Article

Study of Heat Transfer Strategy of Metal Heating/Conduction Plates for Energy Efficiency of Large-Sized Automotive Glass Molding Process

1
College of Mechanical Engineering, Yellow River Conservancy Technical Institute, Kaifeng 475000, China
2
Mechanical and Electrical Engineering Institute, Zhengzhou University of Light Industry, Zhengzhou 450002, China
3
Guangdong Provincial Key Laboratory of Digital Manufacturing Equipment, Guangdong HUST Industrial Technology Research Institute, Dongguan 523808, China
*
Author to whom correspondence should be addressed.
Metals 2023, 13(7), 1218; https://doi.org/10.3390/met13071218
Submission received: 23 May 2023 / Revised: 29 June 2023 / Accepted: 29 June 2023 / Published: 30 June 2023

Abstract

:
In recent years, as an important functional material, glass has been widely used in architecture, electronics, optics, and other fields. As an emerging glass processing technology, the glass molding process (GMP) has received widespread attention and research in recent years. In this paper, we study the modeling and analysis of different heat transfer strategies for the energy efficiency of large-sized automotive instrument glass. The heat transfer model of the metal heating plate–conducting plate mold is established, the thermal energy efficiency in the forming process of large automobile glass is analyzed, and the energy efficiency of the mold in the heating stage is compared. The energy consumption per piece generated by the GMP heating device is reduced from 4865.2 to 4668.5 kJ, a reduction of 4.04%. By optimizing the heat flow density, the energy consumption per piece generated by the GMP heating device was reduced from 4865.2 to 4625.5 kJ, a reduction of 4.92%, meeting the sustainable manufacturing requirements.

1. Introduction

The glass molding process (GMP), as a substitute for the traditional manufacturing process of glass materials, has the advantages of high forming accuracy, a short production cycle, low cost, and no pollution. GMP techniques have become revolutionary techniques in which glass preforms are placed into a mold and subjected to specific temperature and pressure loading conditions to produce glass parts that meet specific requirements [1,2,3]. The GMP process consists of four main steps: heating, pressing, annealing, and cooling [4,5]. It not only effectively replaces traditional glass processing methods but has also found wide application in the production of optical glass. Compared to traditional techniques, GMP has advantages such as high precision, high efficiency, and a short cycle time. As conventional techniques in glass processing lead to the production of glass components with various defects [6,7] and extremely high energy consumption, the new GMP stands out for its high precision, efficiency, and short cycle time.
The high thermal coupling and ultra-high temperature (700 °C) of GMP technology has hindered its development [8,9,10]. For example, when using GMP technology to process certain glass components, in order to meet the requirements, the heating system must provide a maximum power of 100 KW to ensure stable temperature control of the mold and glass [11]. Additionally, the consumption of nitrogen gas and the waste rate of graphite molds can lead to increased energy consumption in glass molding pressing [12]. Studies have shown that the configuration of the heating system and the mold losses are the primary factors influencing the energy efficiency and sustainability of glass molding pressing equipment [13]. To improve heat transfer efficiencies, Li et al. [14] proposed a low-energy consumption, short-cycle, and high-precision temperature control heating system for hot press forming to improve temperature control accuracy and process quality. Ming et al. [15,16,17] simulated and tested the energy use of different heating methods for smartphone casing. Under optimal process parametric conditions, the model decreased the expected energy consumption from 614 kJ to 594.4 kJ, a decrease of 3.19%. At the same time, the glass forming time was shortened from 148.8 s to 139.2 s, with a rate of reduction of 6.45%. Yang et al. [2] established a finite element model for typical surface forming defects, effectively improving the production efficiency and glass quality. Zhang’s team [18,19] attempted to analyze the surface integrity of ultra-thin glass using laser and thermal bending techniques. With the results of simulation and experimental studies, the glass forming temperature had a significant effect on the fracture rate, microbubble, and water ripple density. The fracture rate decreased from 67% to 0% at the optimum molding temperature and pressure.
There has been a new demand for oversized-shaped glass in the current market, but the existing technology is not mature. Many studies have focused on the hot bending forming of small-sized glass components, while there has been relatively little research on the hot bending forming of large-sized, shaped glass components. Processing large-sized irregular glass components has problems, such as low yield, high processing energy consumption, and unsustainable manufacturing [20]. At the same time, irregularly sized glass has the characteristics of irregularity and an excessive length–thickness ratio (1430 mm: 1 mm), making it difficult to process. In order to improve the processing yield and quality, reduce the energy consumption, and carry out sustainable green manufacturing of large-scale special-shaped glass, this paper models and analyzes the forming process of large-scale dashboard glass using different heating methods based on the concept of green manufacturing. By establishing a numerical heat transfer model, the effects of energy flow, energy consumption, and the heating strategy of the GMP on performance were studied. In order to better evaluate the performance of the mold structure and its parameters, various simulation experiments were used in this paper to minimize the energy consumption of the GMP.

2. Heat Transfer Model

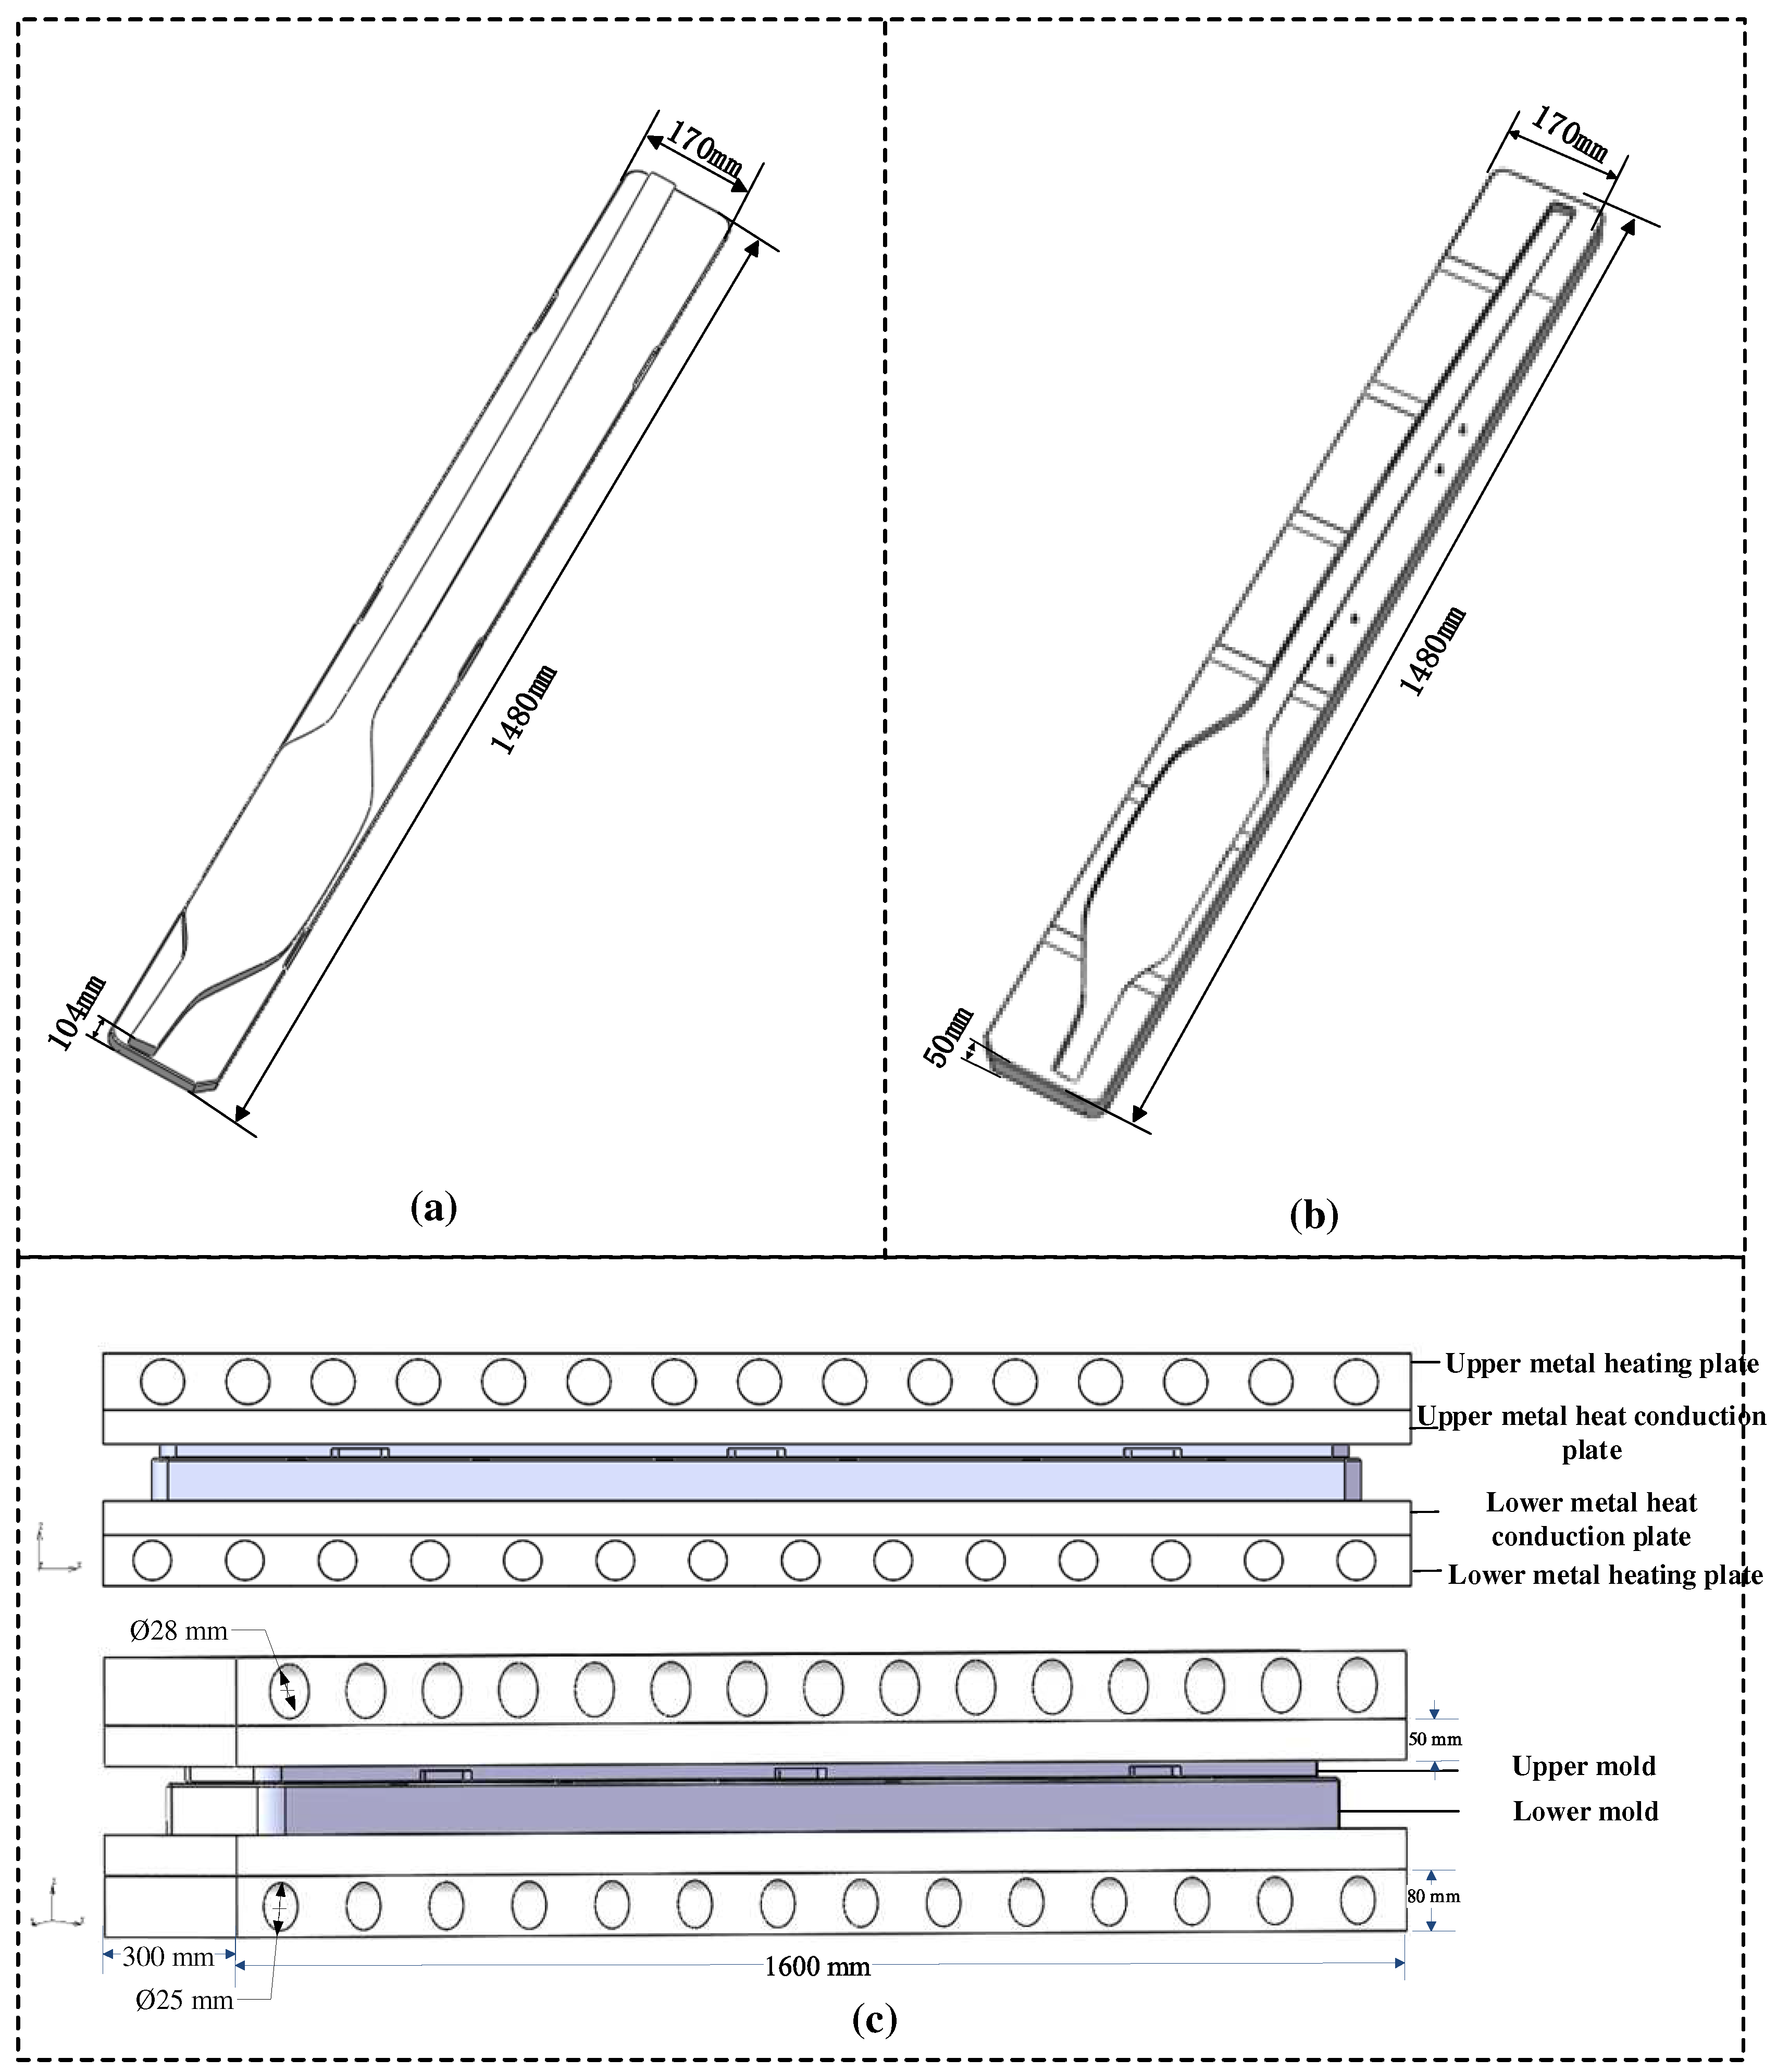
2.1. Heat Conduction Model and Its Initial Parameters

The thermal equilibrium problem between the glass and the mold is an important element affecting glass forming quality [21]. By analyzing the thermodynamic behavior of the metal heating plates, the metal heat conductors, and a mold, a thermodynamic simulation that can be used for glass molding pressing production was constructed.
Thermodynamic simulations that can be used for GMP production were constructed by analyzing the thermodynamic behavior of metal-heated plates, conductors, and dielectrics. According to Figure 1a,b, the size of the metal heating conductor was 1600 mm × 300 mm× 80 mm, and the size of the metal heating plate was 1600 × 300 × 50 mm. The diameters of the holes on the upper and lower metal heating plates were 28 mm and 25 mm, respectively. Figure 1c clearly shows the three-dimensional structures of the metal heating plate, conductor, and mold, as well as their main dimensions. In this model, the influence of the glass cover plate located inside the mold was ignored. Fifteen 1.0 kW·h heating pipes were installed at the top of the mold, while fourteen 1.2 kW·h heating pipes were installed at the bottom.
The heating tube model will not be repeated here, assuming that each heating tube fully absorbs the heat and that it is generated without any loss. As a result, the heating rate of the heating tube can be replaced by the heat flux density, yielding a more efficient heating system. Three different materials—graphite as the mold, tungsten carbide steel (WC) as the heat conductor, and nickel–chromium austenitic stainless steel (SUS 310S) as the heating plate—were used in this study to accomplish this purpose. High-quality austenitic stainless steel SUS 310S was manufactured in Japan. It has excellent corrosion resistance and high-temperature resistance, and could meet the needs of various application scenarios. WC steel is widely used in molds, wear-resistant parts, rolling mills, and other fields, as shown in Table 1.

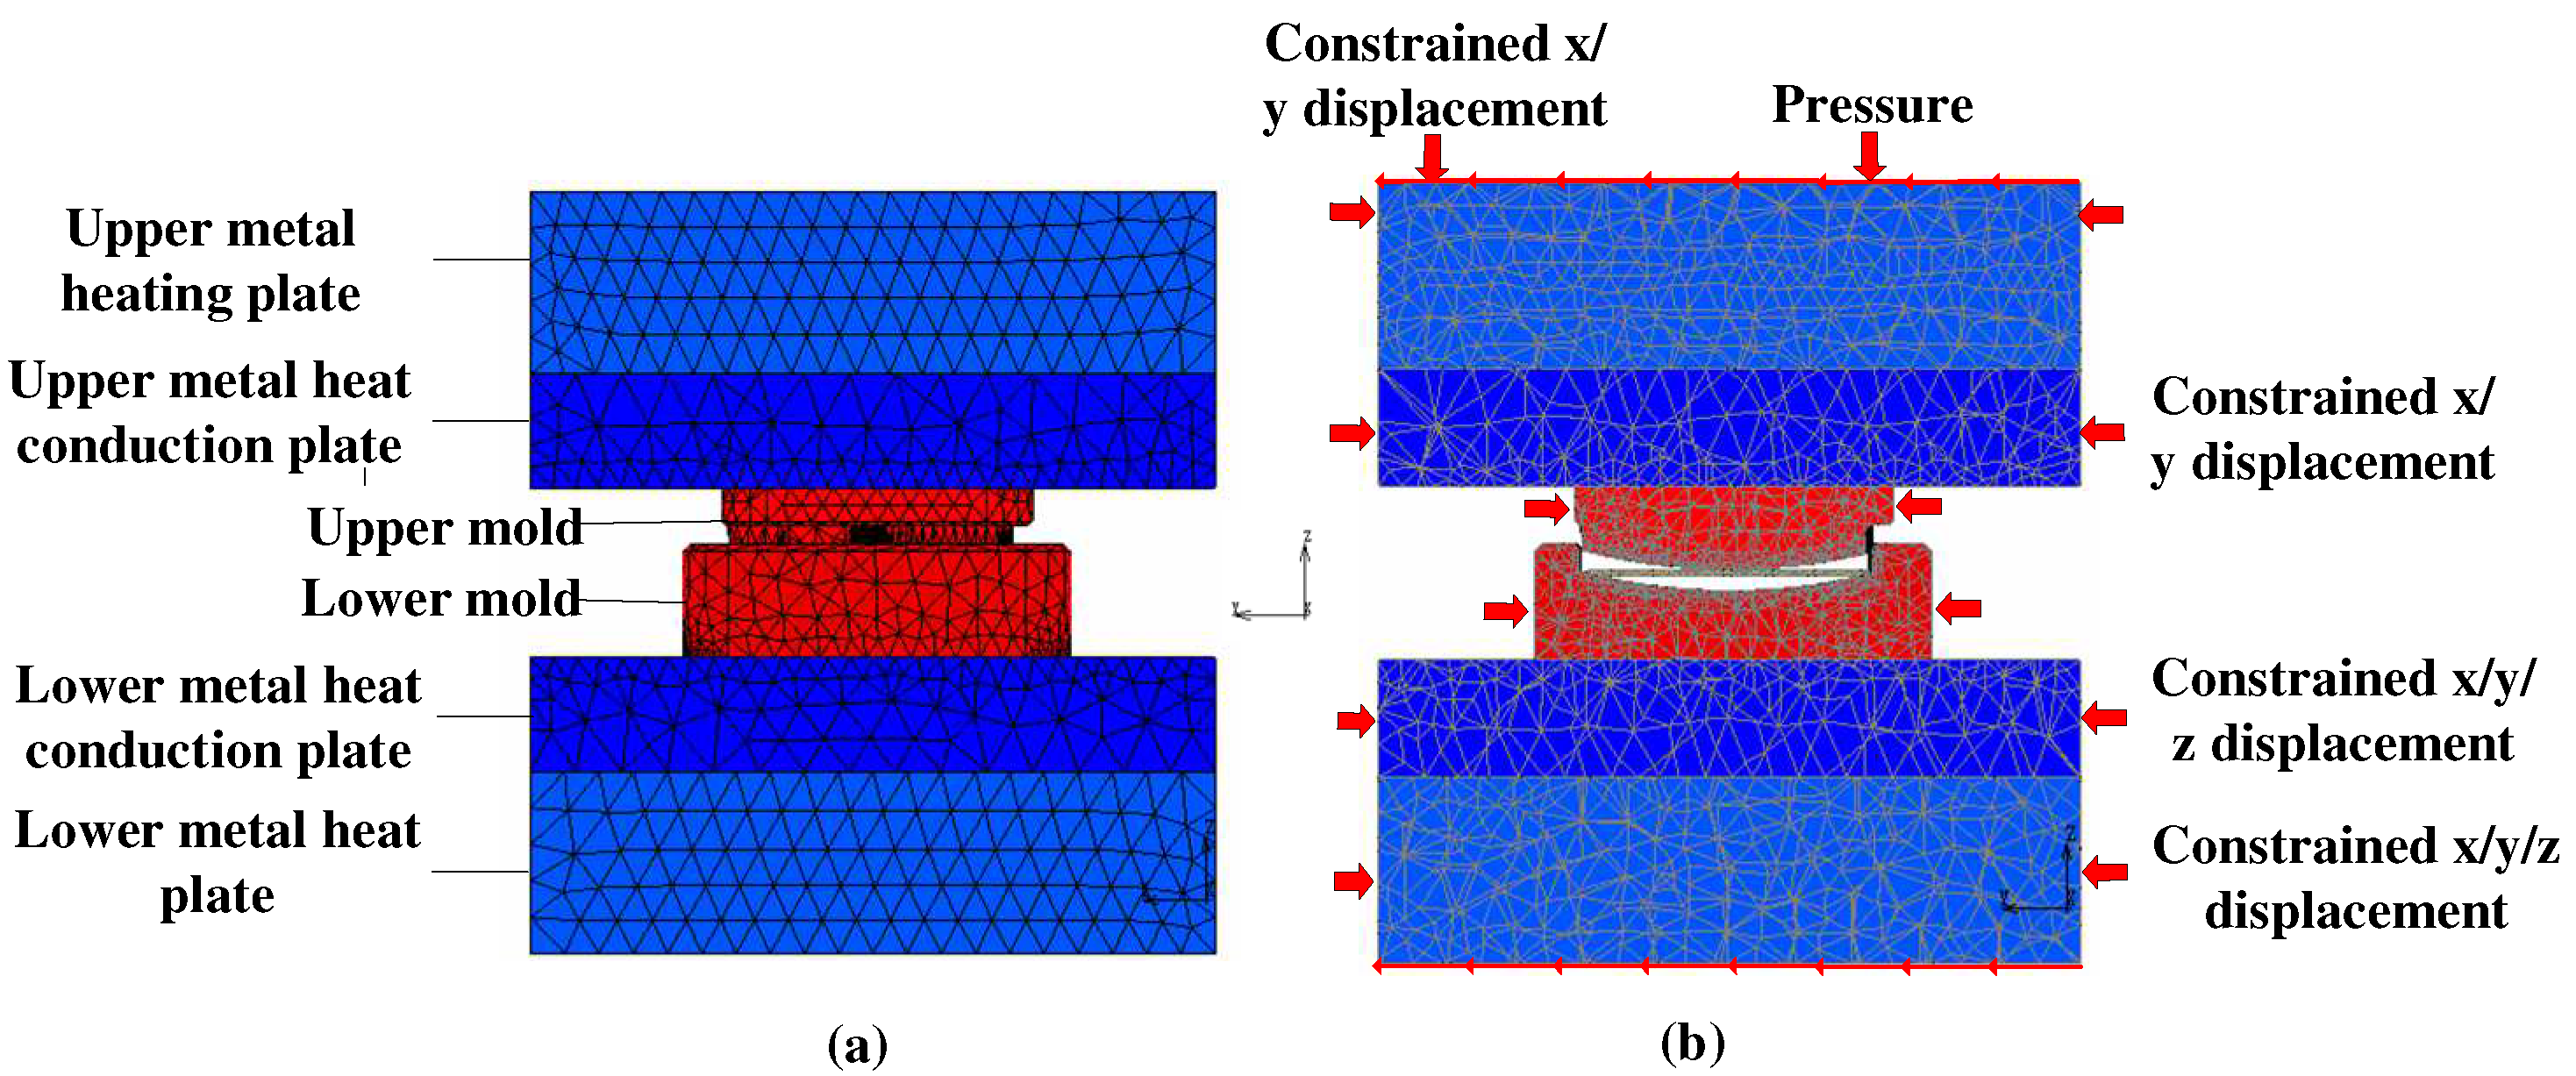
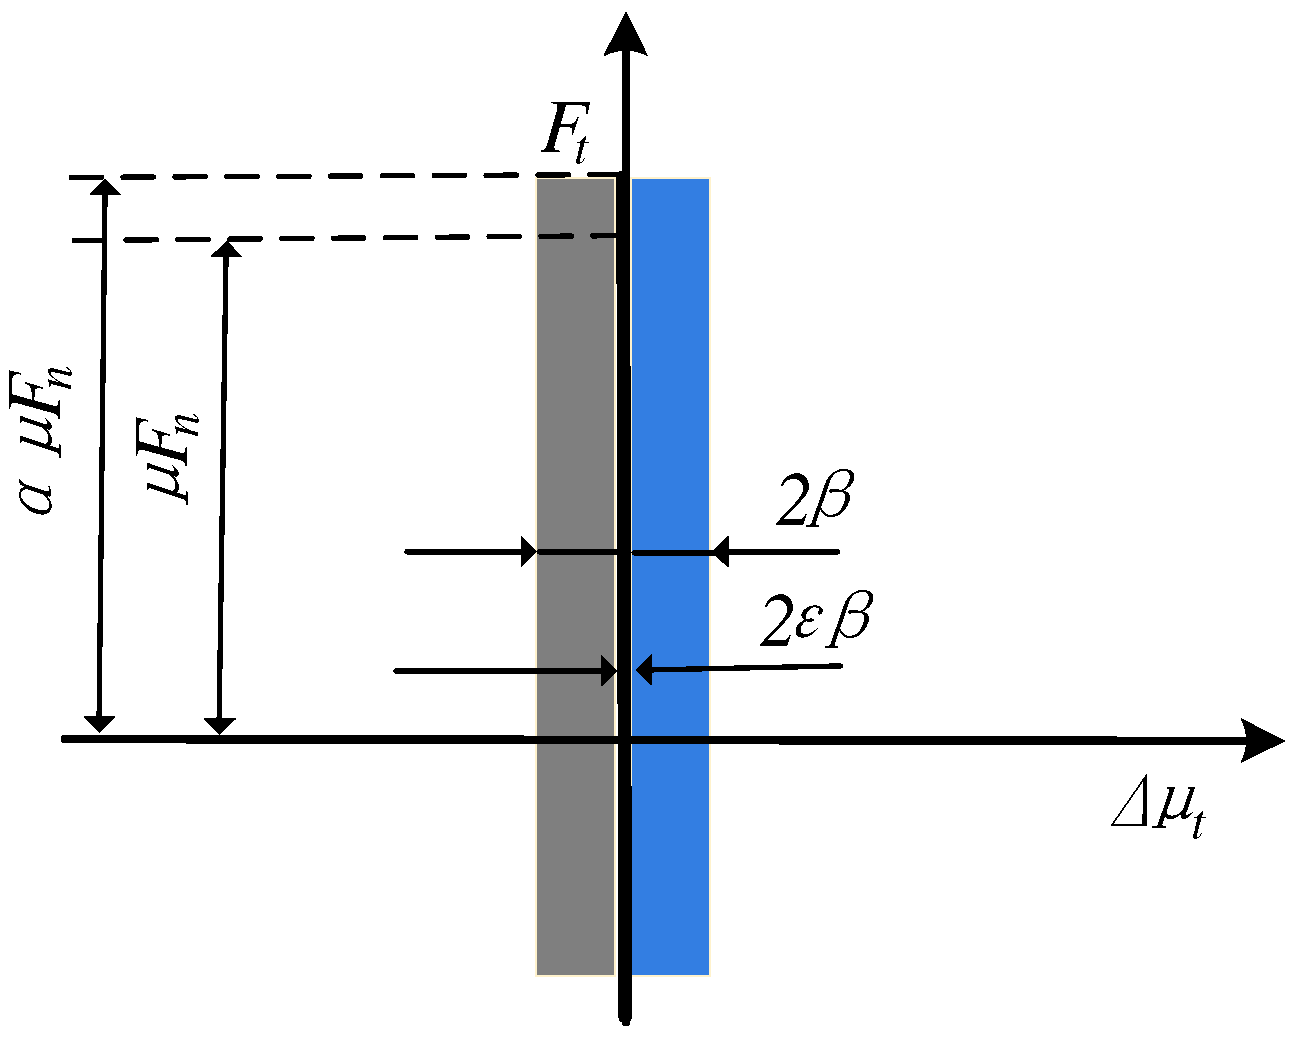
2.2. Boundary Conditions

Numerical modeling and simulation techniques are widely used in the field of machining, and our team has studied them on the basis of MSC Marc and published articles about these problems [2,12,15]. The 3D simulation in this study was implemented by mature software. Figure 2a shows a 3D finite element mesh model of the glass molding process, and Figure 2b displays the cross-sectional view of the model. The thermal coupling analysis model was used to simulate the heating course of the metal heating plates, metal heat conductors, and mold. The tetrahedron was selected as the target family volume, and Patran was used for meshing and modeling. Mesh refinement was performed for the contact surfaces of the metal heating plate, heating tubes, and the inner surface of the mold. Finally, the meshes of the molds (including the upper and lower), heat tubes, and metal heat conductors were accurately refined to 116,851, 23,471, and 105,923 units, respectively. According to the data in Table 2, the heat transfer efficiency can be improved by adjusting the contact area between the metal heating plates, metal heat conductors (heat conducting plates), mold, and nitrogen.
By applying the viscous–sliding friction model [22], the transition from viscous to sliding friction during the thermal expansion and deformation of an object can be effectively simulated. This process can be expressed by Equation (1), as shown in Figure 3 [22].
F t μ F n , Static ; F t α μ F n , K i n e t i c
where F t is the shear stress; μ is the coefficient of friction (0.1); F n is the normal force; α is the coefficient of friction with a default value of 1.05. The energy balance equation allows for the temperature distribution profiles of the mold, the metal heat conductor, and the metal heating plate. The equations are specified as follows [23,24]:
ρ m C p m T 1 t = k m 2 T 1 x 2 + k m 2 T 1 y 2 + k m 2 T 1 z 2
ρ c C p c T 2 t = k c 2 T 2 x 2 + k c 2 T 2 y 2 + k c 2 T 2 z 2
ρ h C p h T 2 t = k h 2 T 3 x 2 + k h 2 T 3 y 2 + k h 2 T 3 z 2
In the above Equations, ρ h is the metal heating plate; ρ c is the metal heat-conducting plate; ρ m is the density (kg/m3) of the mold; k , C p are the thermal conductivity (W/m °C) and the specific heat capacity (J/kg °C), respectively; T 1 , T 2 ,   and T 3 are the temperature (°C) of the mold, metal heat conductor, and metal heating plate, respectively. The contact thermal conductivity value of the conductor with the heating plate was 2500 W/m2 °C, and the contact thermal conductivity value of the conductor with the mold was 2800 W/m2 °C.

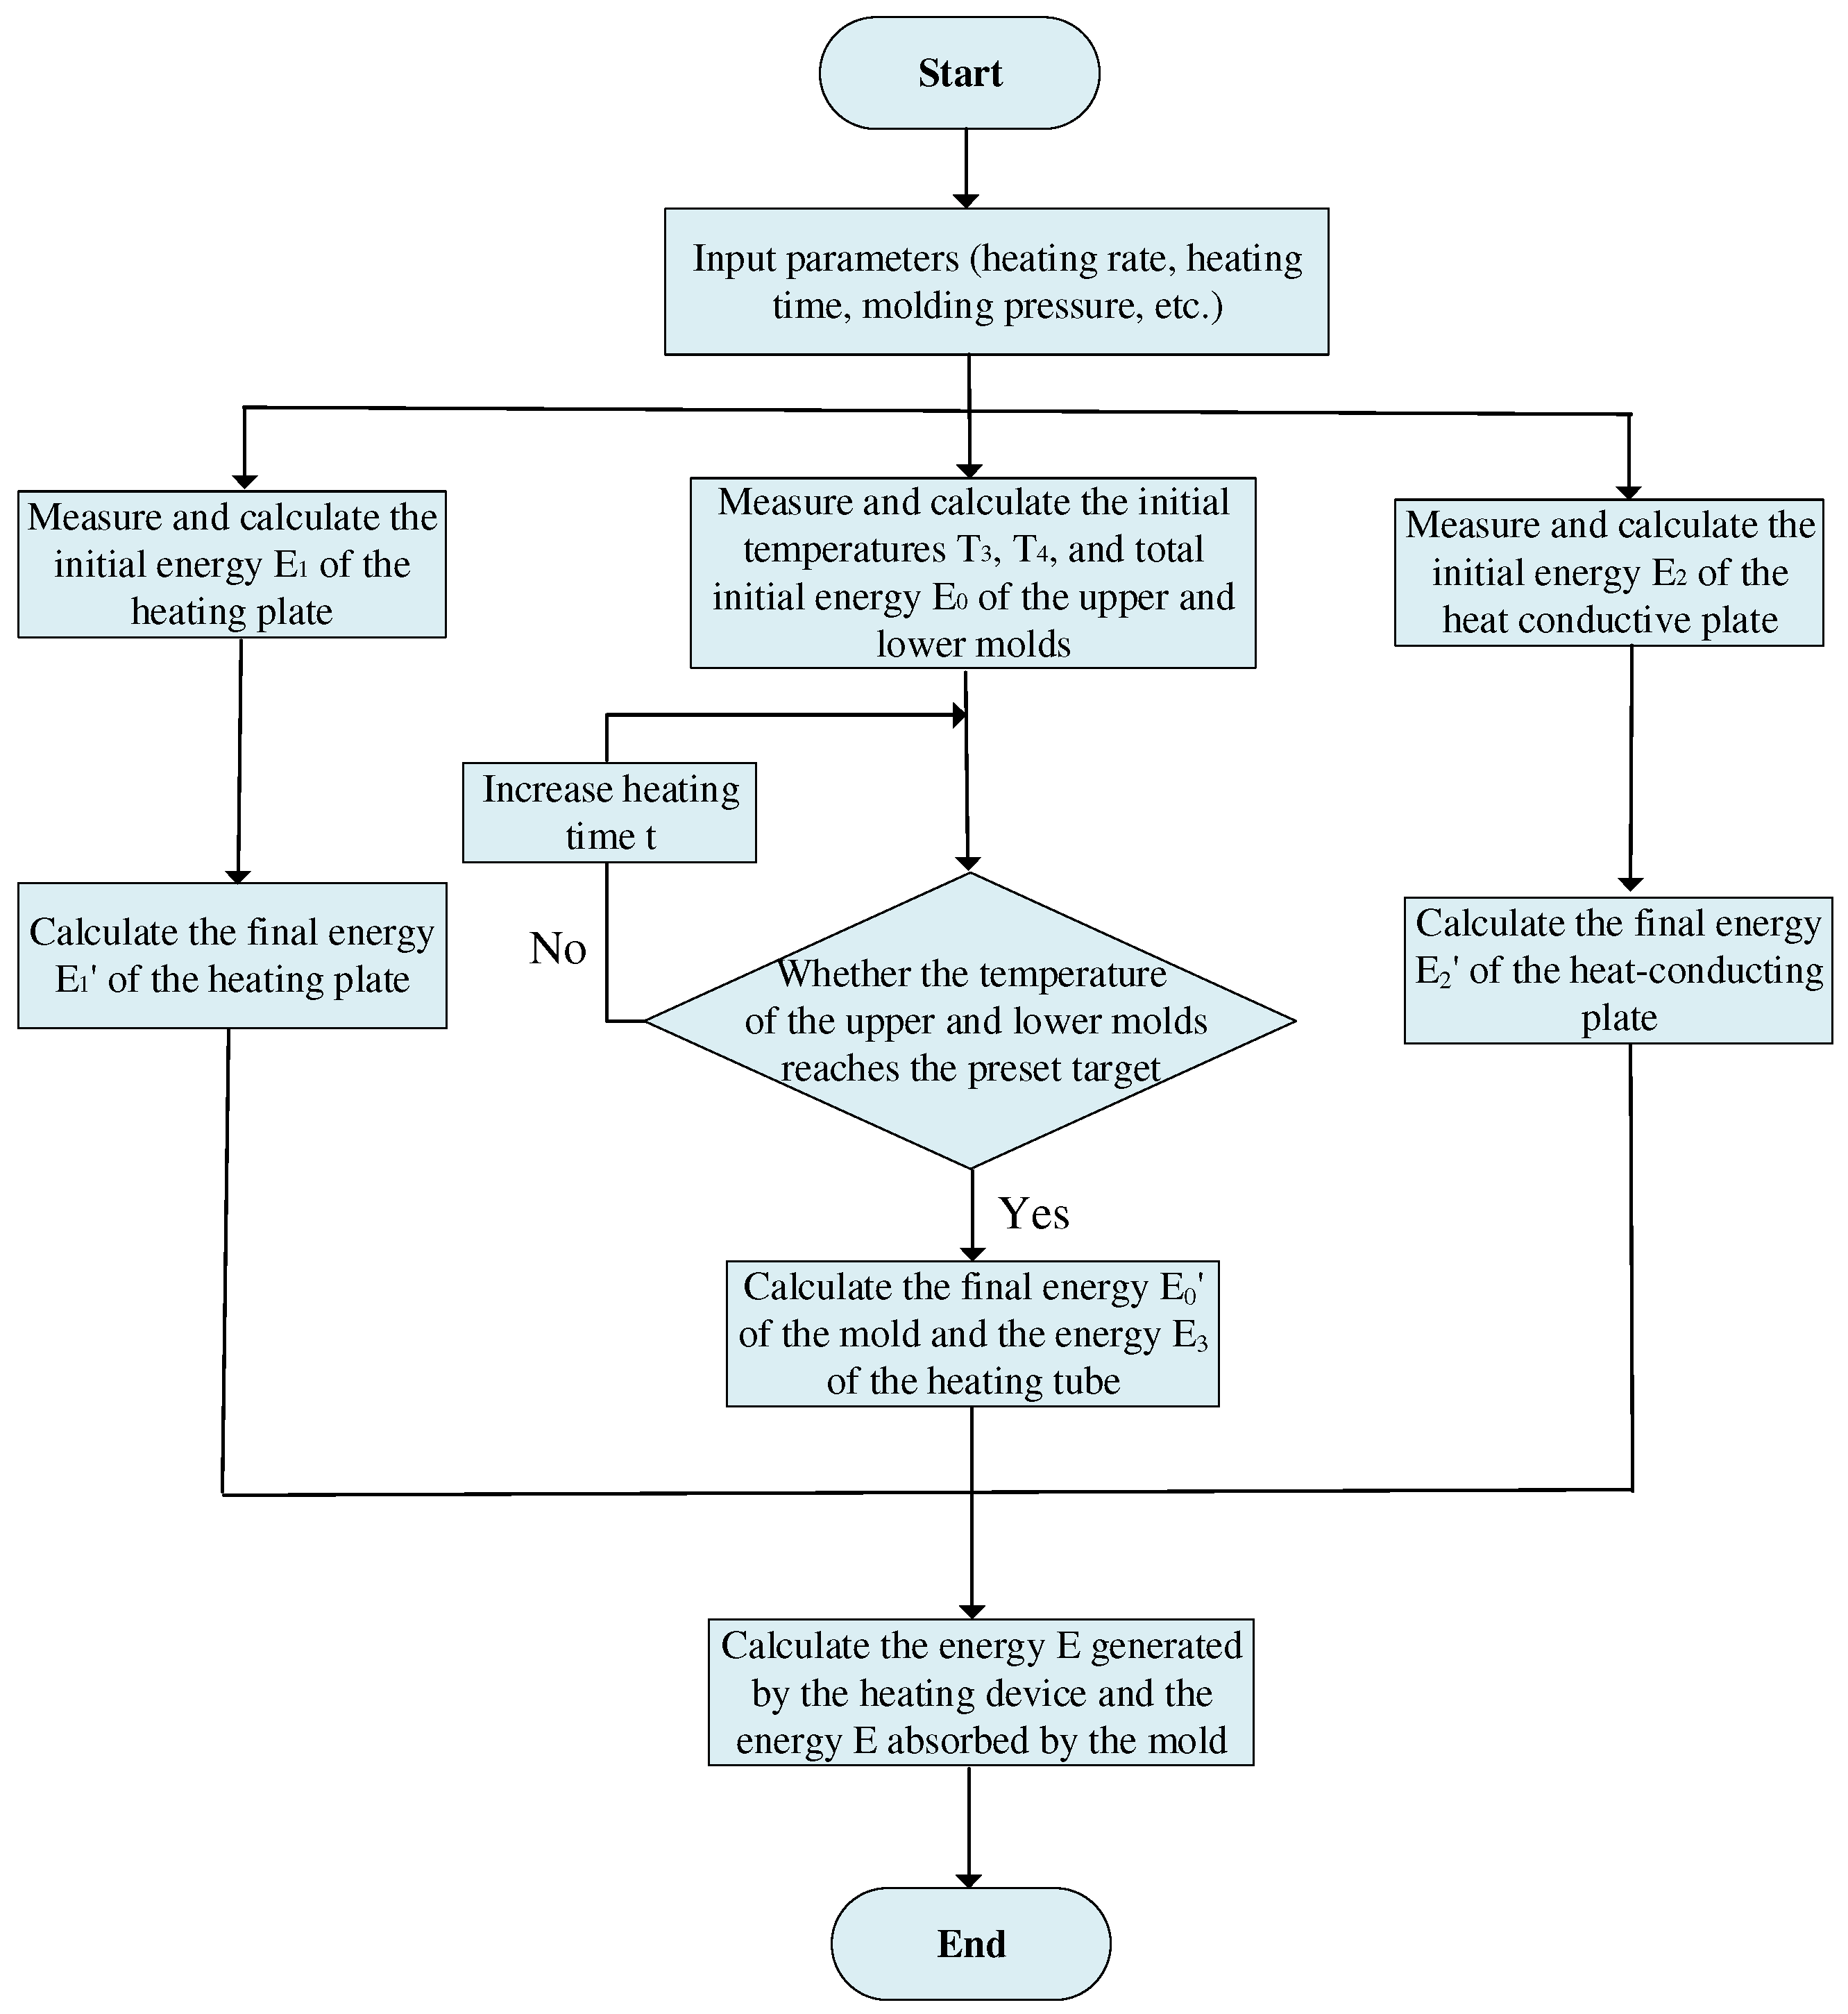
2.3. Calculation of Production Energy Consumption

Figure 4 depicts the energy efficiency calculation flow of the GMP system, which contains the heat transfer between the metal heating plate and the heat conductor, as well as the heating tubes. To better simulate the actual situation, the simulation model can be used with multiple temperature measurement points. T 1 and T 1 indicate the average temperatures of the initial and final status of the heating stage, respectively. Then, Equation (5) can be adopted to estimate the effect of heat transfer on the energy inside the metal heating plate, so that the heat loss ( E 1 ) can be estimated more accurately [22].
E 1 = E 1 E 1 = m 1 c 1 ( T 1 T 1 )
where E 1 is the initial energy of the metal heating plate; E 1 is the final energy of the metal heating plate; m represents the mass; and c represents the specific heat capacity. Similarly, the internal energy loss of the metal heat conductor ( E 2 ) is obtained from Equation (6) [22]:
E 2 = E 2 E 2 = m 2 c 2 ( T 2 T 2 )
Additionally, the energy produced by the heating tubes is determined by Equation (7) [22]:
E 3 = n q ¯ f S t
where t , n , and S are the heating time, the number of heating tubes, and the surface area of heating tubes (mm2), respectively. Therefore, Equation (8) can be used to determine the energy produced by the heating device [22].
E = E 1 + E 2 + E 3
The energy absorbed by the mold is depicted by Equation (9) [22]:
E = E 0 E 0 = m 3 c 3 ( T 3 T 3 ) + m 4 c 3 ( T 4 T 4 )
where E 0 is the initial energy of the mold and E 0 is the final energy of the mold; T 3 is the upper mold’s initial temperature; T 4 is the lower mold’s initial temperature; T 3 is the upper mold’s final temperature; T 4 is the lower mold’s final temperature; c 3 is the mold’s specific heat capacity; m 3 represents the upper mold’s mass; and m 4 represents the lower mold’s mass.

3. Results and Analysis

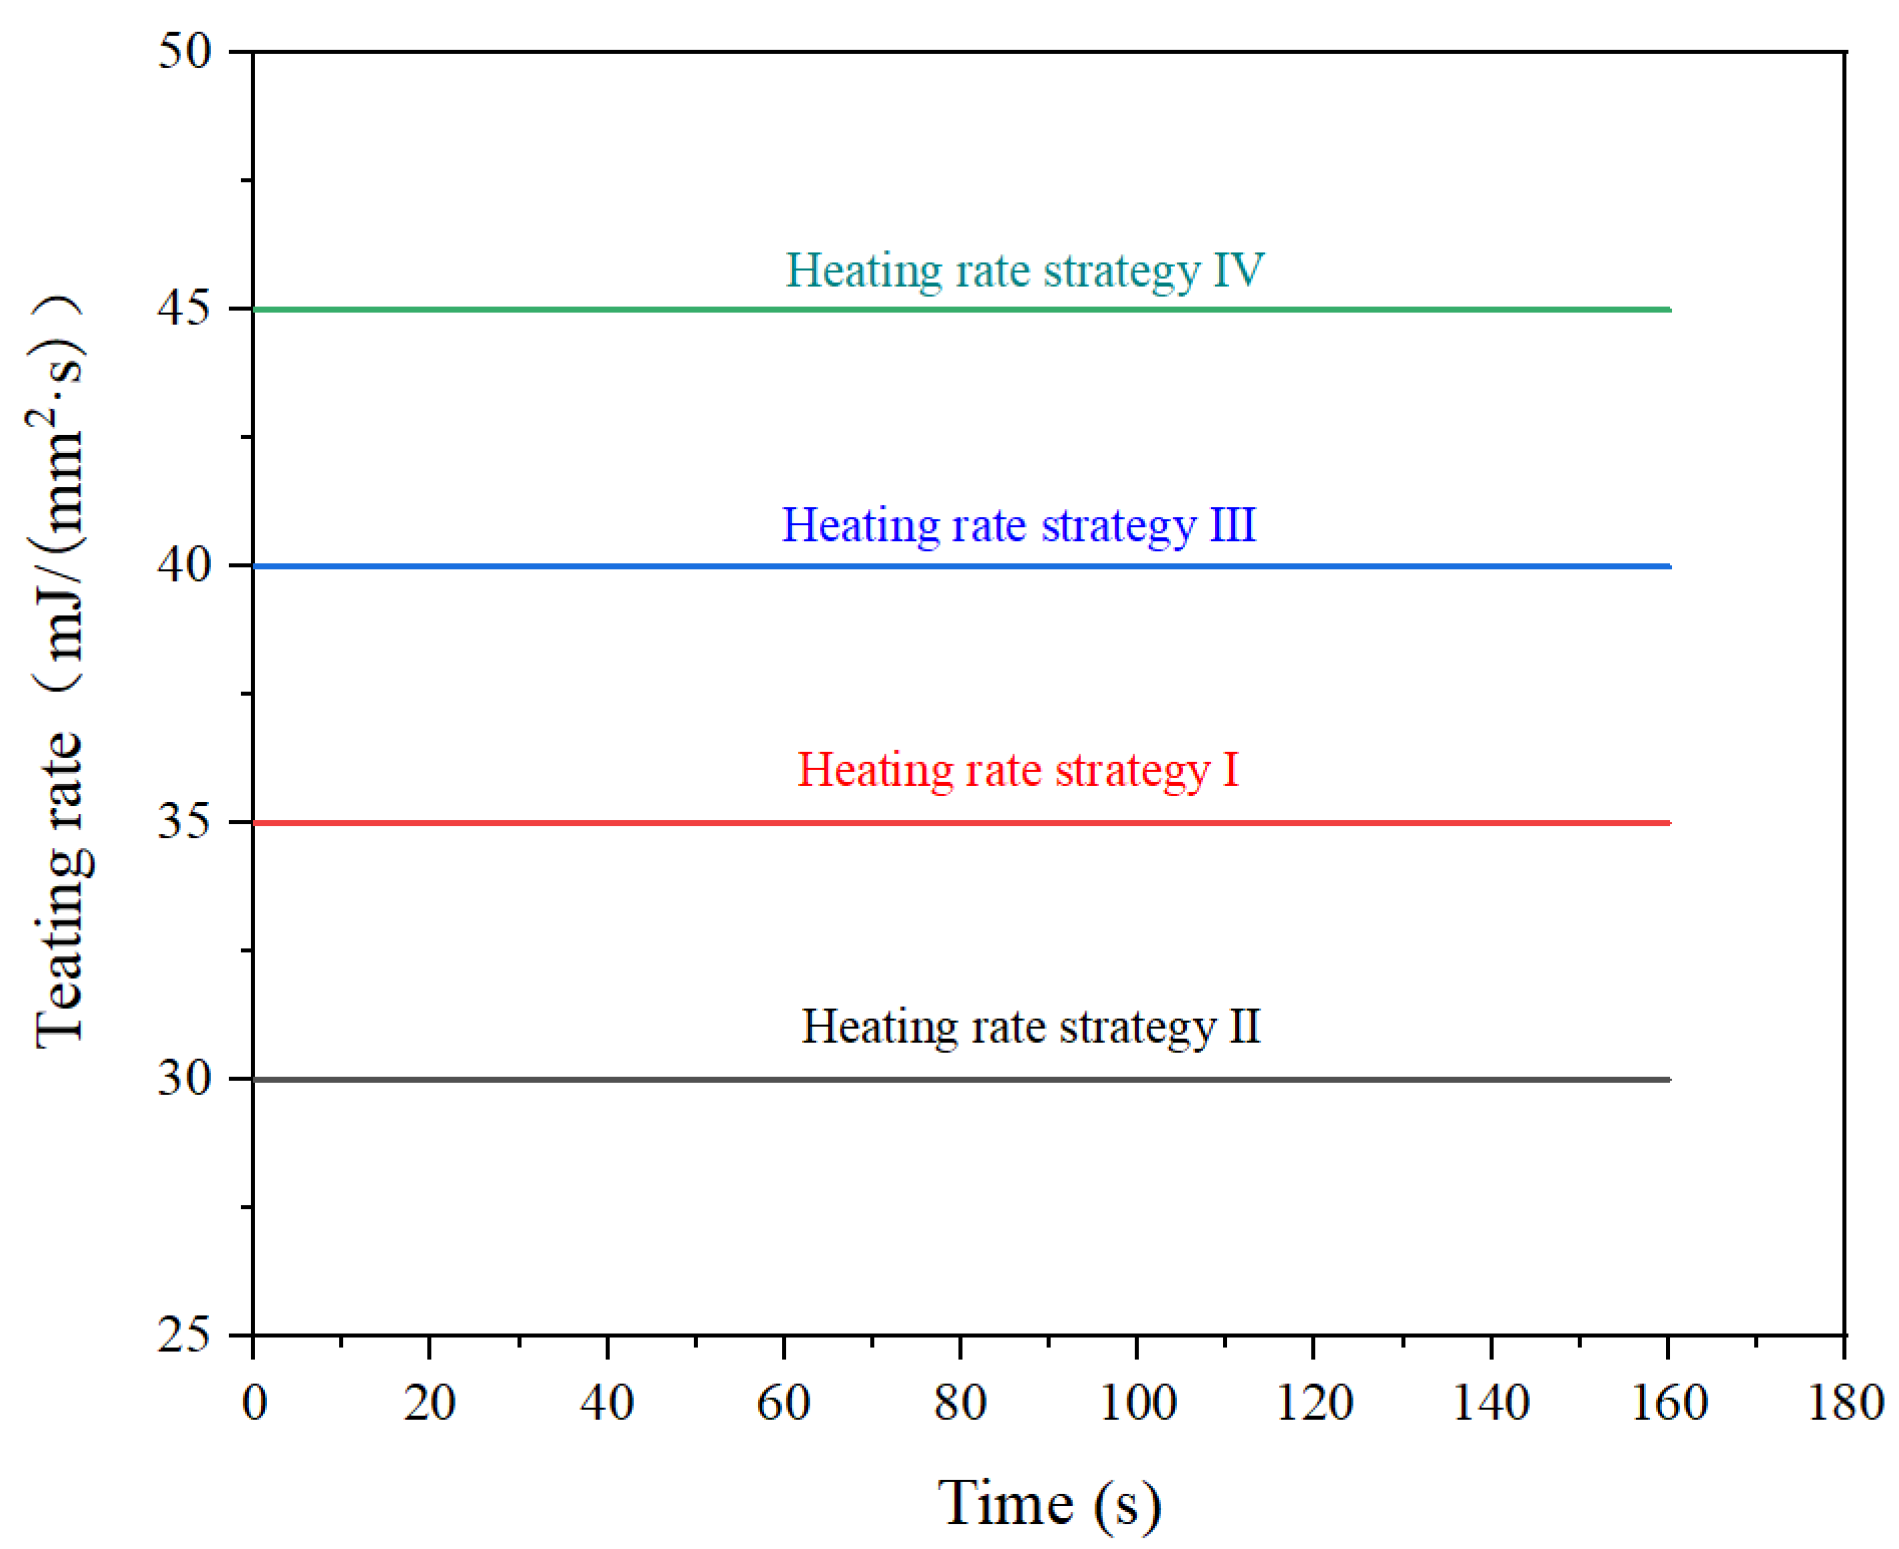
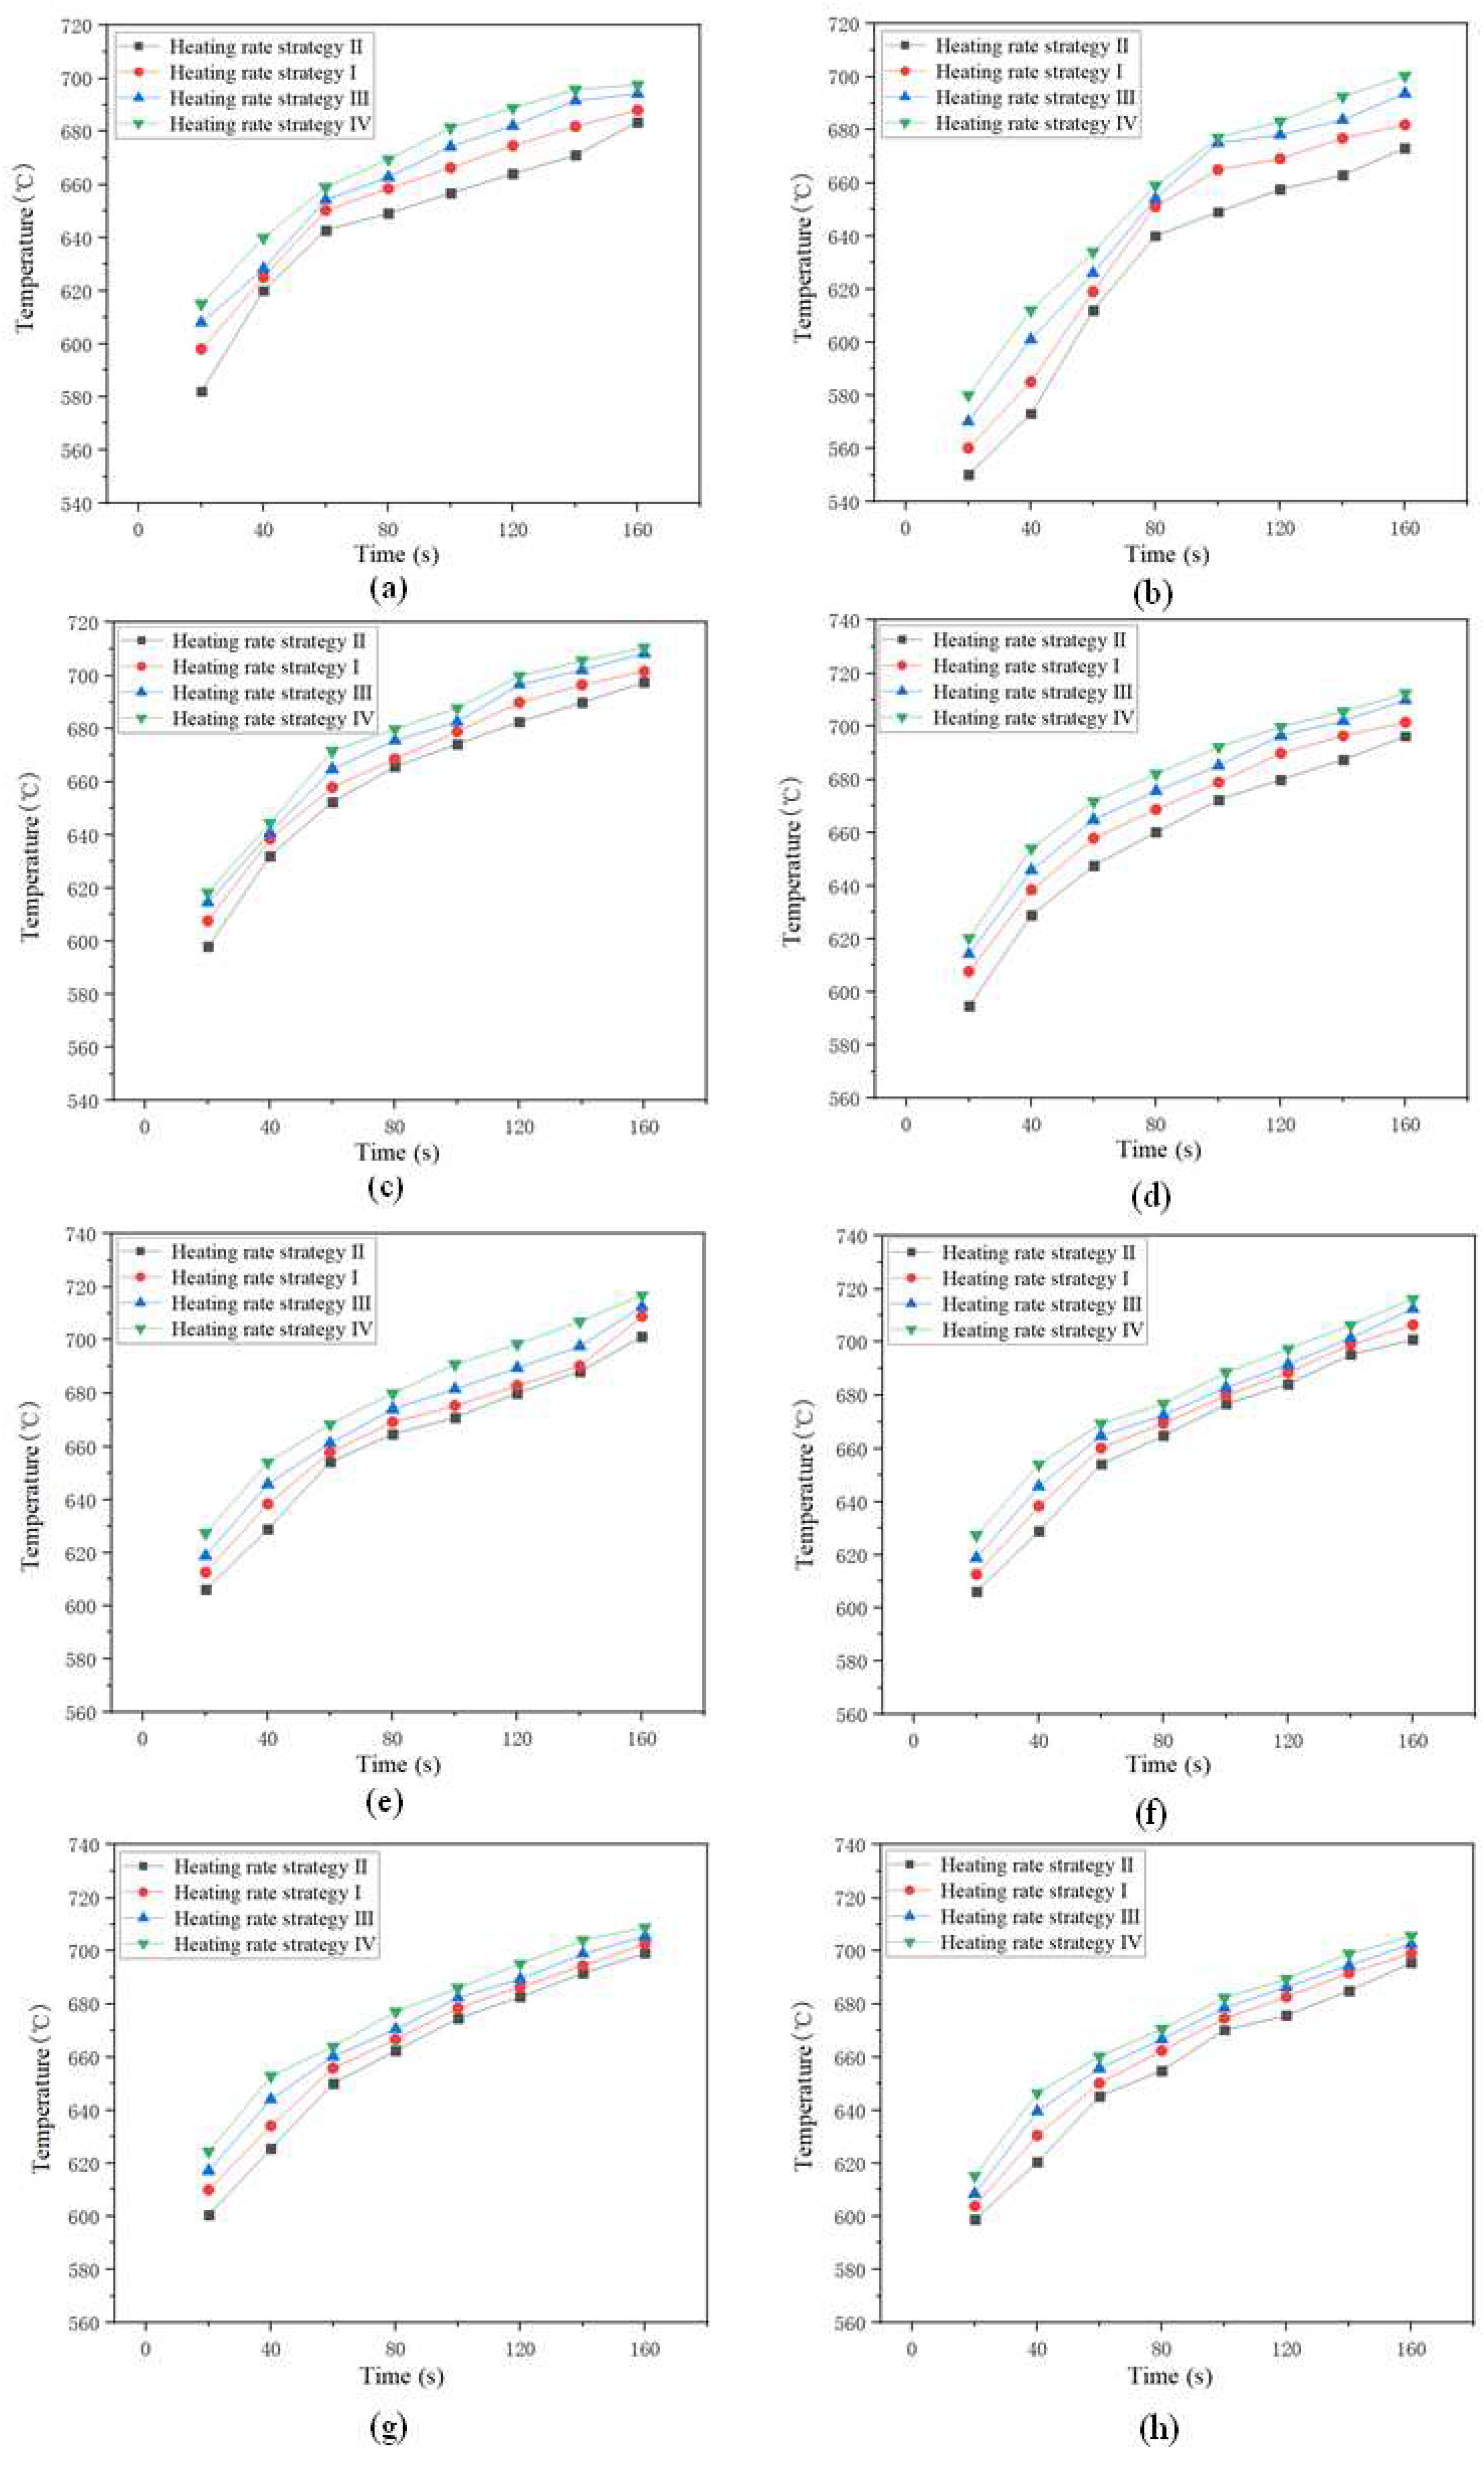
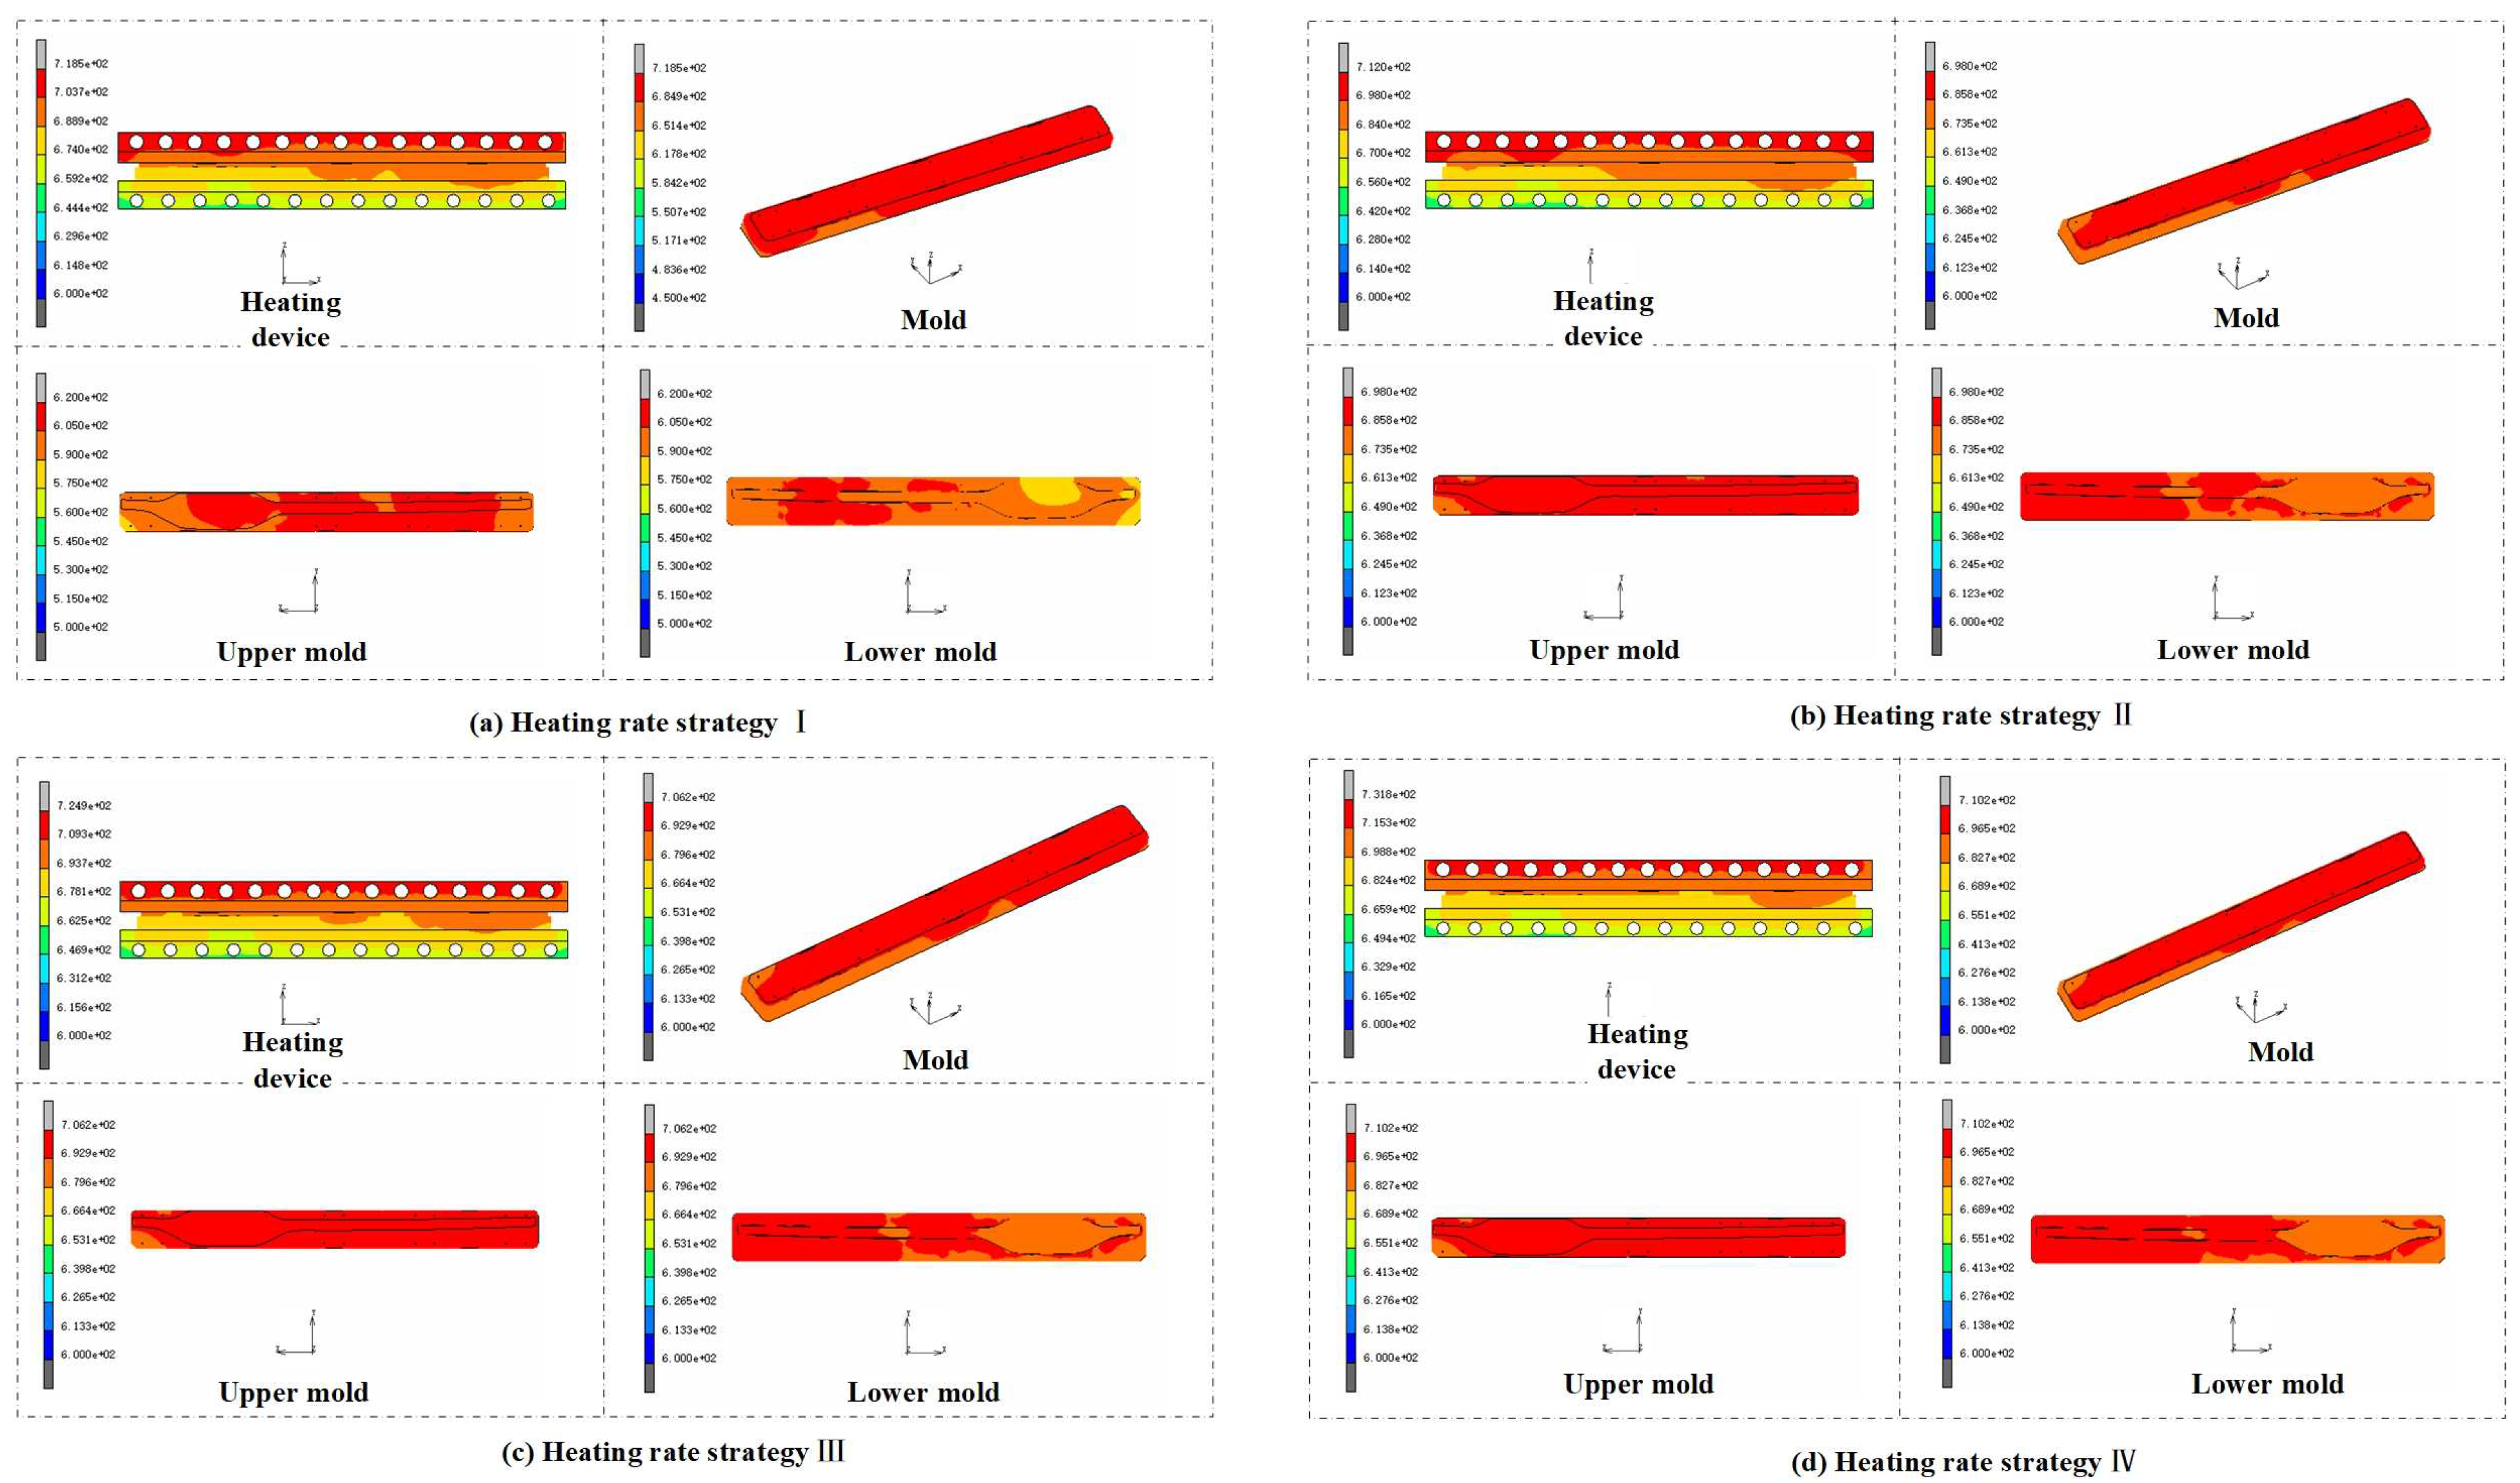
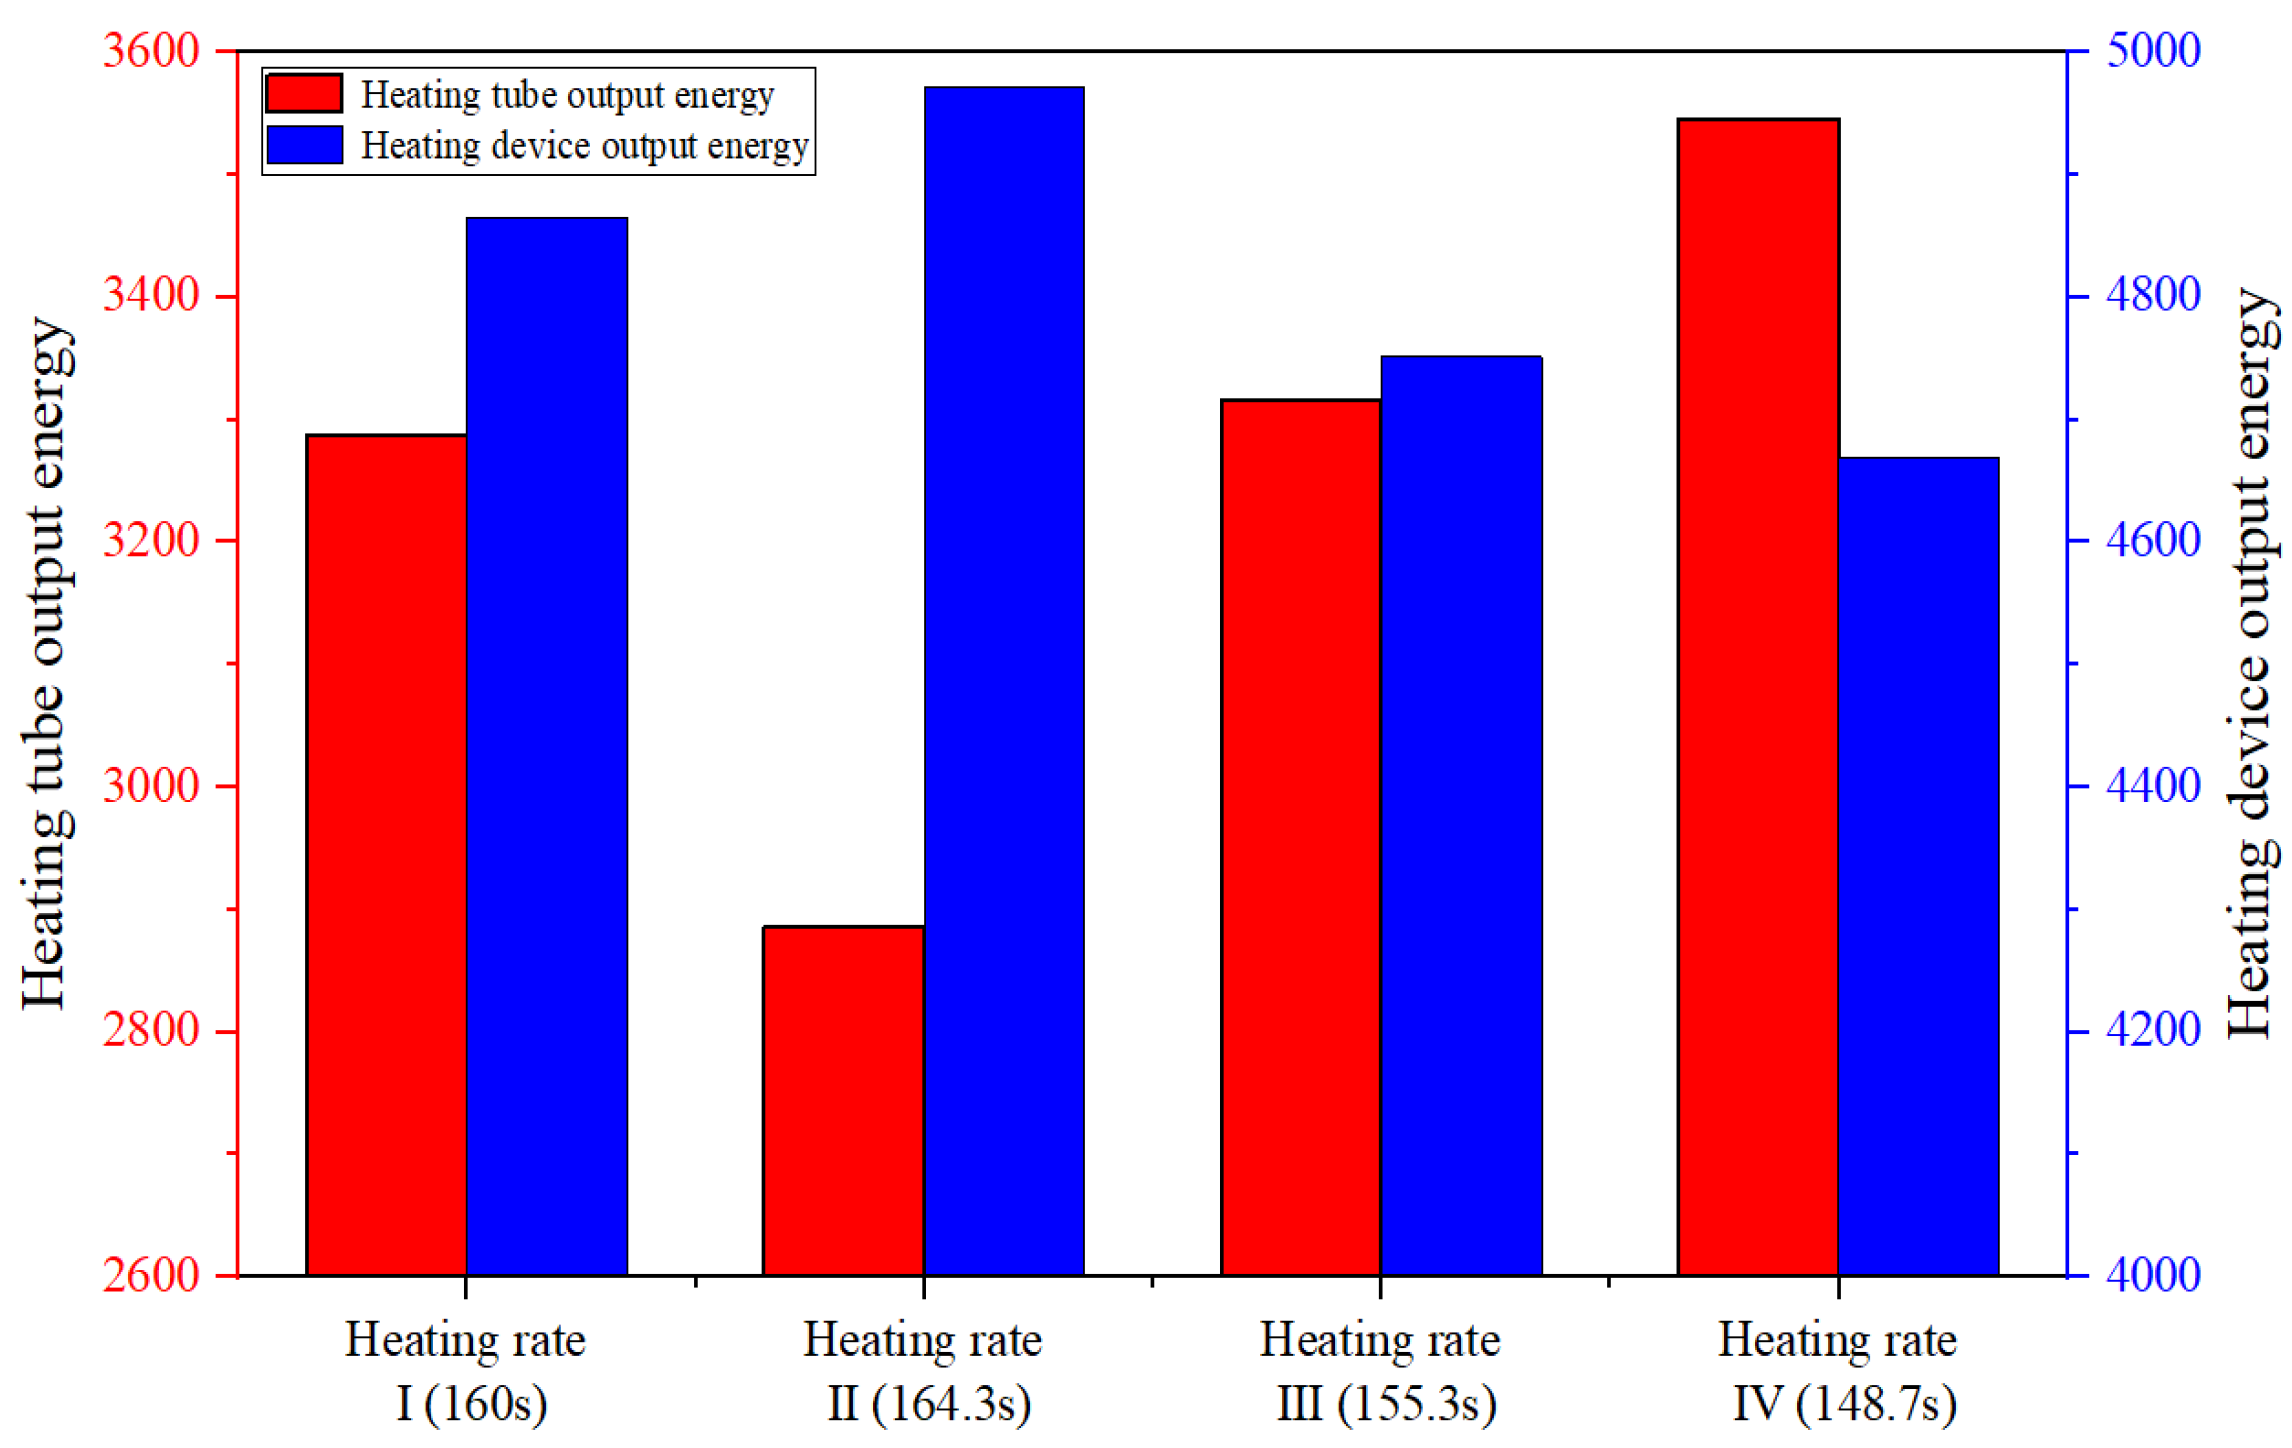
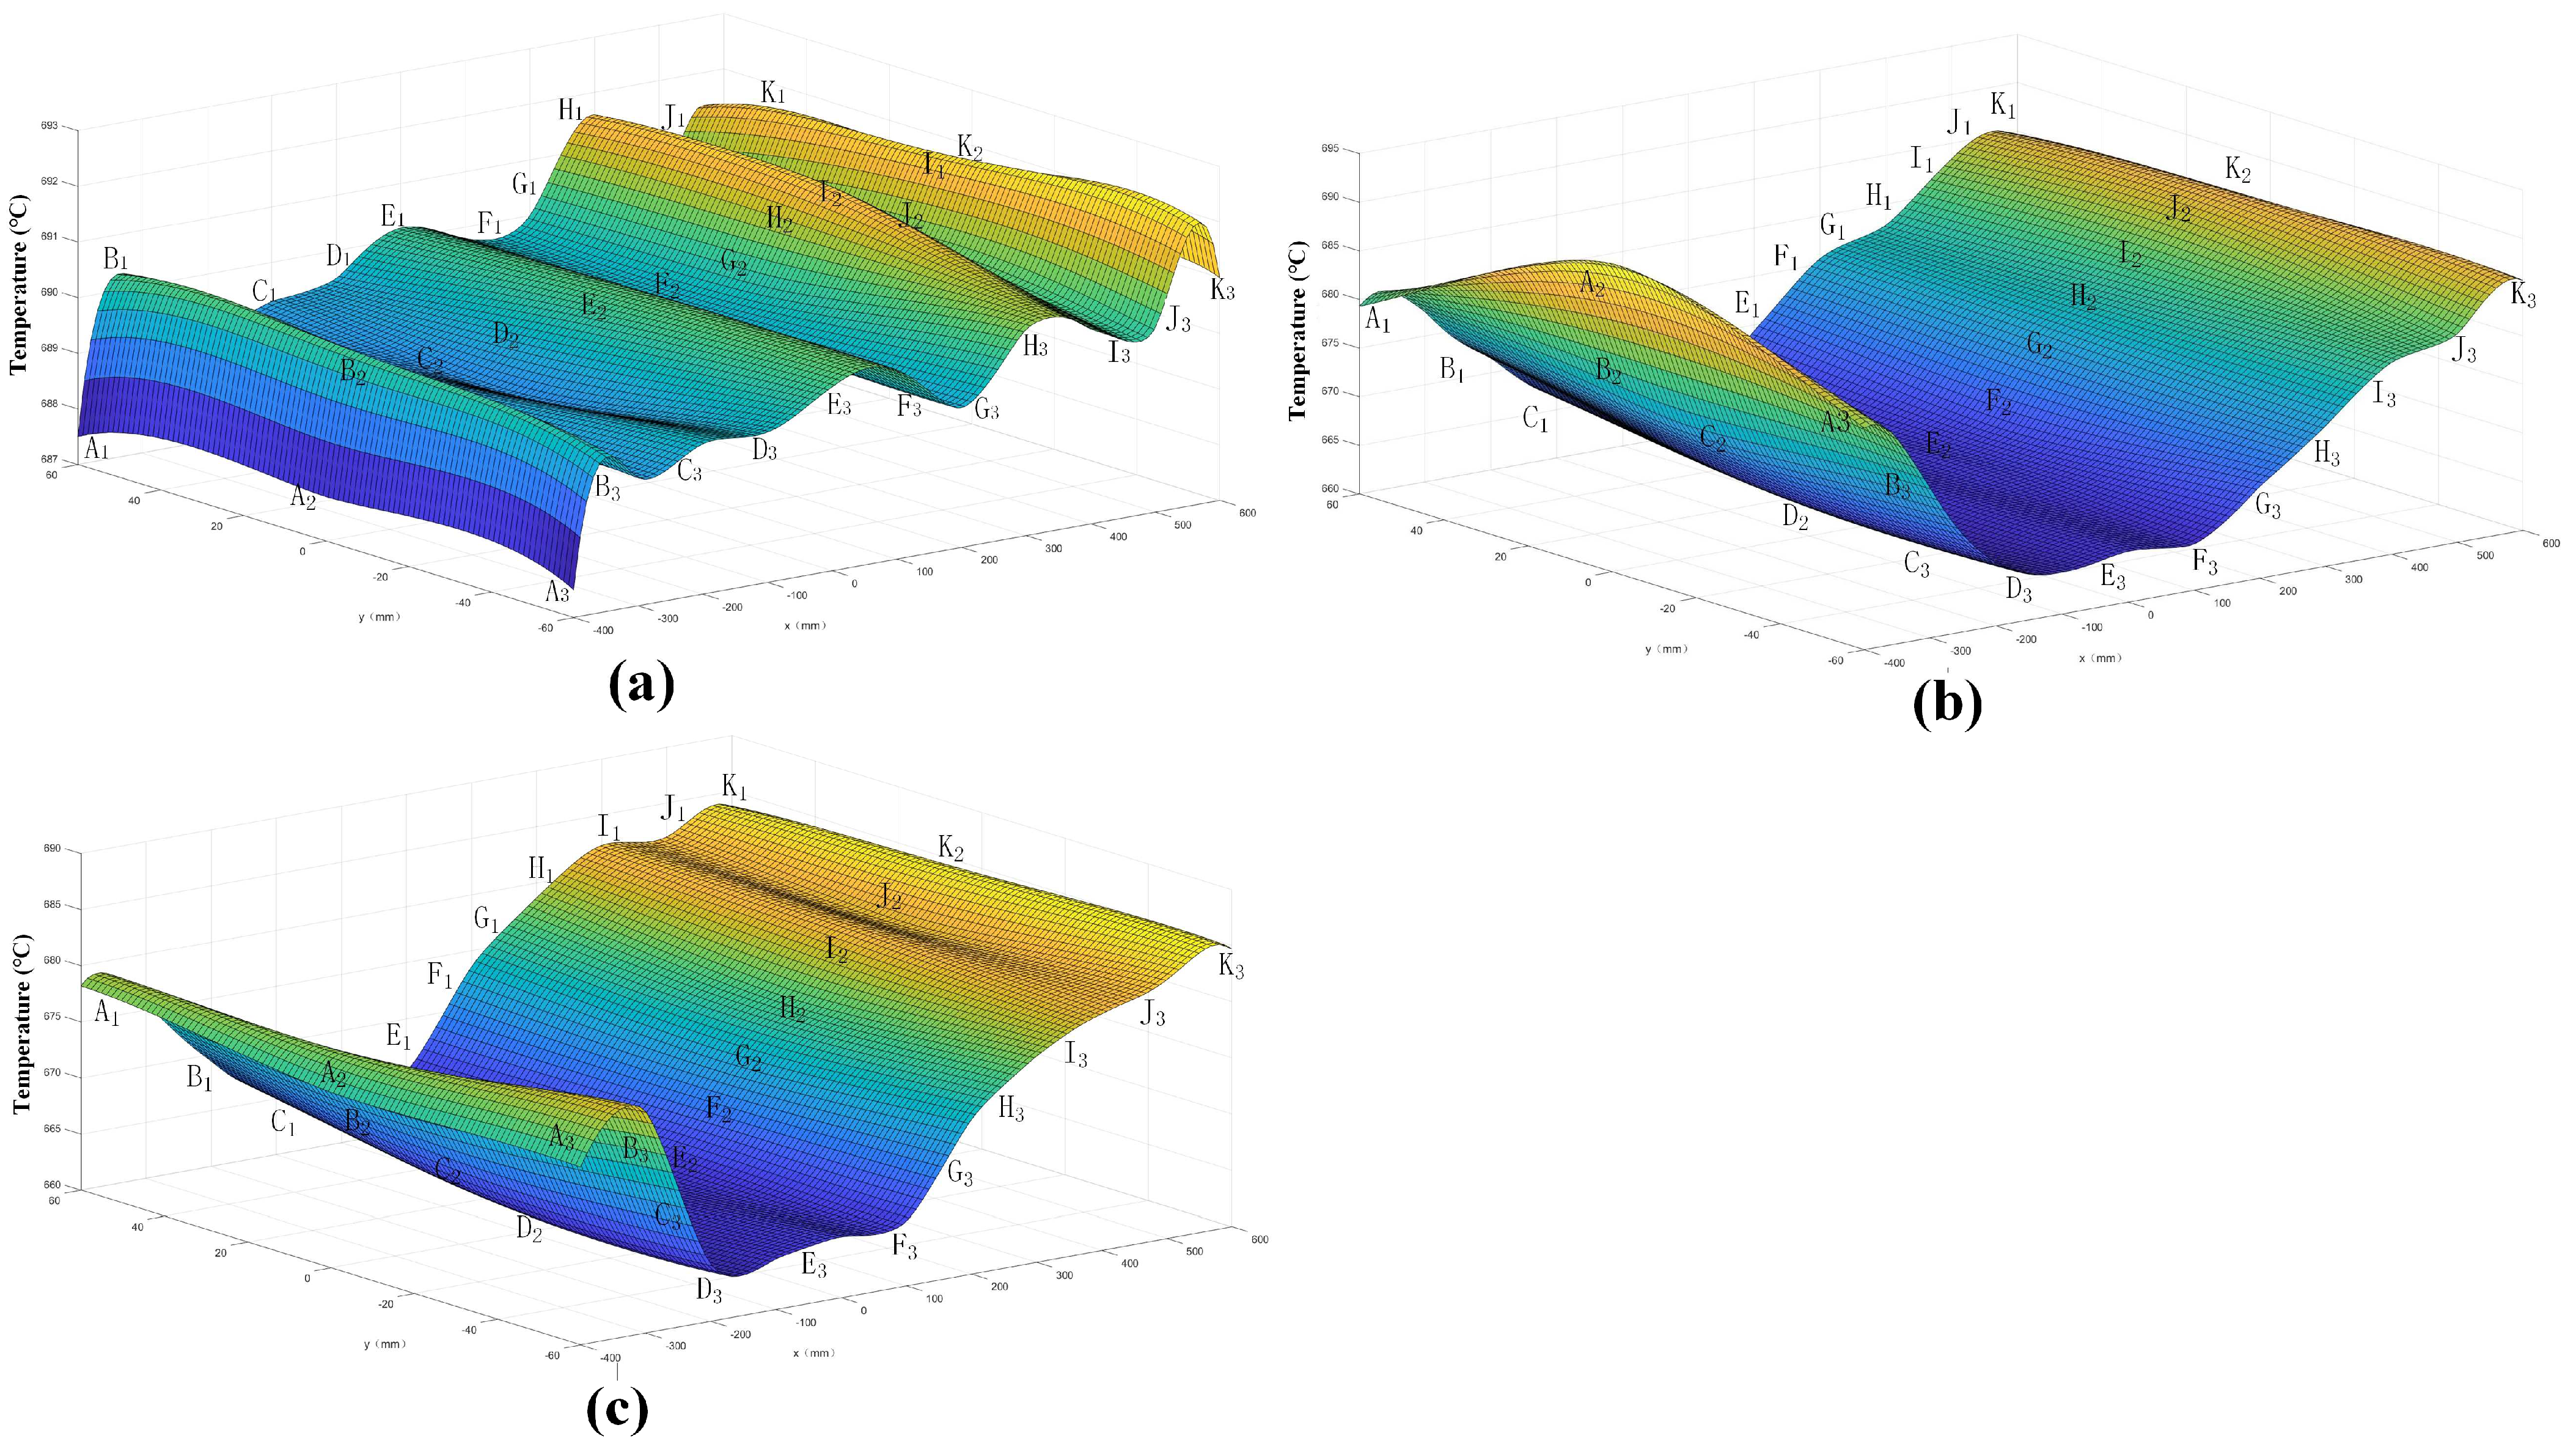
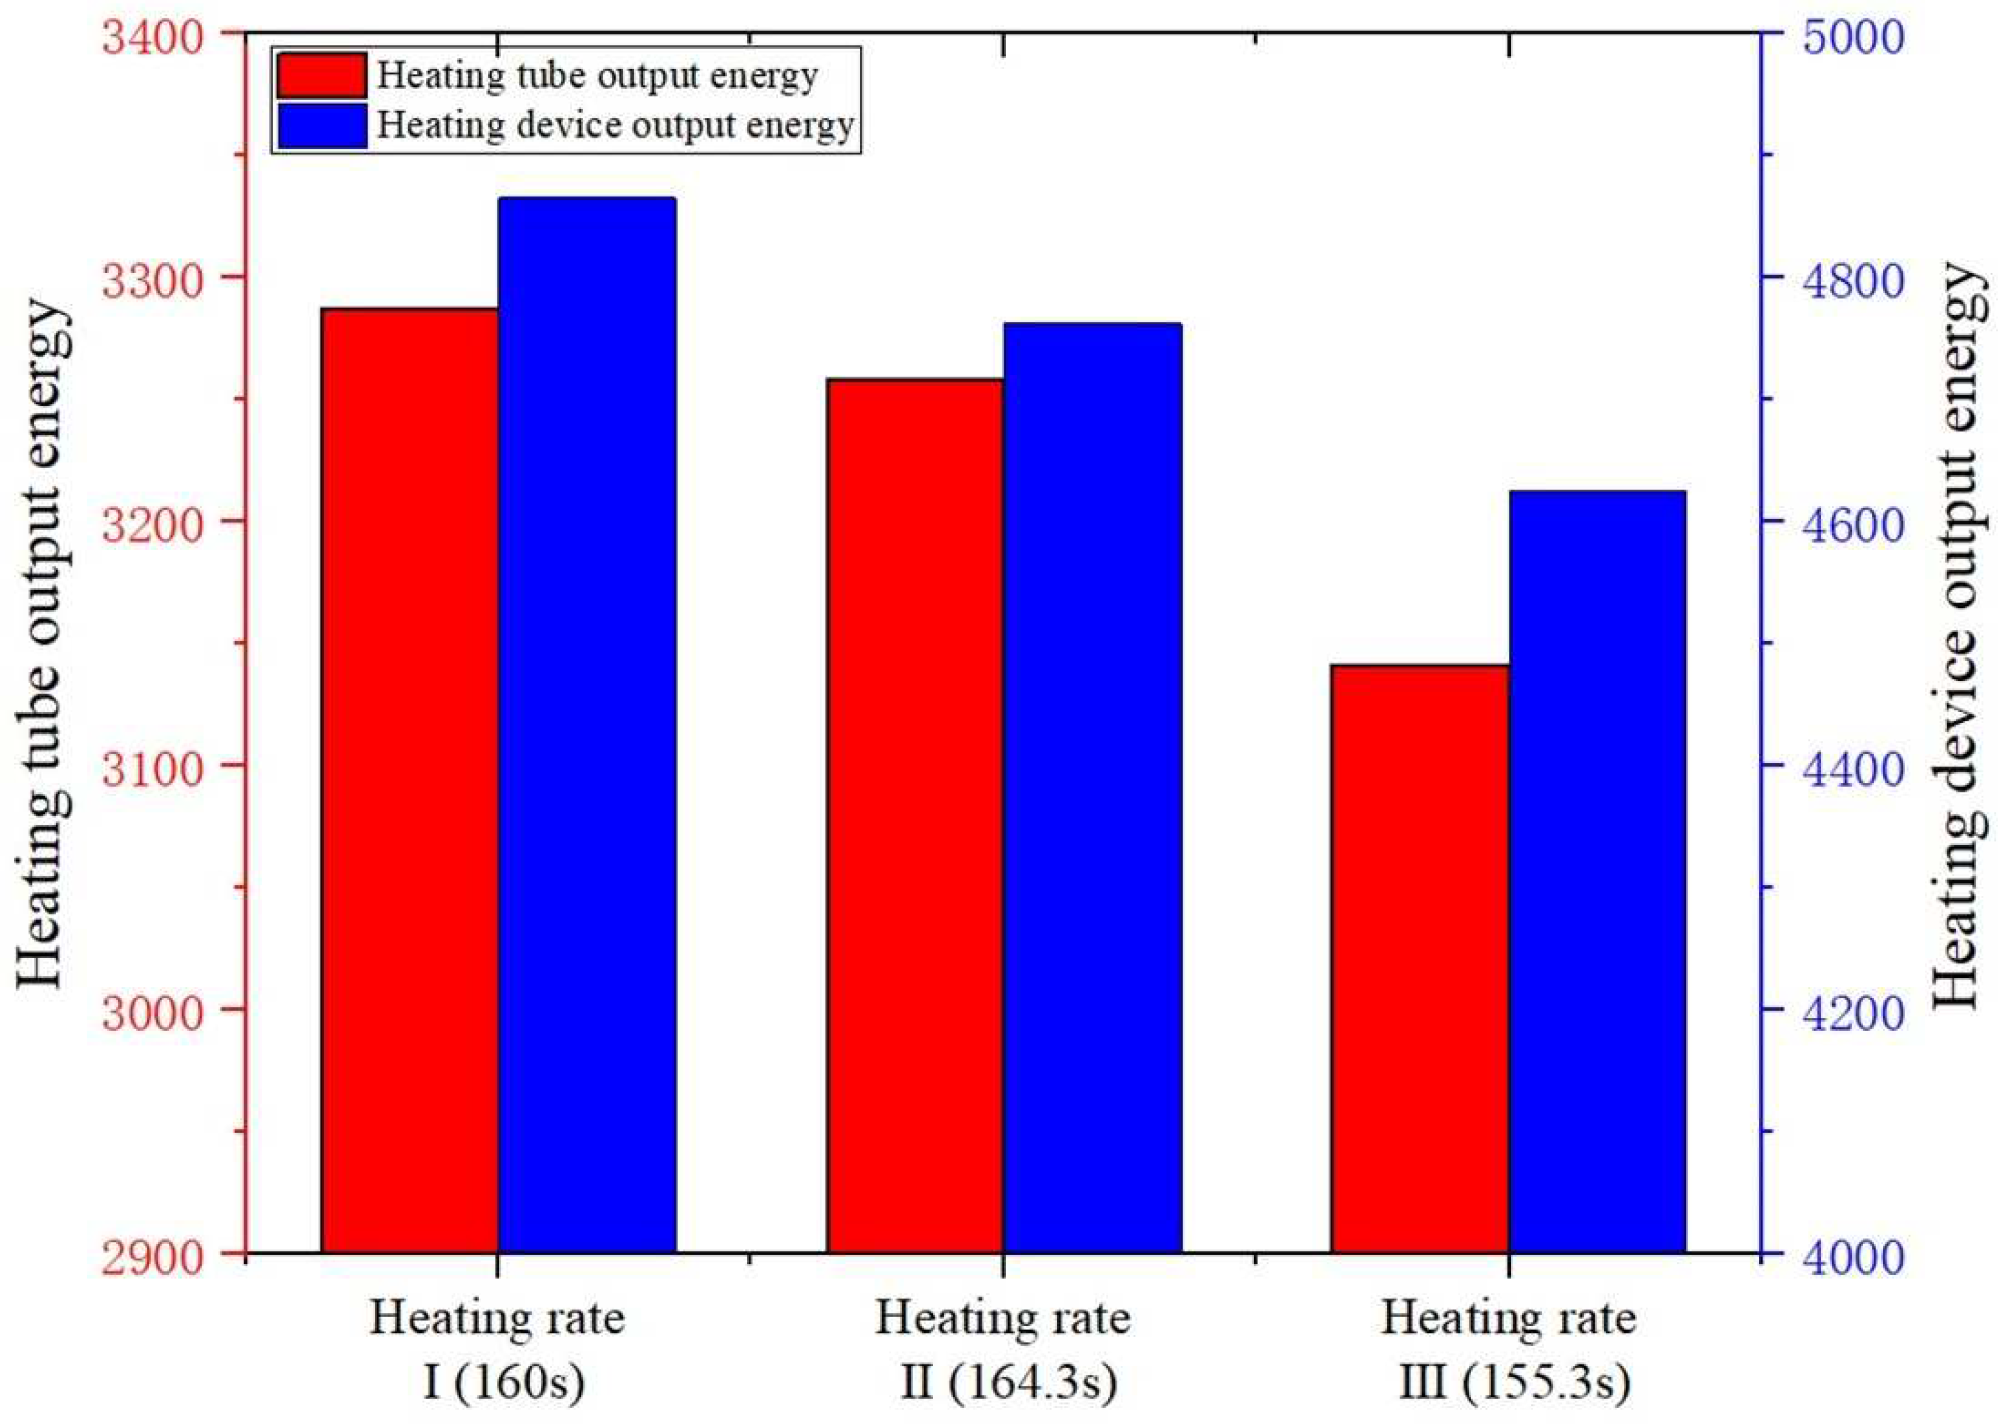
3.1. Impact of Heating Rate on Energy Efficiency

The GMP is affected by the heating rate during the heating phase, which in turn has an effect on energy consumption. In this study, four different strategies for the heating rate were used to investigate this issue. Figure 5 shows the four different heating methods, where the heating rate of the original heating strategy Ⅰ (0–160 s) was 35 mJ/(mm2·s), which effectively improved the forming effect of glass. Throughout the heating process, the value of heating rate strategy Ⅱ remained at 30 mJ/(mm2·s), the value of strategy Ⅲ remained at 40 mJ/(mm2·s), and finally, the value of strategy Ⅳ remained at 45 mJ/(mm2·s).
We performed a temperature simulation and analysis on the glass molds under four different heating rate strategies. As shown in Figure 6, observations were made at four points in the middle of the inner surface of the upper/lower mold, and the temperatures at points A, B, C, and D were compared under different strategies. The results of the simulation for the central temperature inside the glass mold are shown in Figure 7. As can be seen in Figure 7, the temperature of the glass mold also increased with the increase in the heating rate, and the temperature inside the mold increased from point A to D. Comparing the temperature changes of the two molds at 160 s, it is clear that the temperature difference of the upper mold was smaller than that of the lower mold. Taking points A1 and A2 as examples, the final temperatures of point A1 under the conditions of increasing the heating rate from low to high were 695.2 °C, 698.4 °C, 702.8 °C, and 706.3 °C, with a maximum temperature difference of 8 °C (in Figure 8). The final temperatures of point A2 at 160 s under the conditions of increasing the heating rate from low to high were 649.8 °C, 665.4 °C, 675.8 °C, and 677.2 °C, with a maximum temperature difference of 28 °C (in Figure 8). It is evident that the lower mold was more affected than the upper mold under the different heating rate strategies. This was due to the fact that the larger mold was heated, and the upper mold contained an additional heating tube than the lower mold, resulting in a more uniform finish.
Figure 8 shows the temperature distribution in the final stage of heating (t = 160 s) using four different heating rates for the heating devices and molds. It can be observed that their temperature variation trends were also very similar. As the heating rate continued to increase, the maximum temperature of the heating equipment and mold also rose. Conversely, if a slower heating rate is used, the surface temperature will decrease as the heating plate and its transmission parts cool down. After comprehensive consideration, adopting heating strategy Ⅳ (45 mJ/(mm2·s)) can significantly shorten the processing time and effectively promote energy efficiency.
By observing Figure 9, it can be seen that there was a significant difference in the energy output between the heating tubes and heating devices in the four different heating strategies. As shown in Figure 9, the heat output values of the heating tubes for heating rate strategies I~IV were 3287.1, 2886.5, 3316.4, and 3545.6 kJ, respectively, while the energy values produced by the heating devices for heating rate strategies I~IV were 4865.2, 4971.3, 4751.6, and 4668.5 kJ, respectively. It was found that the heating rate strategies with lower energy output from the heating tubes had higher energy output from the heating devices, while the heating rate strategies with higher energy output from the heating tubes had lower energy output from the heating devices. This is because using a fast heating rate strategy can shorten the heating time and reduce energy loss. In addition, using heating rate strategy Ⅳ reduced the energy output of the heating device by 4.04% compared to heating rate strategy Ⅰ, and the heating time was reduced by 7.06%. As the heating rate increases, negative effects may occur, such as excessive internal material stress and difficulty controlling the dimensional accuracy. To find a suitable balance between the processing performance and energy consumption, heating rate strategy Ⅳ was adopted in this study to reduce the energy consumption. In addition, under these process parameters, the nitrogen consumption was also reduced due to the shortened heating time.

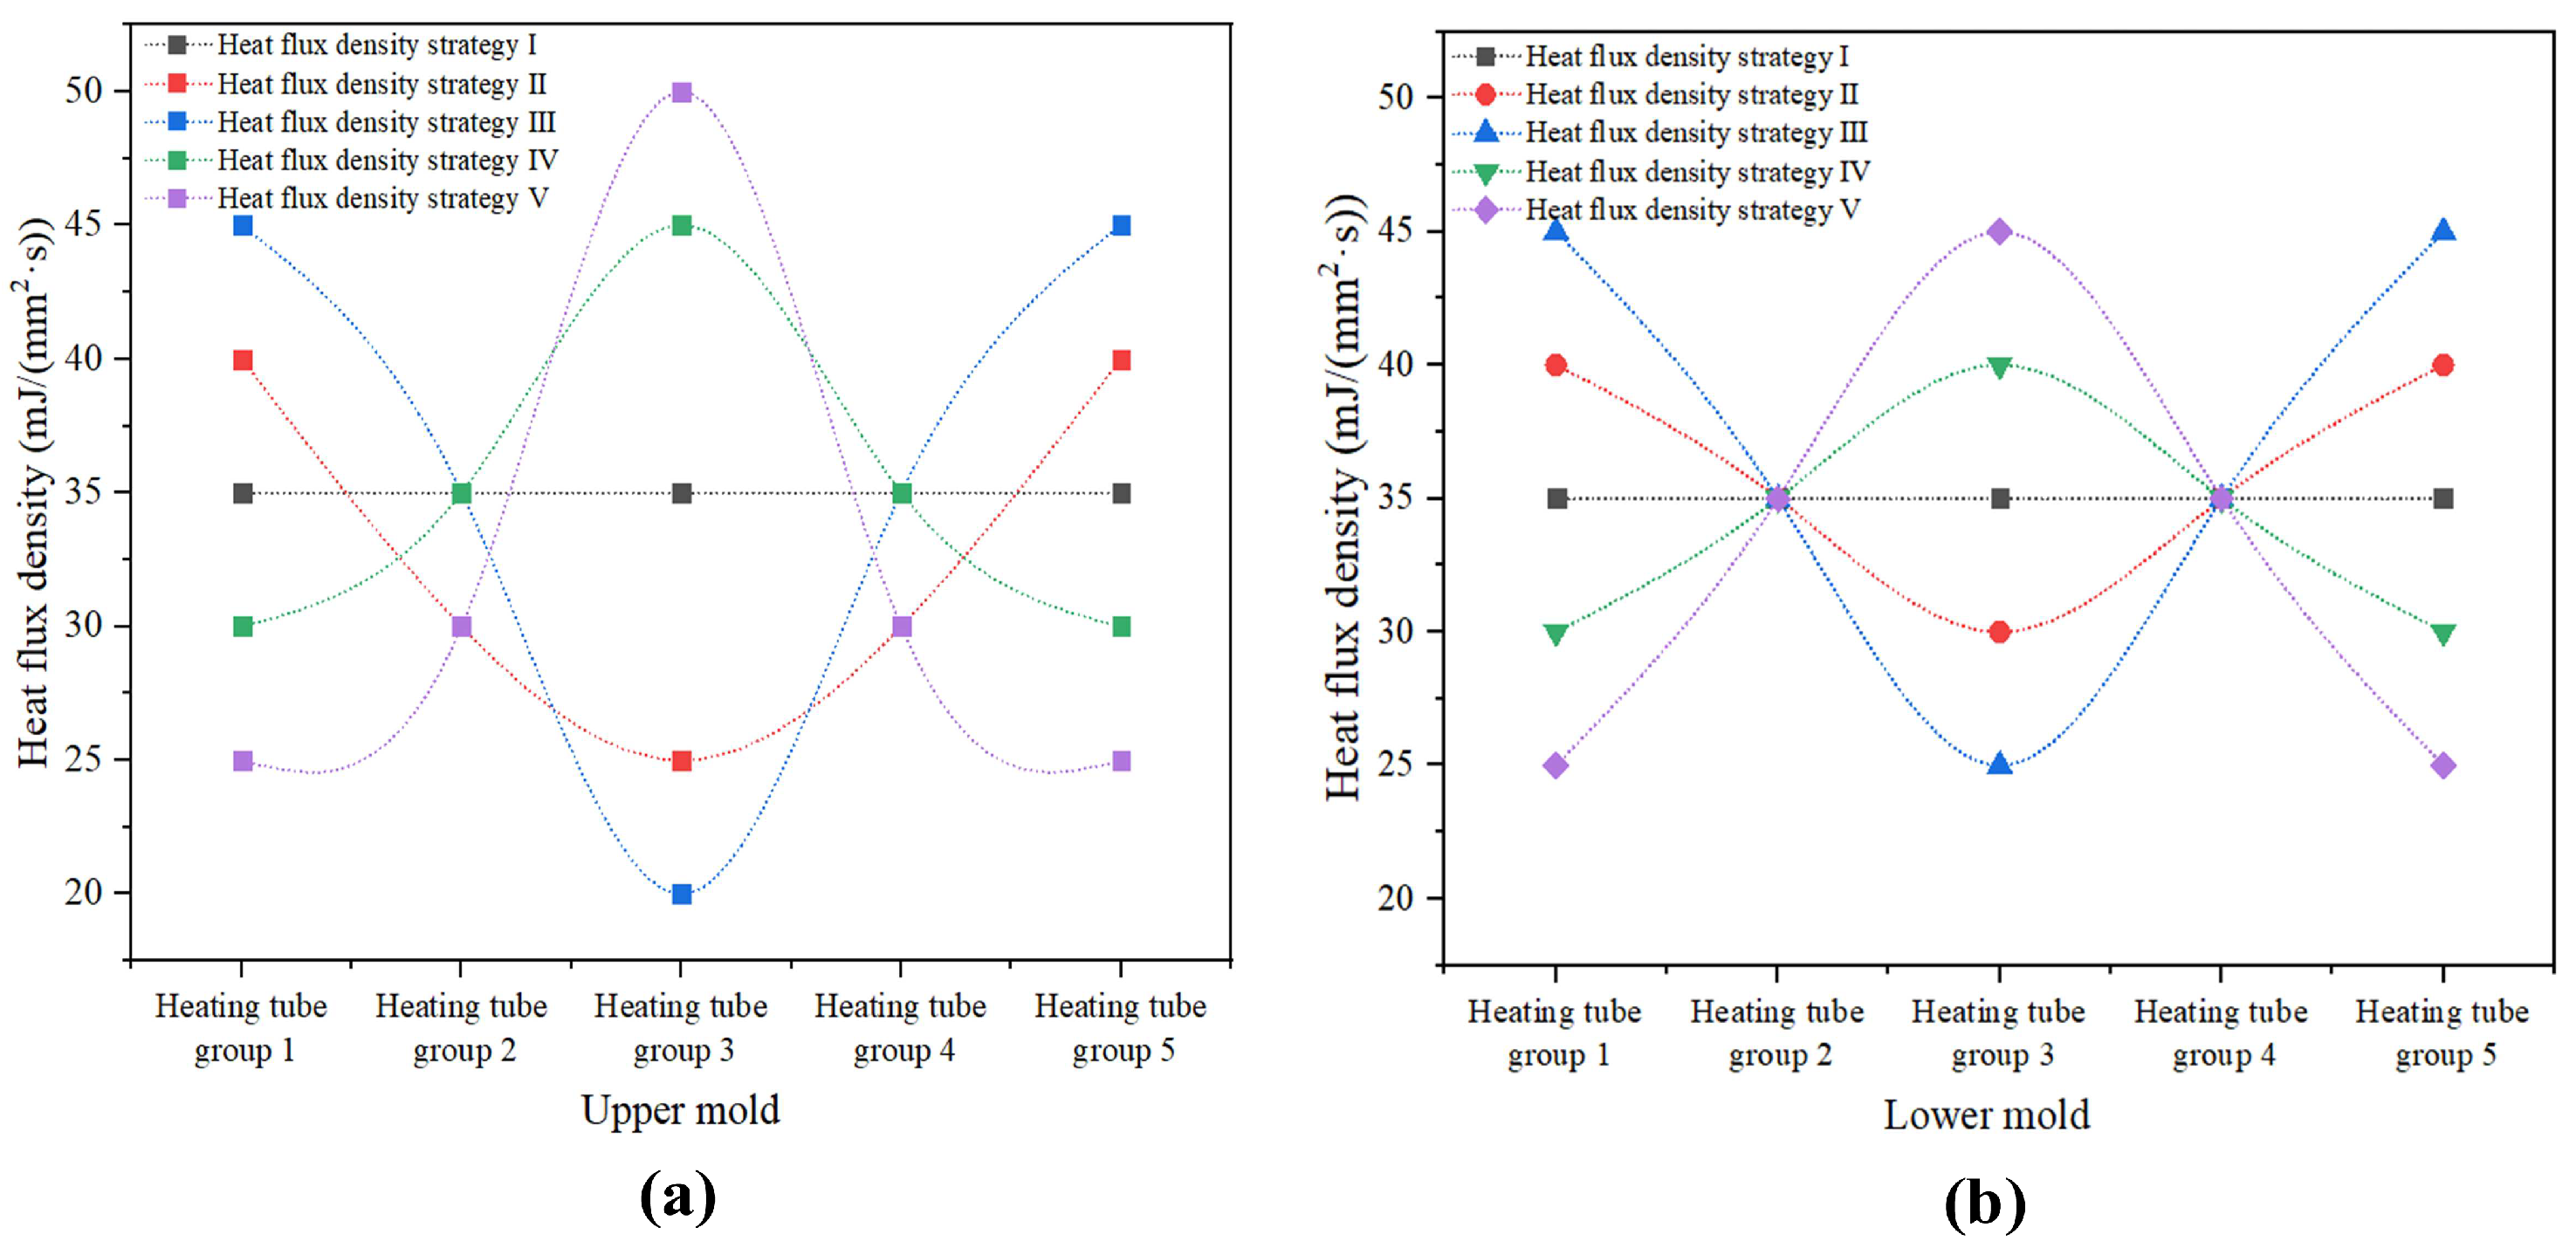
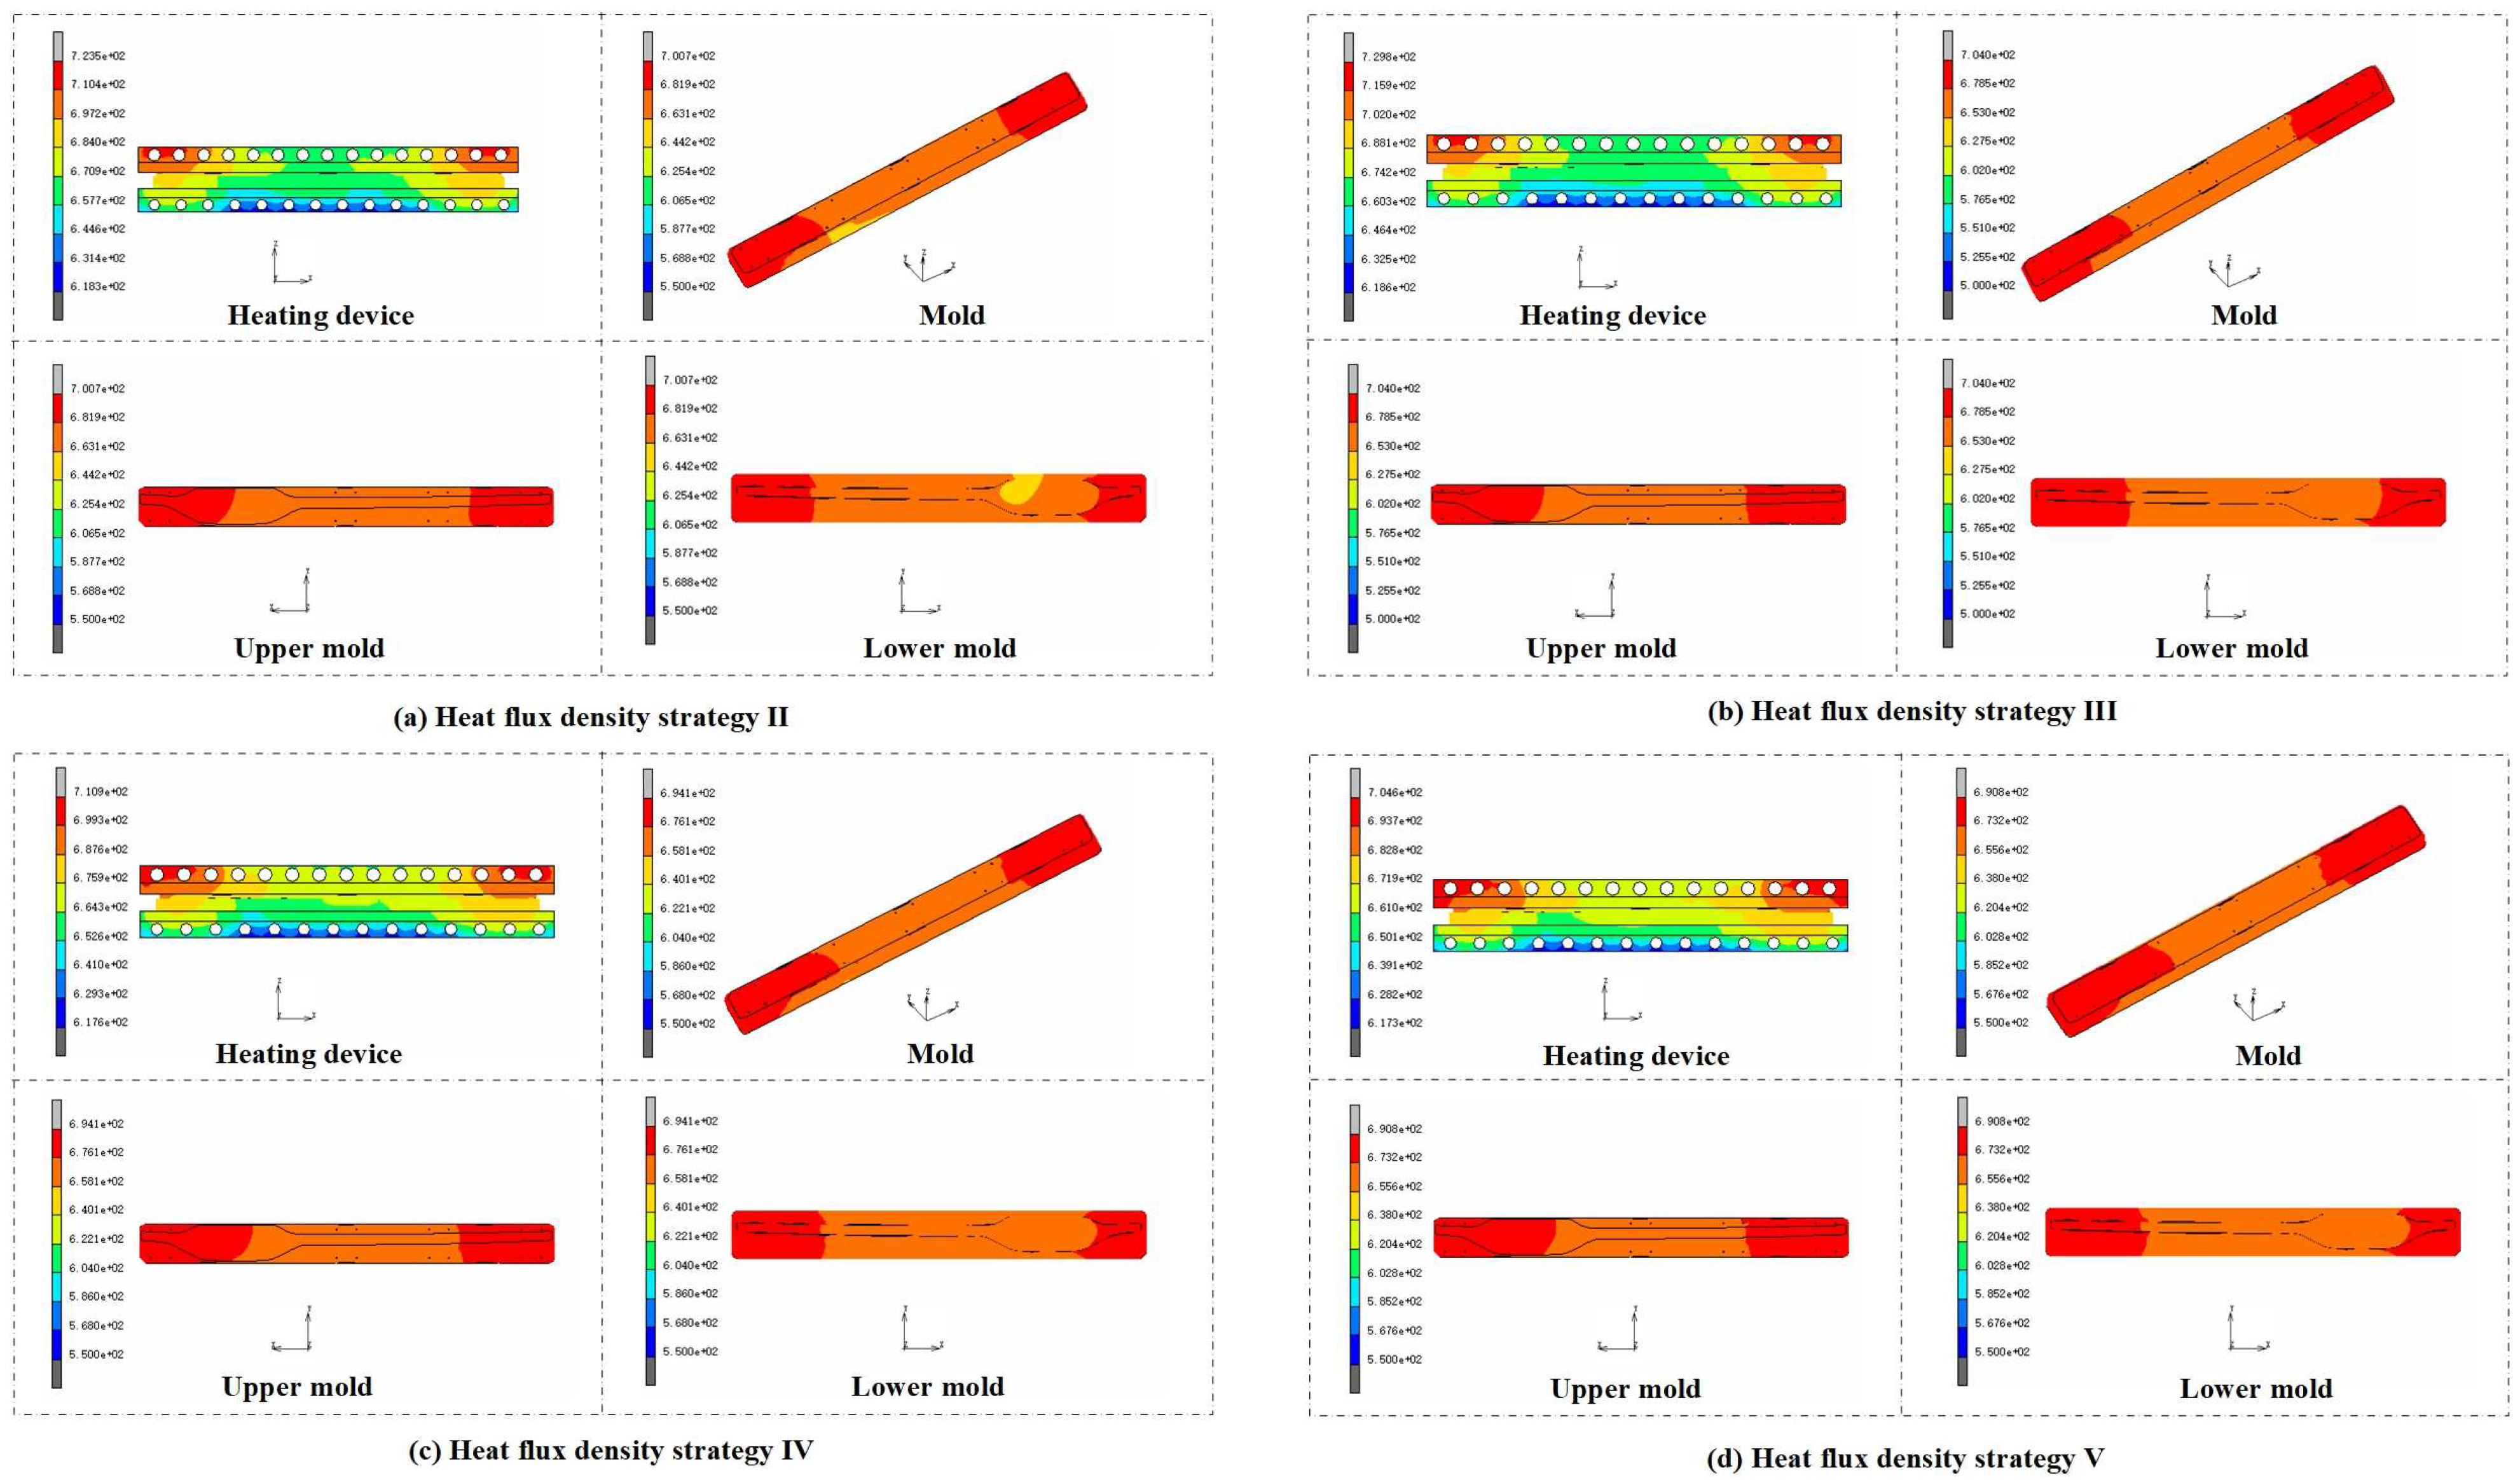
3.2. Impact of Heat Flux Density on Energy Efficacy

In the heating stage, the GMP is mainly heated by heating tubes. To explore the impact of the internal heat flux density of the heating tubes on the energy efficiency of the device, five different heat flow configuration strategies were designed, as shown in Figure 10. Fifteen and fourteen heating tubes were placed inside the upper and lower metal heating plates, respectively, and arranged into five groups. Three conductive pipes were installed in each group of the upper metal heating plate, while the number of conductive pipes in the lower metal heating plate was arranged as 3-3-2-2-3. In Figure 10, it can be seen that the five different strategies of heating heat flux density were applied to the glass molding process. In this section, the effects of five different strategies for the heat flux configuration of the heating tube on the temperature distribution of the heating device and the mold were studied. The impact of different configurations on energy consumption and the optimal energy-saving strategy were determined.
Five different heat flux density strategies were performed in simulation experiments, and the temperature at multiple observation points on the mold surface was observed. The simulation results of the different configurations of heat flux density in the final heating stage (t = 160 s) are shown in Figure 11. Based on the data in Figure 8 and Figure 11, whether using uniform or non-uniform heat flux density, the temperature variation in the heating equipment and the mold it produced was small. When using uniform heat flux density, the lowest temperature can be set to 718.5 °C, while when using non-uniform heat flux density (i.e., heat flux density strategy III), the lowest temperature can be set to 729.8 °C. When employing a strategy of higher heat flow density on the sides and lower heat flow density in the middle, the maximum temperature will be higher compared to using uniform heat flow density. Conversely, adopting the opposite approach will result in a lower temperature. However, the temperature distribution is similar to that of different strategies. Adopting the strategy can achieve balanced heat transfer but may reduce the temperature of the metal heating and conductive plates while increasing the mold temperature. Therefore, to improve production efficiency, a strategy with higher heat flow density on both sides and lower heat flow density in the middle can be chosen when selecting the heat flux density.
The use of different heating tube groups with different heat flux density strategies can cause changes in the overall temperature of the mold. According to Figure 12, thirty-three temperature monitoring points (A1-K3) were selected in the lower mold, and the temperature distribution using heat flux density strategies I–III is shown in Figure 13. In Figure 13a, it can be observed that the temperature change inside the lower mold using heat flux density strategy I was not significant, with a temperature change range of up to 5 °C. However, when strategy II was adopted, the highest temperature in the lower mold appeared in the areas around the left and right sides of the mold (A1-A3-B3-B1 and K1-K3-J3-J1), and the lowest temperature appeared in the central area of the inner cavity (D1-D3-F3-F1), as shown in Figure 13b. The temperature distribution using heat flux density strategy III was similar to that of strategy II, and the maximum temperature difference of strategy III was smaller than that of strategy II. A large temperature difference can cause a decrease in the product processing performance (in Figure 13c). Therefore, the final molding performance was the best when using strategy III.
As shown in Figure 14, by comparing three different strategies, it was observed that in strategies I, II, and III, the output power of the heating tubes reached 3287.1, 3258.6, and 3141.5 kJ, respectively. In the same three strategies, it consumed 4865.2, 4762.3, and 4625.5 kJ for the output power of the heating device. Therefore, it can be concluded that the effectiveness of all three strategies improved. After applying strategy III of non-uniform heat flux, the output energy of the heating tubes and the heating device was lower, and the maximum temperatures of the heating device and the mold were both increased. This is because a non-uniform strategy in heat flux density was used, which shortened the heating time and reduced energy loss. Compared to strategy I, the output energy using strategies II and III was reduced by 4.04% and 4.92%, respectively. In comparison, strategy I completed heating within 160 s, while strategy II completed it in 156.2 s, and strategy III completed it in 150.3 s. By comparison, the heating efficiency using strategies II and III was significantly improved, with the former’s reduction reaching 2.37%, and the latter’s reduction reaching 6.06%.

4. Discussion

As a major contributor to the world economy, China is the world’s largest producer and consumer of coal and, naturally, the world’s largest emitter of carbon [25,26,27,28]. Therefore, improving the efficiency of energy use and reducing carbon emissions are necessary parts of our production and processing [29,30,31]. During the process of forming large-scale automotive instrument glass, the heating apparatus requires electrical energy, the main source of which is coal used for electricity generation. The nitrogen required to cool the system also consumes a lot of electrical energy, which has an overall negative impact on the environment. Figure 15 shows the percentage of CO2 emissions from the automotive glass molding process. In the whole process, direct CO2 emissions account for about 92–97%, and indirect CO2 emissions account for about 3–6%. In the heating process, heating the mold and manufacturing nitrogen are the main components of direct CO2 emissions, accounting for 18–20% and 74–77%, respectively. In addition, the service life of graphite molds is significantly shortened in high-temperature environments; therefore, both graphite molds and glass raw materials are consumables, and the indirect emissions of CO2 are mainly from the process of manufacturing graphite molds (1–3%) and glass raw materials (2–3%). It was found that the direct emissions of CO2 are more significant than their indirect emissions.
Currently, coal-fired power generation is widely used in developing countries, such as China, due to its irreplaceability. According to the analysis of the heat transfer results for the different strategies, heating rate strategy IV and heat flux strategy III were the optimal strategies for the heat transfer model. The thermal energy output values of the heating device for these two strategies were 4668.5 kJ and 4625.5 kJ, respectively, compared to 4865.2 kJ for the original heat transfer strategy. It can be concluded that the CO2 emissions of heating rate strategy IV, heat flow density strategy III, and the original heat transfer strategy were 1.0374 kg, 1.0278 kg, and 1.0811 kg, respectively. This means that heat transfer strategy IV reduced carbon emissions by 4.04% compared to the original strategy, and heat transfer density strategy III reduced carbon emissions by 4.92%. Thereafter, the heat transfer model with heat flow density strategy III was the best strategy to reduce energy consumption and improve energy efficiency.
In our previous study [15], we studied the energy flow, energy consumption, and their relationships with the heating rate and heat flux in the heating stage of the GMP and analyzed the impact of the GMP on the environment from the perspective of carbon emissions. However, in this study, we chose glass with a large size and irregular shape as the research object, which is rarely studied by scholars and is also our innovation point. However, in terms of sustainable manufacturing, processing large-size glass using the GMP method has several disadvantages, including low efficiency, uneven heating, large temperature gradients, and low optical properties of the glass components after processing. By combining advanced technologies, such as ultrasonic-assisted GMP [31,32,33] and laser-assisted GMP [18,34,35], the efficiency and effectiveness of the hot bending process can be improved, resulting in higher-quality and more accurate glass elements. In a follow-up study, we will conduct further research on these two auxiliary processing technologies.

5. Conclusion and Future Work

In this survey, numerical simulations were performed for large-scale automotive instrument glass, and numerical and experimental models were constructed to explore the energy efficiency issues of different strategies during the heating phase of the glass molding process and to analyze the environmental impact of carbon emissions from the GMP. The following important conclusions can be drawn.
(1)
After systematic theoretical analysis and experimental tests, a heat transfer model of a metal heating plate, a metal heat conductor, and a glass model was developed, which can accurately model the action of heat flow, and thus, predict the temperature changes in the glass mold for large-sized automotive instrument glass.
(2)
The analysis of the simulation results shows that different heating rate strategies had an impact on the energy efficiency of the GMP. Under heating rate strategy IV, the output energy of the heating device was lower than that under strategy I by 4.04%, and the heating time was reduced by 7.06%. Therefore, using heating rate strategy IV is the most ideal option.
(3)
The analysis of the numerical results shows that different heat flux strategies affected the energy consumption of the heating device. The results show that the heat flow density strategy III effect was the best. The output energy of the heating equipment was reduced by 4.92%, and the heating time was reduced by 6.06%.
In the future, we will actively engage in extensive research to introduce new process technologies, such as ultrasound-assisted and laser-assisted techniques. The application of these emerging technologies will further enhance work efficiency and facilitate effective energy conservation.

Author Contributions

Y.C. (Yanyan Chen), Y.C. (Yang Cao) and W.M. carried out the concept and methodology. Y.C. (Yanyan Chen) and S.Z. wrote the first draft. S.Z., S.H., Y.Z., Y.C. (Yanyan Chen) and G.Z. carried out the formal analysis and data analysis. S.H., Y.Z., G.Z. and W.M. mainly carried out the investigation. G.Z. and W.M. undertook funding acquisition. Y.C. (Yanyan Chen) and S.Z. are the first co-authors. All authors have read and agreed to the published version of the manuscript.

Funding

This work was supported by the National Natural Science Foundation of China (No. 51975228), the Henan Province Key Science and Technology Project (Nos. 222102220011, 232102220099), and the Local Innovative and Research Team Project of Guangdong Pearl River Talents Program (No. 2017BT01G167).

Data Availability Statement

Not applicable.

Conflicts of Interest

The authors declare no conflict of interest.

References

  1. Akhtar, A.; Ruan, H.H. Review on thin film coatings for precision glass molding. Surf. Interfaces 2022, 30, 101903. [Google Scholar] [CrossRef]
  2. Yang, W.; Zhang, Z.; Ming, W.Y.; Yin, L.; Zhang, G.J. Study on shape deviation and crack of ultra-thin glass molding process for curved surface. Ceram. Int. 2022, 48, 6767–6779. [Google Scholar] [CrossRef]
  3. Shu, C.S.; Guo, X.P.; Yin, S.H.; Huang, S.; Mao, Z.Z. Fabrication of curved aspheric compound eye microlens array with high surface quality by precision glass molding. Precis. Eng. 2023, 82, 129–139. [Google Scholar] [CrossRef]
  4. Yi, A.Y.; Jain, A. Compression Molding of Aspherical Glass Lenses-A Combined Experimental and Numerical Analysis. J. Am. Ceram. Soc. 2005, 88, 579–586. [Google Scholar] [CrossRef]
  5. He, W.B.; Chen, Z.J.; Ming, W.Y.; Du, J.G.; Cao, Y.; Ma, J.; Wei, A.Y. Multi-objective optimization of glass multi-station bending machining for smartphone curved screen. J. Braz. Soc. Mech. Sci. 2019, 41, 476. [Google Scholar] [CrossRef]
  6. Ming, W.Y.; Zhang, S.F.; Liu, X.W.; Liu, K.; Yuan, J.; Xie, Z.B.; Sun, P.Y.; Guo, X.D. Survey of Mura Defect Detection in Liquid Crystal Displays Based on Machine Vision. Crystals 2021, 11, 1444. [Google Scholar] [CrossRef]
  7. Ming, W.Y.; Cao, C.; Zhang, G.J.; Zhang, H.M.; Zhang, F.; Jiang, Z.W.; Yuan, J. Review: Application of Convolutional Neural Network in Defect Detection of 3C Products. IEEE Access 2021, 9, 135657–135674. [Google Scholar] [CrossRef]
  8. Disfani, M.M.; Arulrajah, A.; Bo, M.W.; Sivakugan, N. Environmental risks of using recycled crushed glass in road applications. J. Clean. Prod. 2012, 20, 170–179. [Google Scholar] [CrossRef]
  9. Ashie, I.N.A.; Smith, J.P.; Simpson, B.K.; Haard, N.F. Spoilage and shelf-life extension of fresh fish and shellfish. Crit. Rev. Food Sci. Nutr. 1996, 36, 87–121. [Google Scholar] [CrossRef]
  10. Poonia, A.; Jha, A.; Sharma, R.; Singh, H.B.; Rai, A.K.; Sharma, N. Detection of adulteration in milk: A review. Int. J. Dairy Technol. 2017, 70, 23–42. [Google Scholar] [CrossRef]
  11. Vu, A.T.; Kreilkamp, H.; Dambon, O.; Klocke, F. Nonisothermal glass molding for the cost-efficient production of precision freeform optics. Opt. Eng. 2016, 55, 071207. [Google Scholar] [CrossRef]
  12. Zhang, Z.; Ming, W.Y.; Zhang, Y.; Yin, L.; Xue, T.; Yu, H.S.; Chen, Z.J.; Liao, D.M.; Zhang, G.J. Analyzing sustainable performance on high-precision molding process of 3d ultra- thin glass for smart phone. J. Clean. Prod. 2020, 255, 120196. [Google Scholar] [CrossRef]
  13. Ming, W.Y.; Chen, J.Z.; Du, J.G.; Zhang, Z.; Zhang, G.J.; He, W.B.; Ma, J.; Shen, F. A comprehensive review of theory and technology of glass molding process. Int. J. Adv. Manuf. Technol. 2020, 107, 2671–2706. [Google Scholar] [CrossRef]
  14. Li, L.H.; Chan, M.K.; Lee, W.B.; Ng, M.C.; Chan, K.L. Modeling and experimental performance analysis of a novel heating system and its application to glass hot embossing technology. Opt. Lett. 2018, 44, 3454–3457. [Google Scholar] [CrossRef]
  15. Ming, W.Y.; Jiang, Z.W.; Chen, Z.J.; He, W.B.; Li, X.K. Modelling and analysis of energy consumption in glass molding process for smartphone covers using different heating strategies. Int. J. Adv. Manuf. Technol. 2023, 124, 1491–1512. [Google Scholar] [CrossRef]
  16. Ming, W.Y.; Jia, H.J.; Huang, H.Y.; Zhang, G.J.; Liu, K.; Lu, Y.; Cao, C. Study on Mechanism of Glass Molding Process for Fingerprint Lock Glass Plates. Crystals 2021, 11, 394. [Google Scholar] [CrossRef]
  17. Ming, W.Y.; Jia, H.J.; Liu, X.; Liu, X.; He, W.B.; Wei, A.Y.; Chen, Z.J. Optimization of process parameters of GMP for 3D ultrathin glass based on cuckoo search algorithm. IOP Conf. Ser. Mater. Sci. Eng. 2020, 768, 042046. [Google Scholar] [CrossRef]
  18. Wang, P.; Zhang, Z.; Hao, B.; Wei, S.; Huang, Y.; Zhang, G. Investigation on heat transfer and ablation mechanism of CFRP by different laser scanning directions. Compos Part B Eng. 2023, 262, 110827. [Google Scholar] [CrossRef]
  19. Zhang, Z.; Yang, W.; Ming, W.Y.; Yin, L.; Liao, D.M.; Zhang, G.J. Surface integrity analysis of ultra-thin glass molding process. Ceram. Int. 2021, 47, 30584–30597. [Google Scholar] [CrossRef]
  20. Ming, W.Y.; Cao, C.; Xie, Z.B.; Liu, X.W.; Xu, Y.J.; Jiang, Z.W.; Li, X.K.; Liu, K.; Guo, X.D.; Yuan, J. Green manufacturing: A comparative study of renewable dielectrics in the EDM process. J. Braz. Soc. Mech. Sci. 2022, 44, 580. [Google Scholar] [CrossRef]
  21. Zhang, Z.; Qiu, W.Z.; Zhang, G.J.; Liu, D.H.; Wang, P. Progress in applications of shockwave induced by short pulsed laser on surface processing. Opt. Laser Technol. 2023, 157, 108760. [Google Scholar] [CrossRef]
  22. Chen, H.; Yang, J.; Xue, X. A New Marc Finite Element Course of Example; China Machine Press: Beijing, China, 2007; pp. 221–289. [Google Scholar]
  23. Beck, J.V. Transient temperatures in a semi-infinite cylinder heated by a disk heat source. Int. J. Heat Mass Transf. 1981, 24, 1631–1640. [Google Scholar] [CrossRef]
  24. Storck, K. Thermal System Analysis: Heat Transfer in Glass Forming and Fluid Temperature-Control Systems; Linköping University: Linköping, Sweden, 1998. [Google Scholar]
  25. Gu, W.; Zhao, X.H.; Yan, X.B.; Wang, C.; Li, Q. Energy technological progress, energy consumption, and CO2 emissions: Empirical evidence from China. J Clean Prod. 2019, 236, 117666. [Google Scholar] [CrossRef]
  26. Ming, W.Y.; Guo, X.D.; Xu, Y.J.; Zhang, G.J.; Jiang, Z.W.; Li, Y.Z.; Li, X.K. Progress in non-traditional machining of amorphous alloys, Ceramics International. Ceram. Int. 2023, 49, 1585–1604. [Google Scholar] [CrossRef]
  27. Ming, W.Y.; Sun, P.Y.; Zhang, Z.; Qiu, W.Z.; Du, J.G.; Li, X.K.; Zhang, Y.M.; Zhang, G.J.; Liu, K.; Wang, Y.; et al. A systematic review of machine learning methods applied to fuel cells in performance evaluation, durability prediction, and application monitoring. Int. J. Hydrog. Energy 2023, 48, 5197–5228. [Google Scholar] [CrossRef]
  28. Zhang, J.; Jiang, H.Q.; Liu, G.Y.; Zeng, W.H. A study on the contribution of industrial restructuring to reduction of carbon emissions in China during the five five-year plan periods. J. Clean Prod. 2018, 176, 629–635. [Google Scholar] [CrossRef]
  29. Ming, W.Y.; Xie, Z.B.; Jiang, Z.W.; Chen, Y.Y.; Zhang, G.J.; Xu, Y.J.; He, W.B. Progress in optical adhesive and lamination process of touch screen in 3C products. J. Soc. Inf. Display 2022, 30, 851–876. [Google Scholar] [CrossRef]
  30. Ming, W.Y.; Jia, H.J.; Zhang, H.M.; Zhang, Z.; Liu, K.; Du, J.G.; Shen, F.; Zhang, G.J. A comprehensive review of electric discharge machining of advanced ceramics. Ceram. Int. 2020, 46, 21813–21838. [Google Scholar] [CrossRef]
  31. Yu, J.W.; Luo, H.; Nguyen, T.H.; Huang, L.; Liu, B.; Zhang, Y.Y. Eigenfrequency characterization and tuning of Ti-6Al-4V ultrasonic horn at high temperatures for glass molding. Ultrasonics 2020, 101, 106002. [Google Scholar] [CrossRef] [PubMed]
  32. Luo, H.; Yu, J.W.; Lou, H.Q.; Huang, K.F.; Hu, J.Z.; Xu, B.C. Thermal/tribological effects of superimposed ultrasonic vibration on viscoelastic responses and mold-filling capacity of optical glass: A comparative study. Ultrasonics 2020, 108, 106234. [Google Scholar] [CrossRef]
  33. Zhang, Y.; Zhao, H.; Yan, Y.Q.; Tong, X.; Ma, J.; Ke, H.B.; Wang, W.H. Ultrasonic-assisted fabrication of metallic glass composites. J. Non-Cryst. Solids 2022, 597, 121894. [Google Scholar] [CrossRef]
  34. Li, R.; Li, C.K.; Yan, M.F.; Li, M.; Lin, C.G.; Dai, S.X.; Song, B.A.; Xu, T.F.; Zhang, P.Q. Fabrication of chalcogenide microlens arrays by femtosecond laser writing and precision molding. Ceram. Int. 2023, 49, 15865–15873. [Google Scholar] [CrossRef]
  35. Gülçür, M.; Romano, J.M.; Penchev, P.; Gough, T.; Brown, E.; Dimov, S.; Whiteside, B. A cost-effective process chain for thermoplastic microneedle manufacture combining laser micro-machining and micro-injection moulding. CIRP J. Manuf. Sci. Technol. 2021, 32, 311–321. [Google Scholar] [CrossRef]
Figure 1. Model of metal heat conduction plates for large-sized automotive instrument glass molding process; (a) upper mold, (b) lower mold, (c) three-dimensional model and dimensions of the metal heating plate and heat-conducting plate (heating conductor).
Metals 13 01218 g001
Figure 2. Three-dimensional finite element (FEM) mesh model (using MSC Marc) and its cross-sectional view of GMP. (a) 3D finite element mesh model of the glass molding process, (b) the cross-sectional view of the model.
Metals 13 01218 g002
Figure 3. GMP viscous–sliding friction model.
Metals 13 01218 g003
Figure 4. Energy consumption calculation process of GMP system during heating.
Metals 13 01218 g004
Figure 5. Schematic diagram of different heating rate strategies during glass molding process.
Metals 13 01218 g005
Figure 6. Schematic diagram of temperature measurement points in the upper and lower mold cavities.
Metals 13 01218 g006
Figure 7. Simulation results of mold temperature under four different heating rate strategies. Upper and lower mold temperature measurement points: (a) A1; (b) A2; (c) B1; (d) B2; (e) C1; (f) C2; (g) D1; (h) D2.
Metals 13 01218 g007
Figure 8. Temperature distribution in the final stage of heating (t = 160 s) using four different heating rates of the heating devices and molds.
Metals 13 01218 g008
Figure 9. Comparison of output energy of heating tube and heating devices under four different heating rate strategies.
Metals 13 01218 g009
Figure 10. Schematic diagram of five different heat flux density strategies during the glass molding process; (a) upper mold heat flux density distribution strategies, (b) lower mold heat flux density distribution strategies.
Metals 13 01218 g010
Figure 11. Temperature distribution of heating device and mold under different strategies of heat flux density (t = 160 s).
Metals 13 01218 g011
Figure 12. Schematic diagram of the selection of observation points for the lower mold temperature (A1–K3 are the temperature detection points).
Metals 13 01218 g012
Figure 13. Temperature distribution on the inner surface of the mold under three different strategies of heat flux density; (a) heat flux density strategy I, (b) heat flux density strategy II, (c) heat flux density strategy III.
Metals 13 01218 g013
Figure 14. Comparison of the output energy of the heating tubes and the heating device under three different heat flux density strategies.
Metals 13 01218 g014
Figure 15. CO2 emission ratio of glass molding process for large-sized automotive instrument glass.
Metals 13 01218 g015
Table 1. Thermal and mechanical properties of SUS310S and WC materials [2].
MaterialsSUS310SWC
Young’s modulus E   ( GPa ) 193570
Poisson’s ratio υ 0.30.22
Density ρ ( g / cm 3 ) 7.914.65
Heat conductivity K   ( W / m ° C ) 18.563
Specific heat capacity C P   ( J / kg ° C ) 500314
Coefficient of heat expansion ( ° C ) 18.2 × 10−64.9 × 10−6
Table 2. Constrained displacement, loading, and initial temperature for the FEM model.
FEM ModelConstrained DisplacementLoading (MPa)Initial Temperature (°C)
Upper heating platex/y0.3780
Upper heat conduction platex/y-780
Moldx/y-20
Lower heat conduction plate x/y/z-780
Lower heating platex/y/z-780
Disclaimer/Publisher’s Note: The statements, opinions and data contained in all publications are solely those of the individual author(s) and contributor(s) and not of MDPI and/or the editor(s). MDPI and/or the editor(s) disclaim responsibility for any injury to people or property resulting from any ideas, methods, instructions or products referred to in the content.

