

Ultra-Low Cycle Fatigue Life Prediction Model—A Review

Abstract
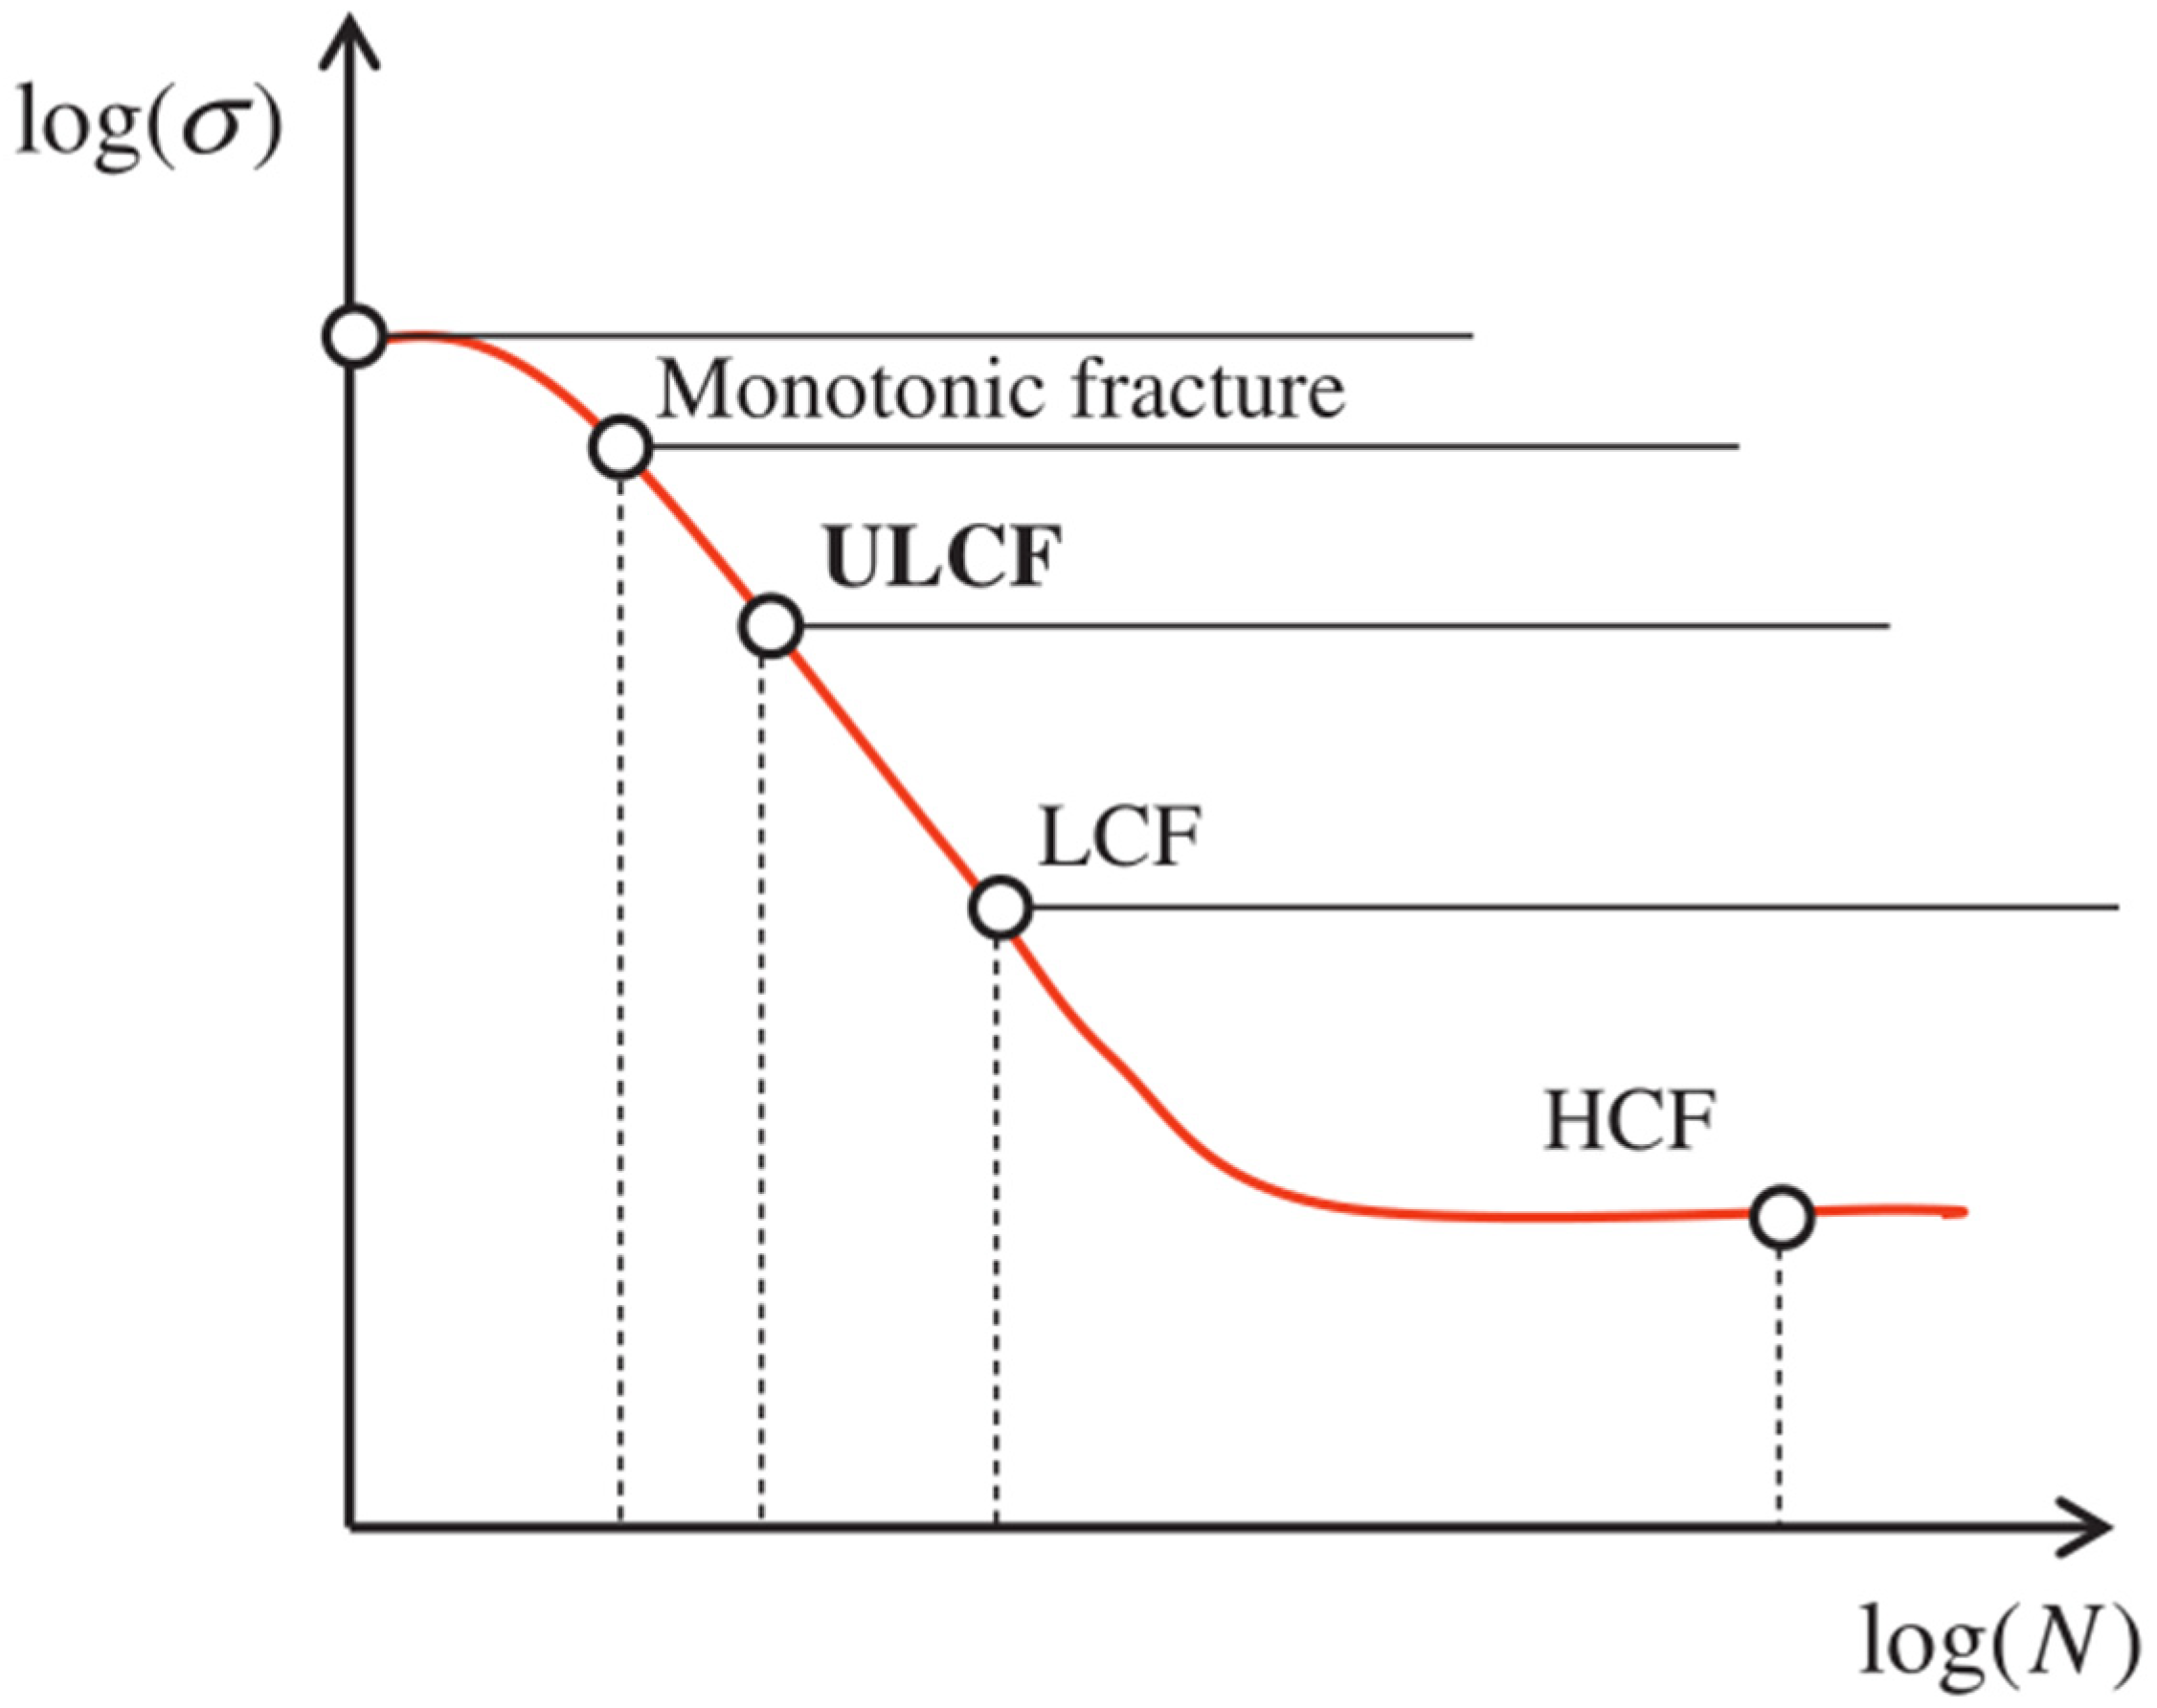
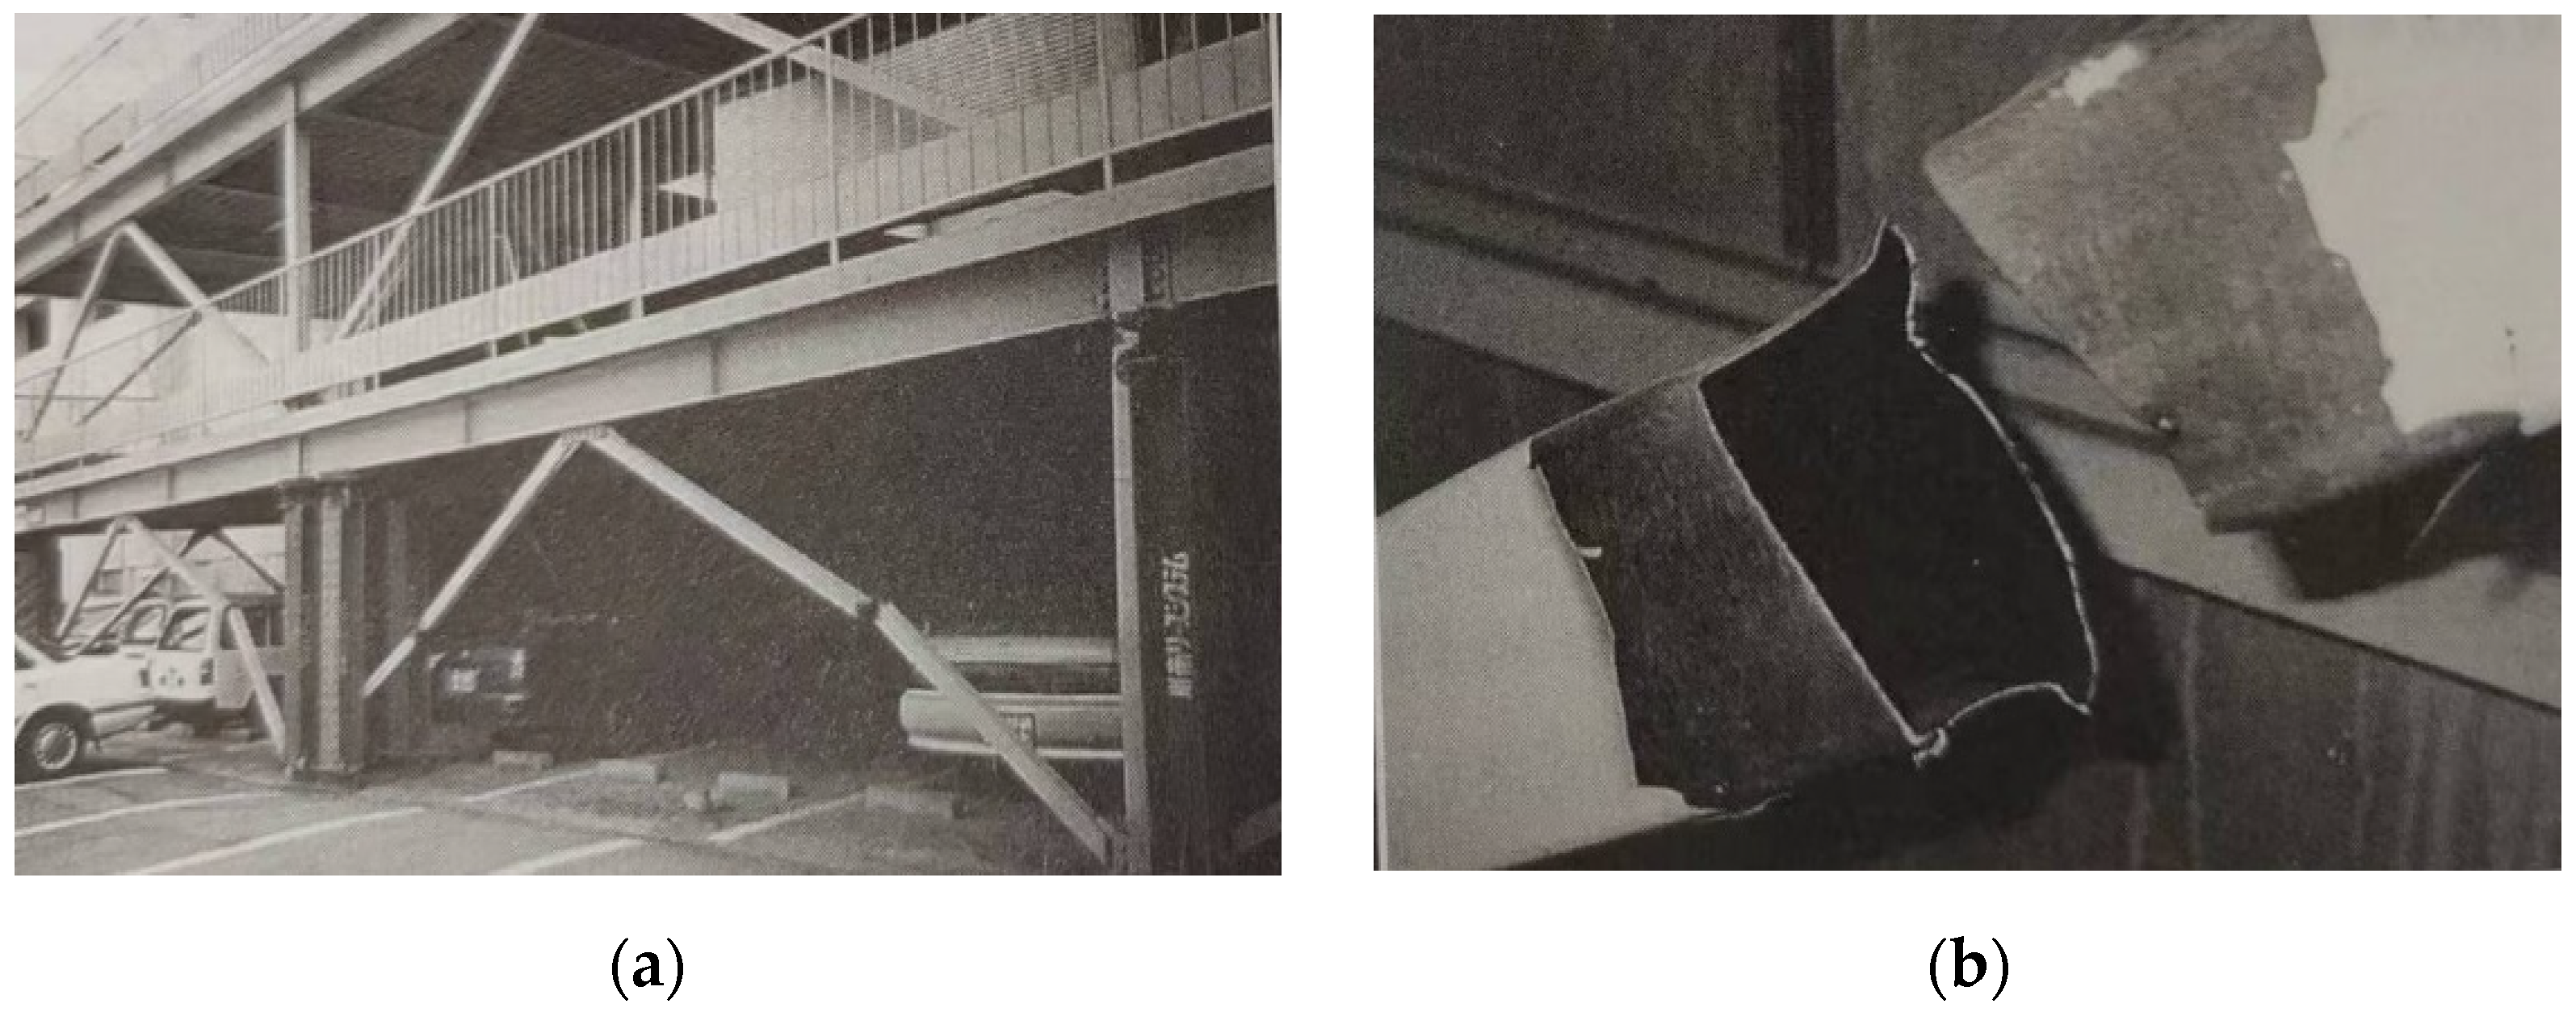
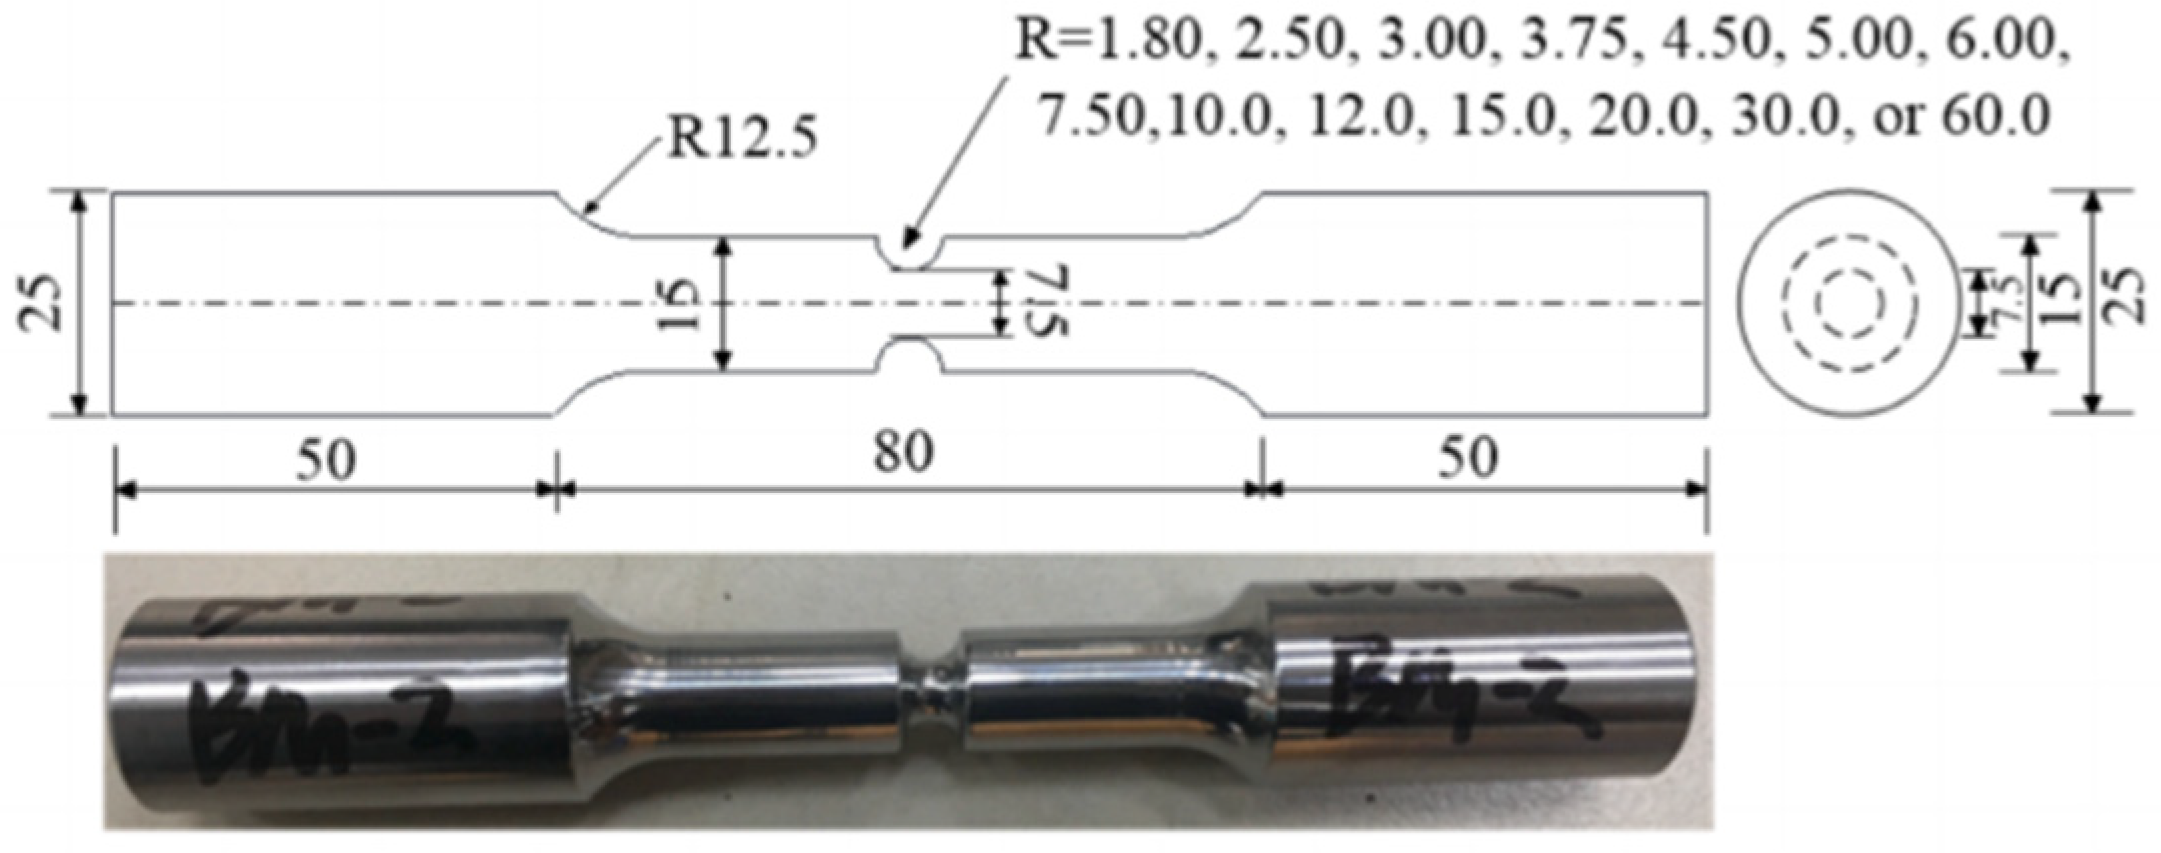
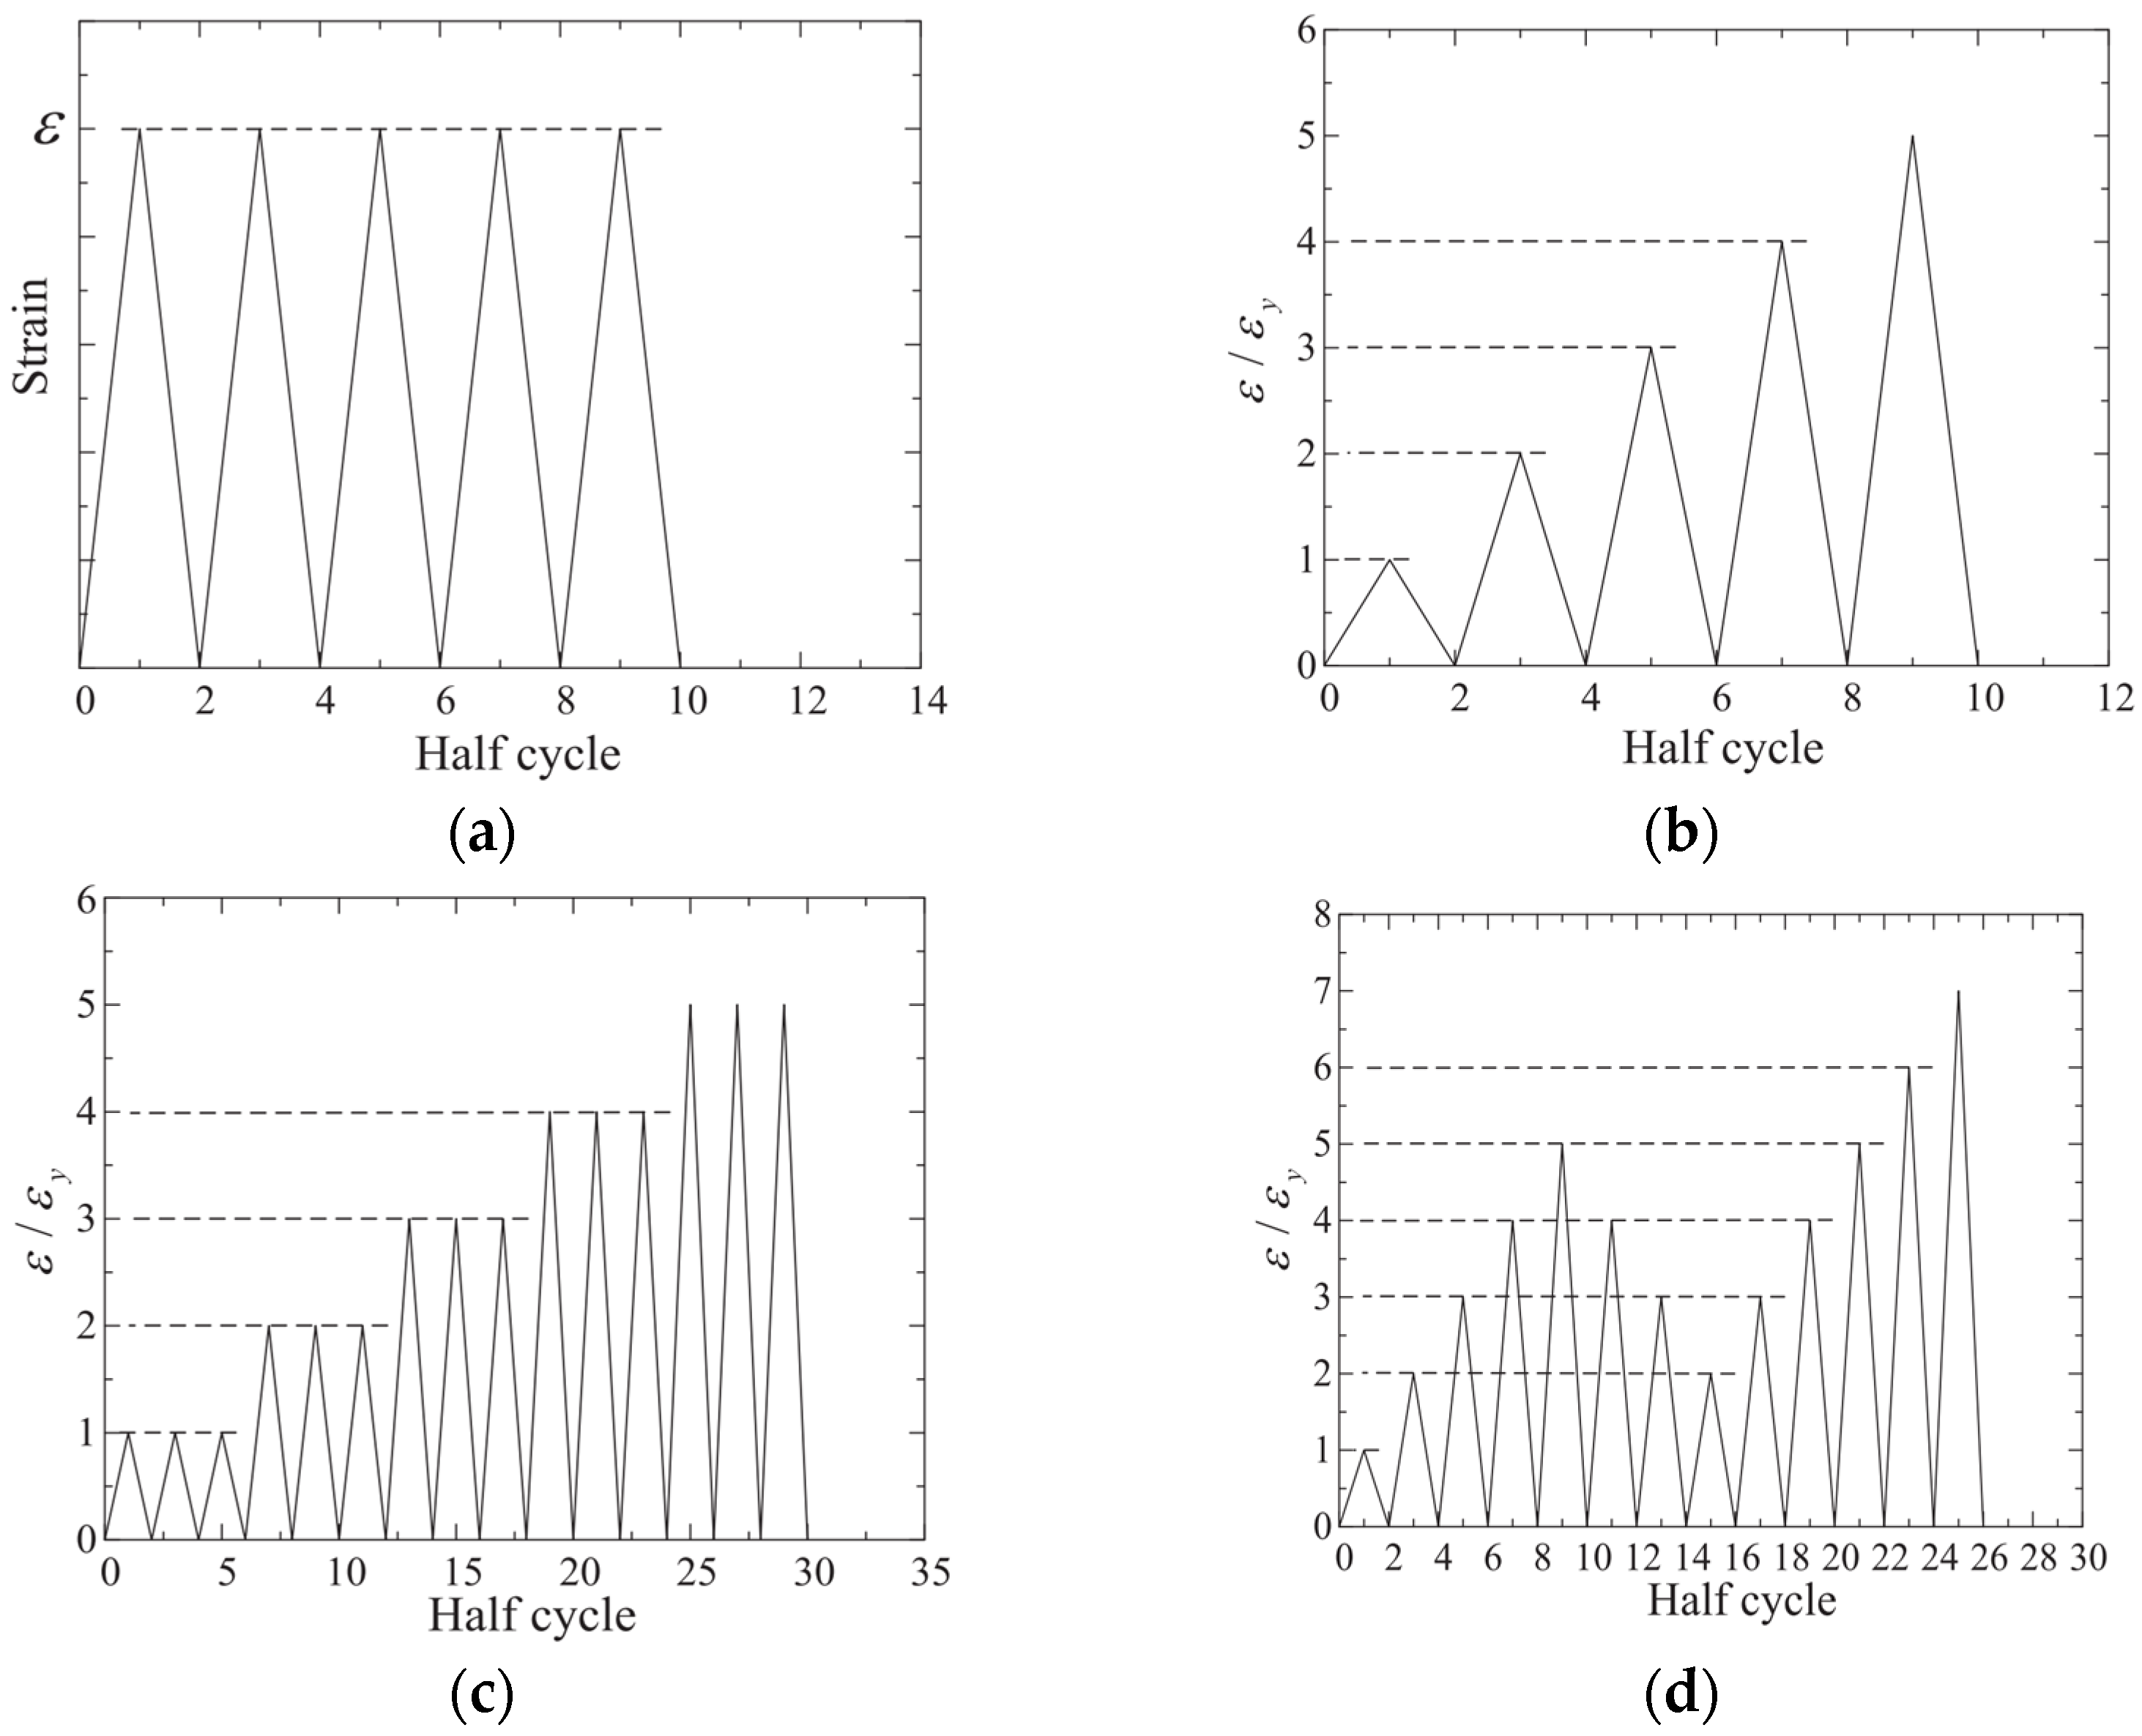
:1. Introduction


2. Improved Manson-Coffin Model
3. Microcosmic Ductility Fracture Model Based on Void Growth
3.1. Rice-Tracey Model
3.2. The Micromechanical Void Growth Model (MM-VGM)
3.3. Stress-Modified Critical Strain (SMCS) Model
3.4. Cyclic Void Growth Model (CVGM)
3.5. Degraded Significant Plastic Strain (DSPS) Model
3.6. The Micromechanical Cyclic Void Growth Model (MM-CVGM)
3.7. Lode Parameter Cyclic Void Growth Model (LCVGM)
3.8. Improved Cyclic Void Growth Model (ICVGM)
3.9. The Summary of This Section
4. Fracture Model Based on Porous Plasticity
4.1. Gurson-Tvergaard-Needleman (GTN) Model
4.2. The Application and Development of the GNT Model
4.3. The Summary of This Section
5. Fracture Model Based on Micromechanical Damage
5.1. Barcelona Plastic Damage Model
5.2. The Damage Model Based on CVGM
5.3. Continuous Damage Model (CDM)
5.4. Stress-Weighted Ductile Fracture Model (SWDFM)
5.5. Liu Model [86]
5.6. Cyclic Multiaxial Fracture Strain Energy (CMFSE)
5.7. Cyclic Lode Parameter Enhanced Continuum Damage Mechanics (CLCDM) Model
5.8. The Summary of this Section
6. Summary
- (1)
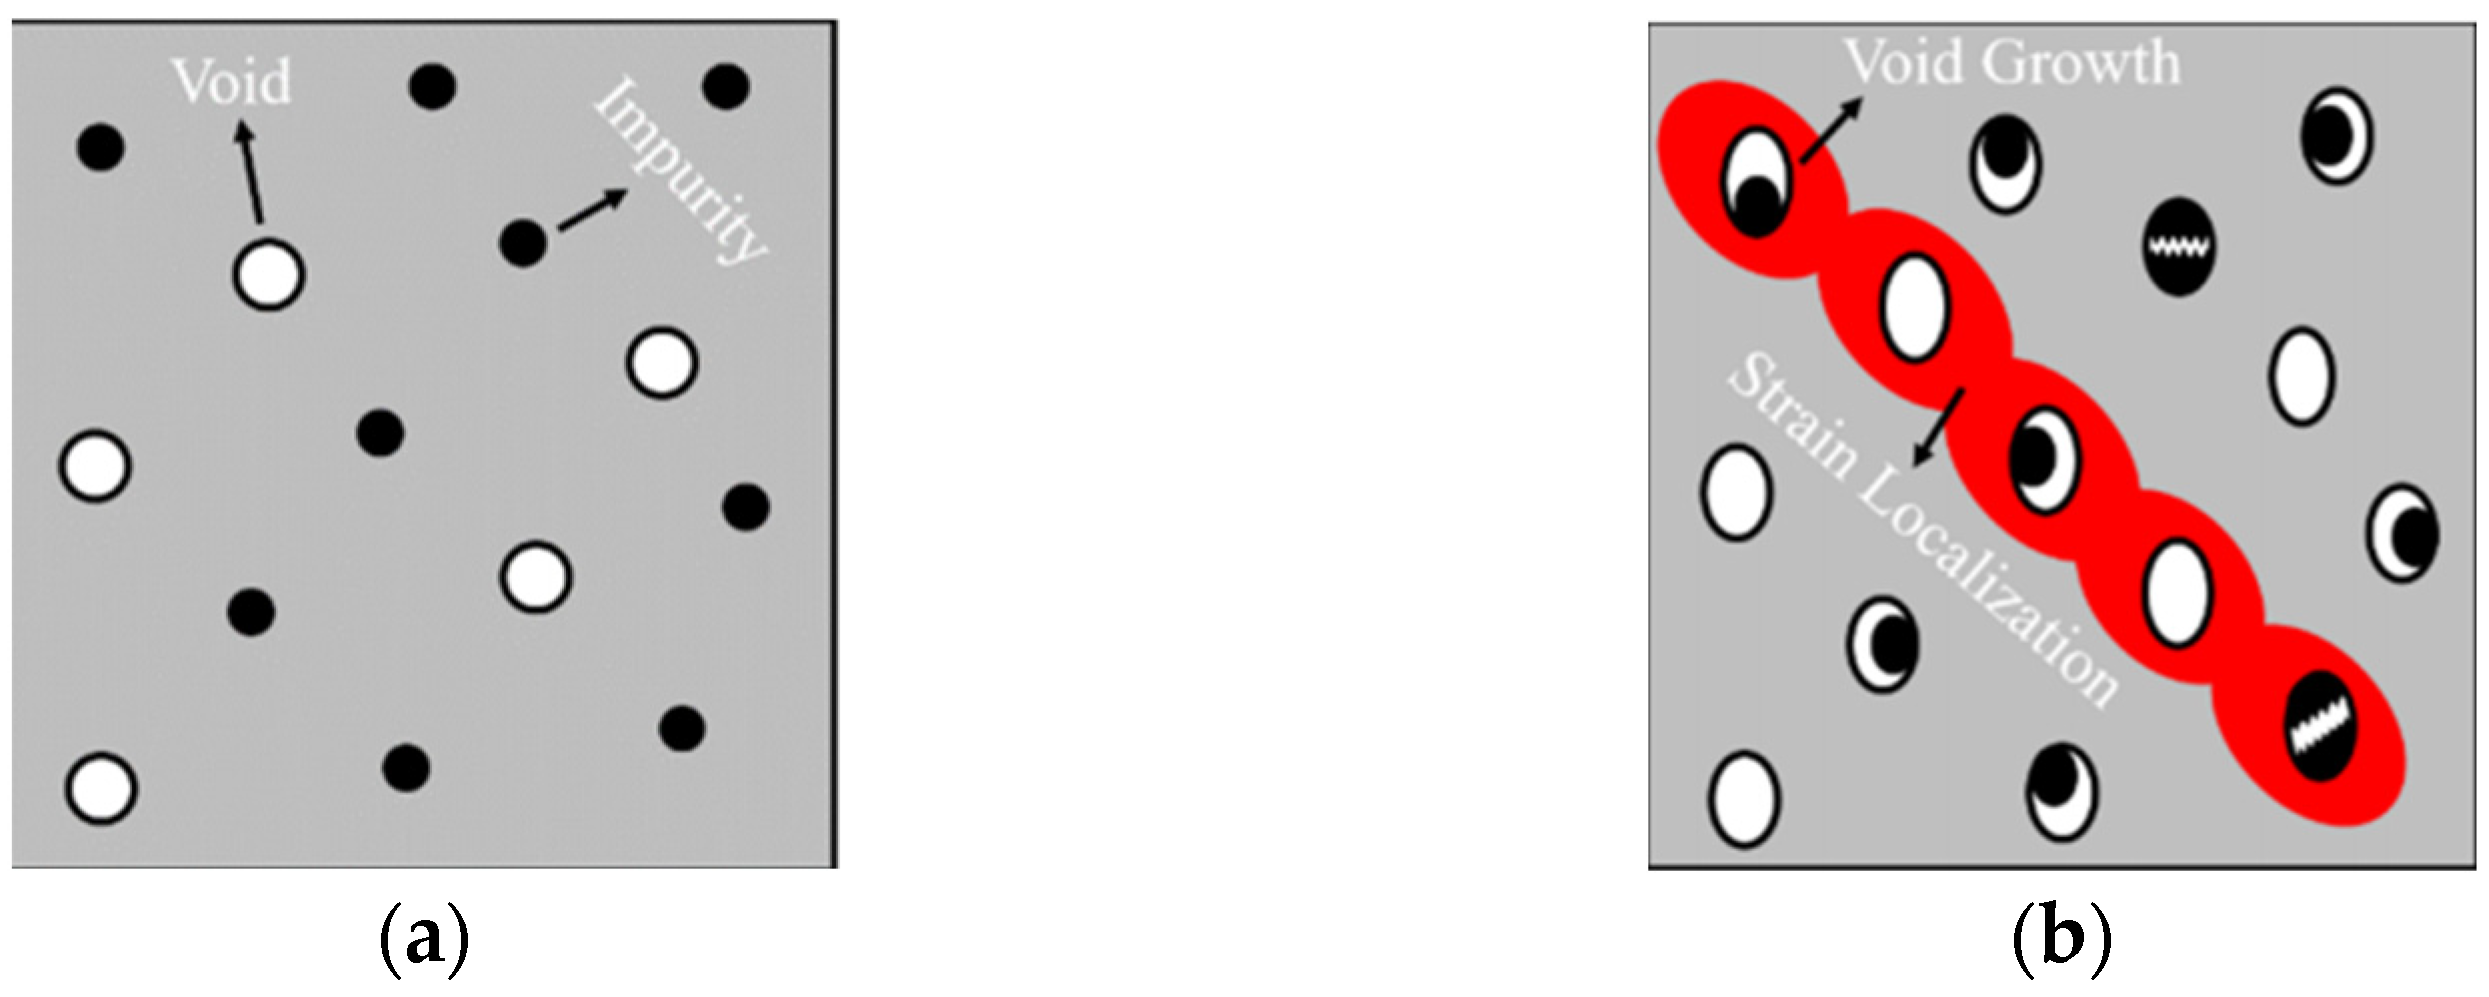
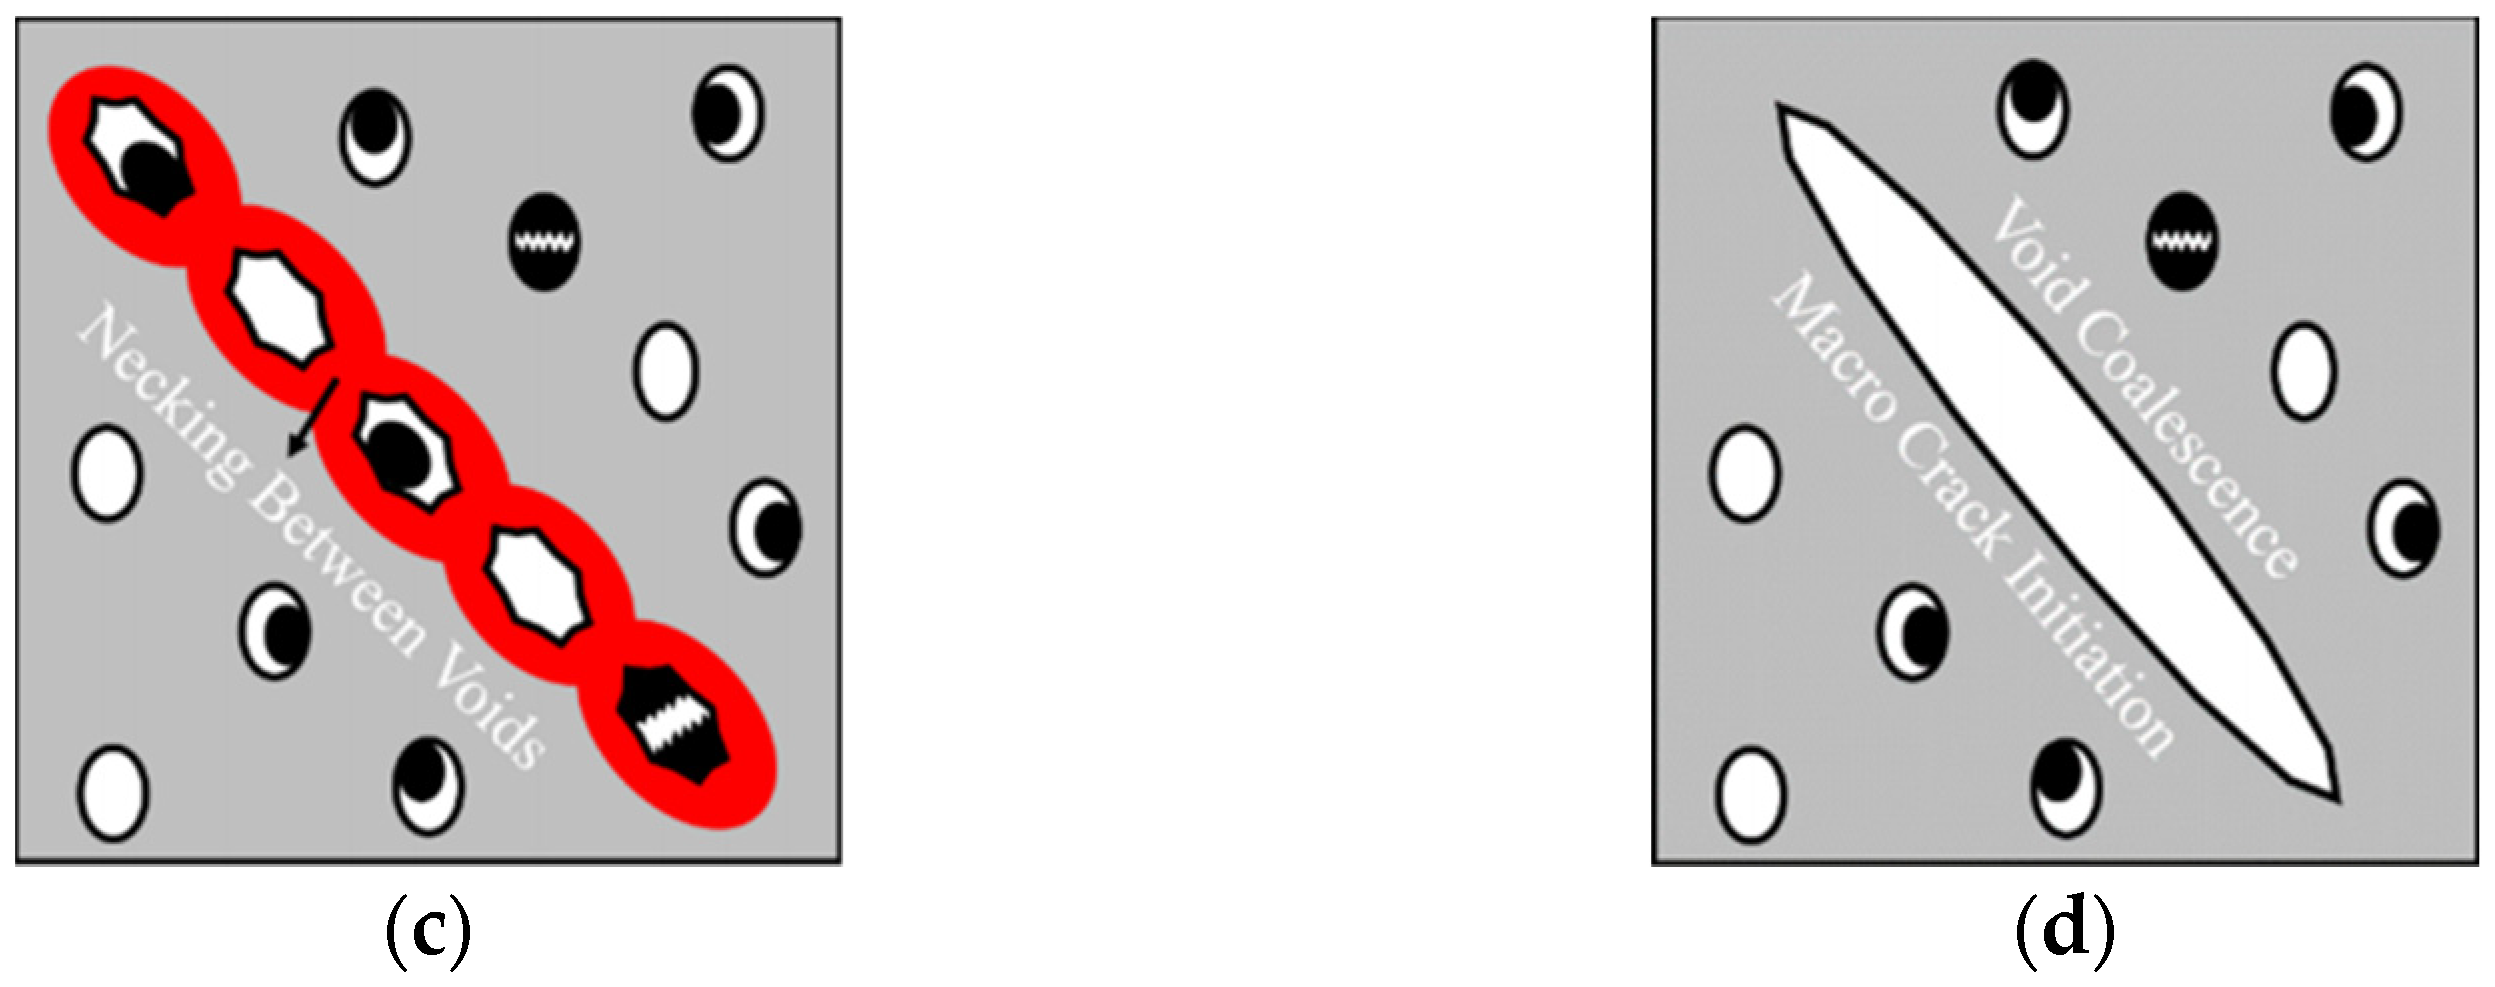
- VGM has the disadvantage of only describing void growth without providing a ductile fracture criterion. The cyclic void growth model (CVGM) extends the theory to cyclic loading and includes mechanisms such as void nucleation, void growth, void coalescence, and fracture. This is currently the recognized theory, and improvements have been made to the model to consider the effects of stress triaxiality and load parameters.
- (2)
- GNT shows higher prediction accuracy when void parameters are considered in the application process. However, the model has 10 unknown parameters, making parameter calibration difficult.
- (3)
- The models introduce damage as a criterion for material fracture, which is more in line with engineering reality. The degree of material damage can better reflect changes in fatigue life. The model has high prediction accuracy, and the accumulation process of damage can better reflect the internal fatigue condition of the material. However, multiple factors, such as stress state and load history, also need to be considered.
Author Contributions
Funding
Data Availability Statement
Acknowledgments
Conflicts of Interest
Nomenclature
| plastic strain range | |
| number of half cycles to fail | |
| k | material-dependent constants |
| C | material-dependent constants |
| the number of half cycles | |
| fatigue life in the th plastic strain range | |
| multiaxial plastic strain range | |
| T | stress triaxiality |
| , | and are determined by the parameter calibration |
| ( are the three principal components of the plastic strain tensor) | |
| fracture strain | |
| R | cavity radius |
| equivalent strain | |
| equivalent plastic strain increment | |
| the functions related to the triaxiality of stress define the material properties | |
| damage integral | |
| critical damage index | |
| characteristic length | |
| computational cell aspect ratio | |
| void aspect ratio | |
| initial void volume fraction | |
| micromechanical void growth indicator | |
| macroscopic stress triaxiality | |
| initial length of the computational cell | |
| initial radius of the computational cell | |
| initial semi axial length of void in r-direction | |
| initial semi axial length of void in z-direction | |
| macroscopic stress in direction | |
| macroscopic stress in direction | |
| initial void size | |
| effective stress | |
| actual yield stress of the matrix | |
| critical value of cumulative equivalent plastic strain | |
| critical void growth index | |
| critical value of cumulative equivalent plastic strain under cyclic loading | |
| critical value of cumulative equivalent plastic strain under monotonic loading | |
| void growth rate under monotonic loading | |
| elasticity modulus | |
| yield stress | |
| tensile stress | |
| toughness parameter | |
| damage degraded parameter of the material under cyclic loading | |
| material damage rate | |
| number of incremental steps | |
| damage index value calculated | |
| total damage | |
| , | the associated damage of IH and KH |
| the macroscopic strain | |
| It reflects the effect of the Lode parameter on the cyclic cavity growth index | |
| range of values of the Load parameter | |
| average stress triaxiality | |
| plastic fracture strain | |
| transient plastic strain | |
| damage rate of material | |
| loading history of stress triaxiality | |
| critical void radius | |
| actual yield stress of the matrix of the material | |
| stress deviator | |
| function of the void volume fraction | |
| critical value at which void coalescence occurs | |
| volume fraction of nucleated voids | |
| maximum volume fraction of microvoids | |
| , | the mean equivalent plastic strain and standard deviation at void nucleation, respectively |
| damage correction factor for interaction between adjacent microvoids | |
| plastic tensile strain | |
| damage state | |
| material degradation parameter for DSPS model | |
| initial diameter | |
| final diameter | |
| , | material constants |
| plastic strain tensor | |
| plastic strain threshold under uniaxial stress | |
| critical damage variable | |
| elastic modulus before damage | |
| elastic modulus after damage | |
| damage state | |
| , | material constants |
| Damage increment | |
| Parameter for damage evolution | |
| plastic displacement of the i-th loading half cycle | |
| initial yield displacement of the first loading half cycle | |
| incremental damage | |
| constant amplitude loads of deformation range | |
| incremental equivalent plastic strain energy | |
| accumulated effective equivalent plastic strain energy | |
| , | stress tensor and back stress tensor, respectively |
| material constant |
References
- Santagati, S.; Bolognini, D.; Nascimbene, R. Strain Life Analysis at Low-Cycle Fatigue on Concentrically Braced Steel Structures with RHS Shape Braces. J. Earthq. Eng. 2012, 16, 107–137. [Google Scholar] [CrossRef]
- Nip, K.H.; Gardner, L.; Davies, C.M.; Elghazouli, A.Y. Extremely low cycle fatigue tests on structural carbon steel and stainless steel. J. Constr. Steel Res. 2010, 66, 96–110. [Google Scholar] [CrossRef]
- Gong, S.; Sheng, G. Influence of the toughness of steel for earthquake-resistant buildings on the seismic performance of buildings. Earthq. Resist. Eng. 2004, 01, 41–47. [Google Scholar]
- Pereira, J.C.R.; de Jesus, A.M.P.; Xavier, J.; Correia, J.A.F.O.; Susmele, L.; Fernandesa, A.A. Low and ultra-low-cycle fatigue behavior of X52 piping steel based on theory of critical distances. Int. J. Fatigue 2020, 134, 105482–105489. [Google Scholar] [CrossRef]
- Luo, Y.; Wang, Q.; Fu, L.; Zhang, Y.; Tao, J.; Xie, W. Ultra-low Cycle Fatigue Performance of Q235 Steel Structural Material. J. Iron Steel Res. 2016, 28, 47–51. [Google Scholar]
- Pereira, J.C.R.; De Jesus, A.M.P.; Xavier, J.; Fernandes, A.A. Ultra low-cycle fatigue behaviour of a structural steel. Eng. Struct. 2014, 60, 214–222. [Google Scholar] [CrossRef]
- Jia, L.; Ge, H. Ultra-Low Cycle Fatigue Failure of Metal Structures under Strong Earthquakes; Tongji University Press: Shanghai, China, 2018; pp. 1–11. [Google Scholar]
- Tian, J.; Wang, X.; Li, H.; Wang, Z.; Pan, J. Ultra-low cycle fatigue performance of grid structure with bolted spherical joints. J. Constr. Steel Res. 2023, 201, 107728. [Google Scholar] [CrossRef]
- Li, S.; Lin, J.; Zhuge, H.; Xie, X.; Cheng, C. Ultra-low cycle fatigue fracture initiation life evaluation of thick-walled steel bridge piers with microscopic damage Index under bidirectional cyclic loading. Structures 2022, 43, 669–681. [Google Scholar] [CrossRef]
- Kermajani, M.; Malek Ghaini, F.; Miresmaeili, R.; Aghakouchak, A.A.; Shadmand, M. Effect of weld metal toughness on fracture behavior under ultra-low cycle fatigue loading (earthquake). Mater. Sci. Eng. A Struct. Mater. Prop. Microstruct. Process. 2016, 668, 30–37. [Google Scholar] [CrossRef]
- Lavogiez, C.; Dureau, C.; Nadot, Y.; Villechaise, P.; Hemery, S. Crack initiation mechanisms in Ti-6Al-4V subjected to cold dwell-fatigue, low-cycle fatigue and high-cycle fatigue loadings. Acta Mater. 2023, 244, 118–560. [Google Scholar] [CrossRef]
- Li, S.; Xie, X.; Cheng, C.; Tian, Q. A modified Coffin-Manson model for ultra-low cycle fatigue fracture of structural steels considering the effect of stress triaxiality. Eng. Fract. Mech. 2020, 237, 107–223. [Google Scholar] [CrossRef]
- Anderson, T.L. Fracture Mechanics: Fundamentals and Applications; CRC Press: Boca Raton, FL, USA, 1991. [Google Scholar]
- Huang, X.; Yuan, Y.; Zhao, J.; Wei, C. Comparative study on ultra-low-cycle-fatigue behavior of Q235 normal-steel and Q690 high-strength steel. J. Constr. Steel Res. 2022, 194, 107–308. [Google Scholar] [CrossRef]
- Manson, S.S. Fatigue: A complex subject—Some simple approximations. Exp. Mech. 1965, 5, 193–226. [Google Scholar] [CrossRef] [Green Version]
- Coffin, C., Jr. A Study of the Effects of Cyclic Thermal Stresses on a Ductile Metal. Trans. Am. Soc. Mech. Eng. 1954, 76, 931–950. [Google Scholar] [CrossRef]
- Miner, M.A. Cumulative damage in fatigue. J. Appl. Mech. 1945, 67, 159–164. [Google Scholar] [CrossRef]
- Kuwamura, H. Transition between Fatigue and Ductile Fracture in Steel. J. Struct. Eng. 1997, 123, 864–870. [Google Scholar] [CrossRef]
- Huang, X.; Zhang, X.; Miao, T. Damage prediction model for ultra-low cycle fatigue fracture failure of structural steel for buildings. Eng. Mech. 2017, 34, 101–108. [Google Scholar]
- Pereira, J.C.R.; De Jesus, A.M.P.; Fernandes, A.A. A new ultra-low cycle fatigue model applied to the X60 piping steel. Int. J. Fatigue 2016, 93, 201–213. [Google Scholar] [CrossRef]
- Xue, L. A unified expression for low cycle fatigue and extremely low cycle fatigue and its implication for monotonic loading. Int. J. Fatigue 2008, 30, 1691–1698. [Google Scholar] [CrossRef]
- Xue, L. Damage accumulation and fracture initiation in uncracked ductile solids subject to triaxial loading. Int. J. Solids Struct. 2007, 44, 5163–5181. [Google Scholar] [CrossRef] [Green Version]
- Pereira, J.C.R.; Wittenberghe, J.V.; Jesus, A.; Thibaux, P.; Fernandes, A.A. Ultra-Low-Cycle Fatigue Behavior of Full-Scale Straight Pipes Under Alternating Bending. In Proceedings of the ASME 2016 Pressure Vessels and Piping Conference, Vancouver, BC, Canada, 17–21 July 2016. [Google Scholar]
- Mortezagholi, M.H.; Zahrai, S.M. Evaluating ultra low cycle fatigue based on ductile fracture model in double core BRBs. Eng. Struct. 2020, 223, 111–158. [Google Scholar] [CrossRef]
- McClintock, F.A.; Kaplan, S.M.; Berg, C.A. Ductile fracture by hole growth in shear bands. Int. J. Fract. Mech. 1966, 2, 614–627. [Google Scholar] [CrossRef]
- McClintock, F.A. Erratum: “A Criterion for Ductile Fracture by the Growth of Holes” (Journal of Applied Mechanics 1968, 35, 363–371). J. Appl. Mech. 1968, 35, 617. [Google Scholar] [CrossRef] [Green Version]
- Rice, J.R.; Tracey, D.M. On the ductile enlargement of voids in triaxial stress fields*. J. Mech. Phys. Solids 1969, 17, 201–217. [Google Scholar] [CrossRef] [Green Version]
- Kiran, R.; Khandelwal, K. A micromechanical model for ductile fracture prediction in ASTM A992 steels. Eng. Fract. Mech. 2013, 102, 101–117. [Google Scholar] [CrossRef]
- Kiran, R.; Khandelwal, K. A micromechanical cyclic void growth model for ultra-low cycle fatigue. Int. J. Fatigue 2015, 70, 24–37. [Google Scholar] [CrossRef]
- Hancock, J.W.; Mackenzie, A.C. On the mechanisms of ductile failure in high-strength steels subjected to multi-axial stress-states. J. Mech. Phys. Solids 1976, 24, 147–160. [Google Scholar] [CrossRef]
- Kanvinde, A.M.; Deierlein, G.G. The Void Growth Model and the Stress Modified Critical Strain Model to Predict Ductile Fracture in Structural Steels. J. Struct. Eng. 2006, 132, 1907–1918. [Google Scholar] [CrossRef]
- Yin, F.; Yang, L.; Wang, M.; Zong, L.; Chang, X. Study on ultra-low cycle fatigue behavior of austenitic stainless steel. Thin-Walled Struct. 2019, 143, 106–205. [Google Scholar] [CrossRef]
- Myers, A.T.; Kanvinde, A.M.; Deierlein, G.G. Calibration of the SMCS Criterion for Ductile Fracture in Steels: Specimen Size Dependence and Parameter Assessment. J. Eng. Mech. 2010, 136, 1401–1410. [Google Scholar] [CrossRef]
- Yin, F.; Yang, L.; Zong, L.; Liu, X.; Wang, Y. Ultra-low Cycle Fatigue Fracture of High-Strength Steel Q460C and Its Weld. J. Mater. Civ. Eng. 2018, 30, 04018280.1–04018280.16. [Google Scholar] [CrossRef]
- Chang, X.; Yang, L.; Zong, L.; Zhao, M.H.; Yin, F. Study on cyclic constitutive model and ultra low cycle fracture prediction model of duplex stainless steel. J. Constr. Steel Res. 2019, 152, 105–116. [Google Scholar] [CrossRef]
- Luo, J.; Li, S.; Mao, L.; Shi, G. Constitutive model of duplex stainless steel S22053 and its weld under cyclic large plastic strain loading. J. Constr. Steel Res. 2023, 205, 107882. [Google Scholar] [CrossRef]
- Zhang, M.; Zheng, B.; Wang, J.; Wu, B.; Shu, G. Study on fracture properties of duplex stainless steel and its weld based on micromechanical models. J. Constr. Steel Res. 2022, 190, 107115. [Google Scholar] [CrossRef]
- Kanvinde, A.M.; Deierlein, G.G. Cyclic Void Growth Model to Assess Ductile Fracture Initiation in Structural Steels due to Ultra Low Cycle Fatigue. J. Eng. Mech. 2007, 133, 701–712. [Google Scholar] [CrossRef]
- Kanvinde, A.M.; Deierlein, G.G.; Kunnath, S.K. Validation of Cyclic Void Growth Model for Fracture Initiation in Blunt Notch and Dogbone Steel Specimens. J. Struct. Eng. 2008, 134, 1528–1537. [Google Scholar] [CrossRef]
- Myers, A.T.; Kanvinde, A.M.; Deierlein, G.G.; Baker, J.W. Probabilistic Formulation of the Cyclic Void Growth Model to Predict Ultra low Cycle Fatigue in Structural Steel. J. Eng. Mech. 2014, 75–100. [Google Scholar]
- Song, F.; Zhang, T.; Xie, X. Effect of Corroded Surface Morphology on Ultra-Low Cycle Fatigue of Steel Bridge Piers. Materials 2021, 14, 666. [Google Scholar] [CrossRef]
- Wang, Y.M. Influence of Welding Residual Stress on Ultra-Low Cycle Fatigue Properties of Beam-Column Joints in Steel Frame. Strength Mater. 2022, 54, 734–746. [Google Scholar] [CrossRef]
- Adasooriya, N.D.; Siriwardane, S.C.; Ohga, M. A simplified approach to predict the failure of steel members under interaction effect of fracture and fatigue. Int. J. Fatigue 2013, 47, 161–173. [Google Scholar] [CrossRef]
- Qiu, C.; Xing, J.; Zhang, L.; Wang, T. Ultra-Low Cycle Fatigue Characteristics of Q460 High Strength Steel and T-Shaped Butt Joints. J. Vib. Shock 2021, 40, 166–174. [Google Scholar]
- Kanvinde, A.M.; Deierlein, G.G. Micromechanical Simulation of Earthquake-Induced Fracture in Steel Structures. Ph.D. Thesis, Stanford University, Stanford, CA, USA, 2014. [Google Scholar]
- Liao, F.; Wang, W.; Chen, Y. Parameter calibrations and application of micromechanical fracture models of structural steels. Struct. Eng. Mech. 2012, 42, 153–174. [Google Scholar] [CrossRef]
- Yin, Y.; Li, S.; Han, Q.; Lei, P. Calibration and verification of cyclic void growth model for G20Mn5QT cast steel. Eng. Fract. Mech. 2019, 206, 310–329. [Google Scholar] [CrossRef]
- Nascimbene, R. Penalty partial reduced selective integration: A new method to solve locking phenomena in thin shell steel and concrete structures. Curved Layer. Struct. 2022, 9, 352–364. [Google Scholar] [CrossRef]
- Huang, X.; Wei, C.; Zhou, J.; Zhao, J.; Ge, J. Experimental and numerical study on ultra low cycle fatigue fracture of X steel tubular joints with CHS braces to SHS chord. Thin-Walled Struct. 2021, 162, 107564. [Google Scholar] [CrossRef]
- Li, S.; Xie, X.; Tian, Q.; Cheng, C.; Zhang, Z. Improved Ultra-Low Cycle Fatigue Fracture Models for Structural Steels Considering the Dependence of Cyclic Damage Degradation Parameters on Stress Triaxiality. Int. J. Steel Struct. 2021, 21, 329–348. [Google Scholar] [CrossRef]
- Li, S.; Xie, X.; Tian, Q.; Zhang, Z.; Cheng, C. A proposal on ultra-low cycle fatigue damage evaluation of structural steels. Theor. Appl. Fract. Mech. 2021, 114, 102973. [Google Scholar] [CrossRef]
- Gurson, A.L. Continuum Theory of Ductile Rupture by Void Nucleation and Growth: Part I—Yield Criteria and Flow Rules for Porous Ductile Media. J. Eng. Mater. Technol. 1977, 99, 2–15. [Google Scholar] [CrossRef]
- Rudnicki, J.W.; Rice, J.R. Conditions for the localization of deformation in pressure-sensitive dilatant materials. J. Mech. Phys. Solids 1975, 23, 371–394. [Google Scholar] [CrossRef]
- Yamamoto, H. Conditions for shear localization in the ductile fracture of void-containing materials. Int. J. Fract. 1978, 14, 347–365. [Google Scholar] [CrossRef] [Green Version]
- Tvergaard, V. Influence of voids on shear band instabilities under plane strain conditions. Int. J. Fract. 1981, 17, 389–407. [Google Scholar] [CrossRef]
- Tvergaard, V. On localization in ductile materials containing spherical voids. Int. J. Fract. 1982, 18, 237–252. [Google Scholar] [CrossRef]
- Tvergaard, V. Material failure by void coalescence in localized shear bands. Int. J. Solids Struct. 1982, 18, 659–672. [Google Scholar] [CrossRef]
- Tvergaard, V.; Needlemanand, A. Analysis of the cup-cone fracture in a round tensile bar. Acta Metall. 1984, 32, 157–169. [Google Scholar] [CrossRef]
- Rakin, M.; Cvijovic, Z.; Grabulov, V.; Putic, S.; Sedmak, A. Prediction of ductile fracture initiation using micromechanical analysis. Eng. Fract. Mech. 2004, 71, 813–827. [Google Scholar] [CrossRef]
- Mear, M.E.; Hutchinson, J.W. Influence of yield surface curvature on flow localization in dilatant plasticity. Mech. Mater. 1985, 4, 395–407. [Google Scholar] [CrossRef]
- Steglich, D.; Pirondi, A.; Bonora, N.; Brocks, W. Micromechanical modelling of cyclic plasticity incorporating damage. Int. J. Solids Struct. 2005, 42, 337–351. [Google Scholar] [CrossRef]
- Huang, X.; Tong, L.; Zhou, F.; Chen, Y. Prediction of fracture behavior of beam-to-column welded joints using micromechanics damage model. J. Constr. Steel Res. 2013, 85, 60–72. [Google Scholar] [CrossRef]
- Wang, J.; Zhuo, Z. Evaluation of fracture performance of Q690 steel and its welded joints based on GTN damage model. Chin. J. Ship Res. 2022, 17, 142–147. [Google Scholar]
- Oh, Y.; Nam, H.; Kim, Y.; Miura, N. Application of the GTN model to ductile crack growth simulation in through-wall cracked pipes. Int. J. Press. Vessel. Pip. 2018, 159, 35–44. [Google Scholar] [CrossRef]
- Li, X.; Chen, Z.; Dong, C. Size effect on the damage evolution of a modified GTN model under high/low stress triaxiality in meso-scaled plastic deformation. Mater. Today Commun. 2021, 26, 101782. [Google Scholar] [CrossRef]
- Qiang, B.; Wang, X. Ductile crack growth behaviors at different locations of a weld joint for an X80 pipeline steel: A numerical investigation using GTN models. Eng. Fract. Mech. 2019, 213, 264–279. [Google Scholar] [CrossRef]
- Ishida, T. Acoustic emission monitoring of hydraulic fracturing in laboratory and field. Constr. Build. Mater. 2001, 15, 283–295. [Google Scholar] [CrossRef]
- Yu, M.; Xie, X.; Li, S. A Simplified Ductile Fracture Model for Predicting Ultra-Low Cycle Fatigue of Structural Steels. Materials 2022, 15, 1663. [Google Scholar] [CrossRef]
- Nkoumbou Kaptchouang, N.B.; Monerie, Y.; Perales, F.; Vincent, P. Cohesive GTN model for ductile fracture simulation. Eng. Fract. Mech. 2021, 242, 107437. [Google Scholar] [CrossRef]
- Liao, F.; Tang, S.; Tu, L. Parameter Calibration of GTN Model for Q460D High Strength Steel and Corresponding ER55-G Welding Material. J. Xi’an Univ. Archit. Technol. 2019, 51, 695–703. [Google Scholar]
- Jia, L.; Ge, H. Ductile Crack Initiation of Structural Steel under Monotonic Loading. In Ultra-low-Cycle Fatigue Failure of Metal Structures under Strong Earthquakes; Springer: Singapore, 2018; pp. 53–69. [Google Scholar]
- Chaboche, J.L. Anisotropic creep damage in the framework of continuum damage mechanics. Nucl. Eng. Des. 1984, 79, 309–319. [Google Scholar] [CrossRef] [Green Version]
- Lemaitre, J. A Continuous Damage Mechanics Model for Ductile Fracture. J. Eng. Mater. Technol. 1985, 107, 83–89. [Google Scholar] [CrossRef]
- Lubliner, J.; Oliver, J.; Oller, S.; Onate, E. A plastic-damage model for concrete. Int. J. Solids Struct. 1989, 25, 299–326. [Google Scholar] [CrossRef]
- Martinez, X.; Oller, S.; Barbu, L.G.; Barbat, A.H.; De Jesus, A.M.P. Analysis of Ultra Low Cycle Fatigue problems with the Barcelona plastic damage model and a new isotropic hardening law. Int. J. Fatigue 2015, 73, 132–142. [Google Scholar] [CrossRef] [Green Version]
- Li, S.; Xie, X.; Liao, Y. Improvement of Cyclic Void Growth Model for Ultra-Low Cycle Fatigue Prediction of Steel Bridge Piers. Materials 2019, 12, 1615. [Google Scholar] [CrossRef] [PubMed] [Green Version]
- Xiang, P.; Qing, Z.; Jia, L.; Wu, M.; Xie, J. Damage evaluation and ultra-low-cycle fatigue analysis of high-rise steel frame with mesoscopic fracture models. Soil Dyn. Earthq. Eng. 2020, 139, 106283. [Google Scholar] [CrossRef]
- Tian, Q.; Zhuge, H.; Xie, X. Prediction of the Ultra-Low-Cycle Fatigue Damage of Q345qC Steel and its Weld Joint. Materials 2019, 12, 4014. [Google Scholar] [CrossRef] [PubMed] [Green Version]
- Bonora, N. A nonlinear CDM model for ductile failure. Eng. Fract. Mech. 1997, 58, 11–28. [Google Scholar] [CrossRef]
- Tian, Q.; Liao, Y.; Xie, X.; Zhuge, H. Study on the Prediction Method of the Ultra-Low-Cycle Fatigue Damage of Steel. Appl. Sci. 2020, 10, 679. [Google Scholar] [CrossRef] [Green Version]
- Liao, F.; Wang, W.; Chen, Y. Prediction of Ultra-Low Cycle Fatigue Fracture of Steel Structure Joints under Reversed Loading. J. Tongji Univ. (Nat. Sci. Ed.) 2014, 42, 539–546, 617. [Google Scholar]
- Smith, C.M.; Deierlein, G.; Kanvinde, A.M. A Stress-Weighted Damage Model for Ductile Fracture Initiation in Structural Steel under Cyclic Loading and Generalized Stress States; ProQuest Dissertations Publishing, John A. Blume Earthquake Engineering Technical Report 187; Stanford Digital Repository: Standford, CA, USA, 2014. [Google Scholar]
- Smith, C.; Ziccarelli, A.; Terashima, M.; Kanvinde, A.; Deierlein, G. A stress-weighted ductile fracture model for steel subjected to Ultra Low Cycle Fatigue. Eng. Struct. 2021, 245, 112964. [Google Scholar] [CrossRef]
- Zhu, Y.; Fell, B.; Kanvinde, A. Continuum damage mechanics based ductile fatigue-fracture prediction in buckling steel braces. J. Constr. Steel Res. 2021, 184, 106812. [Google Scholar] [CrossRef]
- Di, Y.; Novokshanov, D.; Münstermann, S. Safety assessment of steels under ULCF loading conditions with damage mechanics model. Procedia Struct. Integr. 2016, 2, 632–639. [Google Scholar] [CrossRef] [Green Version]
- Liu, Y.; Jia, L.; Ge, H.; Kato, T.; Ikai, T. Ductile-fatigue transition fracture mode of welded T-joints under quasi-static cyclic large plastic strain loading. Eng. Fract. Mech. 2017, 176, 38–60. [Google Scholar] [CrossRef]
- Xie, X.; Cheng, C.; Li, S. A Deformation History-Based Approach for Ultra-Low Cycle Fatigue Damage Evaluation of Steel Structures. Int. J. Steel Struct. 2020, 20, 1378–1392. [Google Scholar] [CrossRef]
- Wang, T.; Wen, J.; Liao, P.; Zhang, X.; Kim, Y.; Tu, S. A study of ultra-low cycle fatigue failure based on a fracture strain energy model. Int. J. Fatigue 2021, 146, 106149. [Google Scholar] [CrossRef]


| Steel | Gpa | (MPa) | (MPa) | Z/% | A/% | Mean (mm) | Upper (mm) | ||||
|---|---|---|---|---|---|---|---|---|---|---|---|
| S220503 | 226 | 531.81 | 754.72 | 1.42 | 67.19 | 43.29 | 2.93 | 0.33 | 0.01 | 0.136 | 0.214 |
| Steel | GPa | MPa | MPa | Z/% | A/% | Lower (mm) | Mean (mm) | Upper (mm) | |||
|---|---|---|---|---|---|---|---|---|---|---|---|
| S30408 | 249 | 273.85 | 710.38 | 2.59 | 76.02 | 62.35 | 3.314 | 0.29 | 0.01 | 0.220 | 0.780 |
| Steel | (GPa) | (MPa) | Lower (mm) | Mean (mm) | Upper (mm) | ||||||
|---|---|---|---|---|---|---|---|---|---|---|---|
| G20Mn5QT | 214 | 427 | 582 | 1.36 | 1.05 | 0.99 | 0.49 | 0.41 | - | 0.202 | - |
| No. | Name | Material | Loading Protocol | Reference |
|---|---|---|---|---|
| 1 | Coffin-Manson model | Aluminum alloy 7075-T6 | C-PTF CTF | [15,16] |
| 2 | XUE Model | 2024-T351 aluminum alloy | CTF | [21,22] |
| 3 | VGM | SS400 steel (BRB) | Monotonic loading | [24] |
| 4 | MM-VGM | ASTM A992 Steel | Monotonic loading | [28] |
| 5 | SMCS | Three rolled, low alloy, quenched, and tempered sheets of steel | Monotonic loading | [30] |
| 6 | CVGM | AS72-Grade 50 A572-Grade 50 AS14-Grade 110 HPS70W JIS-SN490B Grade 50 JIS-SM490YBTMC-5L Grade 50 JIS-SN490B Grade 50 | C-PTF CTF | [38,39,40] |
| 7 | DSPS | AS72-Grade 50 A572-Grade 50 AS14-Grade 110 HPS70W JIS-SN490B Grade 50 JIS-SM490YBTMC-5L Grade 50 JIS-SN490B Grade 50 | C-PTF CTF | [45] |
| 8 | MM-CVGM | ASTM A992 steel | CTF | [29] |
| 9 | L-CVGM | X steel tubular joints | CTF | [49] |
| 10 | ICVGM | Q345qC | C-PTF CTF | [50] |
| b | C1/MPa | b1 | C2/MPa | b2 | q1 | q2 | ||||||||
|---|---|---|---|---|---|---|---|---|---|---|---|---|---|---|
| 346 | 150 | 8 | 7000 | 80 | 660 | 0.8 | 0.0050 | 0.25 | 0.28 | 0.04 | 0.3 | 0.1 | 1.5 | 0.71 |
| 402 | 300 | 0.0100 | ||||||||||||
| 366 | 110 | 0.0085 |
| Locations | q1 | q2 | q3 | N | ||||||
|---|---|---|---|---|---|---|---|---|---|---|
| WM | 1.5 | 1 | 2.25 | 0.3 | 0.1 | 0.001 | 0.2 | 0.2 | 1.54 × 10⁴ | 0.06 |
| CGHAZ | 1.5 | 1 | 2.25 | 0.3 | 0.1 | 0.0006 | 0.2 | 0.2 | 4.77 × 10⁵ | 0.11 |
| FGHAZ | 1.5 | 1 | 2.25 | 0.3 | 0.1 | 0.002 | 0.2 | 0.2 | 4.77 × 10⁵ | 0.10 |
| ICHAZ | 1.5 | 1 | 2.25 | 0.3 | 0.1 | 0.0025 | 0.2 | 0.2 | 4.77 × 10⁵ | 0.09 |
| BM | 1.5 | 1 | 2.25 | 0.3 | 0.1 | 0.00025 | 0.2 | 0.2 | 4.77 × 10⁵ | 0.06 |
| No. | Name | Material/Application | Loading Protocol | Reference |
|---|---|---|---|---|
| 1 | Barcelona Plastic Damage Model | Concrete | Monotonic loading | [74] |
| 2 | Improve Barcelona Plastic Damage Model | X52 steel | ULCF loading | [75] |
| 3 | CDM | Q345qC | ULCF loading | [78] |
| 4 | Liu Model | welded T-joints | CTF | [86] |
| 5 | CMFSE | Mn-Si steel | C-PTF CTF | [88] |
| 6 | CLCDM | Q235 & Q690 | Monotonic loading ULCF loading | [13] |
Disclaimer/Publisher’s Note: The statements, opinions and data contained in all publications are solely those of the individual author(s) and contributor(s) and not of MDPI and/or the editor(s). MDPI and/or the editor(s) disclaim responsibility for any injury to people or property resulting from any ideas, methods, instructions or products referred to in the content. |
© 2023 by the authors. Licensee MDPI, Basel, Switzerland. This article is an open access article distributed under the terms and conditions of the Creative Commons Attribution (CC BY) license (https://creativecommons.org/licenses/by/4.0/).
Share and Cite
Xu, Y.; Li, X.; Zhang, Y.; Yang, J. Ultra-Low Cycle Fatigue Life Prediction Model—A Review. Metals 2023, 13, 1142. https://doi.org/10.3390/met13061142
Xu Y, Li X, Zhang Y, Yang J. Ultra-Low Cycle Fatigue Life Prediction Model—A Review. Metals. 2023; 13(6):1142. https://doi.org/10.3390/met13061142
Chicago/Turabian StyleXu, Yali, Xin Li, Yanjuan Zhang, and Jianwei Yang. 2023. "Ultra-Low Cycle Fatigue Life Prediction Model—A Review" Metals 13, no. 6: 1142. https://doi.org/10.3390/met13061142