Article

Notch-Stress S–N Curves for Welded Aluminum-Alloy Components Subjected to Bending

1
Faculty of Sciences, University of Split, R. Boškovića 33, 21000 Split, Croatia
2
Faculty of Maritime Studies, University of Split, R. Boškovića 37, 21000 Split, Croatia
*
Author to whom correspondence should be addressed.
Metals 2023, 13(6), 1133; https://doi.org/10.3390/met13061133
Submission received: 19 May 2023 / Revised: 10 June 2023 / Accepted: 14 June 2023 / Published: 16 June 2023

Abstract

:
Fatigue analysis of aluminum-alloy welded joints based on the linear elastic notch-stress approach is presented in this paper. The International Institute of Welding proposes two variants of the approach, one for thick joints, i.e., joints with a plate thickness of 5 mm or more, with a reference radius rref = 1 mm, using the FAT71 notch-stress design curve, and one for thin joints, i.e., joints with a plate thickness of less than 5 mm, with a reference radius rref = 0.05 mm, using the FAT180 notch-stress design curve. In this work, the feasibility of the proposed S–N curves, obtained mainly by fatigue tests on axially loaded joints, was investigated for 4 mm thick joints subjected to bending. The fatigue analysis was performed for two types of joints: a joint with longitudinal fillet-welded attachment and a joint with round sheet fillet-welded attachment. It was shown that a more accurate estimation of the fatigue life of 4 mm thick aluminum joints loaded in bending can be obtained using the FAT71 notch-stress design curve.

1. Introduction

The rules and guidelines [1,2,3,4,5,6] for the fatigue design of aluminum-alloy weldments are generally based on an S–N curve approach, where the design stress is equal to the nominal stress range. However, this approach does not account for stress increases due to local weld geometries or local geometry changes. Thus, all structural discontinuities and weld geometry influences are implicitly included in the fatigue strength S–N curve. The formal simplicity of the nominal stress range approach is subjected to the condition that the fatigue-stressed component and the associated specimen coincide with respect to all significant influencing parameters. This coincidence is the exception rather than the rule. Alternatively, a design principle based on either the structural stress approach or the notch-stress approach can be used in fatigue analysis [3,4,5,6,7,8,9]. Madox [10] reviews the methods used in the relevant codes and standards for fatigue assessment of welded aluminum-alloy structures, focusing on nominal stress and structural stress approaches. Zamzami et al. [11] investigated the accuracy and reliability of various stress methods, including nominal stresses, hot-spot stresses, and notch stresses, in estimating the fatigue life of aluminum welded joints. This comparative assessment was based on a large number of experimental data gathered from the literature, as well as from tests of various aluminum welded structural details under cyclic axial loading or cyclic bending. The results obtained show that the effective notch-stress method provides a more accurate estimation of fatigue life compared to other methods. Corigliano et al. [12] presented the state of the art in standards and approaches for predicting the fatigue life of welded joints in the marine industry. The article reviews various approaches to provide insight into their advantages and limitations.
The most important parameter required for the S–N curve approach with nominal stress, structural stress, or notch-stress range is the stress distribution near the fatigue regions. The stress distribution near the weld toe is shown schematically in Figure 1.
The notch stress, σk, is the stress in the component considering the stress-increasing effects of structural geometry and weld geometry, and assuming linear elastic material behavior. The stress increase can be represented by the notch-stress concentration factor Kt, which is calculated as the ratio of notch stress to nominal stress. To calculate the notch-stress concentration factor, the International Institute of Welding (IIW) recommendations prescribe either a direct analysis of the weld geometry, based on finite element or boundary element methods, or the use of parametric formulae [2]. Parametric formulae have been published for standard welded joints such as butt joints, T-joints, and cruciform joints (load-carrying and non-load-carrying) [13,14,15,16,17]. In finite element analysis of aluminum-alloy welded joints, notch stress is determined by modelling the sharp notches of the actual weld contour with reference radii of rref = 1 mm (thicknesses t ≥ 5 mm) or rref = 0.05 mm (thicknesses t < 5 mm), as a function of plate thickness [18,19,20,21,22]. In this way, stress singularities at the notch root are avoided. According to Baumgartner et al. [23], there are three reference radii for weld toe failure, rref = 1 mm (t ≥ 5 mm), rref = 0.3 mm (1.5 mm ≤ t ≤ 10 mm), or rref = 0.05 mm (t < 5 mm), which should be selected as a function of the plate thickness.
According to Sonsino [24], the equivalent local stresses can be determined either by the principal stress hypothesis or by the von Mises hypothesis, so an appropriate design curve must be selected. For the fatigue assessment of welded aluminum-alloy structures, the IIW design recommendations suggest the use of two notch-stress design curves: FAT71 and FAT180, for thick and thin welded joints [18]. These FAT classes are based on the maximum principal stress occurring in the notch itself. Baumgartner et al. [23] have recommended FAT71 and FAT160 for weld toe failures with a notch opening angle between 90° and 150°, depending on the reference radius used for modelling (rref = 1 mm or rref = 0.05 mm). Design S–N curves are applied to all aluminum alloys, regardless of their different mechanical properties [2]. FAT classes represent characteristic fatigue strength values, defined in terms of stress ranges, corresponding to a certain survival probability. The fatigue strength value refers to the as-welded condition, including the effect of high-tensile residual stresses. FAT classes can be applied to complex welded structures where the fabrication process or assembly constraints may result in high residual stresses in the region susceptible to fatigue crack initiation and propagation.
Various methods for relieving residual stresses in welds can be found in the literature. These methods can be divided into those performed before welding, during the welding process itself, or after welding. Post-weld improvement methods have the potential to increase fatigue strength, mainly by improving the weld profile, residual stress conditions or environmental conditions of the welded joint [2]. Several methods are available to improve the residual stress states after the welding process, such as hammer peening, needle peening, shot peening, brush peening, ultrasonic treatment, overstressing (proof testing), and stress relief. Recent studies have also described additional methods [25,26,27,28] for improving residual stress conditions.
Special attention is required for structures that are stress-relieved or known to have low residual stresses. Depending on the load mean stress, which is indicated by the stress ratio R, the applied fatigue loads can be increased by applying a bonus factor to the fatigue strength of the joint in the as-welded condition [29]:
  • 1.6, for R ≤ −1 or when the applied load is entirely compressive,
  • 1.2 – 0.4 · R, for −1 ≤ R ≤ 0.5.
For small or thin-walled components without assembly constraints, the applied fatigue loads can be increased by a factor of:
  • 1.3, for R ≤ −1 or when the applied load is entirely compressive,
  • 0.9 – 0.4 · R, for −1 ≤ R ≤ 0.5.
In the construction of small and medium-sized ships made of aluminum alloys, plates with a thickness of up to 5 mm are often used for both the hull and the structural elements [30]. To optimize material consumption, it is desirable to calculate all parts of the ship’s structure as accurately as possible. Because the distribution of buoyancy along the length of the ship is different from the distribution of weights, and because of differences in water pressure on either side of the ship, certain sections of the ship are loaded primarily for bending. The design curves FAT71 and FAT180 have been determined largely on the basis of fatigue tests on axially loaded welded joints. Pedersen et al. [31] found that steel T-joint specimens tested for bending show better results than suggested by the FAT225 design curve (rref = 1 mm). This deviation is explained by the positive effect of the steep stress gradient and the small-to-non-existent negative effect of misalignment, in the case of bending loads. The exact value of the deviation is not given.
In this paper, the applicability of the proposed S–N curves is investigated for joints made of 4 mm thick plates subjected to bending. The results of fatigue tests on components with a longitudinal fillet-welded attachment (60 components) and components with round sheet fillet-welded attachment (50 components) subjected to bending were evaluated using a notch-stress approach with reference radii of 1 mm and 0.05 mm. The fatigue analysis results are compared with corresponding design S–N curves.

2. Materials and Methods

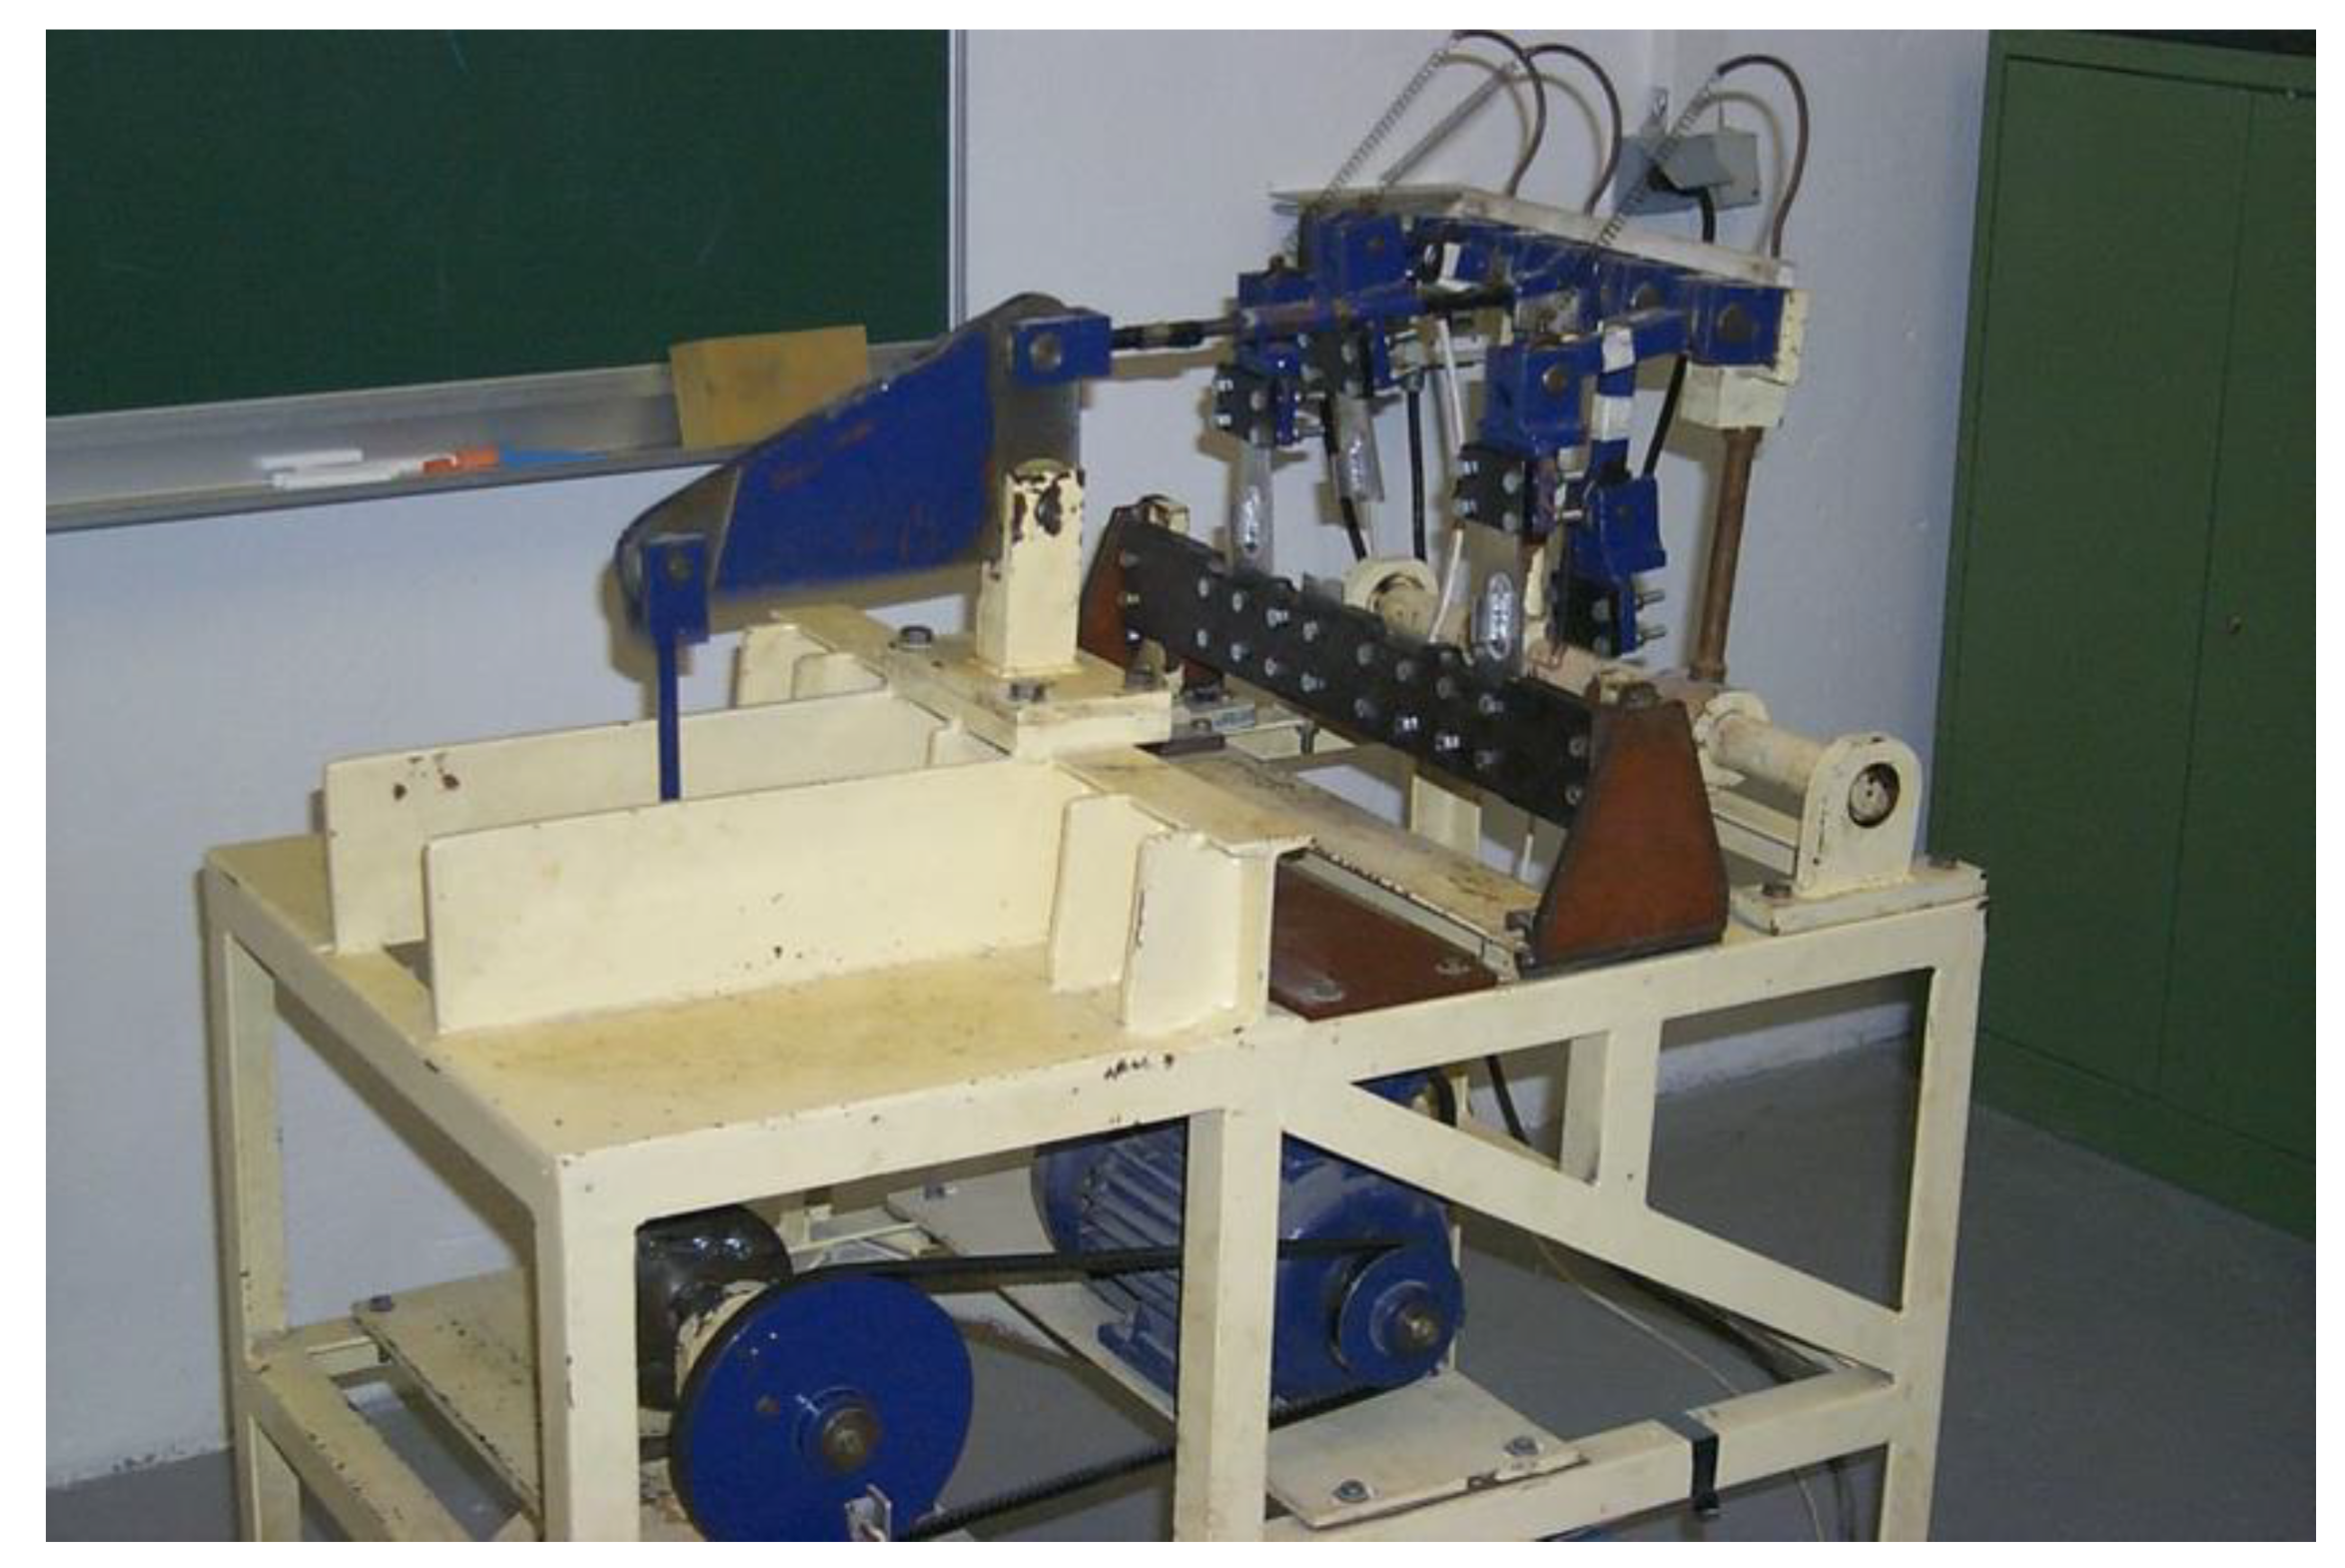
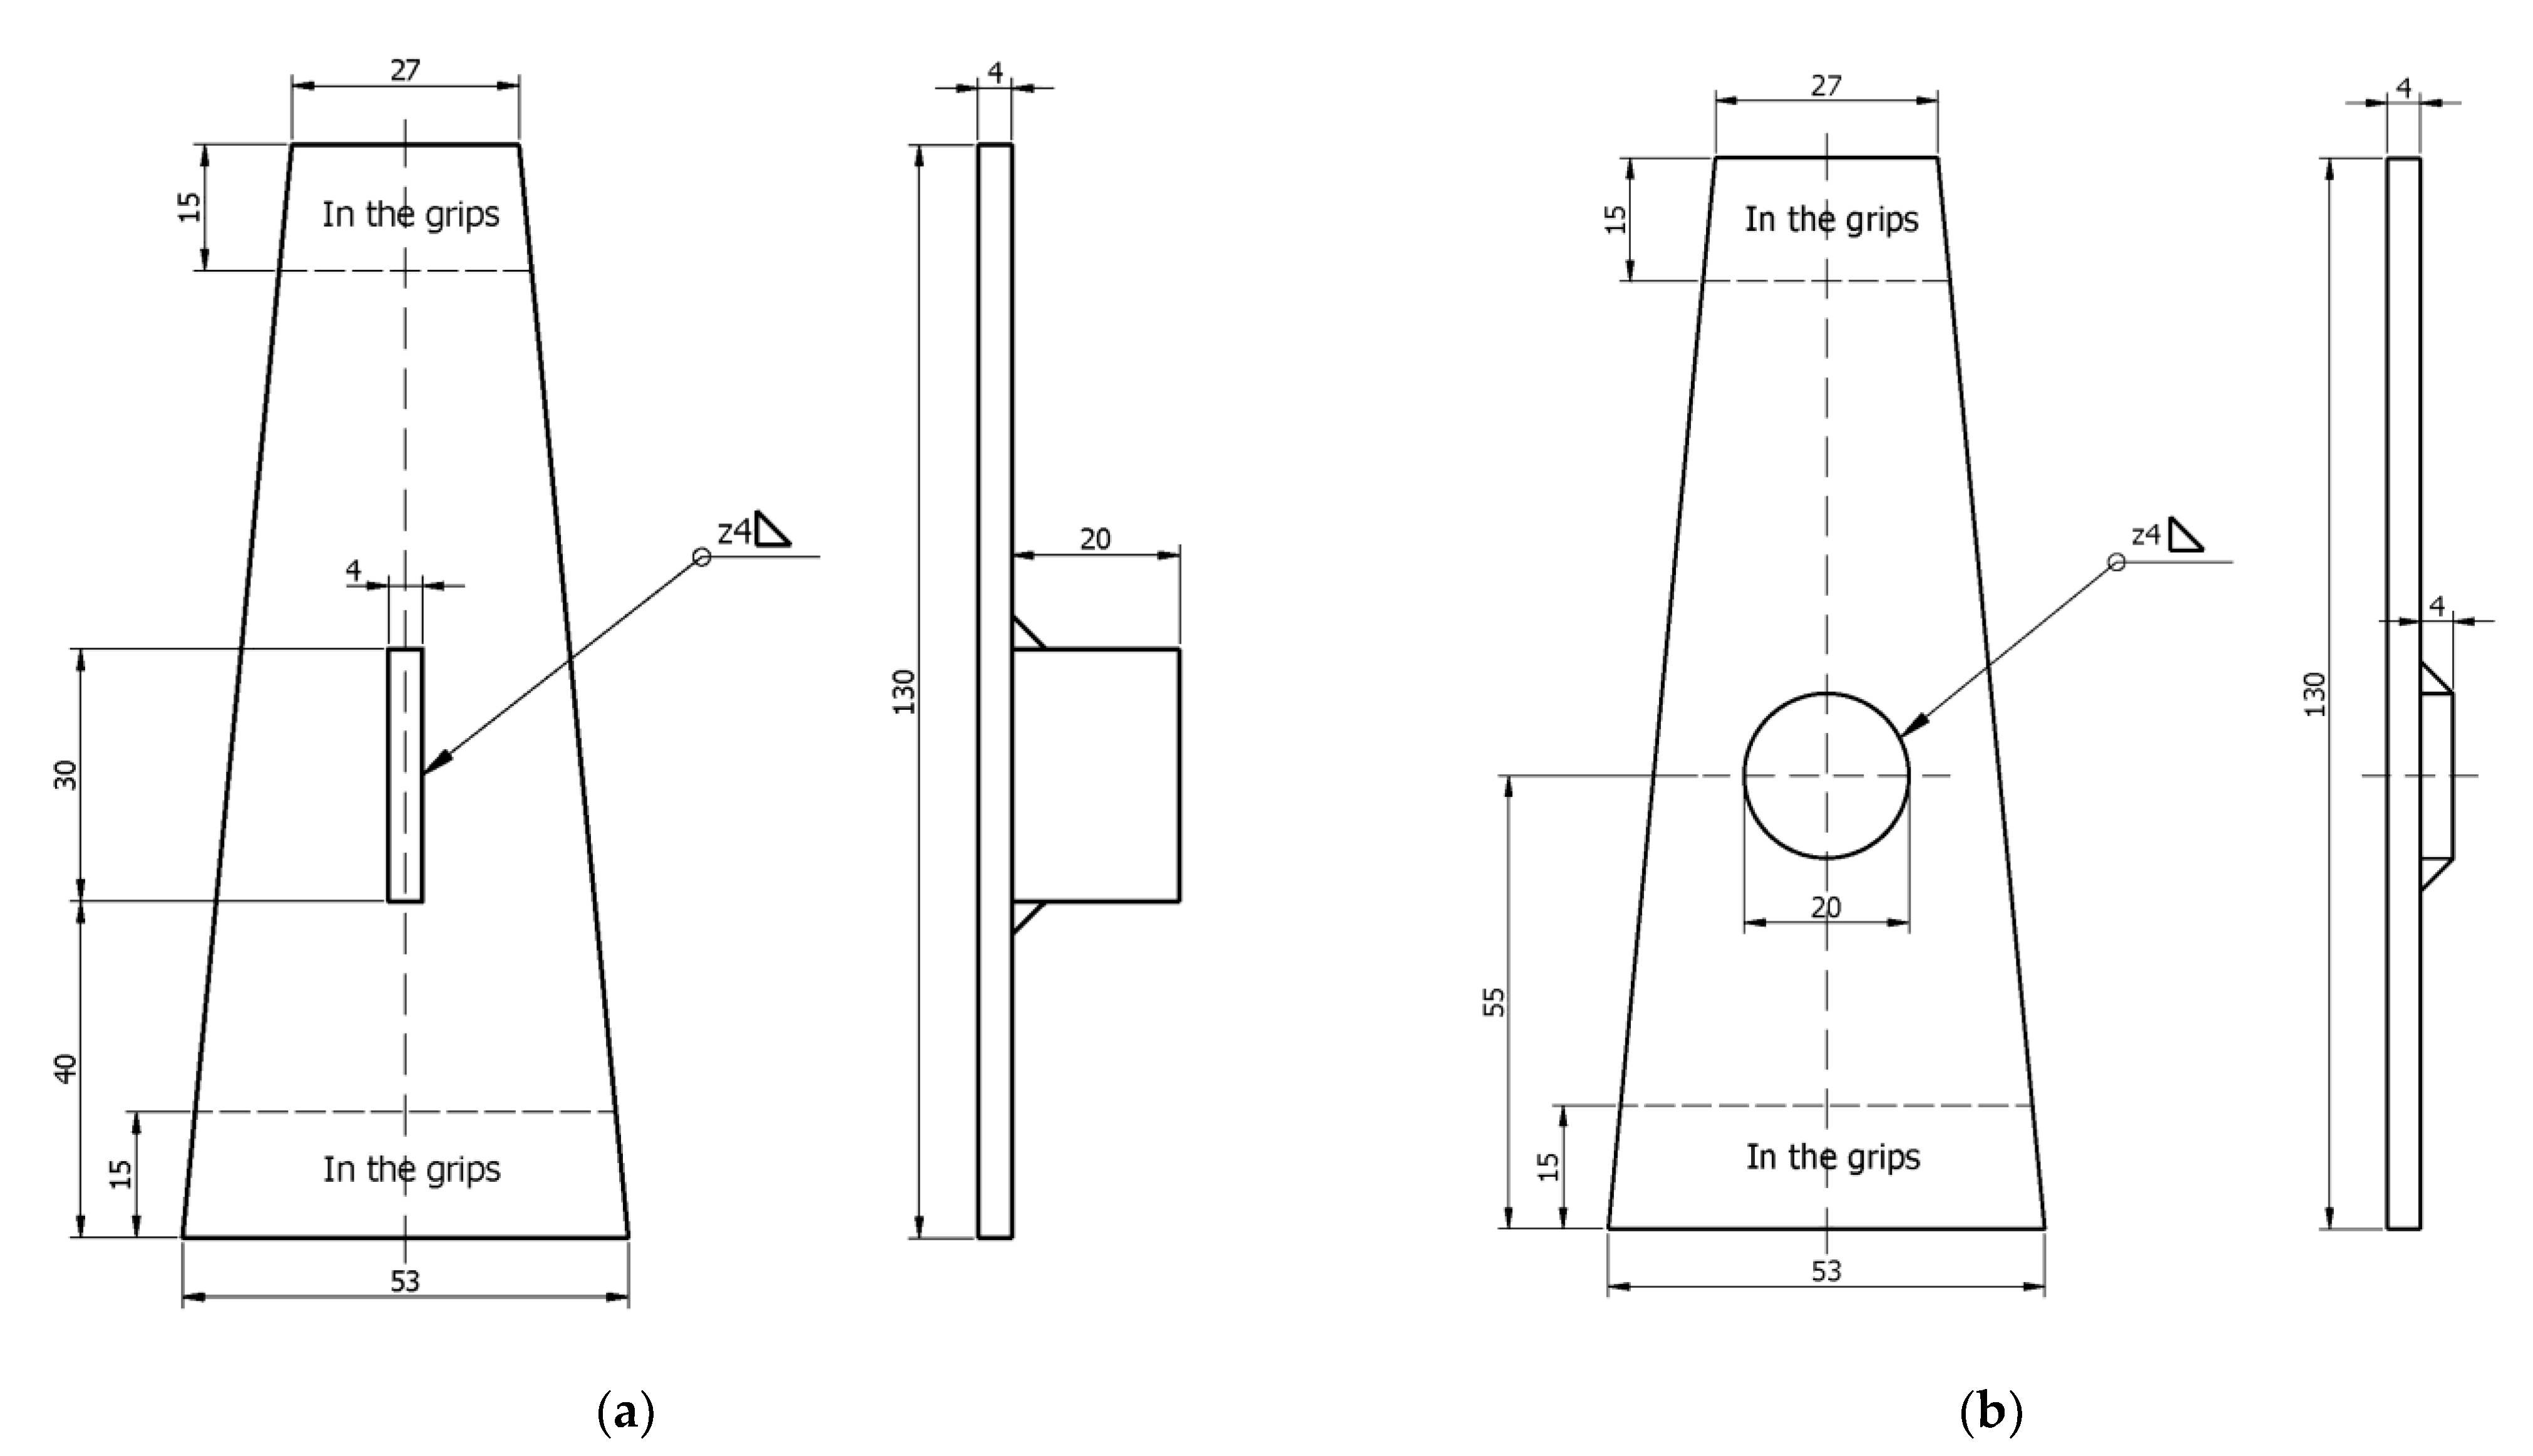
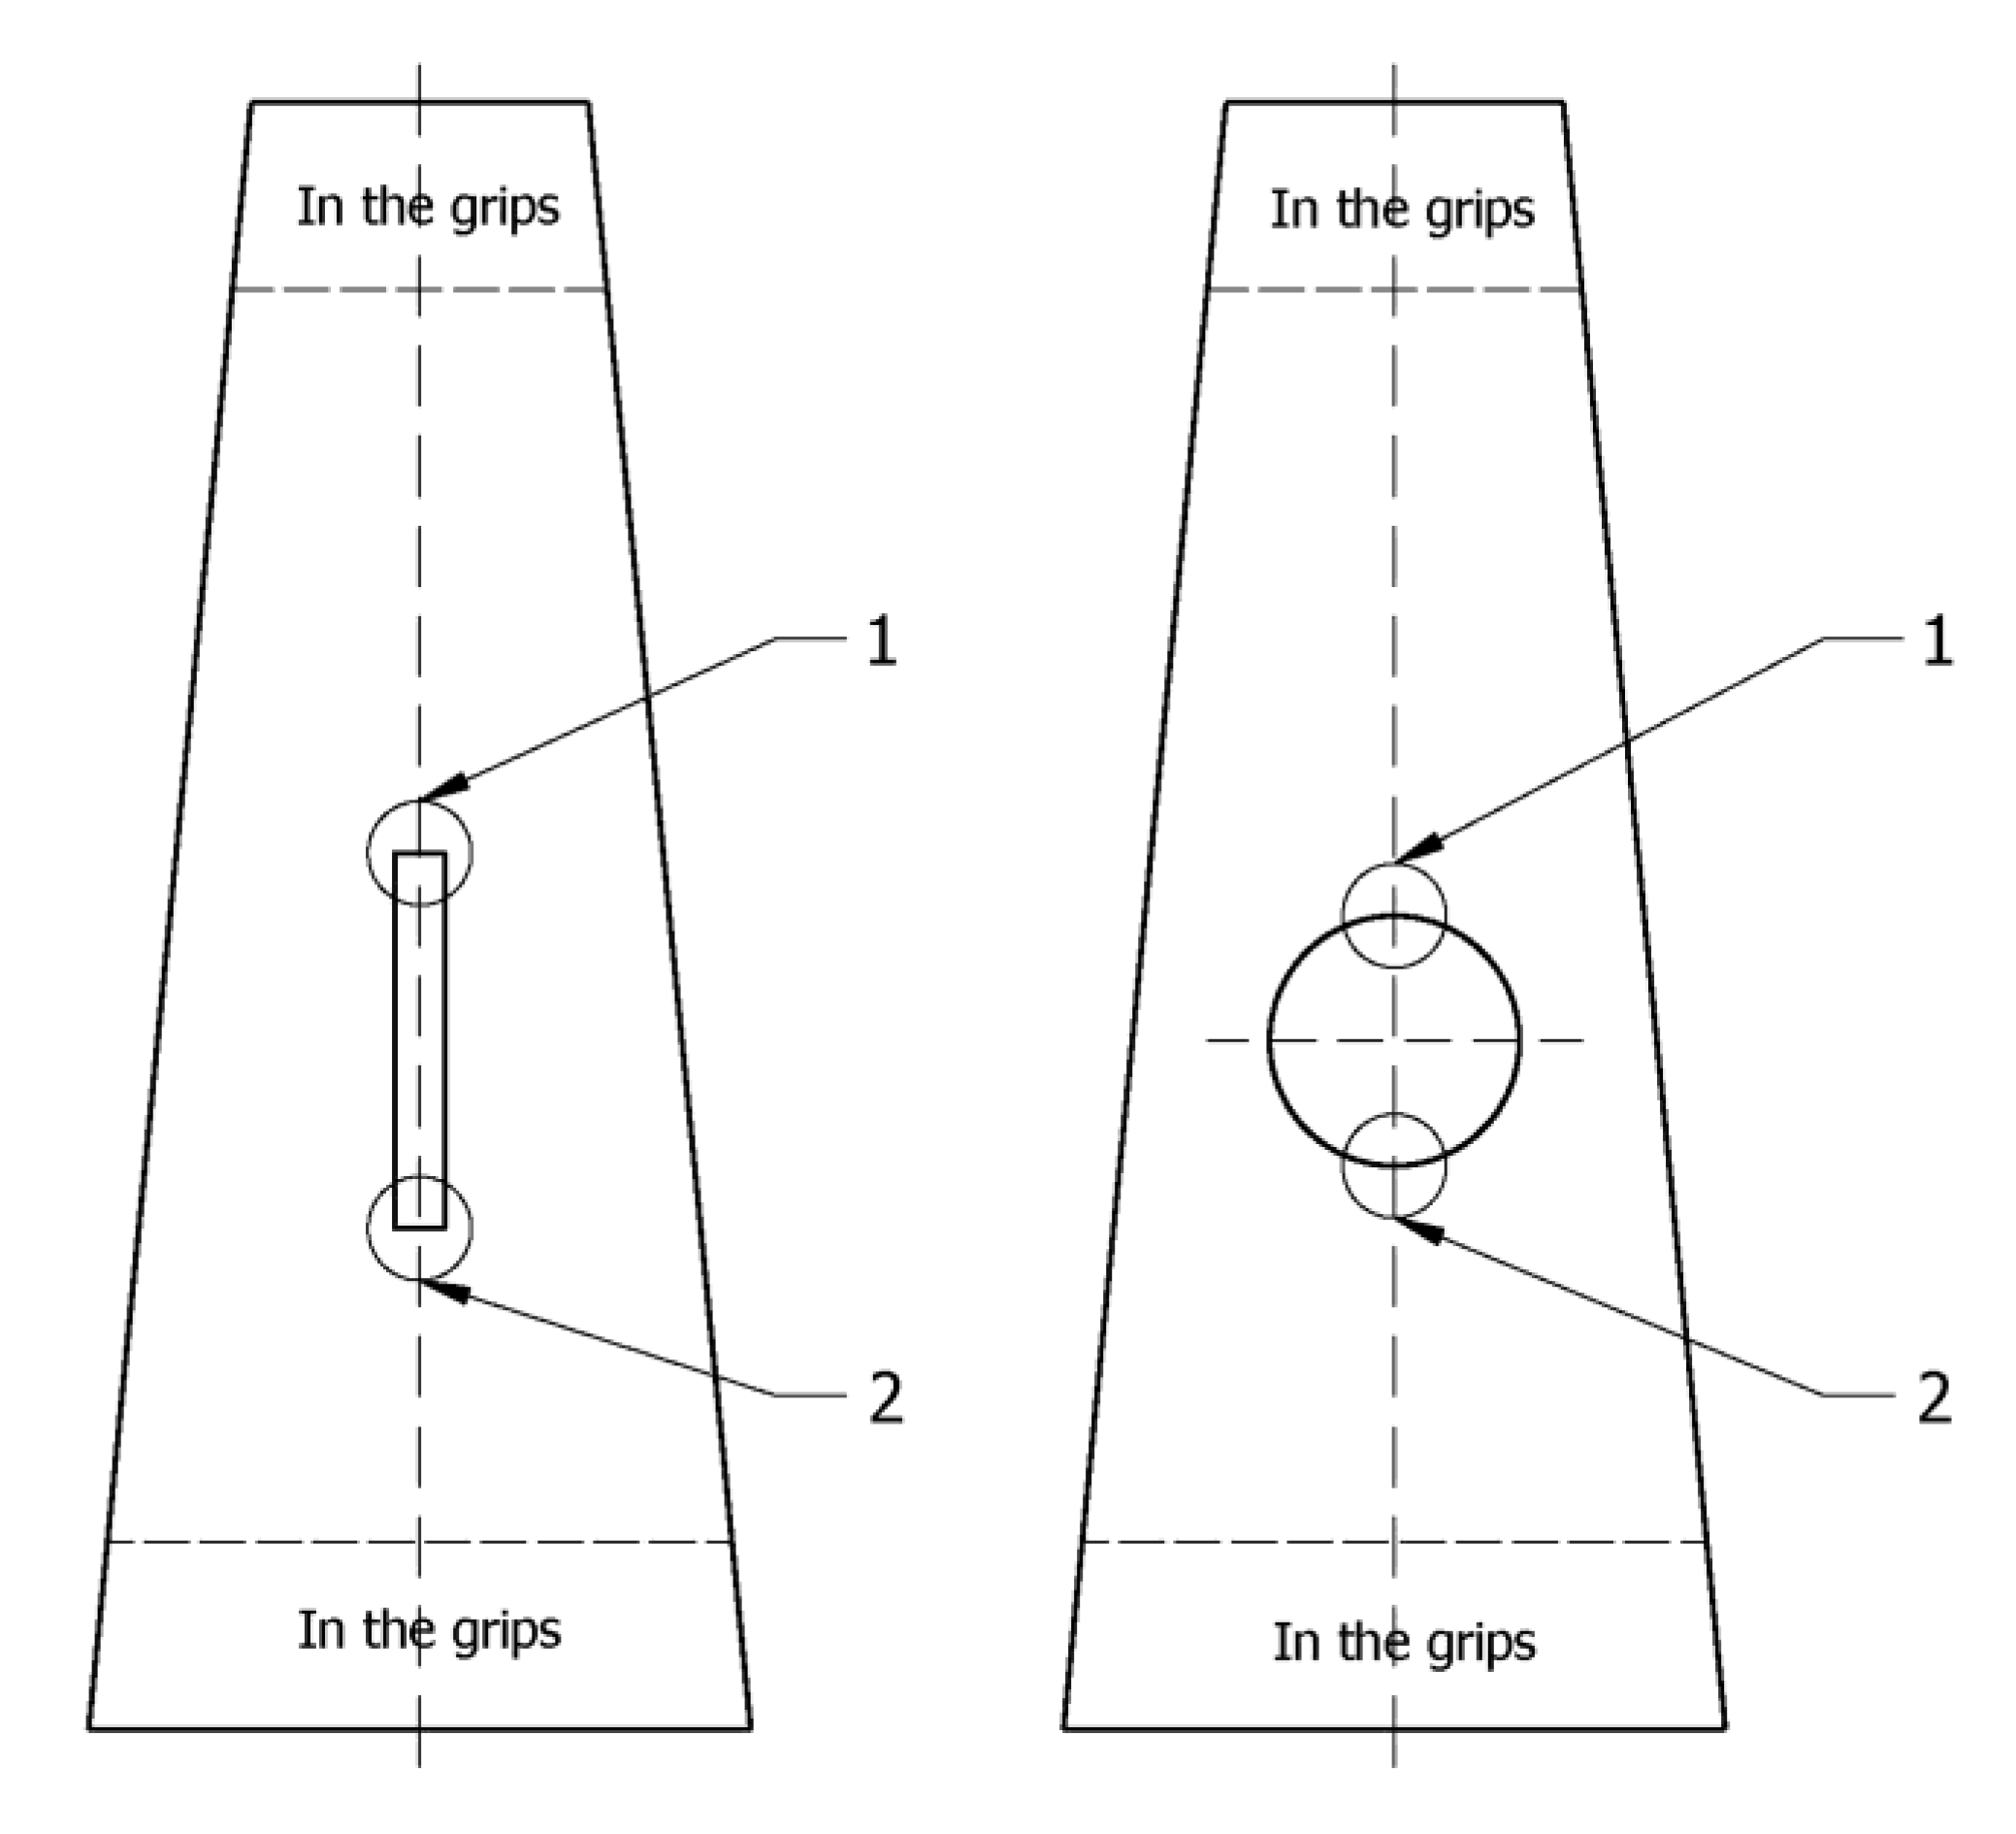
2.1. Experimental Procedure

Tensile residual stresses resulting from welding and other manufacturing processes reduce fatigue strength. The FAT design curve takes into account the high-tensile residual stresses in the welded components and refers to the as-welded condition [2]. When considering S–N data, it is important to account for the fact that residual stresses are usually low for small-scale specimens. Therefore, results should be adjusted to reflect the larger effects of residual stresses in real components and structures. This can be achieved by performing fatigue tests at high stress ratios, such as R = 0.5, or by testing at R = 0 and reducing the fatigue strength at 2 million cycles (FAT) by 20% [2]. In order to compare the results of the fatigue tests with the corresponding design curves, the fatigue tests in this study were performed with a stress ratio (min/max) of 0.5. The bending tests were performed on a mechanically driven bending testing machine (Figure 2) at two load intensities with constant amplitude. Components with a longitudinal fillet-welded attachment were loaded with nominal stress ranges of 60 MPa and 45 MPa and components with round sheet fillet-welded attachment with nominal stress ranges of 70 MPa and 45 MPa. For the derivation of S–N curves, the stress ranges were preferably chosen so that the fatigue life of the specimens was in the range of 5 × 10⁴ to 106 [2]. The stress intensities were chosen taking into account the fact that the structural stresses at the weld toe were in the range of material elasticity behavior.
The components with the longitudinal fillet-welded attachment and the components with the round sheet fillet-welded attachment were made of a 4 mm thick aluminum-alloy plate (AlMg4.5Mn or AlMg2.5Mn). The longitudinal direction of the components coincides with the rolling direction of the plates. The size of the fillet weld, the welding procedure and the welding parameters comply with the standard recommendations [32,33,34]. Angular misalignments of the welded components were not observed. A dimensional inspection of the weld, a visual inspection, and an ultrasonic inspection of the weld seam were performed. In addition, the size of a weld profile was measured by taking images of the weld in a direction perpendicular to the longitudinal plane of symmetry of the component. The notch opening angle with minimum deviations between the components was 135°. Only components with a weld profile meeting the technical specifications and without weld seam irregularities, i.e., with satisfactory quality, were selected for fatigue testing. The changes in the mechanical properties of the parent metal in the weld zone and the heat-affected zone caused by the welding process were not investigated. However, this influence on the fatigue resistance of the components is included in the S–N curve. The tapered specimen shape was chosen to achieve a uniform change in nominal stress along the specimen. The materials of the components, the welding procedure, and the welding parameters are presented in Table 1. The geometries of the components are shown in Figure 3. The fractures occurred in the parent metal, i.e., in the heat-affected zone, where the highest local stresses prevailed due to the geometry of the components. Visual inspection of the fracture surfaces of the components revealed that in all cases, the fractures were initiated at the weld toe by the formation of an initial crack that propagated through the thickness of the plate to the final fracture. It should be noted, however, that a detailed analysis of the fracture mechanism was not performed as this is beyond the scope of this article.
The locations marked 1 and 2, where the fatigue fractures occurred, are shown in Figure 4.

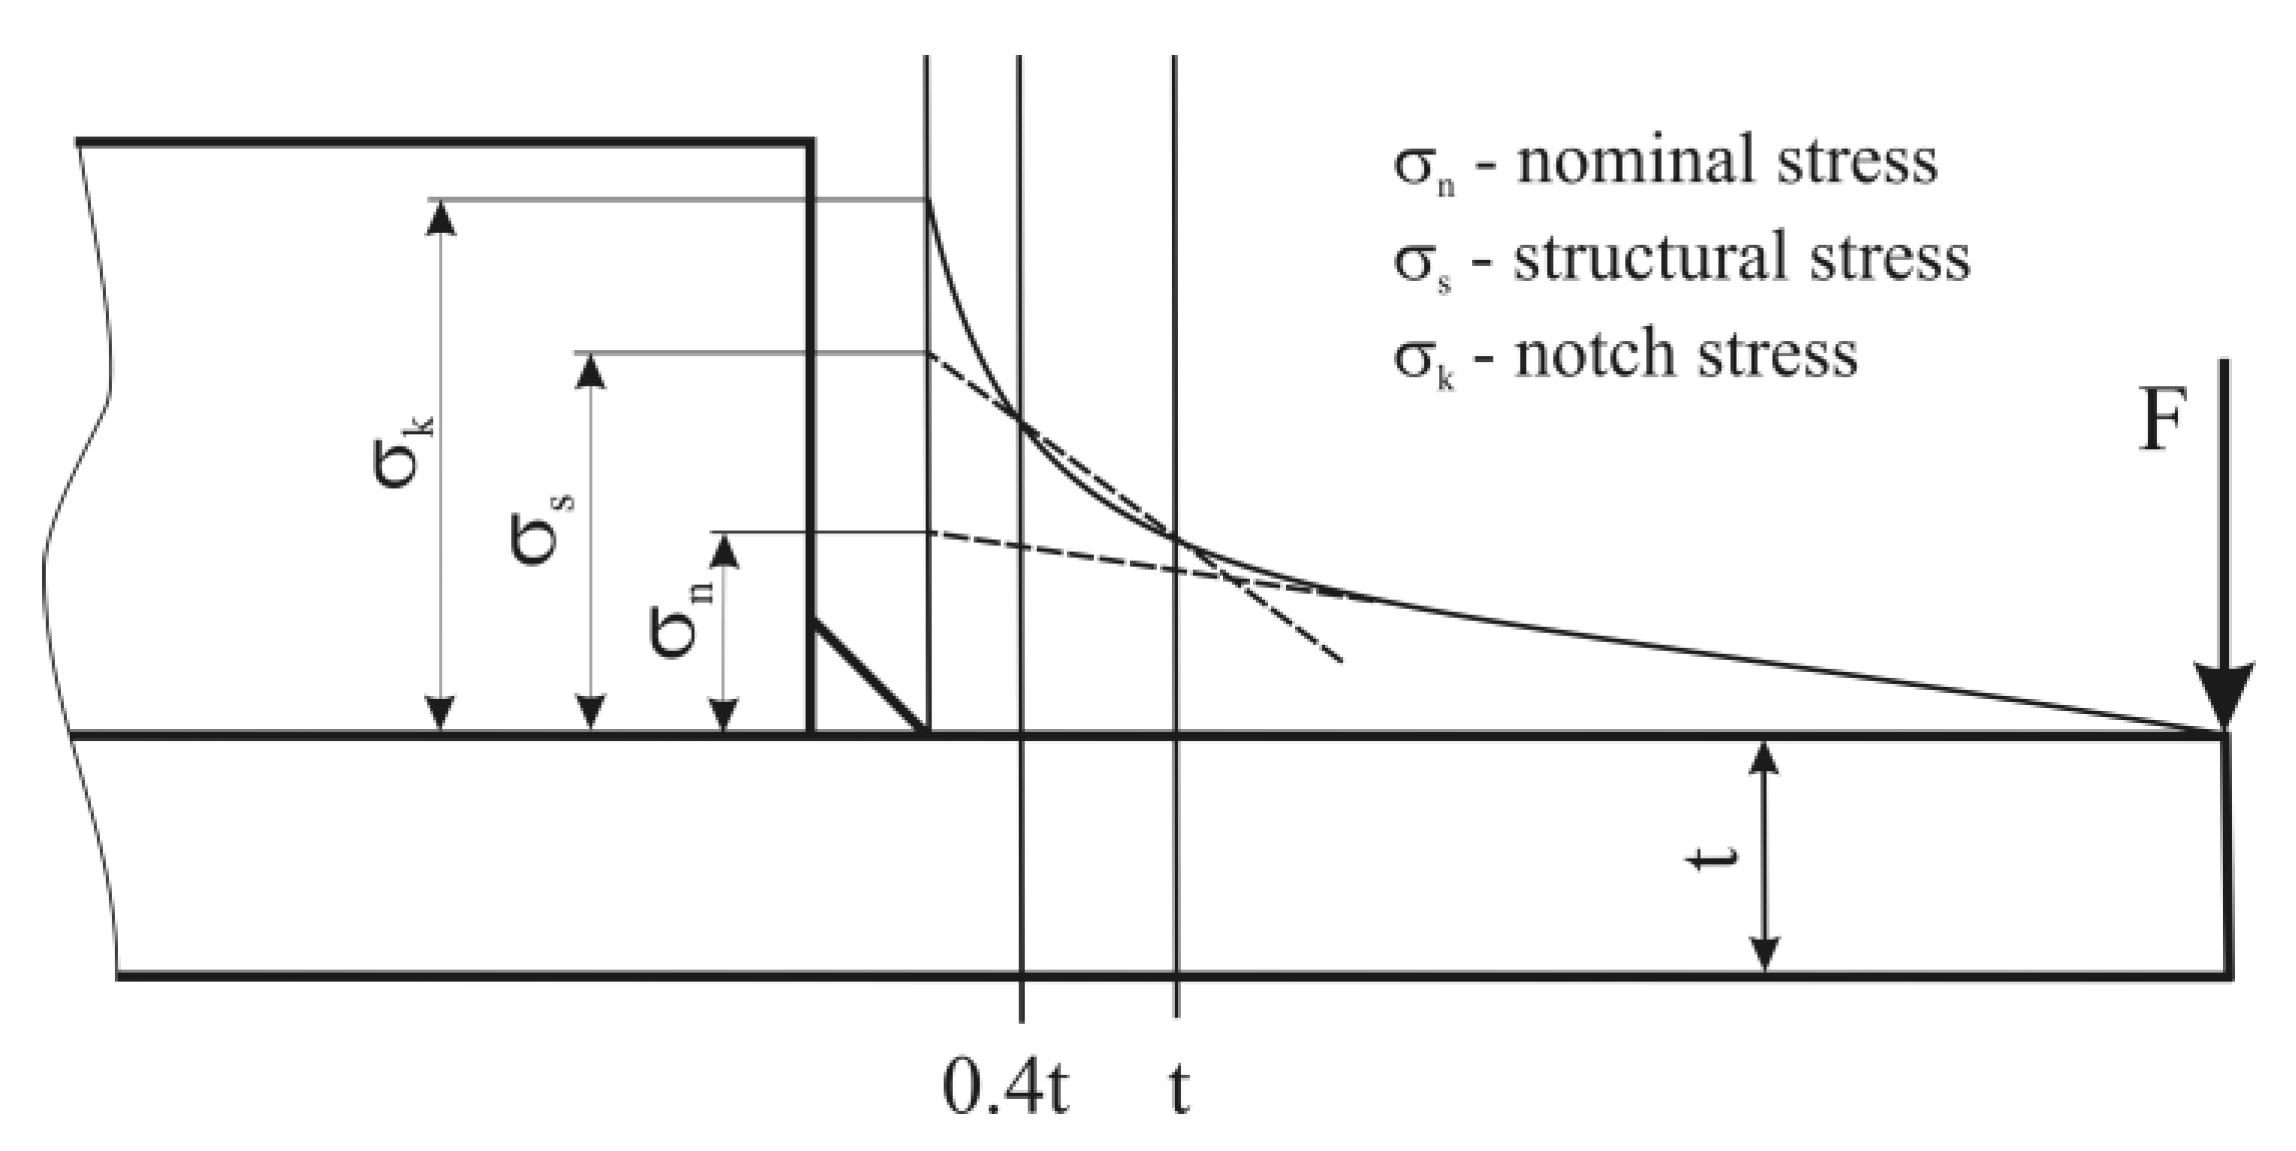
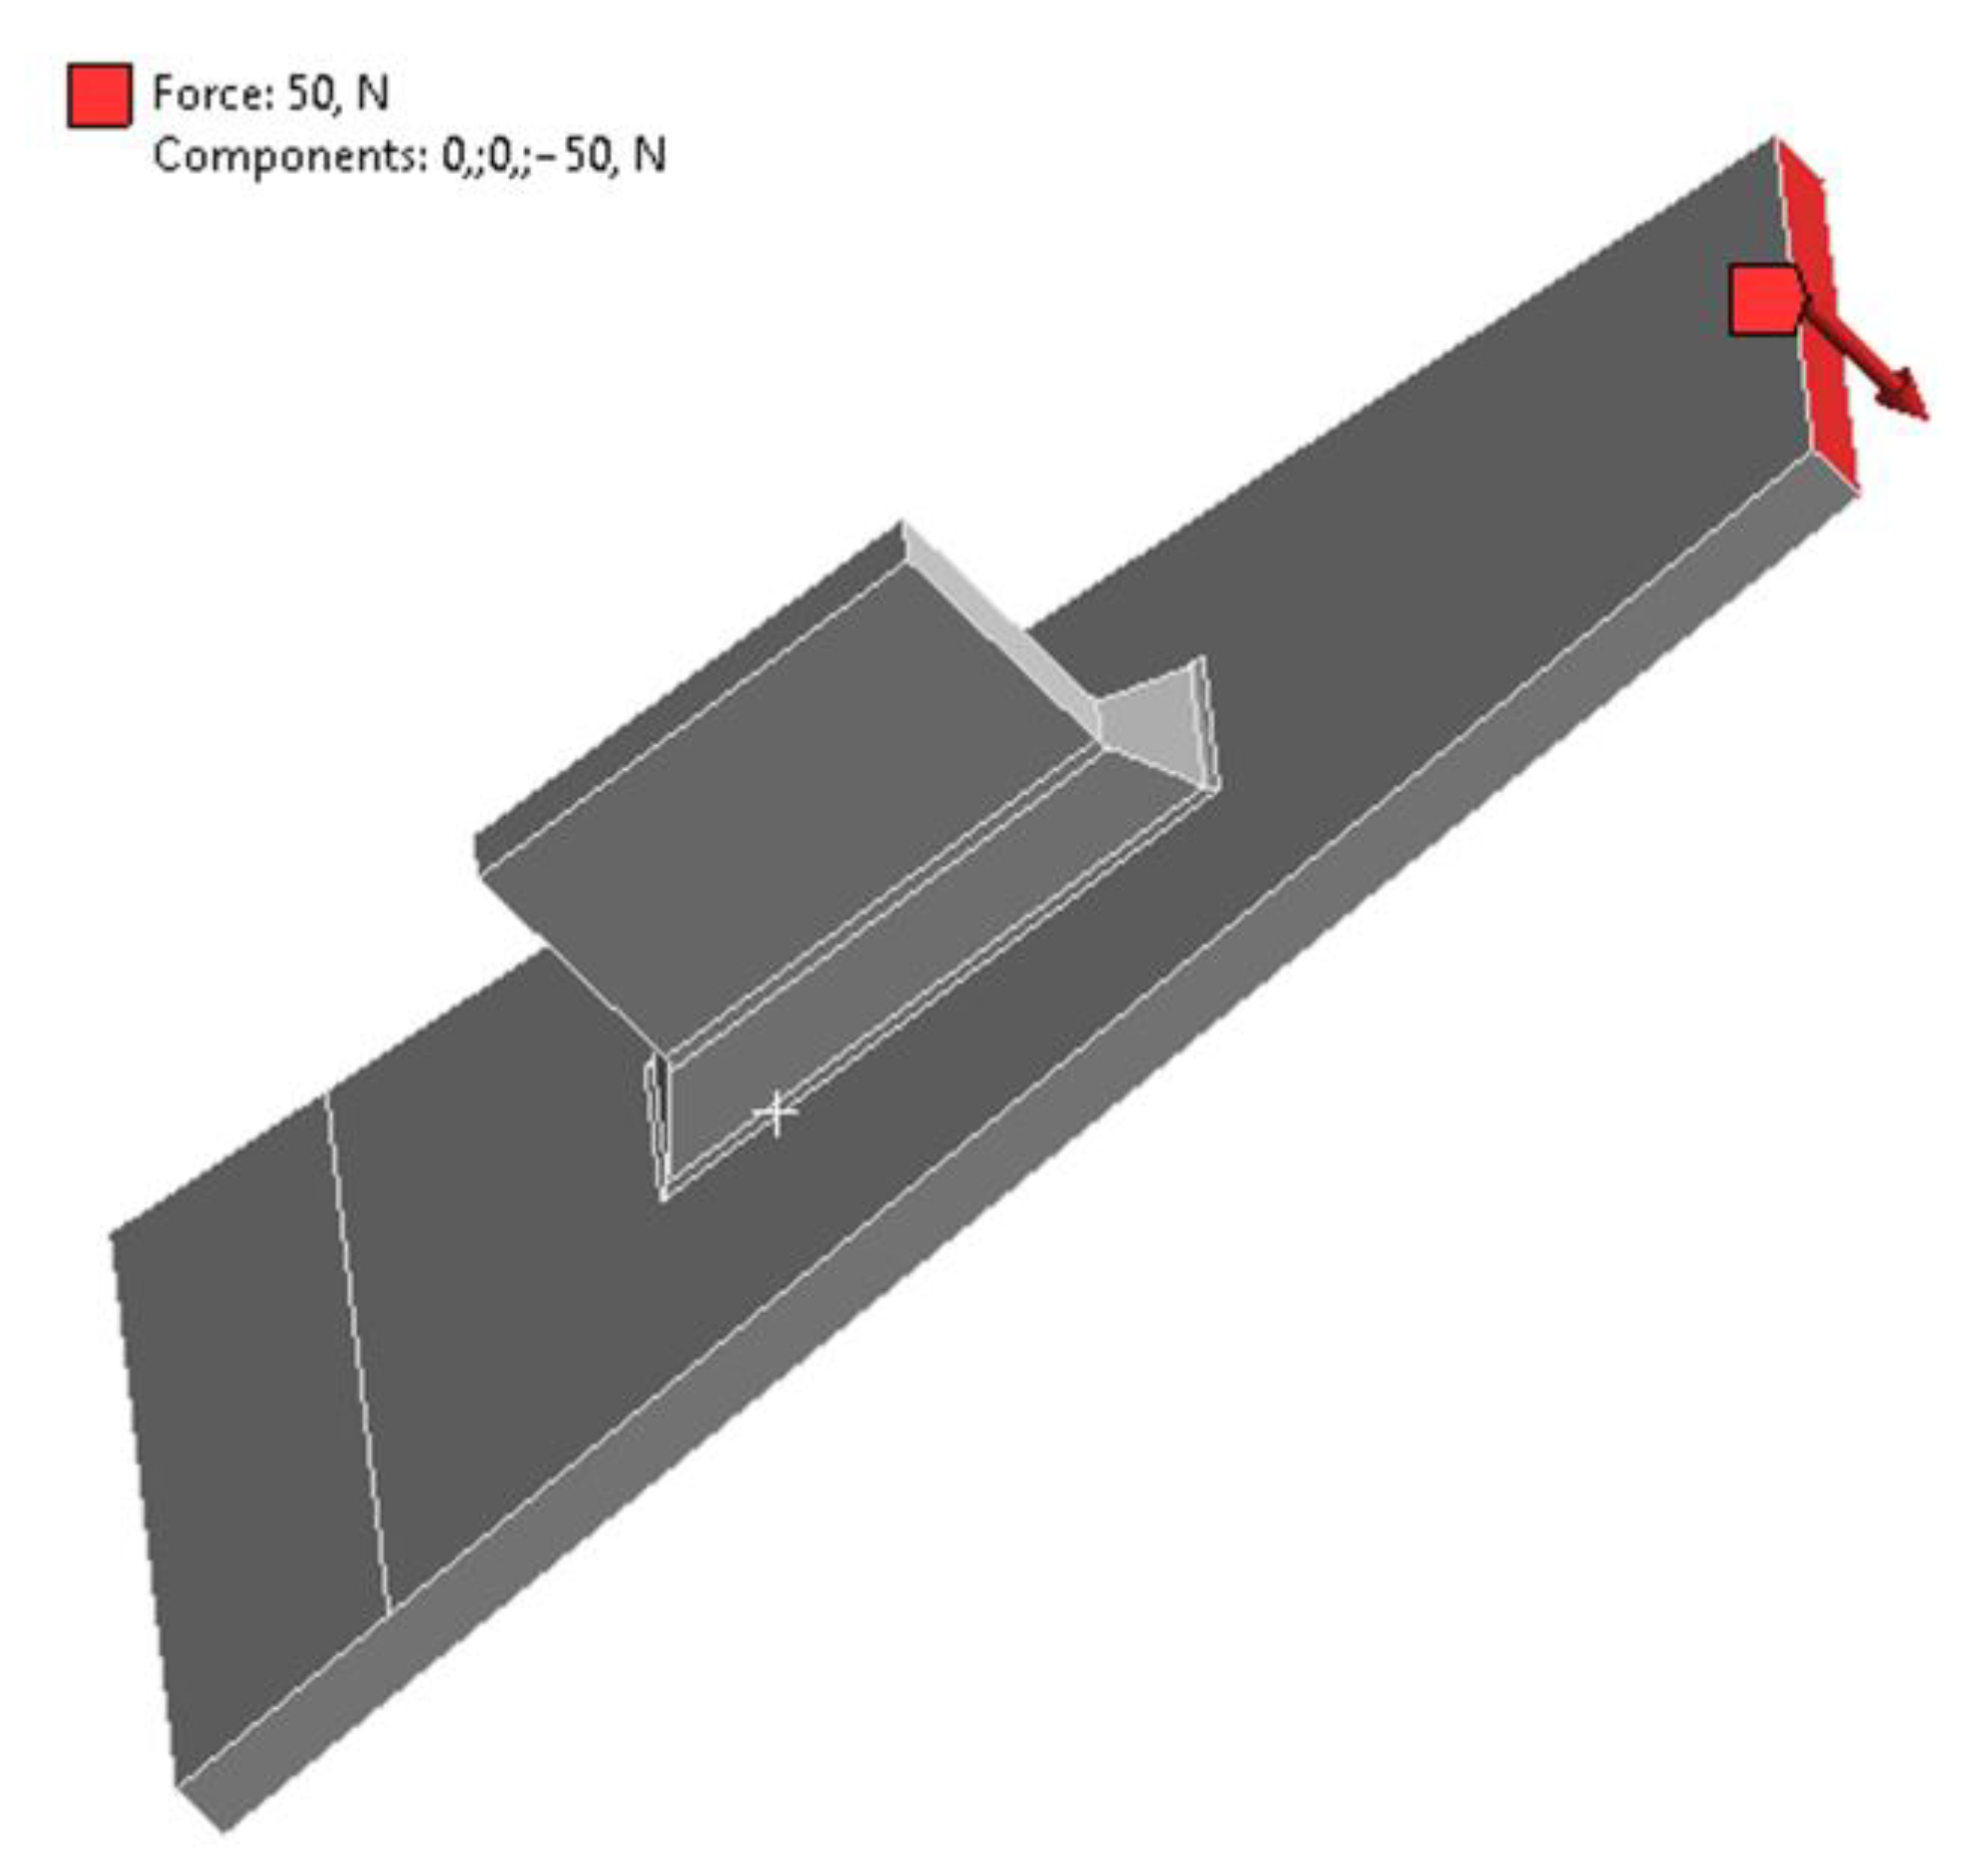
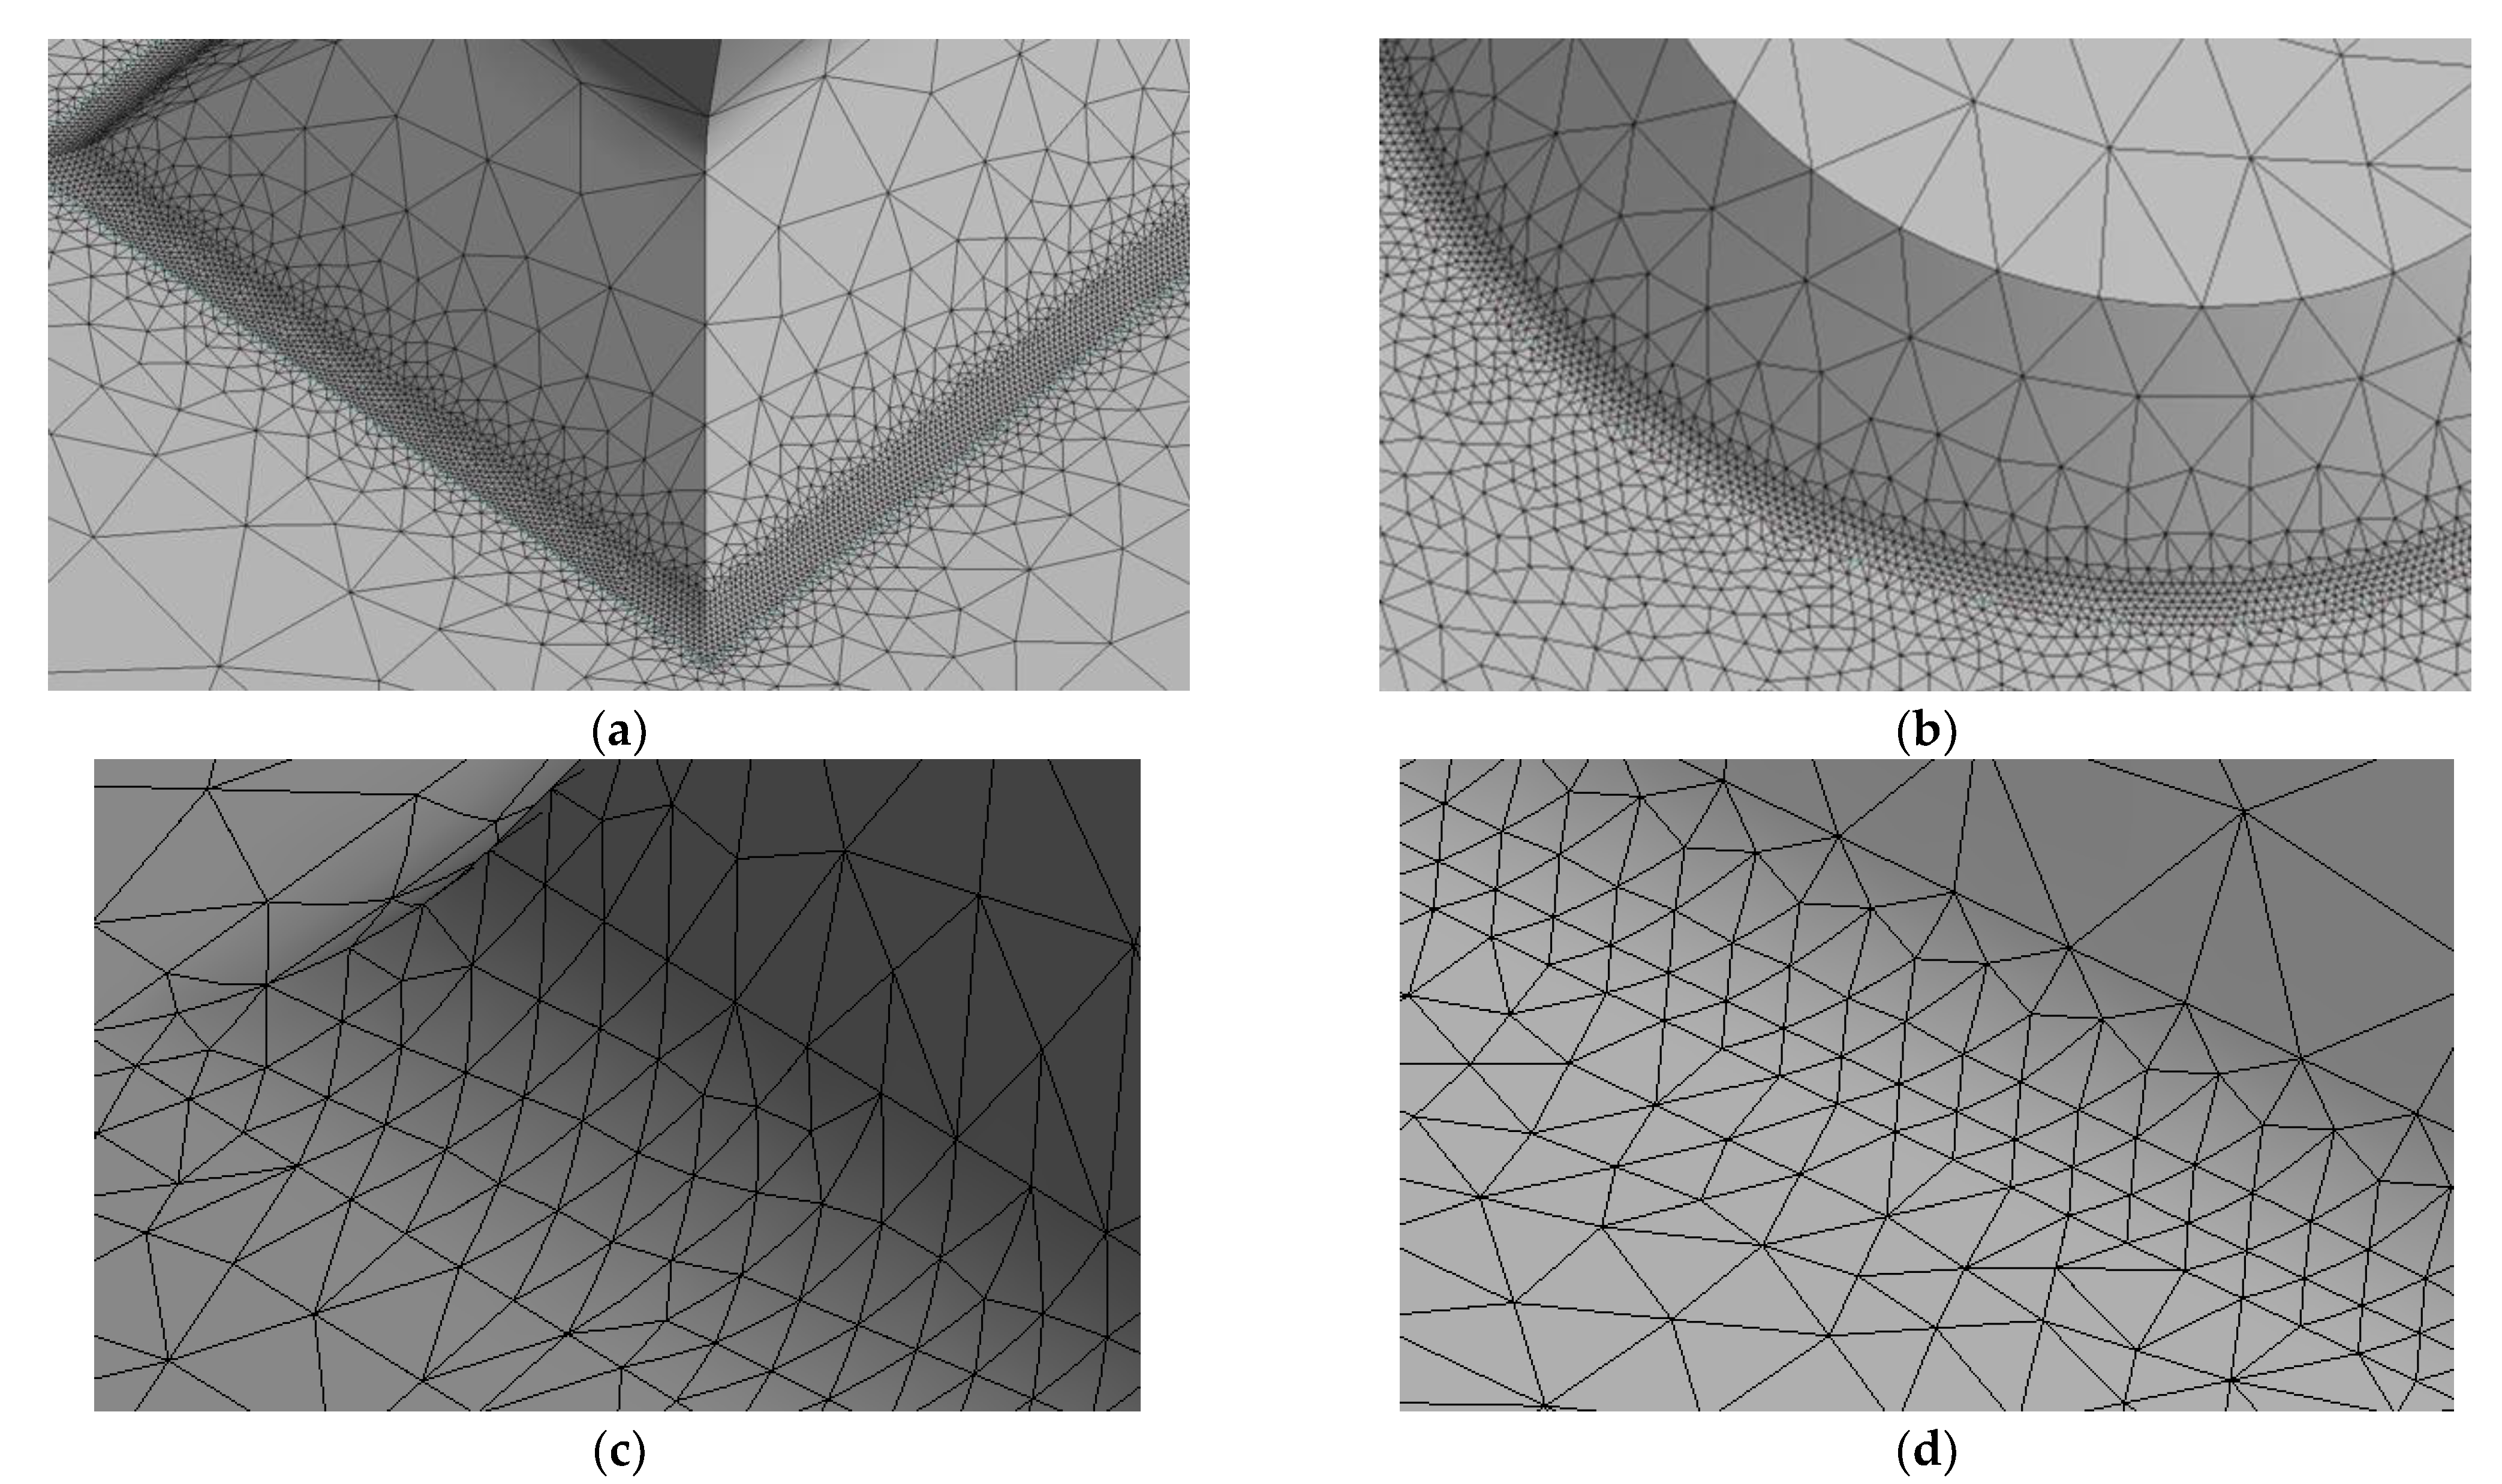
2.2. Stress Calculation

Different types of stress calculations have been performed to evaluate the nominal stresses and the notch stresses developed at the weld toe. The nominal stresses are estimated implementing the elastic beam theory term:
σ n = F · x / W x ,
where F is the applied loading force, x is the distance between the fatigue fracture location and the loading point, and W(x) is the elastic section modulus at the fracture location. The results of the nominal stresses obtained using this expression and finite element analysis do not differ from each other at locations far enough from the load application location and stress concentration points.
Notch stresses at the weld toe were evaluated using the finite element method. Three-dimensional finite element models for both types of components were developed in ANSYS 17.0. Ten-node tetrahedral solid structural elements with quadratic displacement interpolation functions (SOLID187) were used for the models (elastic modulus of 72,000 MPa and Poisson’s ratio of 0.33). A force was applied to the upper vertical bounding surface of the model, while the boundary conditions of the model part placed in the lower grips constrained the displacement and all three rotations along the model edges, Figure 5.
The notch-stress concentration factor Kt was evaluated by the 3D finite element model of the component for the two reference radii at the weld toe, 1 mm and 0.05 mm:
K t = σ k / σ n ,
where σk denotes the notch stress (value of the maximum principal stress at the weld toe) and σn is the nominal stress value.
According to the IIW recommendations, the finite element mesh had to be progressively refined toward the notch region. The relative size of the elements with respect to the reference radius should be smaller than rref/4. Recent research on the determination of stress concentration in notches [36] also came to the same conclusion regarding the size of the elements in the notch area. In addition, it was found that more accurate stress results can be obtained by determining nodal stresses than element stresses. In the present study, both components were modeled with finite element sizes of rref/5 and rref/10 in the notch region. This approach was used for both reference radii, namely rref = 1 mm and rref = 0.05 mm. Models with locally refined meshes in the rounded weld toe region gave the same results for both components, regardless of whether the size of the finite elements was rref/10 or rref/5. To ensure the accuracy of the determined notch stresses, a convergence test of the mesh was also performed. The results of the convergence test of the mesh in the notch region did not differ from those obtained with models, having finite element sizes of rref/5 and rref/10.
The details of the 3D finite element models with rounded welds are shown in Figure 6.

3. Results

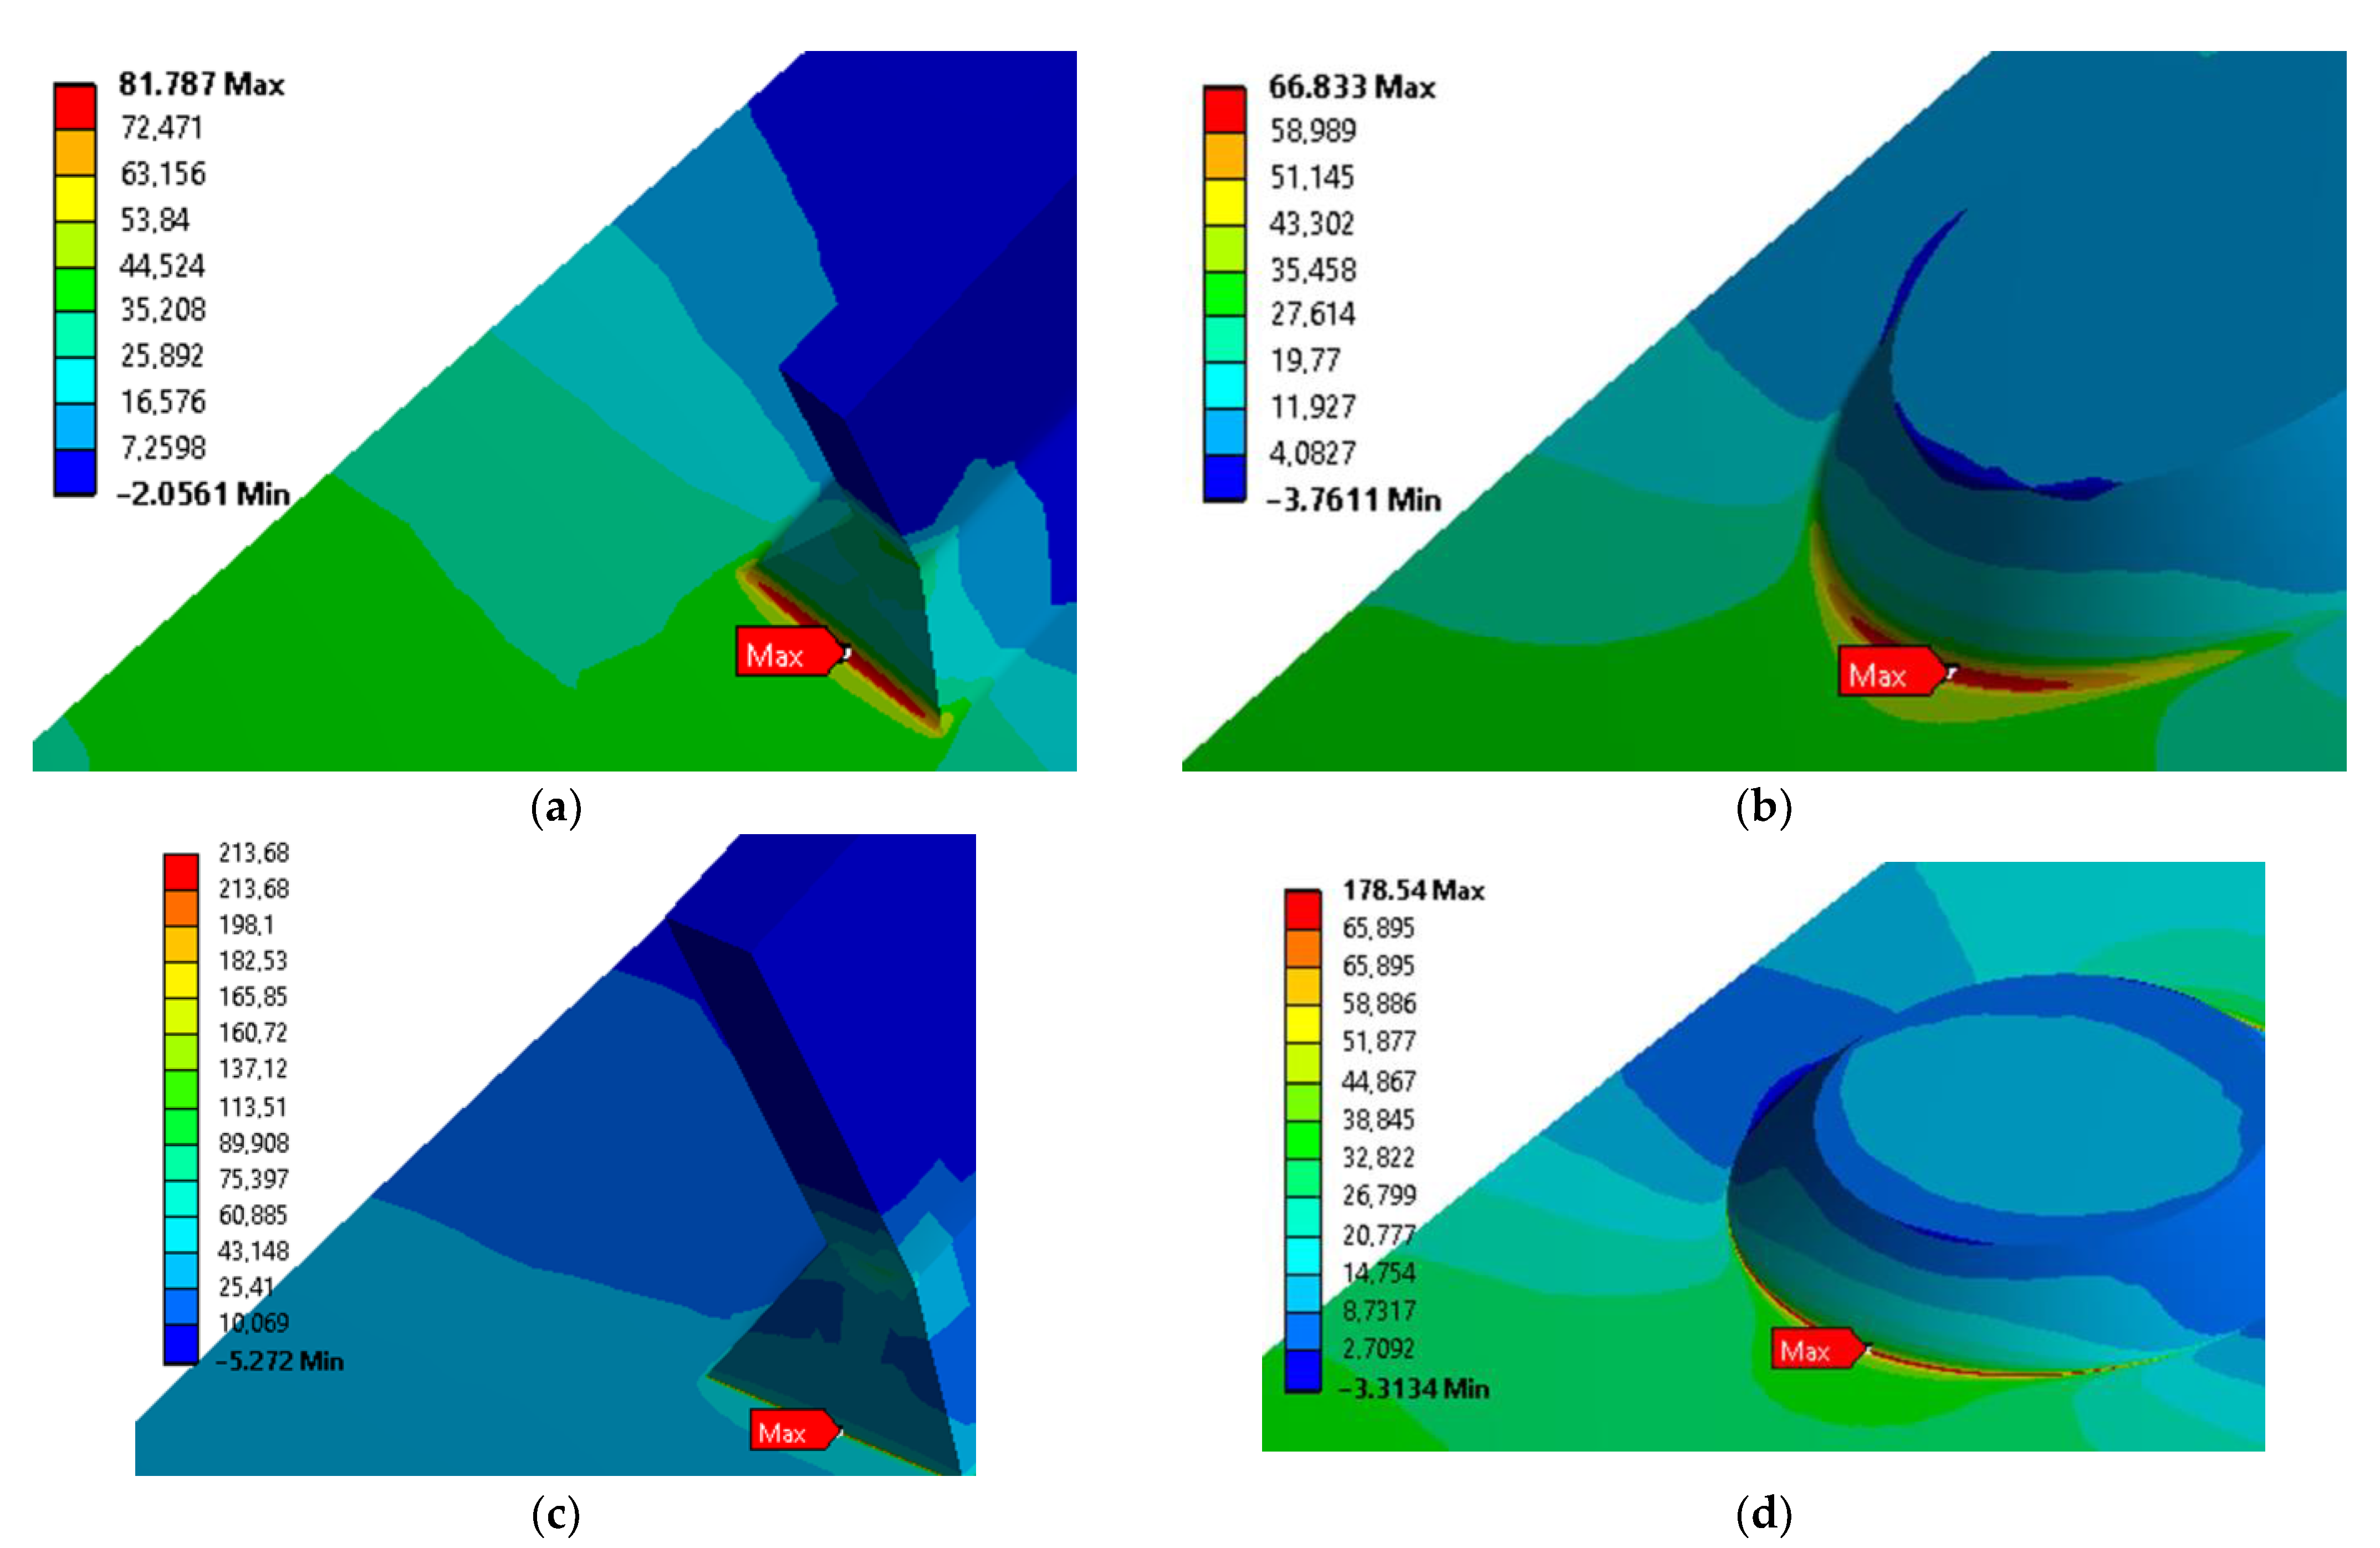
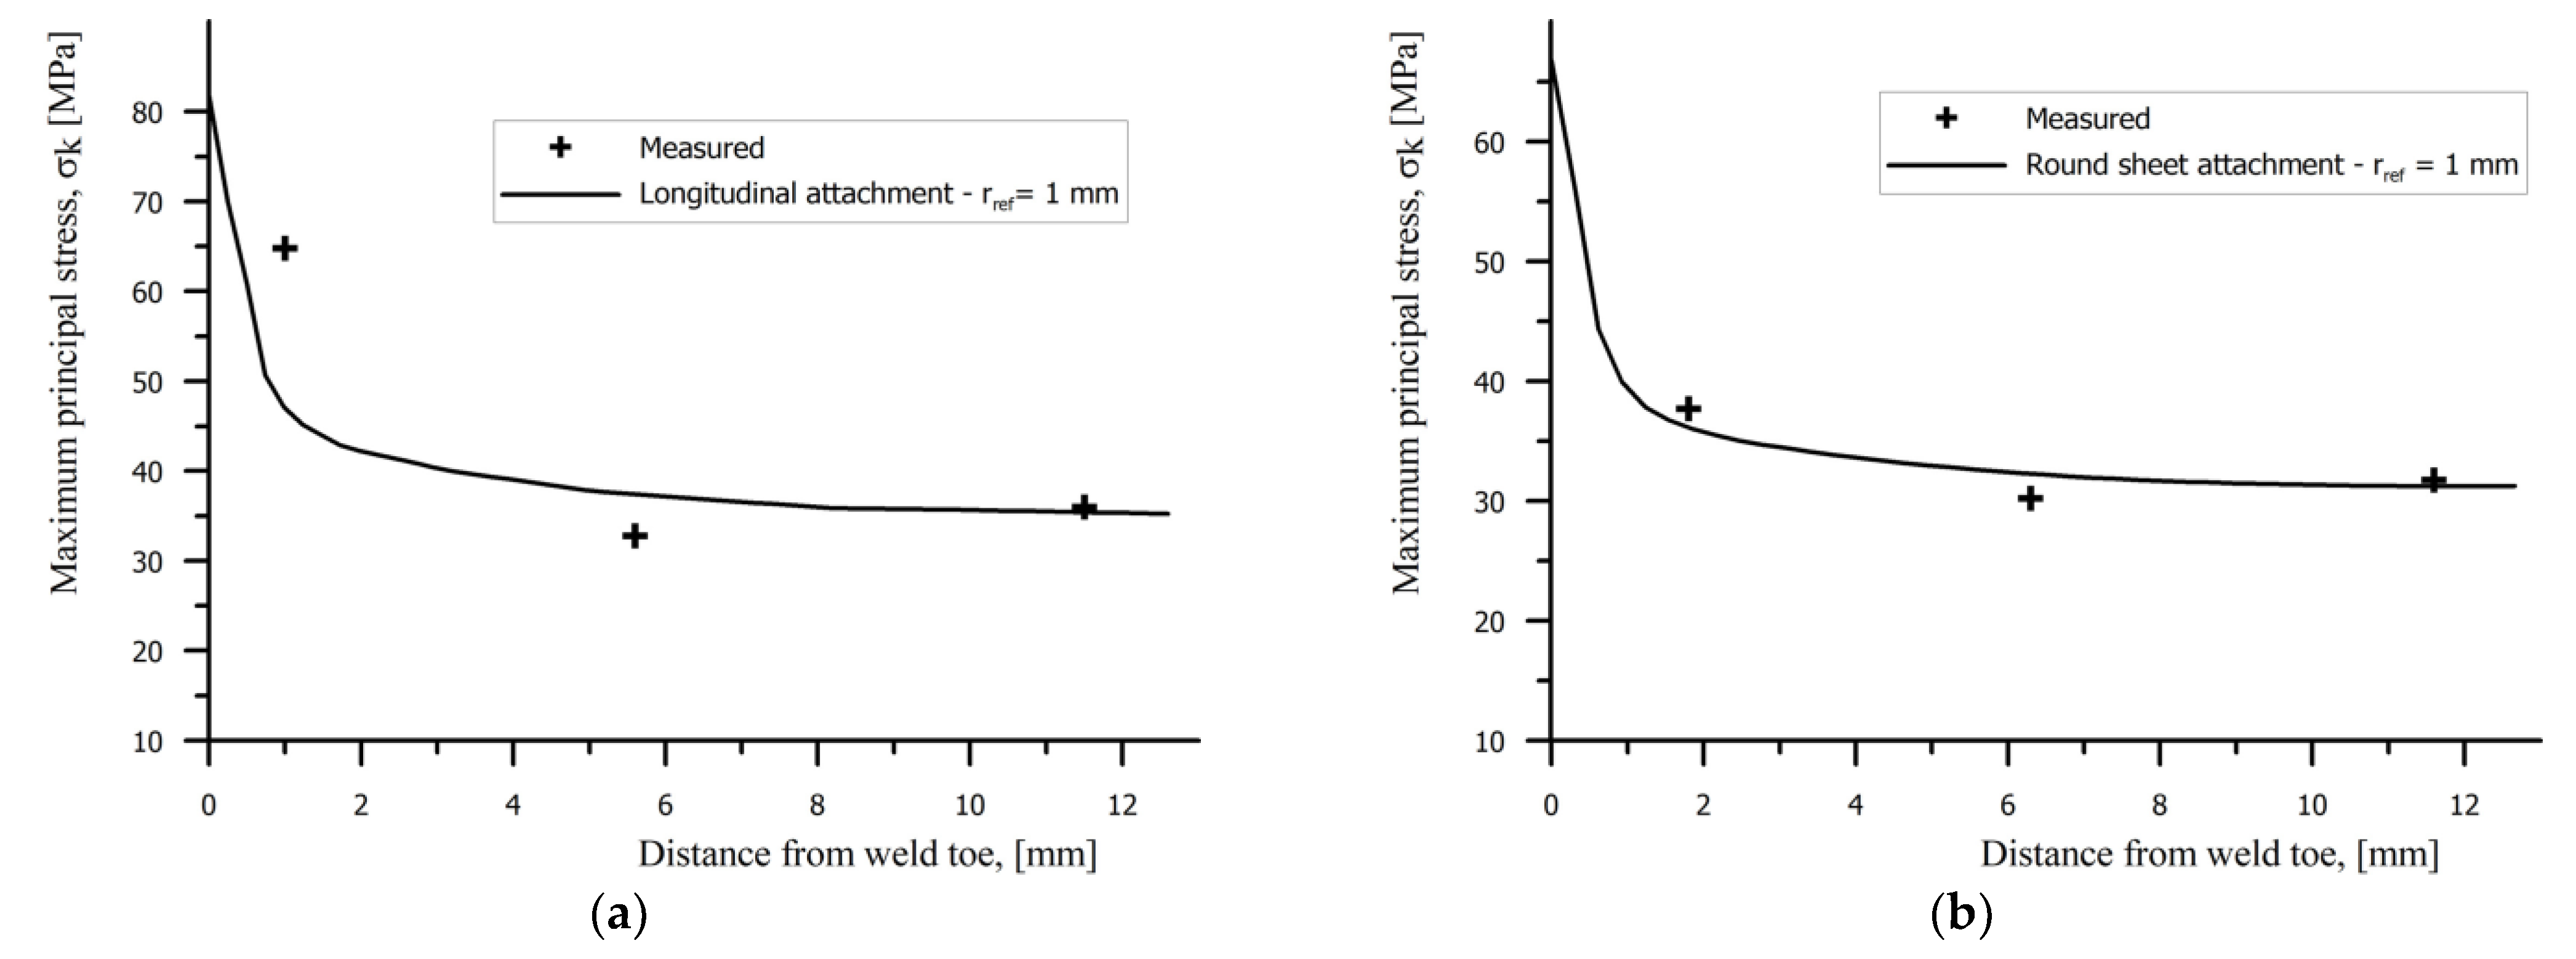
3.1. Stress Calculation Results

The maximum principal stress distributions for both welded components are shown in Figure 7. The components with a longitudinal fillet-welded attachment and the components with round sheet fillet-welded attachment are loaded with a vertical force (F = 50 N and F = 46 N, respectively) causing a displacement of the top edge of the model by 1 mm.
The results of the finite element analysis were compared with the results of strain gauge measurements. The distribution of the maximum principal stress along the plane of symmetry of the components, as a function of the distance from the weld toe (fatigue fracture location 2) for the cases rref = 1 mm are shown in Figure 8. A similar distribution along the component is obtained when the weld toe is modelled with rref = 0.05 mm. However, the notch stress increases from 81.78 MPa to 213.68 MPa for the component with the longitudinal fillet-welded attachment and from 66.83 MPa to 178.54 MPa for the component with round sheet fillet-welded attachment.
The nominal stress σn and the notch-stress value σk at the fatigue fracture location, for the component with the longitudinal fillet-welded attachment and a round sheet fillet-welded attachment, are given in Table 2 and the notch-stress concentration factors Kt in Table 3.

3.2. Fatigue Testing Results

A total of 60 components with longitudinal fillet-welded attachment (31 components made of AlMg4.5Mn and 29 components made of AlMg2.5) and 50 components with round sheet fillet-welded attachment (27 components made of AlMg4.5Mn and 23 components made of AlMg2.5) were tested on a mechanically driven bending testing machine. The results of the fatigue tests (number of cycles to failure as a function of the applied structural stresses) are presented in the paper of Matić et al. [37]. According to Domazet et al. [38], the tensile strength of the material of the welded components has no influence on their fatigue strength. For this reason, the fatigue test data of the components made of both parent metals were analyzed together. The statistical analysis of the test results was carried out according to the recommendations of the IIW [2] and the ISO guidance [39]. The fatigue life of the components was evaluated using the notch-stress approach and compared with the corresponding design curves. The following relationships for the S–N curve (Ps = 97.7%) were derived:
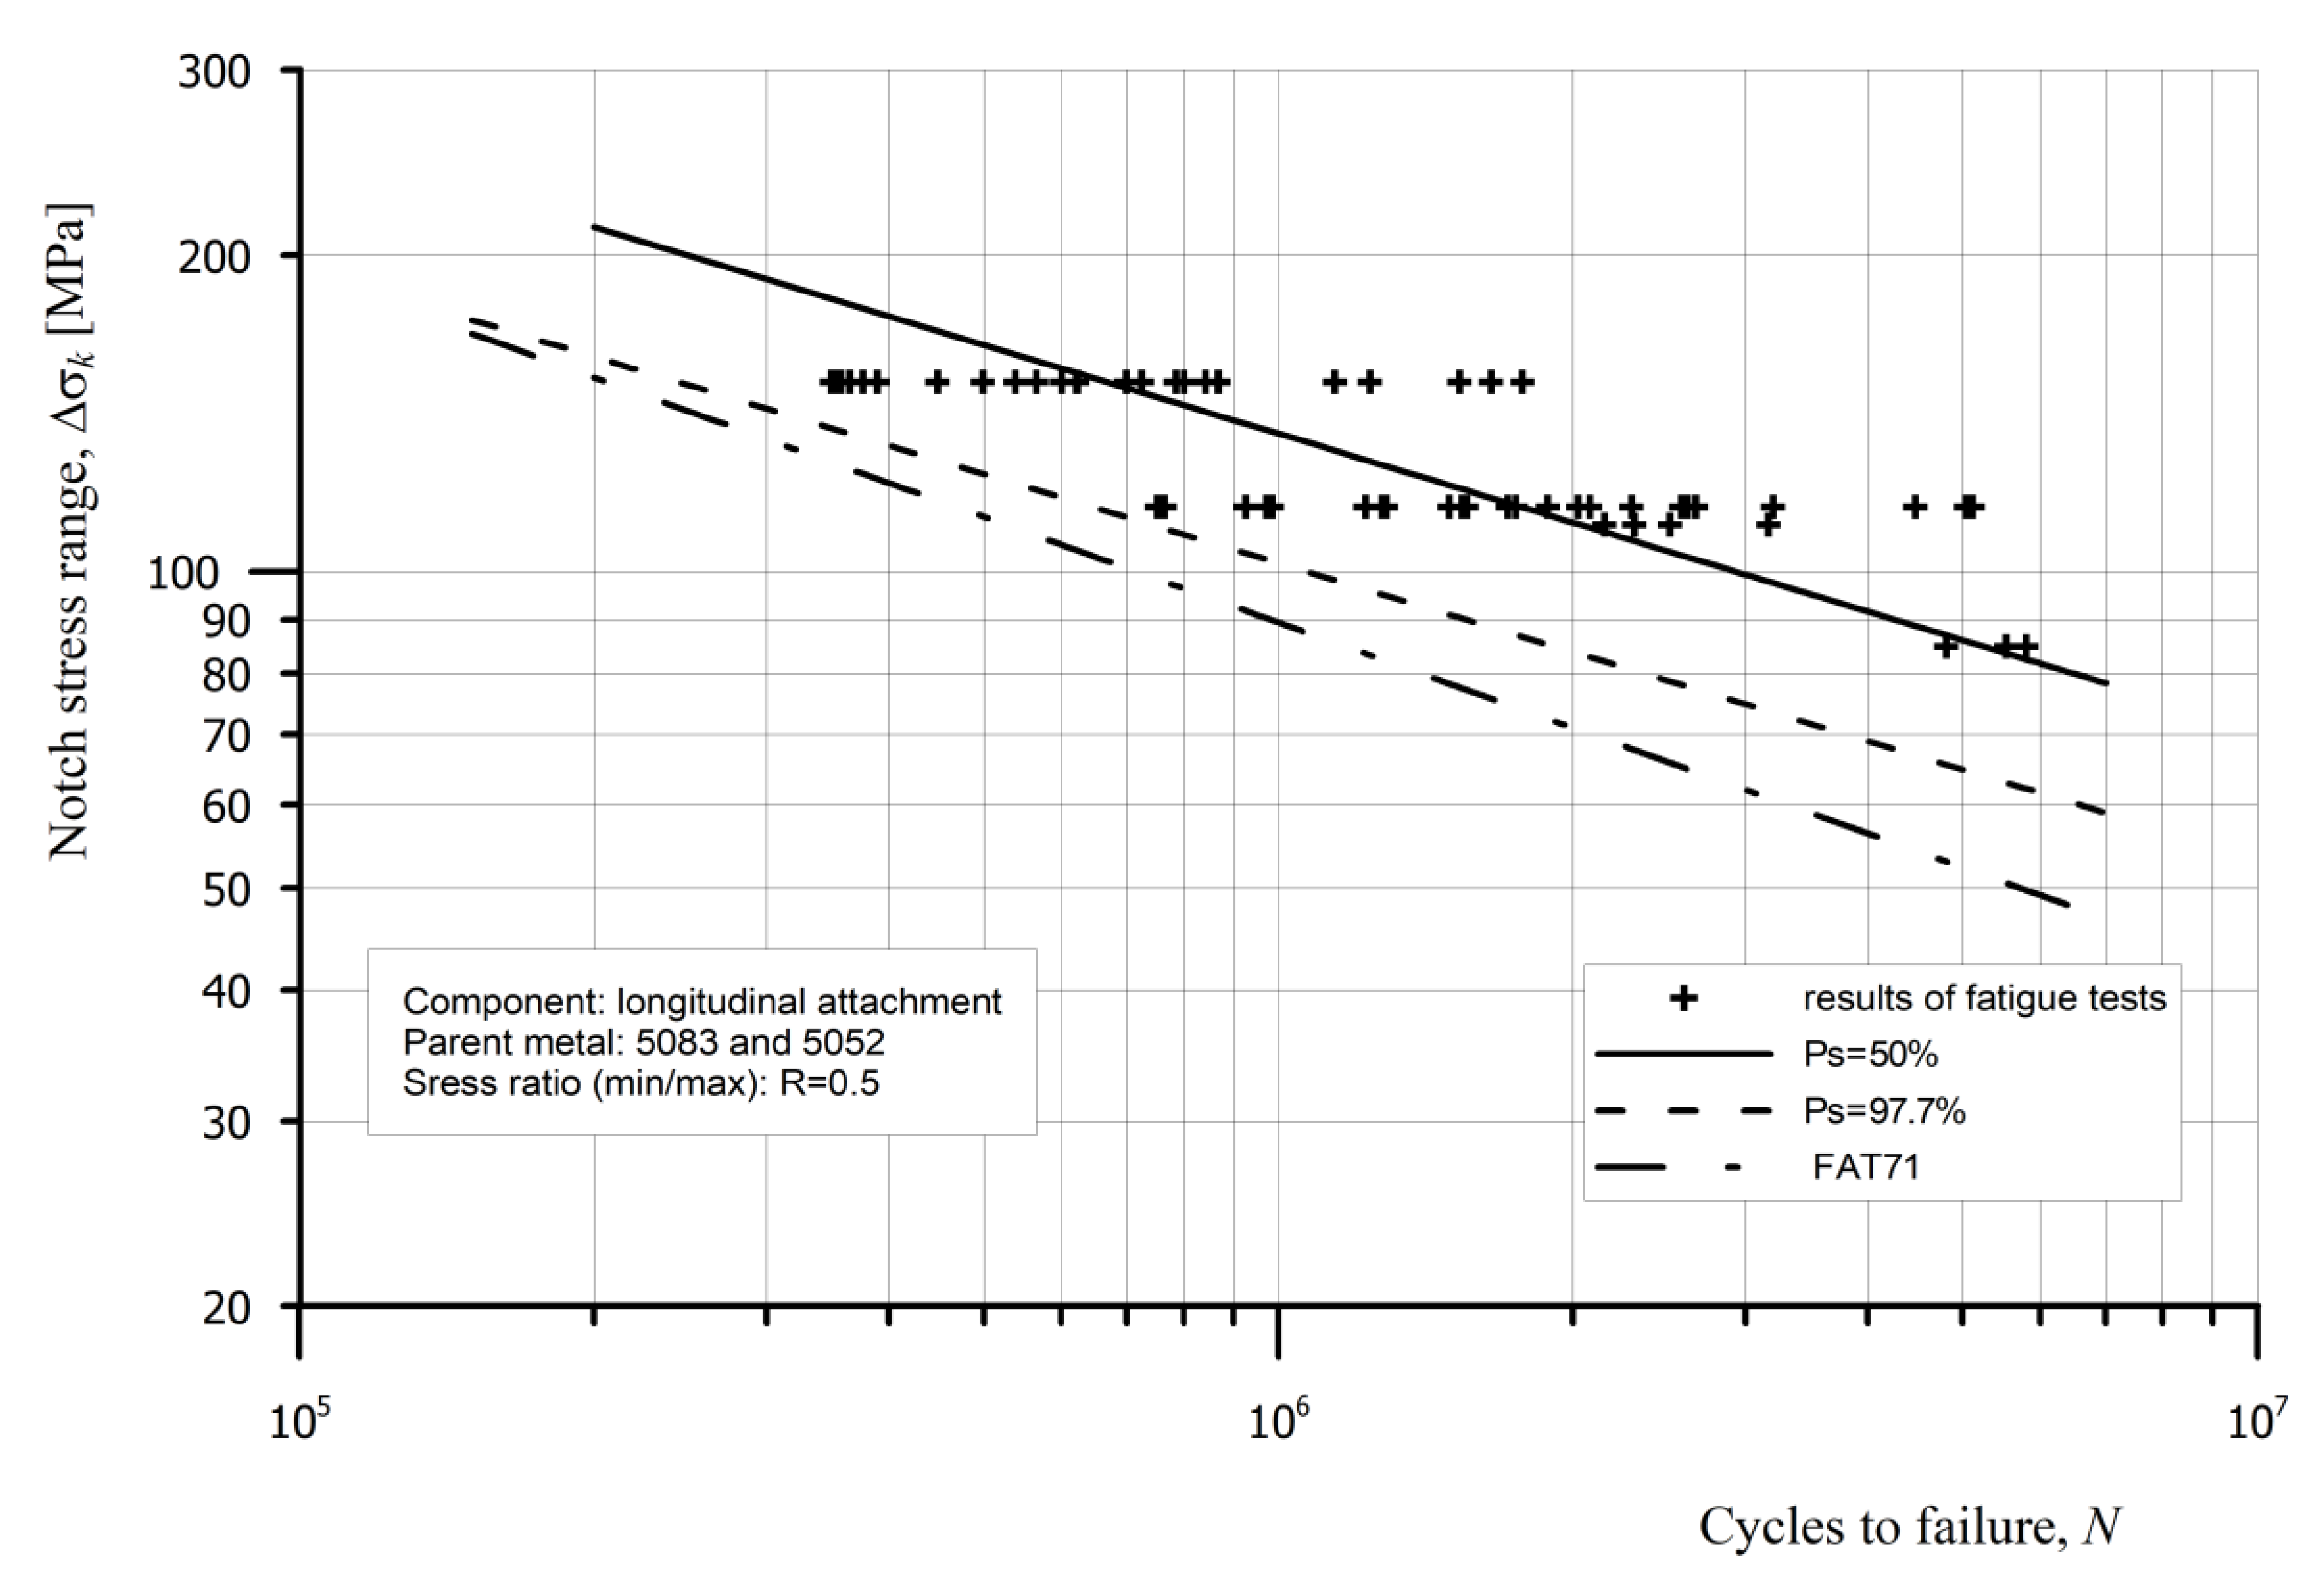
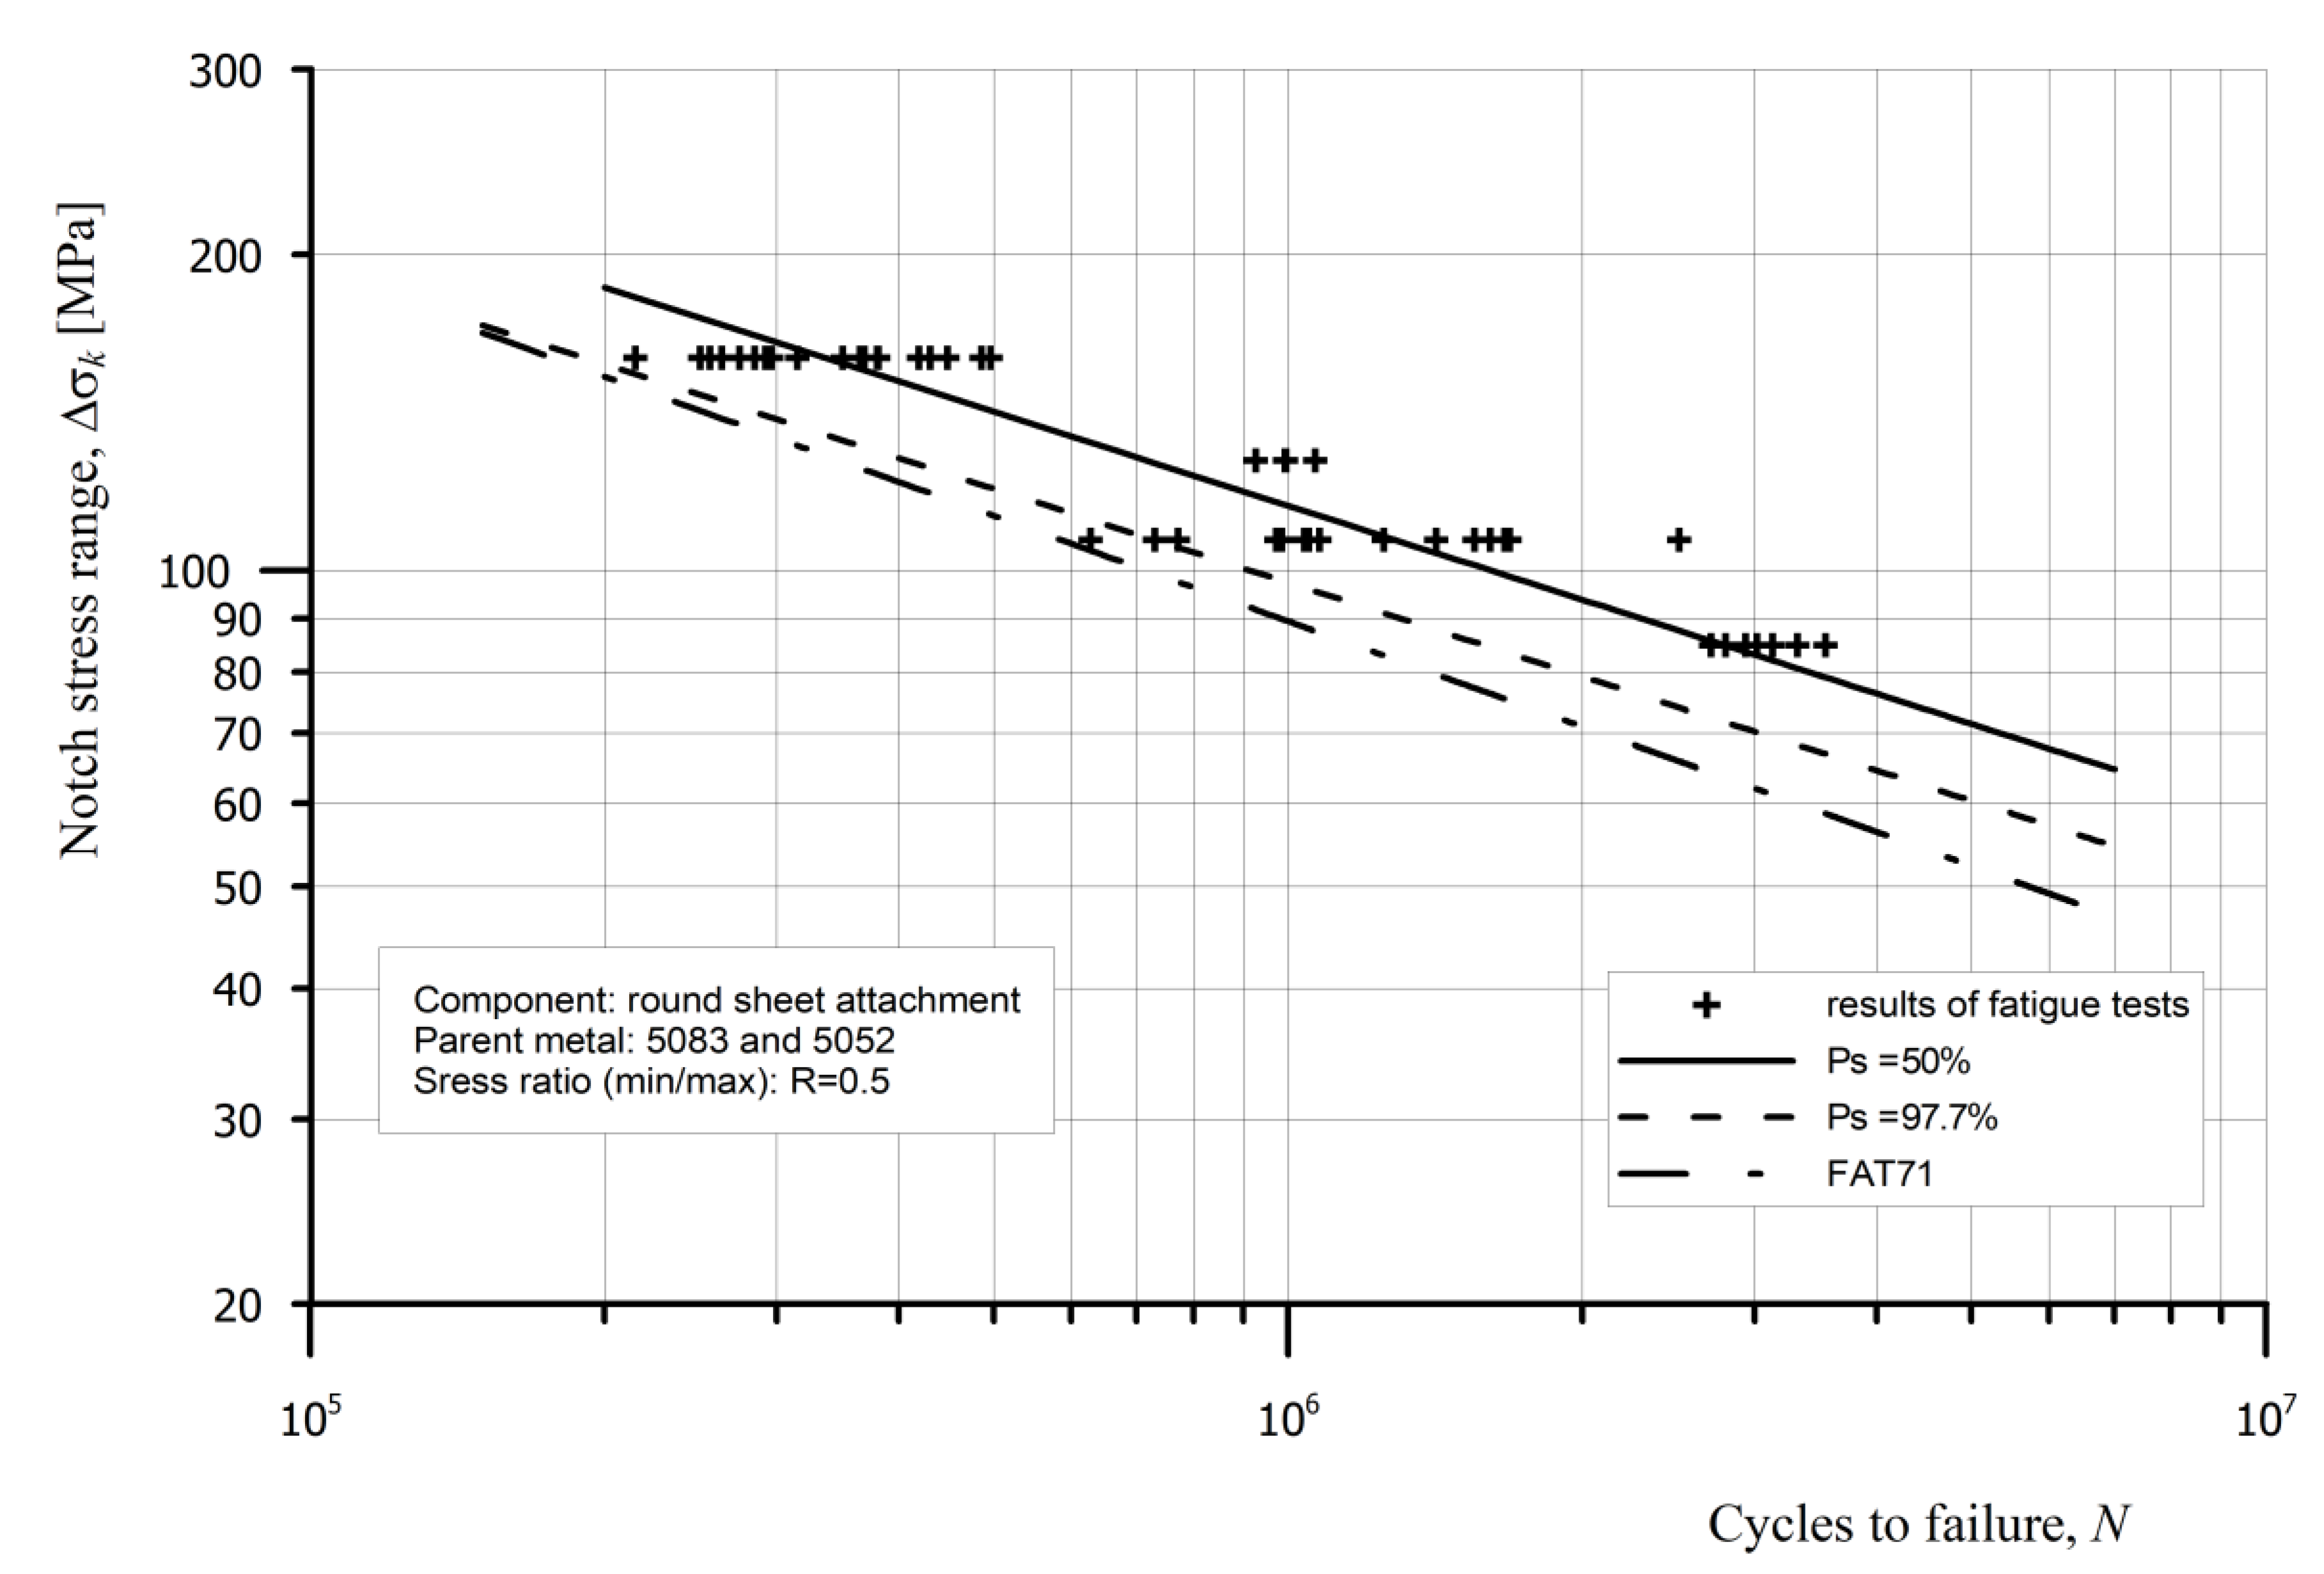
  • Reference radius rref = 1 mm: logN = 13.150 – 3.561 · log∆σk for components with longitudinal fillet-welded attachment and logN = 12.689 – 3.364 · log∆σk for component with round sheet fillet welded attachment. The scatter range of stress Tσ = 1:(∆σ(Ps = 10%) ⁄ ∆σ(Ps = 90%)) was Tσ = 1:1.439 and Tσ = 1:1.241, respectively.
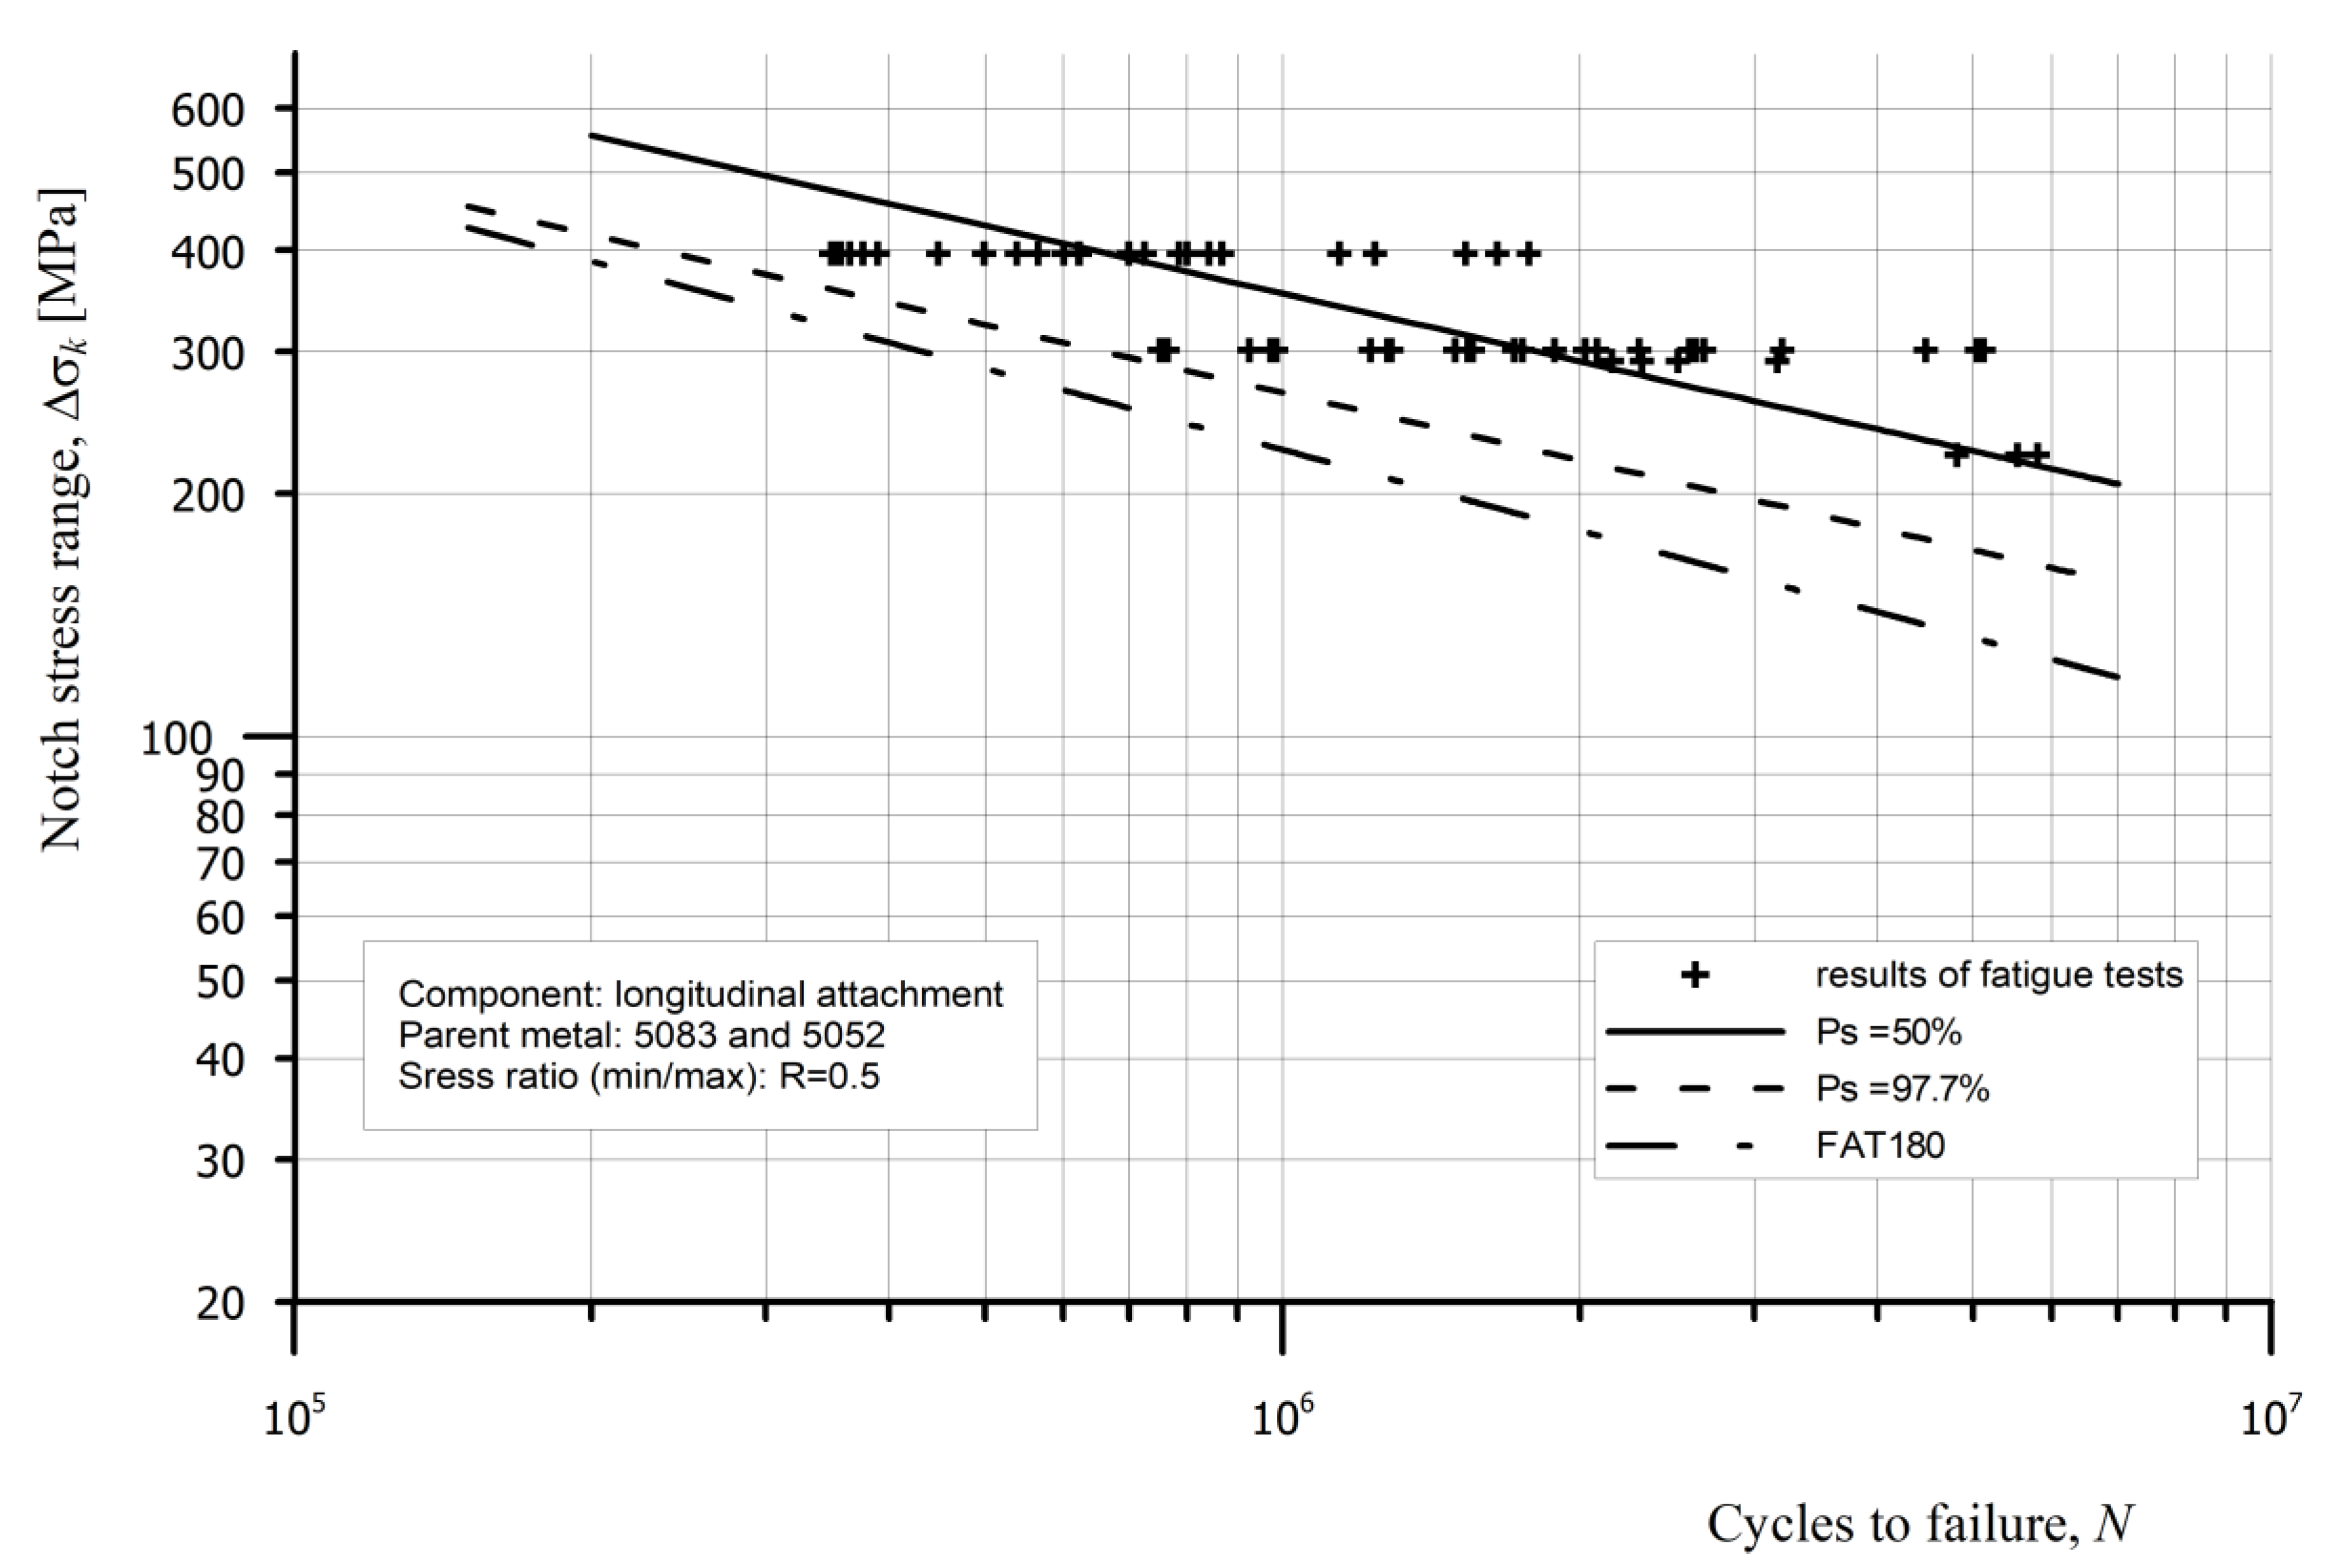
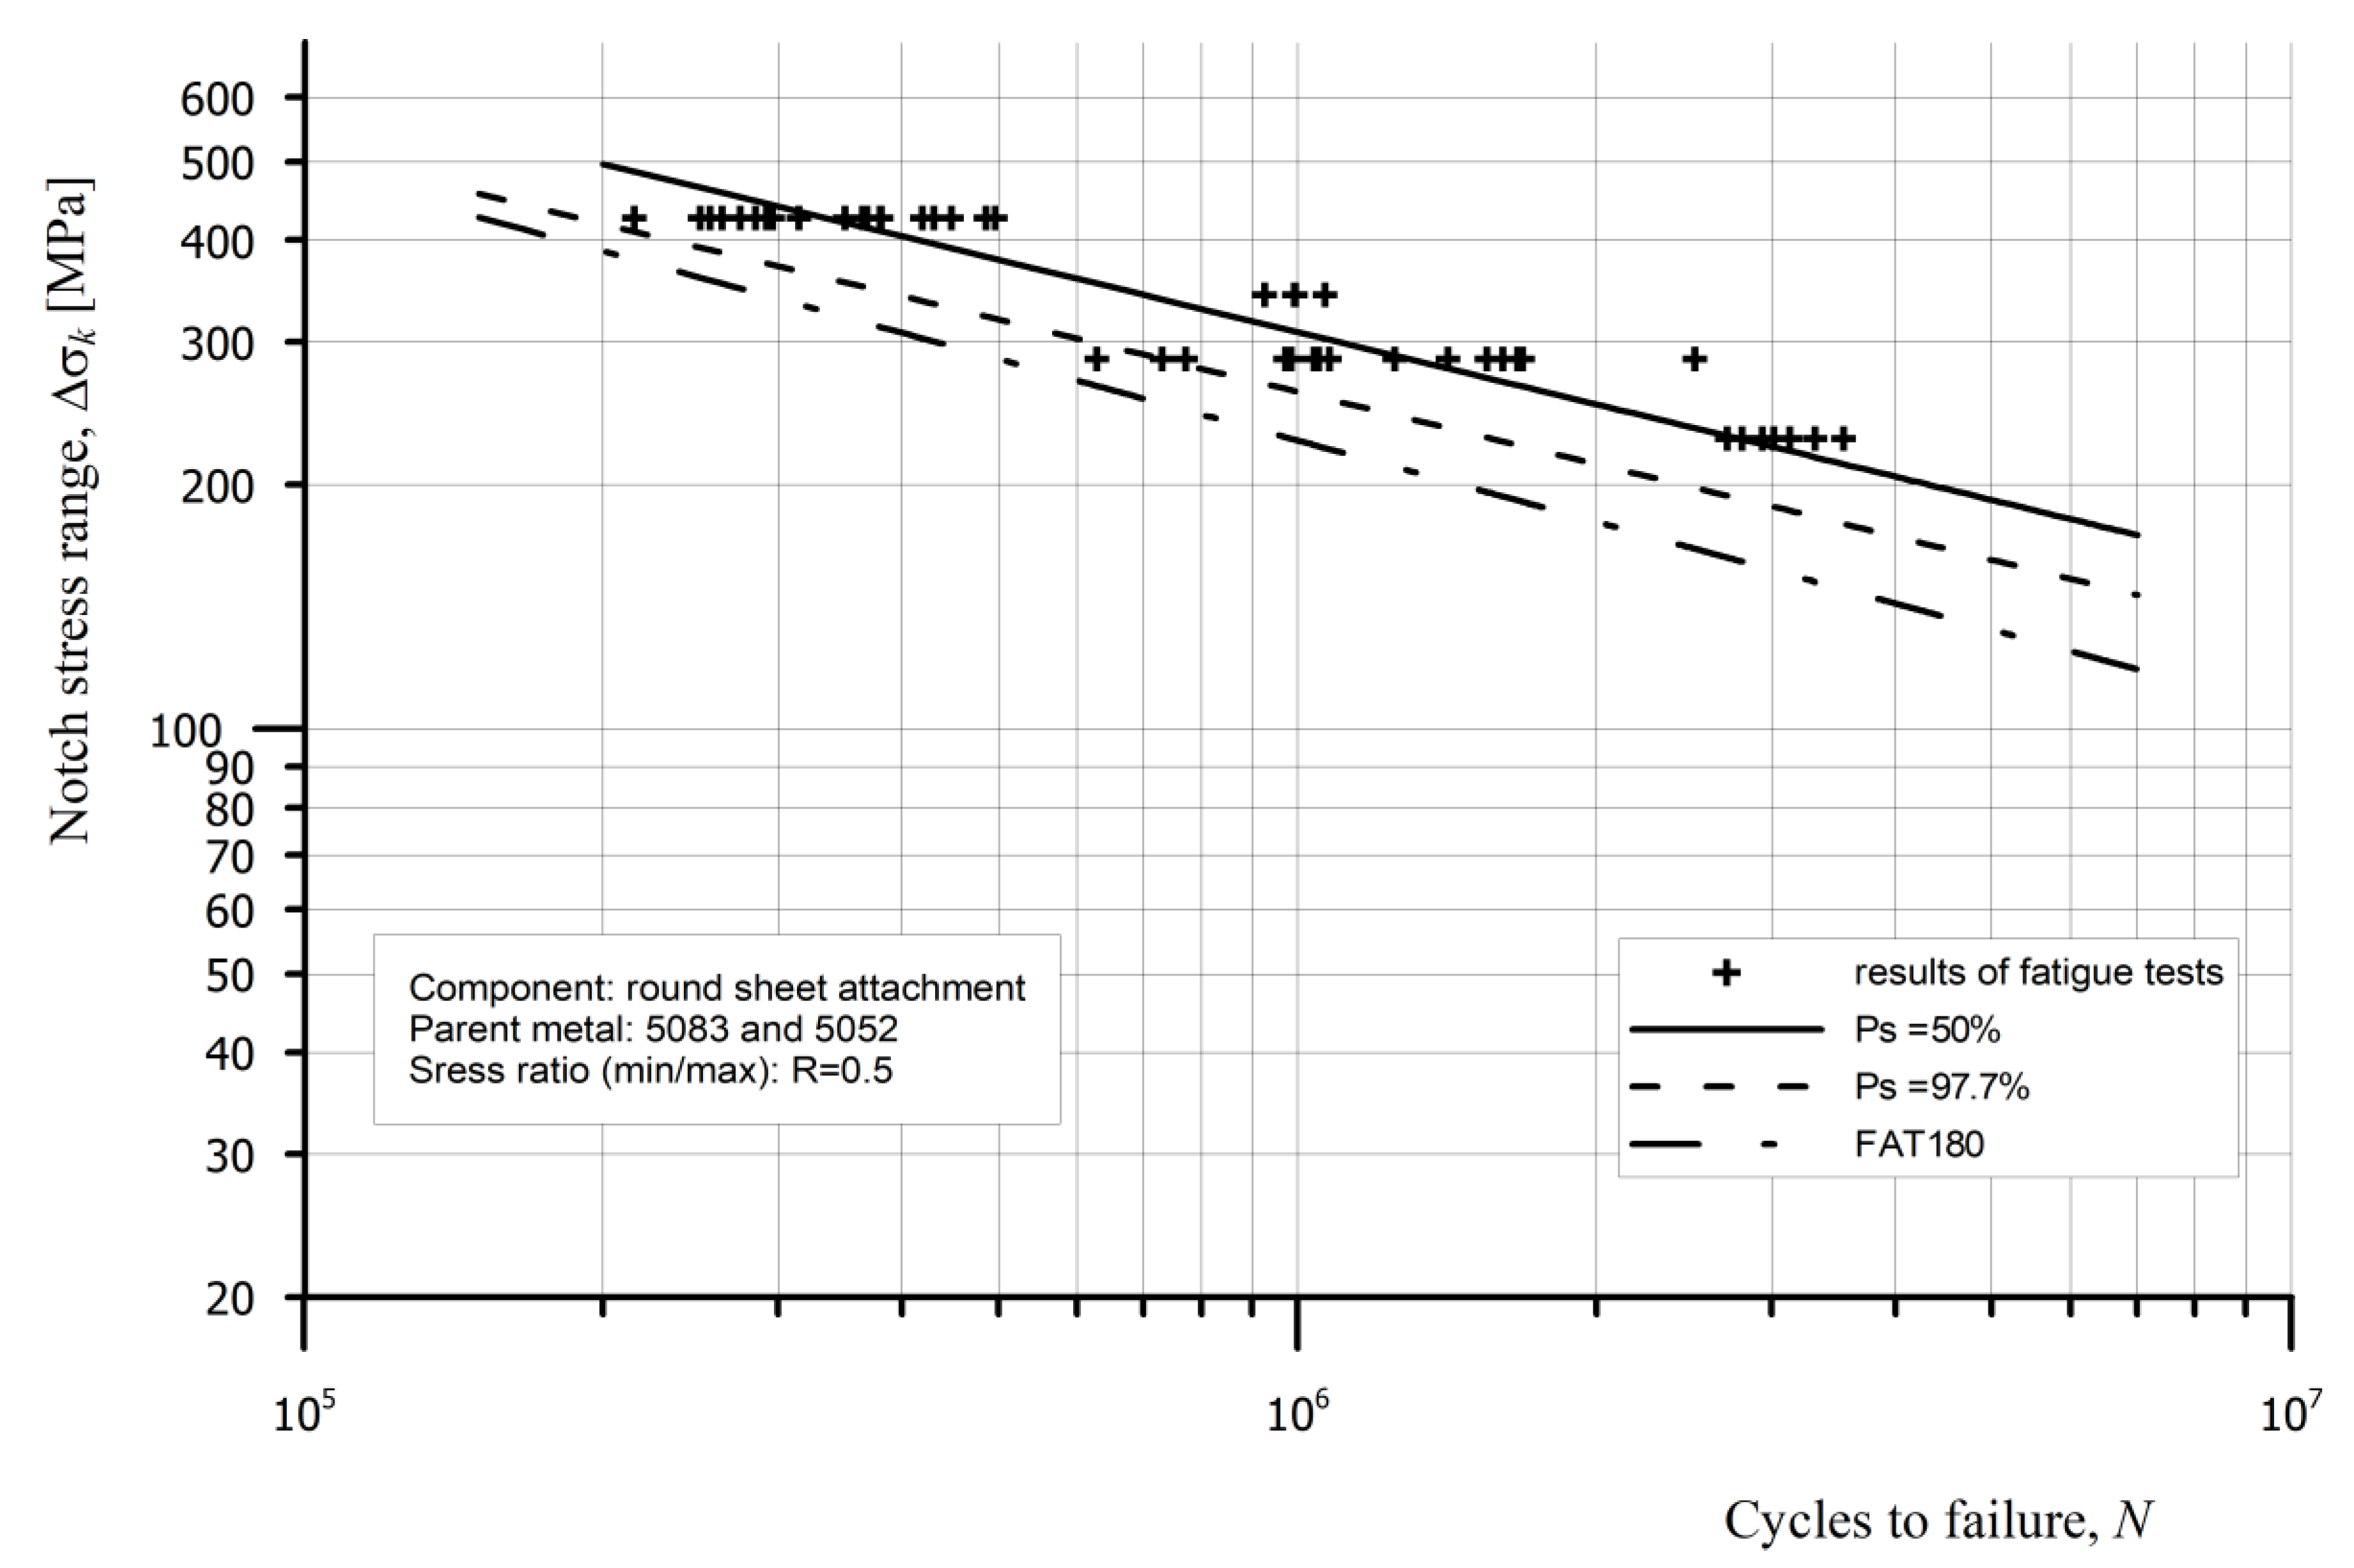
  • Reference radius rref = 0.05 mm: logN = 14.696 – 3.584 · log∆σk for components with longitudinal fillet-welded attachment and logN = 14.165 – 3.380 · log∆σk for components with round sheet fillet welded attachment. The scatter range of stress was Tσ = 1:1.436 and Tσ = 1:1.243, respectively.
The results of fatigue tests, the S–N curves (Ps = 50% and Ps = 97.7%) and the corresponding notch-stress-design S–N curves are presented in Figure 9 and Figure 10 for rref = 1 mm and in Figure 11 and Figure 12 for rref = 0.05 mm.

4. Discussion

In order to compare the notch-stress-design S–N curves with the results of the fatigue tests, a design conservatism factor was calculated. This factor is defined as the ratio between the stress range of the S–N curve (Ps = 97.7%) and the stress range of the corresponding notch-stress-design S–N curve, at Nref = 2 × 10⁶ cycles, Table 4.
The predicted strength for Nref = 2 × 10⁶ cycles, obtained using the reference radius of 0.05 mm and the notch-stress-design curve FAT180, was found to be more conservative than using the reference radius of 1 mm and the notch-stress-design curve FAT71. These differences of 22% and 18% between the fatigue-test stress range and the design S–N curve stress range, for the components with a longitudinal fillet-welded attachment and the ones with a round sheet fillet-welded attachment, resulted in estimated fatigue lives that were 2 and 1.74 times shorter, respectively. Using this approach with a reference radius of 1 mm, the difference was smaller: 18% and 12% of the predicted stress range, respectively, and estimated fatigue lives that were 1.8 and 1.4 times shorter, respectively.

5. Conclusions

In the “IIW recommendations for fatigue assessment of welded structures by notch stress analysis”, two variants of the notch-stress approach depending on the joint thickness are proposed. One with the reference radius rref = 1 mm applies to joints with a thickness of 5 mm and more; the second with the reference radius rref = 0.05 mm applies to joints with a thickness of less than 5 mm. The influence of finite element sizes on the determined stress value at the weld toe, which is modelled with reference radii of rref = 1 mm or rref = 0.05 mm, was investigated. The study shows that models with locally refined meshes in the region of the rounded weld toe give the same results regardless of whether the relative size of the elements, with respect to if the reference radius is rref/10 or rref/5. The accuracy of the determined stress values was confirmed by the convergence test, which also gives consistent results. From these findings, it can be concluded that the mesh density in the region of the rounded weld toe should have a relative size of the elements with respect to the reference radius of rref/5 in order to assess the stress state at the weld.
Both variants of the notch-stress approach were used in the fatigue analysis of joints made of 4 mm thick plates under bending load. A comparison of the proposed S–N curves for notch-stress design with the results of fatigue tests on welded components shows the following:
  • The S–N notch-stress curve FAT71 underestimates fatigue strength: 18% for joints with longitudinal fillet-welded attachments (1.8 times shorter estimated fatigue life) and 12% for joints with round sheet fillet-welded attachments (1.4 times shorter estimated fatigue life),
  • The S–N notch-stress design S–N curve FAT180 underestimates fatigue strength: 22% for joints with longitudinal fillet-welded attachments (2 times shorter estimated fatigue life) and 18% for joints with round sheet fillet-welded attachments (1.74 times shorter estimated fatigue life).
It is evident that welded components subjected to bending loads have better results than suggested by the notch-stress-design S–N curves. This can be attributed to the positive effect of the steep stress gradient and the small negative impact of misalignment, especially for bending loads.
It can be concluded that while both S–N curves for notch-stress design are conservative and usable, they lack the necessary accuracy to effectively optimize material consumption when dealing with components subjected to bending stress. More accurate results for fatigue analysis of joints made of 4 mm thick plates under a bending load can be achieved using the reference radius of 1 mm and the FAT71 S–N curve. However, it is important to note that this approach is primarily recommended for joints with a thickness of 5 mm or more.
Since only two types of welded components were studied, further research is needed to recommend a notch-stress design curve for bending loads that could be used to optimize the material consumption of the ship structure.

Author Contributions

Conceptualization, T.M.; formal analysis, T.M.; methodology, T.M.; investigation, T.M.; supervision, N.V., D.K. and I.P.; validation, N.V.; visualization, T.M.; writing—original draft, T.M.; writing—review and editing, N.V., D.K. and I.P. All authors have read and agreed to the published version of the manuscript.

Funding

This research received no external funding.

Data Availability Statement

Data are available from the corresponding author upon reasonable request.

Conflicts of Interest

The authors declare no conflict of interest.

Nomenclature

Fbending force
Ktnotch-stress concentration factor
Ncycles to failure
Nrefreference fatigue life
Psprobability of survival
Rstress ratio
rrefreference radius
Sstress range
tplate thickness
Tσscatter range of stress
W(x)elastic section modulus
xdistance between the fatigue fracture location and the loading point
Δσstress range
Δσknotch-stress range
σknotch stress (maximum principal stress)
σnnominal stress
σsstructural stress

References

  1. EN 1999-1-3; Eurocode 9: Design of Aluminium Structures—Part 1–3: Structures Susceptible to Fatigue. CEN: Brussels, Belgium, 2011.
  2. Hobbacher, A.F. Recommendations for Fatigue Design of Welded Joints and Components, 2nd ed.; Springer: Cham, Switzerland, 2016. [Google Scholar]
  3. Rennert, R.; Kullig, E.; Vormwald, M.; Esderts, A.; Siegele, D. FKM Guideline: Analytical Strength Assessment of Components Made of Steel, Cast Iron and Aluminum Materials in Mechanical Engineering; VDMA: Frankfurt, Germany, 2012. [Google Scholar]
  4. DNVGL Class Guidelines. DNVGL-CG-0129: Fatigue Assessment of Ship Structures; DNV: Oslo, Norway, 2018. [Google Scholar]
  5. ABS. Guide for Fatigue Assessment of Offshore Structures; American Bureau of Shipping: Houston, TX, USA, 2020. [Google Scholar]
  6. Indian Register of Shipping. IRS-G-DES-07: Guidelines on Fatigue Design Assessment of Ship Structures; Indian Register of Shipping: Mumbai, India, 2021. [Google Scholar]
  7. Radaj, D.; Sonsino, C.M.; Fricke, W.A.F. Fatigue Assessment of Welded Joints by Local Approaches, 2nd ed.; Woodhead Publishing Limited: Cambridge, England, 2006. [Google Scholar]
  8. IACS. Recommendation No. 56: Fatigue Assessment of Ship Structures; International Association of Classification Societies: London, UK, 1999. [Google Scholar]
  9. Tveiten, B.W.; Moan, T. Determination of Structural Stress for Fatigue Assessment of Welded Aluminum Ship Details. Mar. Struct. 2000, 13, 189–212. [Google Scholar] [CrossRef]
  10. Maddox, S.J. Review of Fatigue Assessment Procedures for Welded Aluminium Structures. Int. J. Fatigue 2003, 25, 1359–1378. [Google Scholar] [CrossRef]
  11. Al Zamzami, I.; Susmel, L. On the accuracy of nominal, structural, and local stress based approaches in designing aluminium welded joints against fatigue. Int. J. Fatigue 2016, 101, 137–158. [Google Scholar] [CrossRef] [Green Version]
  12. Corigliano, P.; Crupi, V. Review of Fatigue Assessment Approaches for Welded Marine Joints and Structures. Metals 2022, 12, 1010. [Google Scholar] [CrossRef]
  13. Brennan, F.P.; Peleties, P.; Hellier, A.K. Predicting weld toe stress concentration factors for T and skewed T-joint plate connections. Int. J. Fatigue 2000, 22, 573–584. [Google Scholar] [CrossRef]
  14. Iida, K.; Uemura, T. Stress concentration factor formulas widely used in Japan. Fatigue Fract. Eng. Mater. Struct. 1995, 19, 779–786. [Google Scholar] [CrossRef]
  15. Radaj, D.; Zhang, S. Multiparameter Design Optimisation in Respect of Stress Concentrations. In Engineering Optimization in Design Processes; Eschenauer, H.A., Mattheck, C., Olhoff, N., Eds.; Springer: Berlin, Germany, 1991; Volume 63, pp. 181–189. [Google Scholar]
  16. Anthes, R.J.; Köttgen, V.B.; Seeger, T. Kerbformzahlen von Stumpfstößen und Doppel-T-Stößen. Schweißen Schneid. 1993, 45, 685–688. [Google Scholar]
  17. Randić, M.; Pavletić, D.; Fabić, M. Evaluation of the Stress Concentration Factor in Butt Welded Joints: A Comparative Study. Metals 2021, 11, 411. [Google Scholar] [CrossRef]
  18. Fricke, W. IIW Recommendations for the Fatigue Assessment of Welded Structures by Notch Stress Analysis: IIW-2006-09; Woodhead Publishing Limited: Cambridge, UK, 2012. [Google Scholar]
  19. Zhang, G.; Richter, B. A new approach to the numerical fatigue-life prediction of spot-welded structures. Fatigue Fract. Eng. Mater. Struct. 2000, 23, 499–508. [Google Scholar] [CrossRef]
  20. Karakas, Ö.; Morgenstern, C.; Sonsino, C.M. Fatigue design of welded joints from the wrought magnesium alloy AZ31 by the local stress concept with the fictitious notch radii of rf=1.0 and 0.05 mm. Int. J. Fatigue 2008, 30, 2210–2219. [Google Scholar] [CrossRef]
  21. Zhang, G. Method of effective stress for fatigue: Part I – A general theory. Int. J. Fatigue 2012, 37, 17–23. [Google Scholar] [CrossRef]
  22. Baumgartner, J. Review and considerations on the fatigue assessment of welded joints using reference radii. Int. J. Fatigue 2017, 101, 459–468. [Google Scholar] [CrossRef]
  23. Baumgartner, J.; Hobbacher, A.F.; Rennert, R. Fatigue assessment of welded thin sheets with the notch stress approach—Proposal for recommendations. Int. J. Fatigue 2020, 140, 105844. [Google Scholar] [CrossRef]
  24. Sonsino, C.M. A Consideration of Allowable Equivalent Stresses for Fatigue Design of Welded Joints According to the Notch Stress Concept with the Reference Radii rref = 1.00 and 0.05 mm. Weld. World 2009, 53, R64–R75. [Google Scholar] [CrossRef]
  25. Pan, X.; Gu, Z.; Qiu, H.; Feng, A.; Li, J. Study of the Mechanical Properties and Microstructural Response with Laser Shock Peening on 40CrMo Steel. Metals 2022, 12, 1034. [Google Scholar] [CrossRef]
  26. Gakias, C.; Maliaris, G.; Savaidis, G. Investigation of the Shot Size Effect on Residual Stresses through a 2D FEM Model of the Shot Peening Process. Metals 2022, 12, 956. [Google Scholar] [CrossRef]
  27. Scharf-Wildenhain, R.; Haelsig, A.; Hensel, J.; Wandtke, K.; Schroepfer, D.; Kromm, A.; Kannengiesser, T. Influence of Heat Control on Properties and Residual Stresses of Additive-Welded High-Strength Steel Components. Metals 2022, 12, 951. [Google Scholar] [CrossRef]
  28. Sausto, F.; Tezzele, C.; Beretta, S. Analysis of Fatigue Strength of L-PBF AlSi10Mg with Different Surface Post-Processes: Effect of Residual Stresses. Metals 2022, 12, 898. [Google Scholar] [CrossRef]
  29. Bertil Jonsson, G.; Dobmann, A.F.; Hobbacher, M.; Kassner, G. IIW Guidelines on Weld Quality in Relationship to Fatigue Strength; Springer: Cham, Switzerland, 2016. [Google Scholar]
  30. IACS. Unified Requirement UR W25: Aluminium Alloys for Hull Construction and Marine Structure; Rev.6; International Association of Classification Societies: London, UK, 2021. [Google Scholar]
  31. Pedersen, M.M.; Mouritsen, O.Ø.; Hansen, M.R.; Andersen, J.G.; Wenderby, J. Re-analysis of fatigue data for welded joints using the notch stress approach. Int. J. Fatigue 2010, 32, 1620–1626. [Google Scholar] [CrossRef] [Green Version]
  32. EN 1011-1:2009; Welding—Recommendations for Welding of Metallic Materials—Part 1: General Guidance for Arc Welding. CEN: Brussels, Belgium, 2009.
  33. EN 1011-4:2000; Welding—Recommendations for Welding of Metallic Materials—Part 4: Arc Welding of Aluminium and Aluminium Alloys. CEN: Brussels, Belgium, 2000.
  34. ISO 10042:2018; Welding—Arc-Welded Joints in Aluminium and Its Alloys—Quality Levels for Imperfections. ISO: Geneva, Switzerland, 2018.
  35. Matic, T. Definition of Input Stress for the Fatigue Strength Assessment of Welded Aluminium Structures. Ph.D. Thesis, University of Split, Split, Croatia, 2003. [Google Scholar]
  36. Chmelko, V.; Harakaľ, M.; Žlábek, P.; Margetin, M.; Ďurka, R. Simulation of Stress Concentrations in Notches. Metals 2022, 12, 43. [Google Scholar] [CrossRef]
  37. Matic, T.; Domazet, Z. Determination of structural stress for fatigue analysis of welded aluminium components subjected to bending. Fatigue Fract. Eng. Mater. Struct. 2005, 28, 835–844. [Google Scholar] [CrossRef]
  38. Domazet, Z.; Matic, T. Material Strength Influence on Fatigue Properties of Welded Aluminium Alloys. In Proceedings of the 21st Danubia-Adria Symposium on Experimental Methods in Solid Mechanics, Brijuni, Croatia, 29 September 2004. [Google Scholar]
  39. ISO/TR 14345:2012; Fatigue—Fatigue Testing of Welded Components—Guidance. ISO: Geneva, Switzerland, 2012.
Figure 1. Schematic presentation of stress distribution near the weld toe.
Metals 13 01133 g001
Figure 2. The fatigue testing machine.
Metals 13 01133 g002
Figure 3. Test component with longitudinal fillet-welded attachment (a), and component with round sheet fillet-welded attachment (b), [35].
Metals 13 01133 g003
Figure 4. Fatigue fracture locations (marked 1 and 2) on the component with longitudinal fillet-welded attachment and on the component with round sheet fillet- welded attachment..
Metals 13 01133 g004
Figure 5. The applied loading-force location.
Metals 13 01133 g005
Figure 6. Three-dimensional finite element models in detail: (a) component with longitudinal fillet-welded attachment (rref = 1 mm, finite element size rref/10), (b) component with round sheet fillet-welded attachment (rref = 1 mm, finite element size rref/5), (c) component with longitudinal fillet-welded attachment (rref = 0.05 mm, finite element size rref/5) and (d) component with round sheet fillet-welded attachment (rref = 0.05 mm, finite element size rref/5).
Metals 13 01133 g006
Figure 7. Maximum principal stress distribution: (a) component with longitudinal fillet welded attachment, rref = 1 mm (F = 50 N), (b) component with round sheet fillet-welded attachment, rref = 1 mm (F = 46 N), (c) component with longitudinal fillet-welded attachment, rref = 0.05 mm (F = 50 N) and (d) component with round sheet fillet-welded attachment, rref = 0.05 mm (F = 46 N).
Metals 13 01133 g007
Figure 8. Distribution of the maximum principal stress along the component symmetry plane (fatigue fracture location 2): (a) component with longitudinal fillet-welded attachment and (b) component with round sheet fillet-welded attachment.
Metals 13 01133 g008
Figure 9. Fatigue test data, S–N curves and the corresponding notch-stress-design S–N curve, rref = 1 mm longitudinal fillet welded attachment (data from [37]).
Metals 13 01133 g009
Figure 10. Fatigue test data, S–N curves and the corresponding notch-stress-design S–N curve, rref = 1 mm round sheet fillet-welded attachment (data from [37]).
Metals 13 01133 g010
Figure 11. Fatigue test data, S–N curves and the corresponding notch-stress-design S–N curve, rref = 0.05 mm longitudinal fillet-welded attachment (data from [37]).
Metals 13 01133 g011
Figure 12. Fatigue test data, S–N curves and the corresponding notch-stress-design S–N curve, rref = 0.05 mm round sheet fillet-welded attachment (data from [37]).
Metals 13 01133 g012
Table 1. Description of the materials of the components, the welding procedure and the welding parameters (Young’s modulus 72,000 MPa, Poisson’s ratio 0.33).
Component
(Number of Components)
Parent MetalFiller MetalWelding ProcedureWelding Current, [A]Welding Voltage, [V]
Longitudinal attachment
(60)
AlMg4.5Mn-O (5083-O)AlMg5TIG14022
AlMg2.5-H32
(5052-H32)
AlMg3TIG14022
Round sheet attachment
(50)
AlMg4.5Mn-O (5083-O)AlMg5TIG14022
AlMg2.5-H32
(5052-H32)
AlMg3TIG14022
Table 2. Nominal stress σn and notch-stress values σk (FL1–fatigue fracture location 1, FL2–fatigue fracture location 2).
ComponentNominal Stress [MPa]Notch Stress (rref = 1 mm) [MPa]Notch Stress (rref = 0.05 mm) [MPa]
FL 1FL 2FL 1FL 2FL 1FL 2
Longitudinal attachment20.1232.3459.2281.78156.23213.68
Round sheet attachment20.2428.4953.6766.83144.37178.54
Table 3. The notch-stress concentration factors, Kt (FL1–fatigue fracture location 1, FL2–fatigue fracture location 2).
ComponentNotch-Stress Concentration Factor
(rref = 1 mm)
Notch-Stress Concentration Factor
(rref = 0.05 mm)
FL 1FL 2FL 1FL 2
Longitudinal attachment2.942.537.766.61
Round sheet attachment2.652.357.136.27
Table 4. Design conservatism factor.
ComponentNotch-stress Range–Fatigue Test Results [MPa]Design Conservatism Factor
rref = 1 mmrref = 0.05 mmrref = 1 mmrref = 0.05 mm
Longitudinal attachment83.84219.981.181.22
Round sheet attachment79.24212.041.121.18
Disclaimer/Publisher’s Note: The statements, opinions and data contained in all publications are solely those of the individual author(s) and contributor(s) and not of MDPI and/or the editor(s). MDPI and/or the editor(s) disclaim responsibility for any injury to people or property resulting from any ideas, methods, instructions or products referred to in the content.

