Article

Effect of Residual Stress on Mode-I Stress Intensity Factor: A Quantitative Evaluation and a Suggestion of an Estimating Equation

School of Mechanical Engineering, Hanoi University of Science and Technology, 1A-Dai Co Viet Street, Hai Ba Trung District, Hanoi 100000, Vietnam
*
Author to whom correspondence should be addressed.
Metals 2023, 13(6), 1132; https://doi.org/10.3390/met13061132
Submission received: 14 May 2023 / Revised: 5 June 2023 / Accepted: 14 June 2023 / Published: 16 June 2023
(This article belongs to the Section Welding and Joining)

Abstract

:
An extensive literature review was conducted primarily to develop a comprehensive understanding of the quantitative behavior of residual stress (RS) distribution in weld joints. Based on prior data, various levels of the peak RS and distribution profiles were applied to a finite element analyses (FEA) model as an initial loading to evaluate the effect of RS on the Mode-I stress intensity factor (SIF), KI. The RS was not found to have a significant effect on the SIF values when the peak RS was less than 300 MPa. The enhanced effect of RS on the KI values was found to be more pronounced at a lower crack ratio, while the analytical form of the RS distribution had a minor effect. The effective boundary corrections function, FResidual, was derived under the effect of RS for 1T CT specimen for various crack geometries of the crack ratio, (a/W) of 0.2, 0.40, 0.50, 0.60, and 0.75, and with peak RS varying from 100 MPa to 600 MPa. The obtained effective function of KI can be employed to quantitatively evaluate the effect of RS on the fatigue performance of welded joints.

1. Introduction

The manufacturing of structural engineering components generally requires various mechanical joining and fastening processes. Among these, welding is the most common fabrication process utilized for metal joining within the industry. This process is much more efficient than other mechanical fastening processes such as riveting, bolting, casting, etc. Welded structures can produce a permanent joint with mechanical properties equal to or even superior to those of base materials. In addition, welded joints may require fewer installation steps and provide lower repair costs for engineering structures [1,2,3]. In general, the mechanical performance of a weldment is strongly influenced by various parameters of the welding process such as thermal condition, welding materials, welding speeds, and the geometrical shape of the groove [4,5,6,7,8,9,10,11]. However, in a comprehensive study analyzing engineering failures, premature cracking and related failures of structural engineering components were often observed in weld joints due to high local stress concentration, the microstructure being heterogenous, and the presence of RS [12,13,14,15]. In almost all cases, the welding RS was found to be the primary contributor [16,17]. Therefore, knowledge of the mechanical performance of weld joints under the effect of RS is crucial for the reliable performance of structural components.
The principal generation of RS in weldment is generally attributed to the non-uniform contraction and expansion of the fusion zone and the surrounding materials under the effect of temperature variation during the welding process [18,19,20,21]. Where RS is present, the regions around and inside the weld zone have usually experienced thermal cycles such as a rapidly increased temperature near the melting temperature followed by a subsequent drop to a low temperature. Specifically, the material layers near the outer surfaces of the weldment usually have a higher cooling rate compared with those of the inside region due to free exposure to an open-air environment. This temperature variation also leads to heterogeneous expansion and contraction along the cross-section of the weldment. The interaction between the welding thermal cycle and the metal lattices of the materials may cause a drastic change in the microstructural characteristics of the materials in the sub-region of a weld joint, which induces microstructure variations in the heat-affected zone (HAZ) [22,23,24]. While the temperature at the region in the core zone of the welding pool is still high, the nonuniform contraction of the material at a lower temperature region near the outer surface may generate tensile/compressive stresses: so-called RS at the outer surface region and in the interior of the weldment, respectively. Therefore, various practical techniques have been employed to eliminate the effect of heterogeneous microstructures as well as improve the cracking resistance of the weld joint [25,26,27].
In general, to accurately assess the performance of welded structures, the lab-scale tested sample should be machined directly from the welded joint [28]. Figure 1 exhibits a typical schematic illustration of sampling positions of the fracture toughness and fatigue crack growth test specimen in a weld joint. The thickness direction of the sample was machined in parallel to the fusion zone, and depending on the purpose of the tests, the interested region should be located at either the center of the weld zone or the heat-affected zone. Specifically, the position of the crack tip and the direction of fatigue pre-crack initiation should be aligned with the fusion zone. Although a portion of the RS can be released in small-scale specimens and during the sampling process, RS still has a significant influence on fatigue crack growth behavior and should be considered [29,30,31]. It was also noted that a considerable tensile RS remained in the region surrounding the crack tip region after performing fatigued pre-crack, and this had a significant influence on the subsequent fracture, which was reported by Moshayedi et al. [32]. To completely elucidate the influence of RS on the mechanical performance of welding joints, the state of RS should be clarified first. A tensile RS was found to be a main factor enhancing the occurrence of brittle fracture, enhancing stress corrosion cracking, and accelerating the fatigue crack growth (FCG) rate. Recent results reported in the literature also suggest that RS has an important influence on the fatigue crack growth behavior rate of welded material, especially at the low-loading regime near the fatigue crack threshold region [30,33,34,35]. However, the effect of RS on the FCGR properties of materials is more complicated due to the continuous redistribution of RS during the propagation processing of the crack [36]. On the other hand, an RS under a compressive state will normally enhance the fatigue strength and make the fatigue crack propagation redundant. Therefore, to eliminate the negative effect of RS, various advanced welding techniques and pre-welding processes have been employed to release the tensile RS. Normalizing the heat treatment of welded components has been shown to be the most effective method for homogenizing the microstructure distribution in different weld zones, hence improving the performance and fatigue strength of weld joints [37,38,39,40].
In general, the remaining life assessment involves step-by-step analysis of crack growth increment based on knowledge of SIFs resulting from applied and residual stress. Therefore, an accurate evaluation of SIFs plays a key role in reliable fatigue crack growth assessment. It is also evident that RS causes unfavorable effects on fatigue crack propagation behavior as well as on the fracture strength of welded joints. Therefore, investigation of the behavior of a crack under the effect of residual stress is very important for reliably evaluating fatigue crack growth data as well as to ensure the long-term safety and reliability of components. To the best of our knowledge, although there is extensive research on the effect of RS on the mechanical performance of weldment under various loading conditions, a quantitative evaluation of RS on the SIFs has yet to be undertaken. In this study, the behavior of RS distribution on the weld joint is reviewed. Based on the results of prior research, various peak values and distribution profiles are applied to the FEA model as an initial loading condition to examine the influences of welding RS on the function of SIFs. A detailed investigation of the relationship between RS levels and SIFs assists in evaluating the effect of RS on fatigue strength and the FCGR properties of materials.

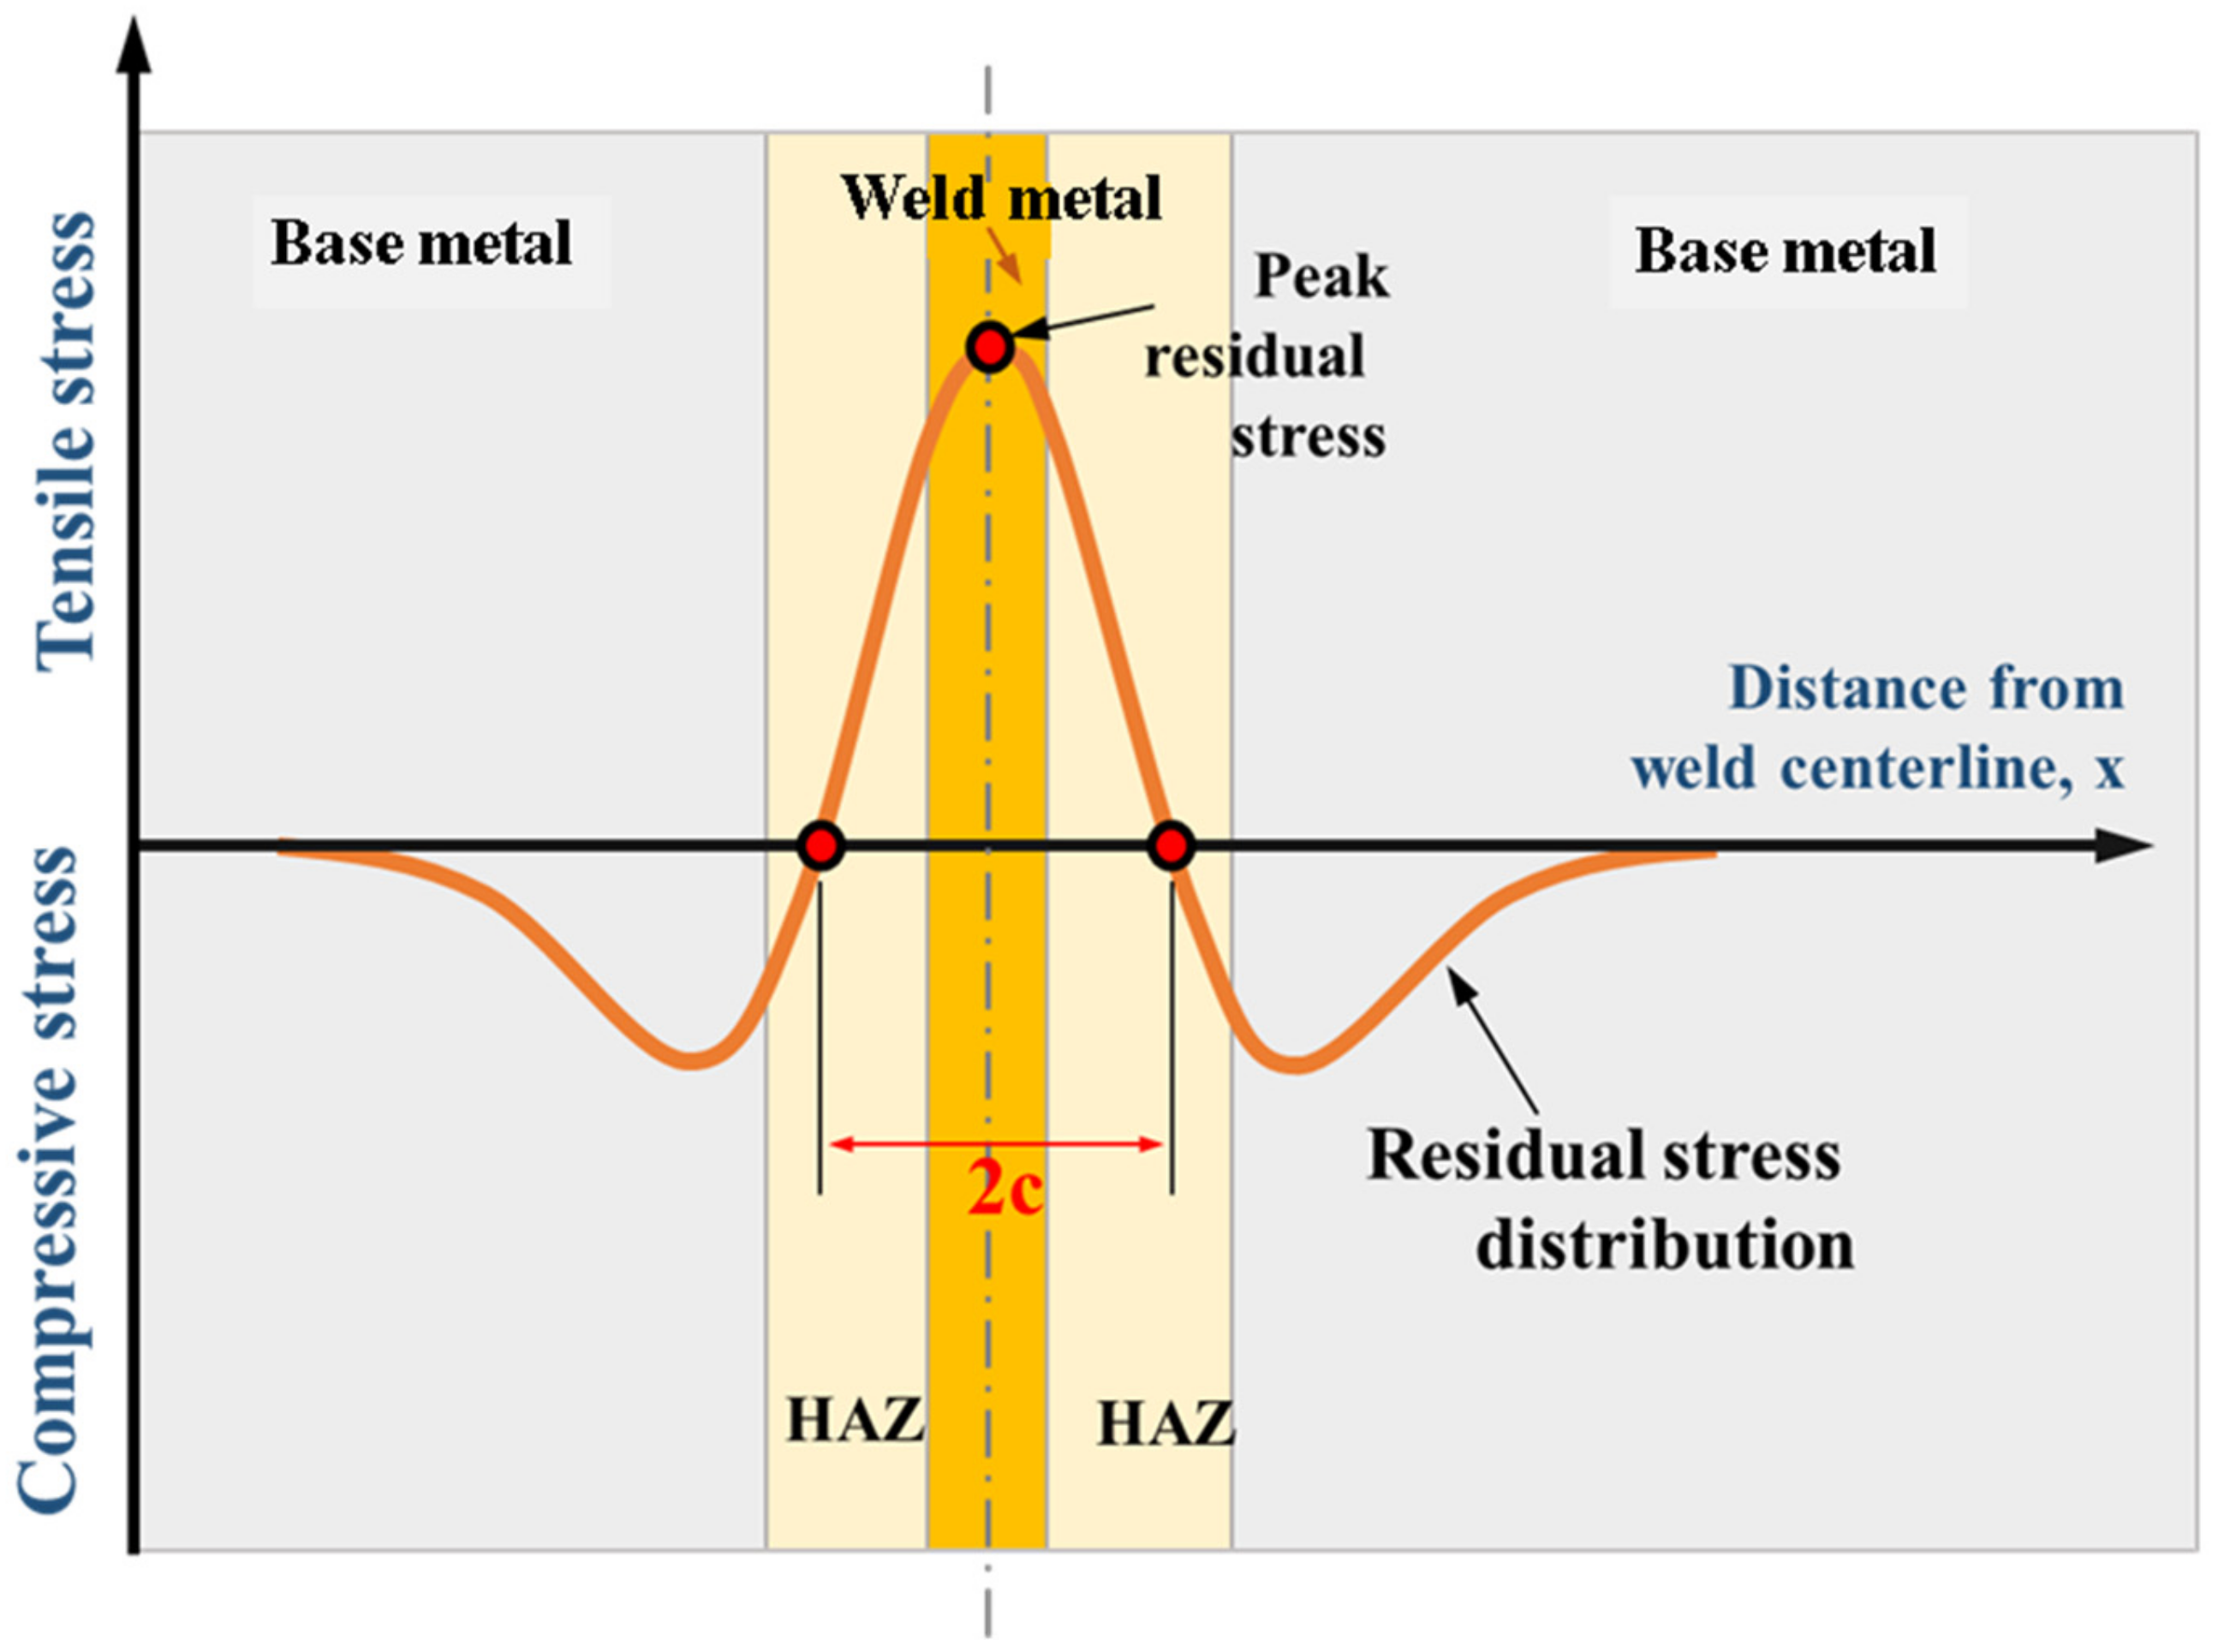
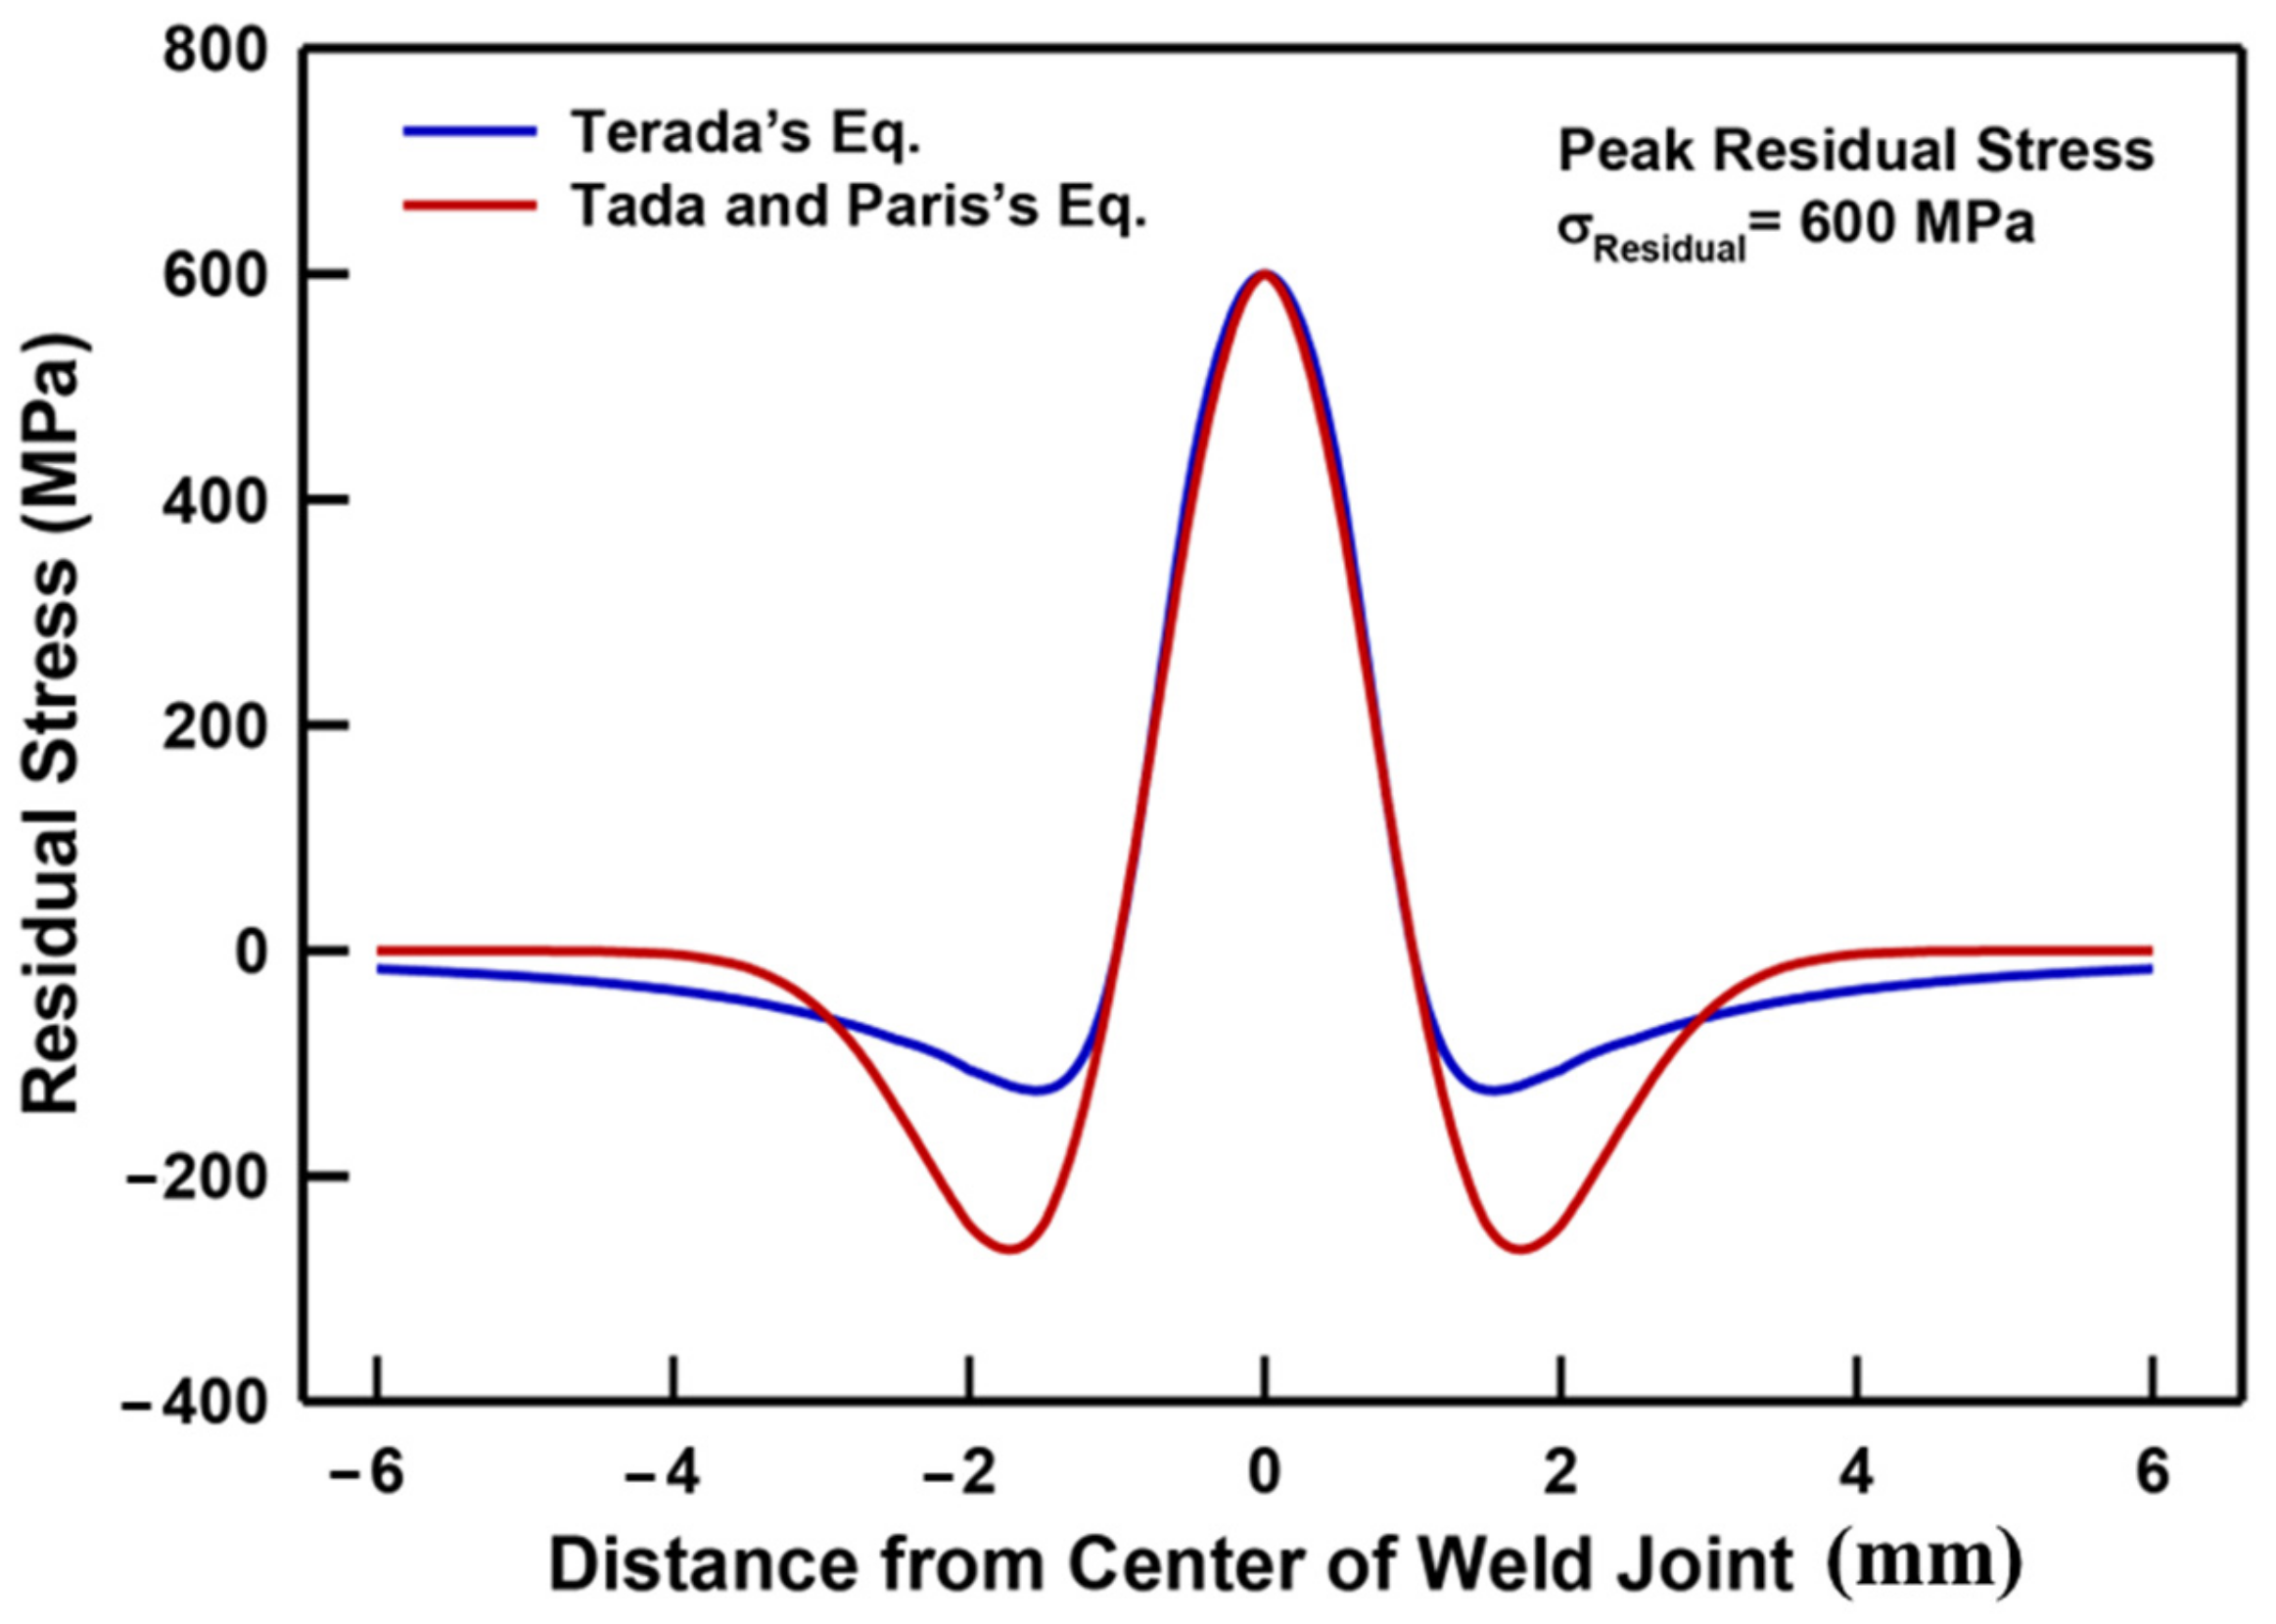
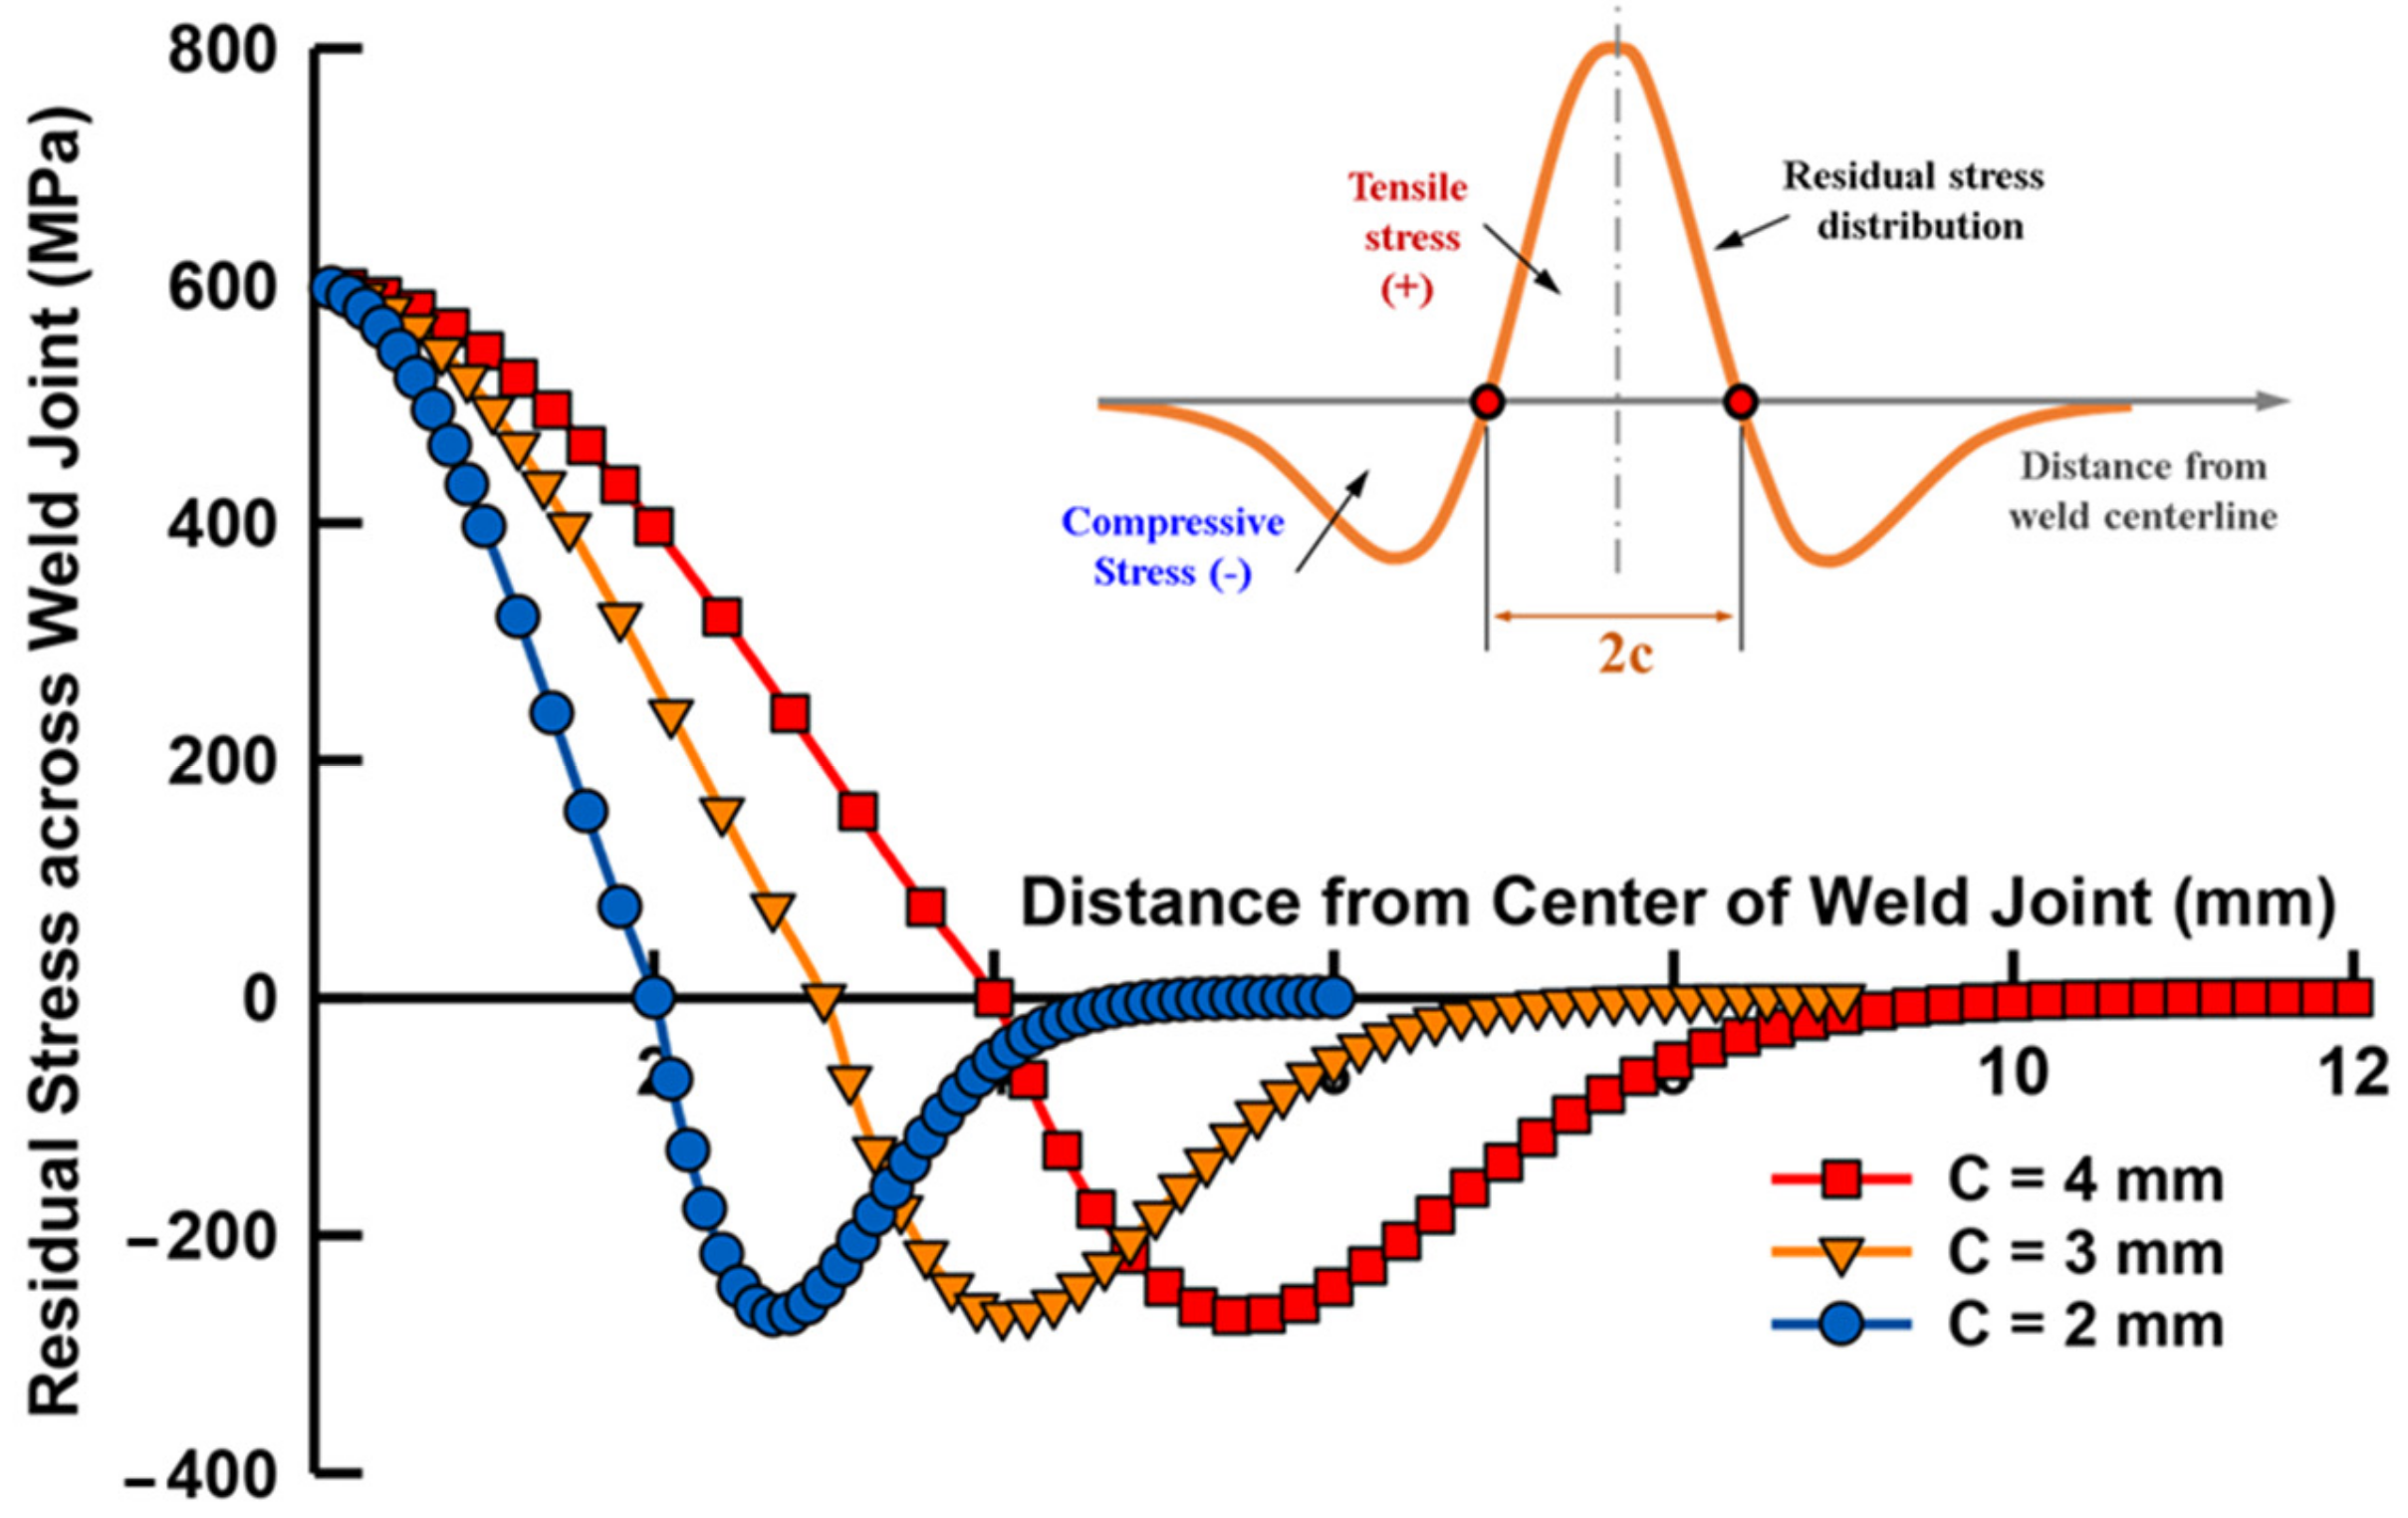
2. Residual Stress Distribution: A Review

In general, the specification of the RS distribution can be classified based on the scale (macro-scale and micro-scale) or state (tension and compression) at which they exist within engineering structures. The macro-scale considers the distribution of RS in a much larger area than the micro-scale, which may exist either at the grain boundaries or inside a grain of material. On the other hand, the stress state is dependent on the local position and type in which non-uniform volumetric change takes place. While a tensile RS often exists in the fusion zone and heat-affected zone (HAZ), compressive RS mostly generates in locations toward the base material. The existing literature has indicated that characteristics of RS in a weld joint are a function of several factors including the structure geometries, the type of weld joint, the welding passes, heat input, material properties, and many other welding process sequencing parameters. Table 1 summarizes the RS distribution with the distance from the weld center of various materials [41,42,43,44]. A consistent trend can be seen in that the RS distribution curves can be schematically divided into two regions that correspond to tensile and compression states. The peaks of tensile RS for fully welded sections generally take place at the middle thickness of the weld zone. As the distance from the center of the weld joint increases, the RS decreases sharply to zero, and, inversely, turns into a compressive state. The valley of the compression RS is usually located in the vicinity of the heat-affected zone toward the base materials. However, it should be noted that the stress distribution also varies, depending on the morphology of the specimen geometries. For example, the welded plate sample mostly produces residual tensile stress at the weld zone and compression stress at the HAZ region. For a thin pipe, since temperature distribution is even across the thickness, the values of radial RS on the outer and inner surfaces are nearly identical. However, the total difference in the RS distribution can be observed between the inner and outer surfaces of a thick-wall pipe sample. A compressive RS is often observed at the inner surface, while the tensile RS exists at the outer surface [41]. Wang et al. reported that welding using the activated flux tungsten inert gas (A-TIG) method can produce a lower tensile RS compared with tungsten inert gas for ferritic P92 steel [42]. Deng reported that insignificant RS exists in the weld joint of low-carbon steel (S15C), while a considerable RS is present in the weld zone of medium-carbon steel (S45C) using tungsten inert arc welding [43]. It is also apparent that peak tensile RS is proportional to the yield strength of materials. Farajian indicated that while the portion under the compressive state is nearly identical, the peak RS under a tensile state of the higher yield strength materials was significantly higher than that at the lower yield strength grade [44].
Since the magnitude and distribution of RS play key roles in the failure mechanisms of welded structures, an accurate investigation of RS distribution is important for assessing its influence on the working performance of the engineering structural component. Figure 2 presents a typical RS distribution of weld joints. The distribution of RS generated by the butt weld for the infinite plate is represented by a function as follows [45]:
σ R e s i d u a l x =   σ o e 0.5 x 2 1 x 2
where σ0 is the peak tensile stress at the middle of the weld zone, and x is the distance from the center line of the weld zone. Another expression, proposed by Tera and Paris, is as follows [46]:
σ R e s i d u a l x =   σ o 1 x 2 1 x 4
Since the portion of the residual distribution under the tensile state is nearly identical, employing either Equation (1) or Equation (2) as the function of RS distribution depends on the characteristics of RS under a compressive state, as well as on the sample geometries, as the residual distribution strongly depends on sample geometries such as plate and pipe components. Usually, a tensile RS would be generated at the fusion zone on the weldment of the steel plate, while compressive RS can be found mostly in the HAZ zone. Therefore, the investigation of the RS distribution in multi-pass welding is often substantially more complicated than in single-welding passes. Once magnitude and distribution are defined, the RS can be taken into a service loading, as the secondary stresses affect the fracture mechanisms and increase failure risk.
As shown in Figure 3, there are two important geometrical parameters on the distribution profile curves. One is the peak value of tensile RS, which depends on various welding process parameters and especially on the properties of materials. It was reported that a higher-strength material has a higher RS due to scale with the yield strength of the material. Another is the c value, which is the distance from the delimitation point between the tensile and compressive state of RS to the center line of the weld zone. When one of these two parameters changes, the shape of the RS distribution will be altered, corresponding to the effective area of RS of the welded sample. Figure 3 illustrates a comparison of the RS distribution with variations in the peak stress according to Equations (1) and (2). It can be seen that while the portion under the tensile RS of two data curves is nearly identical, the absolute values of valley compressive stress expressed in Equation (1) are lower compared with those in Equation (2). Figure 4 shows a comparison of the RS for various c values. As shown, the effective area due to the RS is significantly broadened when the delimitation parameter of the RS distribution curve (c values) is increased.

3. Finite Element Analyses

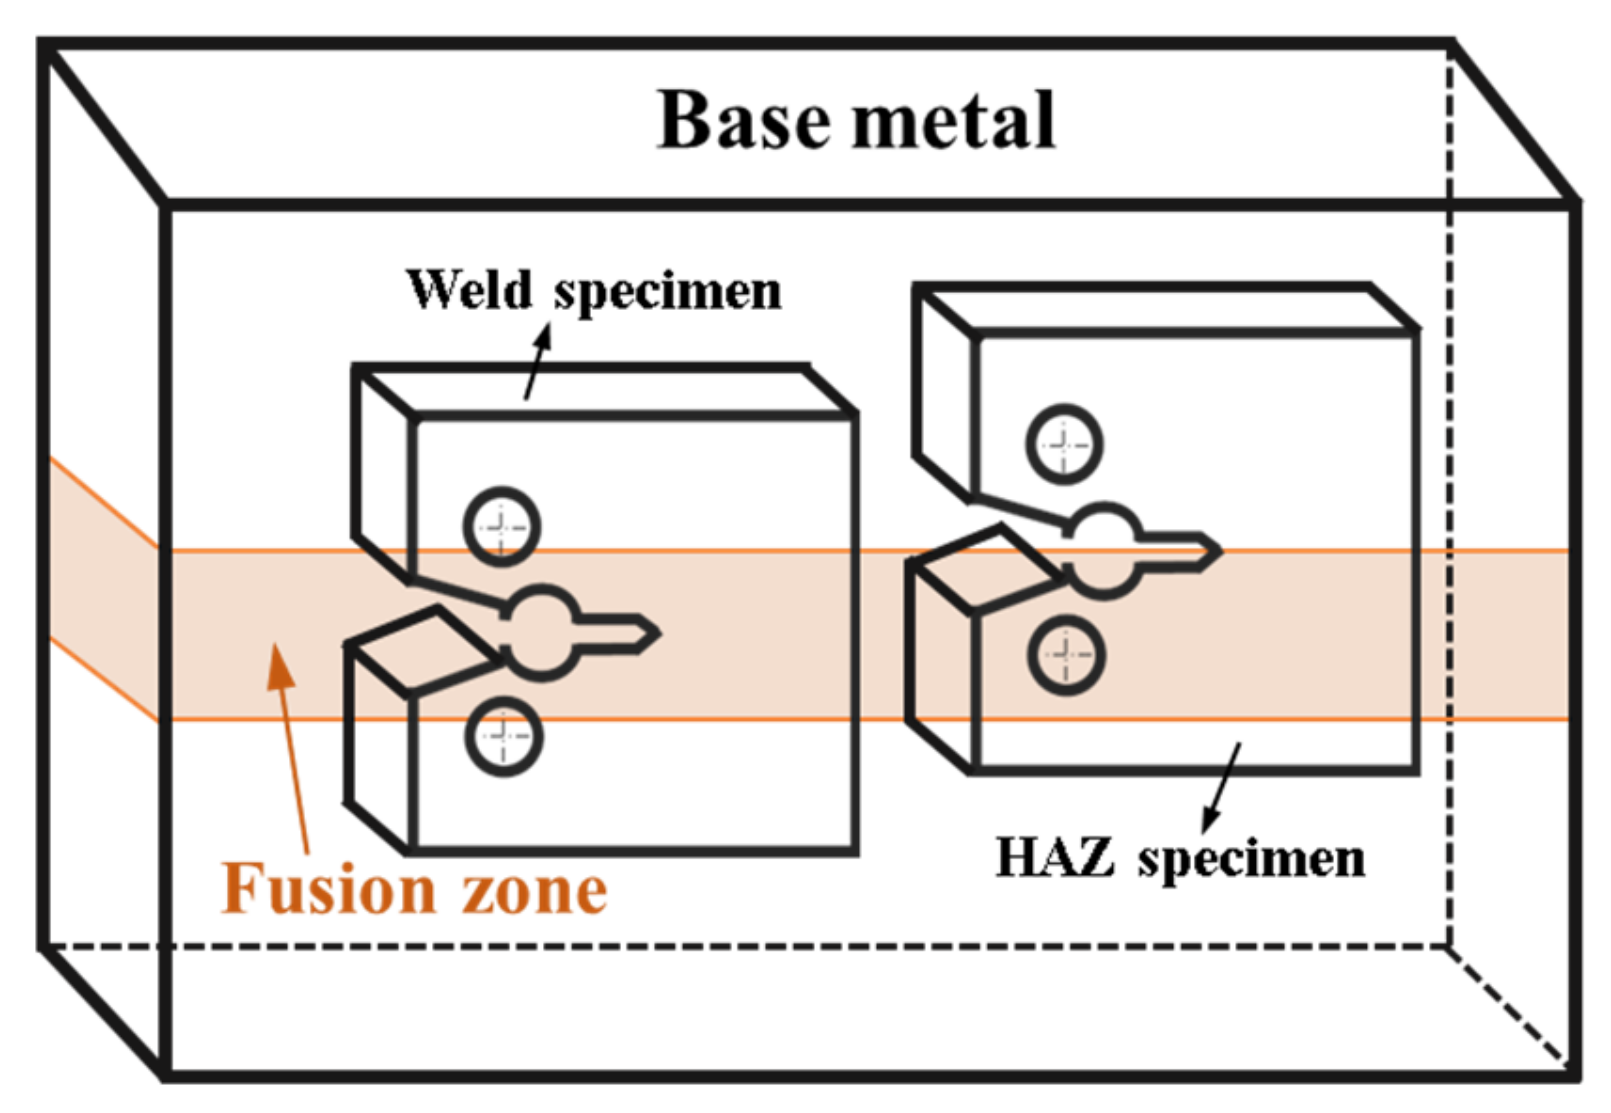
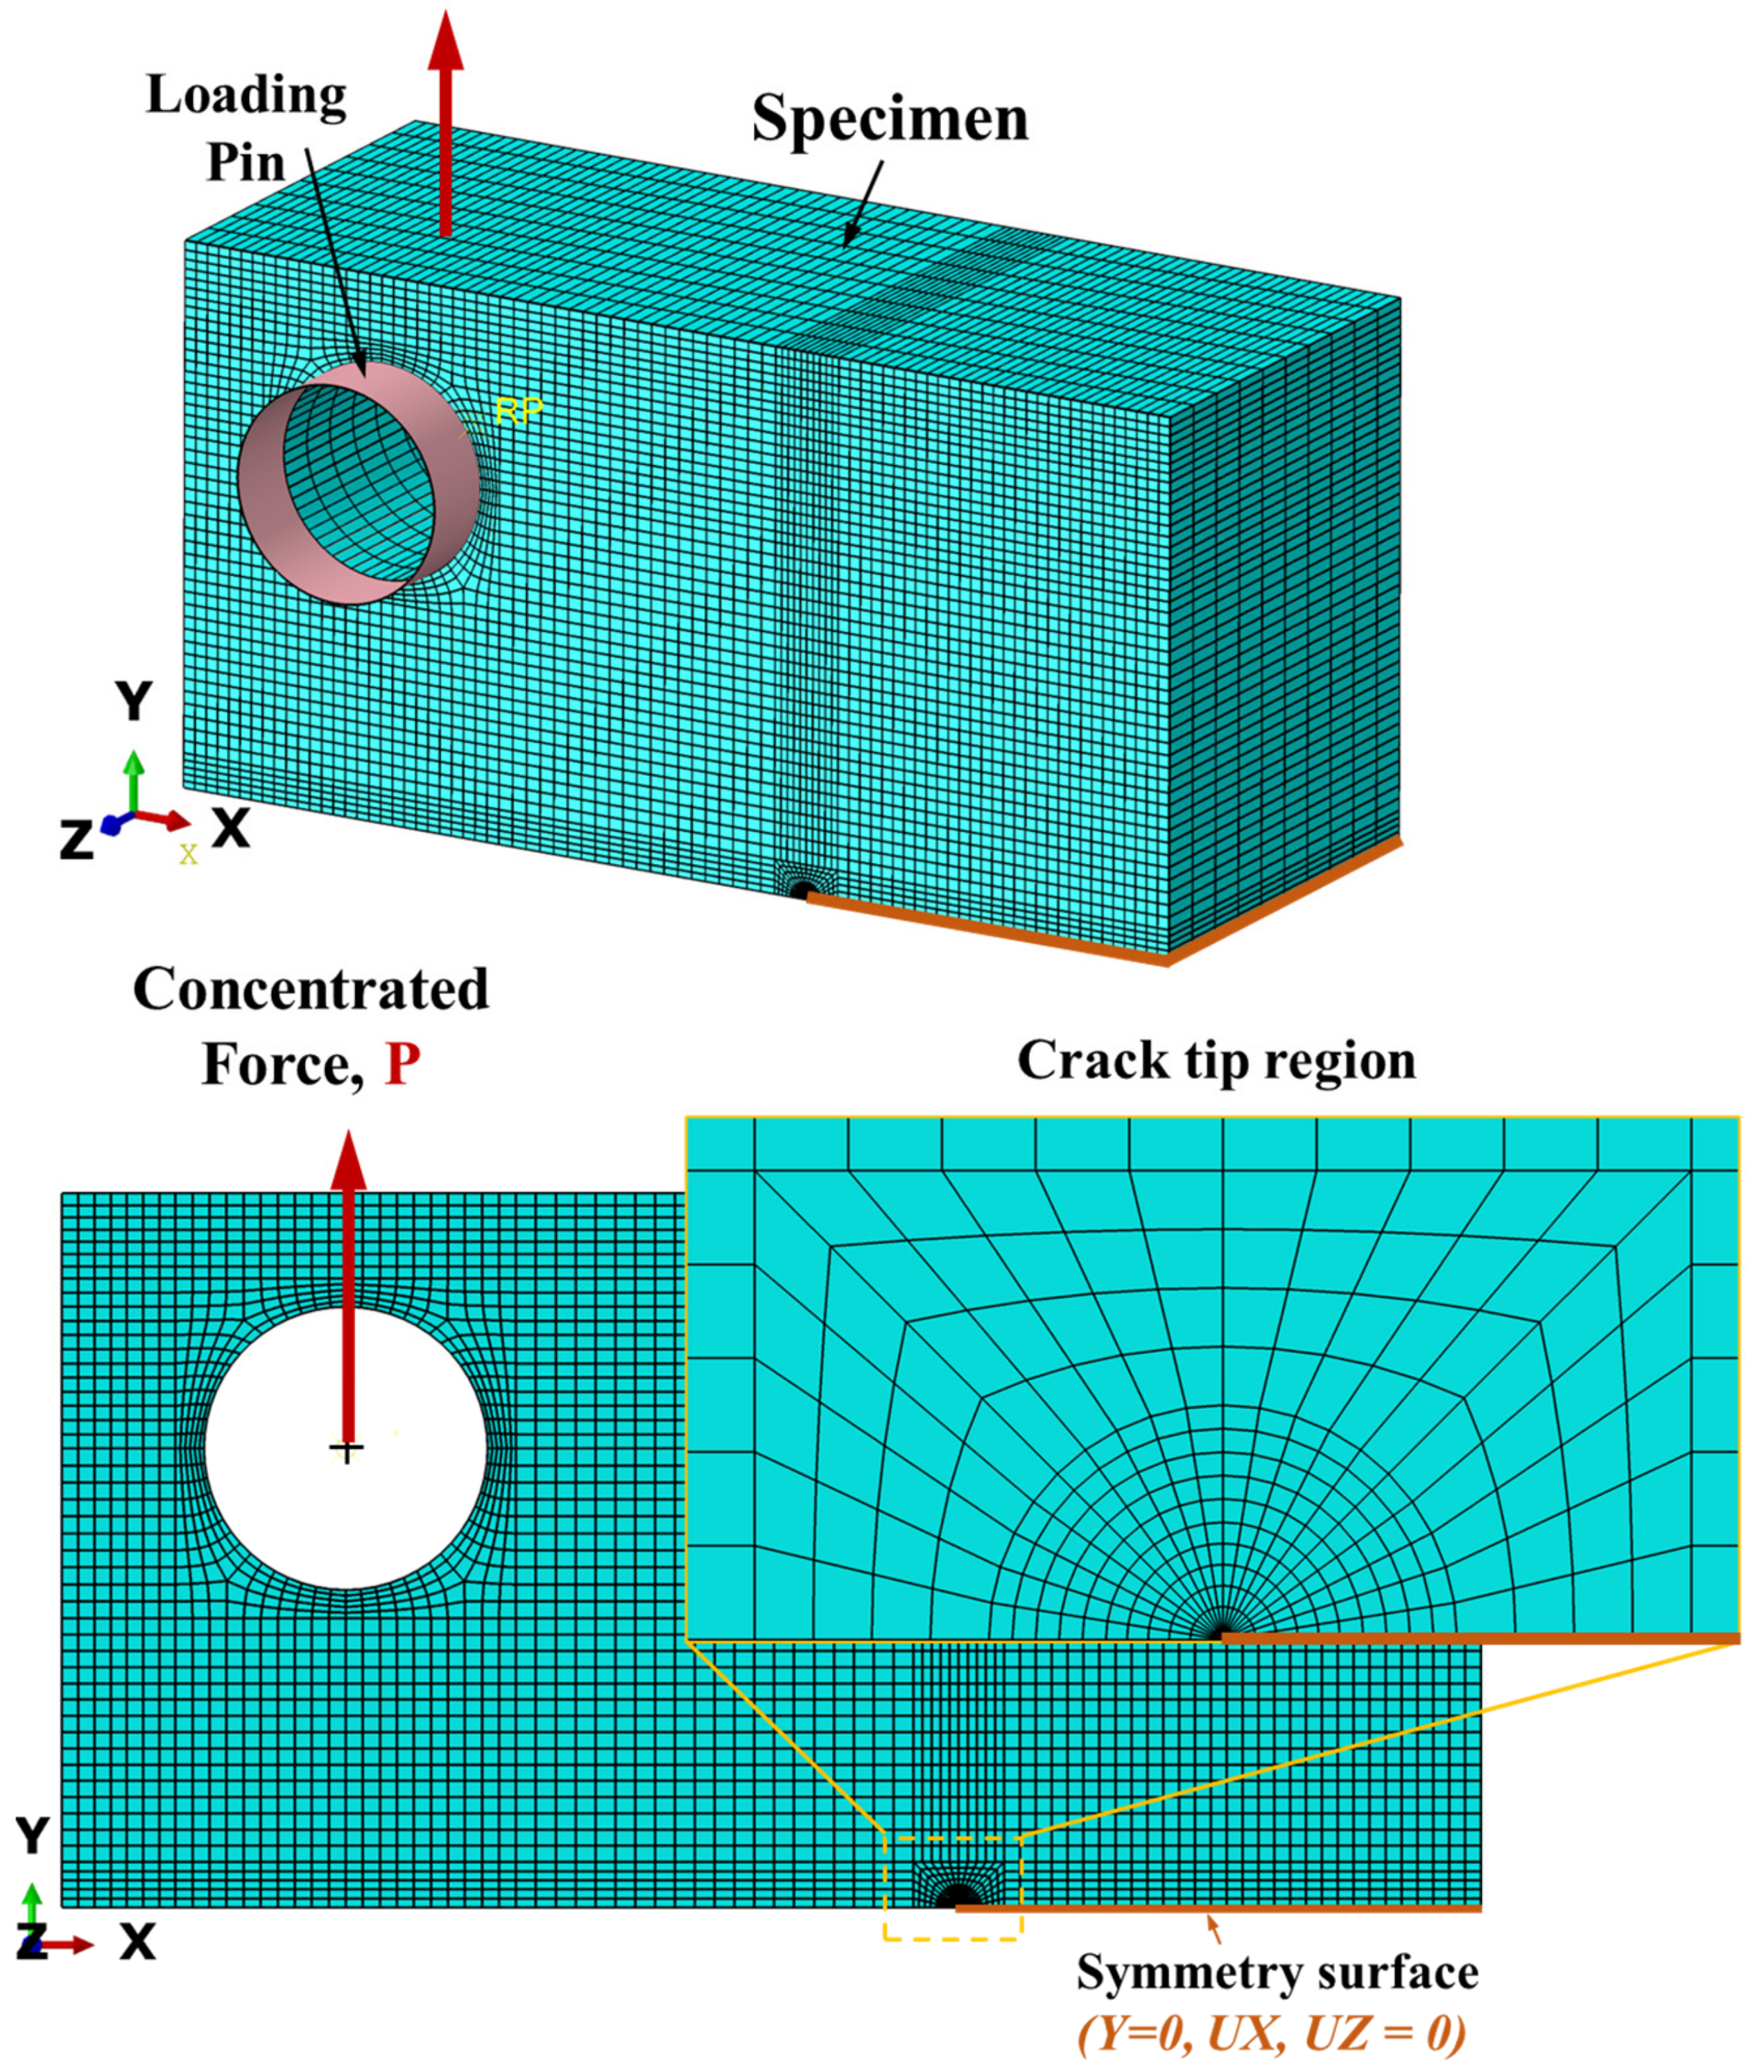
3.1. Materials, Specimen Geometries, and Boundary Conditions

The typical standard compact tension specimen (1T CT) geometry used in the current study is depicted schematically in Figure 5. The configuration of the specimen geometry was characterized by the non-dimensional parameters of the crack ratio, a/W, and specimen width, W = 62.5 mm. A commercial finite element analysis code, ABAQUS, was used in this study. Figure 5 also shows an FE model with the detailed meshing of the region toward the crack-tip region, boundary, and loading condition. A plane strain condition was employed as the specimen had a real thickness of 25.4 mm. As the specimen was symmetrical, only half of the specimen was modeled to minimize the simulation time. The symmetric boundary condition was applied to the uncracked ligament. A concentrated force was applied to the specimen by a rigid pin. The loading pin was modeled as a rigid body to avoid any deformations due to mechanical loading. The friction coefficient between the loading pin’s outer surface and the specimen’s surface was input with a constant value of 0.2 for all cases. It was determined that the SIF results were not significantly influenced by the friction coefficient. The concentration force to the loading pin was fixed at 28 kN.
Prior to the analyses, a series of FEA models with different mesh sizes were created to evaluate the optimal element size to achieve convergent SIF values. A meshing methodology using the bias mesh algorithm was employed to optimize the smallest number of elements with a convergence value of SIF. The region in the crack tip vicinity had finer meshing than other regions. A finer mesh was employed in the vicinity of the crack tip region to achieve more accurate results. It was found that the element size of 0.2 mm around the crack front obtained optimum convergence SIFs. A type of element was CPE8R, which is an eight-node, plane strain, and reduced integration element. The SIF results were calculated as an average value of the SIFs of five contours surrounding the crack tip. The material employed in the FEA model was considered as elastic deformation, with Young’s modulus, E = 200 GPa, and a Poisson’s ratio of 0.3. The RS can be pre-introduced into the FEA model in the initial step using a predefined field specified by the user (*INITIAL CONDITIONS, TYPE = STRESS, Type). The RS distribution, following Equations (1) and (2), were introduced to the FE model with discrete values over every 0.2 mm distance. Detailed methodology for integrating RS into the FEA model is depicted in Figure 6. The average RS at (σi + σi + 1)/2 was introduced to all the elements located at the location from yi to yi+1. The crack ratio, a/W, was modified from 0.20 to 0.75 to evaluate the effect of the crack depth on the boundary correction function. For each analysis of crack ratio, a/W, various RS distributions following Equation (1) with peak stress varying from 100 MPa to 600 MPa were applied. In addition, three cases of the FEA model with c = 2, 3, 4 with a constant crack ratio, a/W = 0.5, were performed to investigate the effect of the c value.
To verify the reliability of the value of the SIFs calculated by the FEA element results, the SIF estimated by the FEA model was compared with the value estimated by the existing analytical equations as recommended in ASTM E1280 for CT specimen [47,48]. From Figure 7, it was found that the SIF values obtained by the FEA model were very well conformed with those evaluated using the analytical solutions. The SIF calculated by Abaqus 2016 was greater than the theoretical value; however, the maximum percentage error of the estimated K values by FEA compared with the analytical results was approximately about 4.48%, which was calculated in the case of a/W = 0.75. It can be concluded that the FEA model with optimized meshing can accurately predict the SIFs of the cracked model.

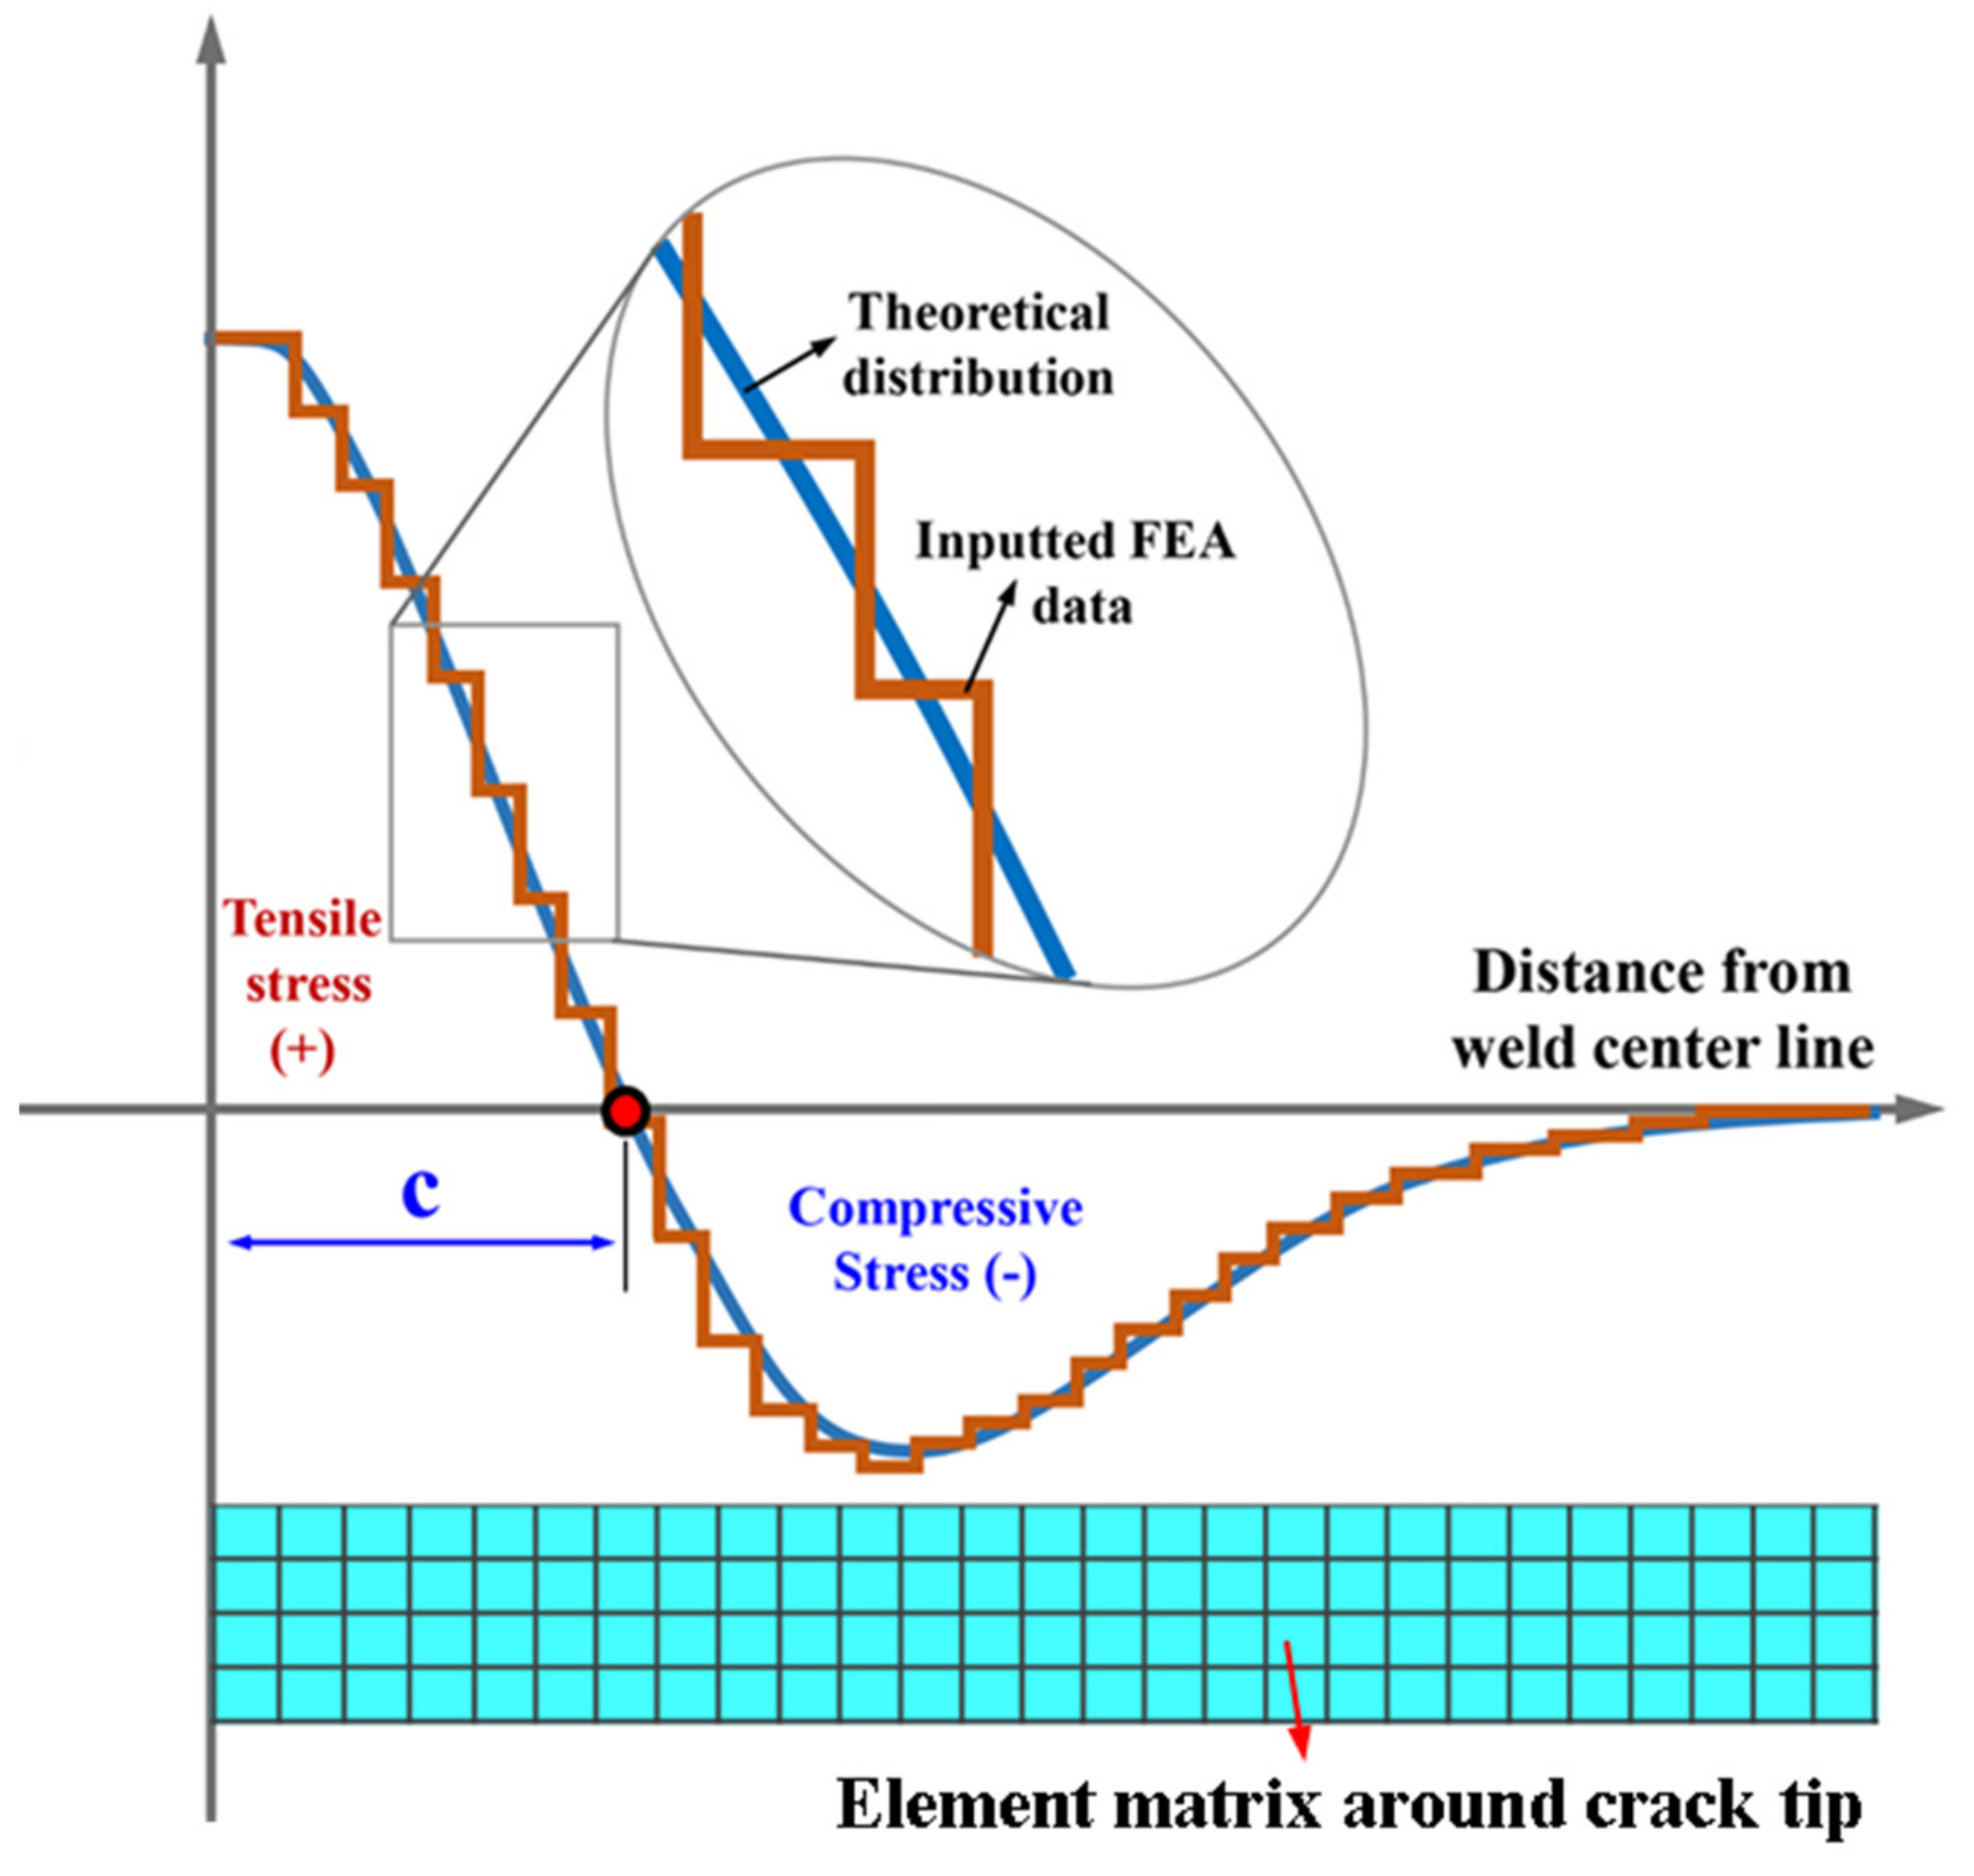
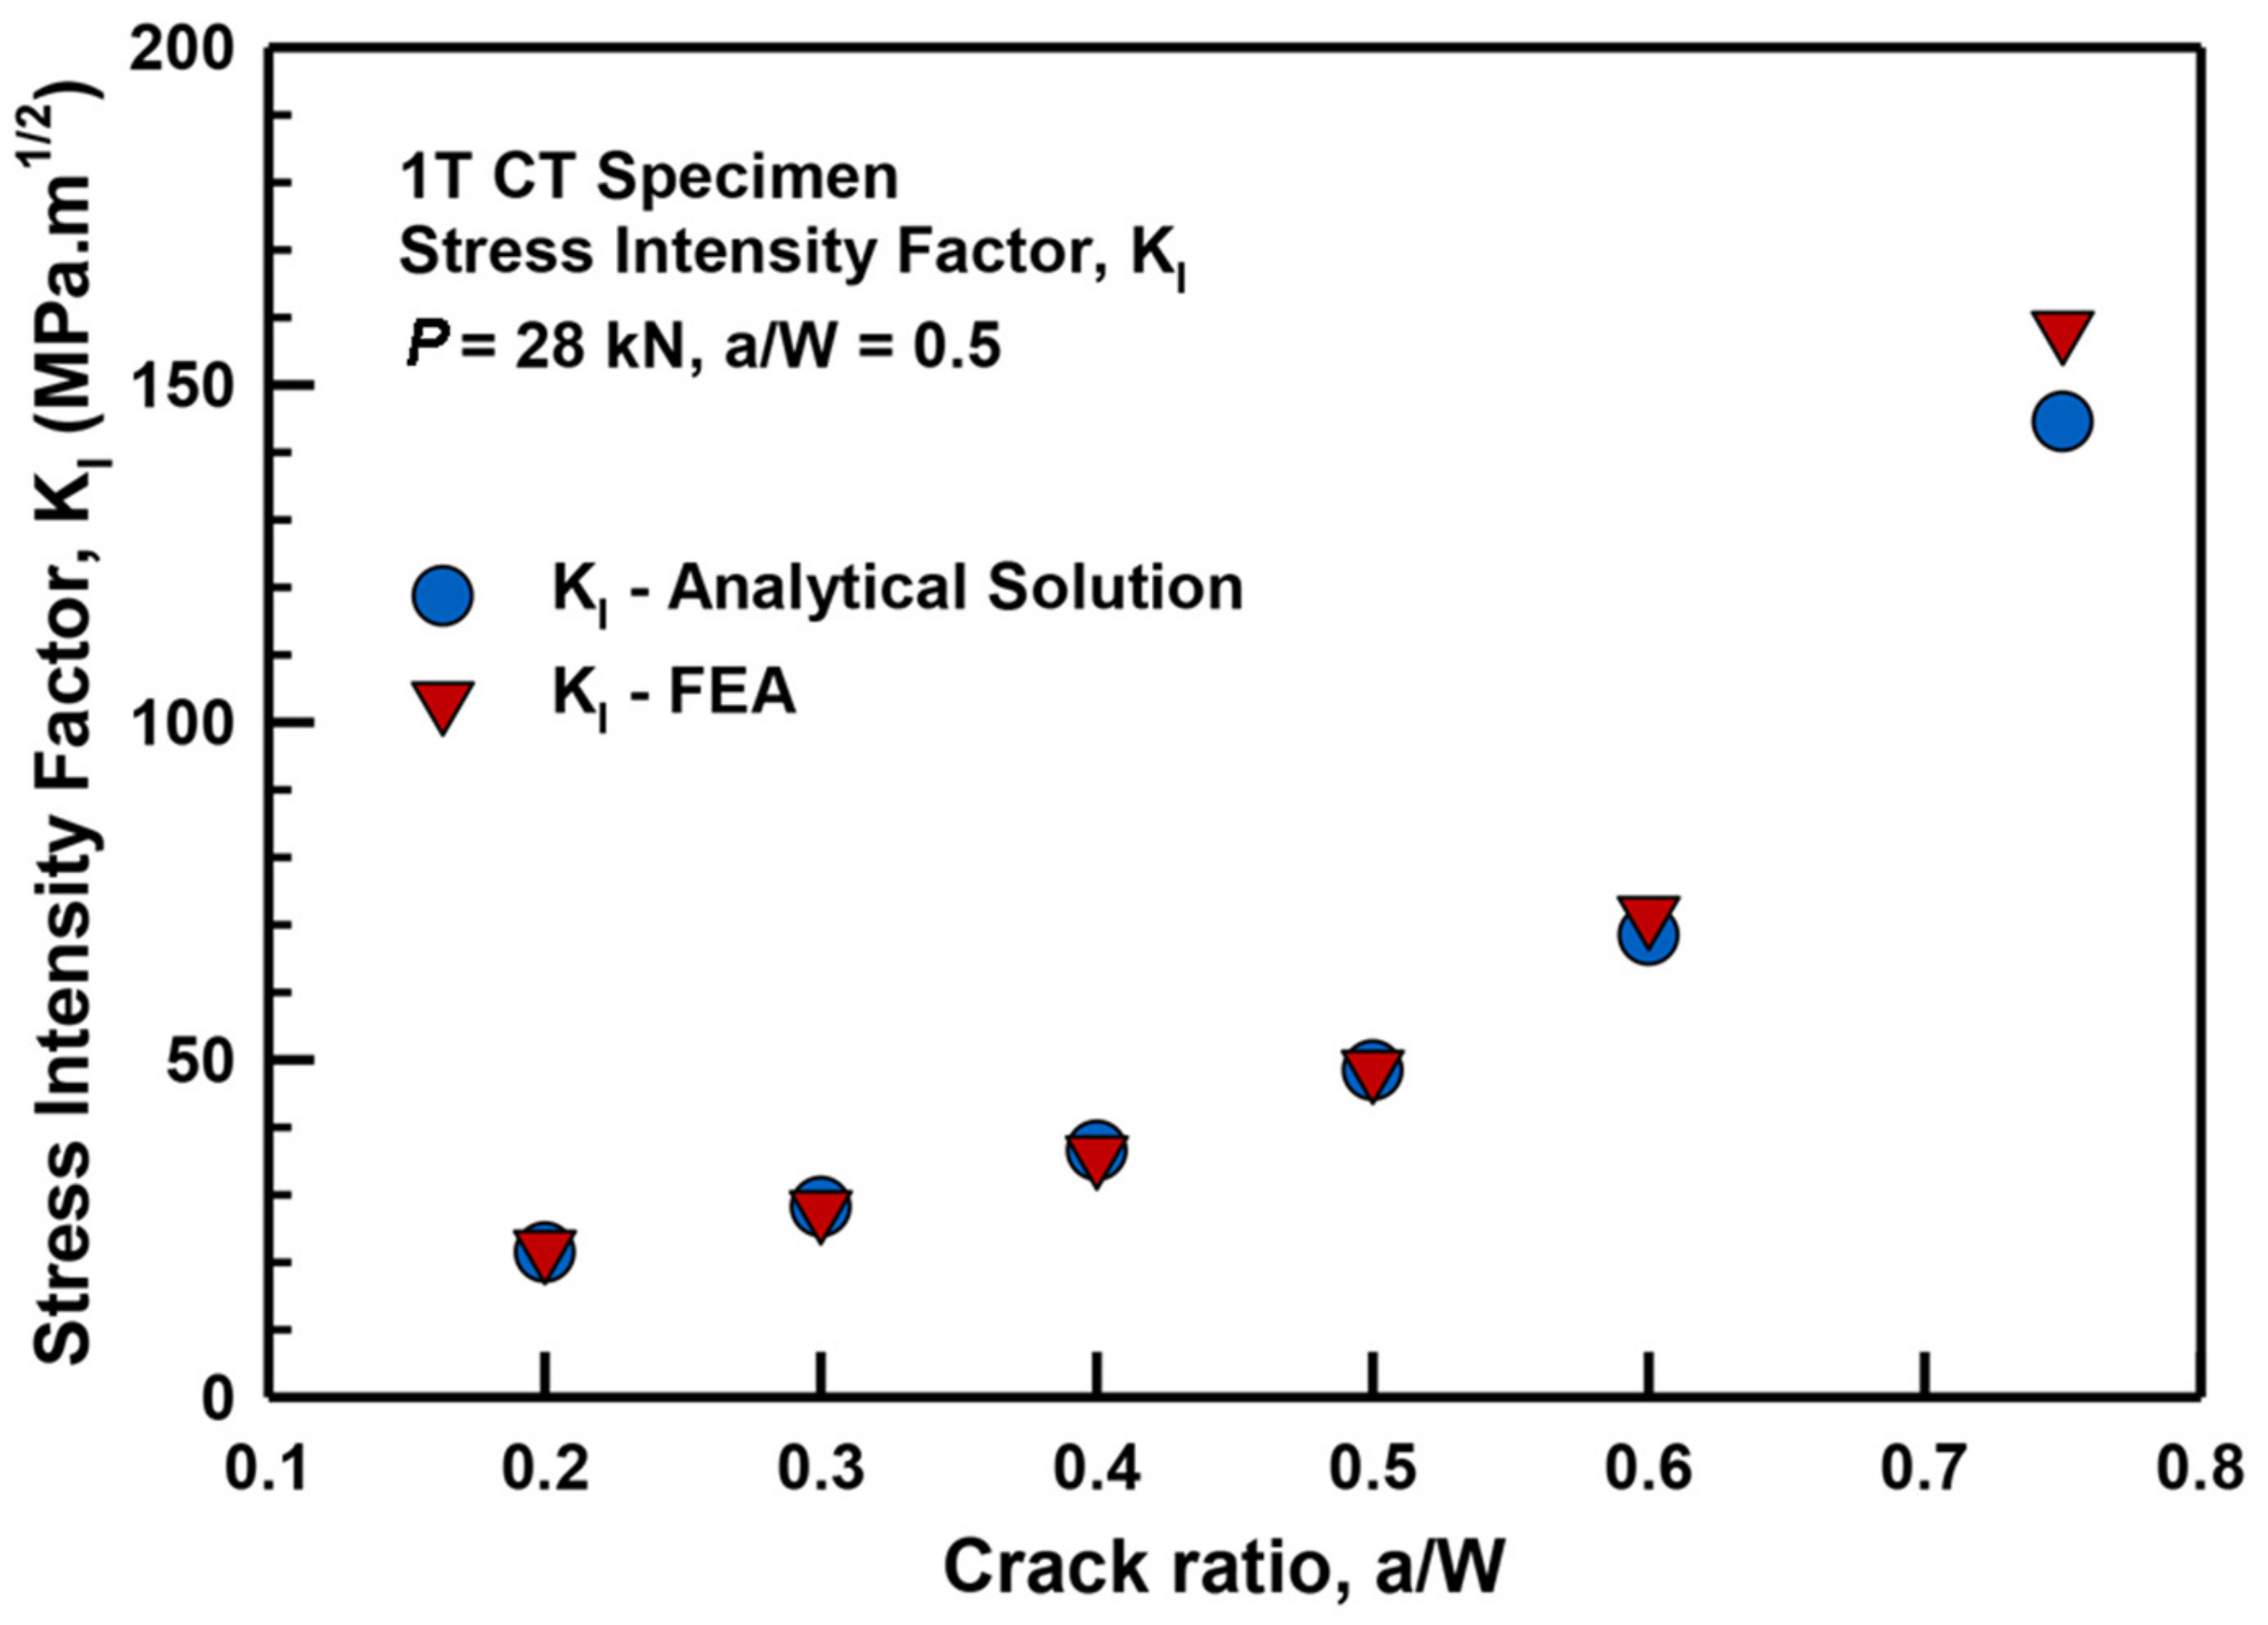
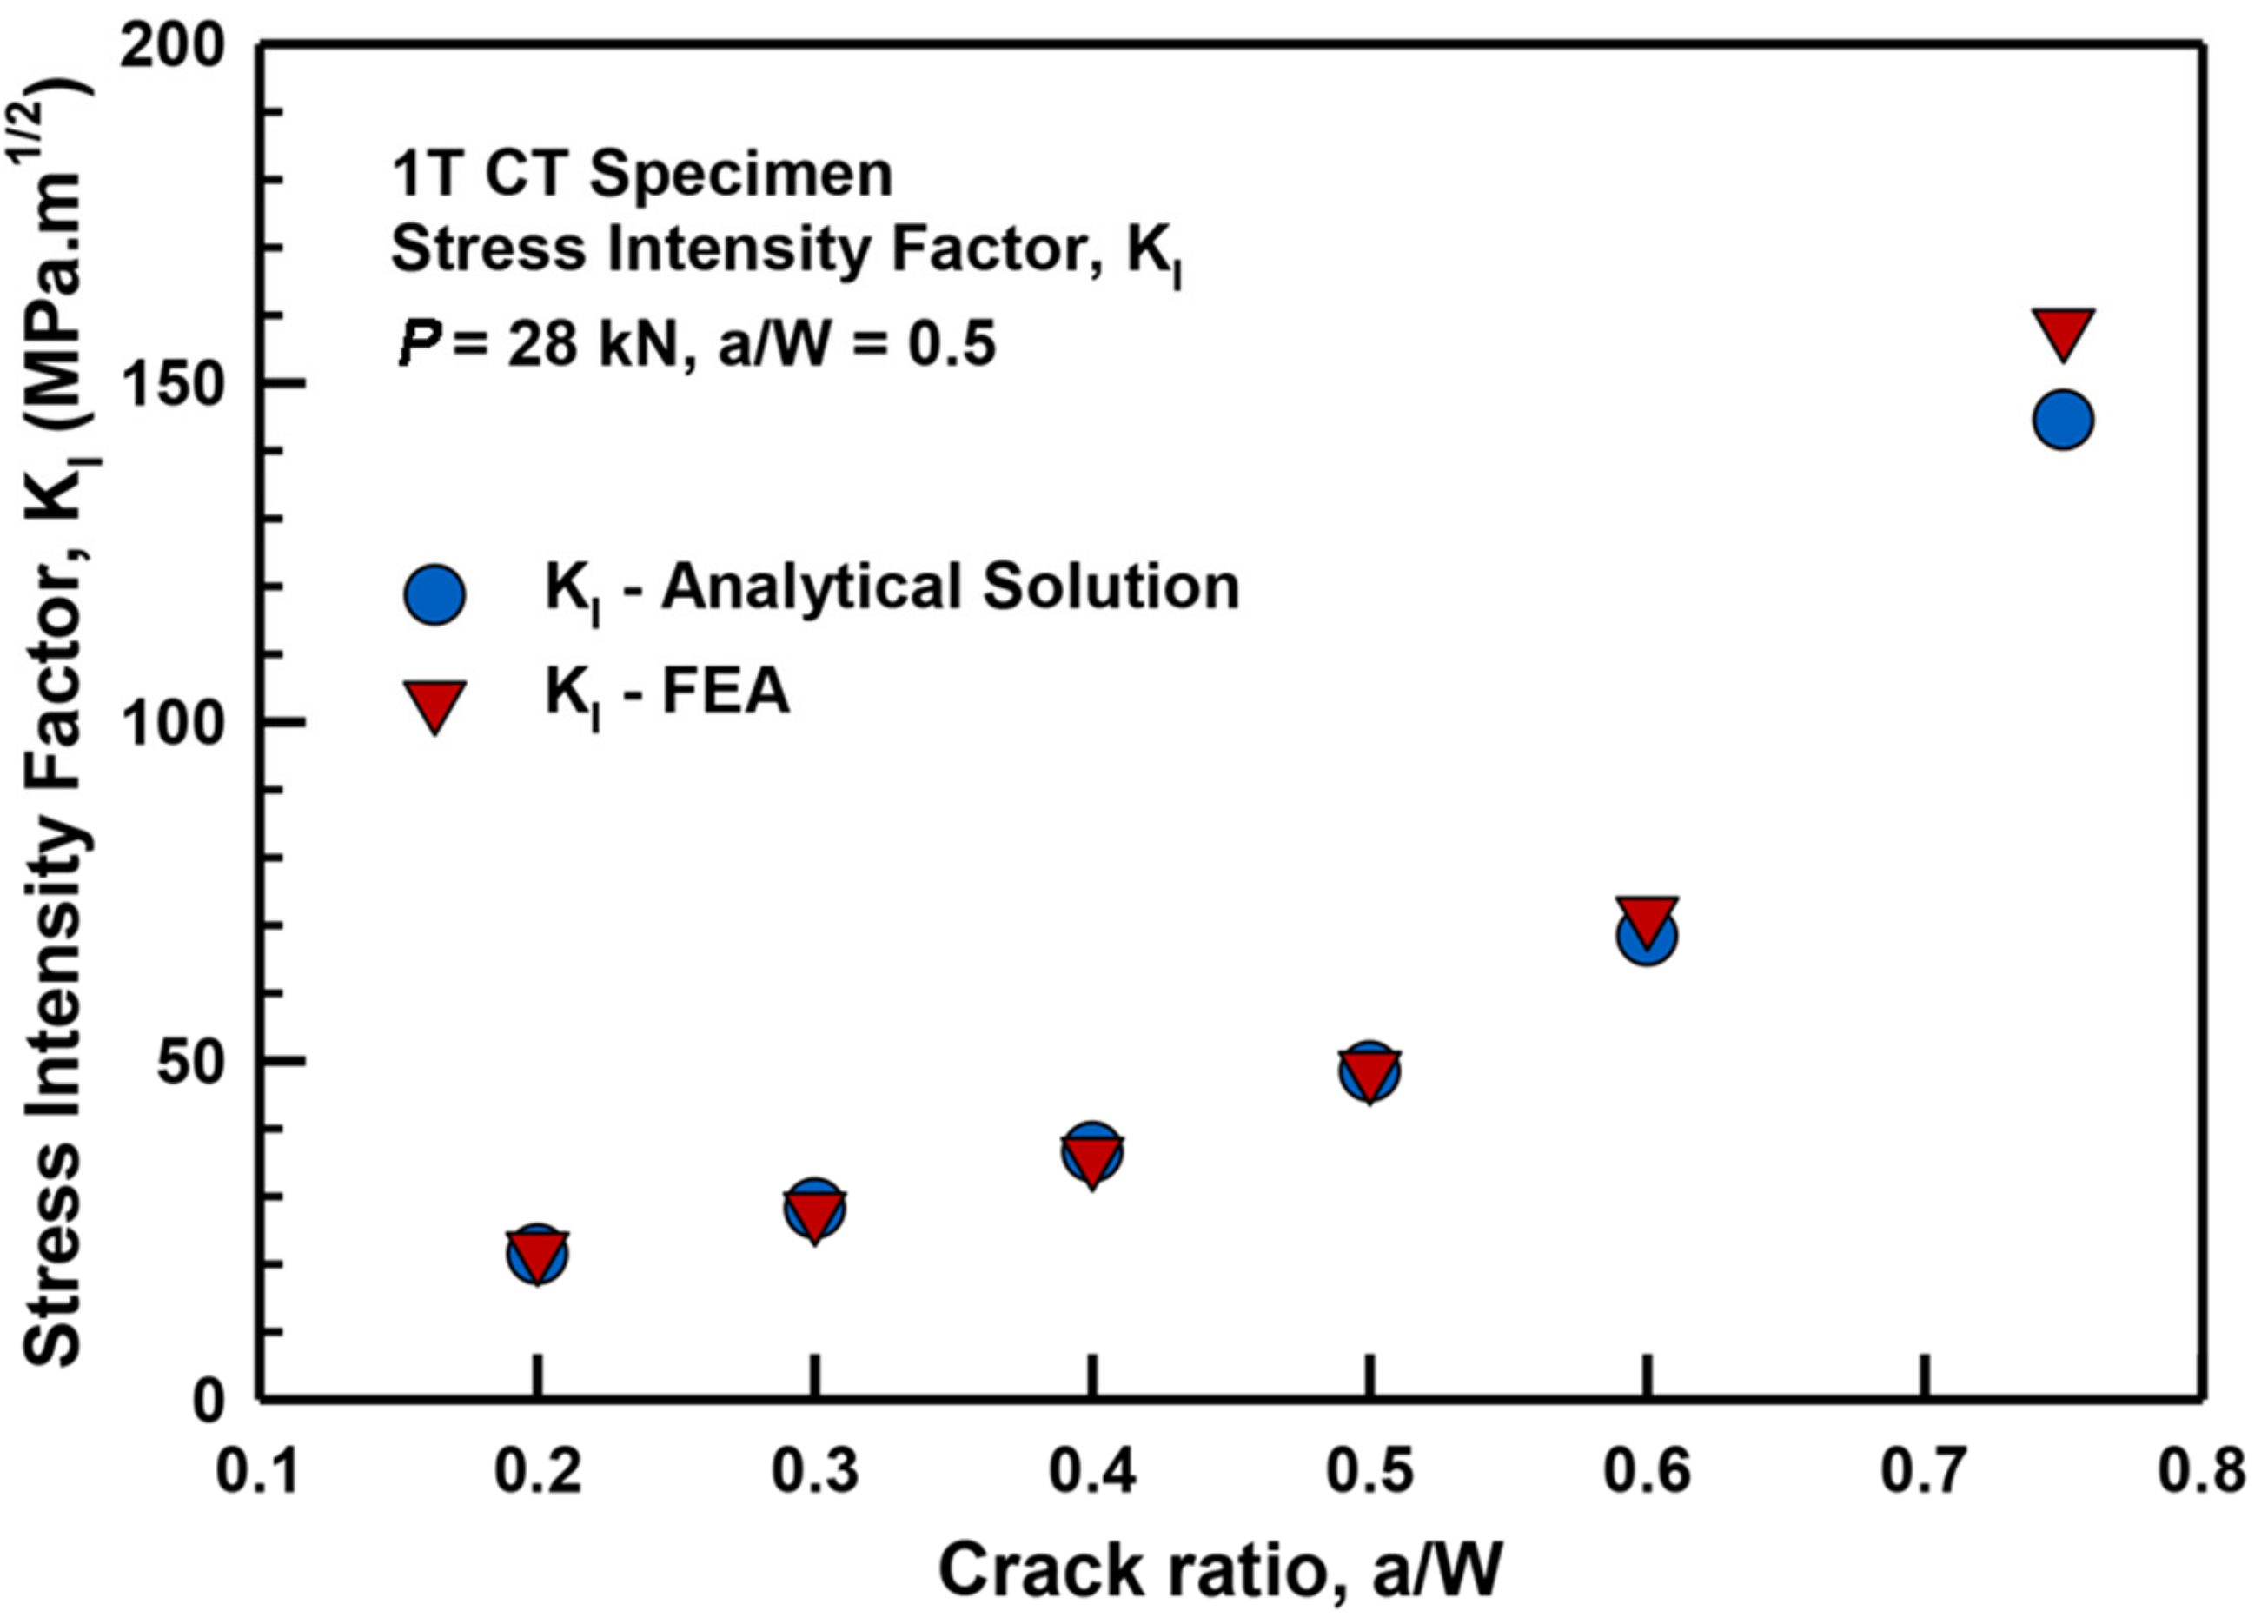
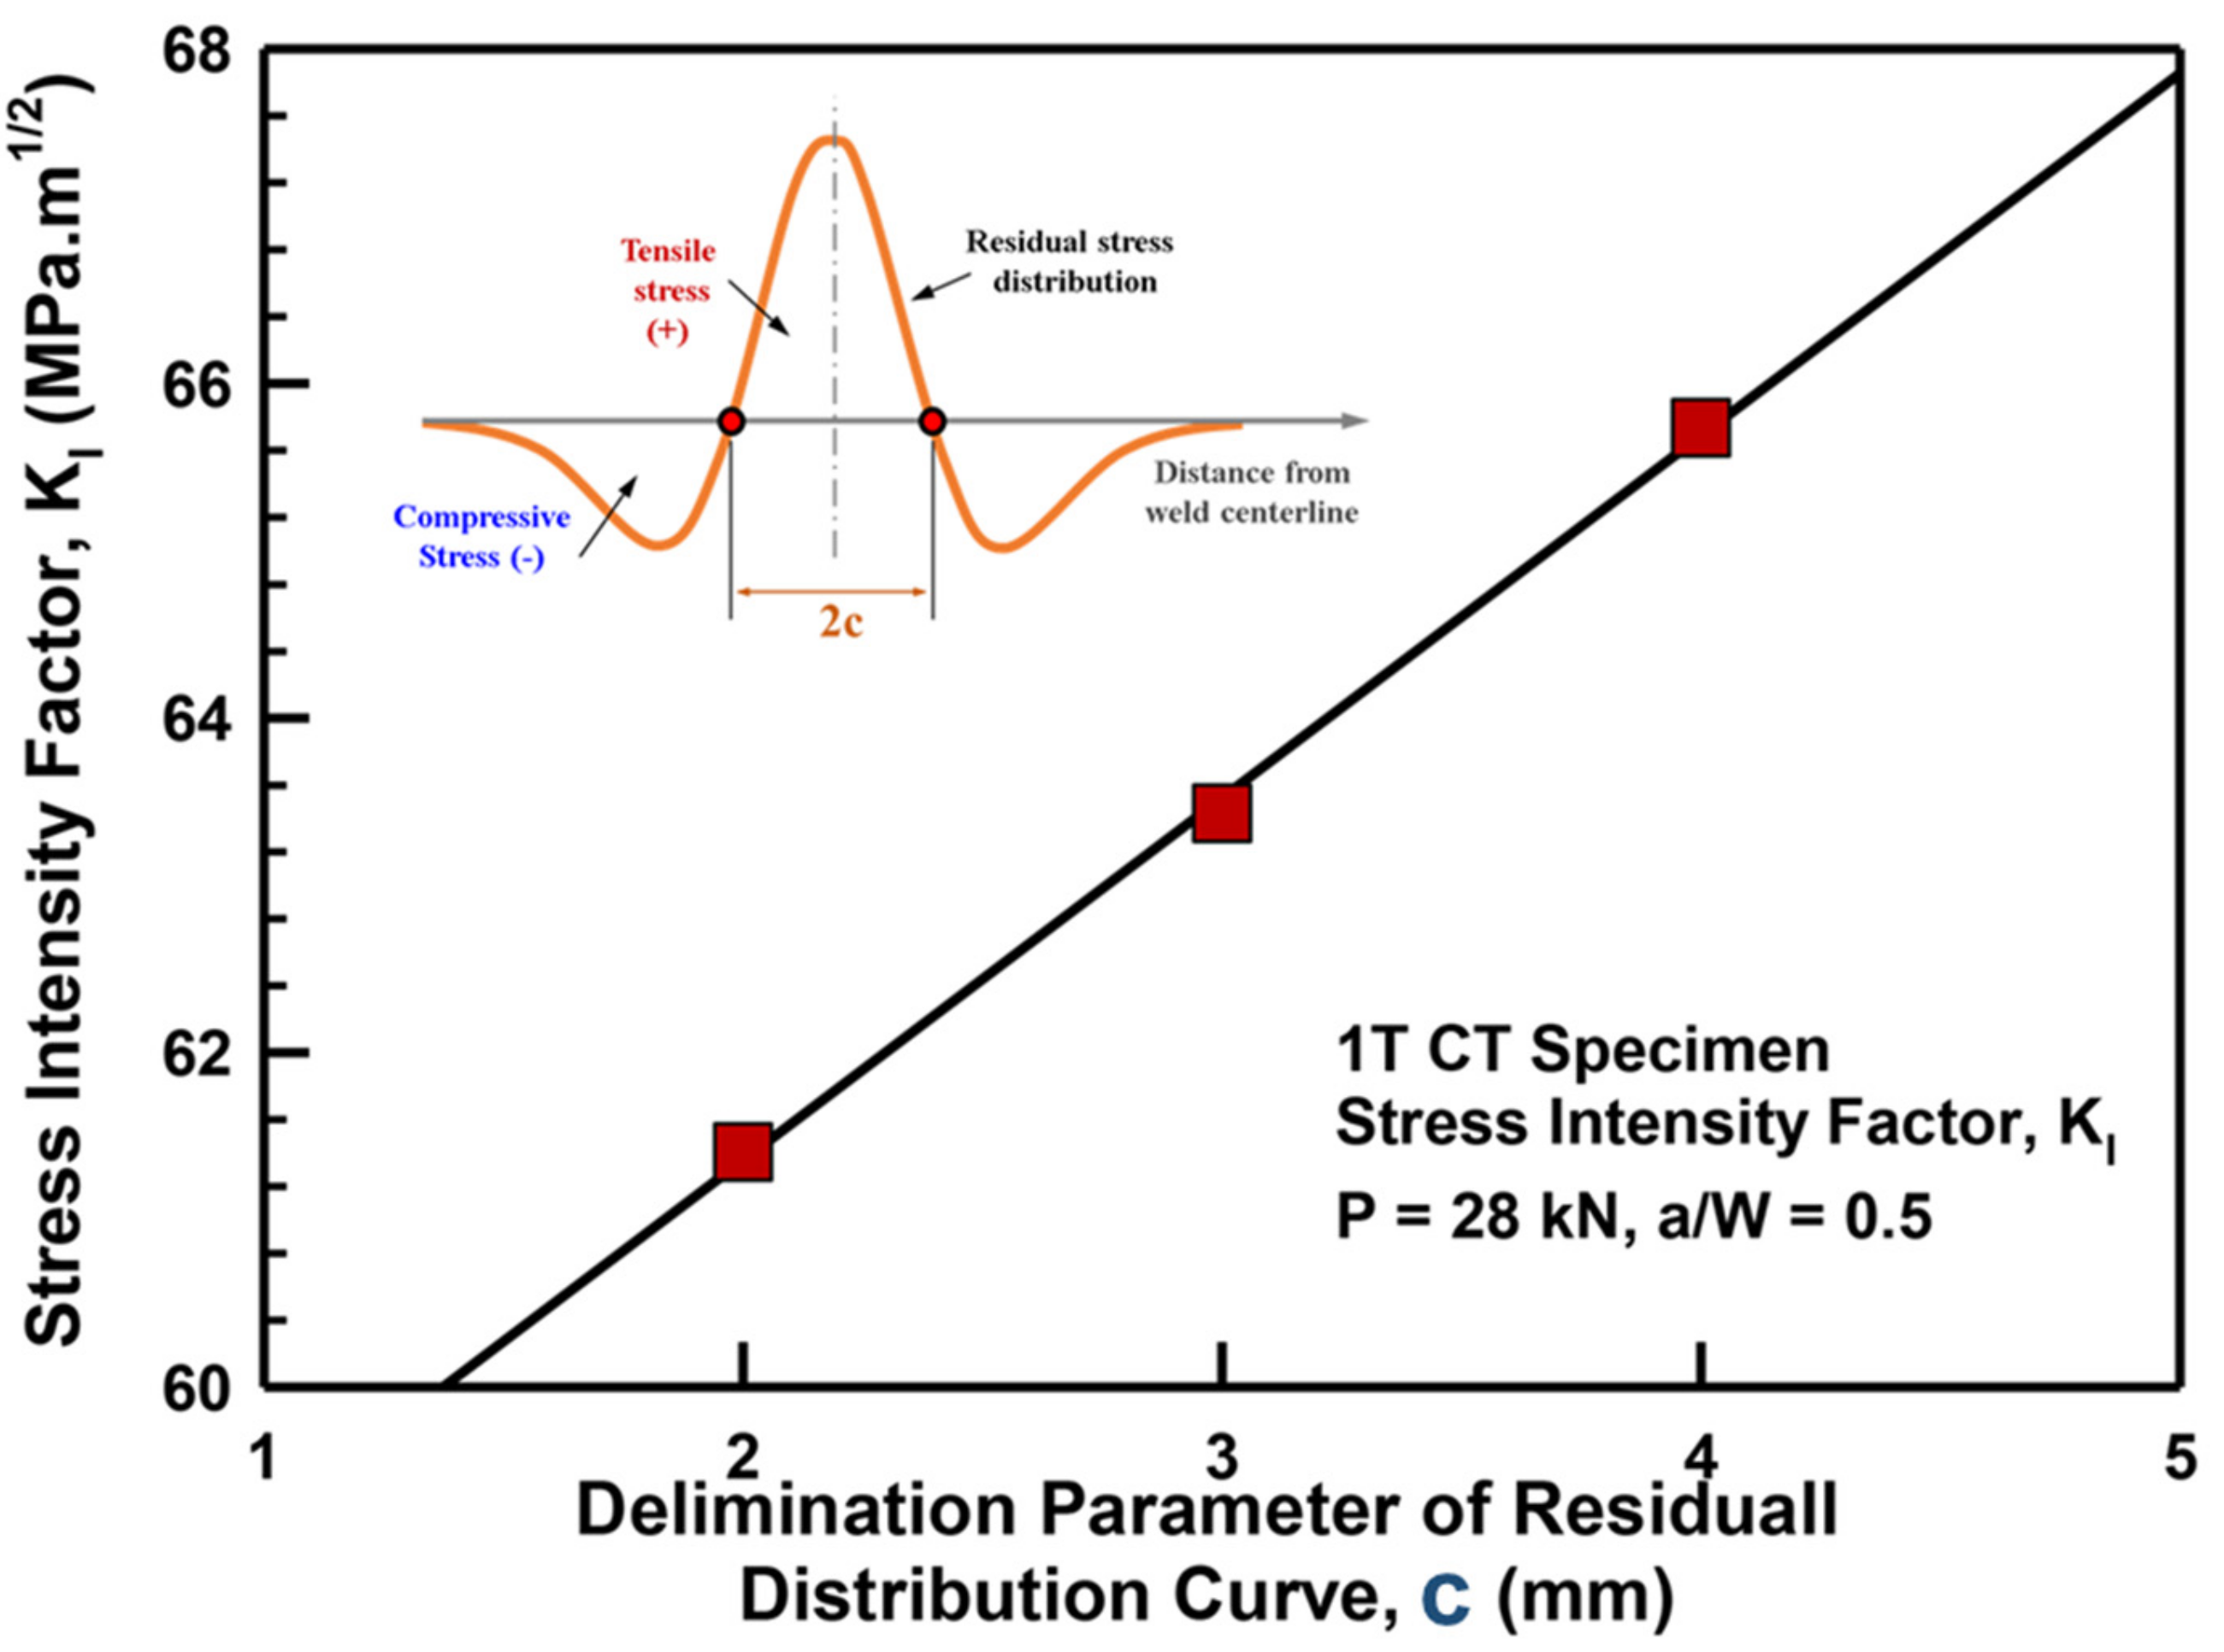
3.2. Estimation of Stress Intensity Factor using FEA

Figure 8 presents the resulting value of SIF, KI for various crack ratios, and that of a/W from 0.2 to 0.75 when the peak RS varied from 0 to 600 MPa. A general trend can be observed that the KI values increased significantly when the crack ratio varied from 0.20 to 0.75 in all cases of the peak RS level. The KI values increased alongside the peak RS at a constant crack ratio, a/W. However, the rates of increasing KI were not consistent according to the crack ratio, a/W. As shown, there were only a few differences between KI values under the effect of the high and low peak RS at the crack ratio, a/W = 0.75. As the crack ratio decreased, the difference between the KI values at the high and low peak RS became more pronounced, especially when the crack ratio was less than 0.4. For example, in the case of a crack ratio of 0.75, the KI value under the effect of RS with a peak value of 600 MPa was about 187.8 MPa.m1/2, only 6.7% higher than the crack model without RS with KI = 176.1 MPa.m1/2. However, when the crack ratio was 0.2, the KI value with a peak RS of 600 MPa was 33.4, which was significantly higher by about 51% compared with the crack model without employing RS. It is argued that the effect of the peak RS on the KI values at a lower crack ratio is more pronounced compared with that at a higher crack ratio. It was also noted that KI values were near comparable when the peak RS was less than 300 MPa in all cases of the crack ratio.
Figure 9 shows the results of KI values of the crack model with a constant crack ratio of 0.50 and various levels of the peak RS. For each peak RS value, two models following Equations (1) and (2) were applied to clarify the influence of RS distribution on the KI values. It can be seen that the KI values obtained using the FEA model with the applied RS distribution following Equation (1) were in strong agreement with those evaluated with the FEA model in which the RS distribution followed Equation (2). Specifically, the SIF calculated using the FEA model with Equation (1) was only slightly greater than the results obtained with the FEA model employing Equation (2) RS distribution. However, the maximum percentage difference of the estimated KI values between the two models was approximately 6.5%, which was calculated in the case of a/W = 0.75. It is argued that the effect of the function of RS distributions on the KI values was insignificant.
Figure 10 presents the effect of the delimitation parameter of the RS distribution curve, c, on the KI values of the crack model with the crack ratio equal to 0.50. According to the variation of c from 2 mm to 4 mm, the RS distributions following Equation (1) with the peak stress of 600 MPa were changed as per Figure 3. As shown, the SIF at a higher c (=4 mm) was only 10% higher than that with c = 2 mm. The slightly higher SIF, KI can be attributed to the expansion of the area affected by the tensile RS when the delimitation parameter, c, was increased from 2 to 4 mm, as shown in Figure 4.

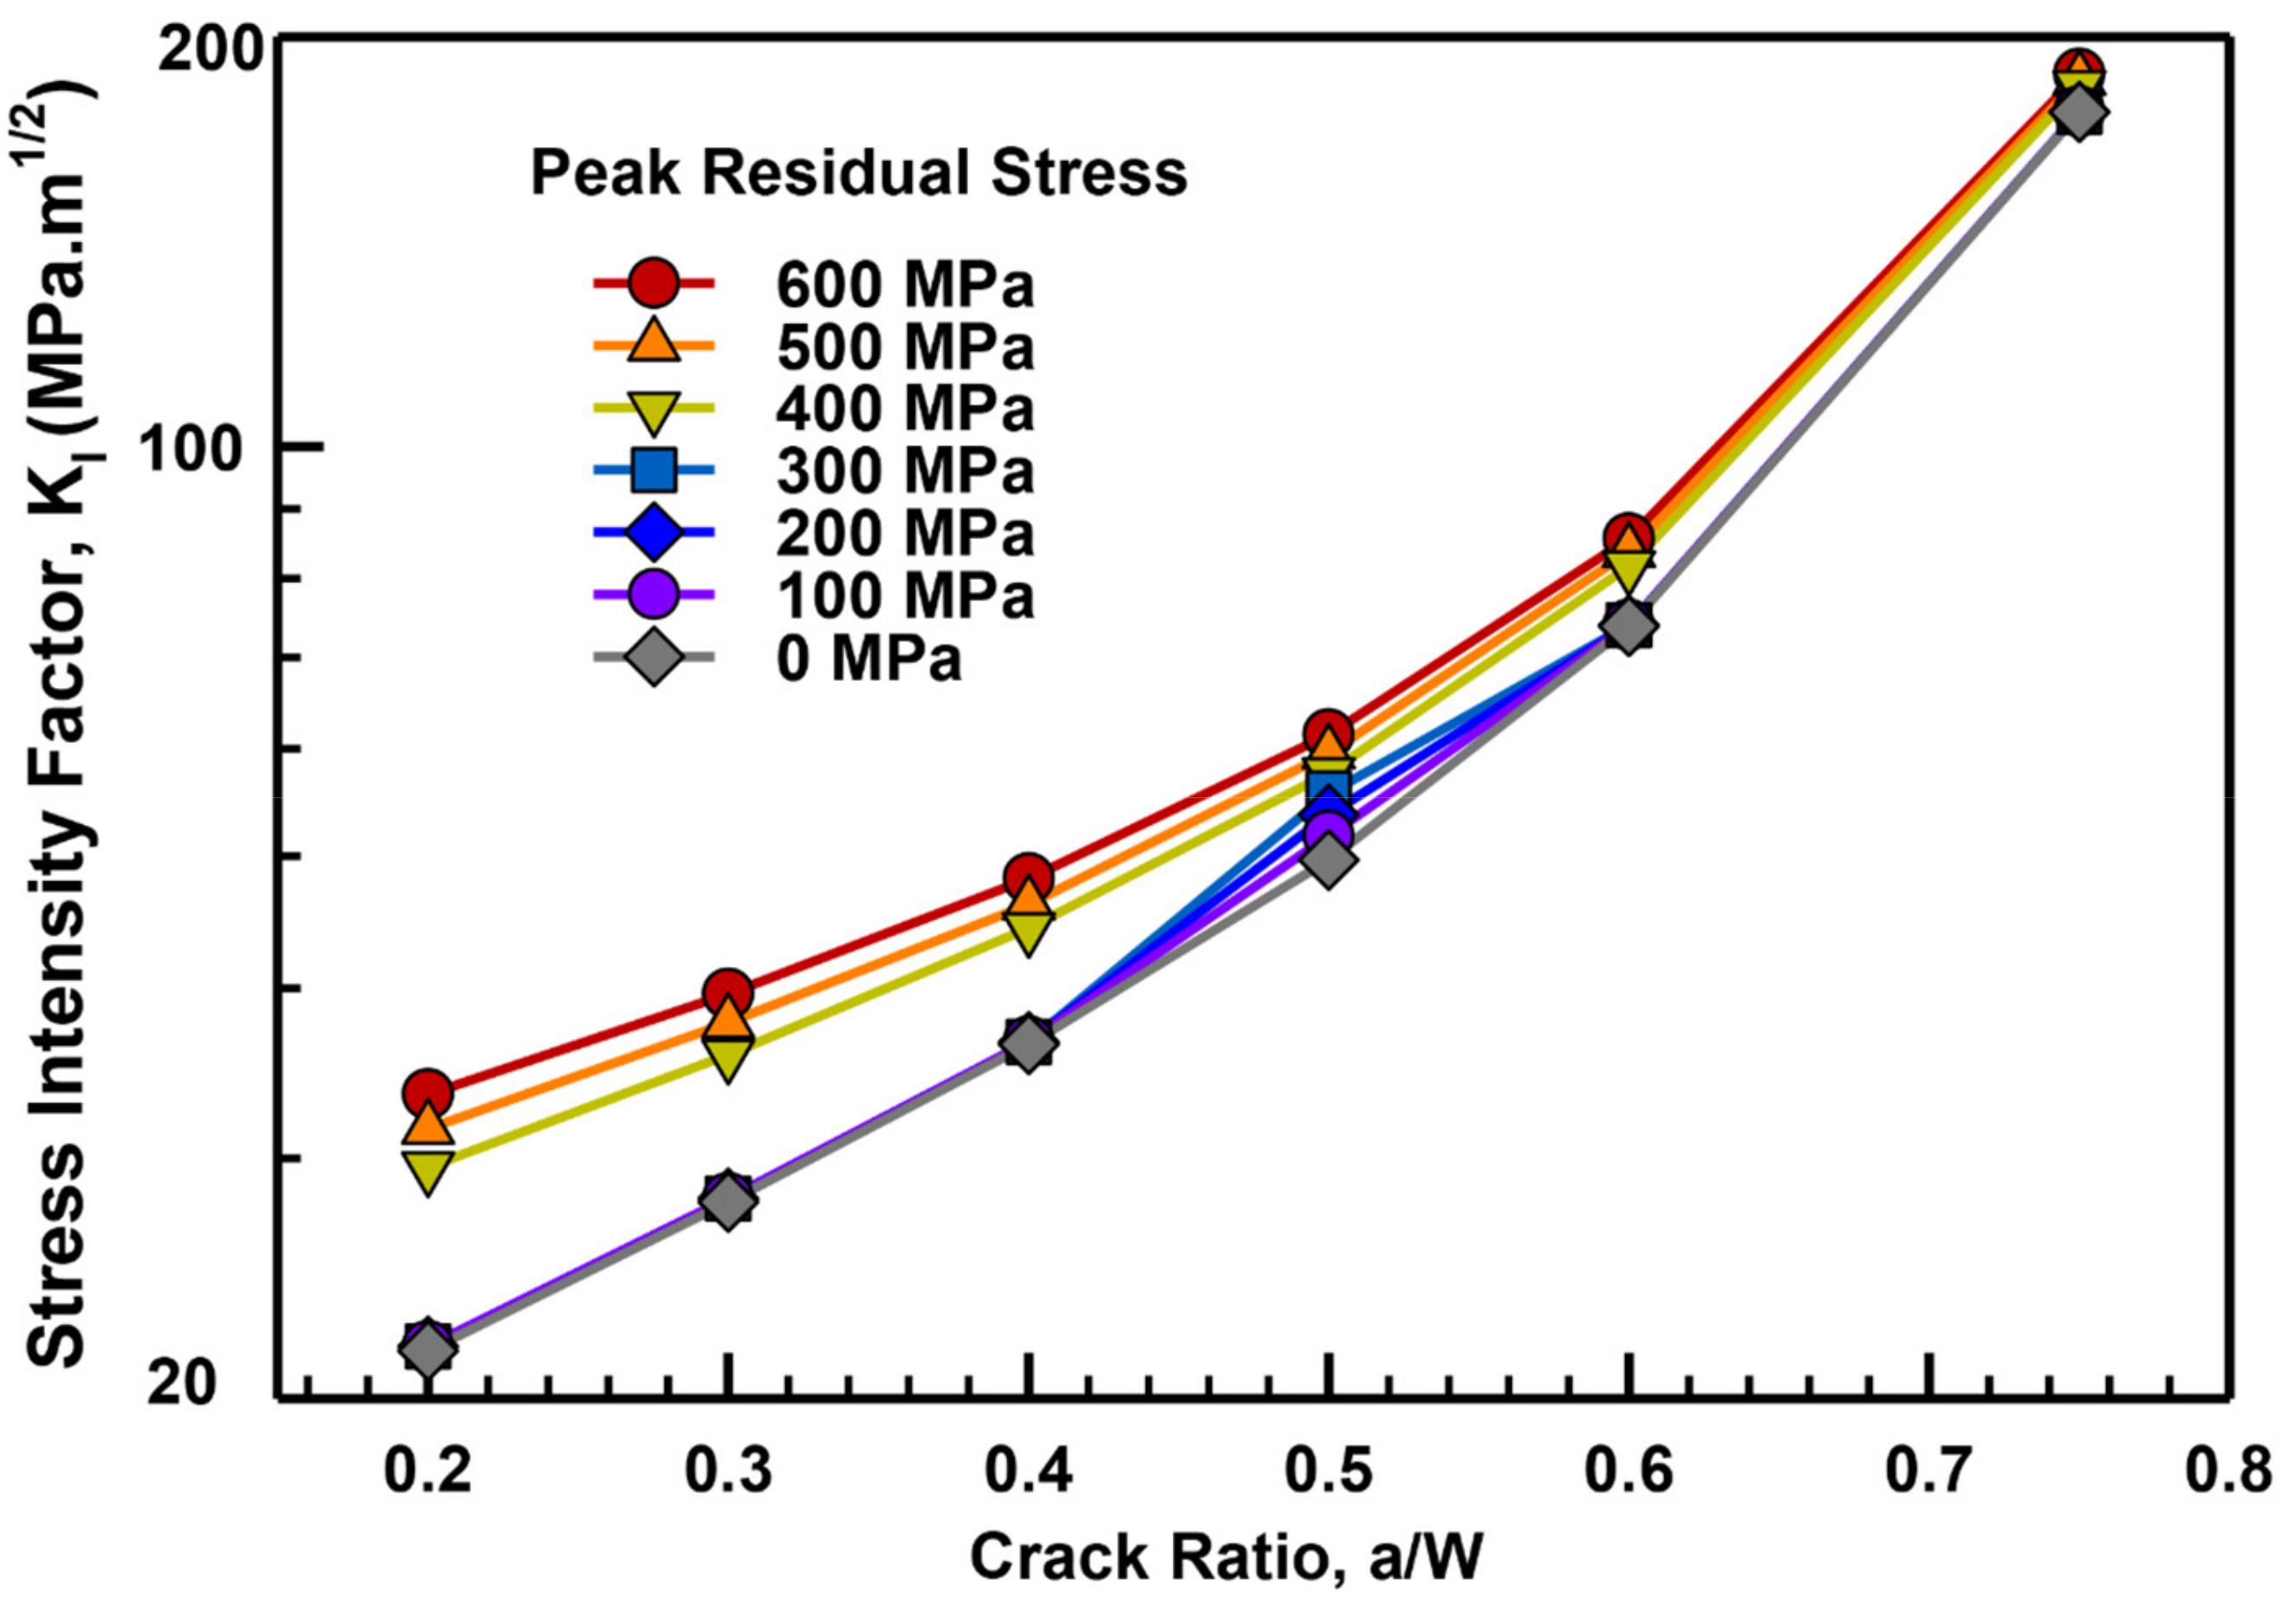
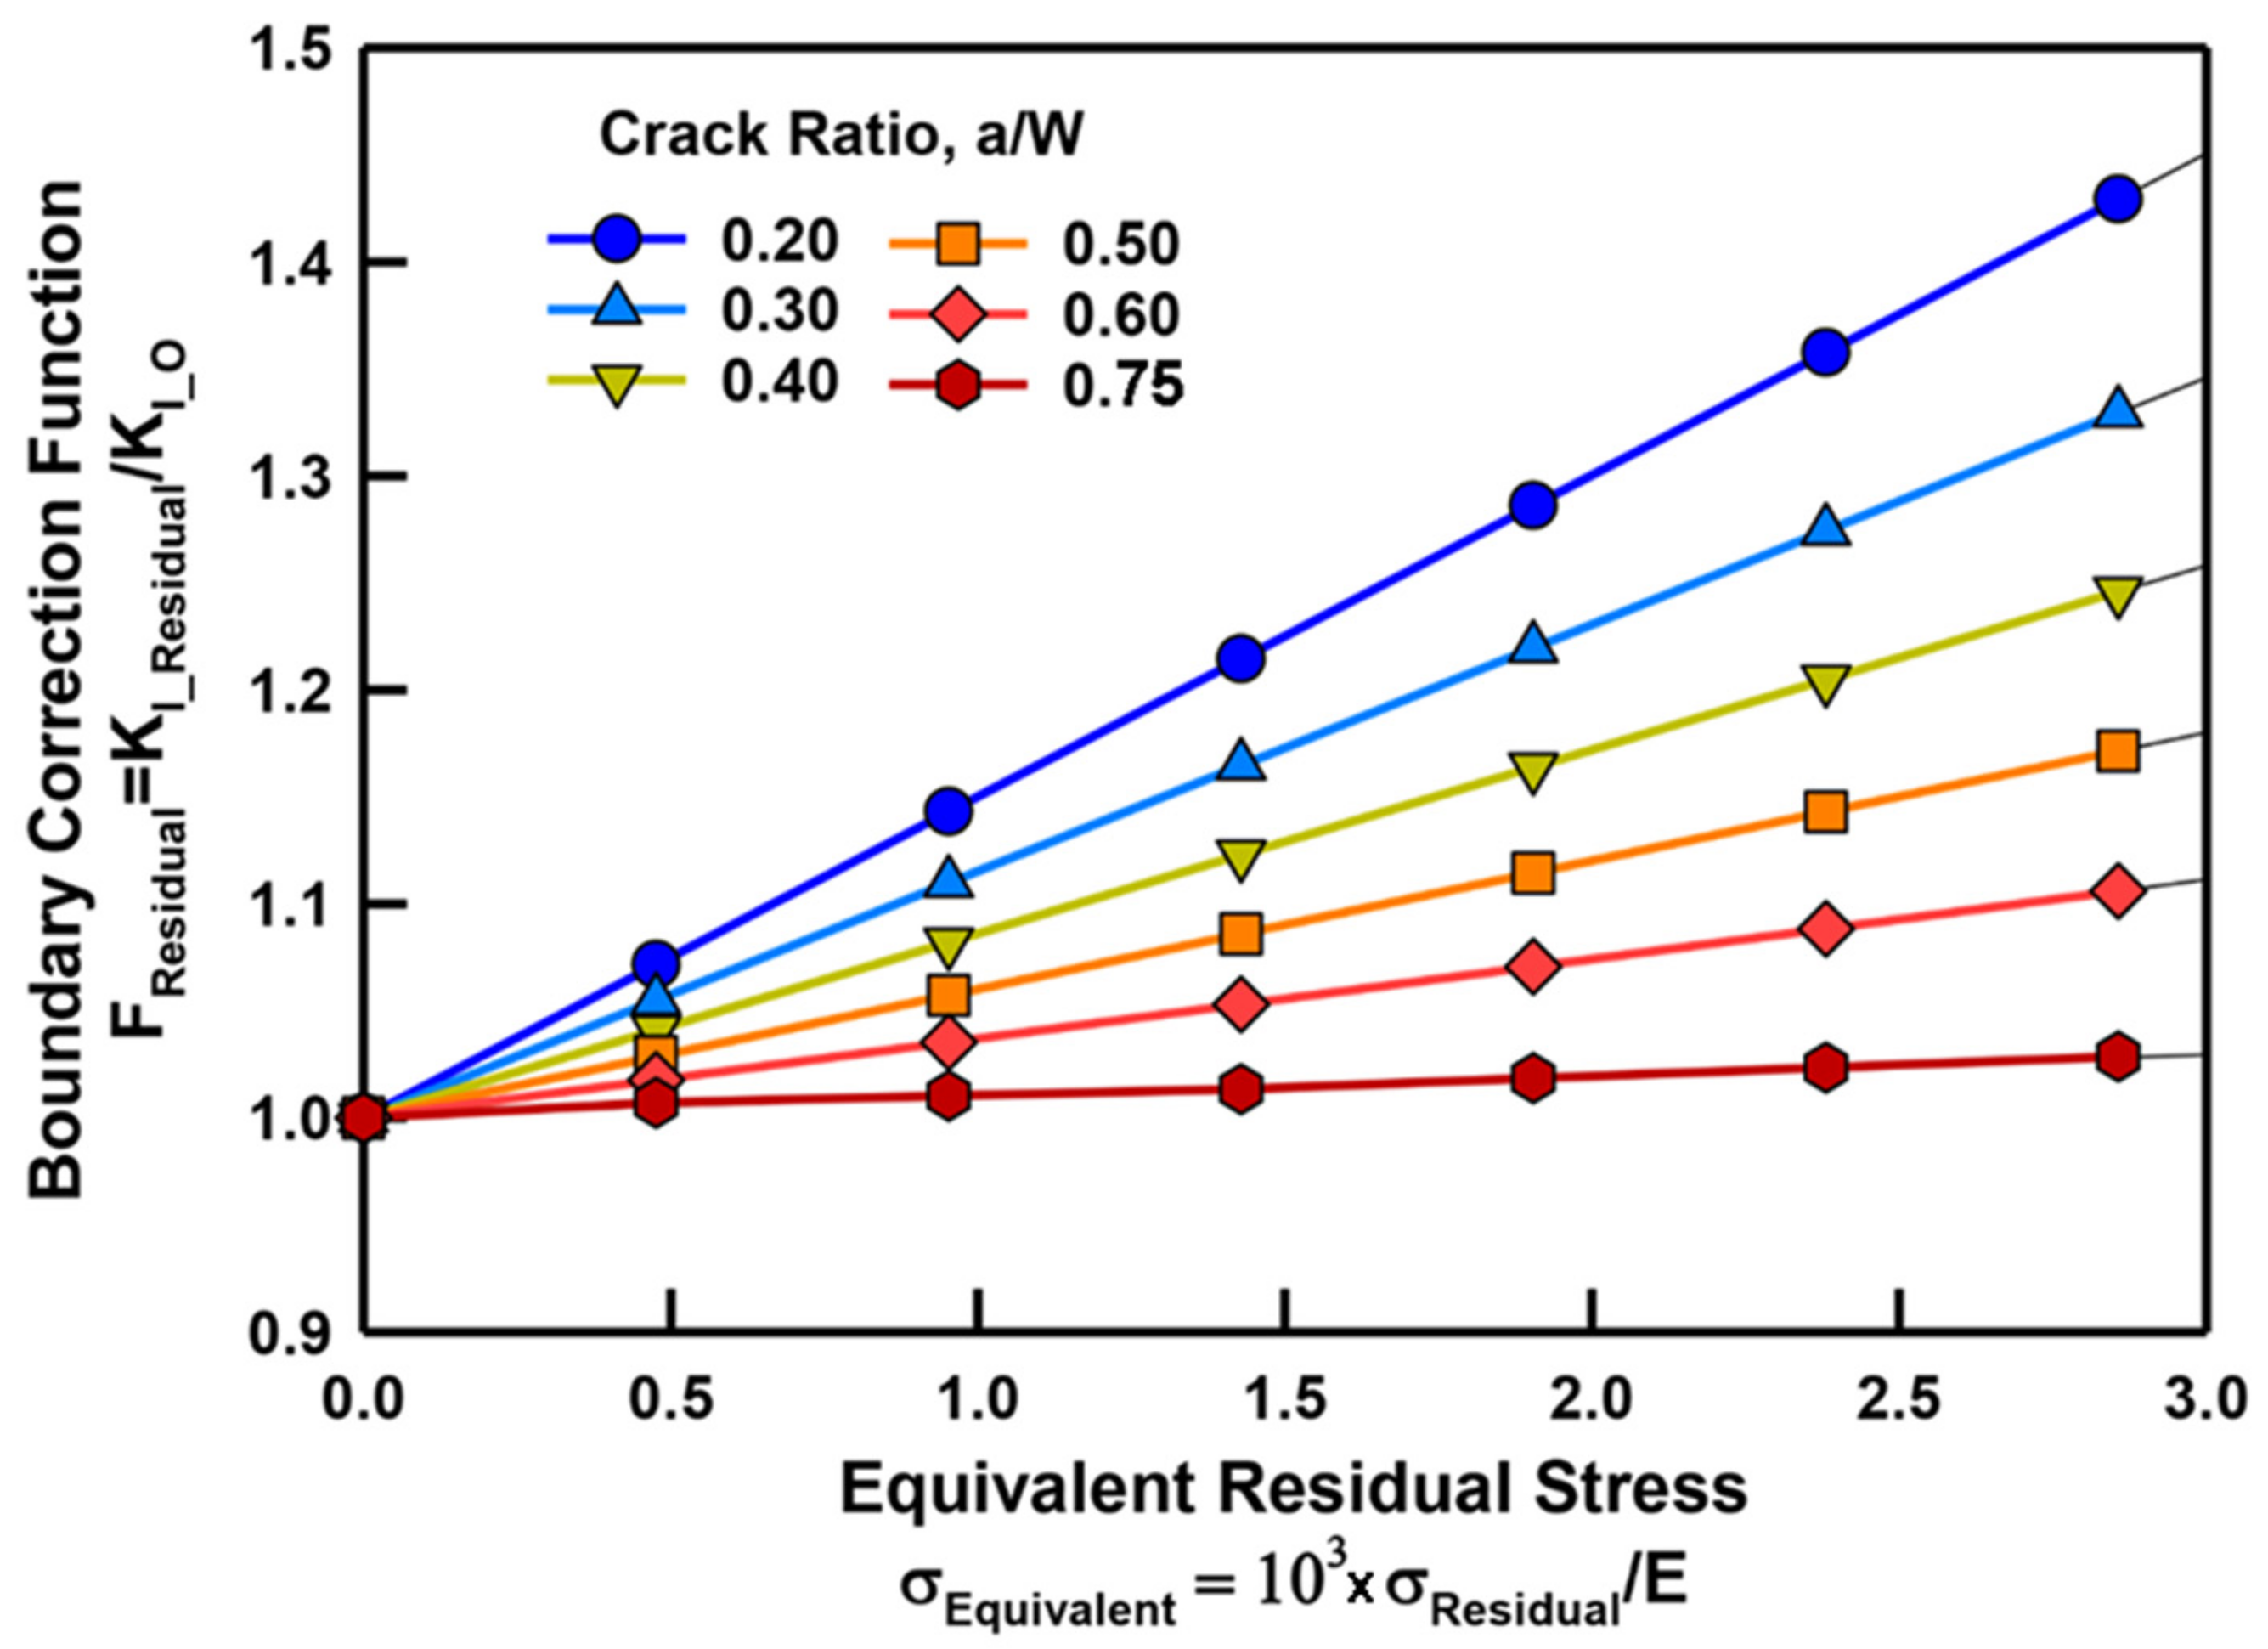
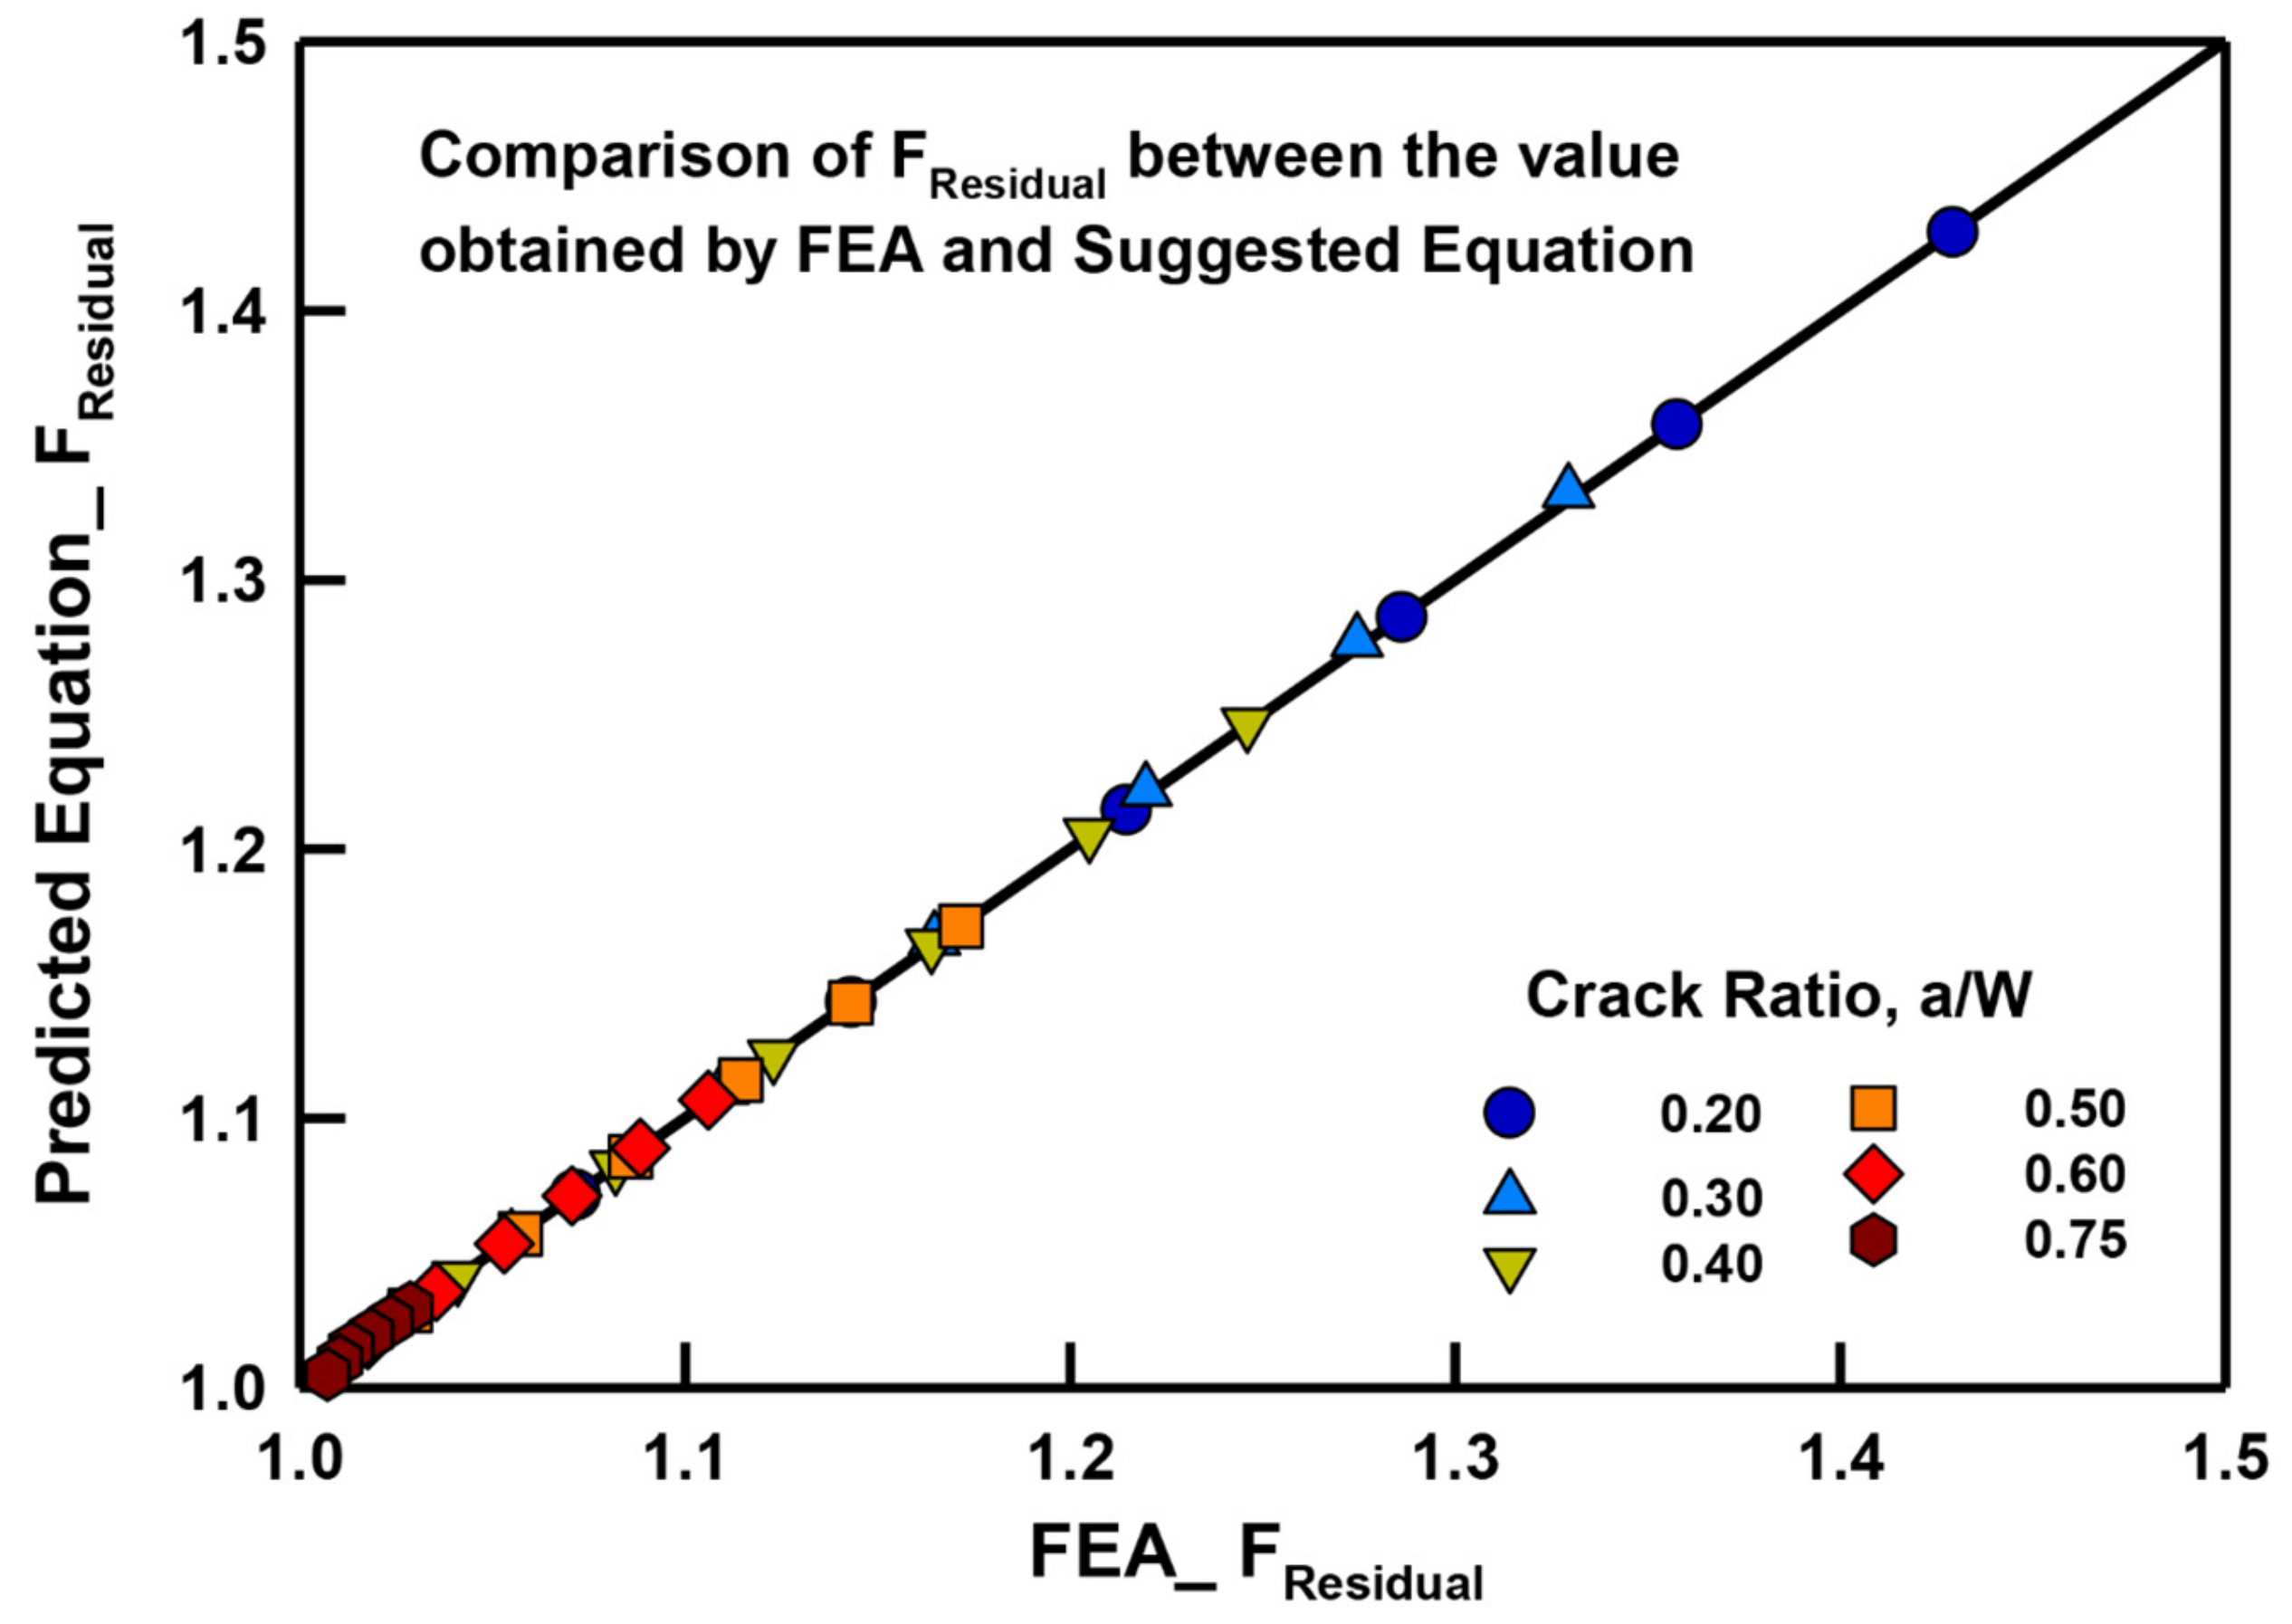
3.3. Suggested Equation for Stress Intensity Factor under the Effect of RS

In general, FCGR data are usually represented in the relation of crack growth rate, da/dN, against the SIF range, ΔK, where K is the linear elastic crack parameter which represents the amplitude of the crack tip singularity. It is a function of various factors such as specimen geometry, crack configuration, and loading conditions. The FCGR properties in terms of Paris’s law can be expressed in the relationships between da/dN and ΔK, as follows in Equations (3) and (4) [49]:
d a d N   =   C   Δ K m
Δ K   =   K max     K min   =   Δ σ Y a
where ΔK is the applied range of the KI values during the fatigue crack growth test. N denotes the number of cycles, and da is an increment of crack extension/growth per cycle. C and m are material properties for specific materials and experimental conditions. The most common analytical function of the SIF solution for the CT specimen is written as follows [47,48]:
K I 0   =   P B W F 0 a W
where P denotes the concentrated-applied force, B is the specimen thickness, a is the crack length, and W is the specimen width. The F0(a/W) function is called a boundary correction function for a specific specimen geometry. For CT specimen, the F0(a/W) function is generally expressed as follows [47]:
F 0 a W   =   2   +   a W 1     a W 3   0.886   +   4.64 a W     13.32 a W 2   +   14.72 a W 3       5.60 a W 4
As expressed in Equations (3) and (4), it is suggested that the effect of the RS on the fatigue life based on the fracture mechanics approaches can be quantitively taken into the change of the SIF values, denoted by an effective SIF, KI-Residual, as:
K I R e s i d u a l   =   K I 0 F R e s i d u a l σ R e s i d u a l , a W
where KI-0 is the SIF value due to the external loading, and KI-Residual is the additional SIF value due to the RS. F R e s i d u a l σ R e s i d u a l , a W is a boundary correction factor under the effect of peak RS, σ R e s i d u a l . The F R e s i d u a l function can be quantitatively evaluated using the ratio between KI-Residual and KI-0. A variation of normalized SIF values KI-Residual/KI-0 as a function of crack ratio, a/W, and peak stress, σ R e s i d u a l , is shown in Figure 11 and Table 2. It is noted that the peak RS values, σ R e s i d u a l , in Figure 11 are substituted by an equivalent RS value, σ E q u i v a l e n t   =   10 3 × σ R e s i d u a l / E . The estimated function for the F R e s i d u a l a W ,   σ E q u i v a l e n t function can be expressed in the form of Equations (4) and (5) using the least-squares regression method, as follows:
F R e s i d u a l a W ,   σ R e s i d u a l = i = 0 1 A i σ E q u i v a l e n t i = A 0 + A 1 σ E q u i v a l e n t
A i = i = 0 1 j = 0 2 B i j a W j = i = 0 1 B i 0 + B i 1 a W + B i 2 a W 2
Equation (5) can be written in matrix form, as follows:
A 0 A 1 = B 00 B 01 B 02 B 10 B 11 B 12 × 1 a / W a / W 2
In the correlation between Equations (8) and (10), the final expression of the F R e s i d u a l function can be rewritten in matrix form, as presented in Equation (6):
F R e s i d u a l a W ,   σ R e s i d u a l =   S   T   ×     B       ×       R
where the matrixes S and R are expressed as:   S =     1 σ E q u i v a l e n t and   R =   1 a / W a / W 2     . The coefficient matrix, B should be determined for various crack ratio, a/W, and out-of-plane crack separation. The least-squares fitting method was employed to evaluate the coefficient matrix B .
B       =       1 0 0 0.281 0.512 0.224
To verify the reliability of the estimating equation, the predicted F R e s i d u a l results using Equation (11) were compared with those estimated with FEA for various peak RSs and crack ratios (a/W), as shown in Figure 12 It can be shown that all data points posited within the 95% prediction interval region of a diagonal line represent equivalence between the predicted F R e s i d u a l results and those values calculated using the FEA. It can be argued that the estimation Equation (11) for F R e s i d u a l , with interpolation coefficient matrixes derived for a wide range of crack parameters, can be employed for the SIF, KI estimation under the effect of RS.
It is obviously well-known that the tensile RS presents detrimental effects on fatigue crack propagation behavior as well as on the fracture strength of the welded joints. Therefore, fatigue life assessment of welded joints under effect of the RS plays a key role in designing and maintaining welded structures. The obtained results of the boundary correction, FResidual, described here provide some useful information for designing as well as servicing appliance and maintenance adjustments of welded structures. Based on the results shown in Figure 8 and Figure 11 the tensile RS remarkably enhanced SIF values of the welded joint. A minor effect of RS on the SIF values when the peak RS was less than 300 MPa indicated that the secondary loads enhanced by RS were not sufficient to dominate the portion of the primary load in the SIF values. However, it should also be noted that only the peak RS had a remarkable effect on SIFs values, while the function of RS distribution may have played a lesser role. It is also reasonable to note that the FCG properties are primarily considered a function of SIF range, ΔK. Therefore, the effective function of KI, as shown in Equation (7), can be employed to quantitatively evaluate the effect of RS on the fatigue performance of welded joints, then improve the reliability of the crack growth measurements and the accuracy of fatigue life estimation.

4. Conclusions

The distribution behavior of the RS was strongly dependent on various factors such as the welding sequences, sample geometries, and the welded materials. The peak RS in welded components was found to be proportional to the yield strength of the materials. Several simplified models of RS distribution can be described accurately with some analytical functions, which were summarized in this paper.
The peak RS had a significant effect on the SIF values, while the function of RS distribution played a lesser role. The effect of RS on SIF values and KI was negligible when the peak RS was less than 300 MPa. When the peak RS was greater than 400 MPa, the lower the crack ratio, a/W, the more strongly the SIF and KI values were impacted. The effect of the expressed function of RS distribution on the KI values was less pronounced than the effect of the peak values of RS.
The effective boundary corrections function, FResidual, under the effect of RS for 1T CT specimen, was derived. These equations were valid for various crack geometries of the crack ratio—0.2, 0.40, 0.50, 0.60, and 0.75—and the peak RS varied from 100 MPa to 600 MPa. The analytical solutions for estimated SIF under the effect of the multiple RSs were derived in a matrix form and the accuracy of the estimated equation was verified.

Author Contributions

Conceptualization, T.T.N. and H.B.D.; methodology, T.T.N.; software, H.A.T. and H.B.D.; validation, T.T.N., H.A.T. and D.H.N.; formal analysis, T.T.N.; investigation, resources, V.S.P., H.A.T. and D.H.N.; data curation, D.H.N.; writing—original draft preparation, T.T.N.; writing—review and editing, T.T.N. and H.B.D.; supervision, V.S.P. and H.A.T.; project administration, T.H.N.; funding acquisition, V.S.P. and T.H.N. All authors have read and agreed to the published version of the manuscript.

Funding

This research received no external funding.

Data Availability Statement

Not applicable.

Acknowledgments

This research was funded by Hanoi University of Science and Technology (HUST) under project number T2022-TT-008.

Conflicts of Interest

The authors declare no conflict of interest.

References

  1. Hong, K.M.; Shin, Y.C. Prospects of laser welding technology in the automotive industry: A review. J. Mater. Process. Technol. 2017, 245, 46–69. [Google Scholar] [CrossRef]
  2. Little, R.L. Welding and Welding Technology; McGraw-Hill Book Co.: New York, NY, USA, 1973. [Google Scholar]
  3. Katayama, S. Handbook of Laser Welding Technologies; Elsevier: Amsterdam, The Netherlands, 2013. [Google Scholar]
  4. Ma, S.; Li, B.; Ma, Y.; Zhang, P.; Xu, P. Effect of Brazing Filler Metals and Welding Parameters on Laser Welding-Brazing Joints of WC-Co to S1045. Metals 2022, 12, 1780. [Google Scholar] [CrossRef]
  5. Krishnan, S.A.; Nikhil, R.; Sasikala, G.; Moitra, A.; Albert, S.K.; Bhaduri, A.K.; Raghava, G. Evaluation of fracture resistance of AISI type 316LN stainless steel base and welded pipes with circumferential through-wall crack. Int. J. Press. Vessel. Pip. 2019, 178, 104008. [Google Scholar] [CrossRef]
  6. Cavaliere, P.; Campanile, G.; Panella, F.; Squillace, A. Effect of welding parameters on mechanical and microstructural properties of AA6056 joints produced by friction stir welding. J. Mater. Process. Technol. 2006, 180, 263–270. [Google Scholar] [CrossRef]
  7. Bagheri, B.; Sharifi, F.; Abbasi, M.; Abdollahzadeh, A. On the role of input welding parameters on the microstructure and mechanical properties of Al6061-T6 alloy during the friction stir welding: Experimental and numerical investigation. Proc. Inst. Mech. Eng. Part L J. Mater. Des. Appl. 2022, 236, 299–318. [Google Scholar] [CrossRef]
  8. Abbasi, M.; Abdollahzadeh, A.; Bagheri, B.; Ostovari Moghaddam, A.; Sharifi, F.; Dadaei, M. Study on the effect of the welding environment on the dynamic recrystallization phenomenon and residual stresses during the friction stir welding process of aluminum alloy. Proc. Inst. Mech. Eng. Part L J. Mater. Des. Appl. 2021, 235, 1809–1826. [Google Scholar] [CrossRef]
  9. Bagheri, B.; Abbasi, M.; Sharifi, F. Study on Microstructure Evolution and Mechanical Properties of Al5083 Joint Obtained from Friction Stir Spot Welding: Effect of Vibration and Plunge Depth. In Engineering Principles: Welding and Residual Stresses; IntechOpen: London, UK, 2022; p. 133. [Google Scholar]
  10. Bagheri, B.; Abbasi, M.; Abdollahzadeh, A. Microstructure and mechanical characteristics of AA6061-T6 joints produced by friction stir welding, friction stir vibration welding and tungsten inert gas welding: A comparative study. Int. J. Miner. Metall. Mater. 2021, 28, 450–461. [Google Scholar] [CrossRef]
  11. Abdollahzadeh, A.; Bagheri, B.; Abassi, M.; Kokabi, A.H.; Moghaddam, A.O. Comparison of the weldability of AA6061-T6 joint under different friction stir welding conditions. J. Mater. Eng. Perform. 2021, 30, 1110–1127. [Google Scholar] [CrossRef]
  12. Kong, D.; Wu, Y.; Long, D.; Zhou, C. Tension fracture behaviors of welded joints in X70 steel pipeline. Theor. Appl. Mech. Lett. 2011, 1, 031008. [Google Scholar] [CrossRef] [Green Version]
  13. Bukovská, Š.; Moravec, J.; Solfronk, P.; Pekárek, M. Assessment of the Effect of Residual Stresses Arising in the HAZ of Welds on the Fatigue Life of S700MC Steel. Metals 2022, 12, 1890. [Google Scholar] [CrossRef]
  14. Cao, J.; Ma, W.; Pang, G.; Wang, K.; Ren, J.; Nie, H.; Yao, T. Failure analysis on girth weld cracking of underground tee pipe. Int. J. Press. Vessel. Pip. 2021, 191, 104371. [Google Scholar] [CrossRef]
  15. Ramakokovhu, U.; Desai, D.; Snedden, G.; Jamiru, T. Significance of residual stresses in fatigue life prediction of micro gas turbine blades. Eng. Fail. Anal. 2021, 120, 105092. [Google Scholar] [CrossRef]
  16. Vaara, J.; Kunnari, A.; Frondelius, T. Literature review of fatigue assessment methods in residual stressed state. Eng. Fail. Anal. 2020, 110, 104379. [Google Scholar] [CrossRef]
  17. Gadallah, R.; Osawa, N.; Tanaka, S.; Tsutsumi, S. Critical investigation on the influence of welding heat input and welding residual stress on stress intensity factor and fatigue crack propagation. Eng. Fail. Anal. 2018, 89, 200–221. [Google Scholar] [CrossRef]
  18. Francis, J.A.; Bhadeshia, H.K.D.H.; Withers, P.J. Welding residual stresses in ferritic power plant steels. Mater. Sci. Technol. 2007, 23, 1009–1020. [Google Scholar] [CrossRef]
  19. Leggatt, R.H. Residual stresses in welded structures. Int. J. Press. Vessel. Pip. 2008, 85, 144–151. [Google Scholar] [CrossRef]
  20. Withers, P.J.; Bhadeshia, H.K.D.H. Residual stress. Part 2—Nature and origins. Mater. Sci. Technol. 2001, 17, 366–375. [Google Scholar] [CrossRef]
  21. Yukio, U.E.D.A.; Chul, K.Y.; Gang, Y.M. A predicting method of welding residual stress using source of residual stress (report I): Characteristics of inherent strain (source of residual stress) (mechanics, strength & structural design). Trans. JWRI 1989, 18, 135–141. [Google Scholar]
  22. Nguyen, T.T.; Yoon, K.B.; Vu, T.T.; Park, J.; Baek, U.B. On the changes in the low-cycle-fatigue life and cracking mechanism of P91 cross-weld specimens at elevated temperatures. Int. J. Fatigue 2022, 159, 106833. [Google Scholar] [CrossRef]
  23. Nguyen, T.T.; Beak, U.B.; Park, J.; Nahm, S.H.; Tak, N. Hydrogen environment assisted cracking in X70 welding heat-affected zone under a high-pressure hydrogen gas. Theor. Appl. Fract. Mech. 2020, 109, 102746. [Google Scholar] [CrossRef]
  24. Ghaini, F.M.; Ebrahimnia, M.; Gholizade, S. Characteristics of cracks in heat affected zone of ductile cast iron in powder welding process. Eng. Fail. Anal. 2011, 18, 47–51. [Google Scholar] [CrossRef]
  25. Karadeniz, E.; Ozsarac, U.; Yildiz, C. The effect of process parameters on penetration in gas metal arc welding processes. Mater. Des. 2007, 28, 649–656. [Google Scholar] [CrossRef]
  26. Ren, S.R.; Ma, Z.Y.; Chen, L.Q. Effect of welding parameters on tensile properties and fracture behavior of friction stir welded Al–Mg–Si alloy. Scr. Mater. 2007, 56, 69–72. [Google Scholar] [CrossRef]
  27. Shakil, M.; Tariq, N.H.; Ahmad, M.; Choudhary, M.A.; Akhter, J.I.; Babu, S.S. Effect of ultrasonic welding parameters on microstructure and mechanical properties of dissimilar joints. Mater. Des. 2014, 55, 263–273. [Google Scholar] [CrossRef]
  28. ISO 12108; 2012 Metallic Materials—Fatigue Testing—Fatigue Crack Growth Method. British Standards Institution: London, UK, 2012.
  29. John, R.; Jata, K.V.; Sadananda, K. Residual stress effects on near-threshold fatigue crack growth in friction stir welds in aerospace alloys. Int. J. Fatigue 2003, 25, 939–948. [Google Scholar] [CrossRef]
  30. Beghini, M.; Bertini, L. Fatigue crack propagation through residual stress fields with closure phenomena. Eng. Fract. Mech. 1990, 36, 379–387. [Google Scholar] [CrossRef]
  31. Ma, Y.E.; Staron, P.; Fischer, T.; Irving, P.E. Size effects on residual stress and fatigue crack growth in friction stir welded 2195-T8 aluminium–Part II: Modelling. Int. J. Fatigue 2011, 33, 1426–1434. [Google Scholar] [CrossRef] [Green Version]
  32. Moshayedi, H.; Sattari-Far, I. The effect of welding residual stresses on brittle fracture in an internal surface cracked pipe. Int. J. Press. Vessel. Pip. 2015, 126, 29–36. [Google Scholar] [CrossRef]
  33. LaRue, J.E.; Daniewicz, S.R. Predicting the effect of residual stress on fatigue crack growth. Int. J. Fatigue 2007, 29, 508–515. [Google Scholar] [CrossRef]
  34. Muñoz, J.A.; Dolgach, E.; Tartalini, V.; Risso, P.; Avalos, M.; Bolmaro, R.; Cabrera, J.M. Microstructural Heterogeneity and Mechanical Properties of a Welded Joint of an Austenitic Stainless Steel. Metals 2023, 13, 245. [Google Scholar] [CrossRef]
  35. Ronevich, J.A.; Song, E.J.; Feng, Z.; Wang, Y.; D’Elia, C.; Hill, M.R. Fatigue crack growth rates in high pressure hydrogen gas for multiple X100 pipeline welds accounting for crack location and residual stress. Eng. Fract. Mech. 2020, 228, 106846. [Google Scholar] [CrossRef]
  36. Lam, Y.C.; Lian, K.S. The effect of residual stress and its redistribution of fatigue crack growth. Theor. Appl. Fract. Mech. 1989, 12, 59–66. [Google Scholar] [CrossRef]
  37. Srivastava, B.K.; Tewari, S.P.; Prakash, J. A review on effect of preheating and/or post weld heat treatment (PWHT) on mechanical behavior of ferrous metals. Int. J. Eng. Sci. Technol. 2010, 2, 625–631. [Google Scholar]
  38. Carone, S.; Corigliano, P.; Epasto, G.; Moramarco, V.; Palomba, G.; Pappalettera, G.; Casavola, C. Innovative Approach for the Evaluation of the Mechanical Behavior of Dissimilar Welded Joints. Metals 2022, 12, 2039. [Google Scholar] [CrossRef]
  39. Prabakaran, M.P.; Kannan, G.R. Effects of post-weld heat treatment on dissimilar laser welded joints of austenitic stainless steel to low carbon steel. Int. J. Press. Vessel. Pip. 2021, 191, 104322. [Google Scholar] [CrossRef]
  40. Jiang, W.; Luo, Y.; Zeng, Q.; Wang, J.; Tu, S.T. Residual stresses evolution during strip clad welding, post welding heat treatment and repair welding for a large pressure vessel. Int. J. Press. Vessel. Pip. 2021, 189, 104259. [Google Scholar] [CrossRef]
  41. Liu, C.; Zhang, J.X.; Xue, C.B. Numerical investigation on residual stress distribution and evolution during multipass narrow gap welding of thick-walled stainless-steel pipes. Fusion Eng. Des. 2011, 86, 288–295. [Google Scholar] [CrossRef]
  42. Wang, X.; Gong, J.; Zhao, Y.; Wang, Y.; Ge, Z. Numerical simulation to study the effect of arc travelling speed and welding sequences on residual stresses in welded sections of new ferritic p92 pipes. High Temp. Mater. Process. 2016, 35, 121–128. [Google Scholar] [CrossRef]
  43. Deng, D. FEM prediction of welding residual stress and distortion in carbon steel considering phase transformation effects. Mater. Des. 2009, 30, 359–366. [Google Scholar] [CrossRef]
  44. Farajian, M. Welding residual stress behavior under mechanical loading: Henry Granjon prize competition 2012 winner category C: Design and structural integrity. Weld. World 2013, 57, 157–169. [Google Scholar] [CrossRef]
  45. Terada, H. An Analysis of the Stress Intensity Factor of a Crack Perpendicular to the Welding Bead. Eng. Fract. Mech. 1976, 8, 441–444. [Google Scholar] [CrossRef]
  46. Tada, H.; Paris, P.C. The Stress Intensity Factor for a Crack Perpendicular to the Welding Bead. Int. J. Fract. 1983, 21, 279–284. [Google Scholar] [CrossRef]
  47. Srawley, J.E. Wide Range Stress Intensity Factor for ASTME399 Standard Fracture Toughness Specimens. Int. J. Fract. 1976, 12, 475–476. [Google Scholar] [CrossRef]
  48. Tada, H.; Paris, P.C.; Irwin, G.R. The Stress Analysis of Cracks Handbook; Paris Productions & Del Research Corp.: Saint Louis, France, 1985. [Google Scholar]
  49. Paris, P.C.; Erdogen, F. A critical analysis of crack propagation laws. Trans. ASME. Ser. D J. Basic Eng. 1963, 85, 528–534. [Google Scholar] [CrossRef]
Figure 1. A typical illustration of sampling positions of the fracture toughness and fatigue crack growth test specimen in a weld joint.
Metals 13 01132 g001
Figure 2. A simplified function of the residual stress distribution that exists in a weld joint.
Metals 13 01132 g002
Figure 3. Comparison of residual stress distribution with a peak residual stress of 600 MPa according to Terada’s equation (Equation (1)) and Tada and Paris’s equation (Equation (2)).
Metals 13 01132 g003
Figure 4. Comparison of residual stress distribution follows Equation (1) with a constant of the peak residual stress at 600 MPa and various c values from 2 mm to 4 mm.
Metals 13 01132 g004
Figure 5. Specimen geometry, boundary conditions, and typical meshing in finite element analysis model.
Metals 13 01132 g005
Figure 6. Methodology for integrating residual stress into the FEA model.
Metals 13 01132 g006
Figure 7. Comparison of SIF, KI of 1T CT specimen without the effect of RS between the values calculated using analytical solutions and FEA results.
Metals 13 01132 g007
Figure 8. Results of SIF, KI values for various crack geometries and various levels of the peak RS.
Metals 13 01132 g008
Figure 9. Effect of the function of RS distribution on the results SIF, KI of the 1T CT specimen with a constant crack ratio, a/W = 0.5.
Metals 13 01132 g009
Figure 10. Effect of the delimitation parameter, c, on the SIF, KI results of the 1T CT specimen with a/W = 0.5.
Metals 13 01132 g010
Figure 11. Variation in normalized SIF, (KI-Residual/KI-0), for various crack geometries and the level of the peak RS.
Metals 13 01132 g011
Figure 12. Comparisons of interaction factors obtained using FEA with the values obtained by Equation (8).
Metals 13 01132 g012
Table 1. Residual stress distribution behavior in the various weld joints.
MaterialWelded Joint GeometryResidual Stress Distribution BehaviorRef.
Stainless steelThick-walled pipeThe value of tensile RS on the outer is significantly higher than that at the inner surfaces[41]
Ferritic P92 steelThin-walled pipeThe peak values of tensile RS on the outer and inner surfaces are nearly identical[42]
Low-carbon steel (S15C), Medium-carbon steel (S45C)PlateInsignificant RS exists in the weld joint of low-carbon steel (S15C)–low strength material, while a considerable RS is present in the weld zone of medium-carbon steel (S45C)–higher strength material[43]
Different steels: S235JRG2,
S355J2G3, P460NL, S690QL, S960QL, and S1100QL
PlatePeak tensile RS is proportional to the yield strength of materials[44]
Table 2. Boundary correction factor, FResidual, for different crack geometries of a/W from 0.2 to 0.75 and a peak residual stress from 100 MPa to 600 MPa.
Peak RS
(MPa)
Crack Ratio, a/W
0.20.30.40.50.60.75
6001.551.431.331.241.161.07
5001.461.361.271.21.141.06
4001.371.291.221.161.111.05
3001.281.221.171.121.091.04
2001.191.151.111.091.061.03
1001.11.081.061.051.031.02
Disclaimer/Publisher’s Note: The statements, opinions and data contained in all publications are solely those of the individual author(s) and contributor(s) and not of MDPI and/or the editor(s). MDPI and/or the editor(s) disclaim responsibility for any injury to people or property resulting from any ideas, methods, instructions or products referred to in the content.

