
Research on the Formation, Microstructure, and Properties of 304 Stainless Steel AC-DC Hybrid TIG Welding
Abstract
:1. Introduction
2. Experimental Materials and Experimental Methods
2.1. Experimental Materials
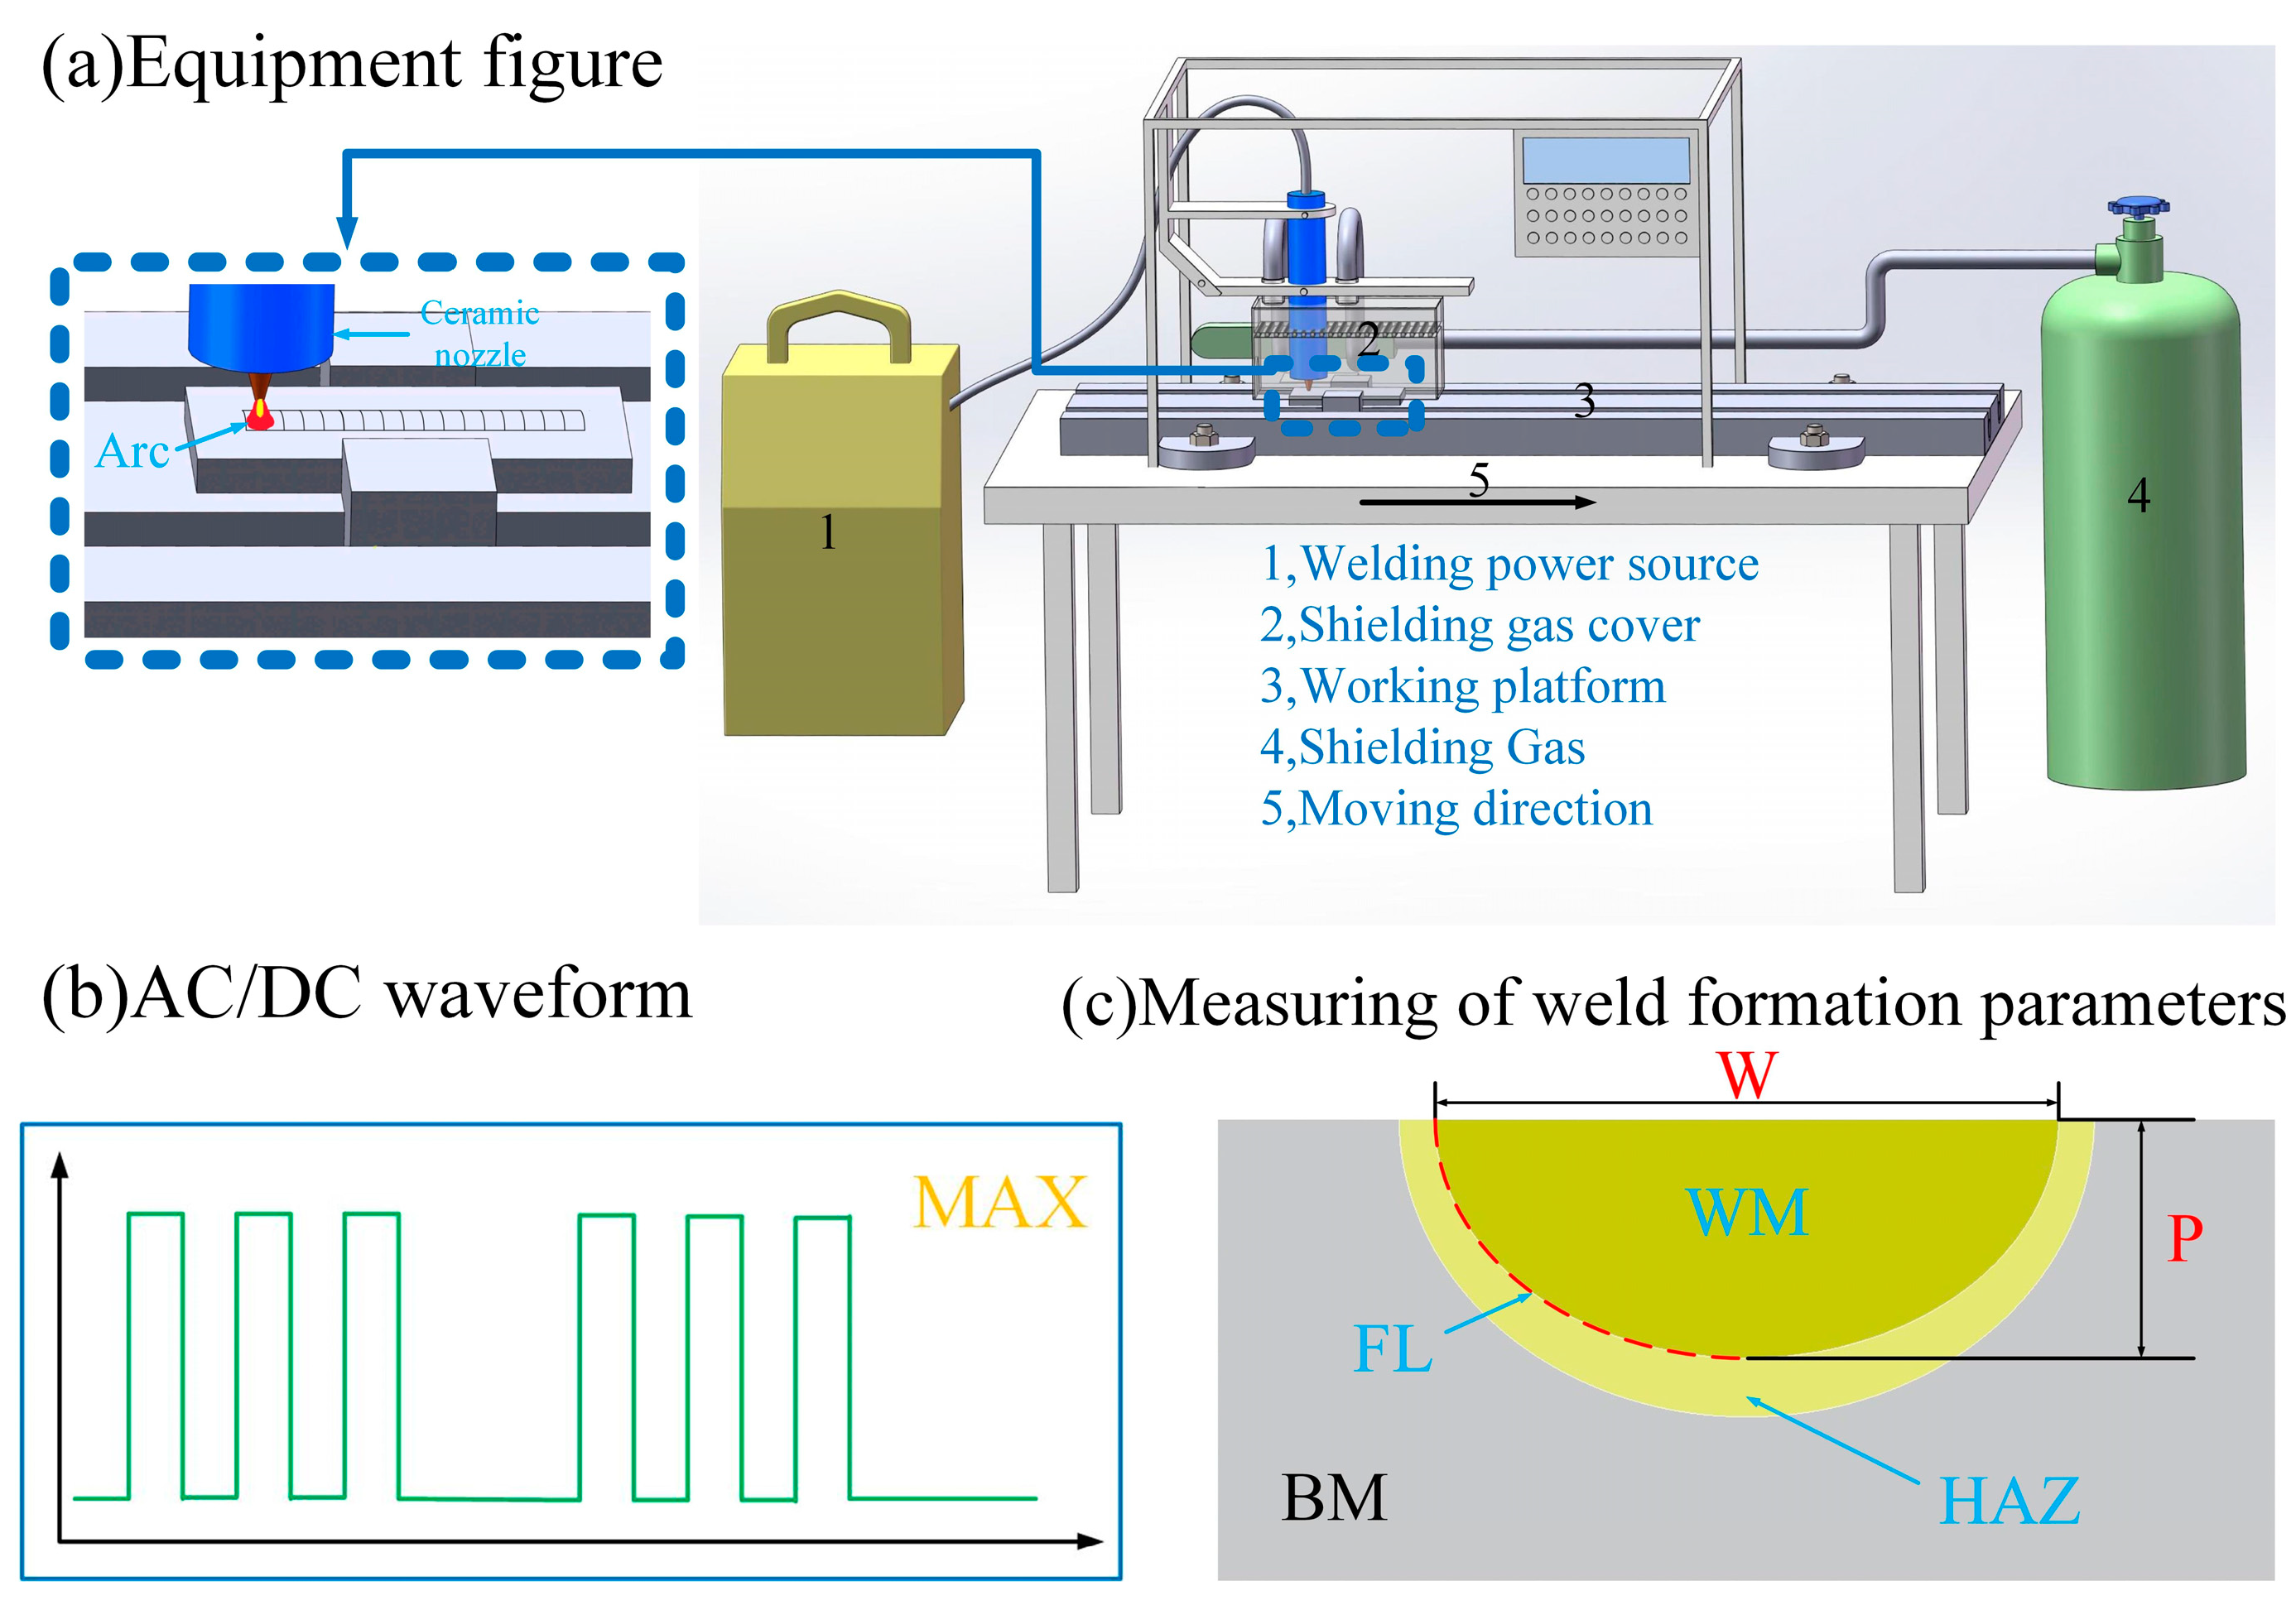
2.2. Experimental Method
3. Experimental Results and Discussion
3.1. Weld Forming
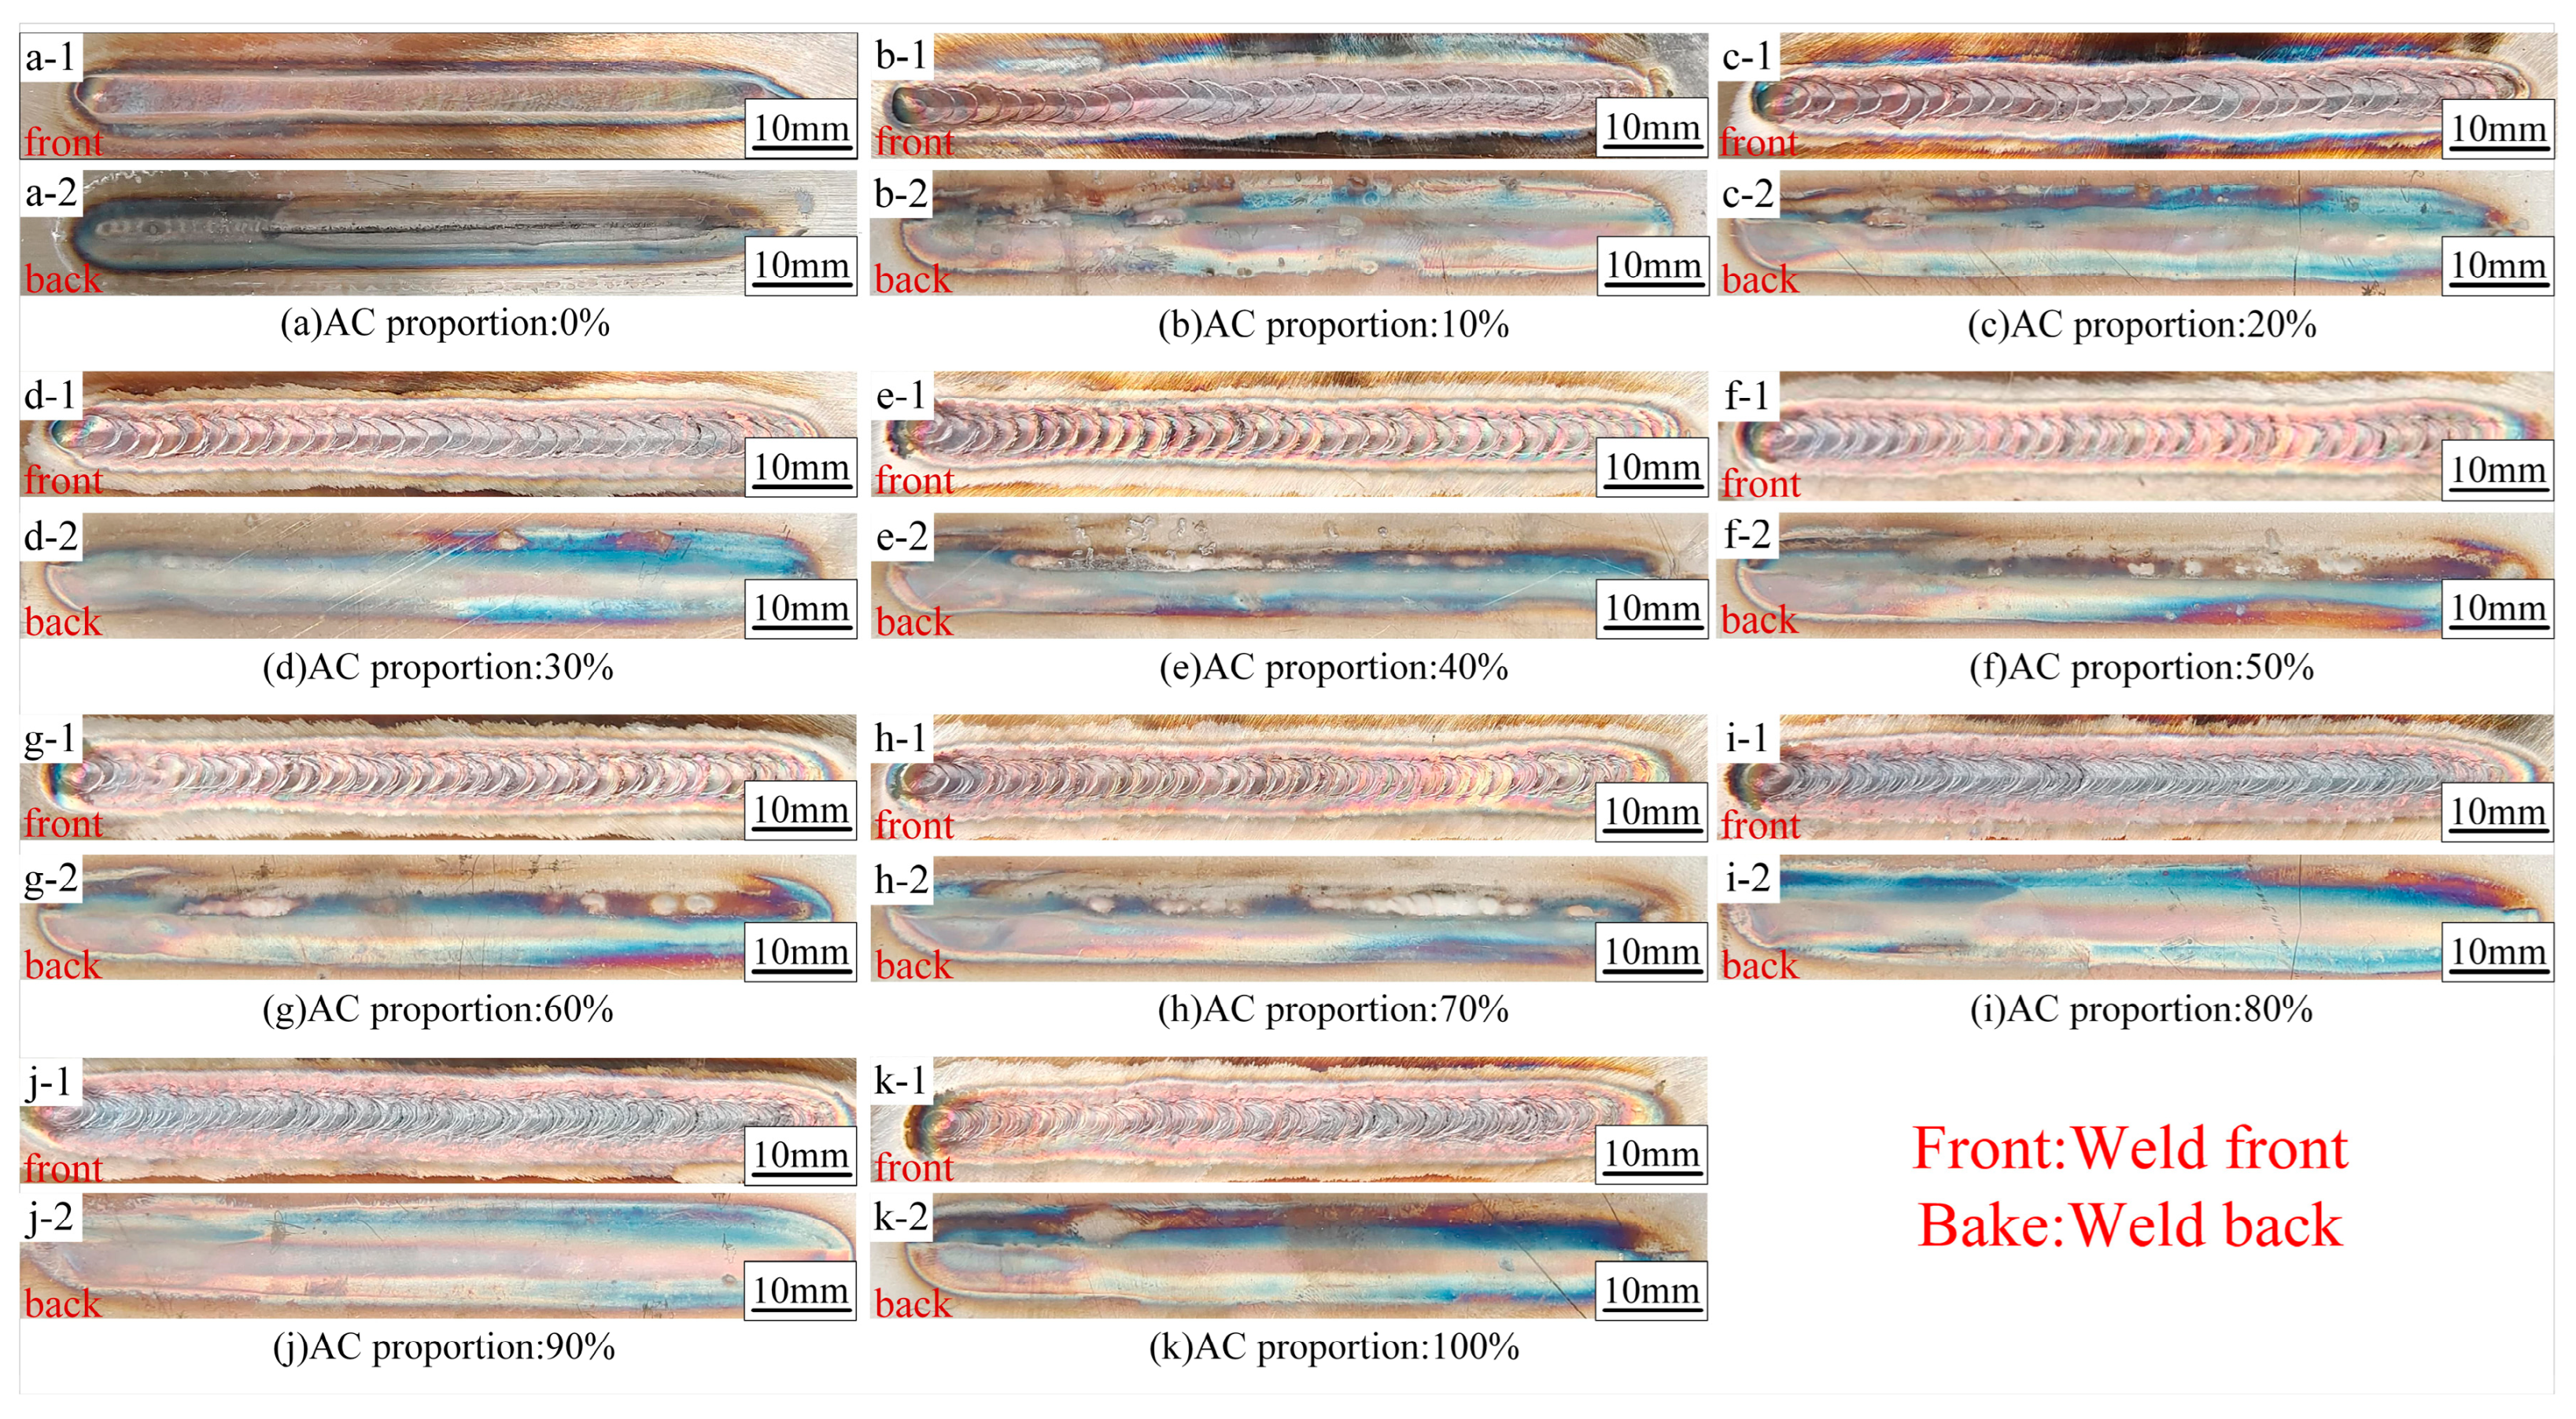
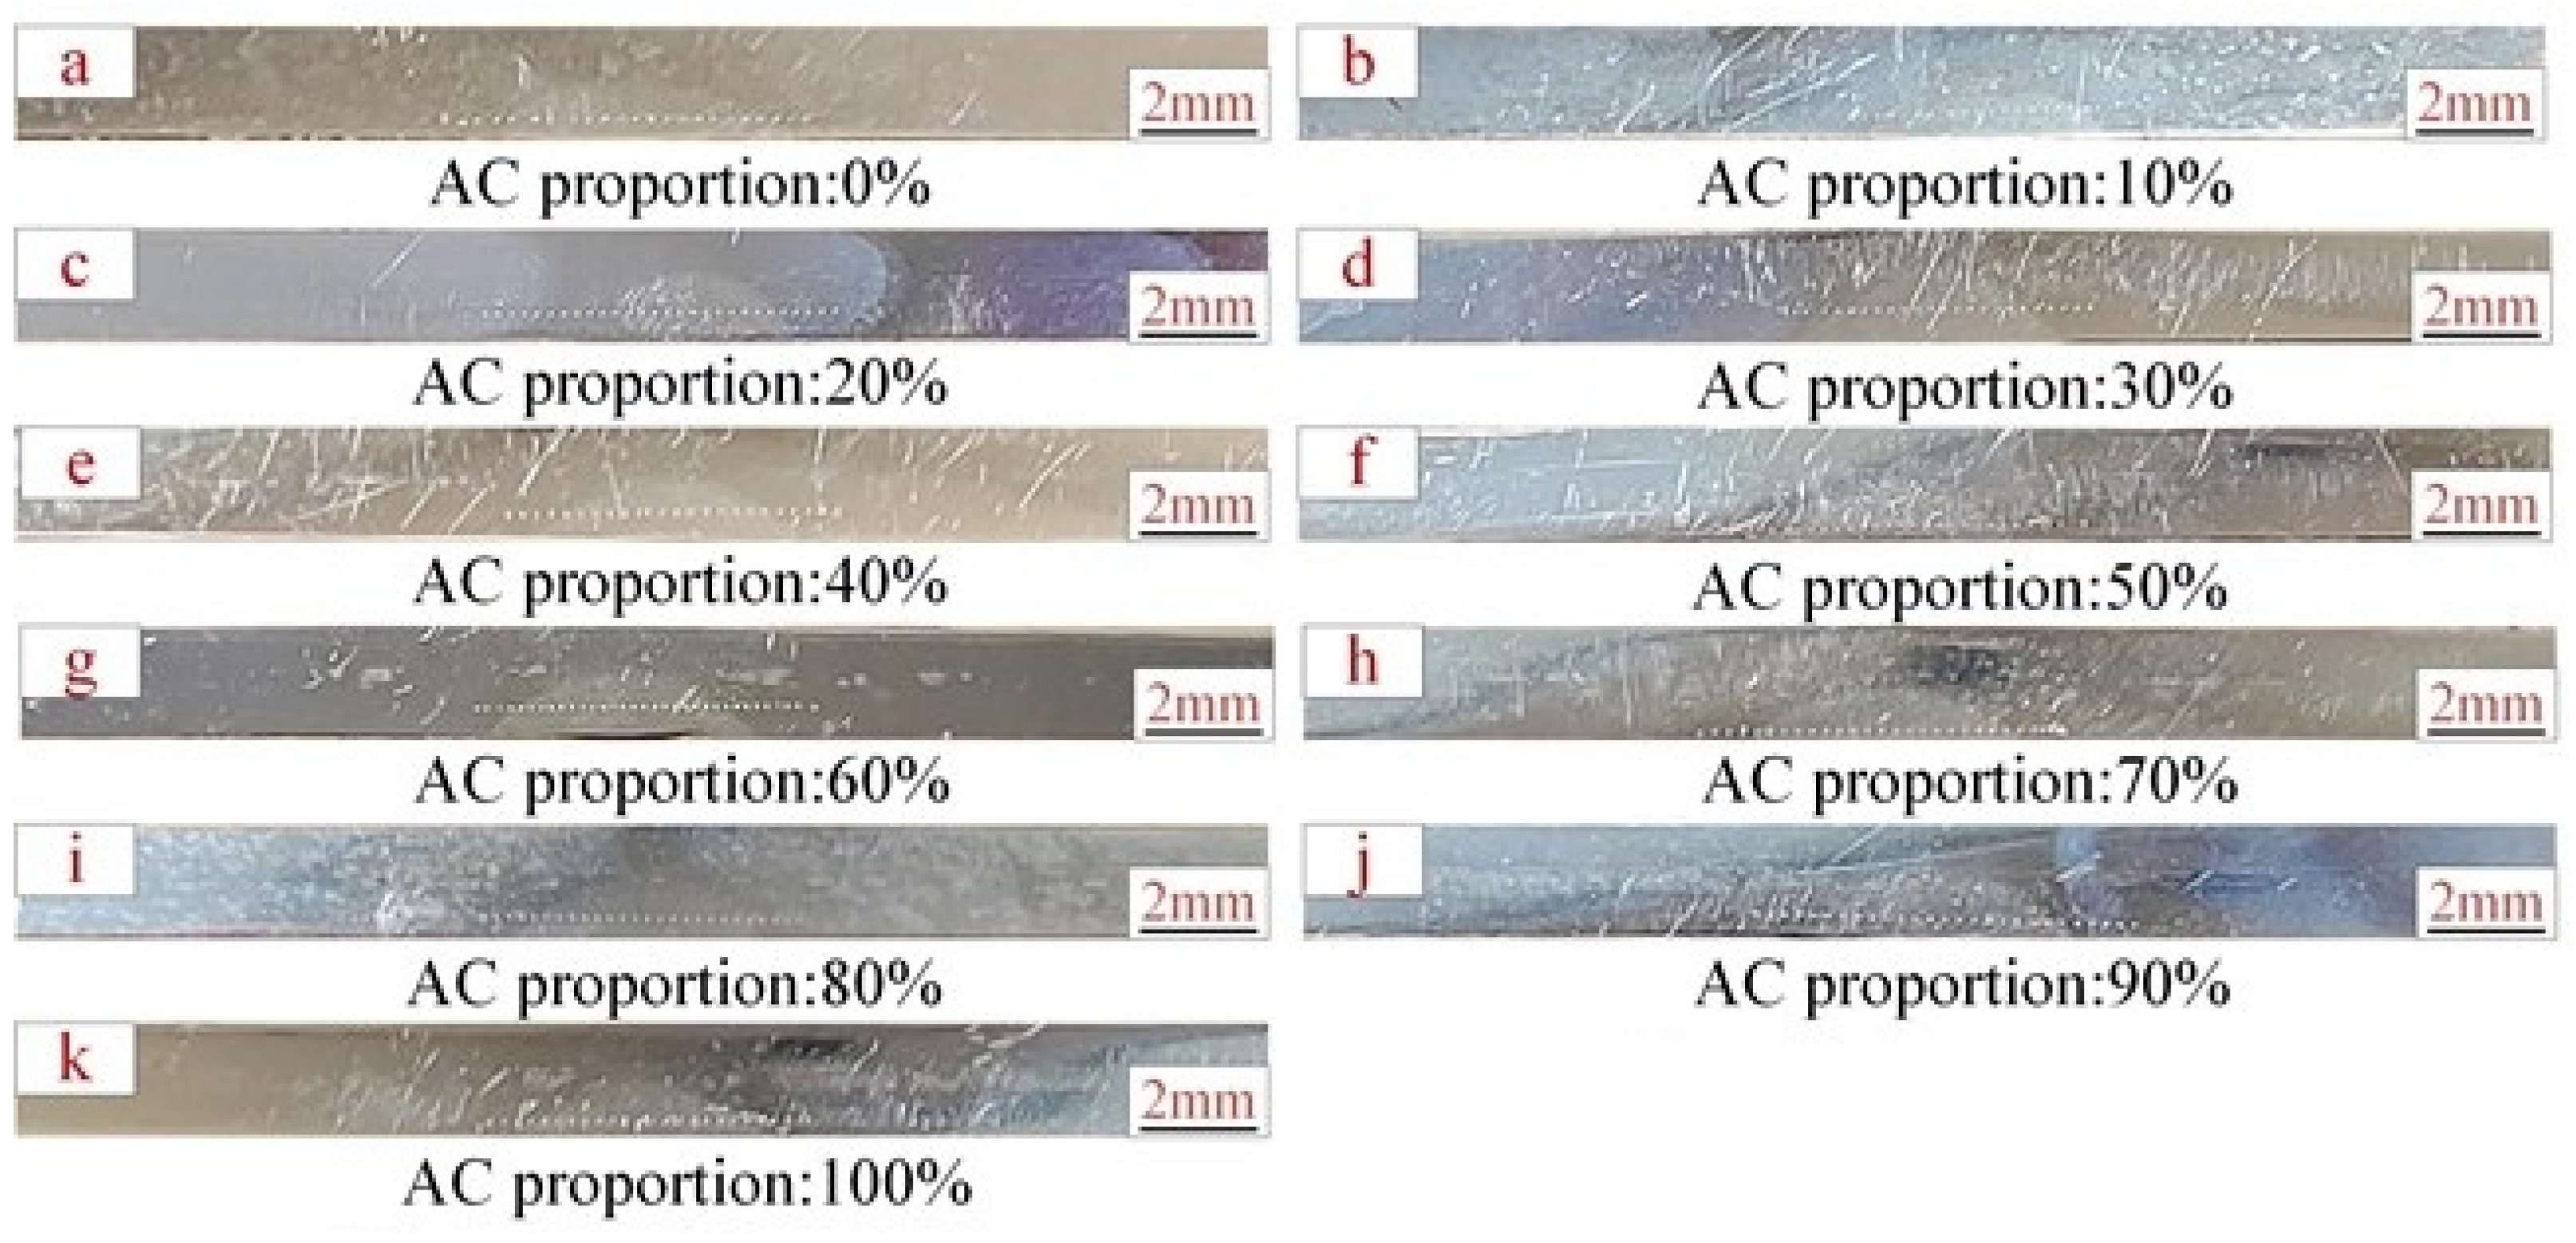
3.1.1. Weld Appearance
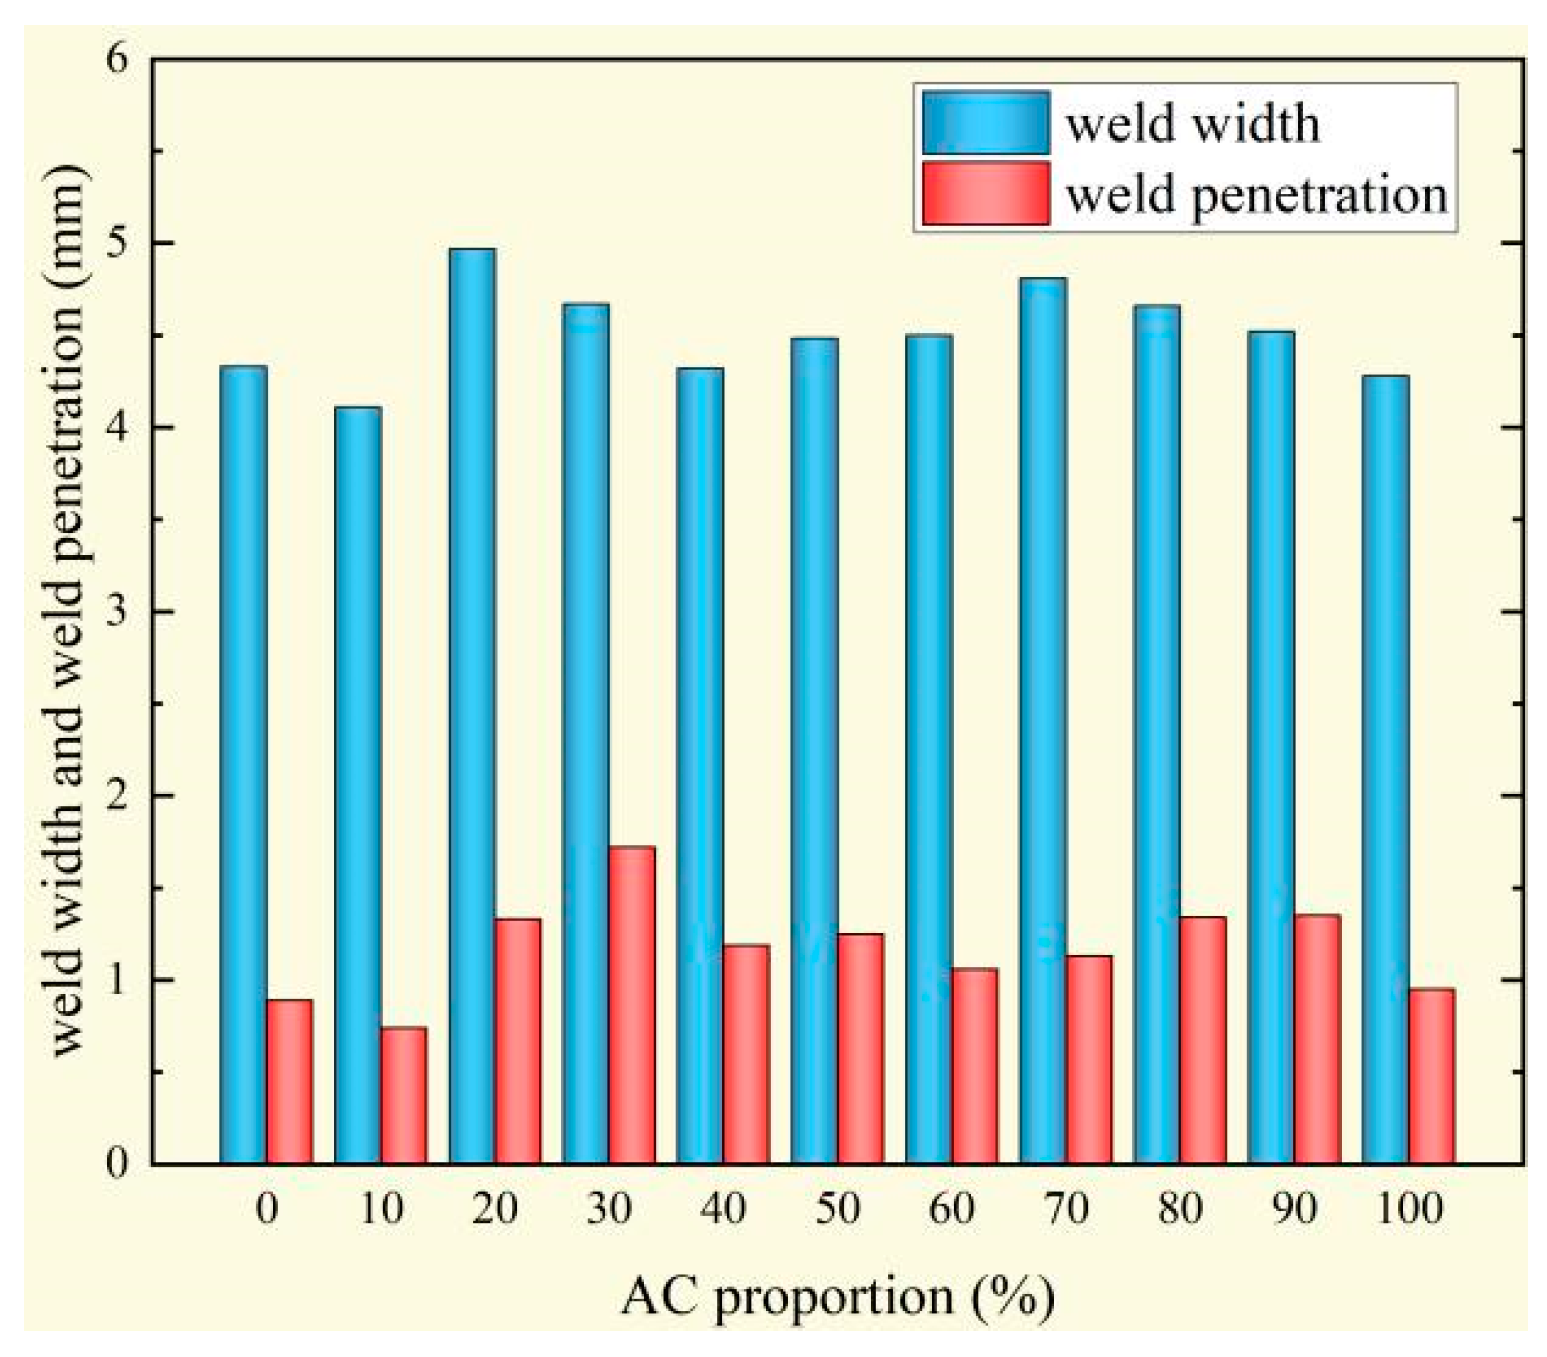
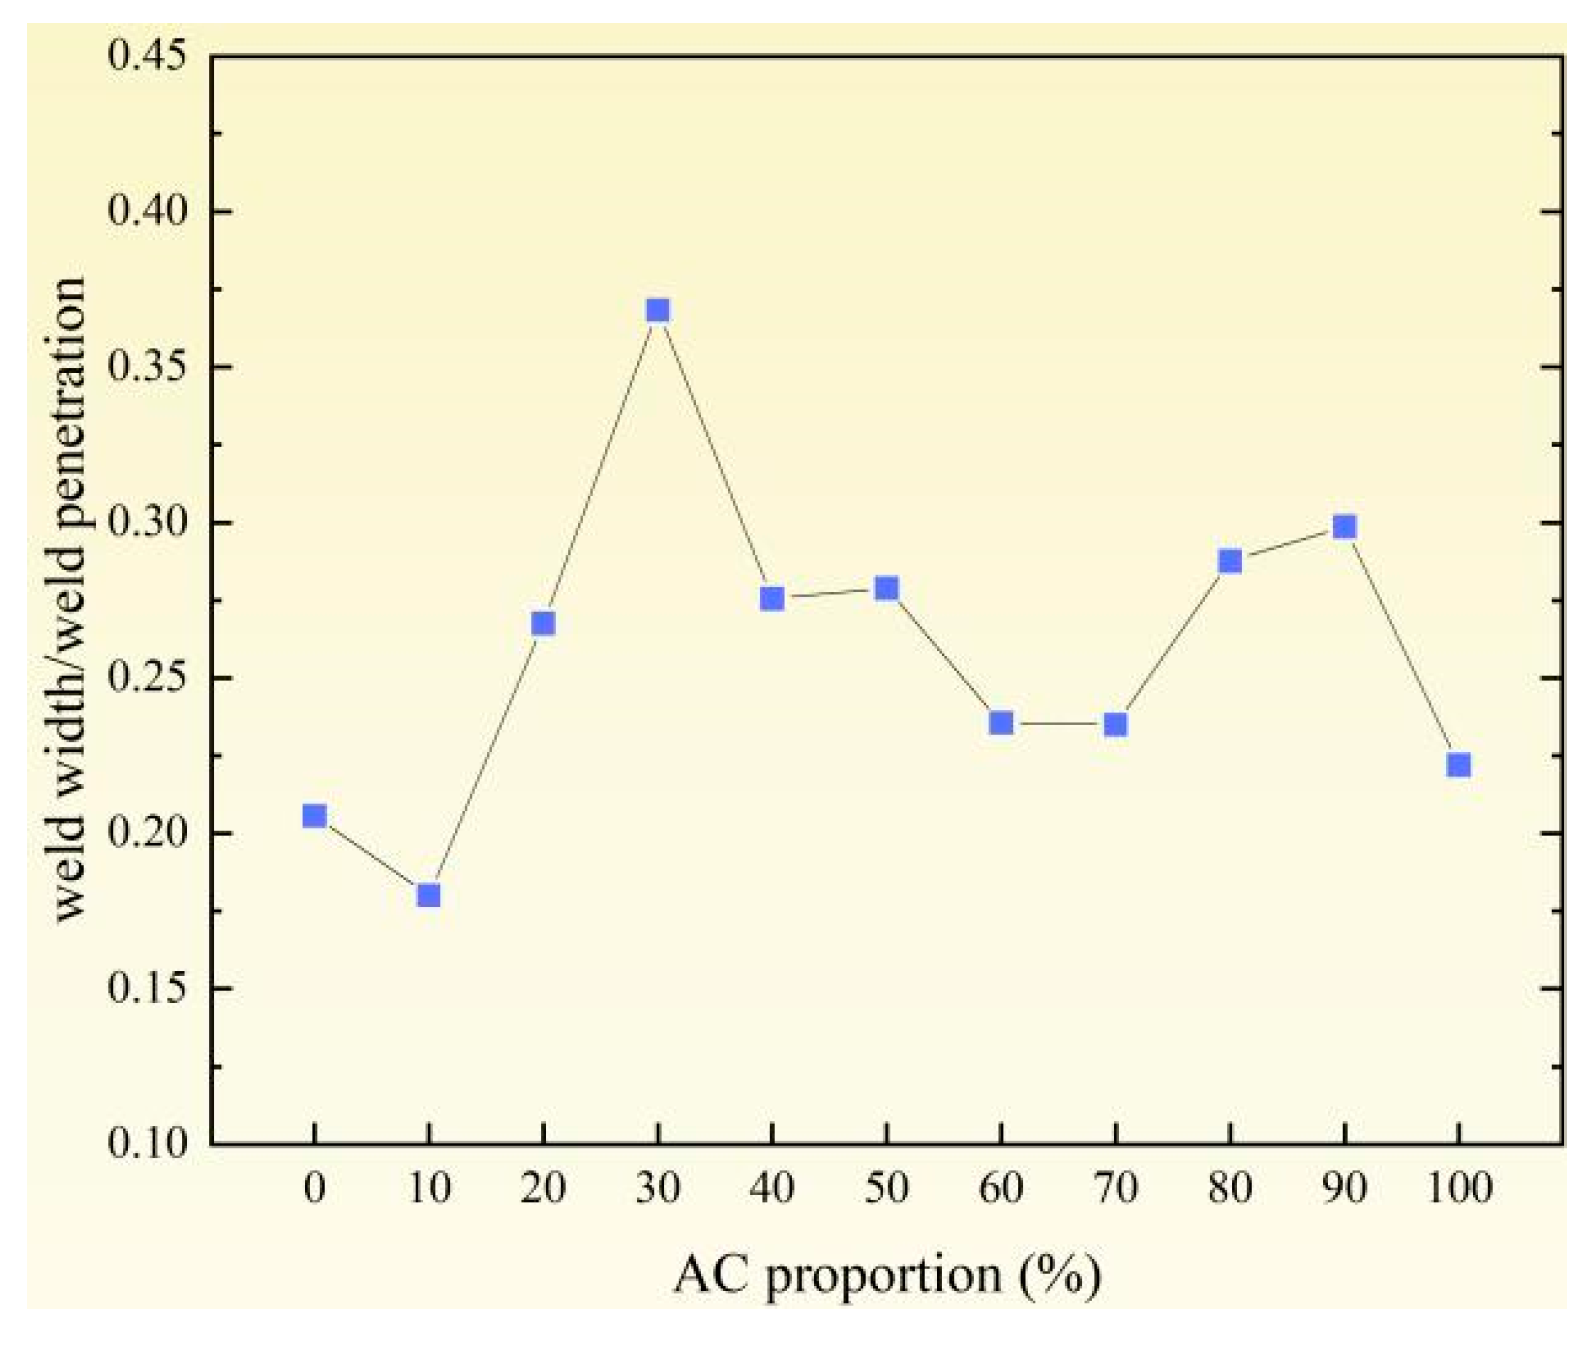
3.1.2. Weld Penetration and Weld Width and Their Ratio
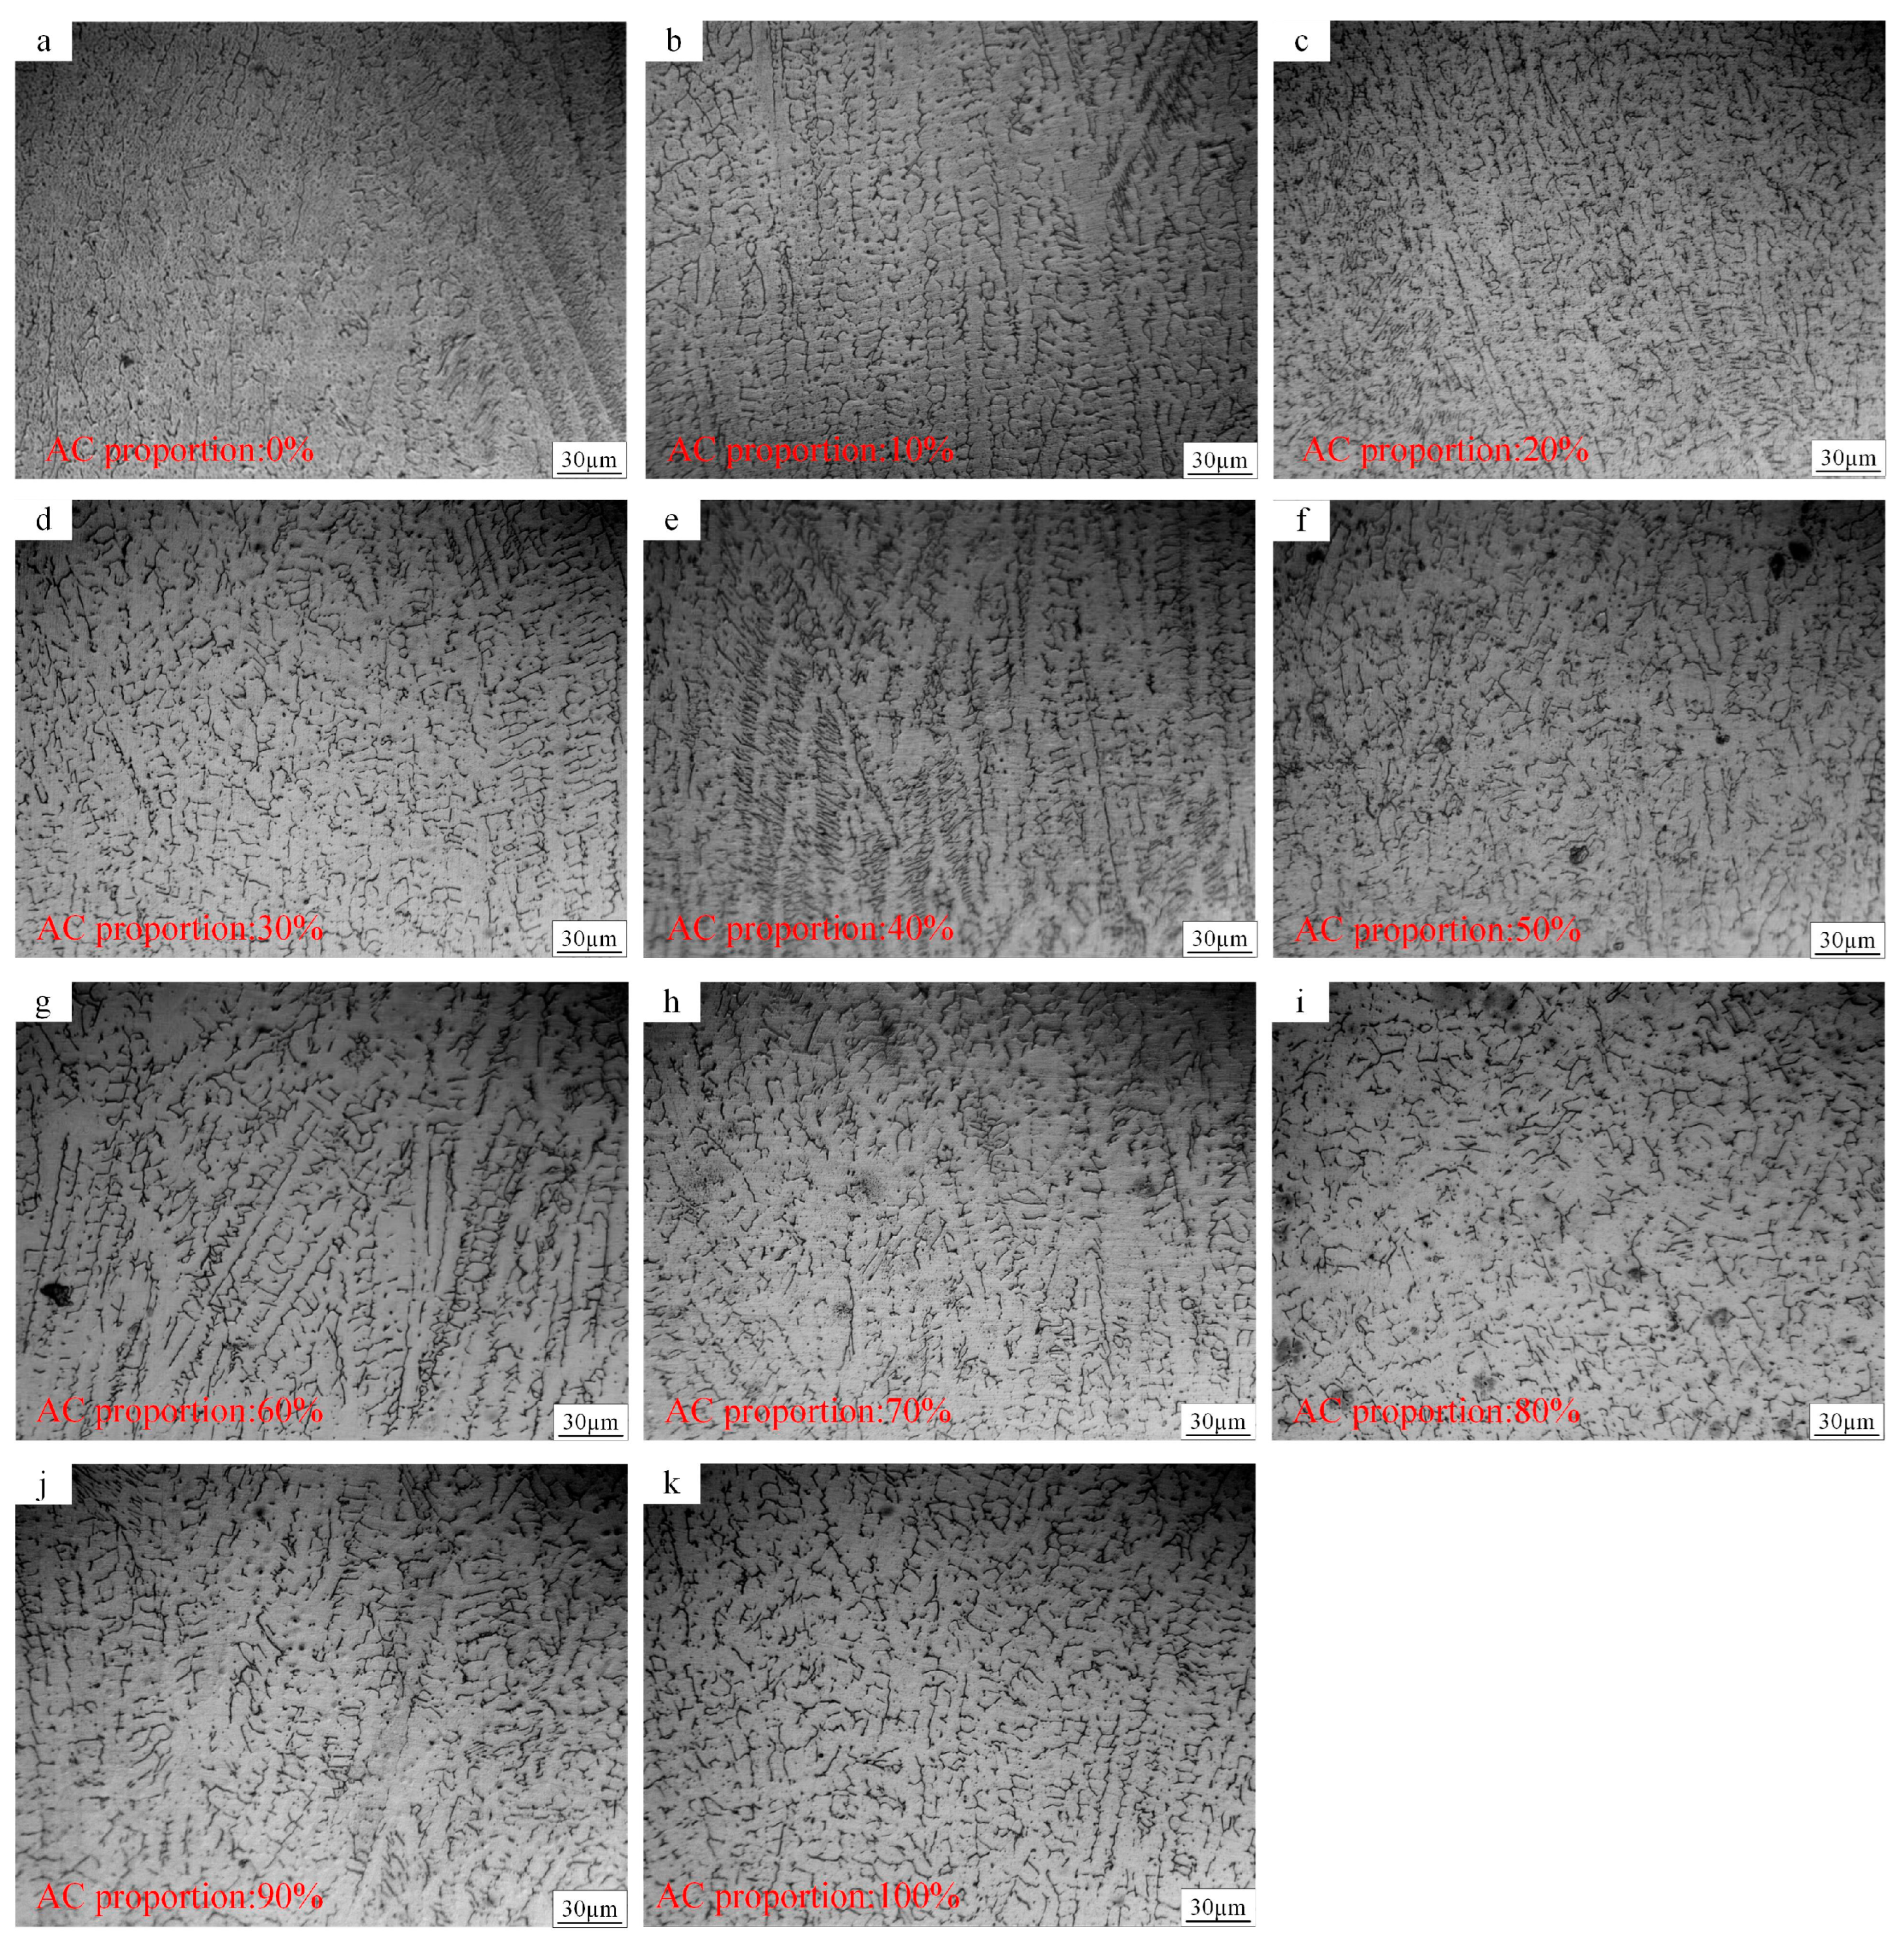
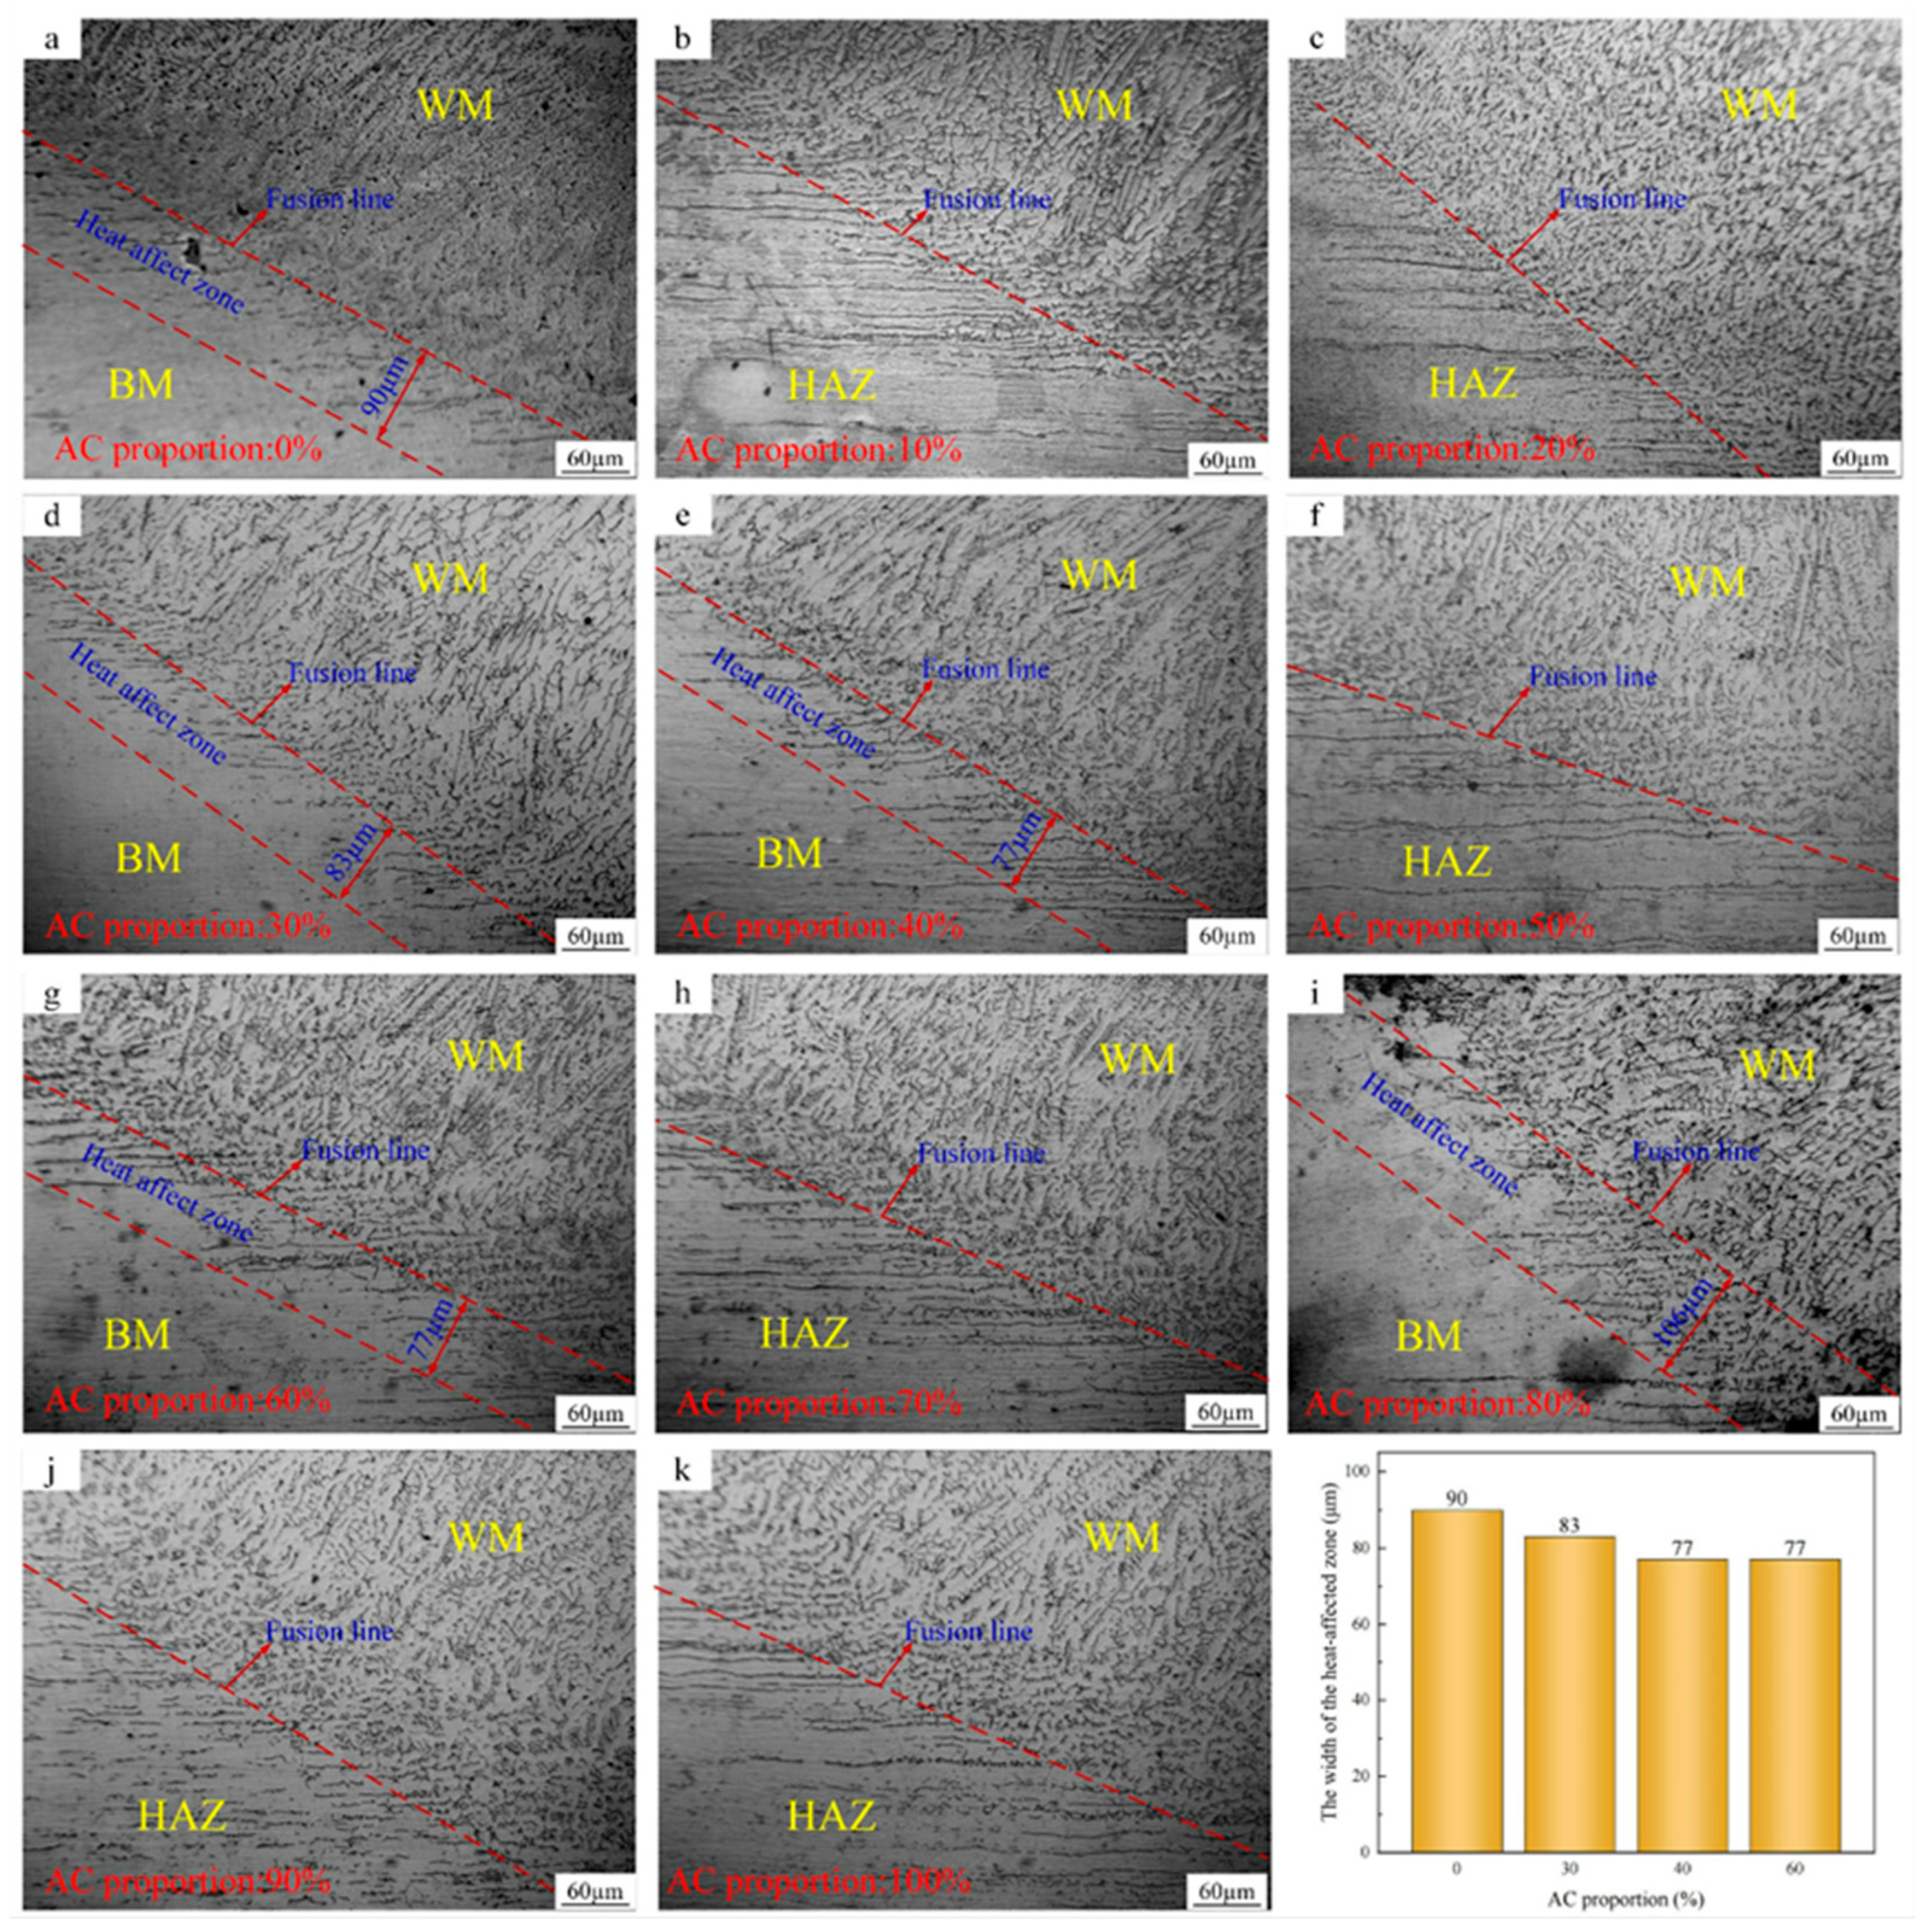
3.2. Microstructure
3.3. Performance
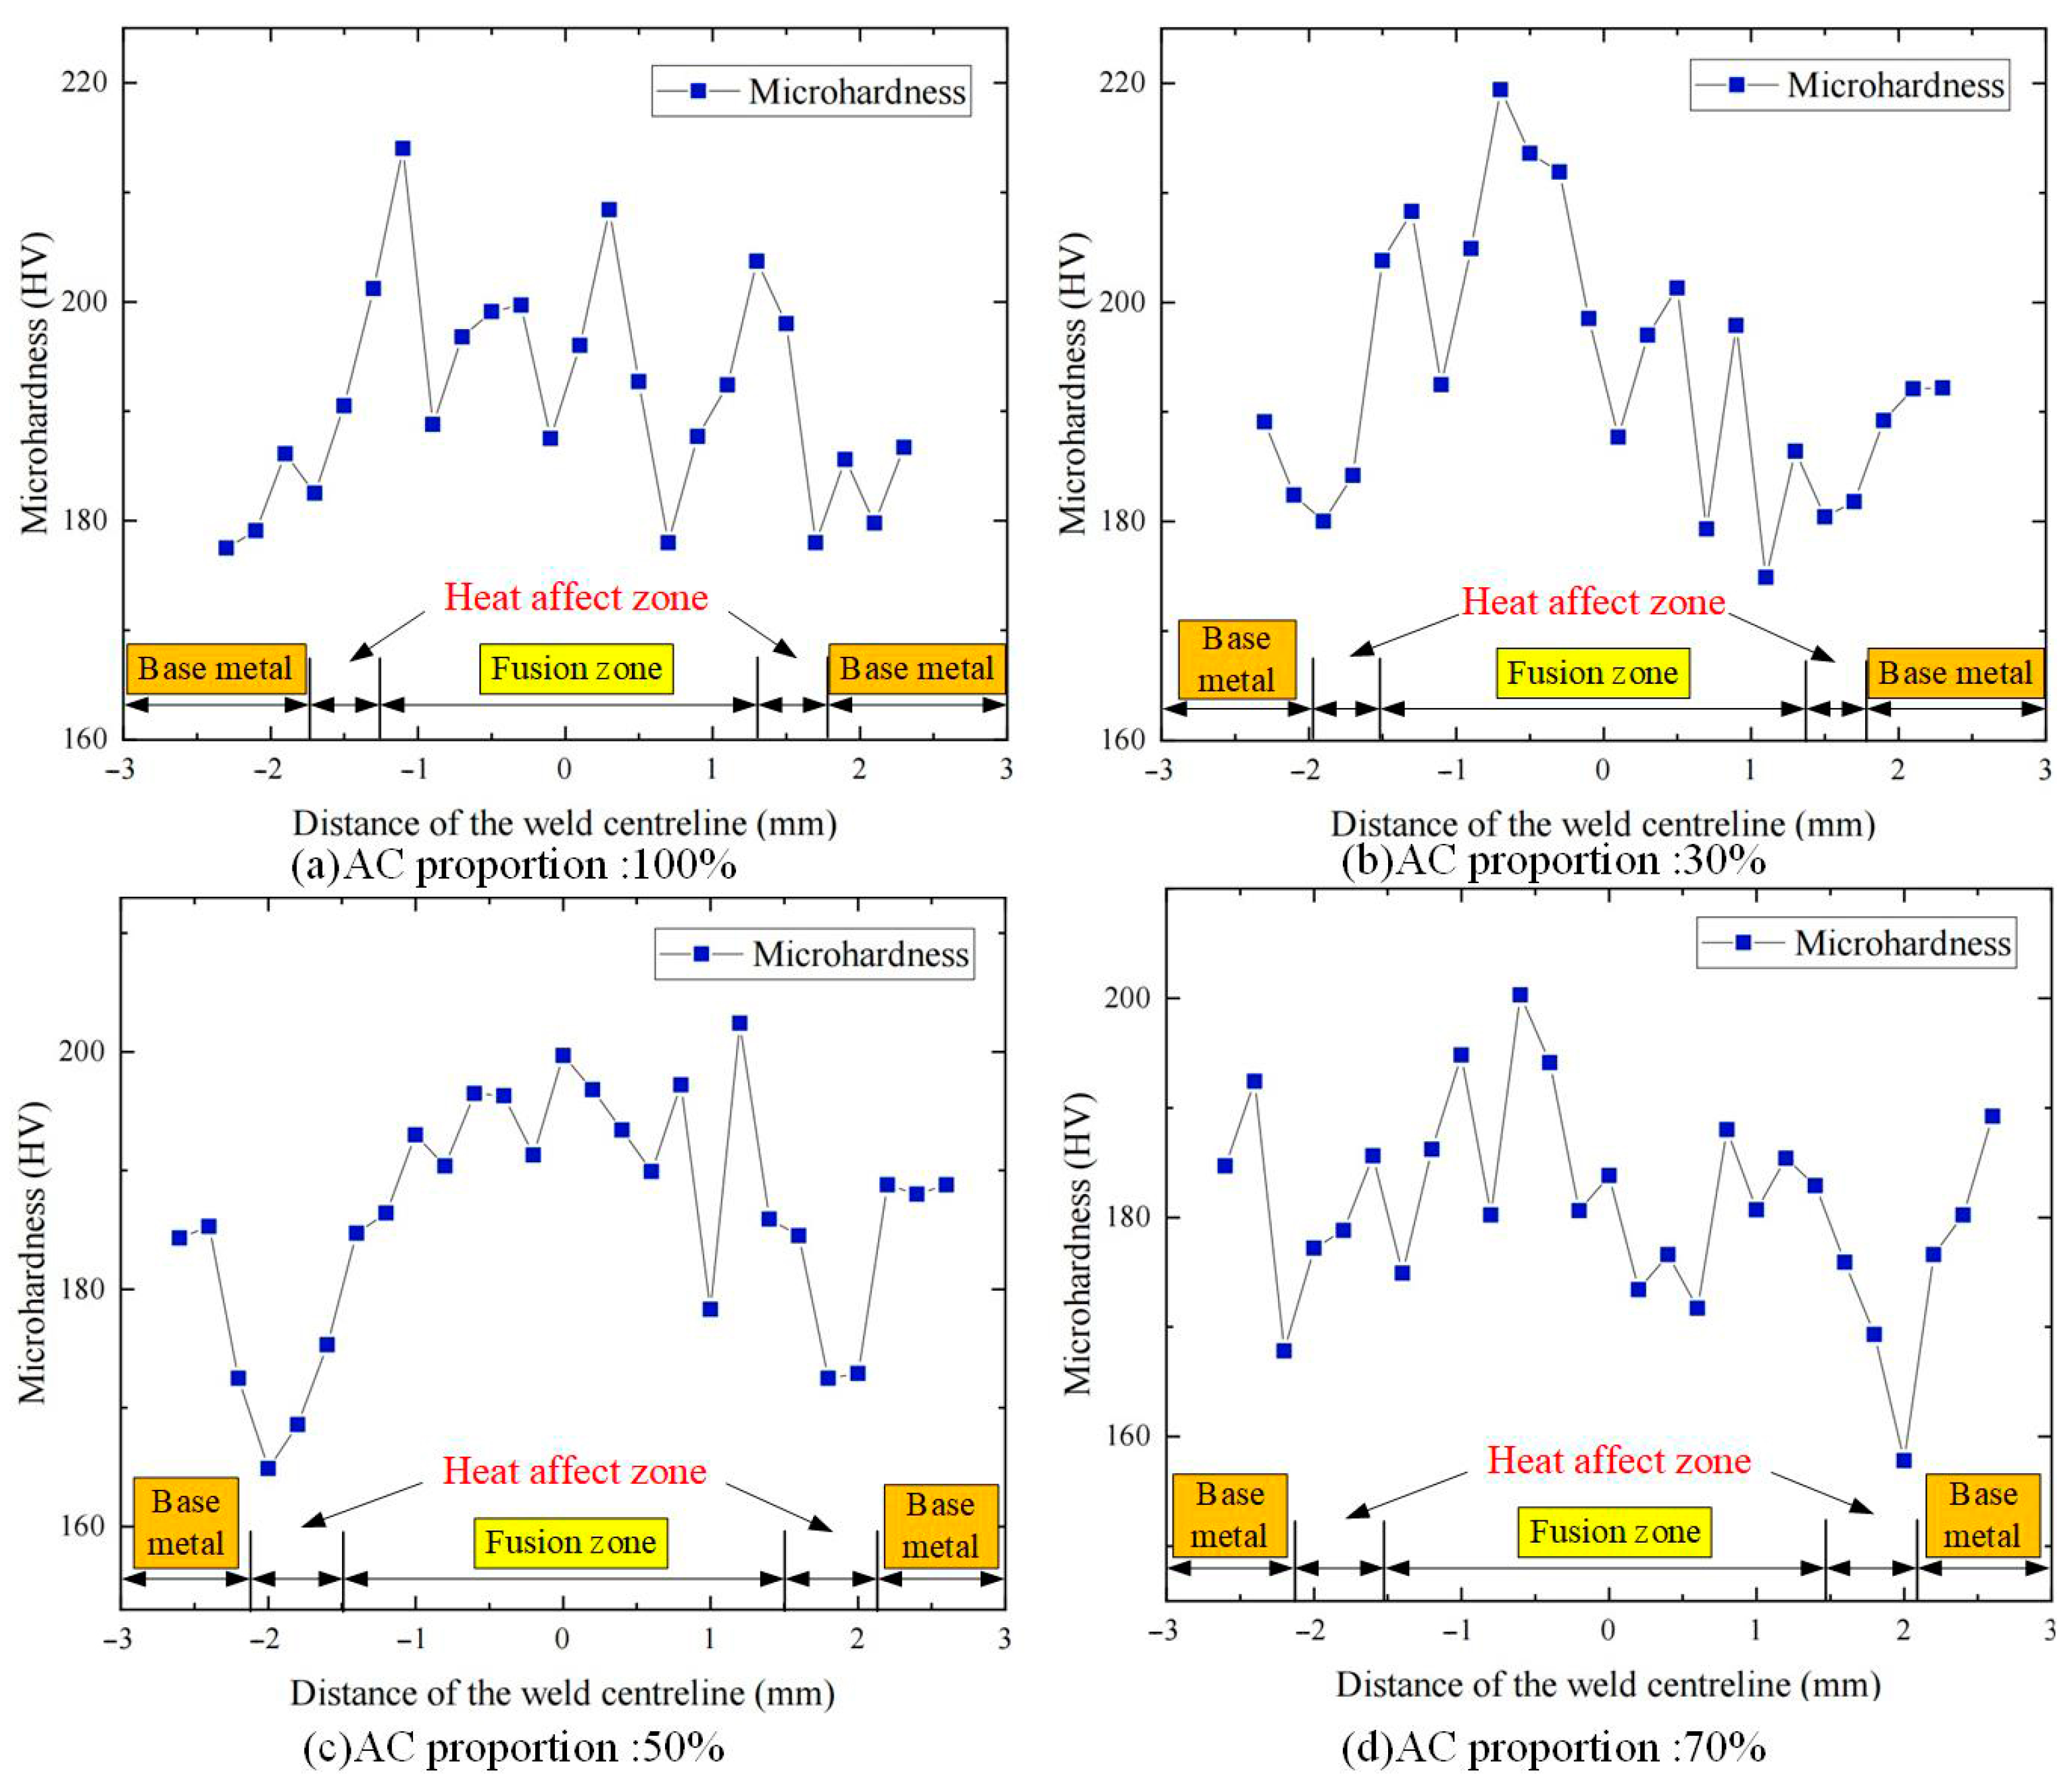
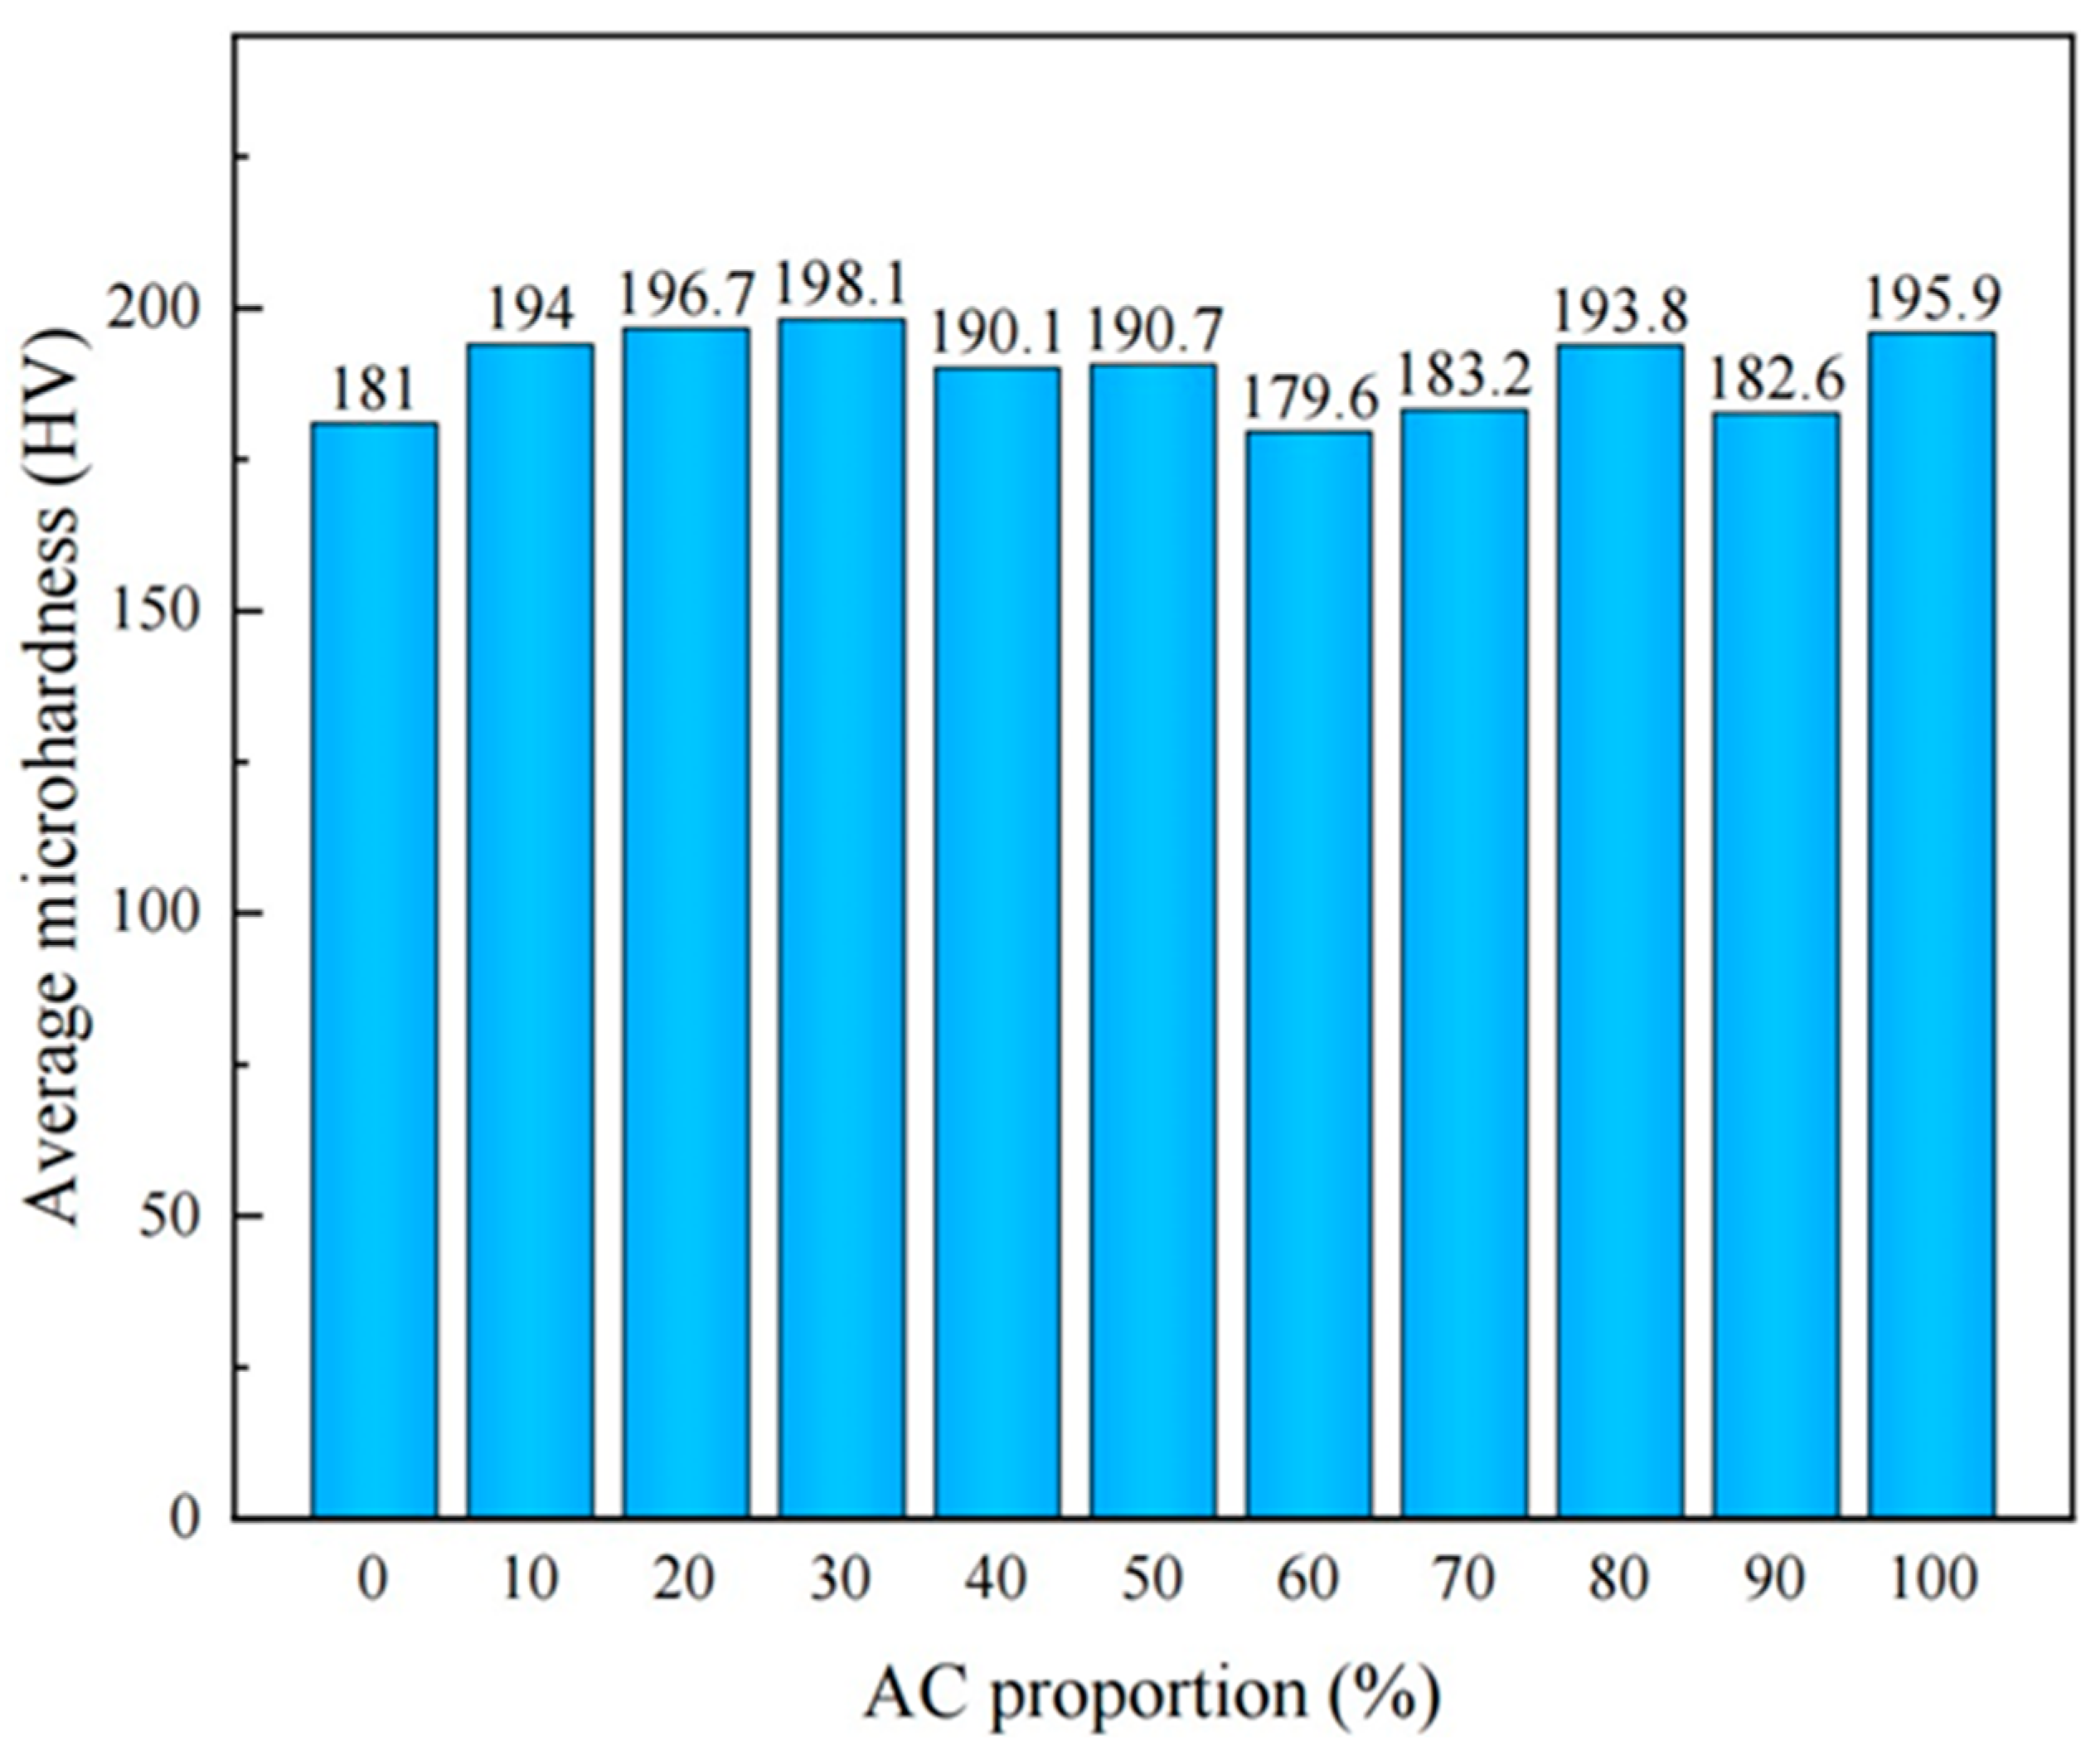
Microhardness
4. Conclusions
- (1)
- The weld under AC/DC mixing is fish scale pattern, and the density of fish scale pattern increases with the increase of AC proportion. When the proportion of AC is 50%, the forming is the most beautiful; the surface has metallic luster, and the fish scales are evenly distributed.
- (2)
- When AC accounts for 10%, the weld penetration, weld width, and their ratios are smaller than those in DC mode. Both weld penetration and the ratio of weld penetration to weld width are the highest when AC accounts for 30%. At this point, the weld penetration is 0.83 mm larger than DC mode, an increase of 93.26%, and the ratio of weld penetration to weld width is 1.6, which is 76.19% higher than DC mode.
- (3)
- When the proportion of AC is increased, the microstructure of the weld is equiaxed or columnar, and the microstructure of the heat-affected zone is ferrite in the form of lath. The best performance is obtained when AC accounted for 20% and 30%, because the microstructure is fine and evenly distributed equiaxed crystal at this time. When the proportion of AC is too large, although the microstructure of weld is equiaxed, the grain size is coarse and the performance decreases.
- (4)
- The hardness of the weld is greater than that of the base metal, and the hardness of the heat-affected zone is the lowest. The microhardness distribution of the weld with AC 50% is the most uniform. The average hardness of welds with AC accounting for 20% and 30% is the largest, which are 196.7 HV and 198.1 HV, respectively.
Author Contributions
Funding
Data Availability Statement
Conflicts of Interest
References
- Li, Y.; Fan, J.; Wen, J.; Nie, X.; Zhou, L. Study on the Effects of Multiple Laser Shock Peening Treatments on the Electrochemical Corrosion Performance of Welded 316L Stainless Steel Joints. Metals 2022, 12, 1215. [Google Scholar] [CrossRef]
- Sarfarazi, S.; Shamass, R.; Mascolo, I.; Dellacorte, G.; Guarracino, F. Some Considerations on the Behavior of Bolted Stainless-Steel Beam-to-Column Connections: A Simplified Analytical Approach. Metals 2023, 13, 753. [Google Scholar] [CrossRef]
- Yoo, Y.; Choi, S.; Kim, Y. Effect of Laser Shock Peening on the Stress Corrosion Cracking of 304L Stainless Steel. Metals 2023, 13, 516. [Google Scholar] [CrossRef]
- Zhang, W.; Liu, F.; Liu, L.; Li, Q.; Liu, L.; Liu, F.; Huang, C. Effect of grain size and distribution on the corrosion behavior of Y2O3 dispersion-strengthened 304 stainless steel. Mater. Today Commun. 2022, 31, 54. [Google Scholar] [CrossRef]
- Xue, J.; Wu, H.; Zhou, C.; Zhang, Y.; He, M.; Yan, X.; Xie, H.; Yan, R.; Yin, Y. Effect of Heat Input on Hydrogen Embrittlement of TIG Welded 304 Austenitic Stainless Steel. Metals 2022, 12, 1943. [Google Scholar] [CrossRef]
- Li, W.; Guo, T.; Xu, L.; Chen, L.; Jiang, B.; Wang, X.; Wu, H.; Qiao, L. Promotion of pitting corrosion at hydrogen-enriched phase boundaries in austenitic stainless steel weld joints. Acta Mater. 2022, 227, 117728. [Google Scholar] [CrossRef]
- Zhou, C.; Liu, X.; Zhang, Y.; Wu, H.; Yang, Y. Numerical study on effect of inclusions on hydrogen segregation in steel under stress conditions. Int. J. Hydrogen Energy 2022, 47, 20310. [Google Scholar] [CrossRef]
- Zhang, H.Y.; Hu, J.; Meng, X.M.; Sun, Y.; Wang, T.; Lv, W.J.; Shi, Q.X.; Ma, J.Y.; Zhou, D.Y.; Liang, W.; et al. Effect of deformation microstructures on hydrogen embrittlement sensitivity and failure mechanism of 304 austenitic stainless steel: The significant role of rolling temperature. J. Mater. Res. Technol. 2022, 17, 2831. [Google Scholar] [CrossRef]
- Dong, Z.; Li, Y.; Wu, H.; Babkin, A.; Chang, Y. Effect of TIG arc characteristics on weld morphology and structure of AISI444 ferritic stainless steel under pulse current. Weld. World 2021, 65, 2093. [Google Scholar] [CrossRef]
- Huang, J.; Sun, T.; Ding, F.; Yu, S. Study on the Surface Flow Behavior of TIG Weld Pool. J. Mech. Eng. 2016, 18, 31. [Google Scholar] [CrossRef]
- Ramkumar, K.; Chandrasekhar, A.; Srivastava, A.; Preyas, H.; Chandra, S.; Dev, S.; Arivazhagan, N. Effects of filler metals on the segregation, mechanical properties and hot corrosion behaviour of pulsed current gas tungsten arc welded super-austenitic stainless steel. J. Manuf. Process. 2016, 24, 46. [Google Scholar] [CrossRef]
- Liu, T.; Chen, H. Influence of Pulse TIG Welding Process Parameters on Weld Forming of Sheet Stainless Steel. Hot Work. Technol. 2015, 44, 187. [Google Scholar]
- Nima, N.; Majid, P. Transition in Interfacial Failure Mechanism of Resistance Spot Welds during Tensile–Shear Loading: Role of Fusion Zone Hardness. Metals 2023, 13, 1076. [Google Scholar]
- Francisco, B.; Igor, F.; Isaque, B.; João, P.; Telmo, S. A Review of Orbital Friction Stir Welding. Metals 2023, 13, 1055. [Google Scholar]
- Singh, A.; Dey, V.; Rai, R. Techniques to improve weld penetration in TIG welding (A review). Mater. Today Proc. 2017, 4, 1252. [Google Scholar] [CrossRef]
- Li, C.; Liu, L. Investigation on weldability of magnesium alloy thin sheet T-joints: Arc welding, laser welding, and laser-arc hybrid welding. Int. J. Adv. Manuf. Technol. 2013, 65, 27. [Google Scholar] [CrossRef]
- Xie, W.; Fan, C.; Yang, C.; Sanbao, L. Influences of acoustic field parameters on welding arc behavior in ultrasonic-MIG welding. China Weld. Engl. Ed. 2015, 24, 29. [Google Scholar]
- Wang, Y.; Qi, B.; Cong, B.; Yang, M. Optimization of hybrid ultrasonic frequency pulsed VP-GTAW process parameters on tensile properties of AA 5456 Alloy. Appl. Sci. 2017, 7, 48. [Google Scholar] [CrossRef] [Green Version]
- Cong, B.; Qi, B.; Zhou, X.; Luo, J. Effect of Superaudio Pulse Square Wave Current Parameters on Weld Microstructure and Mechanical Properties of 2219 Aluminum Alloy. Acta Metall. Sin. 2009, 45, 1057. [Google Scholar]
- Sharifitabar, M. Microstructure and mechanical properties of resistance upset butt welded 304 austenitic stainless steel joints. Mater. Des. 2011, 32, 3854. [Google Scholar] [CrossRef]
- Gui, X.; Zhang, Y.; You, D.; Gao, X. Numerical simulation and test for influence of laser arc hybrid welding sequence on 304 stainless steel T-joint. Trans. China Weld. Inst. 2021, 12, 34. [Google Scholar]
- Lee, J.K. Nondestructive Evaluation on Hydrogen Effect of TIG Welded Stainless Steel for Component Design of Pressure Vessel. J. Power Syst. Eng. 2017, 3, 102. [Google Scholar]
- Yang, M.; Yang, Z.; Qi, B. Effect of fluid in molten pool on the welds with Ti-6Al-4V during pulsed arc welding. Int. J. Adv. Manuf. Technol. 2015, 5, 1007. [Google Scholar] [CrossRef]
- Wang, Y.; Chen, M.; Wu, C. High-frequency pulse-modulated square wave AC TIG welding of AA6061-T6 aluminum alloy. Weld. World 2020, 10, 1749. [Google Scholar] [CrossRef]
- Manti, R.; Dwivedi, D. Microstructure of Al-Mg-Si weld joints produced by pulse TIG welding. Mater. Manuf. Process. 2007, 1, 57. [Google Scholar] [CrossRef]
- Cui, Z.; Liu, B. Metallogy and Principle of Heat Treatment; Harbin Institute of Technology Press: Harbin, China, 1998; p. 51. [Google Scholar]
- Fan, Y.; Sun, Q.; Yang, C.; Liu, S.; Fan, C. TIG welding of the stainless steel 304 based on the ultrasonic vibration. Trans. China Weld. Inst. 2019, 30, 91. [Google Scholar]
- Cao, Z.; Wu, D.; Su, H. Influence of External Magnetic Field on Microstructure and Properties of Stainless Steel TIG Welding Joint. Hot Work. Eng. 2009, 38, 134. [Google Scholar]
- Lu, B. Study on Laser Welding Process of 304 Stainless Steel Sheet. Hot Work. Work. Arts 2023, 52, 145. [Google Scholar]
- Chen, Y.; Lu, J.; Xu, L.; Wang, Y.; Zhang, T. Study on Microstructure and mechanical properties of Longitudinal Joints of 304 Stainless Steel Thin Wall Pipe Fitting under Different Welding Processes. Hot Work. Ski. 2022, 51, 127. [Google Scholar]
- Li, F. Microstructure and Performance Analysis of Ultrasonic assisted CMT Welded Joint of 304 Stainless Steel. Inn. Mong. Ind. Learn. 2021, 11, 71. [Google Scholar]


| C | Mn | P | S | Ni | Cr |
|---|---|---|---|---|---|
| 0.06 | 1.84 | 0.02 | 0.02 | 8.23 | 18.5 |
| NO. | 1 | 2 | 3 | 4 | 5 | 6 | 7 | 8 | 9 | 10 | 11 |
|---|---|---|---|---|---|---|---|---|---|---|---|
| AC proportion | 0 | 10 | 20 | 30 | 40 | 50 | 60 | 70 | 80 | 90 | 100 |
| AC Proportion | Weld Penetration (mm) | Weld Width (mm) | Weld Penetration/Weld Width |
|---|---|---|---|
| 0% | 0.89 0.05 | 4.33 | 0.21 |
| 10% | 0.74 | 4.11 | 0.18 |
| 20% | 1.33 | 4.97 | 0.27 |
| 30% | 1.72 | 4.67 | 0.37 |
Disclaimer/Publisher’s Note: The statements, opinions and data contained in all publications are solely those of the individual author(s) and contributor(s) and not of MDPI and/or the editor(s). MDPI and/or the editor(s) disclaim responsibility for any injury to people or property resulting from any ideas, methods, instructions or products referred to in the content. |
© 2023 by the authors. Licensee MDPI, Basel, Switzerland. This article is an open access article distributed under the terms and conditions of the Creative Commons Attribution (CC BY) license (https://creativecommons.org/licenses/by/4.0/).
Share and Cite
Ye, Y.; Yang, B.; Yang, Y.; Pan, Z.; Chen, C.; Zhang, X. Research on the Formation, Microstructure, and Properties of 304 Stainless Steel AC-DC Hybrid TIG Welding. Metals 2023, 13, 1127. https://doi.org/10.3390/met13061127
Ye Y, Yang B, Yang Y, Pan Z, Chen C, Zhang X. Research on the Formation, Microstructure, and Properties of 304 Stainless Steel AC-DC Hybrid TIG Welding. Metals. 2023; 13(6):1127. https://doi.org/10.3390/met13061127
Chicago/Turabian StyleYe, Ying, Bairu Yang, Yonghui Yang, Zihan Pan, Chao Chen, and Xinlong Zhang. 2023. "Research on the Formation, Microstructure, and Properties of 304 Stainless Steel AC-DC Hybrid TIG Welding" Metals 13, no. 6: 1127. https://doi.org/10.3390/met13061127