
Microstructure and First Hydrogenation Properties of Ti30V60Mn(10−x)Crx (x = 0, 3.3, 6.6, 10) + 4 wt.% Zr


Abstract
:1. Introduction
2. Materials and Methods
2.1. Alloy Synthesis
2.2. Crystal Structure and Morphology
2.3. Hydrogen Absorption and Desorption Measurements
3. Results
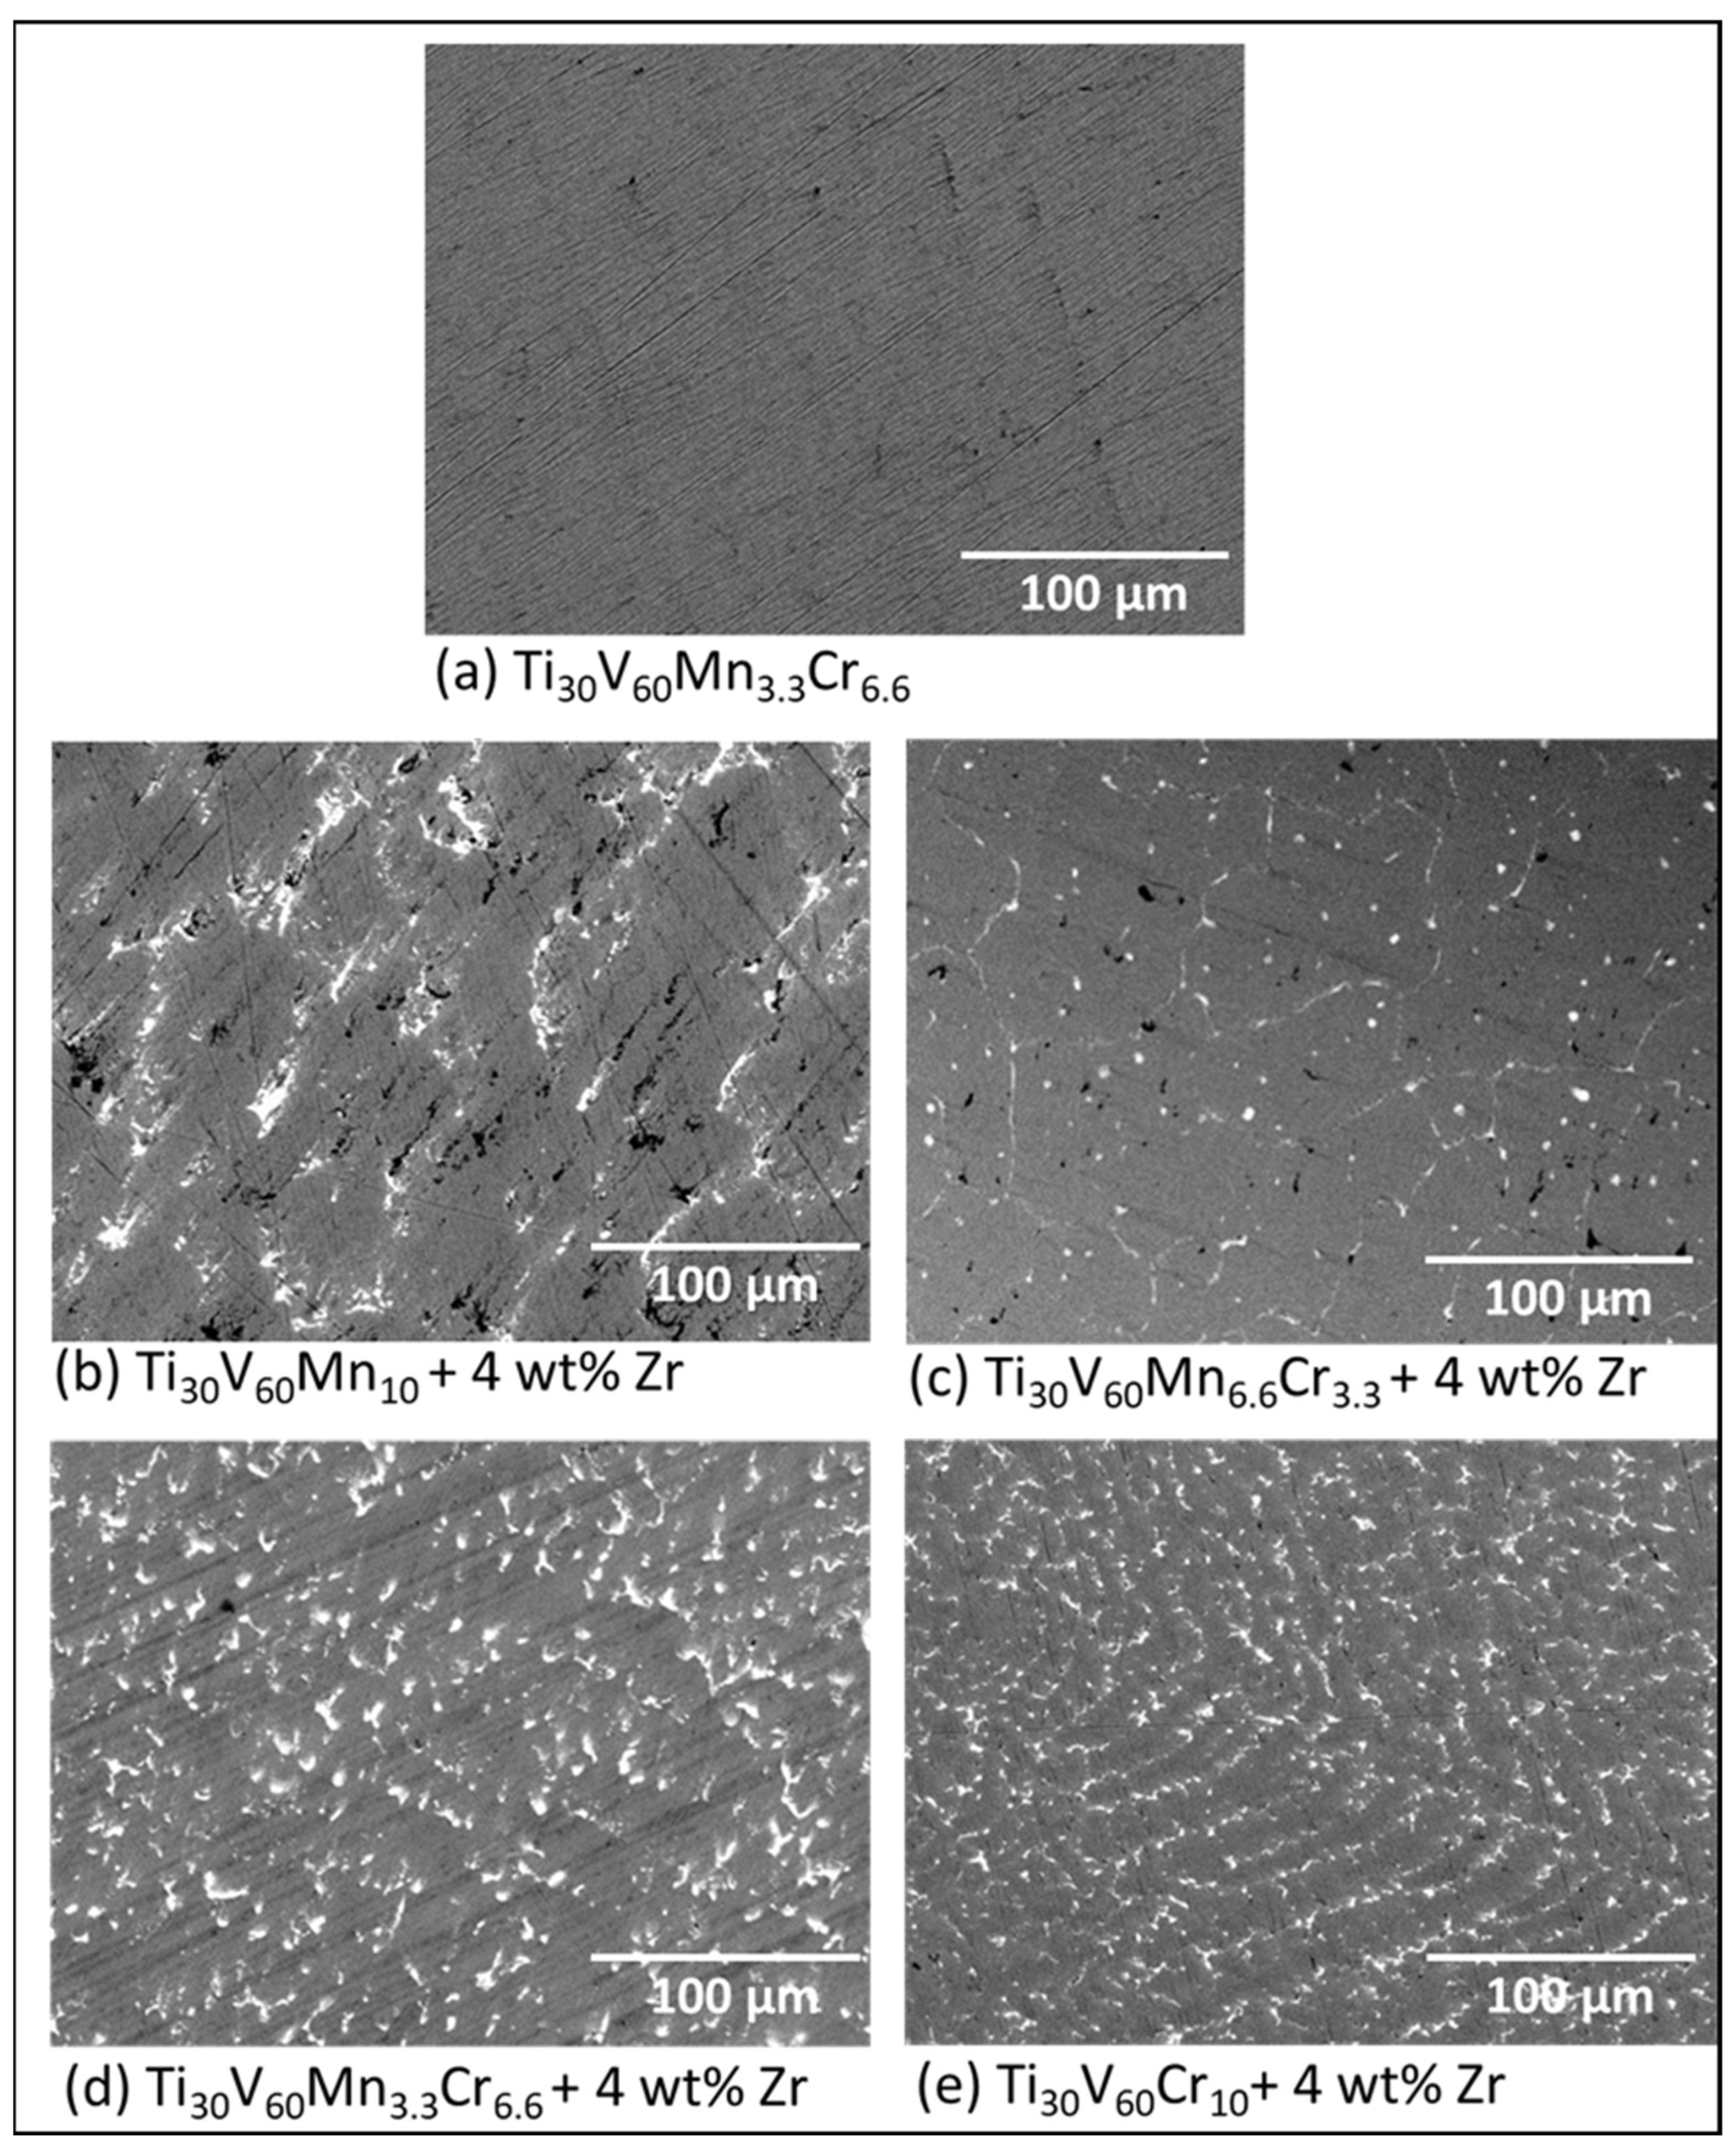
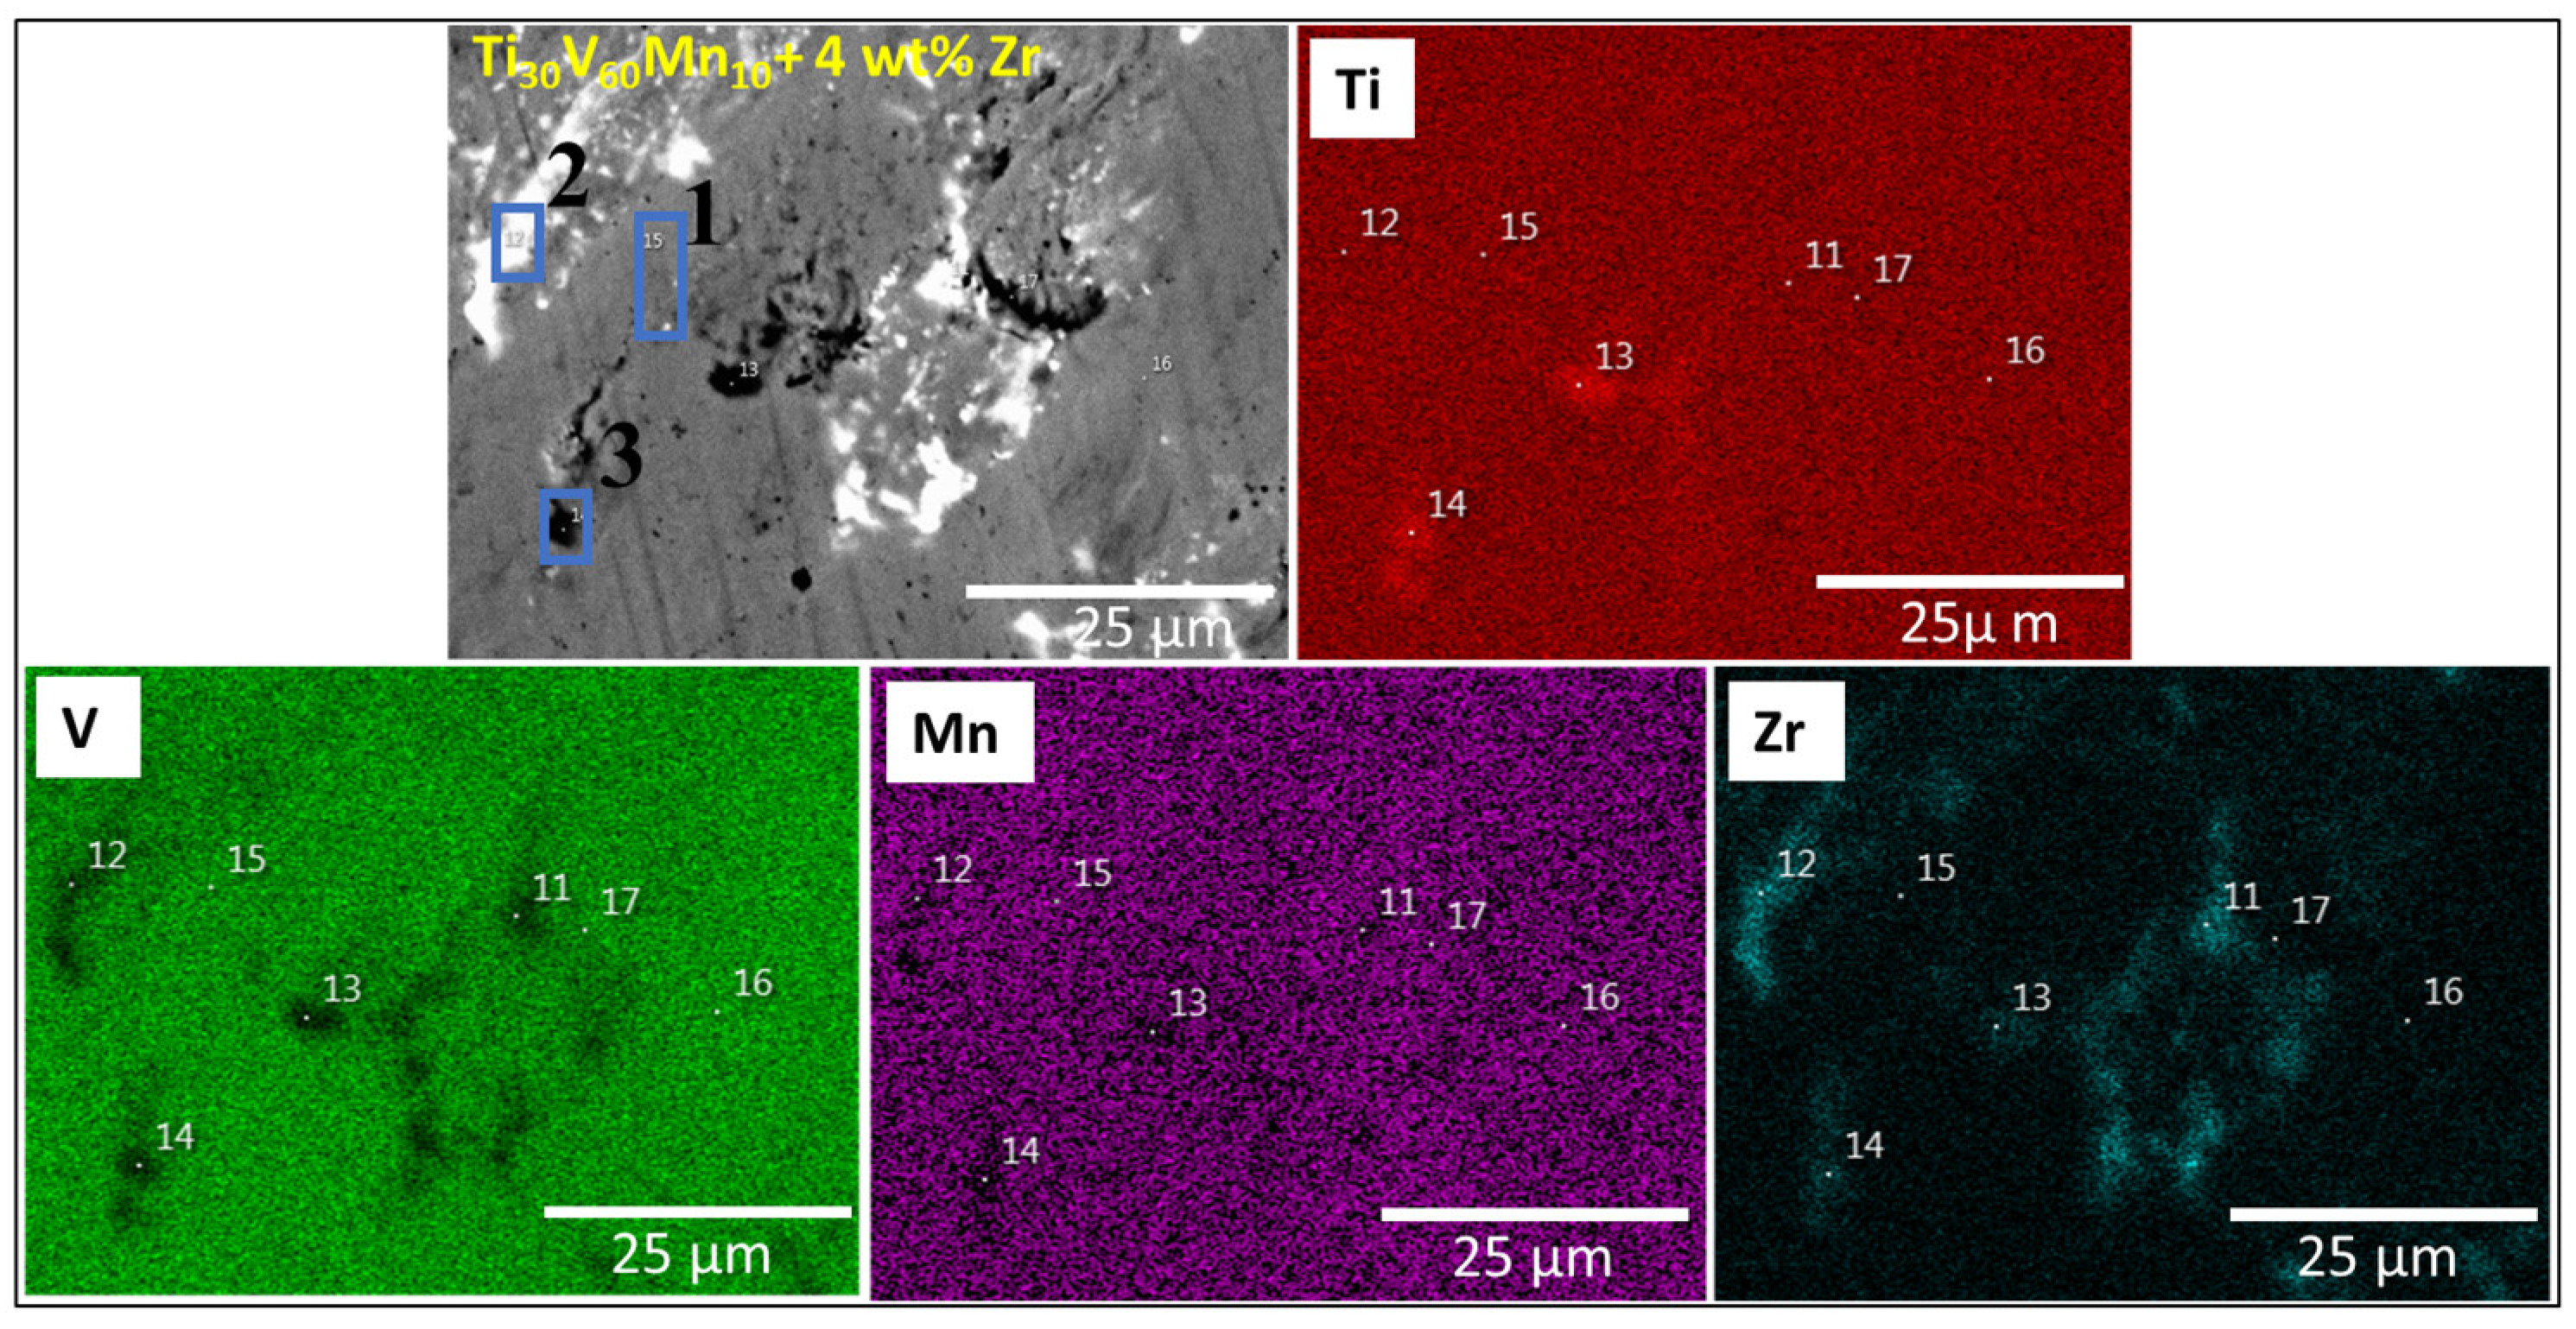
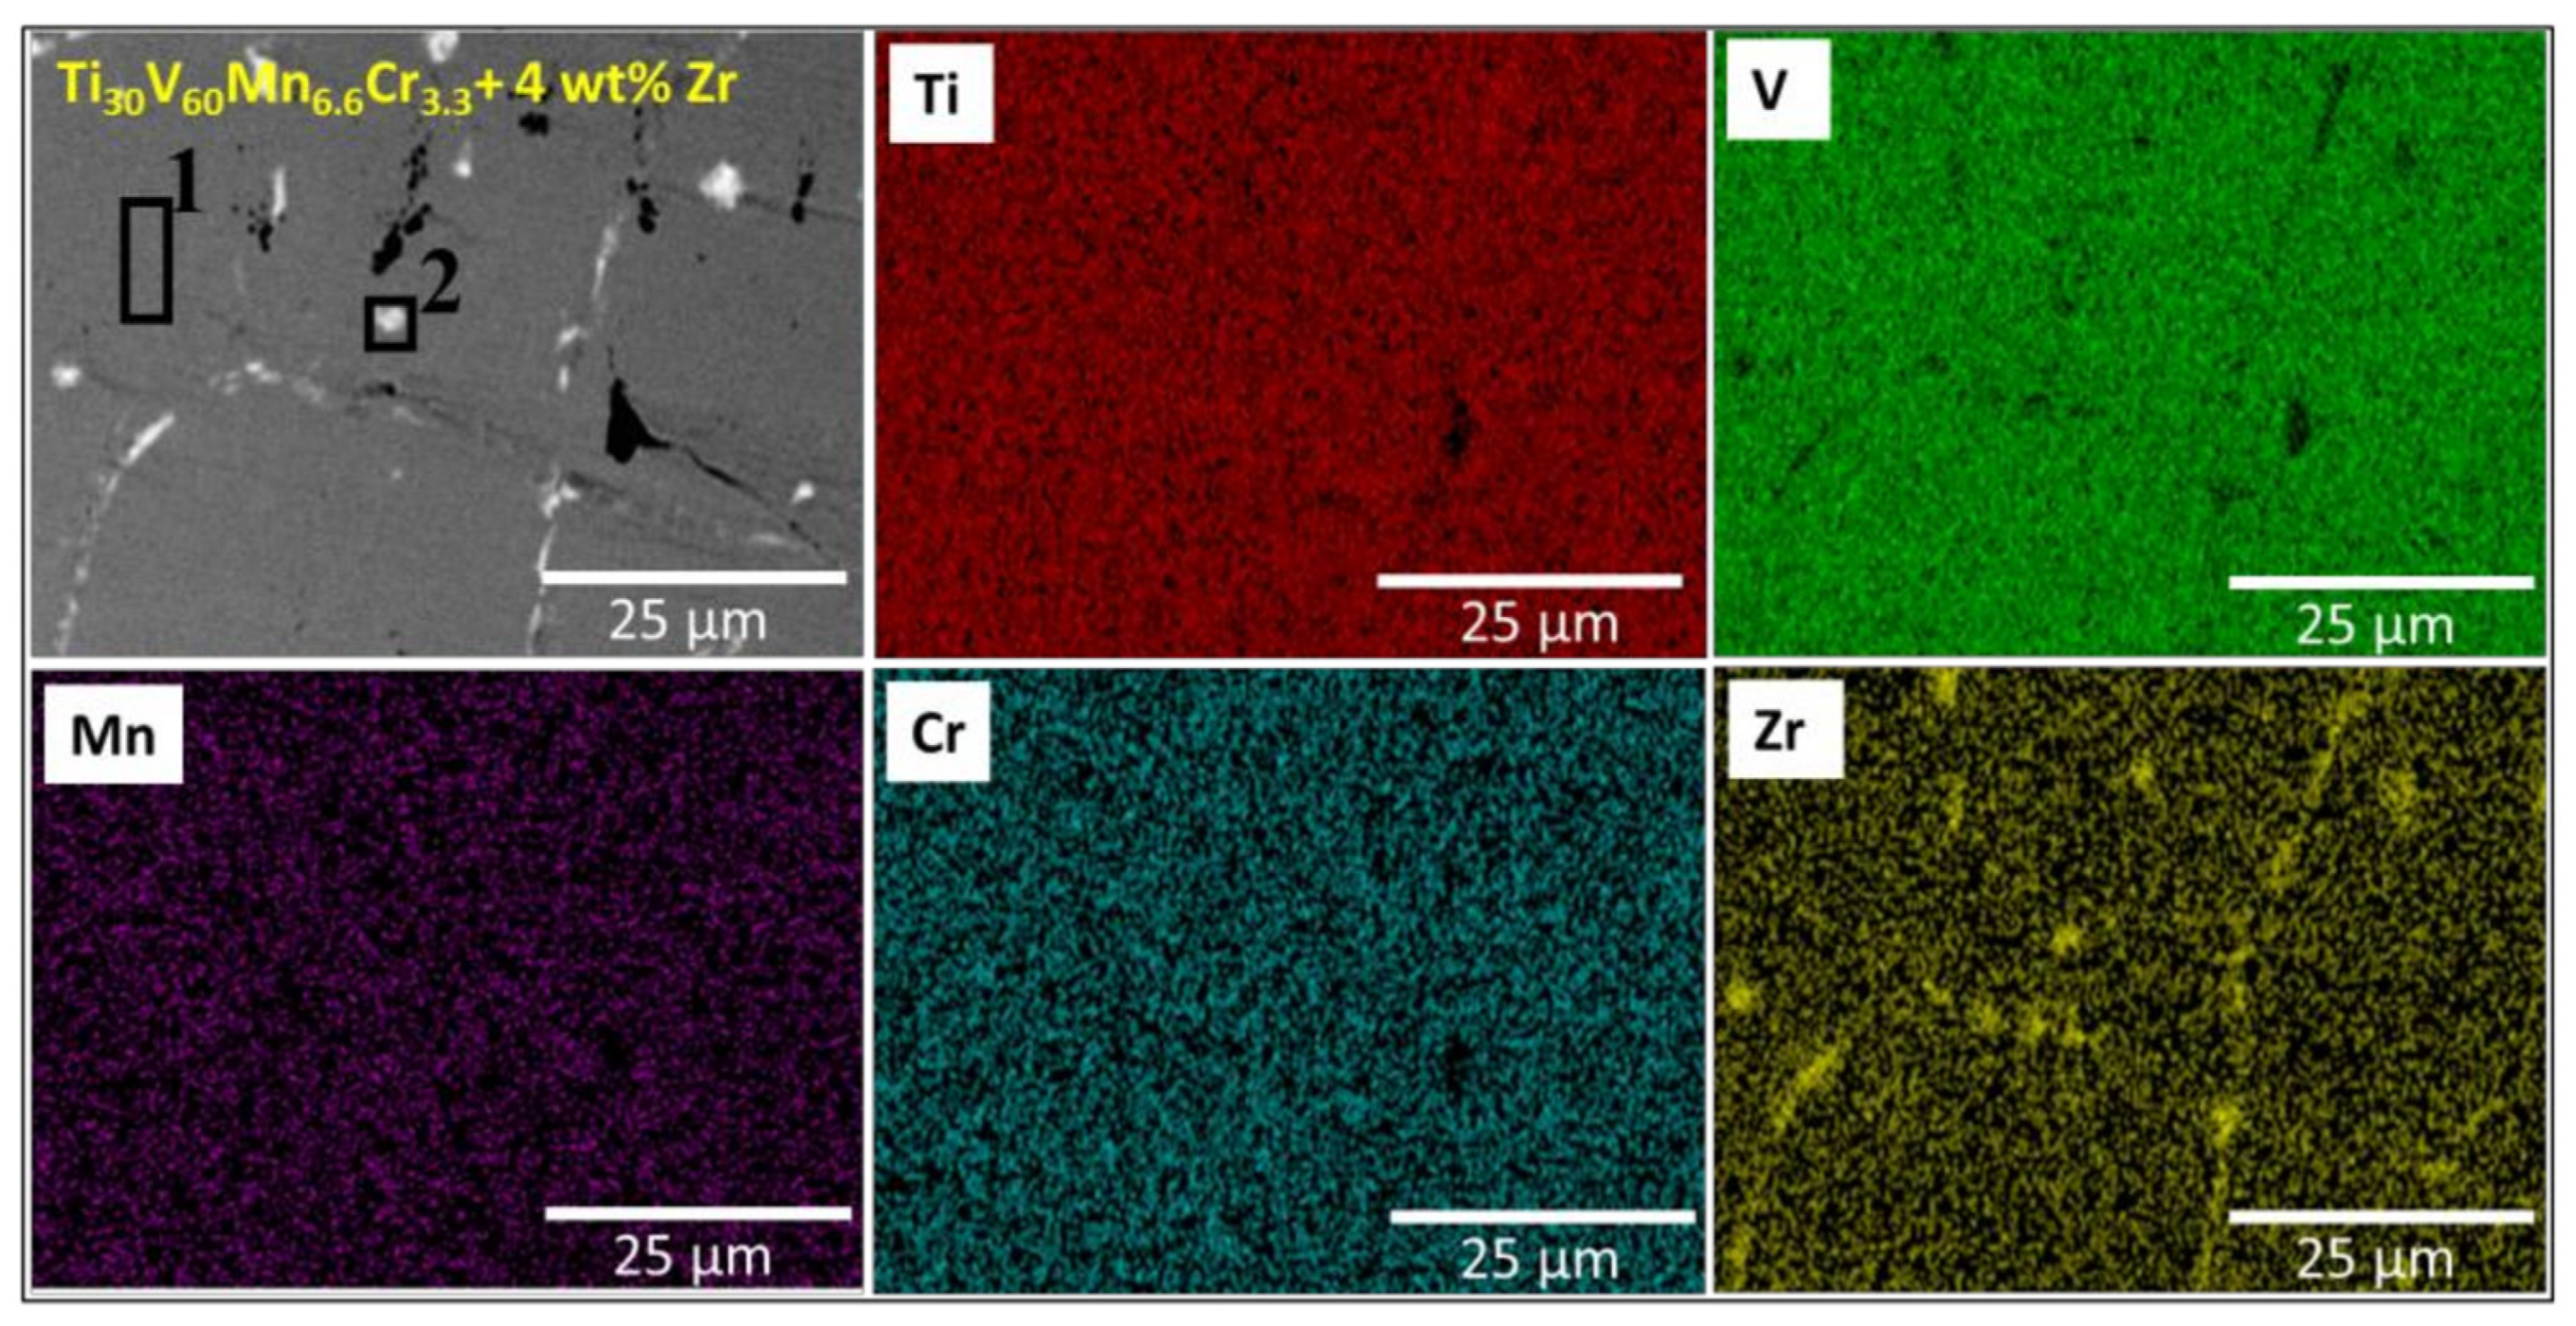
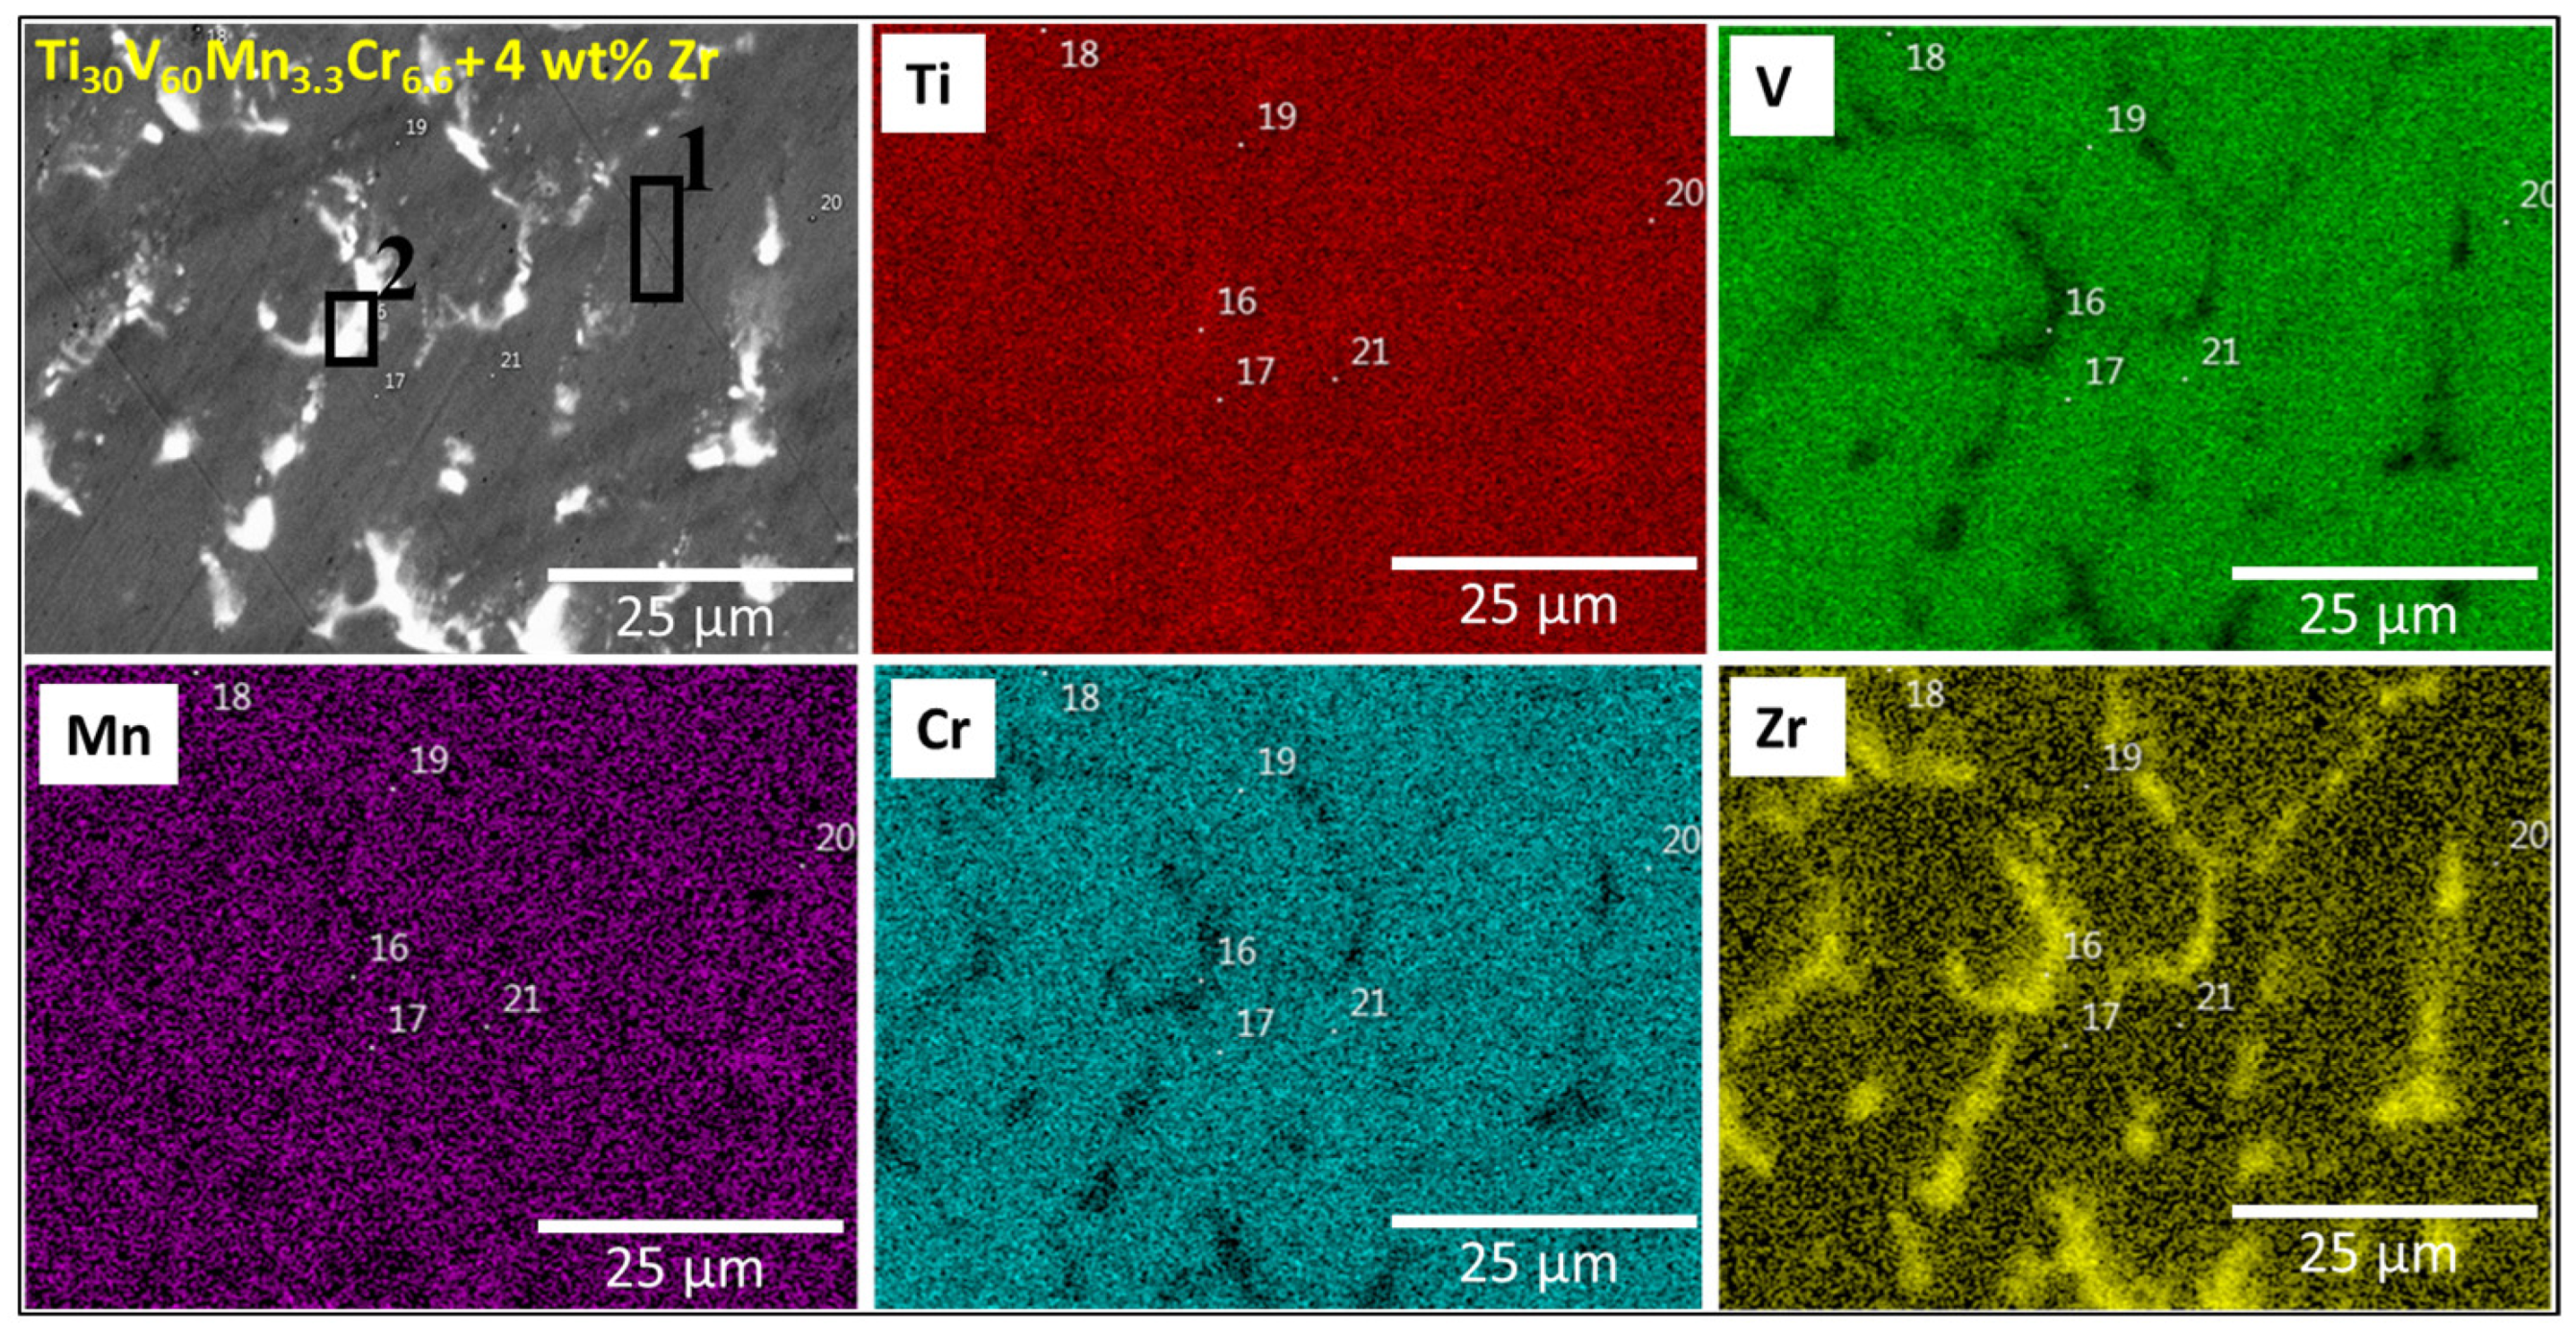
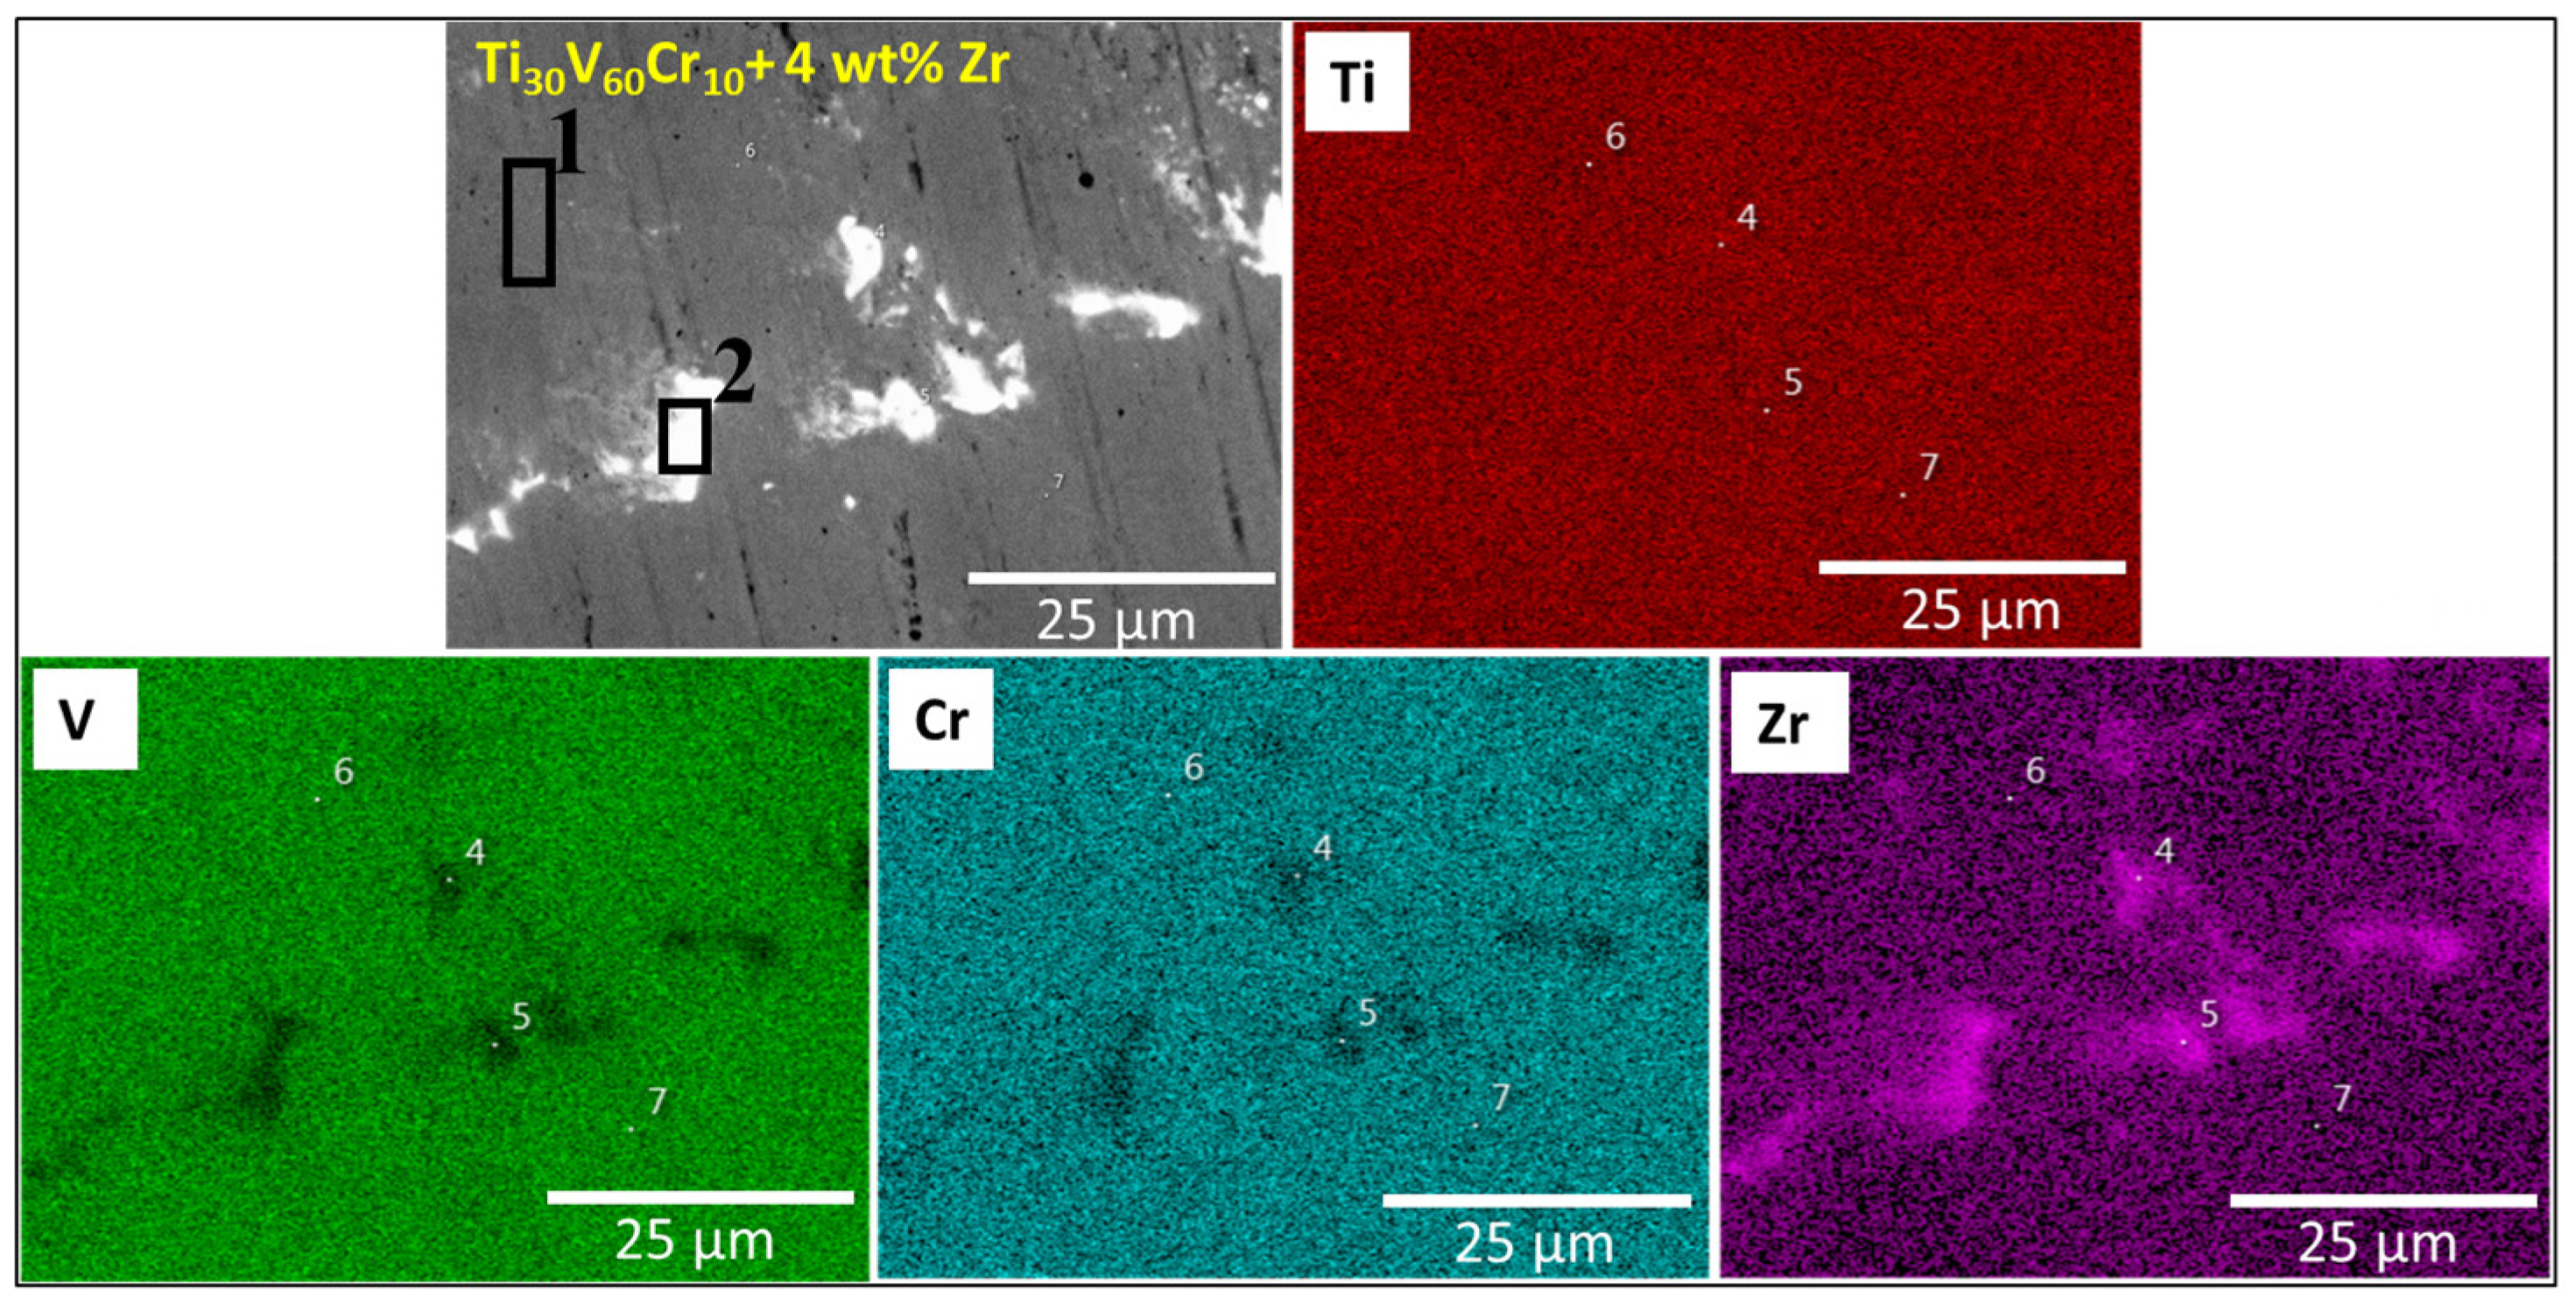
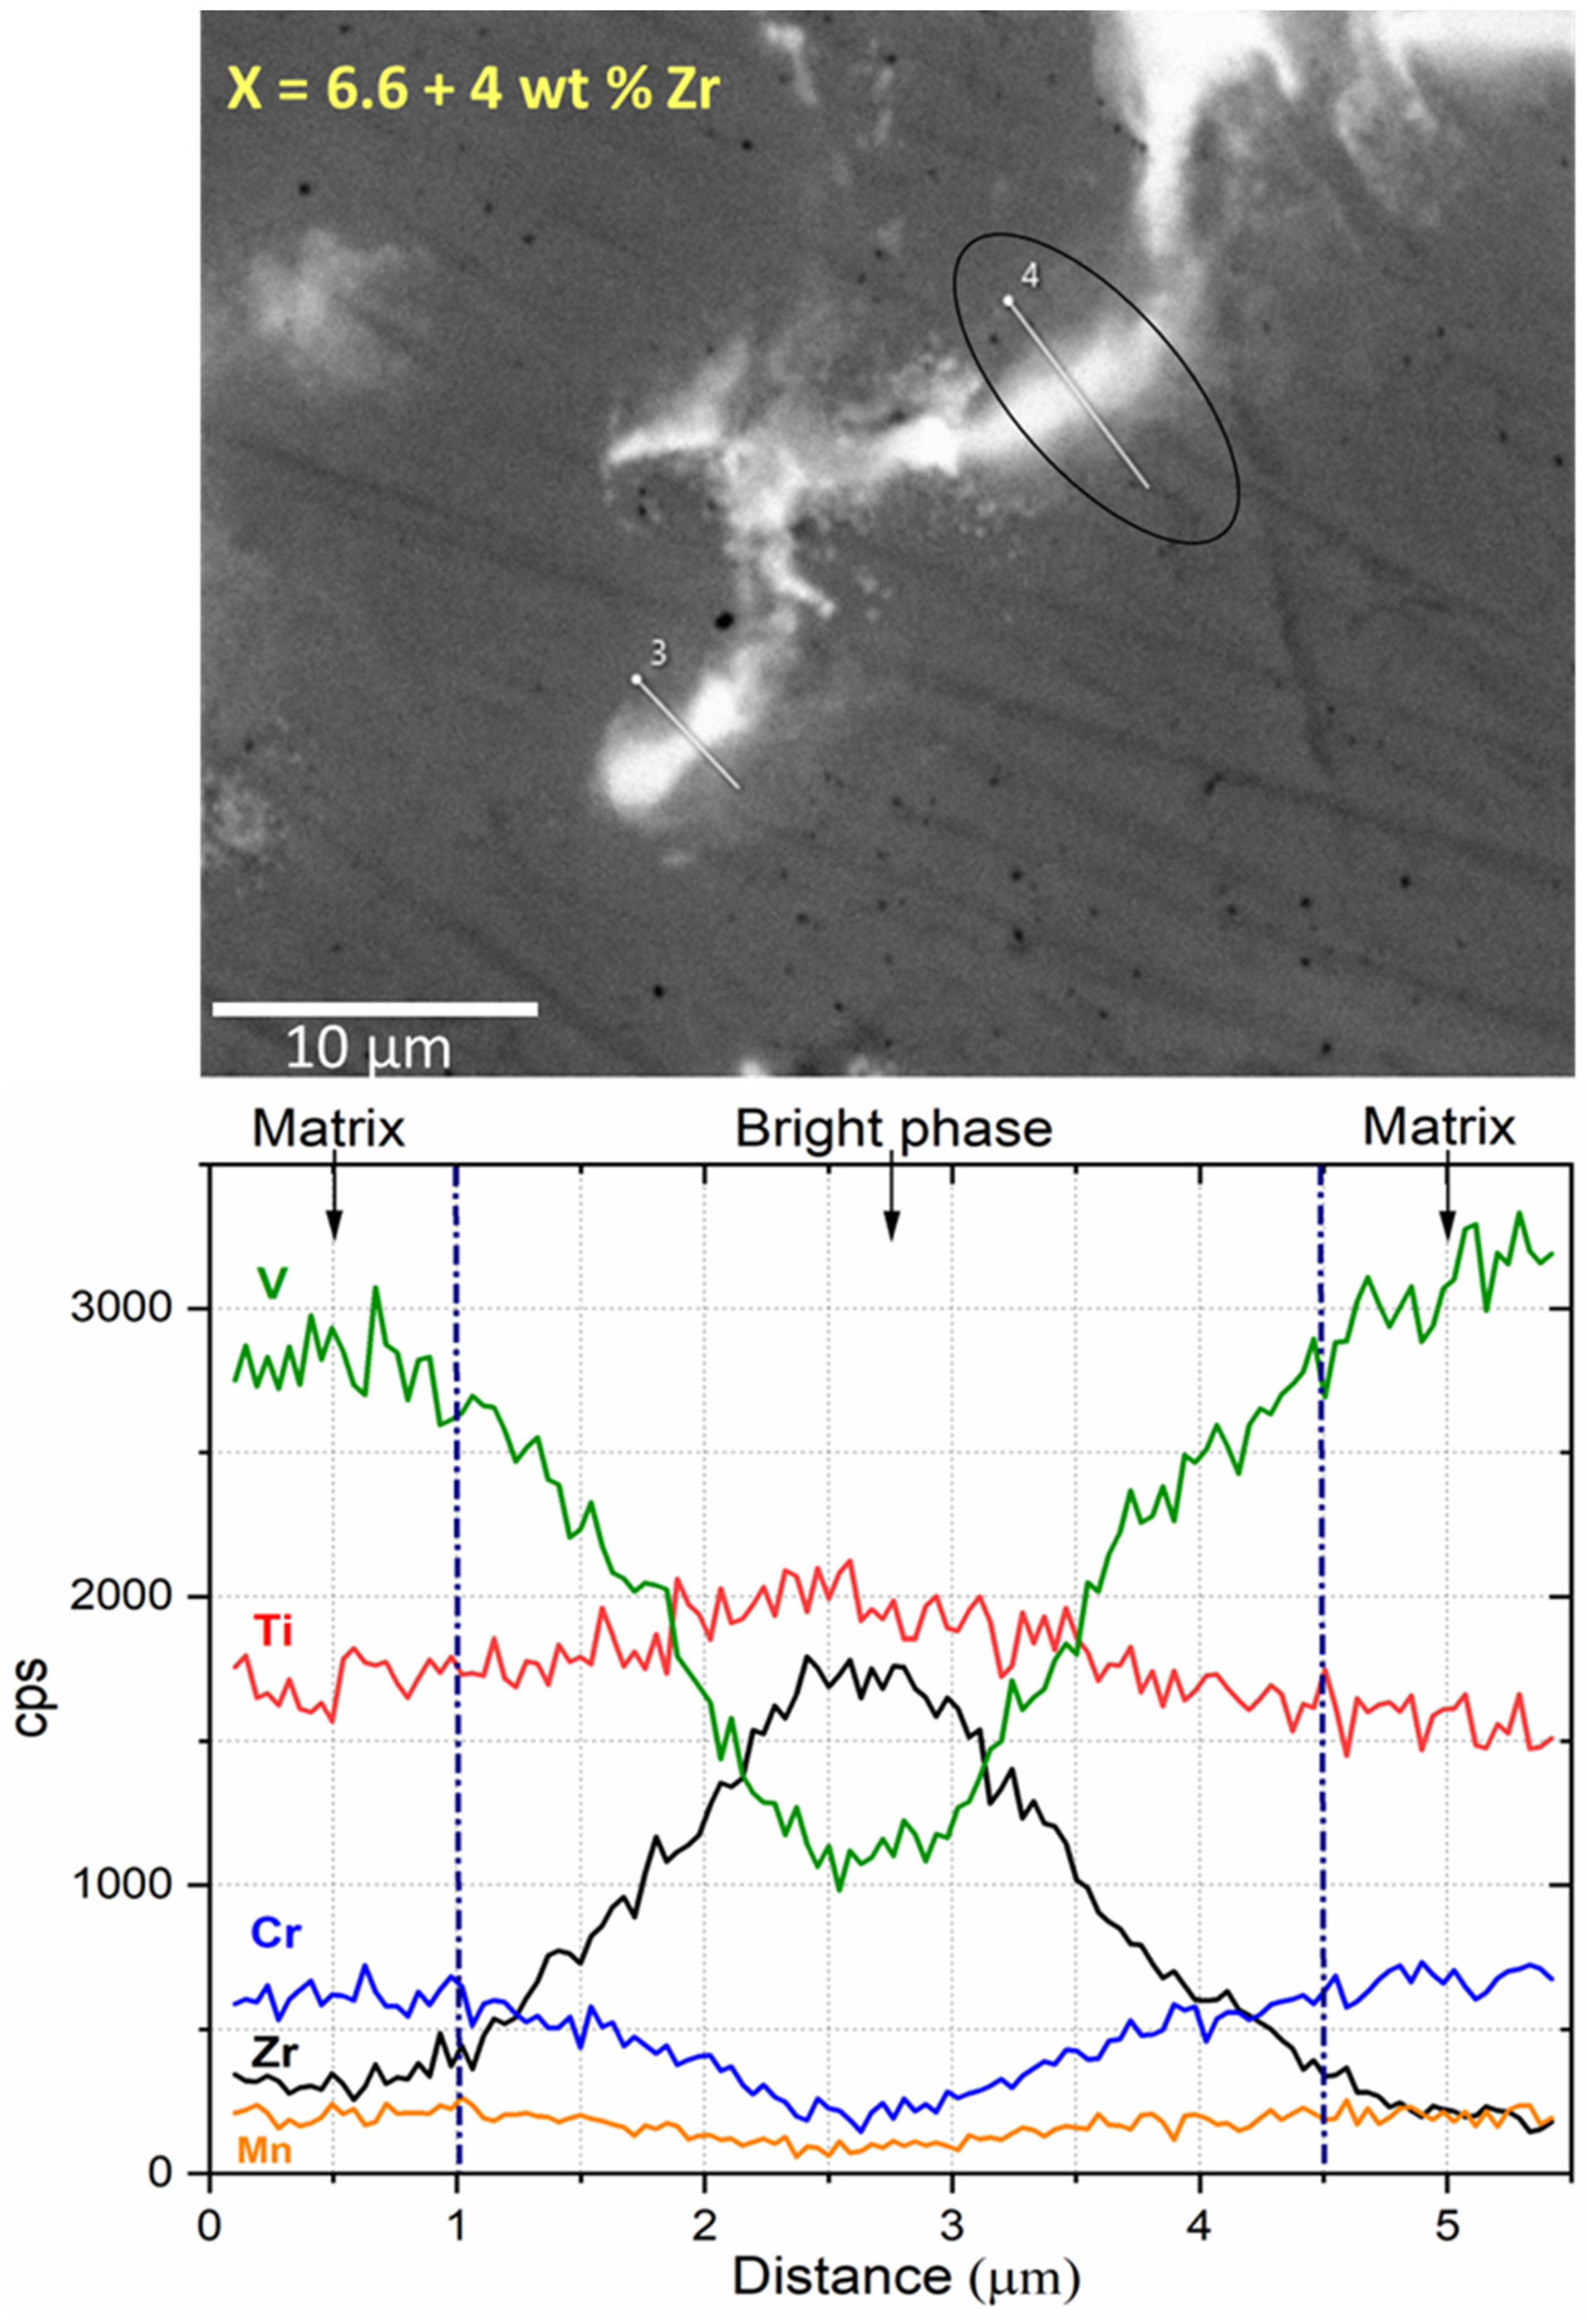
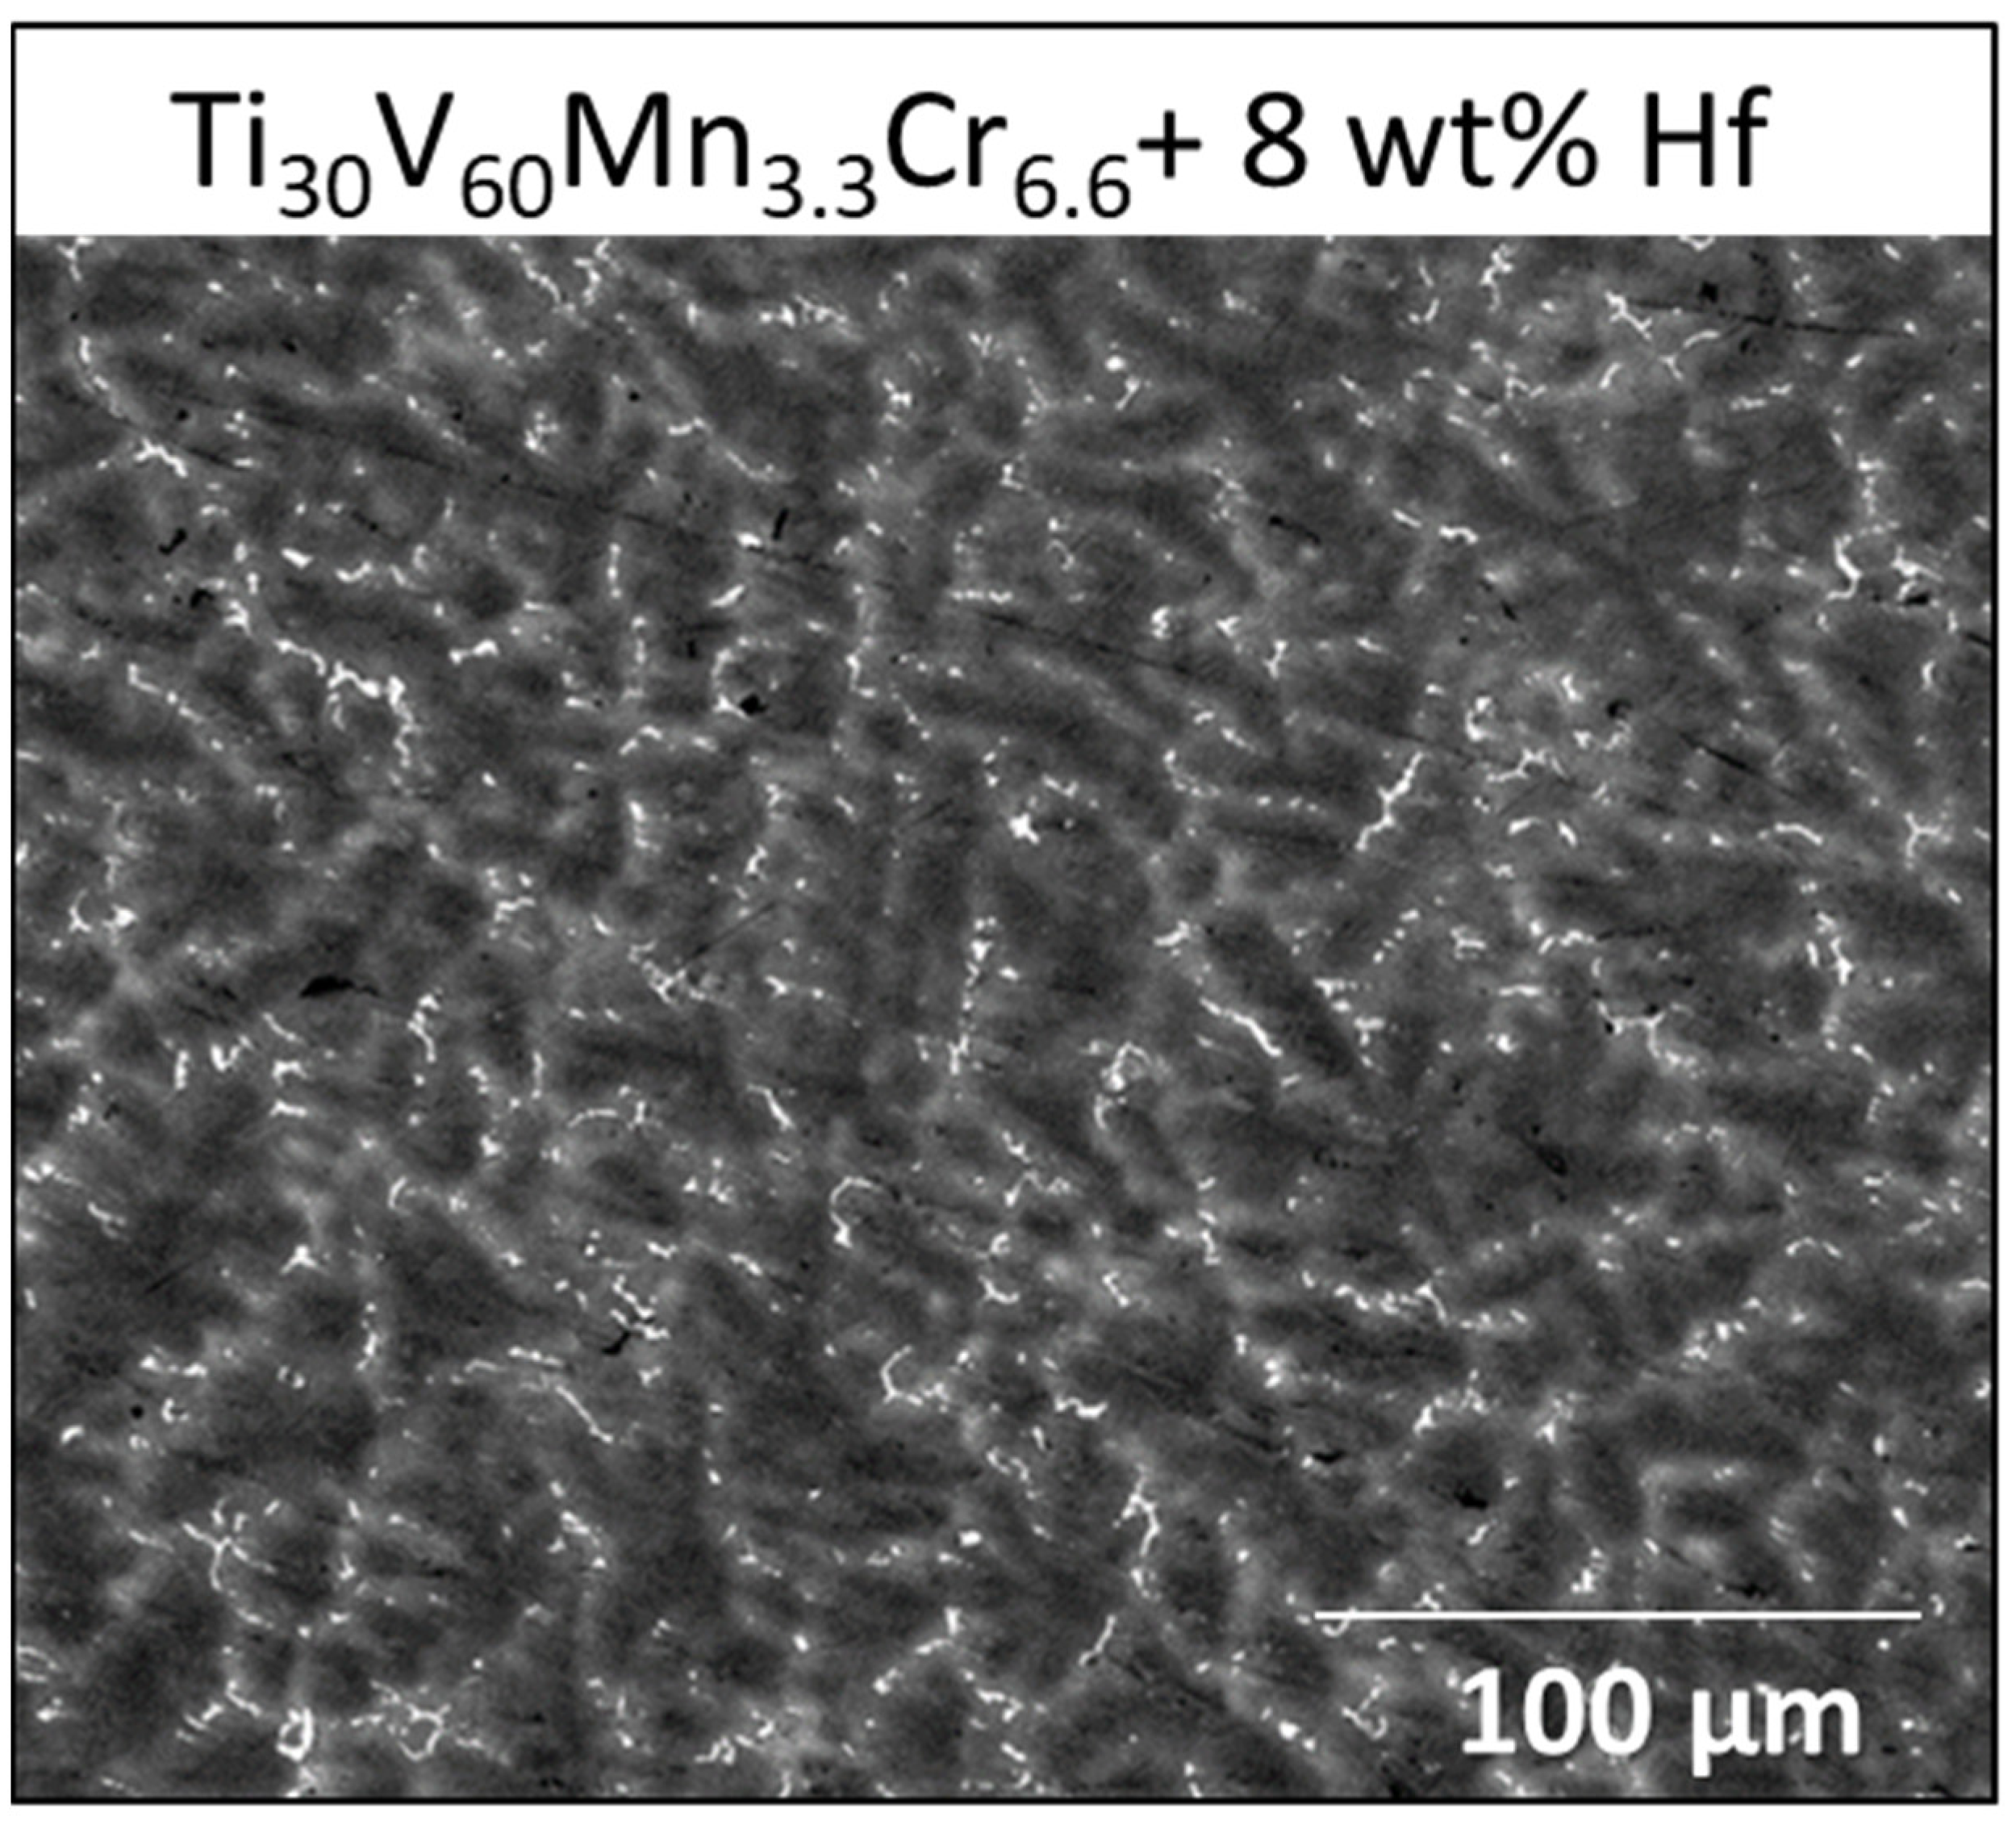
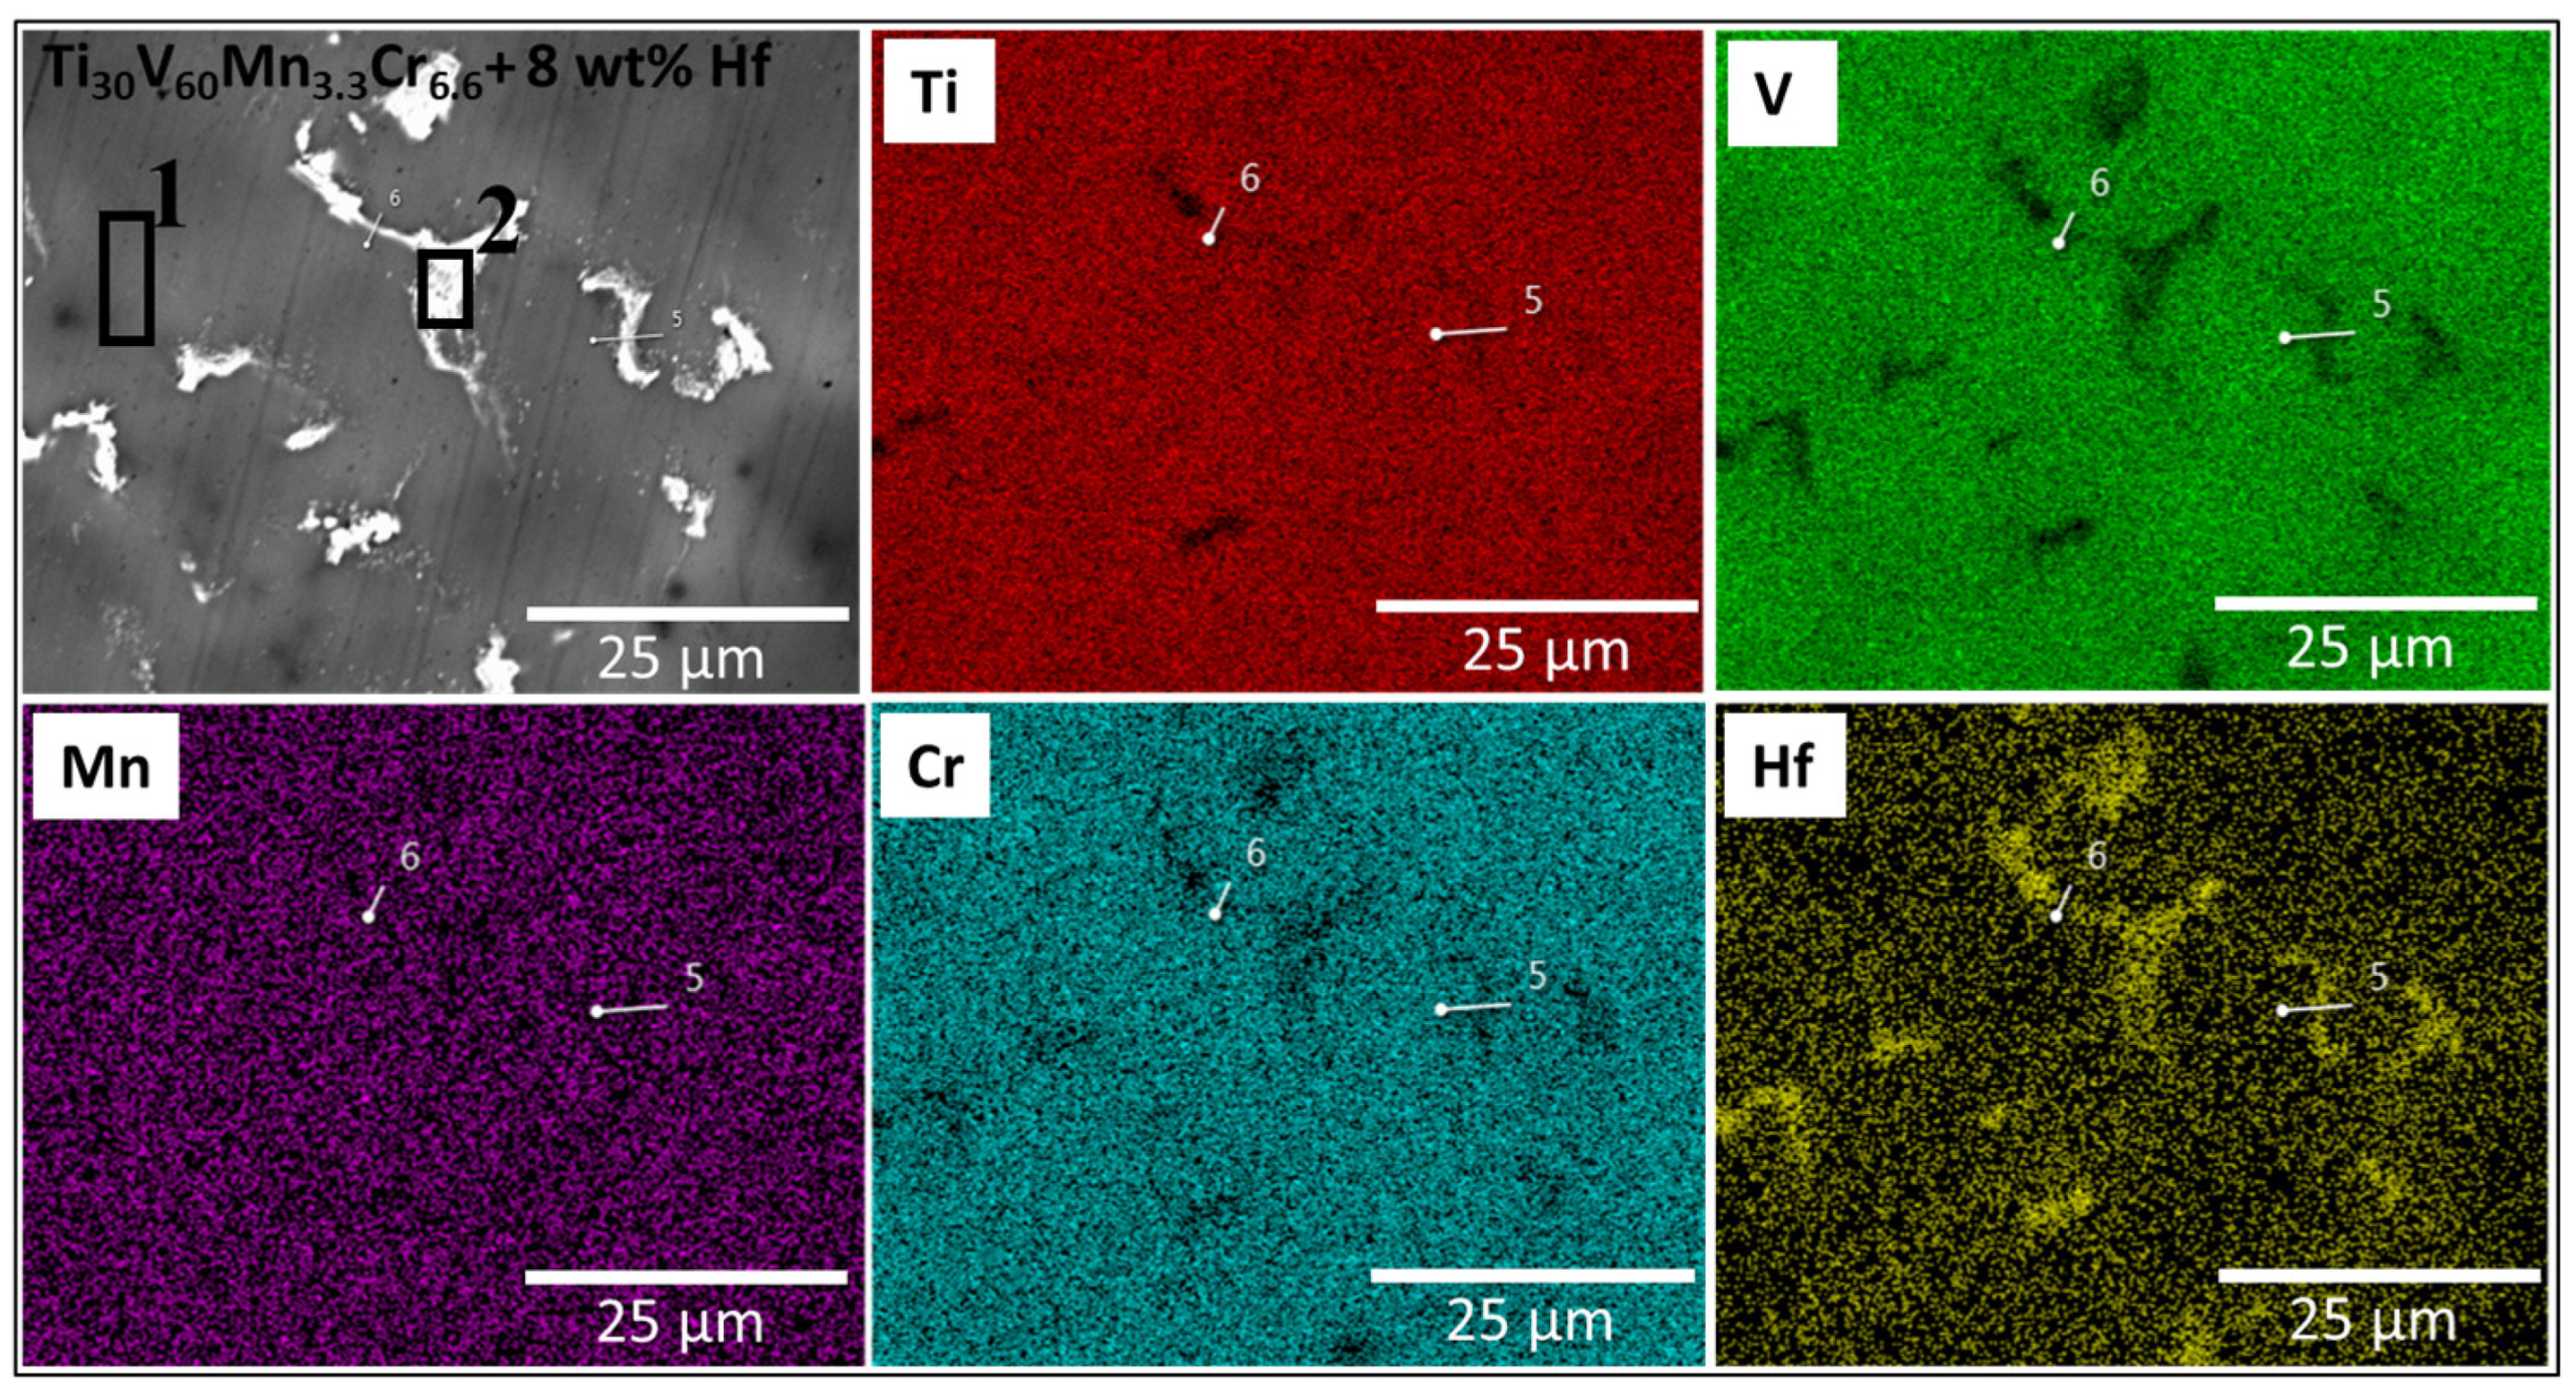
3.1. Morphologie
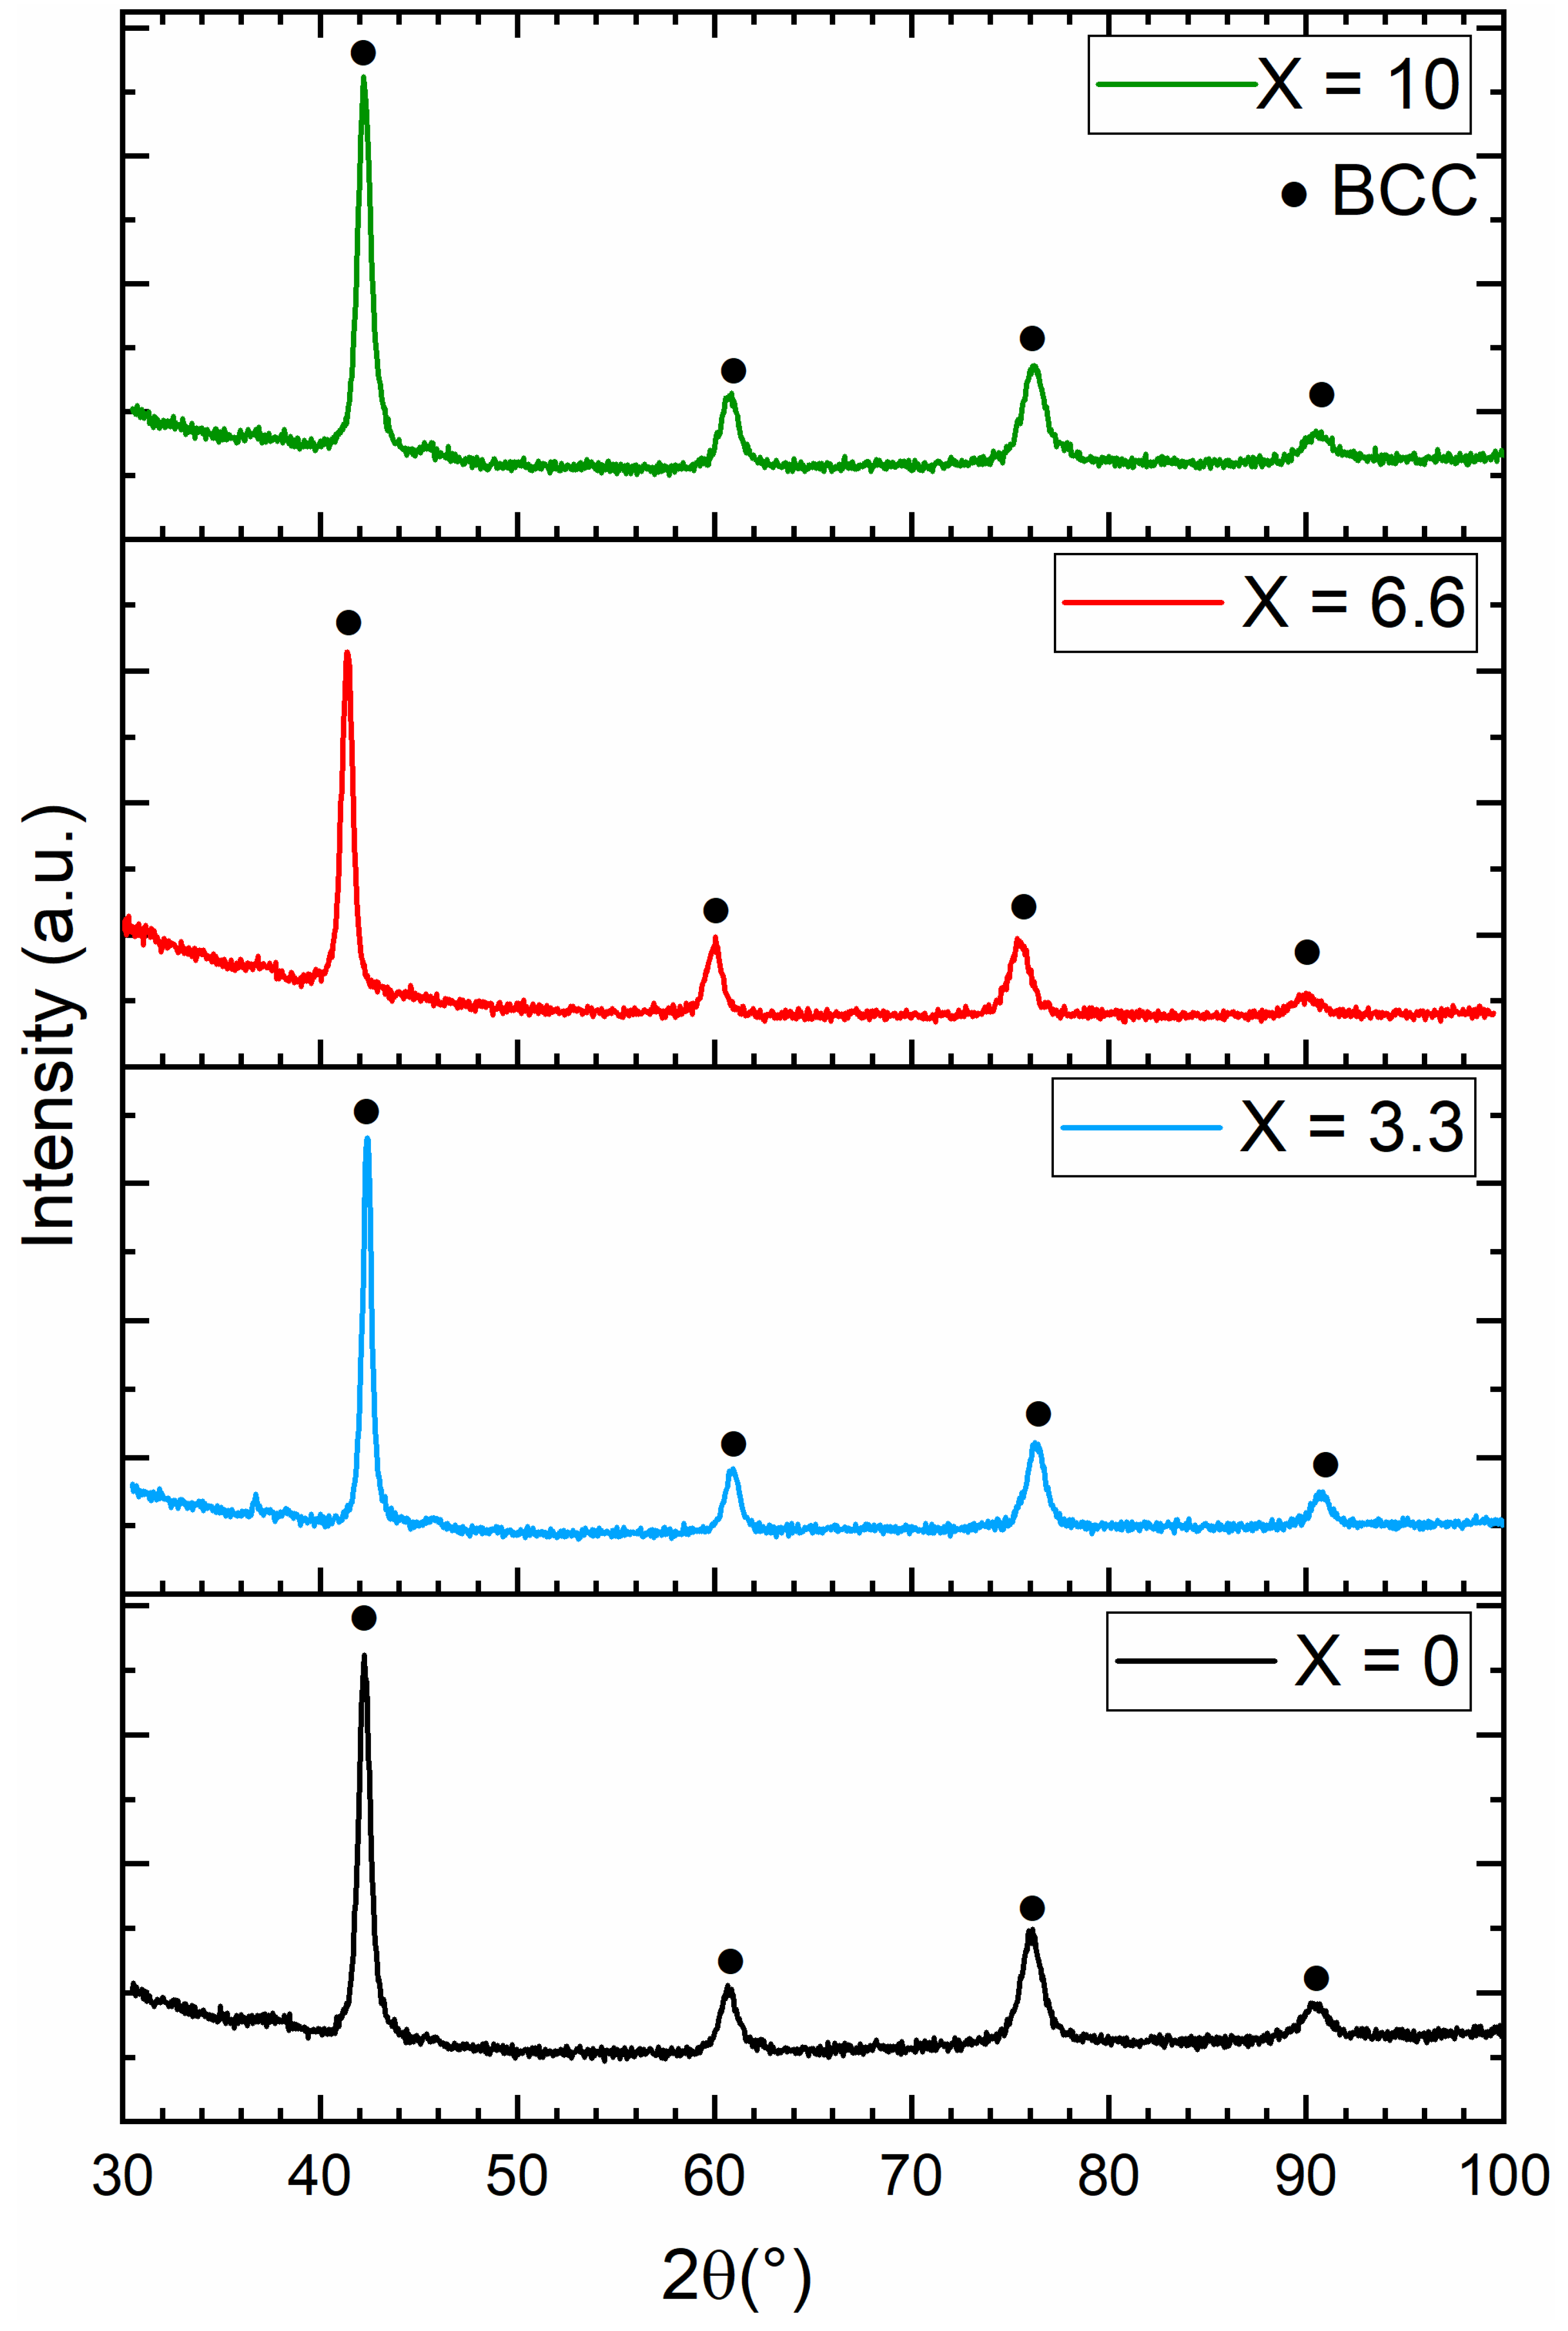
3.2. Crystal Structure of As-Cast Alloys
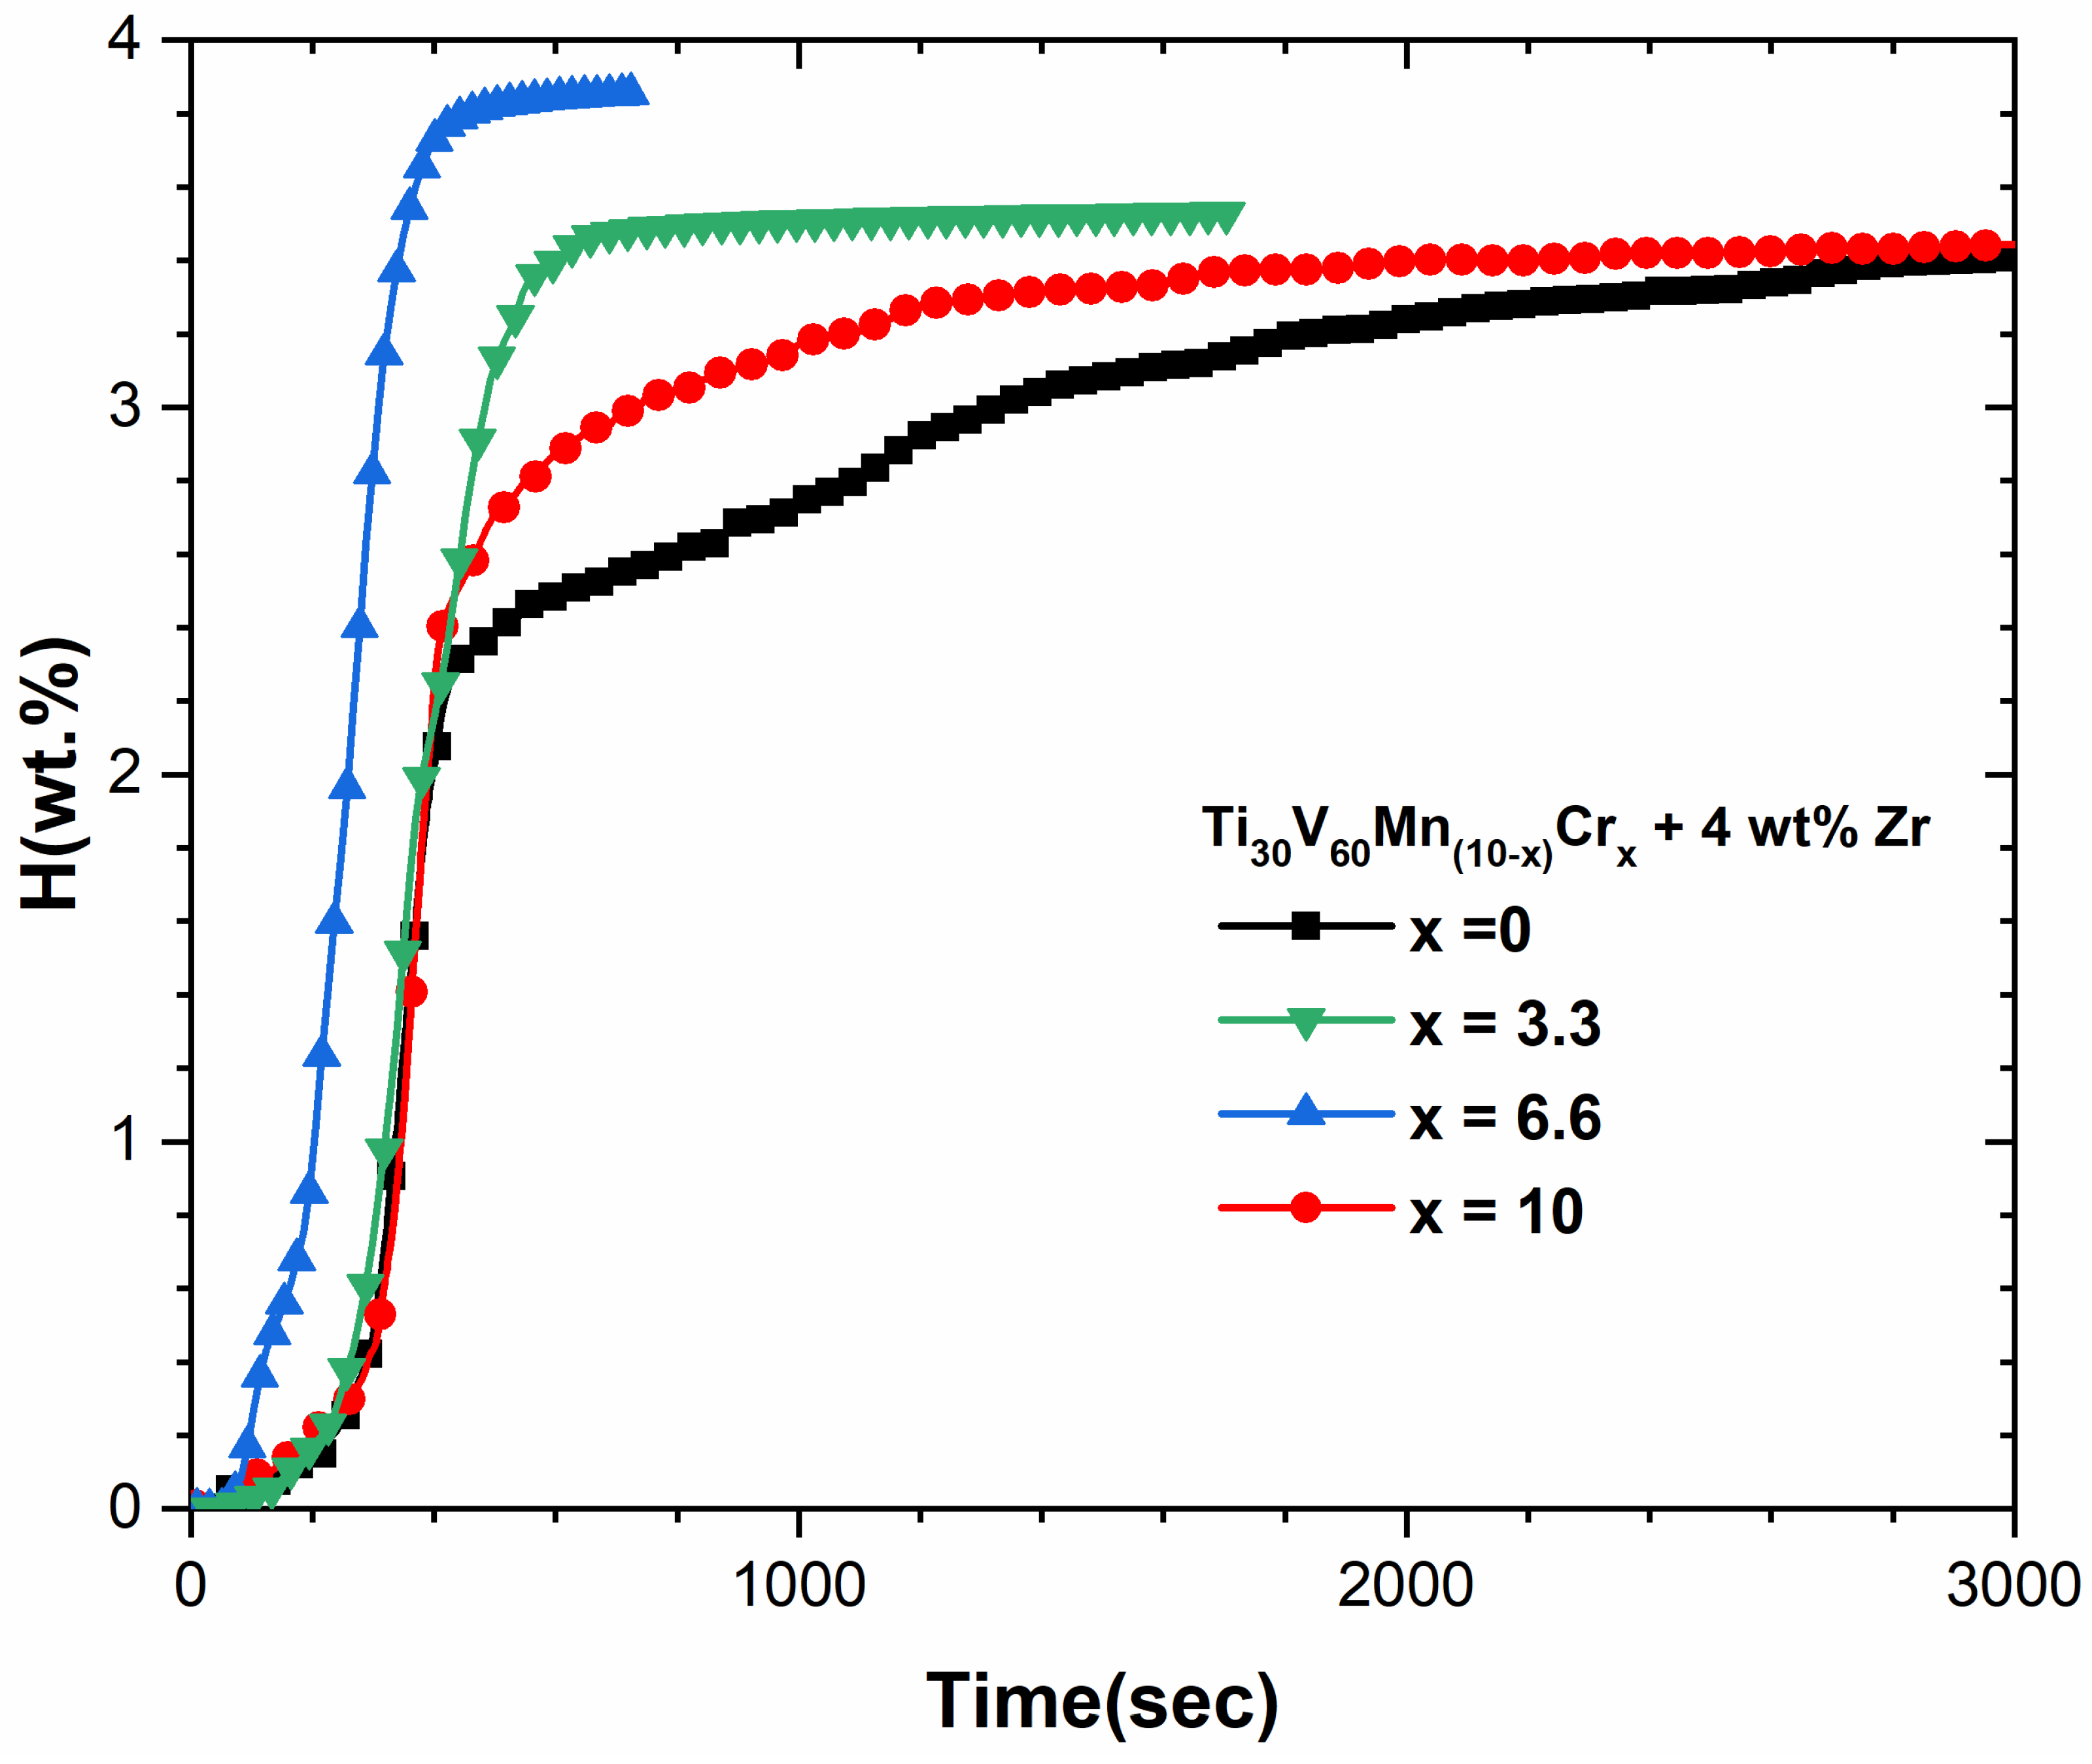
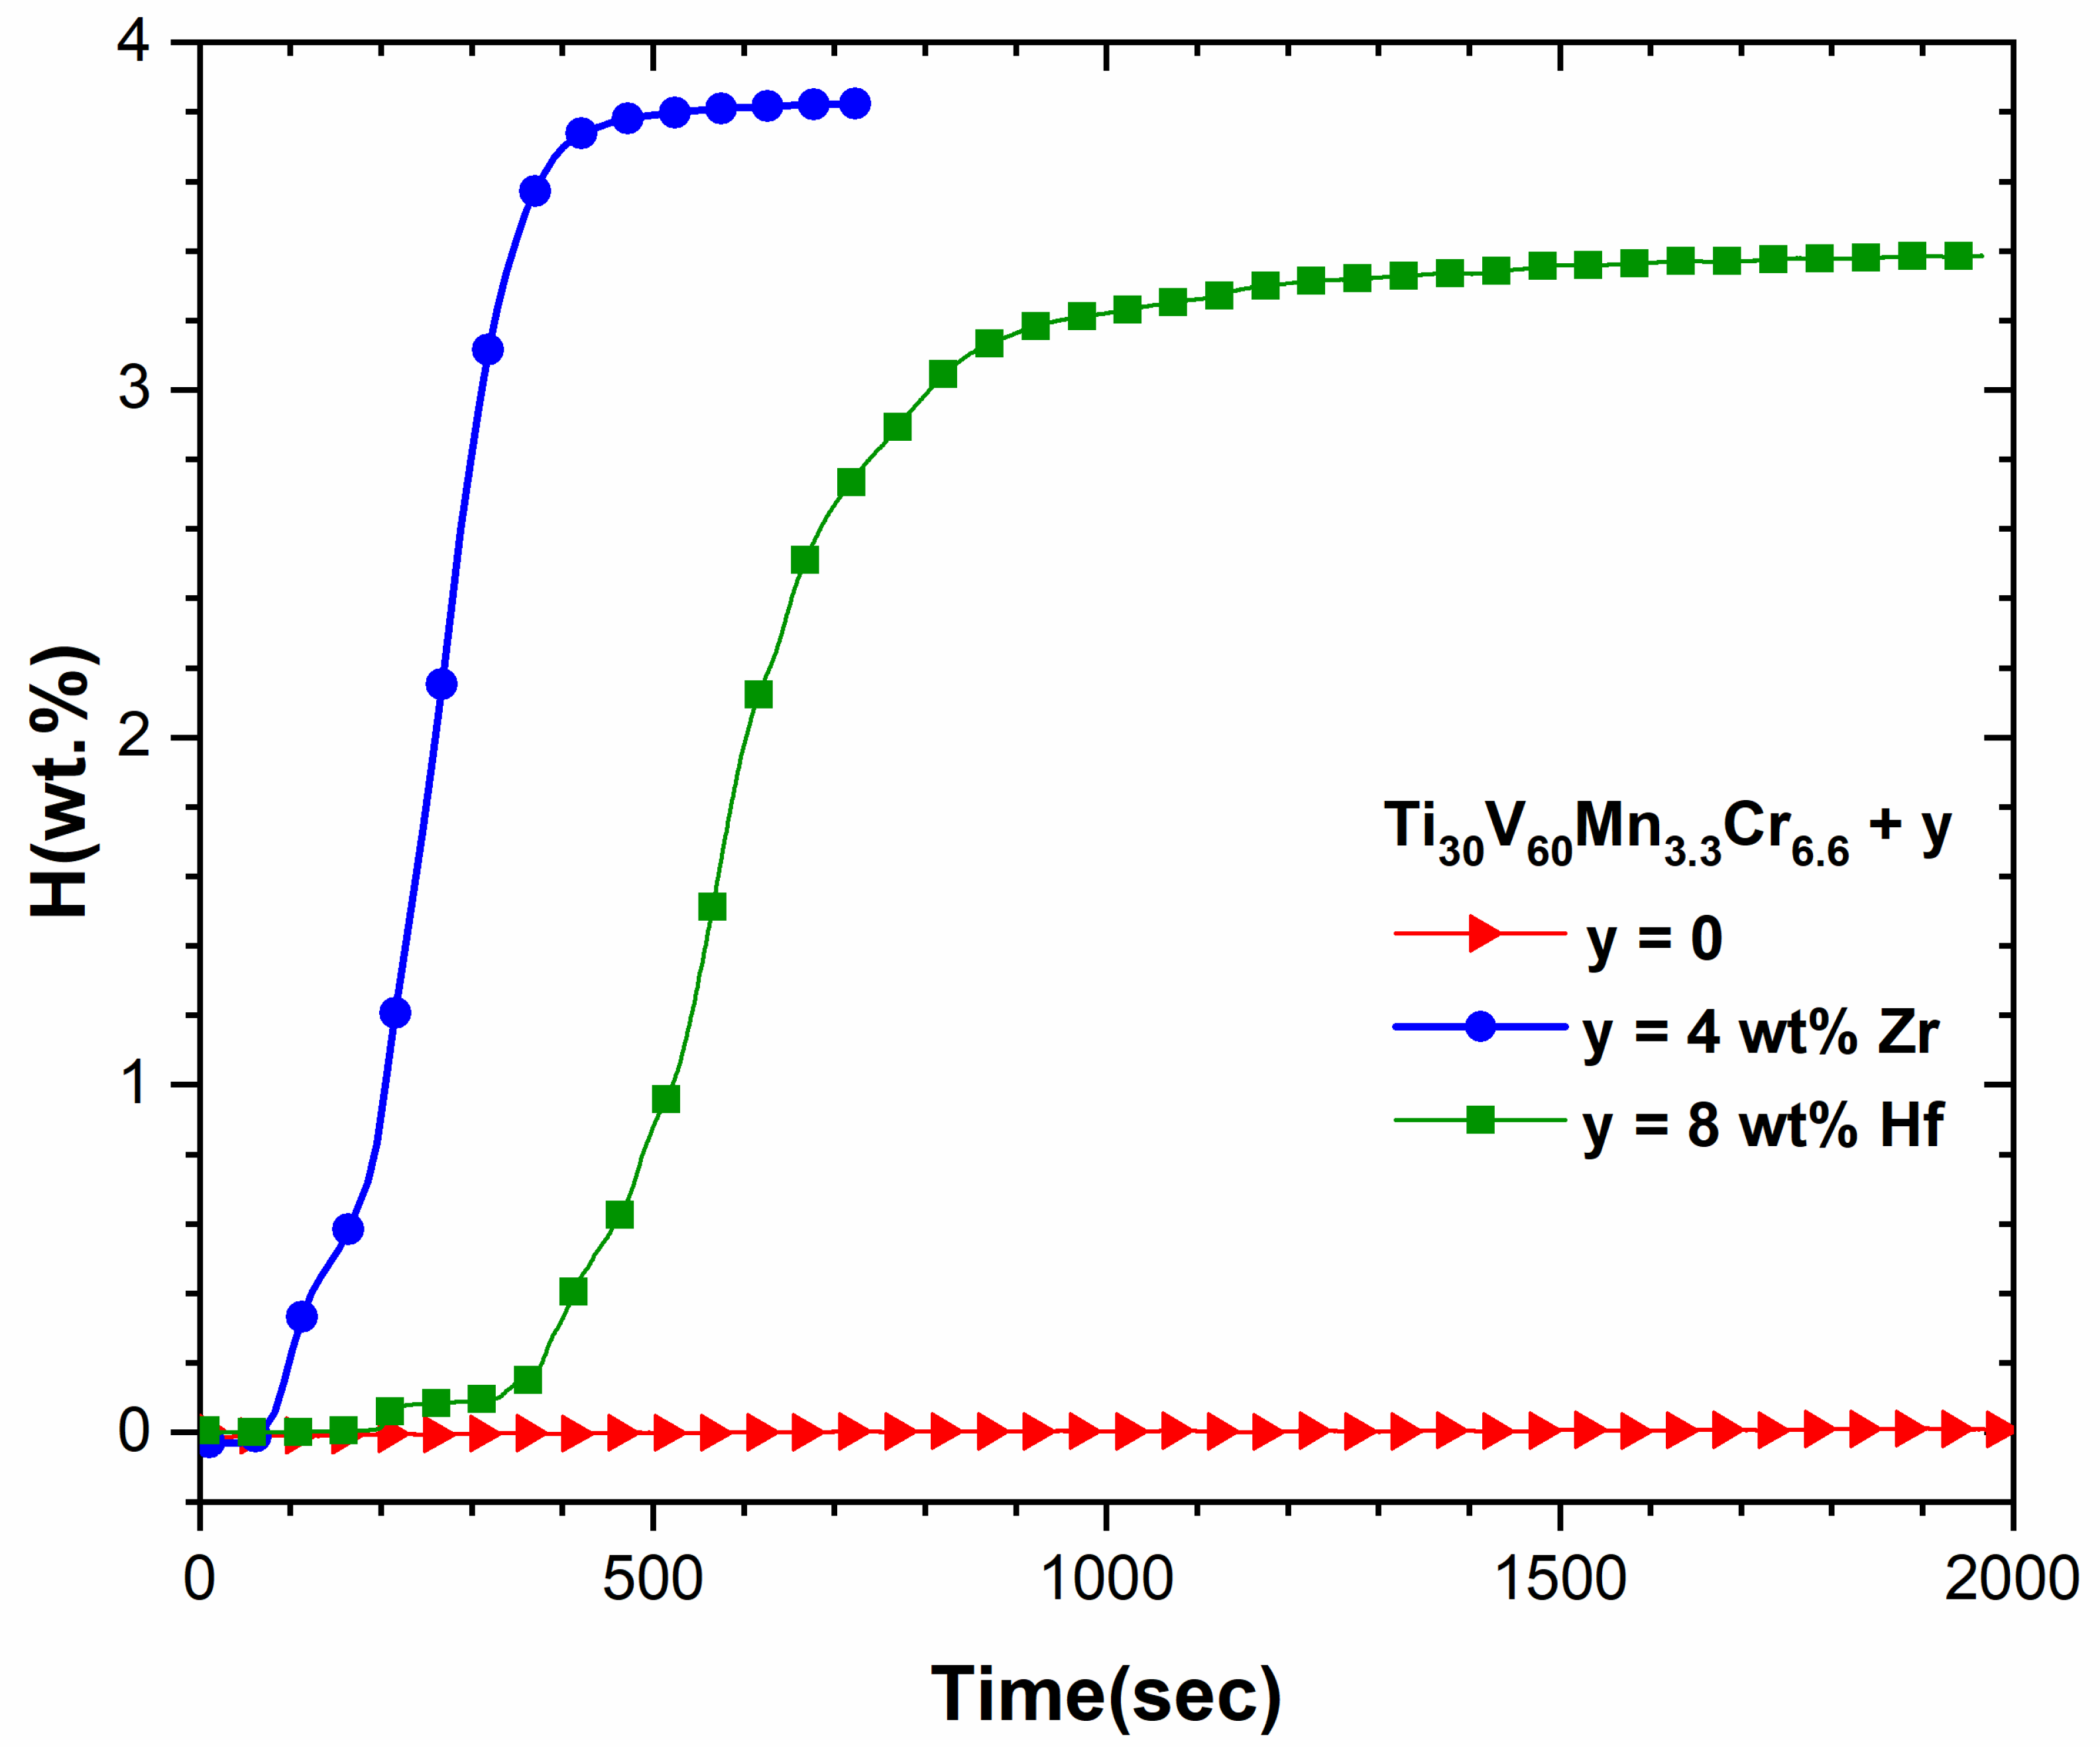
3.3. First Hydrogenation Properties
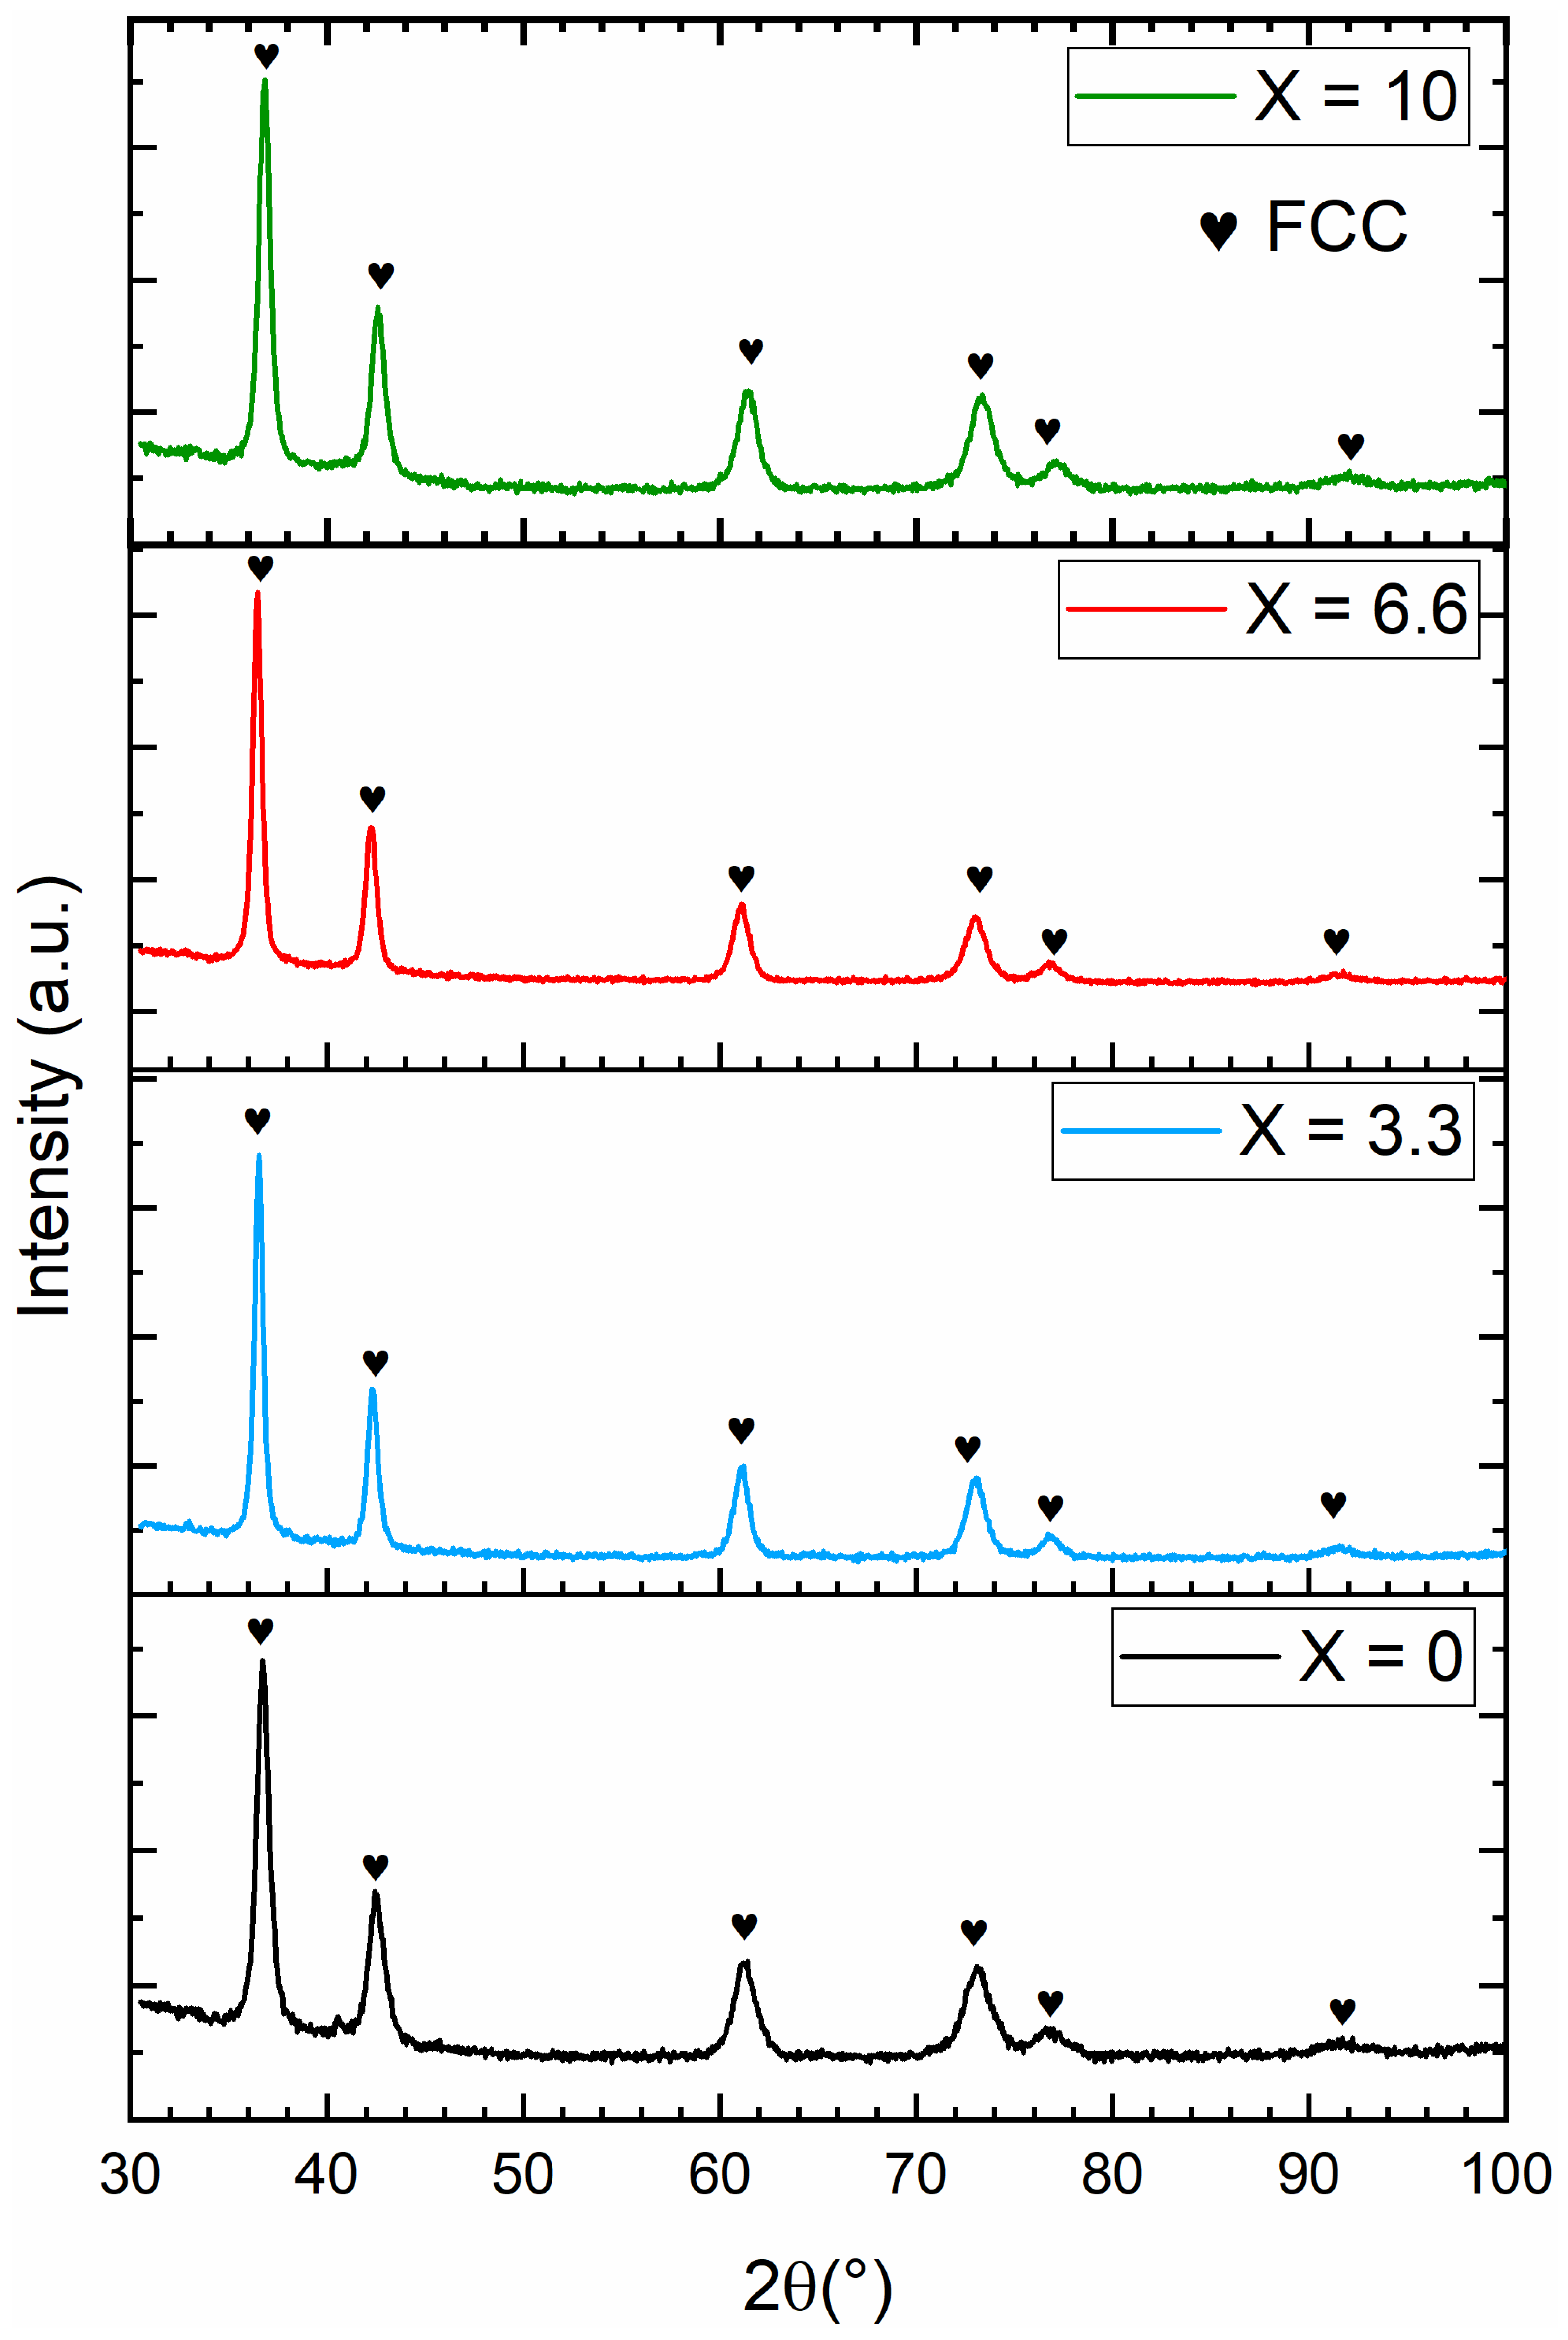
3.4. Crystal Structure of Hydrogenated Alloys
4. Discussion
Author Contributions
Funding
Data Availability Statement
Acknowledgments
Conflicts of Interest
References
- Cho, Y.; Cho, H.; Cho, E.S. Nanointerface Engineering of Metal Hydrides for Advanced Hydrogen Storage. Chem. Mater. 2023, 35, 366–385. [Google Scholar] [CrossRef]
- Kovač, A.; Paranos, M.; Marciuš, D. Hydrogen in energy transition: A review. Int. J. Hydrogen Energy 2021, 46, 10016–10035. [Google Scholar] [CrossRef]
- Zhou, L.; Li, W.; Hu, H.; Zeng, H.; Chen, Q. Ce-doped TiZrCrMn alloys for enhanced hydrogen storage. Energy Fuels 2022, 36, 3997–4005. [Google Scholar] [CrossRef]
- Joubert, J.-M.; Paul-Boncour, V.; Cuevas, F.; Zhang, J.; Latroche, M. LaNi5 related AB5 compounds: Structure, properties and applications. J. Alloys Compd. 2021, 862, 158163. [Google Scholar] [CrossRef]
- Liang, G.; Huot, J.; Schulz, R. Hydrogen storage properties of the mechanically alloyed LaNi5-based materials. J. Alloys Compd. 2001, 320, 133–139. [Google Scholar] [CrossRef]
- Sato, T.; Saitoh, H.; Utsumi, R.; Ito, J.; Nakahira, Y.; Obana, K.; Takagi, S.; Orimo, S.-I. Hydrogen Absorption Reactions of Hydrogen Storage Alloy LaNi5 under High Pressure. Molecules 2023, 28, 1256. [Google Scholar] [CrossRef] [PubMed]
- Lv, P.; Huot, J. Hydrogenation improvement of TiFe by adding ZrMn2. Energy 2017, 138, 375–382. [Google Scholar] [CrossRef]
- Xu, Y.; Deng, Y.; Liu, W.; Zhao, X.; Xu, J.; Yuan, Z. Research progress of hydrogen energy and metal hydrogen storage materials. Sustain. Energy Technol. Assess. 2023, 55, 102974. [Google Scholar] [CrossRef]
- Zhang, Y.; Li, J.; Zhang, T.; Kou, H.; Hu, R.; Xue, X. Microstructural characterization and hydrogenation properties of non-stoichiometric Zr0.9TixV2 alloys. Int. J. Hydrogen Energy 2014, 39, 19637–19645. [Google Scholar] [CrossRef]
- De Rango, P.; Marty, P.; Fruchart, D. Hydrogen storage systems based on magnesium hydride: From laboratory tests to fuel cell integration. Appl. Phys. A 2016, 122, 126. [Google Scholar] [CrossRef]
- Edalati, K.; Akiba, E.; Botta, W.J.; Estrin, Y.; Floriano, R.; Fruchart, D.; Grosdidier, T.; Horita, Z.; Huot, J.; Li, H.-W.; et al. Impact of severe plastic deformation on kinetics and thermodynamics of hydrogen storage in magnesium and its alloys. J. Mater. Sci. Technol. 2023, 146, 221–239. [Google Scholar] [CrossRef]
- Yartys, V.A.; Lototskyy, M.V.; Akiba, E.; Albert, R.; Antonov, V.; Ares, J.-R.; Baricco, M.; Bourgeois, N.; Buckley, C.; von Colbe, J.B.; et al. Magnesium based materials for hydrogen based energy storage: Past, present and future. Int. J. Hydrogen Energy 2019, 44, 7809–7859. [Google Scholar] [CrossRef]
- Zhou, C.; Fang, Z.Z.; Bowman, R.C. Stability of Catalyzed Magnesium Hydride Nanocrystalline during Hydrogen Cycling. Part I: Kinetic Analysis. J. Phys. Chem. C 2015, 119, 22261–22271. [Google Scholar] [CrossRef]
- Ding, N.; Li, Y.; Liang, F.; Liu, B.; Liu, W.; Wang, Q.; Wang, L. Highly Efficient Hydrogen Storage Capacity of 2.5 wt % above 0.1 MPa Using Y and Cr Codoped V-Based Alloys. ACS Appl. Energy Mater. 2022, 5, 3282–3289. [Google Scholar] [CrossRef]
- Mazzolai, G.; Coluzzi, B.; Biscarini, A.; Mazzolai, F.M.; Tuissi, A.; Agresti, F.; Lo Russo, S.; Maddalena, A.; Palade, P.; Principi, G. Hydrogen-storage capacities and H diffusion in bcc TiVCr alloys. J. Alloys Compd. 2008, 466, 133–139. [Google Scholar] [CrossRef]
- Montero, J.; Ek, G.; Laversenne, L.; Nassif, V.; Zepon, G.; Sahlberg, M.; Zlotea, C. Hydrogen storage properties of the refractory Ti–V–Zr–Nb–Ta multi-principal element alloy. J. Alloys Compd. 2020, 835, 155376. [Google Scholar] [CrossRef]
- Okada, M.; Kuriiwa, T.; Tamura, T.; Takamura, H.; Kamegawa, A. Ti–V–Cr b.c.c. alloys with high protium content. J. Alloys Compd. 2002, 330, 511–516. [Google Scholar] [CrossRef]
- Balcerzak, M. Hydrogenation properties of nanocrystalline Ti–V–Mn body-centered-cubic alloys. Int. J. Hydrogen Energy 2020, 45, 15521–15529. [Google Scholar] [CrossRef]
- Song, F.; Yao, J.; Yong, H.; Wang, S.; Xu, X.; Chen, Y.; Zhang, L.; Hu, J. Investigation of ball-milling process on microstructure, thermodynamics and kinetics of Ce–Mg–Ni-based hydrogen storage alloy. Int. J. Hydrogen Energy 2023, 48, 11274–11286. [Google Scholar] [CrossRef]
- Chen, X.; Chen, R.; Ding, X.; Fang, H.; Li, X.; Ding, H.; Su, Y.; Guo, J.; Fu, H. Effect of phase formation on hydrogen storage properties in Ti-V-Mn alloys by zirconium substitution. Energy 2019, 166, 587–597. [Google Scholar] [CrossRef]
- Zhang, Y.; Li, J.; Zhang, T.; Kou, H.; Hu, R.; Xue, X. Hydrogen storage properties of non-stoichiometric Zr0.9TixV2 melt-spun ribbons. Energy 2016, 114, 1147–1154. [Google Scholar] [CrossRef]
- Li, Z.; Yan, Y.; Huang, H.; Liu, B.; Lv, Y.; Zhang, B.; Lv, W.; Yuan, J.; Wu, Y. Effects of the different element substitution on hydrogen storage properties of Ti0.8Zr0.2Mn0.9Cr0.6V0.3M0.2 (M = Fe, Ni, Co). J. Alloys Compd. 2022, 908, 164605. [Google Scholar] [CrossRef]
- Nygård, M.M.; Sørby, M.H.; Grimenes, A.A.; Hauback, B.C. The Influence of Fe on the Structure and Hydrogen Sorption Properties of Ti-V-Based Metal Hydrides. Energies 2020, 13, 2874. [Google Scholar] [CrossRef]
- Suwarno, S.; Solberg, J.; Maehlen, J.; Krogh, B.; Yartys, V. Influence of Cr on the hydrogen storage properties of Ti-rich Ti–V–Cr alloys. Int. J. Hydrogen Energy 2012, 37, 7624–7628. [Google Scholar] [CrossRef]
- Tsukahara, M. Hydrogenation properties of vanadium-based alloys with large hydrogen storage capacity. Mater. Trans. 2011, 52, 68–72. [Google Scholar] [CrossRef]
- Young, K.; Ouchi, T.; Nei, J.; Meng, T. Effects of Cr, Zr, V, Mn, Fe, and Co to the hydride properties of Laves phase-related body-centered-cubic solid solution alloys. J. Power Source 2015, 281, 164–172. [Google Scholar] [CrossRef]
- Bibienne, T.; Tousignant, M.; Bobet, J.-L.; Huot, J. Synthesis and hydrogen sorption properties of TiV(2−x)Mnx BCC alloys. J. Alloys Compd. 2015, 624, 247–250. [Google Scholar] [CrossRef]
- Pickering, L.; Li, J.; Reed, D.; Bevan, A.I.; Book, D. Ti–V–Mn based metal hydrides for hydrogen storage. J. Alloys Compd. 2013, 580, S233–S237. [Google Scholar] [CrossRef]
- Pickering, L.; Reed, D.; Bevan, A.I.; Book, D. Ti–V–Mn based metal hydrides for hydrogen compression applications. J. Alloys Compd. 2015, 645, S400–S403. [Google Scholar] [CrossRef]
- Shashikala, K.; Banerjee, S.; Kumar, A.; Pai, M.; Pillai, C. Improvement of hydrogen storage properties of TiCrV alloy by Zr substitution for Ti. Int. J. Hydrogen Energy 2009, 34, 6684–6689. [Google Scholar] [CrossRef]
- Shibuya, M.; Nakamura, J.; Akiba, E. Hydrogenation properties and microstructure of Ti–Mn-based alloys for hybrid hydrogen storage vessel. J. Alloys Compd. 2008, 466, 558–562. [Google Scholar] [CrossRef]
- Banerjee, S.; Kumar, A.; Ruz, P.; Sengupta, P. Influence of Laves phase on microstructure and hydrogen storage properties of Ti–Cr–V based alloy. Int. J. Hydrogen Energy 2016, 41, 18130–18140. [Google Scholar] [CrossRef]
- Cho, S.-W.; Yoo, J.-H.; Shim, G.; Park, C.-N.; Choi, J. Effects of B addition on the hydrogen absorption–desorption property of Ti0.32Cr0.43V0.25 alloy. Int. J. Hydrogen Energy 2008, 33, 1700–1705. [Google Scholar] [CrossRef]
- Feng, Z.; Zhong, H.; Li, D.; Li, X.; Yang, B.; Li, S. Microstructure and hydrogen storage properties of Ti–V–Mn alloy with Zr, Ni, and Zr7Ni10 addition. J. Mater. Res. 2022, 37, 1591–1601. [Google Scholar] [CrossRef]
- Ruz, P.; Banerjee, S.; Halder, R.; Kumar, A.; Sudarsan, V. Thermodynamics, kinetics and microstructural evolution of Ti0.43Zr0.07Cr0.25V0.25 alloy upon hydrogenation. Int. J. Hydrogen Energy 2017, 42, 11482–11492. [Google Scholar] [CrossRef]
- Yan, Y.; Chen, Y.; Liang, H.; Wu, C.; Tao, M. Hydrogen storage properties of V30–Ti–Cr–Fe alloys. J. Alloys Compd. 2007, 427, 110–114. [Google Scholar] [CrossRef]
- Hang, Z.; Xiao, X.; Tan, D.; He, Z.; Li, W.; Li, S.; Chen, C.; Chen, L. Microstructure and hydrogen storage properties of Ti10V84−xFe6Zrx (x = 1–8) alloys. Int. J. Hydrogen Energy 2010, 35, 3080–3086. [Google Scholar] [CrossRef]
- Mouri, T.; Iba, H. Hydrogen-absorbing alloys with a large capacity for a new energy carrier. Mater. Sci. Eng. A 2002, 329, 346–350. [Google Scholar] [CrossRef]
- Miraglia, S.; de Rango, P.; Rivoirard, S.; Fruchart, D.; Charbonnier, J.; Skryabina, N. Hydrogen sorption properties of compounds based on BCC Ti1−xV1−yCr1+x+y alloys. J. Alloys Compd. 2012, 536, 1–6. [Google Scholar] [CrossRef]
- Dixit, V.; Huot, J. Structural, microstructural and hydrogenation characteristics of Ti-V-Cr alloy with Zr-Ni addition. J. Alloys Compd. 2019, 776, 614–619. [Google Scholar] [CrossRef]
- Dixit, V.; Huot, J. Investigation of the microstructure, crystal structure and hydrogenation kinetics of Ti-V-Cr alloy with Zr addition. J. Alloys Compd. 2019, 785, 1115–1120. [Google Scholar] [CrossRef]
- Evans, J.S. Advanced input files & parametric quantitative analysis using topas. Mater. Sci. Forum. 2010, 651, 1–9. [Google Scholar] [CrossRef]
- Miracle, D.B.; Senkov, O.N. A critical review of high entropy alloys and related concepts. Acta Mater. 2017, 122, 448–511. [Google Scholar] [CrossRef]


| Sample | Region | Ti (at.%) | V (at.%) | Mn (at.%) | Cr (at.%) | Zr (at.%) |
|---|---|---|---|---|---|---|
| Ti30V60Mn10 + 4 wt.% Zr | nominal | 30.9 | 58.2 | 8.9 | - | 2 |
| Bulk measured | 32.2(1) | 57.9(1) | 6.3(1) | - | 3.7(1) | |
| Ti30V60Mn10 + 4 wt.% Zr | Matrix | 31.2(8) | 60(1) | 6.5(3) | - | 2.3(3) |
| Bright region | 41.4(1) | 28(1) | 3.6(1) | - | 27(1) | |
| Black region | 78.7(1) | 10.7(8) | 0.7(1) | - | 9.9(5) | |
| Ti30V60Mn6.6Cr3.3 + 4 wt.% Zr | nominal | 30.8 | 58.1 | 6 | 3.1 | 2 |
| Bulk measured | 30.4(1) | 57.1(1) | 6.2(1) | 2.9(1) | 3.4(1) | |
| Ti30V60Mn6.6Cr3.3 + 4 wt.% Zr | Matrix | 30.7(4) | 57.5(4) | 6(6) | 2.90(4) | 2.9(1) |
| Bright region | 38.7(1) | 29.2(1) | 3(1) | 1.4(1) | 27.7(1) | |
| Ti30V60Mn3.3Cr6.6 + 4 wt.% Zr | nominal | 30.8 | 58 | 2.9 | 6.3 | 1.9 |
| Bulk measured | 28.7(1) | 58.5(1) | 3.6(1) | 6.2(1) | 3.3(1) | |
| Ti30V60Mn3.3Cr6.6 + 4 wt.% Zr | Matrix | 27.8(8) | 62(1) | 3.2(1) | 6.10(5) | 1.1(2) |
| Bright region | 39.9(5) | 26(1) | 2.7(1) | 3.0(2) | 28(1) | |
| Ti30V60Cr10 + 4 wt.% Zr | nominal | 30.7 | 58 | - | 9.5 | 1.9 |
| Bulk measured | 29.6(1) | 57.7(1) | - | 9.9(1) | 2.8(1) | |
| Ti30V60Cr10 + 4 wt.% Zr | Matrix | 29.2(9) | 59(1) | - | 9.8(2) | 2(5) |
| Bright region | 41.6(4) | 29.5(2) | - | 4.9(2) | 24(3) | |
| Ti30V60Mn3.3Cr6.6 (Zr-free) | nominal | 31.4 | 59.2 | 3 | 6.4 | - |
| Bulk measured | 31.0(1) | 59.1(1) | 3.5(1) | 6.4(1) | - | |
| Ti30V60Mn3.3Cr6.6 (Zr-free) | Matrix | 31.1(3) | 59(3) | 3.6(4) | 6.3(1) | - |
| Sample | Region | Ti (at.%) | V (at.%) | Mn (at.%) | Cr (at.%) | Hf (at.%) |
|---|---|---|---|---|---|---|
| Ti30V60Mn3.3Cr6.6 + 8 wt.% Hf | nominal | 31 | 58 | 3 | 6 | 2 |
| Bulk measured | 30.4 | 57.4 | 3.4 | 6.3 | 2.5 | |
| Ti30V60Mn3.3Cr6.6 + 8 wt.% Hf | Matrix | 29.7 | 57.4 | 3.1 | 5.9 | 3.9 |
| Bright Region | 41.2 | 32.6 | 1.8 | 3.3 | 21.1 |
| Alloy | Lattice Parameter (Å) | Cell Volume (Å)3 | Crystallite Size (nm) | Microstrain (%) | Average Atomic Radius r (Å) | Ratio r/a |
|---|---|---|---|---|---|---|
| x = 0 | 3.1037(5) | 29.90(1) | 13.7(4) | 0.256(6) | 1.3708(4) | 0.4416(2) |
| x = 3.3 | 3.0979(5) | 29.71(2) | 12.8(2) | 0.254(7) | 1.3687(4) | 0.4418(2) |
| x = 6.6 | 3.0859(7) | 29.52(2) | 10.8(2) | 0.254(6) | 1.3657(4) | 0.4425(2) |
| x = 10 | 3.0962(6) | 29.68(2) | 11.4(3) | 0.252(7) | 1.3627(4) | 0.4401(2) |
| Alloy | Lattice Parameter (Å) | Cell Volume (Å)3 | Crystallite Size (nm) | Microstrain (%) |
|---|---|---|---|---|
| x = 0 | 4.3388(8) | 81.68(4) | 14.5(6) | 0.378(7) |
| x = 3.3 | 4.3289(5) | 81.12(3) | 20.4(6) | 0.24(4) |
| x = 6.6 | 4.3219(5) | 80.73(3) | 20.6(6) | 0.268(4) |
| x = 10 | 4.3276(6) | 81.05(3) | 15.5(5) | 0.312(6) |
Disclaimer/Publisher’s Note: The statements, opinions and data contained in all publications are solely those of the individual author(s) and contributor(s) and not of MDPI and/or the editor(s). MDPI and/or the editor(s) disclaim responsibility for any injury to people or property resulting from any ideas, methods, instructions or products referred to in the content. |
© 2023 by the authors. Licensee MDPI, Basel, Switzerland. This article is an open access article distributed under the terms and conditions of the Creative Commons Attribution (CC BY) license (https://creativecommons.org/licenses/by/4.0/).
Share and Cite
Kefi, C.; Huot, J. Microstructure and First Hydrogenation Properties of Ti30V60Mn(10−x)Crx (x = 0, 3.3, 6.6, 10) + 4 wt.% Zr. Metals 2023, 13, 1119. https://doi.org/10.3390/met13061119
Kefi C, Huot J. Microstructure and First Hydrogenation Properties of Ti30V60Mn(10−x)Crx (x = 0, 3.3, 6.6, 10) + 4 wt.% Zr. Metals. 2023; 13(6):1119. https://doi.org/10.3390/met13061119
Chicago/Turabian StyleKefi, Chourouk, and Jacques Huot. 2023. "Microstructure and First Hydrogenation Properties of Ti30V60Mn(10−x)Crx (x = 0, 3.3, 6.6, 10) + 4 wt.% Zr" Metals 13, no. 6: 1119. https://doi.org/10.3390/met13061119