Article

Leaching of Waste Pharmaceutical Blister Package Aluminium in Sulphuric Acid Media

Department of Chemical and Metallurgical Engineering (CMET), School of Chemical Engineering, Aalto University, Vuorimiehentie 2 K, 02150 Espoo, Finland
*
Author to whom correspondence should be addressed.
Metals 2023, 13(6), 1118; https://doi.org/10.3390/met13061118
Submission received: 10 May 2023 / Revised: 9 June 2023 / Accepted: 11 June 2023 / Published: 14 June 2023

Abstract

:
In this study, the leaching behaviour of aluminium from waste pharmaceutical blister packages (WPBs) is investigated in sulphuric acid media to build future strategies for aluminium recycling from this non-recycled waste fraction. The results suggest that in hydrometallurgical recycling, passivation of aluminium during leaching can be mitigated in dilute sulphuric acid solutions (0.25 M), at high temperatures (60–80 °C) and specifically with H2O2 addition. With this system, 100% extraction was achieved within five hours under optimized conditions (H2SO4 = 0.25 M, T = 80 °C, H2O2 = 1.25 vol.%). The leaching mechanism is suggested to be based on electrochemical dissolution of metallic aluminium oxidized by H+ or H2O2, followed by fast passivation by Al2O3 and consequent chemical dissolution of Al2O3 at slower kinetics. The calculated activation energy (~69 kJ/mol) suggests that the leaching reaction is controlled by the chemical or electrochemical reaction step rather than diffusion. By WPB leaching, an aluminium sulphate solution could be obtained, suitable for further aluminium sulphate crystallization. This may provide a potential route for the valorisation of aluminium from a currently overlooked waste fraction of pharmaceutical blister packages.

1. Introduction

In the modern world, aluminium is one of the most important metals, second to steel in produced amount, with an annual primary production of 68.41 million metric tonnes in the year 2022 [1] and being used in a variety of applications such as automobiles, packaging, batteries, capacitors, conductor alloys, etc. [2]. During the past 25 years, the volume of aluminium produced has risen by roughly 2.5% annually; in 1997, 21.8 million tonnes were produced, compared to the predicted 58.45 million in 2025 [1]. Currently, aluminium is one of the most recycled metals, and it has been predicted that by the 2050s, post-consumer recycling may provide 50% of Europe’s need for aluminium [3]. As a result, Europe’s annual CO2 emission may reduce up to 39 million tonnes [3]. It has been estimated that the total energy consumption in the aluminium recycling process is 95% lower than that required in primary aluminium production by the Bayer process (caustic digestion—gibbsite precipitation—calcination) followed by electrolytic reduction up to a purity of 99.5–99.8% (Hall–Héroult process) [4,5]. Further refining of aluminium can be performed either using the Hoopes process (purity ~99.98%) or the Gadeau process (purity ~99.99%) [5,6,7].
In the medicine industry, most tablets and capsules currently use blister packages as their preferred receptacle [8]. The COVID-19 pandemic led to a sudden amplification of pharmaceutical drug production, hence resulting in increased generation of WPBs [9]. According to a market study conducted by Future Market Insights, the global demand for blister packaging reached 5.18 kt in 2021 [9]. With ca. 10 wt.% aluminium content and the remaining 90 wt.% being either poly vinyl chloride (PVC) or poly vinyl di-chloride (PVDC) in blister packages [10], this is equal to ~518 t of aluminium, i.e., 10,150 t of CO2 eq. footprint when produced from primary raw materials (19.6 kg CO2 eq./kg Al, ecoinvent 3.8 database [11], ReCiPe 2016 [12]). Currently, WPBs are treated as municipal waste either by disposal in landfills or in incinerators [10]. The major disadvantage of incineration is the rapid oxidation of aluminium, hence preventing its circulation due to where the aluminium compound may end up or in which form. Additionally, formation of hazardous gases such as hydrogen chloride gas and dioxins containing chlorine may exist during PVC or PVDC incineration [13].
Alternative strategies have been investigated for the separation of aluminium from pharmaceutical blister packages including various mechanical [14,15,16] and chemical routes [17,18,19]. Recent mechanical studies have suggested that cryo-comminution followed by electrostatic separation could recover ca. 80% of aluminium in the conducting fraction, with some impurity plastic also present [14,15]. Moreover, electrodynamic fragmentation has been investigated in aluminium separation with up to 88% recovery and 99.4% purity [16]. In the delamination studies, the aim is to separate metallic aluminium from plastic by having a chemical impact on bonding between these fractions. Yousef et al. [19] employed N,N-dimethyl-cyclohexylamine (DMCHA) as a switchable hydrophilicity solvent in conjunction with ultrasonic treatment to destroy the adhesive bonding, whereas Nieminen et al. [20] presented the use of deep eutectic solvents (DES) consisting of lactic acid and choline chloride (with a molar ratio of 1:9) and pure lactic acid. Regardless of success in separation, the first study suffered from the use of a flammable, toxic and hazardous chemical (DMCHA) [21] and the latter from the oxidation of the aluminium surface. In the latest study by Shukla et al. [10], aluminium delamination was performed in iso-propanol and acetone (50 vol.%) with full separation [10]. However, in this study, flammable chemicals were used yet resulted in 100% separation of aluminium from waste pharmaceutical blister packages [10]. In the aluminium leaching studies, both sodium hydroxide and hydrochloric acid have shown high aluminium extractions, i.e., up to 100% [17,18]. However, both lixiviants have a higher carbon footprint (1.29 kg CO2 eq./kg NaOH and 0.58 kg CO2 eq./kg HCl) when compared to that of the most typical lixiviant in hydrometallurgical processing, i.e., sulphuric acid (0.08 kg CO2 eq./kg H2SO4, ecoinvent 3.8 database [11], ReCiPe 2016 [12]), motivating further studies on its use.
Leaching of aluminium from different kinds of waste fractions such as aluminium dross, salt cake and salt slag is reported in a wide range of literature [22,23,24]. The standard reduction potential (E0) of aluminium is −1.66 V vs. SHE, describing that it has high thermodynamical affinity to donate electrons and oxidize, i.e., dissolve in the presence of a high variety of redox couples. For instance, in acidic media, a proton (H+) can thermodynamically oxidize aluminium, forming hydrogen gas. Moreover, in the presence of hydrogen peroxide, it may oxidize whilst hydrogen peroxide reduces to water. Some studies have reported these reactions in acidic media as well [25,26]. However, aluminium may react with oxygen, forming a thin layer of aluminium oxide that acts as an electric insulator, passivating the dissolving aluminium surface [27]. Similarly, metallic aluminium can also react with water to form a similar aluminium oxide layer [22]. It has also been reported that in the presence of H2O2, metallic aluminium may go through reactions creating a thin passivating layer that protects the further corrosion of metallic aluminium [24].
Opposite to metallic Al, dissolution of Al2O3 is a challenge, as the passivating layer acts as a protective barrier and may stop further leaching. This phenomenon is known to make aluminium structures durable in construction and resistant to corrosion [25]. However, as claimed by Amer et al. [23], diluted H2SO4 (5–12.5 wt.%) may allow the dissolution of the aluminium oxide layer, and it has also been evidenced in several applications—such as waste Li-battery leaching—that metallic aluminium will be dissolved into the acidic and basic solution in the presence of H2O2 [26,28,29]. According to Lewis [28], the interaction between aluminium and H2O2 is a two-step process including both chemical and electrochemical steps. The metallic aluminium can react electrochemically with H2O2, forming a passivating aluminium oxide layer. The following chemical reaction leads to the dissolution of aluminium oxide into the acidic media [30]. Dissolved aluminium exists in the solution as hydrated ionic compounds (aluminium sulphate, commonly known as alum) that can be crystallized from the solution with the chemical formula of Al2(SO4)3. The aluminium sulphate has a solubility of 40.4 g/100 mL of water at 30 °C [31]. Aluminium sulphate occurs as different solid forms of hydrates, of which hexa-decahydrate and octa-decahydrate are the most common [32]. The potential applications of alum (fire retardant, fomite, adjuvant, antibacterial agent and coagulating agent in water treatment) may in future reinforce the strategy of aluminium recycling via sulphate media [33,34].
In this present work, the leaching behaviour of aluminium present in WPBs is studied in sulphuric acid media in the absence and presence of an oxidant, H2O2. This was performed to find strategies for aluminium valorisation, in this case via the production of aluminium-rich pregnant leach solution (PLS), which after further processing is hypothesised to be suitable for the production of Al2(SO4)3 either by crystallization or precipitation.

2. Materials and Methods

2.1. Materials

The following chemicals were used in this investigation: sodium hydroxide (1.0 M NaOH, standardized, Alfa Aesar, Germany), methyl orange (Schering AG, Germany), sulphuric acid (H2SO4, 95–97%) and hydrogen peroxide (H2O2, 50 vol.%), both from VWR Chemicals, Belgium. Hydrogen peroxide was determined using titration in sulphuric acid media with standardized KMnO4 (0.05 M, Merck, Titripur, India). The WPBs used in this study were collected from a machine dose dispenser of the pharmaceutical company (Pharmac Finland Oy, Finland). The investigated raw material—aluminium—was recovered from WPBs by employing delamination method developed by Shukla et al. [10].

2.2. Methods

The WPBs were firstly delaminated by employing the method developed by Shukla et al. [10]. WPBs before delamination and their comprising layers of plastic and aluminium film after delamination are shown in Figure 1a–c, respectively. Table 1 provides the average elemental composition of the aluminium layer (wt.%) after the delamination based on the data provided by Shukla et al. [10]. The aluminium film shown in Figure 1c was used as raw material in leaching experiments without any further processing. The calculation basis for aluminium extraction was made by assuming that the aluminium film shown in Figure 1c consists of pure aluminium.

2.2.1. Leaching Experiments

Leaching studies were conducted in sulphuric acid solution in a controlled environment. A set of preliminary experiments (PE 1–4, Table 2) was conducted to ascertain the effect of H2SO4 concentration on aluminium leaching (0.25–1.0 M). This set of experiments was conducted in 200 cm3 borosilicate glass beakers, with 100 cm3 of solution volume at targeted concentration (0.25–1.0 M) of sulphuric acid prepared by diluting the stock solution with deionized water (15 MΩ∙cm, Merck Elix Essential, France). The beakers were heated to target temperature by using multiple position hot plate magnetic stirrers (IKA RT10, Germany). Temperature and leaching time were kept constant with continuous stirring at 80 °C and 24 h, respectively, for all the preliminary experiments. The beakers were sealed using Parafilm® (Bemis Company Inc., Sheboygan Falls, WI, USA). Moreover, raw material amount, i.e., S:L ratio, was 0.4 g/100 mL (i.e., 4 g/L). After each preliminary experiment, sampling was carried out by retrieving ca. 3–4 cm3 of solution from the beaker for each experiment at the end of the leaching time, i.e., 24 h. The samples were syringe-filtered with 0.45 µm polyethylene sulfone (PES) membranes (VWR, Atlanta, GA, USA) and analysed by inductively coupled plasma–optical emission spectrometry (ICP-OES, 5900 SVDV, Agilent, Santa Clara, CA, USA).
The main leaching experiment series (T1–T3, Table 2) was performed in a 500 cm3 jacketed glass reactor (Lasilaite, Helsinki, Finland), with 400 cm3 of 0.25 M sulphuric acid prepared by diluting with deionized water (15 MΩ∙cm, Merck Elix Essential, France). Sodium hydroxide (0.1 M NaOH solution) was used to ascertain lixiviant concentration before and after the experiment. Methyl orange was used as an indicator. The aluminium sample amount used was 1.8 g in all experiments, i.e., solid/liquid ratio was 4.5 g/L, corresponding to stoichiometric H+/Al ratio of 3:1. The experiments were conducted with and without the addition of H2O2 (1.25–2.5 vol.%). A condenser was attached to the reactor, and the reactor was sealed with glass stoppers, silicon O-ring and steel clamp. The reactor was heated to target temperature (40–80 °C) by the attached water bath with circulating pump and thermostat (Lauda A100, Germany). Agitation was employed by an overhead stirrer (VOS 16, VWR, Atlanta, GA, USA, equipped with a four-blade 5 cm diameter PTFE (polytetrafluoroethylene) agitator with 45° blade angle) to ensure that all the reactants were in suspension. Additionally, a redox electrode (Ag/AgCl 3 M KCl, InLab, Mettler Toledo, Columbus, OH, USA) attached to a multi-meter (Fluke 77 IV, Everett, WA, USA) was used to monitor the redox potential tests in A3 #, A6 # and A9 # whilst sampling. These experiments were repeated for titration, pH and redox measurements. The redox potential readings measured with Ag/AgCl were converted into standard hydrogen electrode (SHE) scale.
After the end of each experiment, the final remaining pregnant leach solution was filtered with Whatman grade 50 filter papers (UK) with a vacuum filtration assembly. The filtrate was allowed to cool down, after which its volume was measured to ascertain the final volume with graduated cylinder.
The aluminium leaching series consisted of 3 experimental sets (T1–T3). Experimental set T1 consisted of 9 experiments (A1–A9), experimental set T2 consisted of 3 experiments (A10–A12), experimental set T3 consisted of 3 experiments (A13–A20) and experimental set T4 consisted of 8 experiments (A21–A28) (Table 2). Experiments A10–A12 were the three replicates of the centre point to ascertain the leaching behaviour. Sampling for T1 was carried out by retrieving ca. 3–4 cm3 of solution from the reactor for each sample. Sampling intervals were 0.5, 1, 1.5, 2, 3, 4, 5, 22.5 and 24 h for experiments A1–A12. Experiments A13–A28 were conducted to investigate and ascertain the effect of leaching parameters at a shortened leaching time of 5 h. Only one sample was retrieved for T3 and T4 experiments at the end, i.e., after 5 h.
Moreover, to ensure that H2O2 is not completely decomposed for the optimum condition, viz., H2SO4 = 0.25 M, T = 80 °C, H2O2 = 1.25 vol.%, a separate experiment with t = 5 h was conducted where no aluminium was added to the system. The redox potential was measured at 1, 5, 10, 15, 20, 30, 60, 90, 120, 180, 240 and 300 min after the addition of H2O2 in the system. A 5 mL sample was taken at 5 h with titration of H2O2, which was carried out immediately to minimize the decomposition of H2O2, with titration repeated three times.

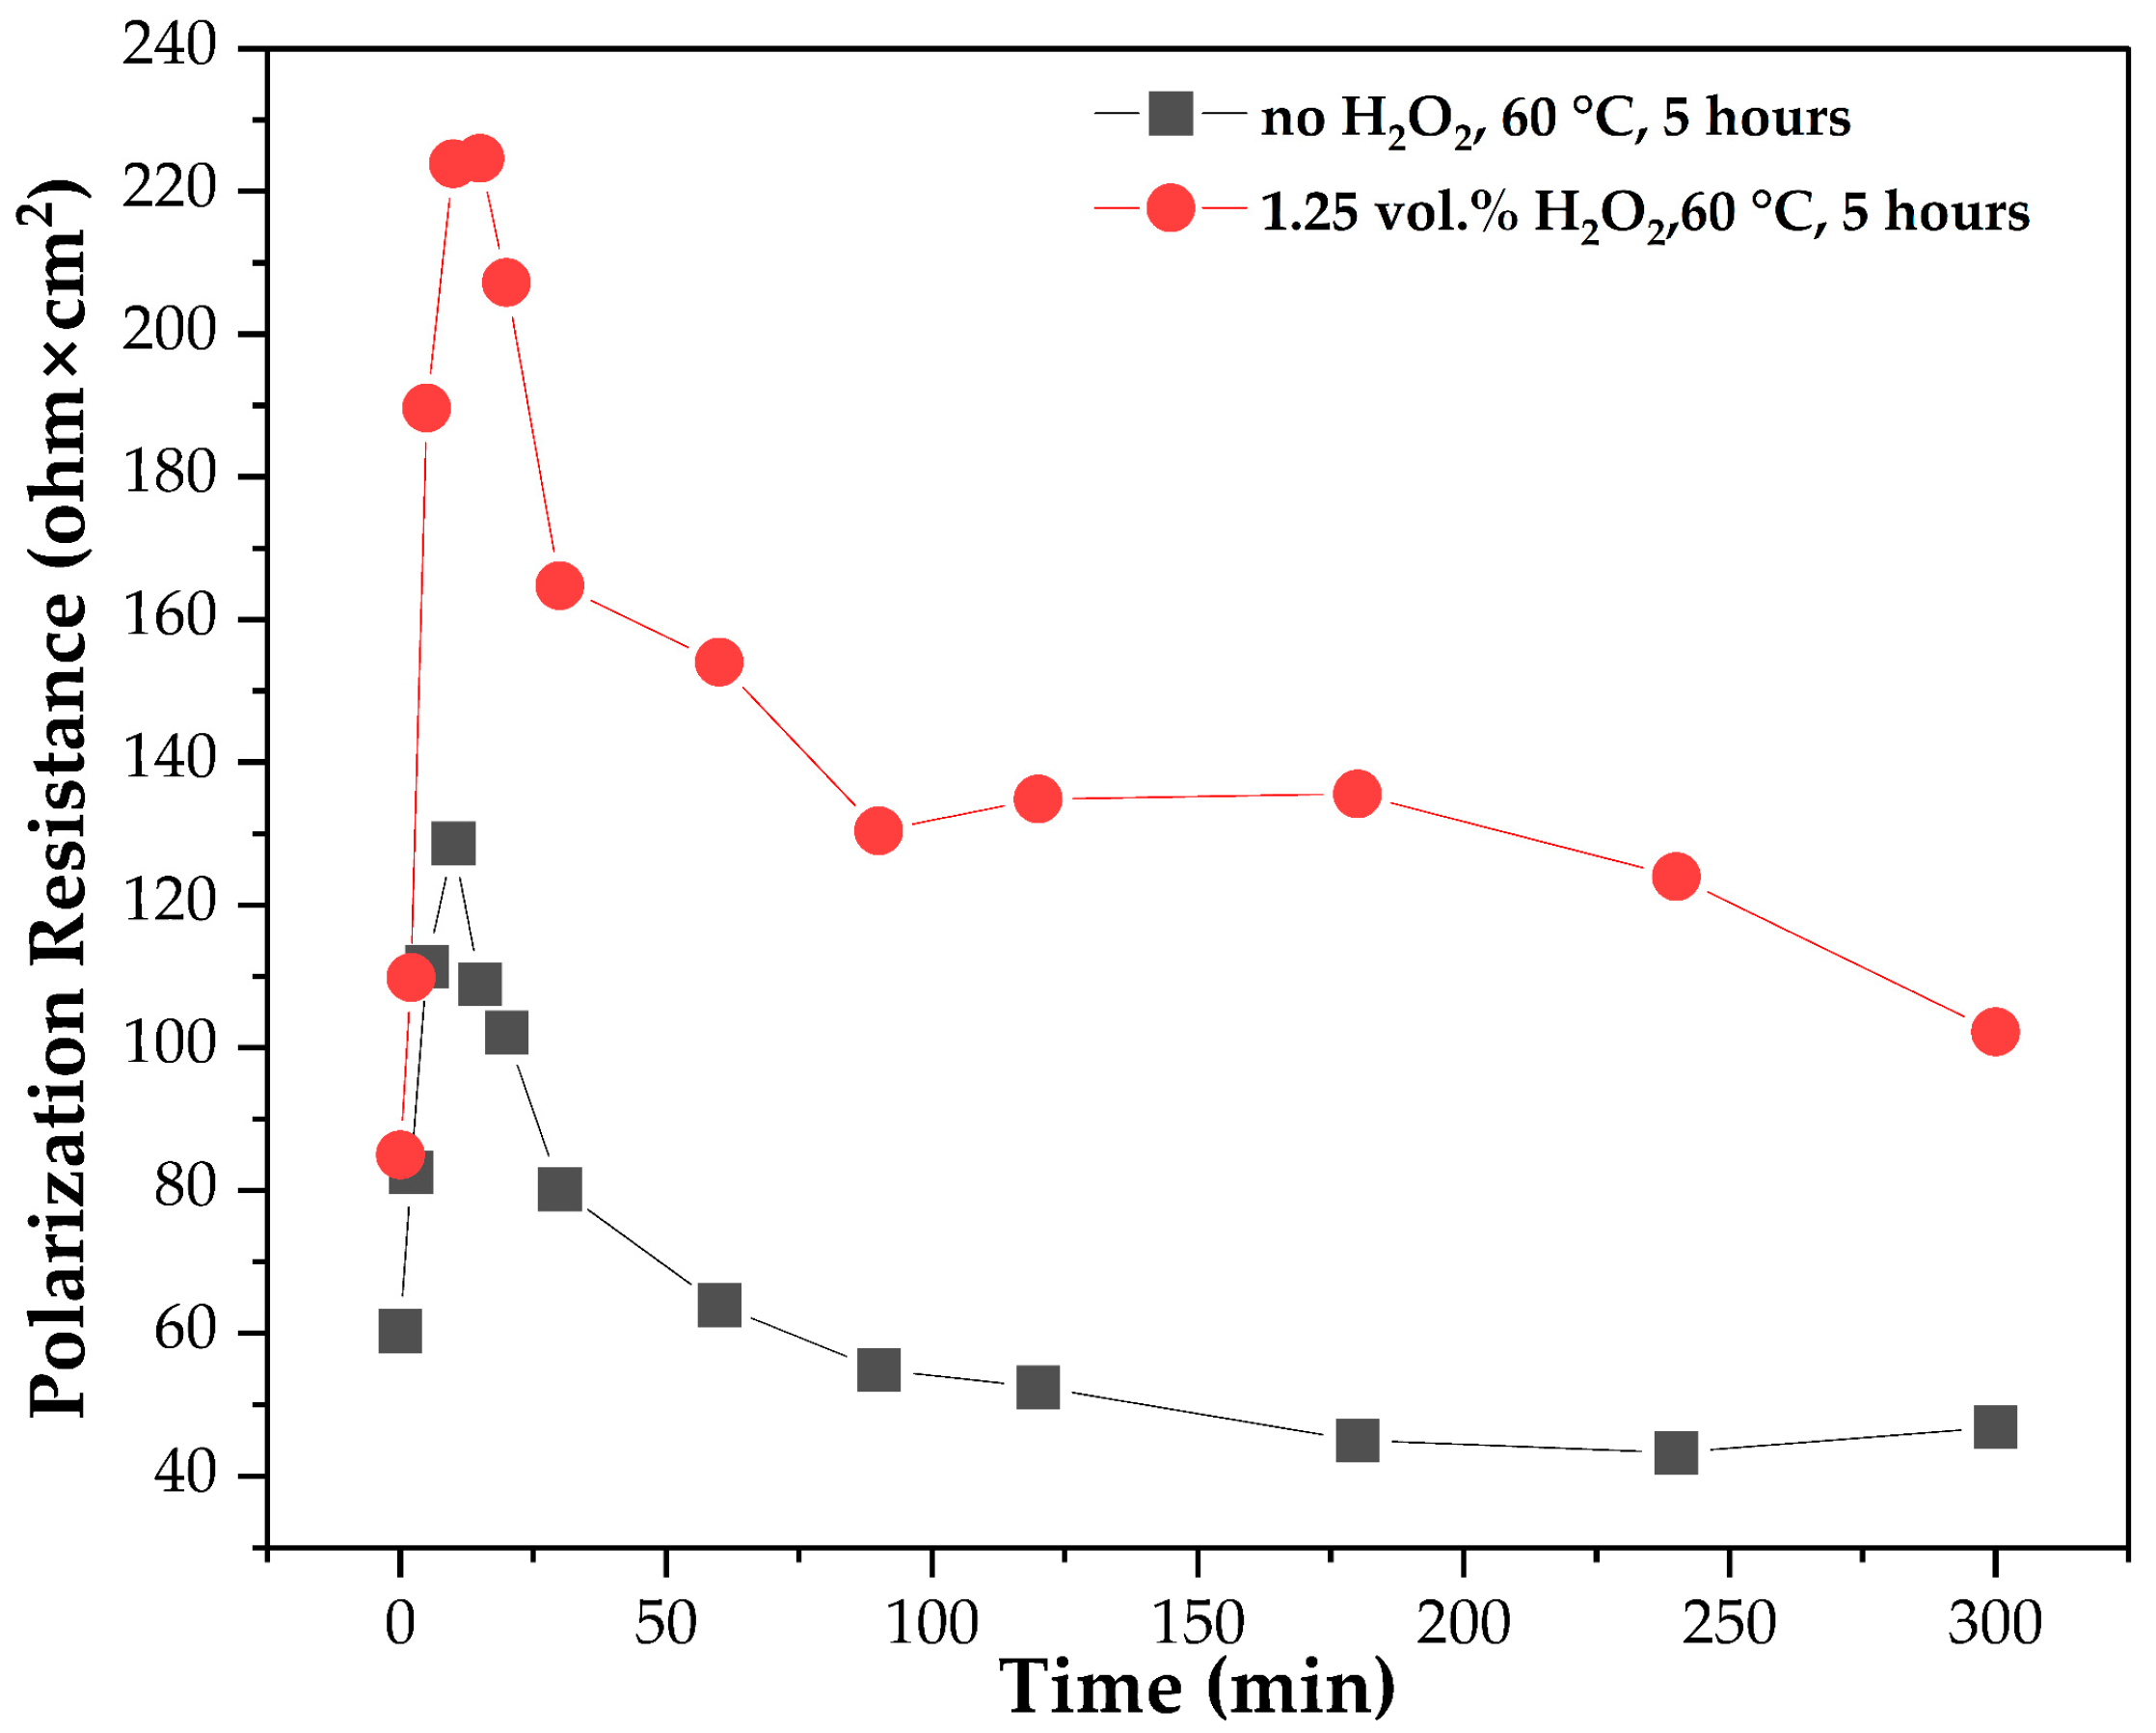
2.2.2. Electrochemical Experiments

Polarization resistance measurements were performed in a water-jacketed three-electrode cell with a volume of 200 mL, heated by water bath (Haake DC10). The working electrode was aluminium strip (1.0 cm × 1.0 cm) covered in a polytetrafluoroethylene (PTFE) sheath (RS Pro), counter electrode platinum plate (2.8 cm × 2.5 cm) and reference electrode SCE, viz., saturated calomel electrode (SI Analytics), with a potential of 241 mV vs. SHE. The solution was 0.25 M H2SO4, and solution volume used was 100 mL. The temperature was kept constant at 60 °C with continuous stirring, and the duration of the polarization resistance experiment was 5 h. The scan rate was set at 0.5 mV/s, and current range was 1 mA. Two experiments were performed, one without H2O2 dosage and one with 1.25 vol.% H2O2 dosage. The polarization resistance measurements were performed at 0, 2, 5, 10, 15, 20, 30, 60, 90, 120, 180, 240 and 300 min. Both electrochemical measurements were performed and monitored using a 24-bit potentiostat (Ivium CompactStat, Ivium Technologies, The Netherlands).

3. Results

3.1. Effect of Leaching Parameters (Acidity, Temperature, Time, Use of H2O2 and S:L Ratio) on Aluminium Extraction

In the preliminary experiments, the effect of acid concentration on aluminium extraction was examined at 80 °C for 24 h. The results showed that after 24 h, >90% of aluminium was leached in all experiments (Supplementary Material, Figure S1). Therefore, for the experimental work, low acidity (0.25 M) was selected, and a further experimental series (T1–T3) was conducted at 0.25 M acid concentration, i.e., with a molar ratio of 3:1 between H+ and Al.
In leaching series T1–T3, the effects of temperature and hydrogen peroxide dosage were examined (Figure 2). The leaching results suggest that the leaching behaviour could be classified into three groups. The aluminium extraction for all the experiments is shown in Supplementary Material, Table S1. Firstly, experiments A6 and A9 showed full (~100%) aluminium extraction with the highest extraction after 5 h. The leaching curve was logarithmic in nature. After 5 h, the leaching curve was shown to plateau. These experiments were characterized by high temperature, i.e., 80 °C, as well as the presence of H2O2 in A6 and A9, viz., 1.25 vol.% and 2.5 vol.%, respectively. Secondly, experiments A3, A5 and A8 showed full (~100%) aluminium extraction with slower kinetics, reaching the maximum aluminium extraction at 24 h. The leaching curve was of logarithmic nature with a linear increase in extraction initially; although, the leaching curve shows a decrease in rate with time. This was also observed for experiments A6 and A9. These experiments were characterized by high and moderate temperatures, i.e., 80 °C for A3 and 60 °C for A5 and A8, as well as the presence of H2O2 in A5 and A8, viz., 1.25 vol.% and 2.5 vol.%, respectively. No H2O2 was added in experiment A3. Thirdly, in the experiments A1, A2, A4 and A7, no full aluminium extraction was achieved, but the leaching behaviour was quite linear and was still in progress after 24 h of leaching. These experiments were characterized by moderate and low temperature, i.e., 60 °C for A2 and 40 °C for A1, A4 and A7, as well as the presence of H2O2 in A4 and A7, viz., 1.25 vol.% and 2.5 vol.%, respectively. No H2O2 was added for experiments A1 and A2.
When total aluminium was extracted, the filtration residue after the leaching was comprised of ink, some microplastic and/or residuals from adhesive (Supplementary Material, Figure S2). In some leaching experiments, total extraction was not observed, and the remaining residue was comprised of aluminium, ink, some microplastic and/or residuals from adhesive.
Moreover, the replicate of the centre point (experiments A10–A12, Figure 3) were also studied. These experiments were characterized by moderate temperature as well as moderate H2O2 dosage, i.e., 60 °C and 1.25 vol.%, respectively. All three centre point replicates followed a similar leaching rate in comparison with experiment A5 of set T1. The slopes of the initial 5 h linear part (Figure 3) are tabulated for centre point measurement in experiments A5 and its replicates A10–A12 in Table 3. Since the coefficient of variation is lower than one (i.e., CV < 1), which implies that distribution is well spread out around the mean, this confirms the replicability of the experiments along with providing similar extraction of aluminium.
The long-term experiments (Figure 2) suggested that temperature has a substantial effect on the aluminium leaching behaviour. Therefore, the effect of temperature on the leaching of aluminium was studied in more detailed (experiments A1 *–A6 * vs. A13–A16) at a shorter leaching time of 5 h (Figure 4a). The aluminium extraction was shown to be relatively low at 40 °C both without H2O2 (~7.5%) and with the use of H2O2 (~15%). However, the increase in temperature clearly enhanced aluminium leaching. In the absence of strong oxidant (H2O2), the aluminium extraction was ~23% at 60 °C and increased to ~72% at 80 °C (A2 * vs. A3 *). In the case of adding 1.25 vol.% of H2O2, the aluminium extraction was ~60% at 60 °C and increased up to 100% at 80 °C (A5 * vs. A6 *). In both cases with and without the dosage of H2O2, the extraction of aluminium increased significantly with increase in temperature. The use of 1.25 vol.% H2O2 as the oxidant increased aluminium extraction at all temperatures (Figure 4a).
The effect of H2O2 dosage on aluminium leaching was also studied further in detail (experiments A1 *, A2 *, A4 *, A5 *, A7 *, A8 * and shorter 5 h experiments A17–A20) (Figure 4b). The aluminium extraction as a function of H2O2 dosage was shown to be increased up to 1.25 vol.% H2O2 dosage at both studied temperatures of 40 and 60 °C. However, no increase in aluminium extraction was observed with further increase in H2O2 dosage. Moreover, the results suggest that the impact of the oxidant (H2O2) was substantially higher at 60 °C with an increase of ~35% units (A18 vs. A17), whereas at 40 °C, aluminium extraction increased only by ~7% units. Barik et al. [35] and Lisinska et al. [36] reflect similar findings that an increase in oxidants concentration (HNO3 and H2O2, respectively) increases the extraction of aluminium.
The effect of time on the aluminium leaching (experiments A3 *, A6 * and A9 *, shorter 5 h experiments) is presented in Figure 4c. With all studied H2O2 concentrations, the extraction of aluminium increased with the reaction time at T = 80 ° C. After 5 h, aluminium extraction is ~72% when no H2O2 is added, whilst it is 100% with both 1.25 and 2.5 vol.% H2O2 additions. In the presence of H2O2, the aluminium extraction rate is high in the initial hours; however, it decreases after 3 h.
The effect of the S:L ratio on the aluminium leaching was studied further in detail and (experiments A5 *, A6 * and A21–A28, shorter 5 h experiments) is presented in Figure 4d. The aluminium extraction as a function of the S:L ratio was shown to be increased up to 4.5 g/L at both studied temperatures of 60 and 80 °C.
The pH of leaching media at the start of the experiments was 0.58, whilst after the 24 h leaching experiment the pH values of A3, A6 and A9 end solutions were 0.80, 1.23 and 1.27, respectively (Table 4). This confirms further that the H+ ions were not fully consumed during the reactions and the pH remained in the solubility area of Al3+ ions and did not allow dissolved aluminium to hydrolyse [37].
The results in Figure 2 and Figure 4c suggest that, in all the studied leaching conditions, the dissolution of aluminium does progress as a function of time, i.e., the passivating Al2O3 layer could not hinder aluminium dissolution recovered from WPBs in the studied environment.
The redox potential was followed in more detail in experiments A3 #, A6 # and A9 # in Figure 5 and showed a decreasing trend as a function of time. In all the experiments, the initial redox potential was between 795 mV and 827 mV. For A3 #, the potential drops rapidly from 827 mV to 77 mV after 30 min of leaching, and the final value after 5 h of leaching is 27 mV.
Although, the redox electrode was initially checked with the redox standard solution, and the measurements were on point. Hence, such high initial redox potential can be speculated due to the dissolved oxygen within the system. The rapid decrease in redox potential reflects the dissolution of Al3+ into the solution, bringing a redox couple, viz., H+/H2, with low potential into the solution. This could be due to the consumption of H+ ions and the generation of H2 gas. However, for experiments A6 # and A9 #, the redox potential shows only a minor decrease during the 5 h of leaching to 697 mV and 723 mV, respectively. This shows that the addition of H2O2 can retain the strong oxidative nature of the solution regardless of the presence of dissolved Al3+ species. However, the different dosage amounts of H2O2 (1.25 and 2.5 vol.%, A6 # and A9 #, respectively) show no significant change in the redox potential and thus no substantial effect in the oxidative power of the solution.

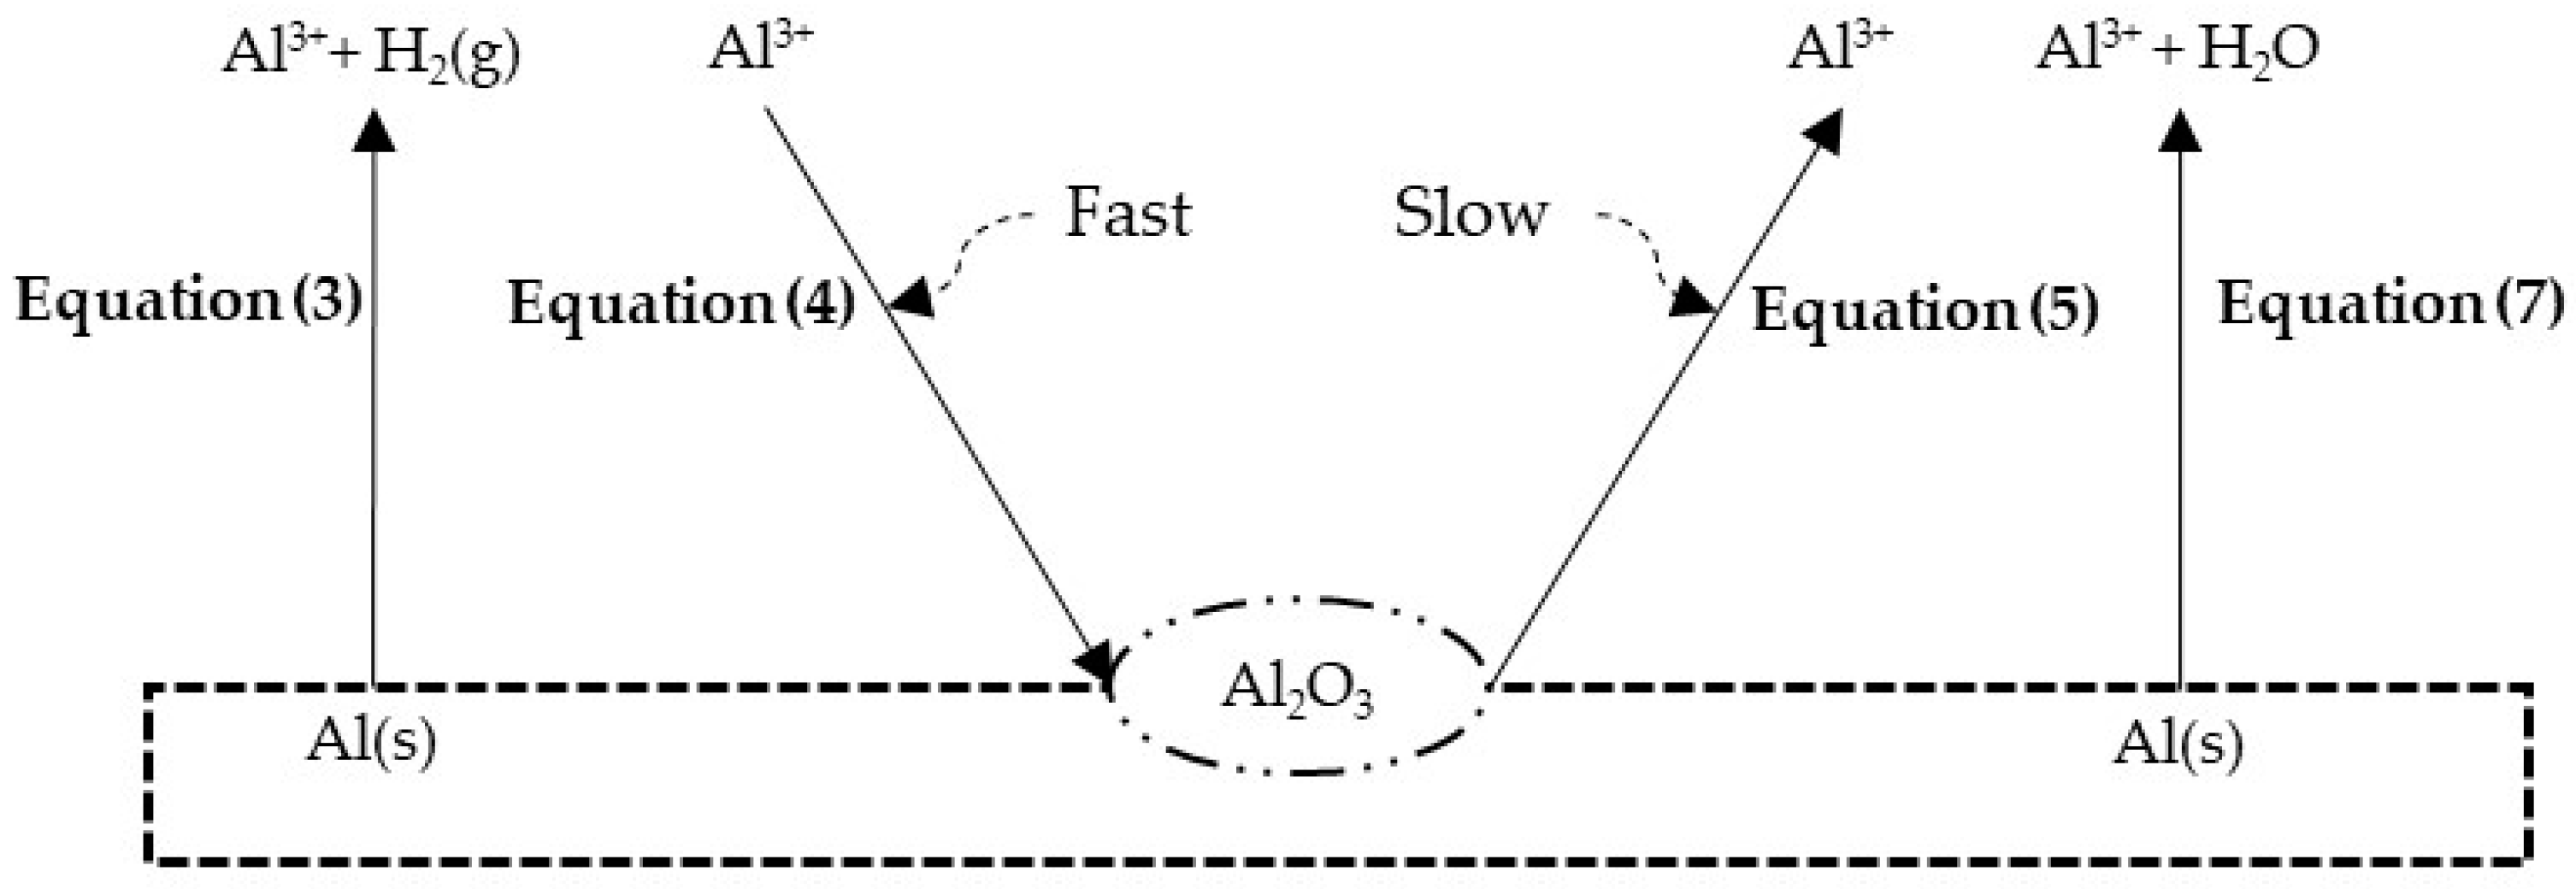
3.2. Leaching Mechanism

The steps that are suggested to be involved in the dissolution of aluminium in sulphuric acid media (both in the absence and presence of hydrogen peroxide) in the current study are depicted in Figure 6. When just the sulphuric acid is used, the reactions that occur are the net reaction of the half reactions of Equations (1) and (2), resulting in hydrogen gas formation, which is Equation (3).
Both chemical reactions, i.e., Equations (4) and (5), are thermodynamically likely to occur, with E°cell way above zero. During acid leaching of aluminium, the sudden decrease in the redox potential (Figure 5) also supports the consumption of H+ ions and the reaction forming hydrogen gas with reductive nature. Additionally, the pH of the pregnant leach solution (Table 4) indicates the consumption of H+ ions during leaching, observed by the increase in the measured pH value—supporting either the reaction of Equation (3) or (7). The addition of hydrogen peroxide shows higher aluminium dissolution (Figure 4), suggesting a higher rate in the reaction of Equation (7).
  Anodic : Al ( s ) Al 3 + + 3 e E anode = 1.662 V
Cathodic : 2 H + + 2 e H 2 ( g ) E cathode = 0 V
Overall : 2 Al ( s ) + 6 H + 2 Al 3 + + 3 H 2 ( g ) E cell = 1.662 V
Chemical : 2 Al 3 + + 3 H 2 O Al 2 O 3 + 6 H +
Chemical : Al 2 O 3 + 6 H + 2 Al 3 + + 3 H 2 O
Cathodic : H 2 O 2 + 2 H + + 2 e 2 H 2 O E cathode = 1.78 V )
Overall : 2 Al ( s ) + 3 H 2 O 2 + 6 H + 2 Al 3 + + 6 H 2 O E cell = 2.442 V
In the electrochemical tests, a spiked increase in polarization resistance was visible in the initial 10–15 min (Figure 7). This indicates that during Al leaching there simultaneously occurs formation of the passivation layer, suggesting a reaction between Al3+ and H2O on the material surface (Equation (4)). This reaction step is suggested to have high kinetics, indicated in Figure 7. However, the gradual decrease in the polarization resistance to a constant value further suggests that the formation of Al2O3 is followed by the consequent chemical dissolution of aluminium oxide in the presence of H+ ions as the reaction stated in Equation (5), however with relatively slow kinetics. Additionally, the redox potential measurement for the H2O2 decomposition was studied under the optimum condition and is shown in Supplementary Material, Figure S3. The gradual and continuous decrease in the redox potential suggests that the H2O2 is not completely decomposed in the timespan of 5 h. Moreover, the titration of the end sample also suggests that around 88% of the initial added H2O2 is not decomposed and is still present in the system.

3.3. Leaching Kinetics

The heterogeneous reaction models can be used to express the rate of reaction between a solid and a fluid. The possible ways to regulate the reaction rate are (a) the film diffusion control model, (b) the product layer diffusion control model and (c) the chemical reaction control model [38]. As per Levenspiel [38], for spherical particles, the film diffusion control model can be expressed by Equation (8), the product layer diffusion control model by Equation (9) and the chemical reaction control model by Equation (10). These models were implemented to study the aluminium leaching kinetics in mild sulphuric acid media:
k1t = x (film diffusion control model)
k2t = 1 − 3(1 − x)2/3 + 2(1 − x) (product layer diffusion control model)
k3t = 1 − (1 − x)1/3 (chemical reaction control model)
where k1, k2 and k3 are the reaction rate constants (min−1), t is the dissolution time (min) and x is the conversion or extraction.
Firstly, the centre point experiment (A5) and the three replicate experiments (A10–A12) were fitted to all the control models, resulting in the film diffusion control model being the best fit with a coefficient of determination (r2) greater than 0.99, followed by the reaction control model with r2 generally being in the range 0.98–0.99, which is presented in Figure 8. However, the product layer diffusion control model was the least fit with r2 lower than 0.88. Moreover, when all the experiments in series T1 (leaching experiments) and T2 (centre point replicates) were fitted to all three control models and Equations (8)–(10) for t = 5 h (Supplementary Material, Figures S4–S6), the experiments followed the chemical reaction control model with r2 being in the range of 0.98–0.99. Most of the experiments followed the film diffusion control model with r2 greater than 0.99, except for experiments A6 and A9 with r2 being 0.96 and 0.97, respectively. Moreover, all the experiments (A1–A12) did not follow the product layer diffusion control model with r2 being in the range 0.85–0.97. Thus, it can be suggested that the studied aluminium leaching can be described either by the film diffusion control model or chemical reaction control model.
The temperature dependence of the chemical reaction can be given by the Arrhenius equation (Equation (11)), as follows:
ln(kc) = ln(A) − Ea/RT
where kc is the rate constant, A is the frequency factor, Ea is the activation energy (J/mol), R is the gas universal constant (J/(K∙mol)) and T is the absolute temperature (K).
According to Equation (11), the plot of ln(kc) versus 1/T should be a straight line with a slope of −Ea/R when the experimental data follow the Arrhenius equation. Using the reaction rate constant (kc), the film diffusion control model and chemical reaction control model were fitted and plotted as shown in Figure 9.
The film diffusion control model followed the Arrhenius plot with r2 being in the range of 0.97–0.99, as presented in Figure 9a, whilst the chemical reaction control model followed the Arrhenius plot with r2 being 0.99, as presented in Figure 9b. The activation energy of leaching aluminium in 0.25 M H2SO4 was calculated based on Figure 9b. When no H2O2 was added, the Ea was 57.38 kJ/mol, with 1.25 vol.% H2O2 dosage the Ea was 67.77 kJ/mol and with 2.5 vol.% H2O2 dosage the Ea was 68.71 kJ/mol. The activation energy of a film diffusion-controlled process is typically from 4 to 12 kJ/mol, while the activation energy for diffusion through the product layer in a solution is usually under 21 kJ/mol, whereas that for a chemically controlled reaction is typically 40–100 kJ/mol [39,40]. Hence, the value of activation energy suggests that the leaching of aluminium in sulphuric acid media both in the presence and the absence of H2O2 is controlled by the chemical reaction.

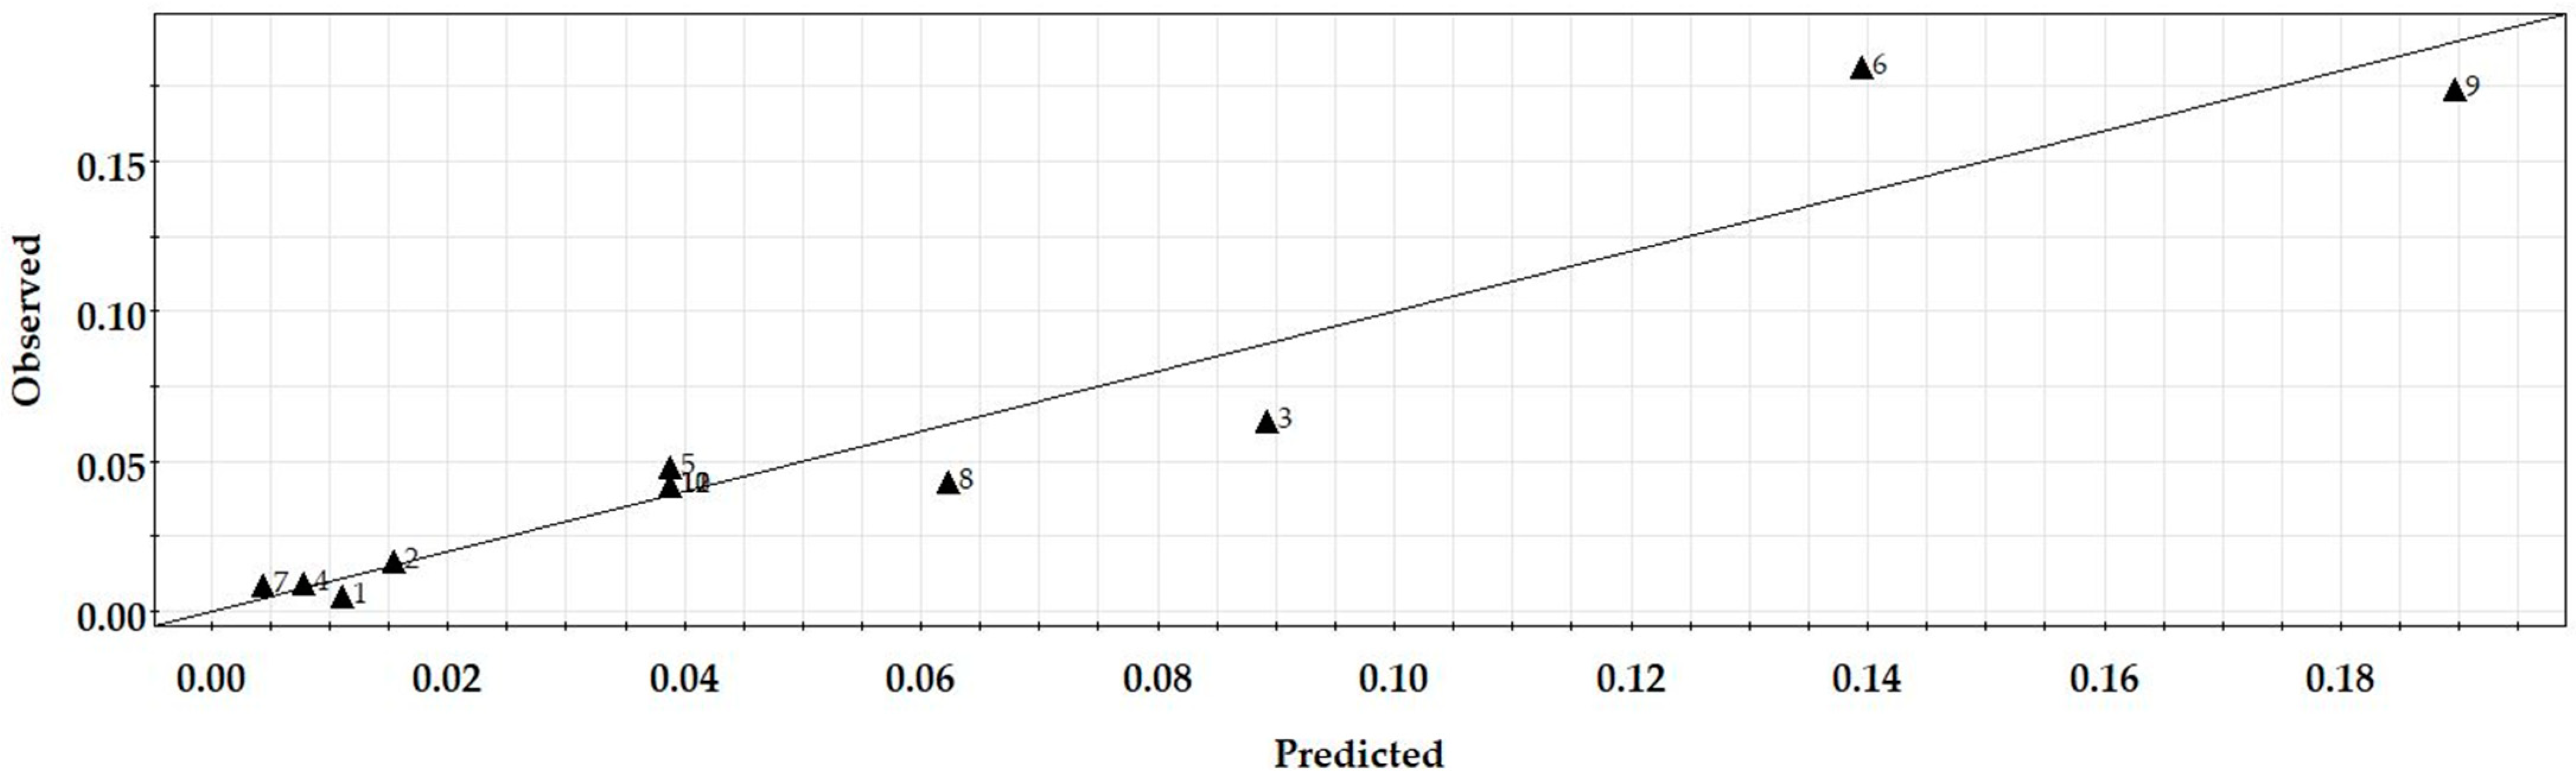
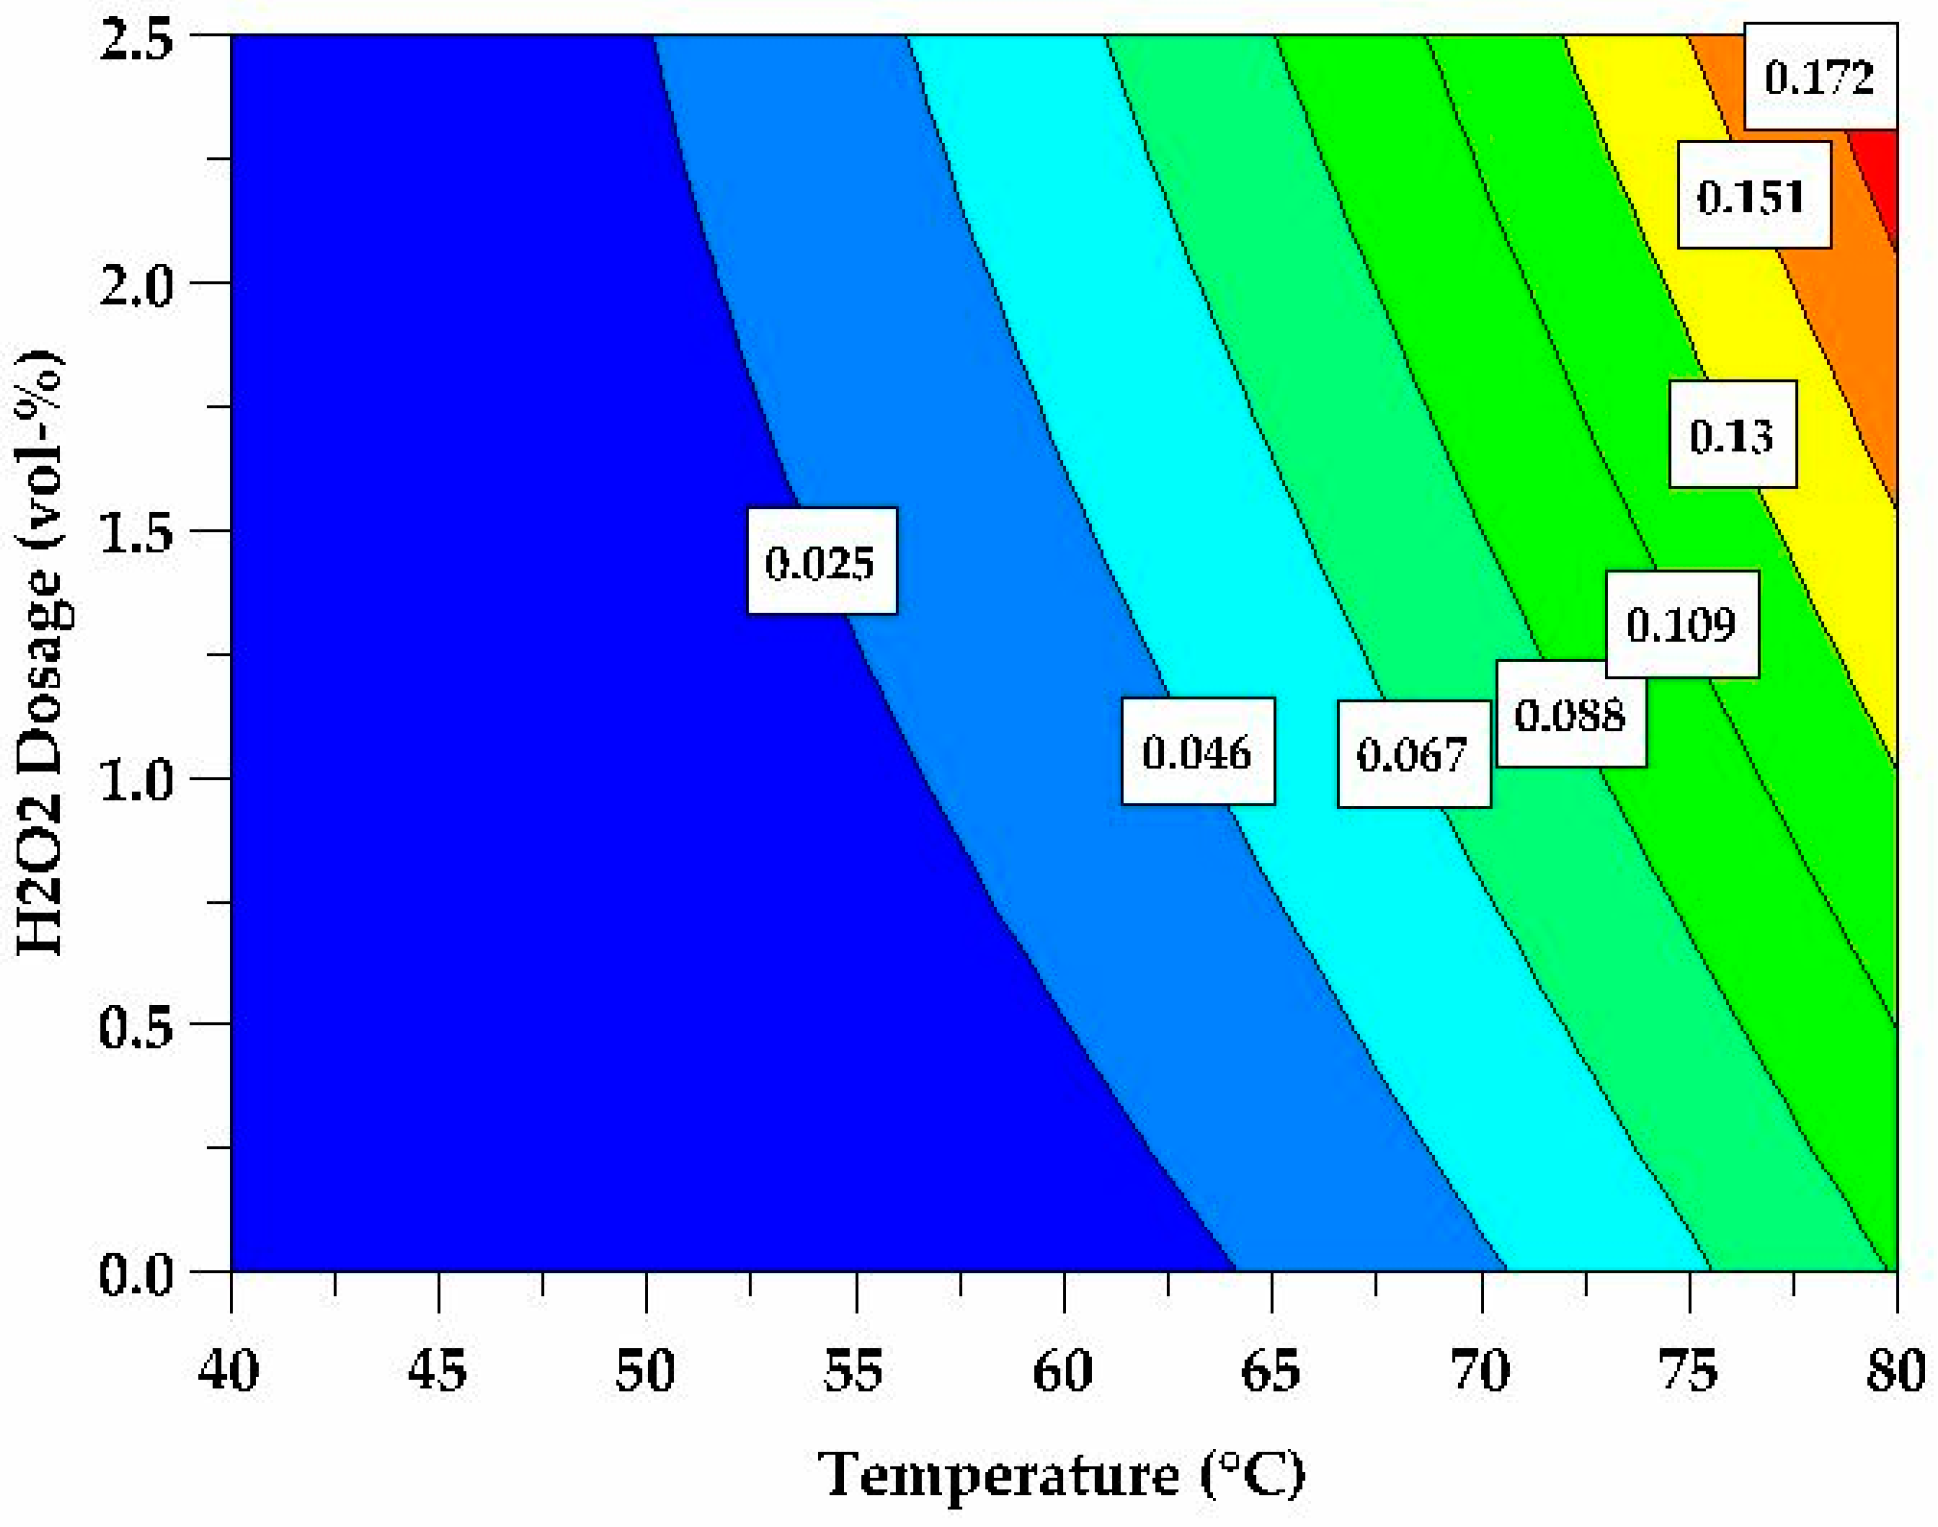
3.4. Regression Modelling

In order to statistically analyse aluminium extraction, experiments A1–A12 were analysed by response surface modelling at t = 5 h (Supplementary Material, Table S2). The selection of t = 5 h (Figure 2) was conducted as none of the leaching curves had reached a plateau, and the variance between different parameters was clearly visible in the extraction levels (7.5–100%). Moreover, the leaching kinetics data followed a linear plot for t = 5 h. The variables observed included the temperature and the amount of H2O2 dosage, whereas acid concentrations were confirmed to be sufficient at all conditions (Figure 2, Table 4).
Experimental data were fitted to a quadratic model [41] (Equation (12)), and the following regression coefficients were obtained:
k = β0 + β1[T] + β2[H2O2] + β12[T·H2O2] + β11[T·T] + β22[H2O2·H2O2] + ε
where k is the reaction rate as the response, [T] and [H2O2] refer to the coded factors, β is the unknown parameters that are estimated based on the experimental data and ε is a random error that describes the experimental error.
In the initial model, all terms were considered as follows: linear—[T] and [H2O2] as well as quadratic—[T·T] and [H2O2·H2O2] followed by the interaction term [T·H2O2]. Subsequently, the insignificant terms were removed at the confidence level of 0.95 with low probability (p-value above 0.05). The quadratic term [H2O2·H2O2] was found to be insignificant and only linear—[T] and [H2O2], quadratic—[T·T] and interaction term—[T·H2O2] were found to be significant (Figure 10). Additionally, observed vs. predicted plot (Figure 11) also shows linear regression scatter.
Over the experimental range investigated, temperature was shown to have a strong contribution to aluminium leaching, indicated by the large constant of [T] in the built linear regression model as uncoded Equation (13). This may be explained by the instability of the passivating aluminium oxide layer at higher temperatures [35,36]. Another explanation for a strong contribution of higher [T] could be based on the Arrhenius equation, suggesting high kinetics in aluminium leaching. Moreover, an increase in the concentration of [H2O2] showed increasing effect on dissolution. Table 5 shows that a response surface (Figure 12) was built based on Equation (13). The temperature [T] is in °C and H2O2 dosage is in vol.% in Equation (13). This response surface enabled the reaction rate to be predicted, with added oxidant H2O2 (vol.%) and temperature (°C) at t = 5 h.
kc = (8.71 × 10⁻⁵)∙[T·T] + (1.07 × 10⁻³)∙[T·H2O2] + 0.32∙[T] − 0.05∙[H2O2] − 1.57

4. Discussion

The results gained suggest that the leaching of aluminium is controlled by electrochemical or chemical reaction (57–69 kJ/mol) and not by the availability or diffusion of reacting species to the surface or through the reaction product layer formed. Moreover, the strong impact of temperature on dissolution (Figure 9, Equation (13)) supports this conclusion. Mohapatra et al. [42] and Mbedzi et al. [43] found similar dependency of the Al2O3 passivating layer while studying the effect of temperature, the Al2O3 passivating layer having an increased tendency for leaching with an increase in temperature [42,43]. Moreover, Barik et al. [35] and Lisinska et al. [36] showed that the leaching of aluminium increases with an increase in temperature [35,36]. Aluminium has a low E° value and is thus likely to donate electrons to both H+ as well as H2O2, supporting the leaching of metallic aluminium.
The analysis of the electrochemical studies suggests that the metallic aluminium passivates, with increasing polarization resistance values at short leaching times. Therefore, it is likely that not only electrochemical dissolution of Al to Al3+ happens but also some formation of an oxidized layer of Al2O3 with high kinetics. However, as a function of time, the polarization resistance decreases, indicating enhanced chemical dissolution of Al2O3 with time.
The experiments suggest that total aluminium extraction of the solution is strongly enhanced by the increase in temperature; however, the presence of H2O2 also supports aluminium extraction into the solution on its behalf. Therefore, it is suggested that the reaction rate limiting step is not the electrochemical dissolution of Al to Al3+ but rather the chemical dissolution of the oxidized layer Al2O3 to Al3+. The formation of a passivating layer on the surface increased with the presence of H2O2 at t = 5 h with higher polarization resistance values compared to the experiment without the addition of H2O2. This further suggests that the rate-controlling step is the chemical dissolution of aluminium oxide into the solution (Supplementary Material, Figure S6).
The results suggest that it is possible to leach aluminium recovered from WPBs by using a mild acidic solution (0.25 M H2SO4). The most favourable conditions for the total leaching (~100% aluminium extraction) were 1.25 vol.% of H2O2 for the oxidation of aluminium, at 80 °C temperature, resulting in complete aluminium dissolution at t = 5 h.
However, although H2SO4 has a low carbon footprint as lixiviant (0.08 kg CO2 eq./kg H2SO4), H2O2 has a high CO2 burden (1.13 kg CO2 eq./kg H2O2). This would favour minimization of the use of this oxidant. An alternative leaching strategy, i.e., longer leaching time t = 24 h, such as A3 (0.25 M H2SO4, 4.5 g/L), at high temperature (T = 80 °C) could be used to avoid the use of hydrogen peroxide. Moreover, the use of alternative oxidants (e.g., Fe3+ with air/oxygen purging) could provide the solution with a regenerable nature. However, it would also add impurities to the solution and cause challenges with following aluminium sulphate recovery.
Furthermore, pure aluminium in PLS can be retrieved as aluminium sulphate either by performing evaporative crystallization or by antisolvent crystallization. Aluminium sulphate solubility at 80 °C is 73.0 g/100 g of H2O, whereas at 40 °C it is only 46.1 g/100 g of H2O. This corresponds to Al3+ concentrations of 7.27 and 11.51 g/100 g of H2O, respectively. In the current experiments, the dissolved amount of aluminium in PLS was highest at 4.5 g/L, implying 0.45 g/100 g of H2O, suggesting that the solution was not close to its solubility limit. However, the stoichiometric limitations could not allow the use of a higher solid/liquid ratio in the leaching experiments. Alternatively, an additional evaporation unit and/or the use of antisolvent is needed prior to aluminium sulphate crystallization. An indicative block diagram for the potential hydrometallurgical recycling process for WPB recycling is presented in Figure 13.

5. Conclusions

A hydrometallurgical process was employed for studying the kinetics of aluminium dissolution using a 0.25 M sulphuric acid concentration in the absence and presence of H2O2. This process allows for the upcycling of the aluminium recovered from WBPs into a value-added product having reasonable economic potential. The effects of temperature, H2O2 dosage and reaction time were investigated. It was observed that dissolution of aluminium increases with an increase in the factors, i.e., temperature and time, implying that higher temperature lowers the activation energy and longer dissolution time increases the yield. Moreover, aluminium dissolution increases with the increase in H2O2 dosage up to 1.25 vol.%. The result from the process cements the hypothesis regarding aluminium dissolution in low-concentration sulphuric acid media. Under optimal conditions, viz., temperature 80 °C, H2O2 dosage 1.25 vol.% and time 5 h, the dissolution of aluminium is up to ~100%. The kinetic mechanism of dissolution was examined, and the process was controlled by the chemical reaction control model, and it is evident that the value of the activation energy of aluminium dissolution is 57–69 kJ/mol. The passivation layer development occurs concurrently with Al leaching. Hence, based on Figure 7, the formation of Al2O3 is followed by the chemical dissolution of aluminium oxide in the presence of H+ ions, with rather slow kinetics.

Supplementary Materials

The following supporting information can be downloaded at: https://www.mdpi.com/article/10.3390/met13061118/s1, Table S1: Leaching experiments and their respective aluminium extraction (%); Table S2: Central composite design and the response for the dissolution experiments; Figure S1: Aluminium extraction for preliminary experiments (experiments PE-1–PE-4) as a function of sulphuric acid concentration (0.25–1.0 M); Figure S2: Filtration residue after leaching experiment when total aluminium extraction was achieved; Figure S3: Redox potential (mV) versus time for leaching system of 1.25 vol.% H2O2 in 0.25 M H2SO4; Figure S4: Film diffusion control model fitted for all the leaching experiments (A1–A12) according to first t = 5 h (R2 = 0.98–0.99, excluding A6 and A9); Figure S5: Product layer diffusion control model fitted for all the leaching experiments (A1–A12) according to first t = 5 h (R2 = 0.85–0.97); Figure S6: Chemical reaction control model fitted for all the leaching experiments (A1–A12) according to first t = 5 h (R2 = 0.98–0.99).

Author Contributions

Conceptualization: S.S., A.C., P.H. and J.A.; methodology: S.S., A.C., P.H. and J.A.; software: S.S., A.C. and J.A.; validation: S.S., A.C. and J.A.; formal analysis: S.S.; writing—original draft preparation: S.S. and P.H.; writing—review and editing: S.S., A.C., P.H., J.A. and M.L.; visualization: S.S. and A.C.; supervision: M.L. All authors have read and agreed to the published version of the manuscript.

Funding

This research was funded by the Strategic Research Council at the Academy of Finland under the SUDDEN Project (Decision No. 320219).

Data Availability Statement

Data sharing not applicable.

Acknowledgments

The authors gratefully acknowledge Pharmac Finland Oy for providing the support and WPBs investigated in this study. This work also made use of Raw-MatTERS Finland Infrastructure (RAMI) funded by the Academy of Finland.

Conflicts of Interest

The authors declare no conflict of interest.

References

  1. Primary Aluminium Production—International Aluminium Institute. Available online: https://international-aluminium.org/statistics/primary-aluminium-production/ (accessed on 2 May 2023).
  2. OECD Global Forum on Environment Focusing on Sustainable Materials Management. Available online: http://www.oecd.org/environment/resourceproductivityandwaste/46194971.pdf (accessed on 2 May 2023).
  3. Circular Aluminium Action Plan: A Strategy for Achieving Aluminium’s Full Potential for Circular Economy by 2030. Available online: https://european-aluminium.eu/wp-content/uploads/2022/08/european-aluminium-circular-aluminium-action-plan.pdf (accessed on 2 May 2023).
  4. Sun, Y.; Huang, X.; Liu, C.; Zhou, M.; Zhang, X. Impurity Iron Separation from Molten Secondary Aluminum by Pulsed Electric Current. J. Alloys Compd. 2022, 934, 167903. [Google Scholar] [CrossRef]
  5. Habashi, F. Handbook of Aluminum: Volume 2: Alloy Production and Materials Manufacturing; Totten, G.E., MacKenzie, D.S., Eds.; CRC press: Boca Raton, FL, USA, 2003; Volume 2, pp. 38–40. ISBN 978-0824708962. [Google Scholar]
  6. Kondo, M.; Maeda, H.; Mizuguchi, M. The Production of High-Purity Aluminum in Japan. JOM 1990, 42, 36–37. [Google Scholar] [CrossRef]
  7. Padamata, S.K.; Yasinskiy, A.; Polyakov, P. A Review of Secondary Aluminum Production and Its Byproducts. JOM 2021, 73, 2603–2614. [Google Scholar] [CrossRef]
  8. de Oliveira, D.P.; Costa, J.S.R.; Oliveira-Nascimento, L. Sustainability of Blisters for Medicines in Tablet Form. Sustain. Chem. Pharm. 2021, 21, 1–7. [Google Scholar] [CrossRef]
  9. Dalal, S.P.; Dalal, P.; Motiani, R.; Solanki, V. Experimental Investigation on Recycling of Waste Pharmaceutical Blister Powder as Partial Replacement of Fine Aggregate in Concrete. Resour. Conserv. Recycl. Adv. 2022, 14, 200076. [Google Scholar] [CrossRef]
  10. Shukla, S.; Halli, P.; Khalid, M.K.; Lundström, M. Waste Pharmaceutical Blister Packages as a Source of Secondary Aluminum. JOM 2022, 74, 612–621. [Google Scholar] [CrossRef]
  11. Wernet, G.; Bauer, C.; Steubing, B.; Reinhard, J.; Moreno-Ruiz, E.; Weidema, B. The Ecoinvent Database Version 3 (Part I): Overview and Methodology. Int. J. Life Cycle Assess. 2016, 21, 1218–1230. [Google Scholar] [CrossRef]
  12. Huijbregts, M.A.J.; Steinmann, Z.J.N.; Elshout, P.M.F.; Stam, G.; Verones, F.; Vieira, M.; Zijp, M.; Hollander, A.; van Zelm, R. ReCiPe2016: A Harmonised Life Cycle Impact Assessment Method at Midpoint and Endpoint Level. Int. J. Life Cycle Assess. 2017, 22, 138–147. [Google Scholar] [CrossRef]
  13. Wang, C.Q.; Wang, H.; Liu, Y.N. Separation of Polyethylene Terephthalate from Municipal Waste Plastics by Froth Flotation for Recycling Industry. Waste Manag. 2015, 35, 42–47. [Google Scholar] [CrossRef]
  14. Gente, V.; la Marca, F.; Lucci, F.; Massacci, P. Electrical Separation of Plastics Coming from Special Waste. Waste Manag. 2003, 23, 951–958. [Google Scholar] [CrossRef]
  15. Gente, V.; la Marca, F.; Lucci, F.; Massacci, P.; Pani, E. Cryo-Comminution of Plastic Waste. Waste Manag. 2004, 24, 663–672. [Google Scholar] [CrossRef]
  16. Agarwal, V.; Halli, P.; Helin, S.; Tesfaye, F.; Lundström, M. Electrohydraulic Fragmentation of Aluminum and Polymer Fractions from Waste Pharmaceutical Blisters. ACS Sustain. Chem. Eng. 2020, 8, 4137–4145. [Google Scholar] [CrossRef]
  17. Wang, C.; Wang, H.; Liu, Y. Separation of Aluminum and Plastic by Metallurgy Method for Recycling Waste Pharmaceutical Blisters. J. Clean. Prod 2015, 102, 378–383. [Google Scholar] [CrossRef]
  18. Wang, C.-Q.; Wang, H.; Gu, G.-H.; Fu, J.-G.; Liu, Y.-N. Kinetics and Leaching Behaviors of Aluminum from Pharmaceutical Blisters in Sodium Hydroxide Solution. J. Cent. South Univ. 2015, 22, 4545–4550. [Google Scholar] [CrossRef]
  19. Yousef, S.; Mumladze, T.; Tatariants, M.; Kriūkienė, R.; Makarevicius, V.; Bendikiene, R.; Denafas, G. Cleaner and Profitable Industrial Technology for Full Recovery of Metallic and Non-Metallic Fraction of Waste Pharmaceutical Blisters Using Switchable Hydrophilicity Solvents. J. Clean. Prod. 2018, 197, 379–392. [Google Scholar] [CrossRef]
  20. Nieminen, J.; Anugwom, I.; Kallioinen, M.; Mänttäri, M. Green Solvents in Recovery of Aluminium and Plastic from Waste Pharmaceutical Blister Packaging. Waste Manag. 2020, 107, 20–27. [Google Scholar] [CrossRef] [PubMed]
  21. N,N-Dimethylcyclohexylamine|C8H17N—PubChem. Available online: https://pubchem.ncbi.nlm.nih.gov/compound/N_N-Dimethylcyclohexylamine (accessed on 2 May 2023).
  22. Tsakiridis, P.E. Aluminium Salt Slag Characterization and Utilization—A Review. J. Hazard. Mater. 2012, 217–218, 1–10. [Google Scholar] [CrossRef]
  23. Amer, A.M. Extracting Aluminum from Dross Tailings. JOM 2002, 54, 72–75. [Google Scholar] [CrossRef]
  24. Feng, C.; Liu, Y.; Sun, M.; Zhang, W.; Zhang, J.; Wang, S. Investigation of Aluminum Gate CMP in a Novel Alkaline Solution. J. Semicond. 2016, 37, 016002. [Google Scholar] [CrossRef]
  25. Sadawy, M.M. Effect of Al2O3 Additives on the Corrosion and Electrochemical Behavior of Steel Embedded in Ordinary Portland Cement Concrete. Am. J. Mater. Res. 2014, 1, 53–58. [Google Scholar]
  26. Dorella, G.; Mansur, M.B. A Study of the Separation of Cobalt from Spent Li-Ion Battery Residues. J. Power Sources 2007, 170, 210–215. [Google Scholar] [CrossRef]
  27. Klyuchnikova, N.; Lumar’, E. Use of Cermet Binder to Obtain Mullite-Corundum Material. Glass Ceram. 2015, 72, 18–20. [Google Scholar] [CrossRef]
  28. Ferreira, D.A.; Prados, L.M.Z.; Majuste, D.; Mansur, M.B. Hydrometallurgical Separation of Aluminium, Cobalt, Copper and Lithium from Spent Li-Ion Batteries. J. Power Sources 2009, 187, 238–246. [Google Scholar] [CrossRef]
  29. Chernyaev, A.; Zou, Y.; Wilson, B.P.; Lundström, M. The Interference of Copper, Iron and Aluminum with Hydrogen Peroxide and Its Effects on Reductive Leaching of LiNi1/3Mn1/3Co1/3O2. Sep. Purif. Technol. 2022, 281. [Google Scholar] [CrossRef]
  30. Lewis, T.J. The Corrosion of Aluminium in Concentrated Hydrogen Peroxide. J. Appl. Chem. 2007, 11, 405–413. [Google Scholar] [CrossRef]
  31. Perry, R.H.; Green, D.W.; Maloney, J.O. Perry’s Chemical Engineers’ Handbook; McGraw-Hill: San Francisco, CA, USA, 1984; p. 121. ISBN 0070498415. [Google Scholar]
  32. Shreve, R.N.; Austin, G.T. Shreve’s Chemical Process Industries, 5th ed.; Austin, G.T., Ed.; McGraw-Hill: Noida, India, 1984; p. 357. ISBN 9781259029455. [Google Scholar]
  33. Chow, C.W.K.; van Leeuwen, J.A.; Fabris, R.; Drikas, M. Optimised Coagulation Using Aluminium Sulfate for the Removal of Dissolved Organic Carbon. Desalination 2009, 245, 120–134. [Google Scholar] [CrossRef]
  34. Birnin-Yauri, A.U.; Aliyu, M. Synthesis and Analysis of Potassium Aluminium Sulphate (Alum) from Waste Aluminium Can. Int. J. Adv. Res. Chem. Sci. 2014, 1, 1–6. [Google Scholar]
  35. Barik, S.P.; Park, K.H.; Parhi, P.K.; Park, J.T.; Nam, C.W. Extraction of Metal Values from Waste Spent Petroleum Catalyst Using Acidic Solutions. Sep. Purif. Technol. 2012, 101, 85–90. [Google Scholar] [CrossRef]
  36. Lisińska, M.; Saternus, M.; Willner, J. Research of Leaching of the Printed Circuit Boards Coming from Waste Mobile Phones. Arch. Metall. Mater. 2018, 63, 143–147. [Google Scholar] [CrossRef]
  37. Chernyaev, A.; Wilson, B.P.; Lundström, M. Study on Valuable Metal Incorporation in the Fe–Al Precipitate during Neutralization of LIB Leach Solution. Sci. Rep. 2021, 11, 23283. [Google Scholar] [CrossRef]
  38. Levenspiel, O. Chemical Reaction Engineering, 3rd ed.; Wiley: Bengaluru, India, 1998; p. 580. ISBN 978-0-471-25424-9. [Google Scholar]
  39. Ashraf, M.; Zafar, Z.I.; Ansari, T.M. Selective Leaching Kinetics and Upgrading of Low-Grade Calcareous Phosphate Rock in Succinic Acid. Hydrometallurgy 2005, 80, 286–292. [Google Scholar] [CrossRef]
  40. Abdel-Aal, E.A. Kinetics of Sulfuric Acid Leaching of Low-Grade Zinc Silicate Ore. Hydrometallurgy 2000, 55, 247–254. [Google Scholar] [CrossRef]
  41. Eriksson, L.; Johansson, E.; Kettaneh-Wold, N.; Wikstroè, C.; Wold, S. Design of Experiments, Principles and Applications; John Wiley & Sons, Ltd.: Hoboken, NJ, USA, 2001; Volume 15, pp. 38–39. ISBN 9197373001. [Google Scholar]
  42. Mohapatra, D.; Park, K.H. Selective Recovery of Mo, Co and Al from Spent Co/Mo/γ -Al 2O3 Catalyst: Effect of Calcination Temperature. J. Environ. Sci. Health A Tox. Hazard Subst. Environ. Eng. 2007, 42, 507–515. [Google Scholar] [CrossRef] [PubMed]
  43. Mbedzi, N.; Ibana, D.; Dyer, L.; Browner, R. The Effect of Oxidant Addition on Ferrous Iron Removal from Multi-Element Acidic Sulphate Solutions. AIP Conf. Proc. 2017, 1805. [Google Scholar] [CrossRef] [Green Version]
Figure 1. (a) WPBs before delamination process, (b) plastic films after delamination process and (c) aluminium film after delamination process, viz., used as raw material for leaching.
Metals 13 01118 g001
Figure 2. Aluminium leaching in experimental set T1 (experiments A1–A9) under varying temperature (40, 60 and 80 °C) and H2O2 (0, 1.25 and 2.5 vol.%) during 24 h of leaching.
Metals 13 01118 g002
Figure 3. Aluminium leaching at centre point measurement experimental set T1 (experiment A5) and T2 (experiments A10–A12) with temperature at 60 °C and H2O2 dosage 1.25 vol.% during 24 h leaching.
Metals 13 01118 g003
Figure 4. (a) Effect of temperature on aluminium leaching in the absence (experiments A1 *–A3 *, A13 and A14, 5 h) and presence (A4 *–A6 *, A15 and A16, 5 h) of 1.25 vol.% H2O2. (b) Effect of H2O2 dosage on aluminium leaching (experiments A1 *, A2 *, A4 *, A5 *, A7 *, A8 * and A17–A20). (c) Effect of time on aluminium leaching (experiments A3 *, A6 * and A9 *), T = 80 °C. (d) Effect of S:L ratio on aluminium leaching (experiments A5 *, A6 * and A21–A28).
Metals 13 01118 g004aMetals 13 01118 g004b
Figure 5. Redox potential (mV) versus time (experiments A3 #, A6 # and A9 #).
Metals 13 01118 g005
Figure 6. Steps involved in aluminium leaching.
Metals 13 01118 g006
Figure 7. Polarization resistance of aluminium in 0.25 M H2SO4 versus time.
Metals 13 01118 g007
Figure 8. Reaction rate constant for centre point experiment (A5) and replicates of centre point experiments (A10–A12) according to first t = 5 h, fitted to chemical reaction control model (r2 = 0.98–0.99).
Metals 13 01118 g008
Figure 9. Arrhenius plot for leaching secondary aluminium recovered from WPBs: (a) film diffusion and (b) chemical reaction control model.
Metals 13 01118 g009
Figure 10. Scaled and centred coefficients for regression analysis for aluminium reaction rate constant in 0.25 M H2SO4 solution after 5 h.
Metals 13 01118 g010
Figure 11. Observed vs. predicted value plot for regression analysis for aluminium reaction rate constant in 0.25 M H2SO4 solution after 5 h.
Metals 13 01118 g011
Figure 12. Response surface of the model for predicting aluminium reaction rate constant at t = 5 h as a function of H2O2 dosage in 0.25 M H2SO4 solution after 5 h.
Metals 13 01118 g012
Figure 13. Indicative flowsheet for valorisation of aluminium recovered from WPBs as aluminium sulphate, data from [10].
Metals 13 01118 g013
Table 1. Elemental composition (wt.%) of aluminium film after delamination (average composition) data from [10].
OAlClFeTotal
Aluminium Film1.0395.571.930.47100
Table 2. The preliminary (PE 1–4) and main leaching experiment series (T1–T4) for WPB aluminium. T1–T4 had [H2SO4] = 0.25 M.
Experimental SetExperiment CodeTemperature
(°C)
H2SO4
(M)
S:L Ratio
(g/L)
Time
(h)
PEPE-1800.254.024
PE-2800.504.024
PE-3800.754.024
PE-4801.004.024
Experimental SetExperiment CodeTemperature
(°C)
H2O2
(vol.%)
S:L ratio
(g/L)
Time
(h)
T1A1 *4004.524
A2 *6004.524
A3 *#8004.524
A4 *401.254.524
A5 *601.254.524
A6 *#801.254.524
A7 *402.54.524
A8 *602.54.524
A9 *#802.54.524
T2A10601.254.524
A11601.254.524
A12601.254.524
T3A135004.55
A147004.55
A15501.254.55
A16701.254.55
A17400.6254.55
A18600.6254.55
A19401.8754.55
A20601.8754.55
T4A21601.252.255
A22601.253.3755
A23601.255.6255
A24601.256.755
A25801.252.255
A26801.253.3755
A27801.255.6255
A28801.256.755
* Five-hour values are considered for these experiments; # experiments were repeated for titration, pH and redox measurement.
Table 3. Standard deviation and coefficient of variation for experiments A5 and A10–A12.
A5A10A11A12
Slope:11.7010.0410.1810.22
Mean for the slopes:8.59
Standard deviation for the slopes:0.78
Coefficient of variation (CV):0.09
Table 4. Measured pH and titrated [H+] conc. of the initial leaching media and pregnant leach solution at t = 5 h (experiments A3 #, A6 # and A9 #).
Initial
Lixiviant
PLS
(A3 #)
PLS
(A6 #)
PLS
(A9 #)
[H+] conc. (mol/L)0.2650.1590.0600.053
pH0.580.801.231.27
Table 5. Model summaries, showing model for leaching kinetics reaction rate constant (kc) (min−1): goodness of prediction (Q2), coefficient of determination (R2), number adjusted R2 and reproducibility.
ModelQ2R2R2 (adj.)Reproducibility
Reaction rate constant
(t = 5 h)
0.4710.9180.8710.997
Disclaimer/Publisher’s Note: The statements, opinions and data contained in all publications are solely those of the individual author(s) and contributor(s) and not of MDPI and/or the editor(s). MDPI and/or the editor(s) disclaim responsibility for any injury to people or property resulting from any ideas, methods, instructions or products referred to in the content.

