Article

Fatigue Life Assessment of Metals under Multiaxial Asynchronous Loading by Means of the Refined Equivalent Deformation Criterion

Department of Engineering and Architecture, University of Parma, Parco Area delle Scienze 181/A, 43124 Parma, Italy
Metals 2023, 13(3), 636; https://doi.org/10.3390/met13030636
Submission received: 21 January 2023 / Revised: 15 March 2023 / Accepted: 17 March 2023 / Published: 22 March 2023
(This article belongs to the Special Issue Fatigue Behavior and Crack Mechanism of Metals and Alloys)

Abstract

:
As is well-known, non-proportional fatigue loading, such as asynchronous one, can have significant detrimental effects on the fatigue behavior of metallic materials by reducing the fatigue strength/fatigue limit and by leading to a fatigue damage accumulation increased with respect to that under proportional loading. In the present paper, the novel refined equivalent deformation (RED) criterion is applied for the first time to estimate the fatigue lifetime of materials, sensitive to non-proportionality, subjected to asynchronous loading under low-cycle fatigue regime. The present criterion is complete since it considers: (i) the strain path orientation, (ii) the degree of non-proportionality, and (iii) the changing of material cyclic properties under non-proportional loading. To evaluate its accuracy, this criterion is applied to examine two different metals (a 304 stainless steel and a 355 structural steel) whose experimental data under multiaxial asynchronous loading are available in the literature. More precisely, the parameters of the criterion are firstly determined by using experimental strain paths, and then the computed refined equivalent deformation amplitude is used to represent the experimental data with a satisfactory accuracy. Finally, a comparison with the results obtained through two other criteria available in the literature is performed, highlighting the good prediction of the present RED criterion.

1. Introduction

It is well-known that non-proportionality of fatigue loading may have a significant influence on the fatigue behavior of metallic materials [1]. When loading components are not in constant proportion, that is, in the case of random components or in the case of periodical components phase-shifted and/or with different frequencies, the microstructure of metals may be strongly affected. As a matter of fact, the non-proportional changing of such loading components usually causes the rotation of the principal axes of stresses and strains, resulting in shear stresses acting in multiple directions and planes. Such shear stresses, indeed, may activate more slip systems compared with those activated under uniaxial and multiaxial proportional loading [2,3,4], producing: an increase of the dislocation interaction [5], a high density and a uniform distribution of the dislocations [3], the formation of dislocation cells of small sizes with great disorientation angles and great sharpness of cell walls [6,7]. As a result, an additional cyclic hardening of the material, as well as a reduction in the fatigue strength/fatigue limit, can be caused by the abovementioned dislocations mechanisms, leading to a fatigue damage accumulation increased with respect to that under proportional loading.
Consequently, the importance of considering the effect of loading non-proportionality from the points of view of both load analysis and material properties appears evident, although different materials show different susceptibilities to the same non-proportional loading degree [1]. For instance, a load characterized by a high degree of non-proportionality acting on a material with a high susceptibility to non-proportionality can lead to a reduction in material fatigue strength of about ten times greater than that caused by a similar proportional loading [1,8]. Therefore, since such an effect cannot be underestimated in engineering practice, research on fatigue non-proportional loading condition is in continuous development [9,10,11,12,13,14].
Historically, the largest group of non-proportional loading used in fatigue tests is out-of-phase loading [15]. In such a case, the parameter that determines the degree of non-proportionality is the phase shift angle, which is constant over time. Another interesting group of non-proportional loading is the asynchronous one, where the loading components are characterized by different frequencies. In comparison with other cases of multiaxial loading, the results of fatigue tests conducted by using asynchronous loading are rarely published in the literature [16]. From such studies, it has been observed that the typical issues related to asynchronous loads are [16]:
(i)
the unclear cycle definition, due to different frequencies of the load components;
(ii)
the not obvious dependence of non-proportionality degree on the values of the ratio f γ / f ε (being f γ and f ε the frequencies of the shear and normal strain components, respectively);
(iii)
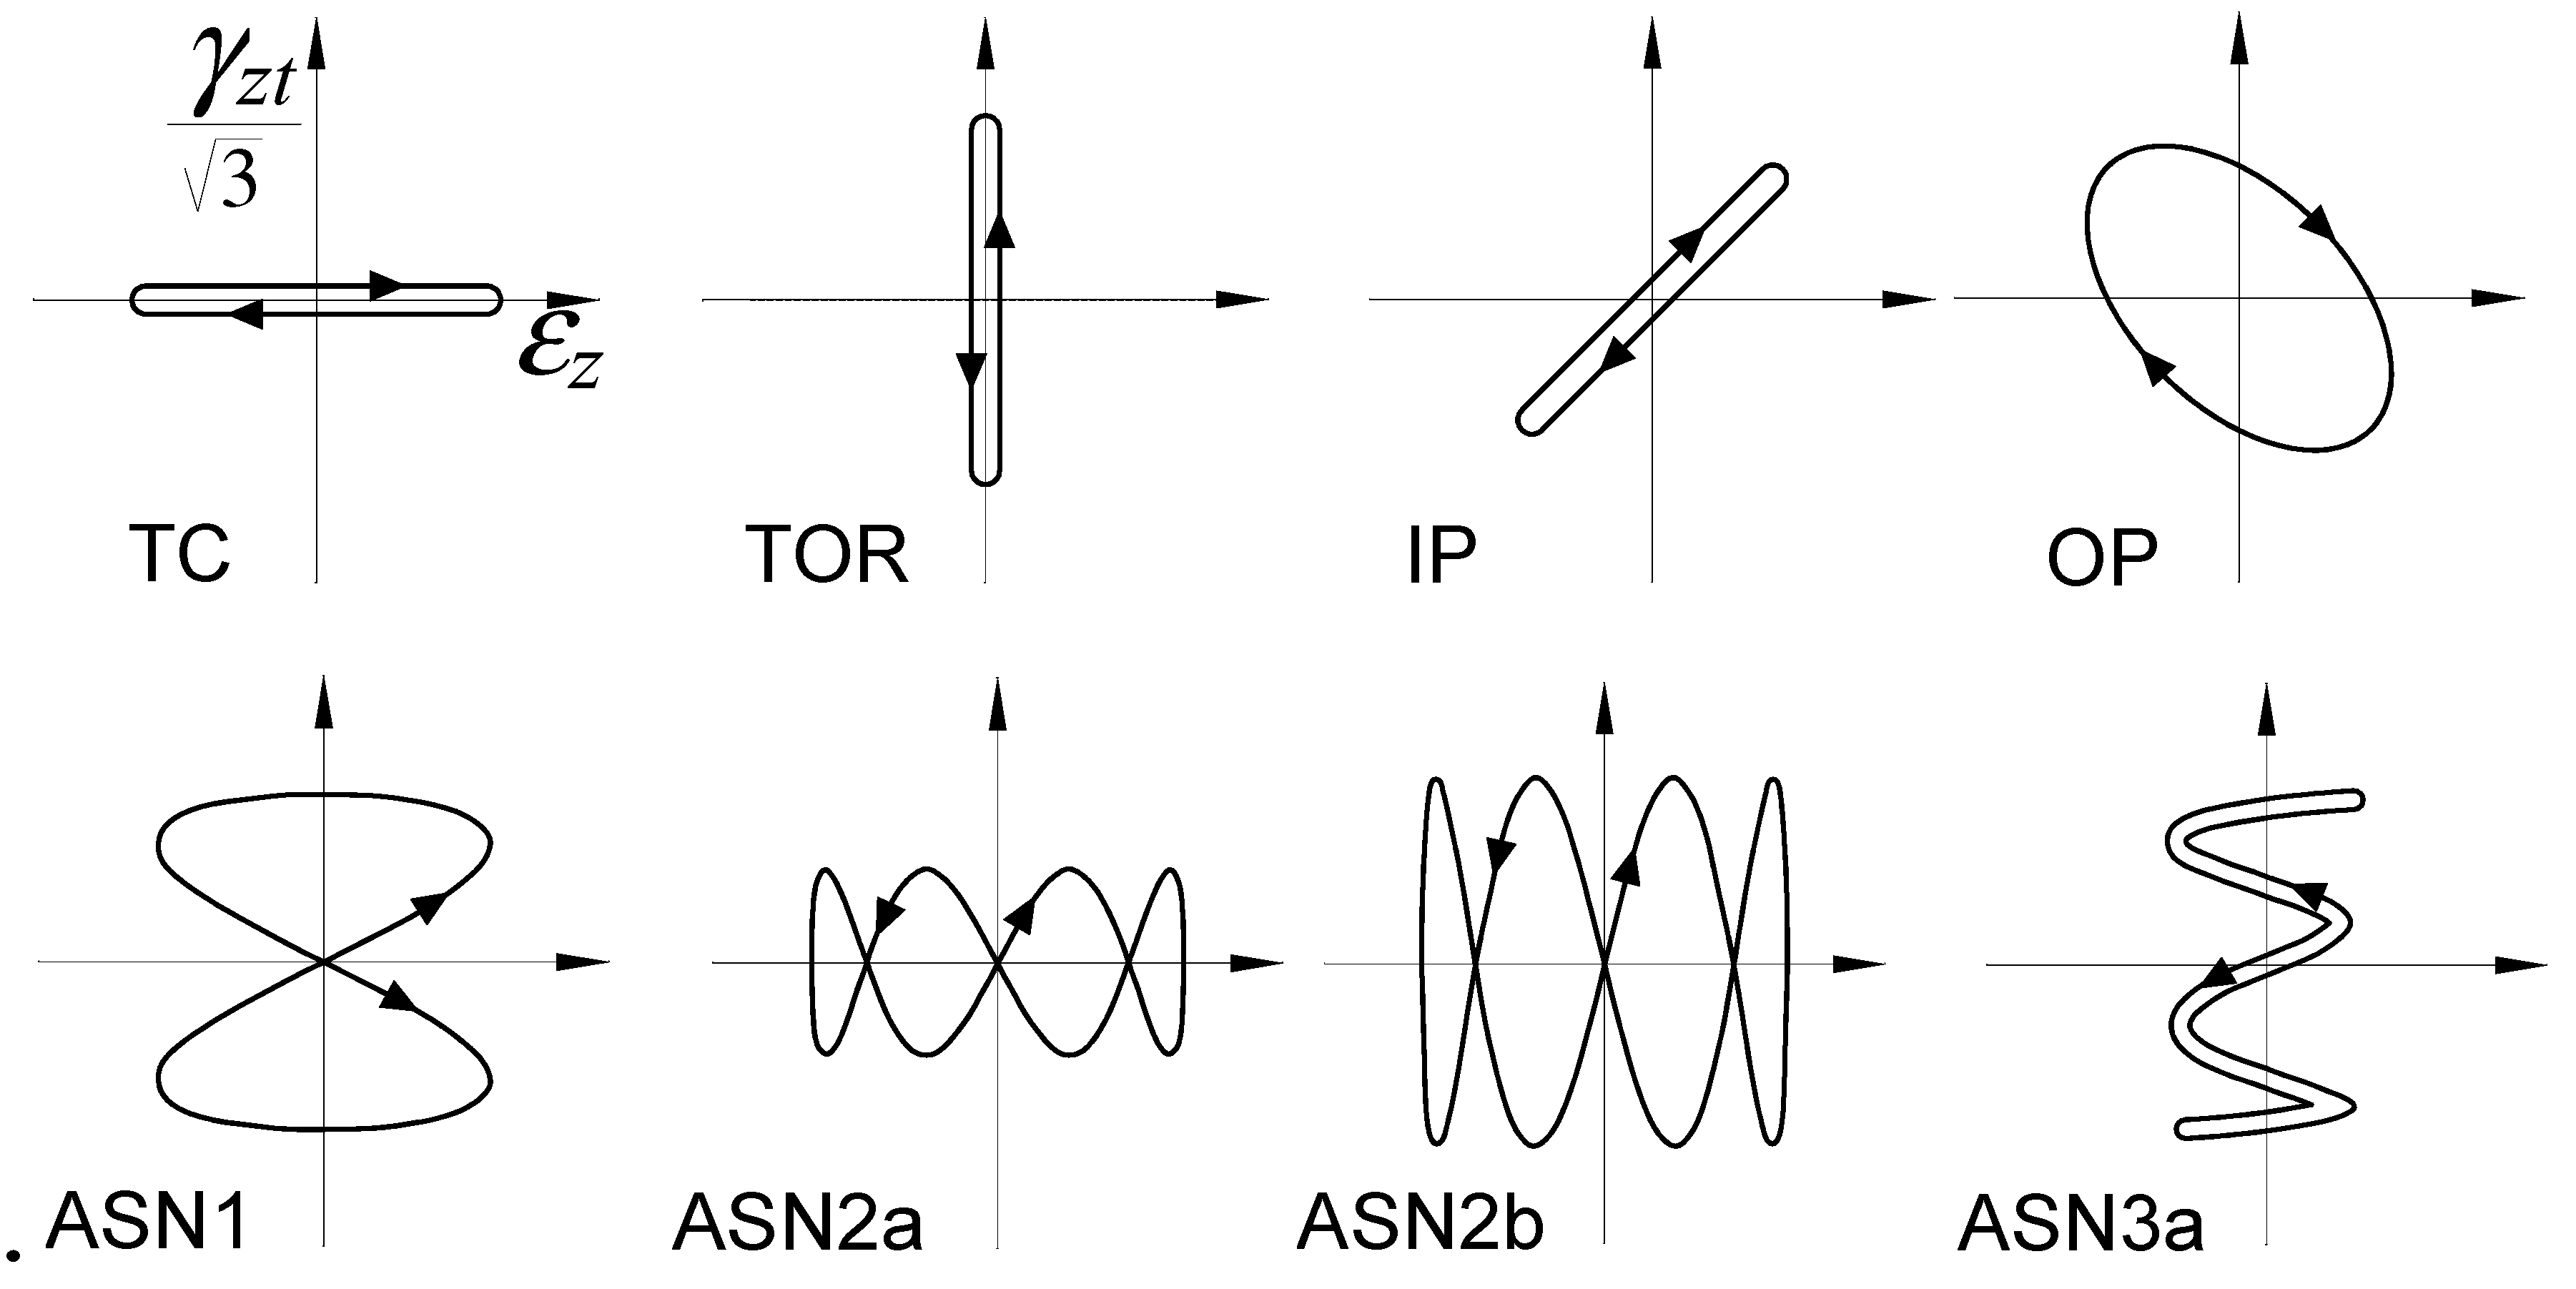
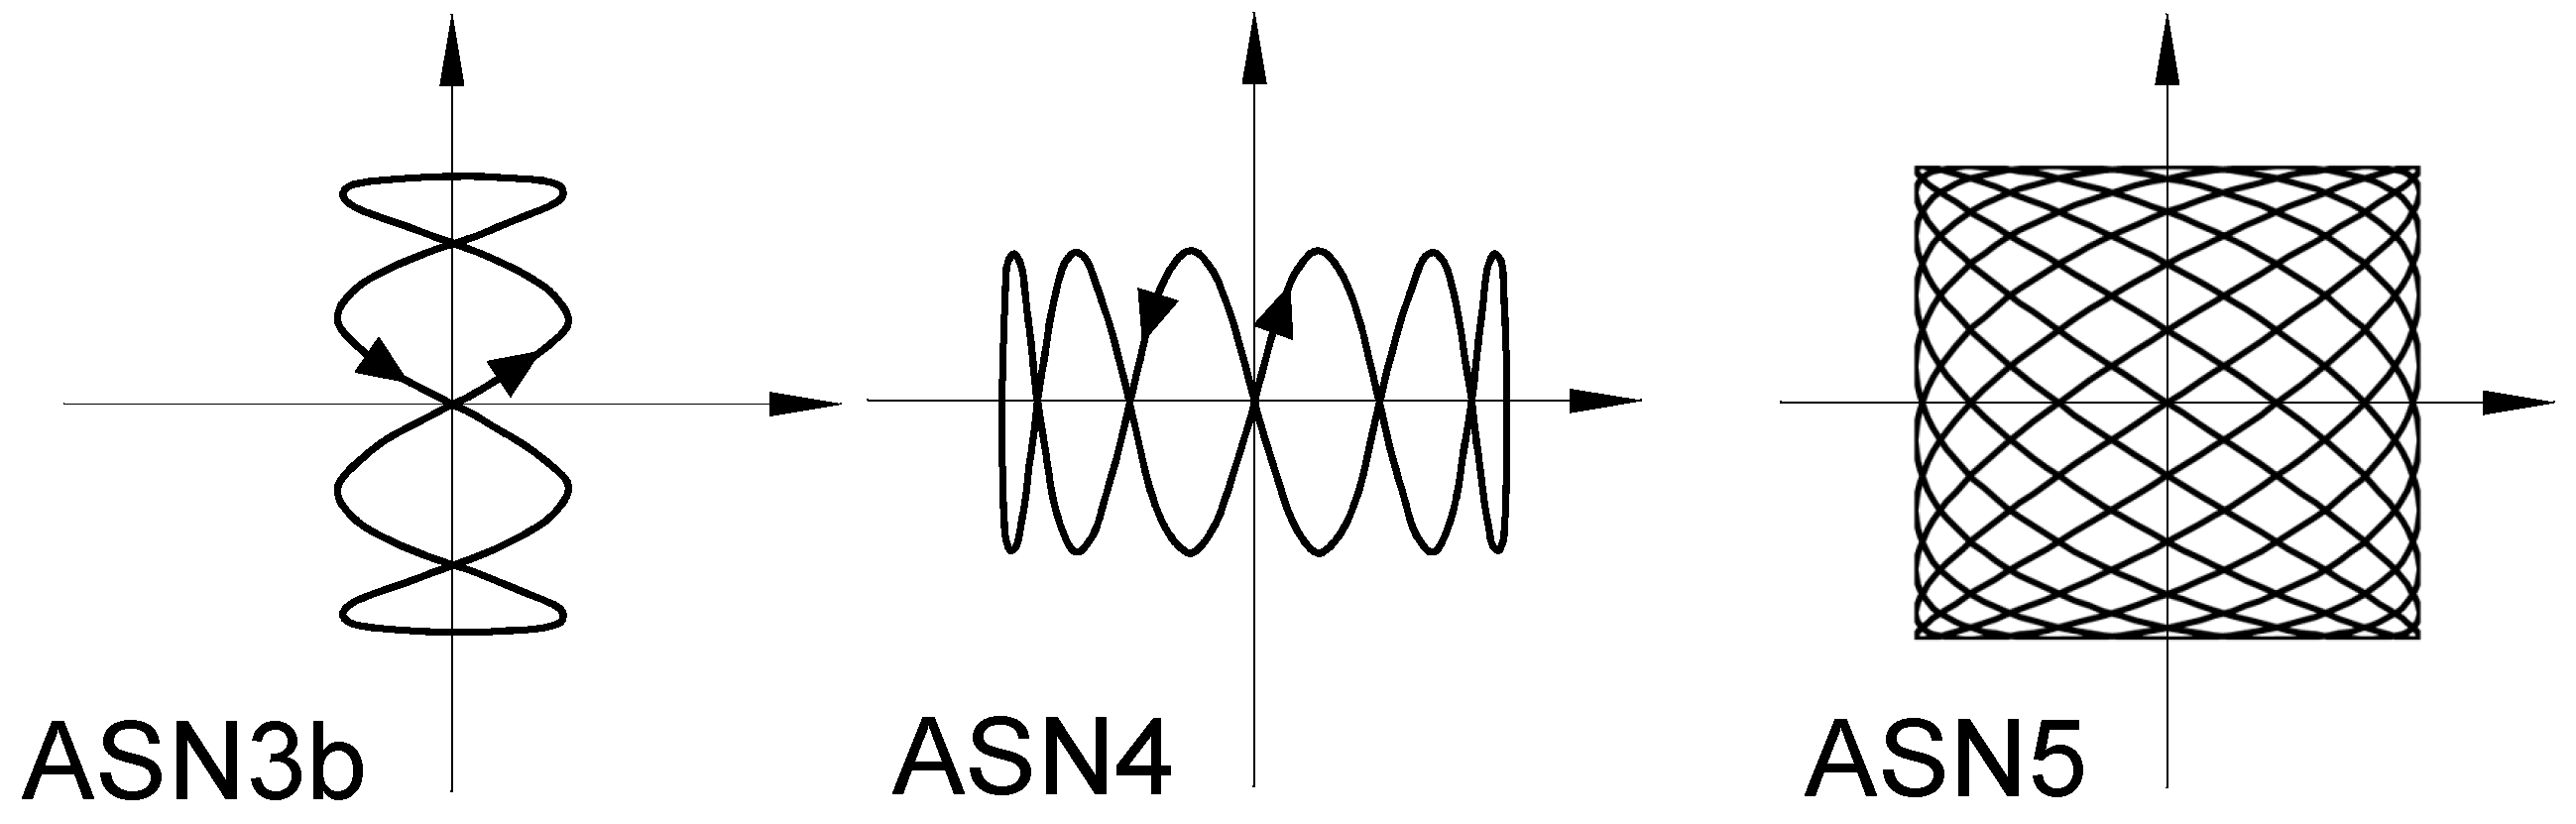
the existence of more than one plane where the maximum damage can be achieved (that is, multiple possible critical planes). For instance, in the case of both in-phase and out-of-phase loading, there are two planes of maximum shear strain and one plane of maximum normal strain, with the plane of maximum normal strain coincident with one of the two planes of maximum shear strain in the case of out-of-phase loading. On the contrary, in the case of asynchronous loading, the number of planes changes according to the f γ / f ε ratio: for a butterfly-shape strain path ( f γ / f ε = 1 / 2 ), four planes of maximum shear strain and two planes of maximum normal strain can be observed [16].
Therefore, it is worth noting that a fatigue criterion cannot accurately estimate fatigue life of components under asynchronous loading by only considering the stress/strain state inside a material for the computation of a suitable damage parameter. Among the criteria available in the literature for such an evaluation, both strain- and energy-based criteria are widely used [8,17,18,19]. In such a context, the novel refined equivalent deformation (RED) criterion [8,20] allows to take into account the effect of asynchronous loading on the fatigue strength for those materials sensitive to load non-proportionality. Such a RED criterion, already successfully applied in the case of out-of-phase loading [8,20], is applied here for the first time to analyze two experimental campaigns performed on 304 stainless steel and 355 structural steel components subjected to various asynchronous loading paths under multiaxial low cycle fatigue (LCF) regime [16].
The present paper is structured as follows. The experimental campaigns here examined are described in Section 2, whereas the RED criterion is presented in Section 3. Then, results and discussion are reported in Section 4. The main conclusions are summarized in Section 5.

2. Examined Experimental Campaigns

The examined experimental campaigns [16] are hereafter presented. More precisely, uniaxial and multiaxial fatigue tests under LCF regime were performed.

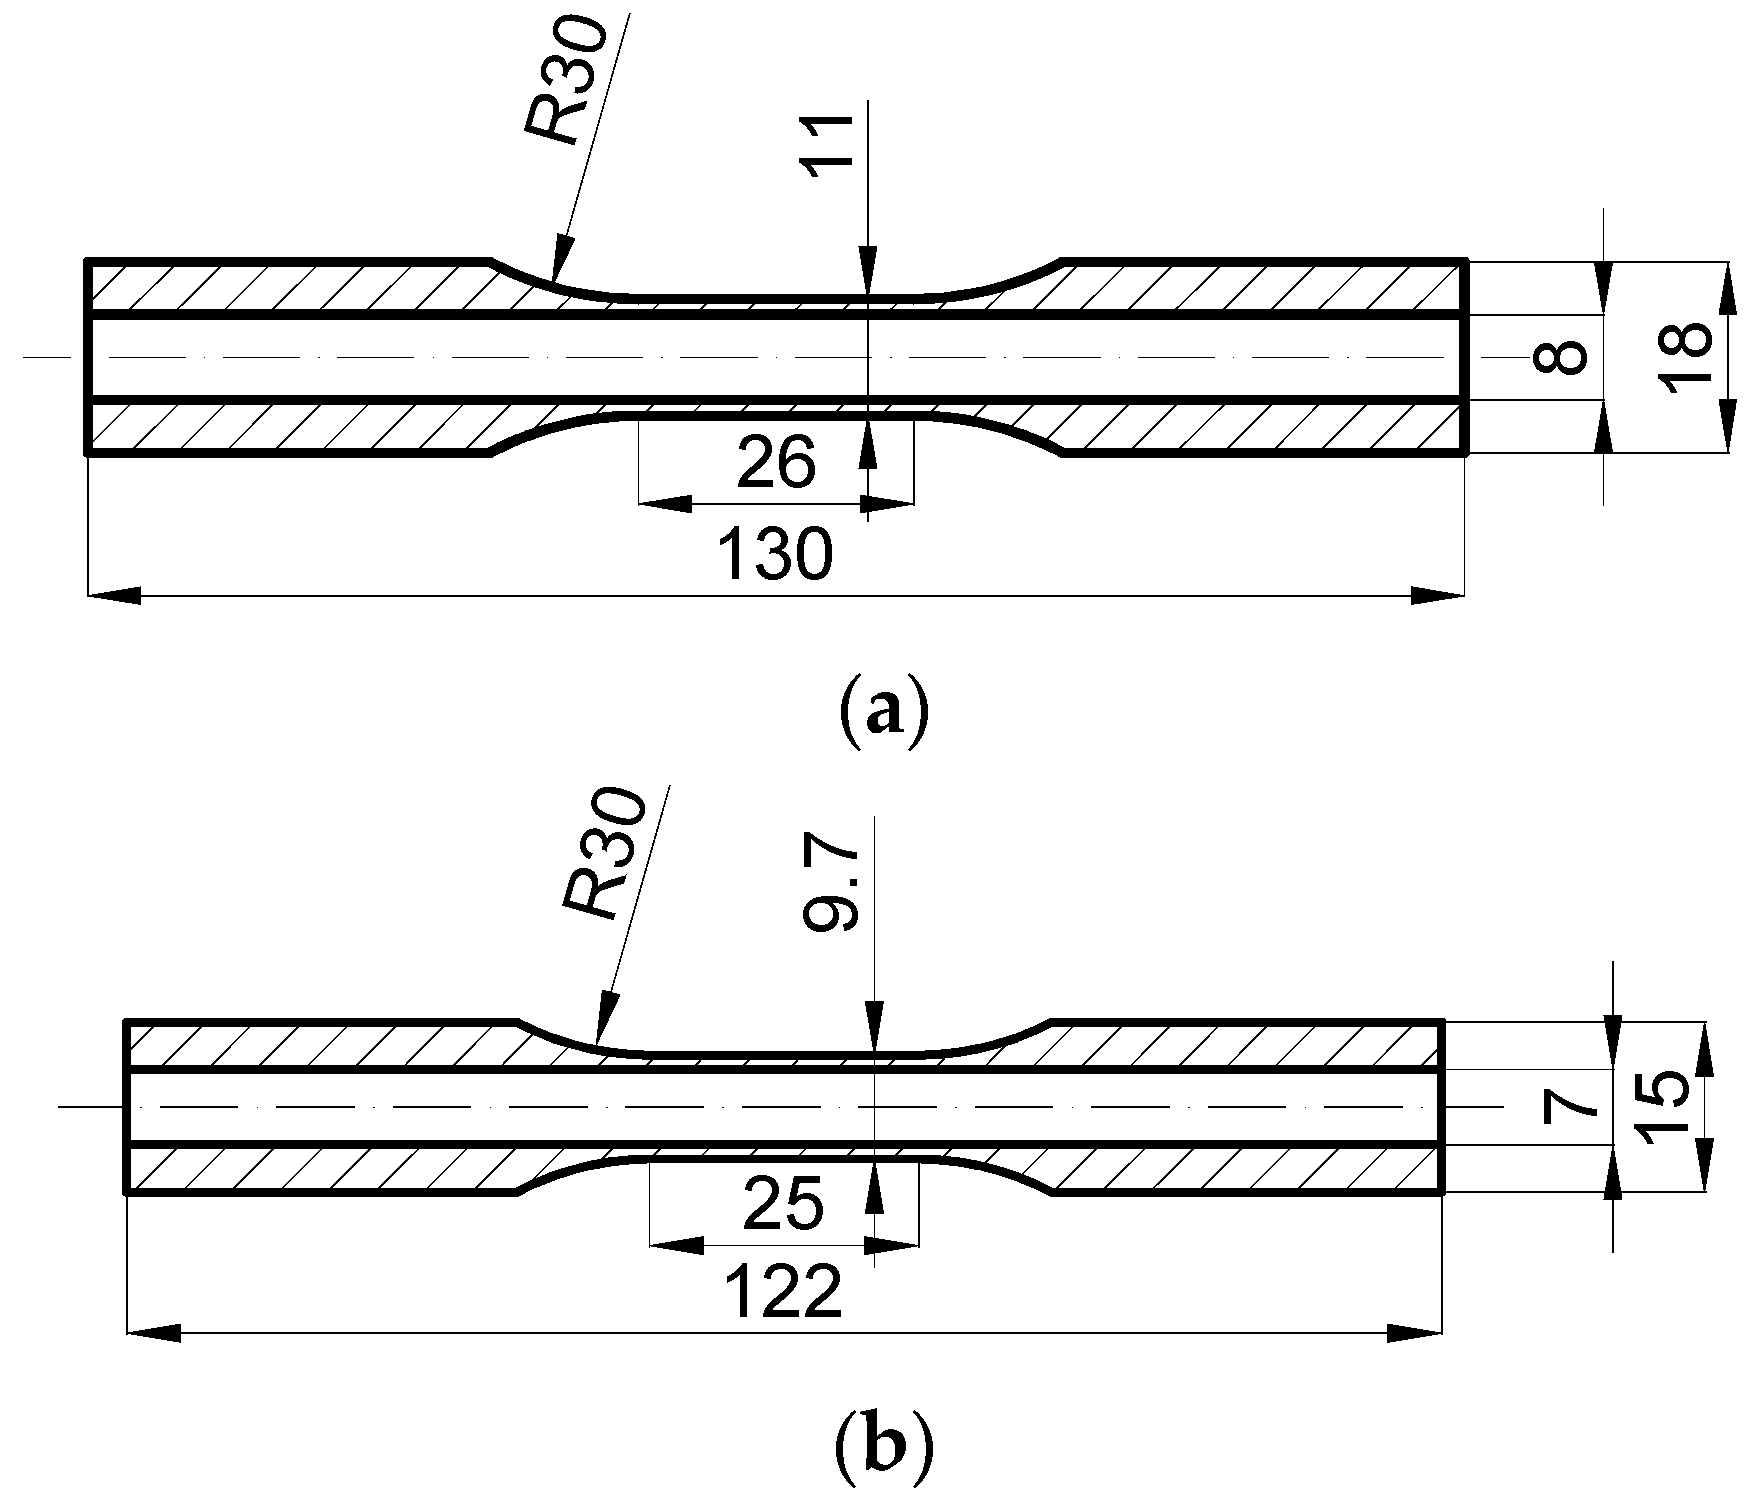
2.1. Materials and Specimens

The materials were 304 austenitic stainless steel (SS304, EN 1.4301), soft annealed, and non-alloy quality 355 structural steel (S355, EN 1.0580). The materials were purchased in the form of precise seamless pipes, and their mechanical properties are listed in Table 1 and Table 2, respectively.
The above materials were selected since it is well known that they were characterised by a large additional cyclic hardening under non-proportional loading [16]. Note that, in Table 1 and Table 2, the mechanical properties of both materials are reported, that is, the elastic modulus, E , the yield strength, σ y , and the effective Poisson’s ratio, ν e f f , together with the Manson-Coffin tensile and torsional parameters, σ f , b , ε f , c and τ f , b 0 , γ f , c 0 , respectively.
Thin-walled tubular specimens were machined, whose sizes are shown in Figure 1.

2.2. Testing Conditions and Experimental Results

All tests were performed by using an Instron 8874 axial-torsional closed-loop servo-hydraulic testing system under displacement control with a grip displacement velocity of 0.02 mm/s [16]. The axial and shear strains were measured by an Epsilon 3550 biaxial extensometer. The frequency of the fatigue tests was varied to keep the maximum value of the equivalent Huber–Mises strain rate below 0.001 s−1, resulting in a frequency range from 2 Hz to tenths of Hz. Sine-shaped fully reversed waveforms of normal, ε z , and shear, γ z t , strains were used, and their equations can be, respectively, written as:
ε z t = ε z , a sin 2 π f ε t
γ z t t = γ z t , a sin 2 π f γ t + β
being ε z , a ,   γ z t , a , f ε and f γ the amplitudes and the frequencies of the normal and shear strains, respectively, and β the phase shift angle. Note that if f γ / f ε = 1 , a proportional (in-phase) loading takes place when β = 0 ° , while a non-proportional out-phase loading is obtained for β 0 ° . On the other hand, if f γ / f ε 1 for both β = 0 ° and β 0 ° , the type of loading is defined as asynchronous, with the normal and shear strain components not in constant proportion.
In both examined experimental campaigns [16], four synchronous loading conditions were considered as listed in Table 3, that is: tension–compression (TC), torsion (TOR), in-phase tension–torsion (IP), and out-of-phase tension–torsion (OP). Moreover, seven asynchronous loading cases (ASN) were considered, as detailed in Table 3. Note that λ is the ratio between the shear strain amplitude and the normal one ( λ = γ z t , a / ε z , a ).
The strain paths of the above synchronous and asynchronous loading in the ε z - γ z t / 3 plane are shown in Figure 2. Seven specimens were tested for each loading path (with the exception of loading paths IP, ASN2b and ASN3b for the S355 structural steel), in agreement with the ASTM E739 standard [22].
The failure condition was assumed to be reached when a 5% (or greater) drop in axial load or torque was observed (whichever occurred first) with respect to the corresponding value registered at approximatively midlife [16]. Further details regarding the loading conditions can be found in Ref. [16].
The amplitudes ε z , a and γ z t , a of the applied strains are listed in Table 4 for the 304 stainless steel and in Table 5 for the 355 structural steel. Moreover, the experimental fatigue life, N f , e x p , of all tested specimens is listed in Table 4 and Table 5.
A particular mention is needed regarding the way such an experimental fatigue life N f , e x p has been defined. As mentioned in the Introduction, one of the issues regarding the asynchronous loading is the unclear definition of a cycle, due to the different frequencies of the strain components. In the literature, two ways are usually followed to define such a fatigue life [16], that is: (i) the number of loading cycles to failure is taken equal to the number of cycles of the strain component with the lower frequency; or (ii) the fatigue life is assumed equal to the number of cycles performed by the strain components with higher frequency.
The most common approach is the first one [16], which is also the most conservative. Therefore, such an approach is followed also in this work, that is: N f , e x p = min N a , e x p ; N t , e x p , being N a , e x p and N t , e x p the number of loadings cycles to failure counted in the normal and shear strains channels during the experimental tests, respectively [16].

3. The Refined Equivalent Deformation (RED) Criterion

The RED criterion is a strain-based criterion that is based on the critical plane concept. The definition of the damage parameter, ε R E D , a (named refined equivalent deformation amplitude), introduced in Ref. [8], is in line with that employed by the Reduced Strain Range Method proposed by Borodii et al. [23,24,25]. Hereafter, a brief description of the criterion framework is given, whereas a detailed presentation of the criterion features can be found in Ref. [20].

3.1. Material Sensitivity to Non-Proportional Loading

As mentioned in the Introduction, different metals have different sensitivities to non-proportional fatigue loading, that is, they react in different ways to a given fatigue loading characterized by a certain degree of non-proportionality. In order to take into account such an aspect, different parameters are available in the literature to quantify such a sensitivity to non-proportional fatigue loading [1], that is, for instance: the Staking Fault Energy (SFE), the additional cyclic hardening coefficient, α , and the ratio τ a f , 1 / σ a f , 1 between the fully reversed shear strength and the fully reversed normal strength. By focusing the attention on the last one, that is the parameter used in the present criterion, it has been proved that a material is sensitive to non-proportional loading when τ a f , 1 / σ a f , 1 1 / 3 [20]; therefore, in such a case, a possible decrease in fatigue strength/fatigue life has to be taken into account. On the other hand, when such a ratio is greater than 1 / 3 , it is generally assumed that no effect produced by non-proportional loading has to be considered in the fatigue life assessment, and the criterion proposed in Ref. [26] can be directly applied.

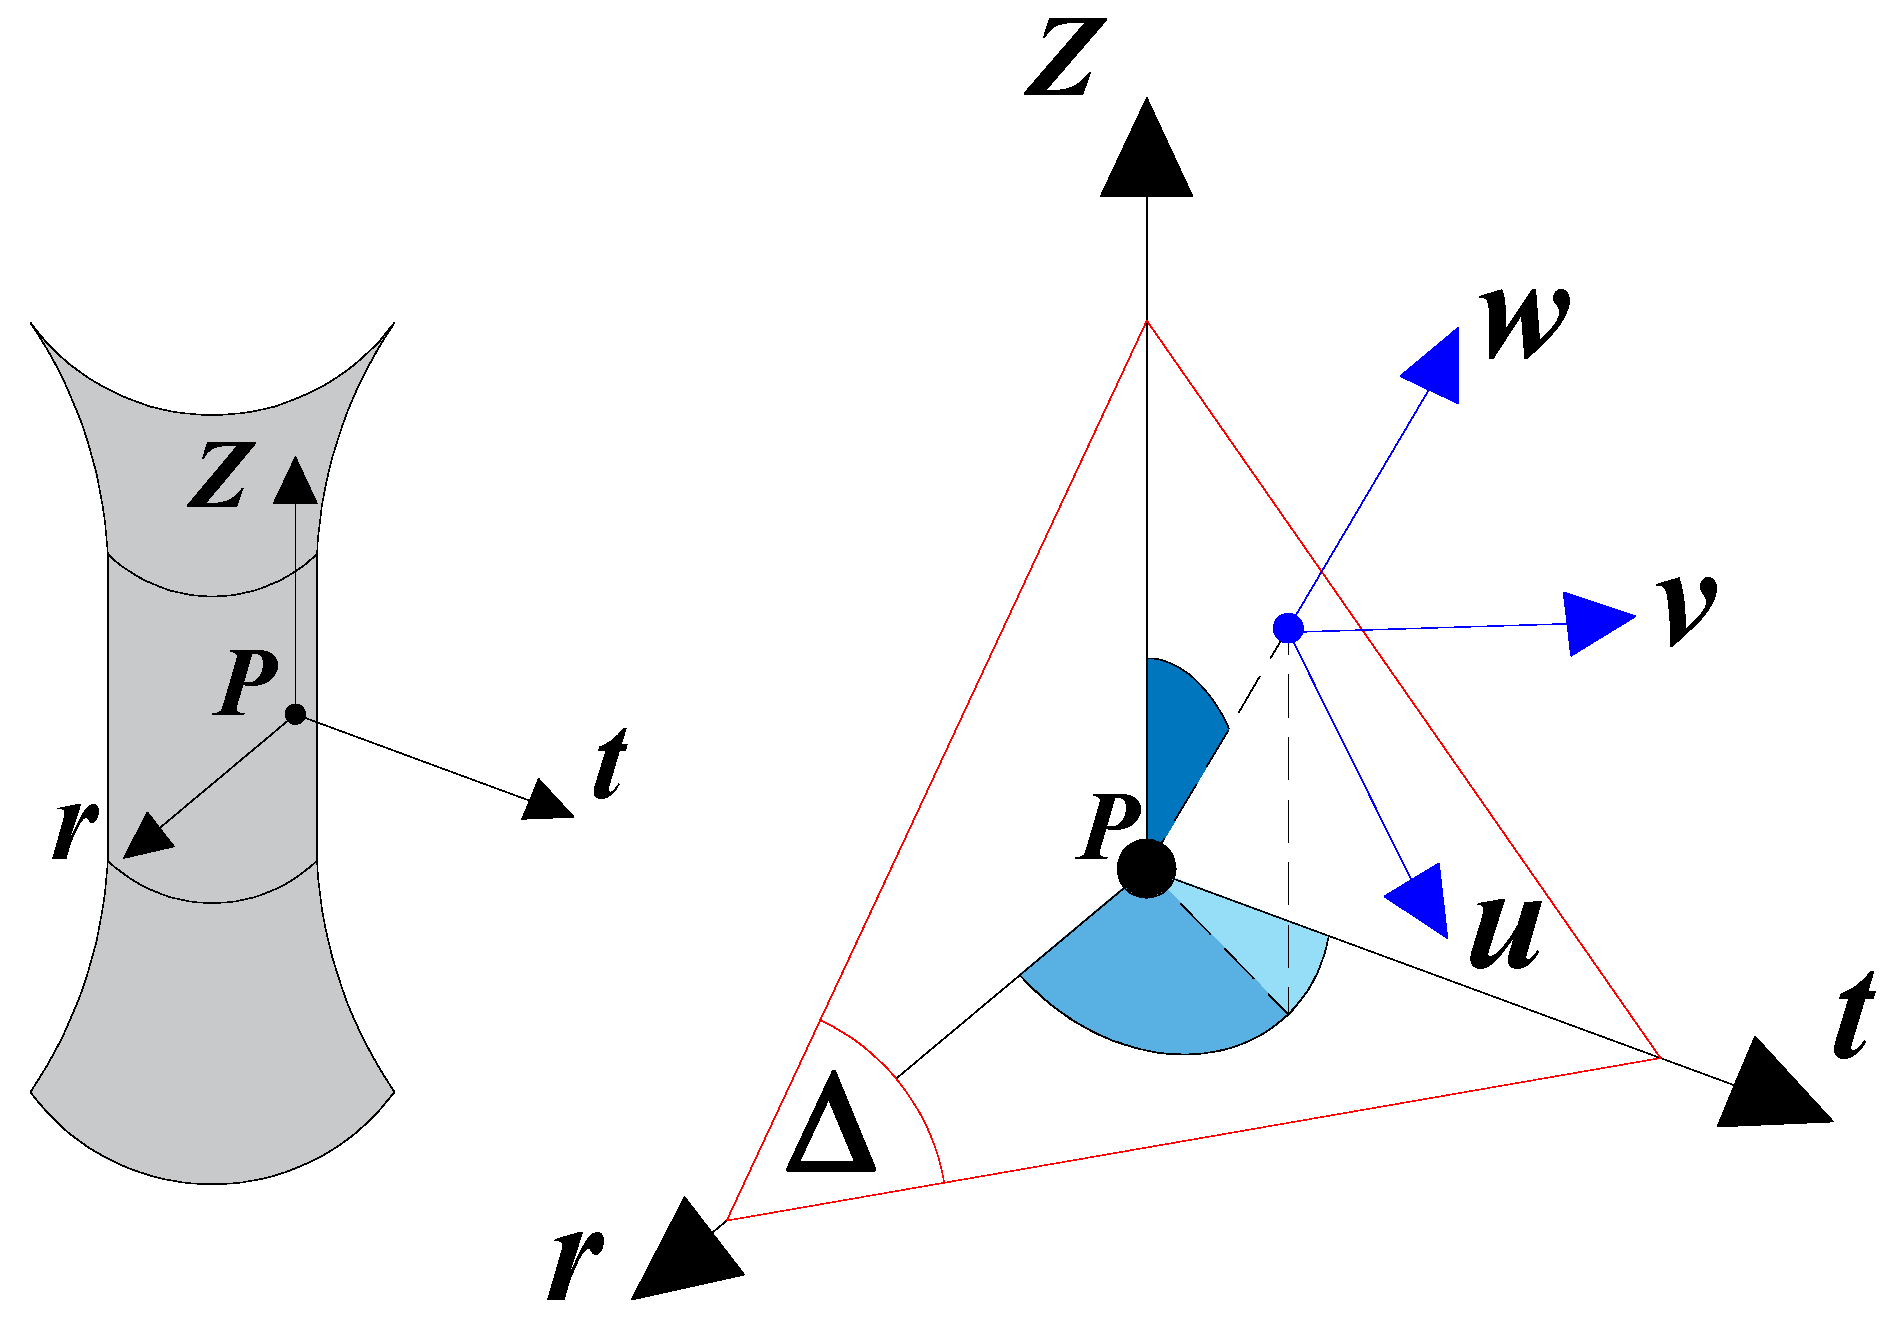
3.2. Critical Plane Determination

The critical plane Δ , that is the plane where the fatigue assessment is performed, is determined according to the method proposed in Ref. [26]. Let us consider a biaxial fatigue loading, for which the strain tensor at a material point P located on the surface of a smooth engineering component has the following strain components: ε r , ε t , ε z , and 1 / 2 γ z t with respect to a fixed frame r t z (Figure 3).
The components ε r and ε t are functions of ε z by means of the effective Poisson’s ratio ν e f f .
The principal strains ε 1 , ε 2 and ε 3 ( ε 1 ε 2 ε 3 ) and the corresponding directions are computed during the observation period T by identifying the instant when ε 1 attains its maximum value during T . Its direction, named 1 ^ , is used to determine the normal w to the critical plane: as a matter of fact, w is assumed to form an angle δ with respect to 1 ^ , where such a rotation is performed from 1 ^ to 3 ^ , being 3 ^ the direction of ε 3 when ε 1 is maximum. The angle δ is computed as follows:
δ = 3 2 1 1 2 1 + ν e f f γ a ε a 2 45 °
where ε a and γ a are computed according to the tensile and torsional Manson–Coffin equations, respectively:
ε a = σ f E 2 N f , c a l b + ε f 2 N f , c a l c
γ a = τ f G 2 N f , c a l b 0 + γ f 2 N f , c a l c 0
being σ f , b , ε f , c and τ f , b 0 , γ f , c 0 the parameters of the Manson-Coffin tensile and torsional equations, respectively, and N f , c a l the number of loading cycles.

3.3. Damage Parameter Determination

Let us consider a local frame u v w (with origin at the abovementioned point P) attached to the critical plane Δ (Figure 3). The displacement η of the point P can be decomposed in a component η N , function of the strain tensor component ε w along the normal to Δ , and a component η C , function of the strain tensor components γ w u and γ w v both lying on Δ .
According to the RED criterion, the refined equivalent deformation amplitude, ε R E D , a , is defined by the following equivalent deformation amplitude for non-proportional loading [8]:
ε R E D , a = 1 + k s i n 45 ° φ i 1 + α   Φ i ε e q , a p
where ε e q , a p is the damage parameter for proportional loading, defined as [26]:
ε e q , a p = η N , a 2 + ε a γ a 2 η C , a 2
being η N , a and η C , a the amplitudes of η N and η C , respectively. Note that, having η C different directions during the observation period, the maximum rectangular hull method [27] is used to compute η C , a . Finally, the fatigue life, N f , c a l , is computed by iteratively solving the Equation (4), where ε e q , a p is replaced by Equation (5).
It is worth noticing that Equation (5) is used even in the case of metals non sensitive to non-proportional loading: in such a case, k and α are set equal to zero.

3.3.1. k and φ i Parameters Definitions

The parameter k is a material constant, which is representative of the material sensitivity to the change of fatigue properties, determined from uniaxial strain paths with respect to those determined from multiaxial proportional ones for the same strain amplitude. Such a constant is computed by considering only uniaxial strain paths:
k = 1 Q j = 1 Q k j = 1 Q j = 1 Q 1 s i n 45 ° ε a N f , e x p , j ε e q , a p 1
where Q is the total number of uniaxial strain paths examined, ε a N f , e x p , j is determined though the tensile Manson-Coffin equation (Equation (3a)) by replacing N f , c a l with the experimental number of loading cycles obtained for the j -th uniaxial strain path, N f , e x p , j , whereas ε e q , a p is computed by means of Equation (5).
When k j > 0 , the material manifests sensitivity to the change of fatigue properties for the j -th strain path; on the contrary, when k j 0 , the material does not manifest such a sensitivity, and k j can be assumed equal to zero.
The parameter φ i is the angle formed by the i -th non-proportional strain path with respect to the abscissa axis in the plane ε z - γ z t / 3 . In order to measure such an angle, the direction of the i -th non-proportional strain path has to be determined. Such a direction is defined as the maximum length of the segment that joints two points on the strain path in the ε z - γ z t / 3 plane, named Δ ε m in the following. Consequently, φ i is measured between the above segment and the abscissa axis of the above plane [20].

3.3.2. α and Φ i Parameters Definitions

The material constant α is determined by only considering non-proportional strain paths [20]:
α = 1 M i = 1 M α i = 1 M i = 1 M 1 Φ i ε a N f , e x p , i ε e q , a p 1
being M the total number of the non-proportional strain paths examined, ε a N f , e x p , i is determined through the tensile Manson-Coffin equation (Equation (3a)) by replacing N f , c a l with the experimental number N f , e x p , i of loading cycles obtained for the i -th non-proportional strain path, and ε e q , a p is computed by means of Equation (5). The parameter α is representative of the material sensitivity to non-proportional loading: when α i > 0 , the material manifests the above sensitivity for the i -th strain path; on the contrary, when α i 0 , the material does not manifest such a sensitivity, and α i can be assumed equal to zero.
The parameter Φ i is the coefficient of non-proportionality related to the i -th non-proportional strain path and it is defined according to the method proposed by Borodii et al. [23,24,25], where a detailed description of its computation is given in Ref. [20]. Such a coefficient is defined as:
Φ i = S i S 0 , i r i
When the non-proportional strain path in the ε z - γ z t / 3 plane is a closed strain path (that is, a convex path), S i is the area enveloped by the i -th convex path and S 0 , i is the area of the smallest circle that contains the above path in the ε z - γ z t / 3 plane. The exponent r i is defined as:
r i = 1                         for   smooth   strain   path
r i = 1 S i S 0 , i l i 4 Δ ε m   for   piecewise   broken   line   strain   path
where l i is the length of the convex path.
On the contrary, when the non-proportional strain path in the ε z - γ z t / 3 plane is an open strain path (that is, a non-convex path), S i is the area enveloped by an equivalent convex strain path containing the i -th one and S 0 , i is the area of the smallest circle that contains the above equivalent path in the ε z - γ z t / 3 plane. In such a case, the exponent r i is given by:
r i = l i 4 Δ ε m
where l i is the length of the non-convex path.

4. Results and Discussion

In the present section, the RED criterion is applied to simulate the results of the biaxial loading experimental tests described in Section 2.

4.1. 304 Stainless Steel

4.1.1. Material Sensitivity to Non-Proportional Loading and RED Parameter Computation

According to the present criterion, some input data have to be set, which are listed in Table 1 for the 304 stainless steel. More precisely, the values of σ f , E , b , ε f and c are taken from Ref. [20], the Huber–Mises–Hencky hypothesis is assumed for both τ f and γ f , that is, τ f = σ f / 3 and γ f = ε f / 3 , respectively, as commonly suggested in the literature [28], b 0 = b and c 0 = c are assumed, and G is determined as a function of the elastic modulus E . The fatigue strengths σ a f , 1 and τ a f , 1 are computed as follows:
σ a f , 1 = σ f 2 N 0 b
τ a f , 1 = τ f 2 N 0 b 0
By assuming N 0 = 2 10 6 loading cycles, such strengths are equal to 177 MPa and τ a f , 1 = τ f 2 N 0 b 0 102 MPa, respectively. The ratio τ a f , 1 / σ a f , 1 is equal to 0.576 , that is, the material is considered sensitive to non-proportional loading, being such a value slightly lower than 1 / 3 . Further, also ν e f f is taken from Ref. [20].
The computed values of k and α for such a steel are equal to 0.3104 and 0.4814 , respectively.

4.1.2. Proportional Loading Tests Results

When loading components are in a constant proportion, such as in the case of the synchronous strain path IP where tension and torsion are in-phase, the damage parameter ε e q , a p , defined in Equation (5), is used [26]. Figure 4 shows the correlation between the experimental fatigue life, N f , e x p , and the computed fatigue life, N f , c a l .
As can be observed from Figure 4, all the results fall in scatter band 2 (defined by the dashed lines). The accuracy of the estimations is evaluated with the root mean square (RMS) error method [26]. The root mean square error, T R M S , is determined through the following relationship:
T R M S = 10 E R M S
where E R M S related to fatigue lifetime is computed as follows:
E R M S = l = 1 13 log 2 T e x p / T c a l l 13
For the synchronous strain path IP T R M S is equal to 1.21.

4.1.3. Non-Proportional Loading Tests Results

The computed values of φ i and Φ i are listed in Table 6 for each examined non-proportional loading condition. The computed values of both ε R E D , a and N f , c a l are also listed in such a table.
The correlation between the experimental fatigue life N f , e x p and the non-proportional damage parameter, ε R E D , a , are shown in Figure 5a, whereas the correlation between the experimental fatigue life N f , e x p and the damage parameter of Ref. [26], ε e q , a p , is shown in Figure 5b, together with the Manson-Coffin curves (see the black solid lines).
It can be noticed that, in Figure 5a, one third of the results are conservative, although also the majority of the non-conservative ones are very close to the Manson-Coffin curve. On the contrary, almost all the results determined by applying the criterion of Ref. [26] are non-conservative as shown in Figure 5b.
Figure 6 shows the correlation between the experimental fatigue life, N f , e x p , and the computed one, N f , c a l , obtained according to both the present RED criterion (see Figure 6a) and the criterion reported in Ref. [26] (see Figure 6b).
From Figure 6a, it can be noticed that all the results obtained through the present criterion fall into the scatter band 3 (defined by the dash-dot lines), with 86% of them into the scatter band 2 (defined by the dashed lines). On the contrary, only 76% of the estima-tions obtained according to the criterion of Ref. [26] falls into the scatter band 3, with 31% of them into the scatter band 2 (Figure 6b). Moreover, the estimations out of the scatter band 3 lie on the non-conservative side. The accuracy of the above criteria is evaluated by means of the root mean square error T R M S [26], whose values are reported in Table 7.
As can be observed, the RED criterion provides more accurate results with a T R M S = 1.68 , while a T R M S = 2.47 is achieved by applying the criterion of Ref. [26]. More in details, the best predictions are obtained for the loading paths ASN2a ( T R M S = 1.25 ) and ASN5 ( T R M S = 1.51 ) for the RED criterion and the criterion of Ref. [26], respectively, whereas the worst ones for the loading paths ASN3a ( T R M S = 2.18 ) and ASN1 ( T R M S = 3.85 ), respectively.

4.1.4. Comparison with Literature Data

Finally, the results of the 304 stainless steel specimens, available in the literature [29] and obtained by using two other criteria, that is, the Fatemi and Socie (FS) [30], and the Smith, Watson, and Topper (SWT) [31,32] ones, are here compared with the estimations performed through the present RED criterion. In Figure 7, the correlation between the experimental fatigue life N f , e x p and the computed one N f , c a l is plotted for the non-proportional loading and both FS and SWT criteria.
From Figure 7a, it can be noticed that almost all the results obtained through the FS criterion [29] fall into the scatter band 3, with 83% of them into the scatter band 2. On the other hand, 83% of the estimations obtained according to the SWT criterion [29] falls into the scatter band 3, with 53% of them into the scatter band 2 (Figure 7b). Moreover, the estimations out of the scatter band 3 lie the non-conservative side.
Regarding the accuracy, the root mean square error of the FS criterion is almost equal to that of the present criterion, that is, T R M S = 1.65 , whereas a slightly greater value is obtained for the SWT criterion, that is, T R M S = 1.85 .

4.2. 355 Structural Steel

4.2.1. Material Sensitivity to Non-Proportional Loading and RED Parameter Computation

The required input data for the present RED criterion related to the 355 structural steel are listed in Table 2. σ f , E , b , ε f and c are taken from Ref. [21], whereas τ f and γ f are computed as τ f = σ f / 3 and γ f = ε f / 3 , respectively, b 0 = b and c 0 = c are assumed, and G is determined as a function of the elastic modulus E . The fatigue strengths computed through Equations (11) by assuming N 0 = 2 10 6 loading cycles are equal to σ a f , 1 = 254.9 MPa and τ a f , 1 = 147.2 MPa. The ratio τ a f , 1 / σ a f , 1 is equal to 0.577 , that is, the material is considered sensitive to non-proportional loading. Further, ν e f f is taken from Ref. [16].
The computed values of k and α for such a structural steel are equal to 0.1931 and 0.4051 , respectively.

4.2.2. Proportional Loading Tests Results

Figure 8 shows the correlation between the experimental fatigue life, N f , e x p , and the computed one, N f , c a l , for the proportional loading IP.
As can be observed from Figure 8, all the results fall into the scatter band 2 (defined by the dashed lines). The accuracy of the estimations is evaluated by means of the root mean square error T R M S [26], which is equal to 1.72.

4.2.3. Non-Proportional Loading Tests Results

The computed values of φ i and Φ i are listed in Table 8 for each examined non-proportional loading condition. The computed values of both ε R E D , a and N f , c a l are also listed in such a Table.
The correlation between the experimental fatigue life N f , e x p and the non-proportional damage parameter, ε R E D , a , are shown in Figure 9a, whereas the correlation between the experimental fatigue life N f , e x p and the damage parameter of Ref. [26], ε e q , a p , is shown in Figure 9b, together with the Manson-Coffin curves (see the black solid lines).
It can be noticed that, in Figure 9a, about one third of the results are conservative, although also the non-conservative ones (with the exception of the values related to loading paths ASN2b and ASN4) are very close to the Manson-Coffin curve. On the contrary, almost all the results determined by applying the procedure proposed in Ref. [26] are non-conservative as shown in Figure 9b.
Figure 10 shows the correlation between the experimental fatigue life, N f , e x p , and the computed one, N f , c a l , obtained according to both the present RED criterion (see Figure 10a) and the criterion reported in Ref. [26] (see Figure 10b).
From Figure 10a, it can be noticed that all the results obtained through the present criterion fall into the scatter band 3 (represented by the dash-dot lines) with 92% of them into the scatter band 2 (represented by the dashed lines). On the contrary, only 61% of the estimations obtained according to the criterion of Ref. [20] falls into the scatter band 2, even if, almost all the results are within the scatter band 3 (Figure 10b).
The accuracy of the estimations is also evaluated by means of the root mean square error T R M S [26], whose values are reported in Table 9 for both criteria.
As can be observed, the RED criterion provides more accurate results with a T R M S = 1.52 , while a T R M S = 1.96 is achieved by applying the criterion of Ref. [26]. More in details, the best predictions are obtained for the loading paths ASN3b ( T R M S = 1.17 ) and ASN5 ( T R M S = 1.17 ) for the RED criterion and the criterion of Ref. [26], respectively, whereas the worst ones for the loading paths ASN5 ( T R M S = 1.97 ) and ASN2b ( T R M S = 2.35 ), respectively.

4.2.4. Comparison with Literature Data

Finally, the results of the 355 structural steel specimens, available in the literature [29] and obtained by using two other criteria, that is, the Fatemi and Socie (FS) [30], and the Smith, Watson, and Topper (SWT) [31,32] ones, are here compared with the estimations performed through the present RED criterion. In Figure 11, the correlation between the experimental fatigue life N f , e x p and the computed one N f , c a l are plotted for the non-proportional loading and both FS and SWT criteria. From Figure 11a), it can be noticed that only 16% of the results obtained through the FS criterion [29] falls into the scatter band 3 (with none of them into the scatter band 2), lying the others on the non-conservative side. For what concerns the SWT criterion [29], instead, almost all the estimations are out of the scatter band 3 on the non-conservative side (Figure 11b).
Regarding the accuracy, the root mean square error values related to both FS and SWT criteria are significantly greater ( T R M S = 3.59 and T R M S = 3.90 , respectively) than the values obtained by applying the present criterion, highlighting its better accuracy.

5. Conclusions

In the present paper, the novel Refined Equivalent Deformation (RED) criterion has been applied for the first time to estimate the fatigue lifetime of materials, sensitive to non-proportionality, subjected to asynchronous loading under multiaxial low-cycle fatigue regime. The present criterion is complete, taking into account: (i) the strain path orientation, by means of the parameter φ i , (ii) the degree of non-proportionality, by means of the parameter Φ i , and (iii) the changing of material cyclic properties under non-proportional loading, by means of the material constants k and α .
Testing results related to two metals have been examined to evaluate the accuracy of the criterion and a comparison with results, available in the literature and obtained through two other criteria, is performed. More precisely, the accuracy of the predictions has been evaluated by both plotting the estimated and experimental fatigue lives and employing the root mean square (RMS) error method.
For the examined 304 stainless steel, it has been observed that:
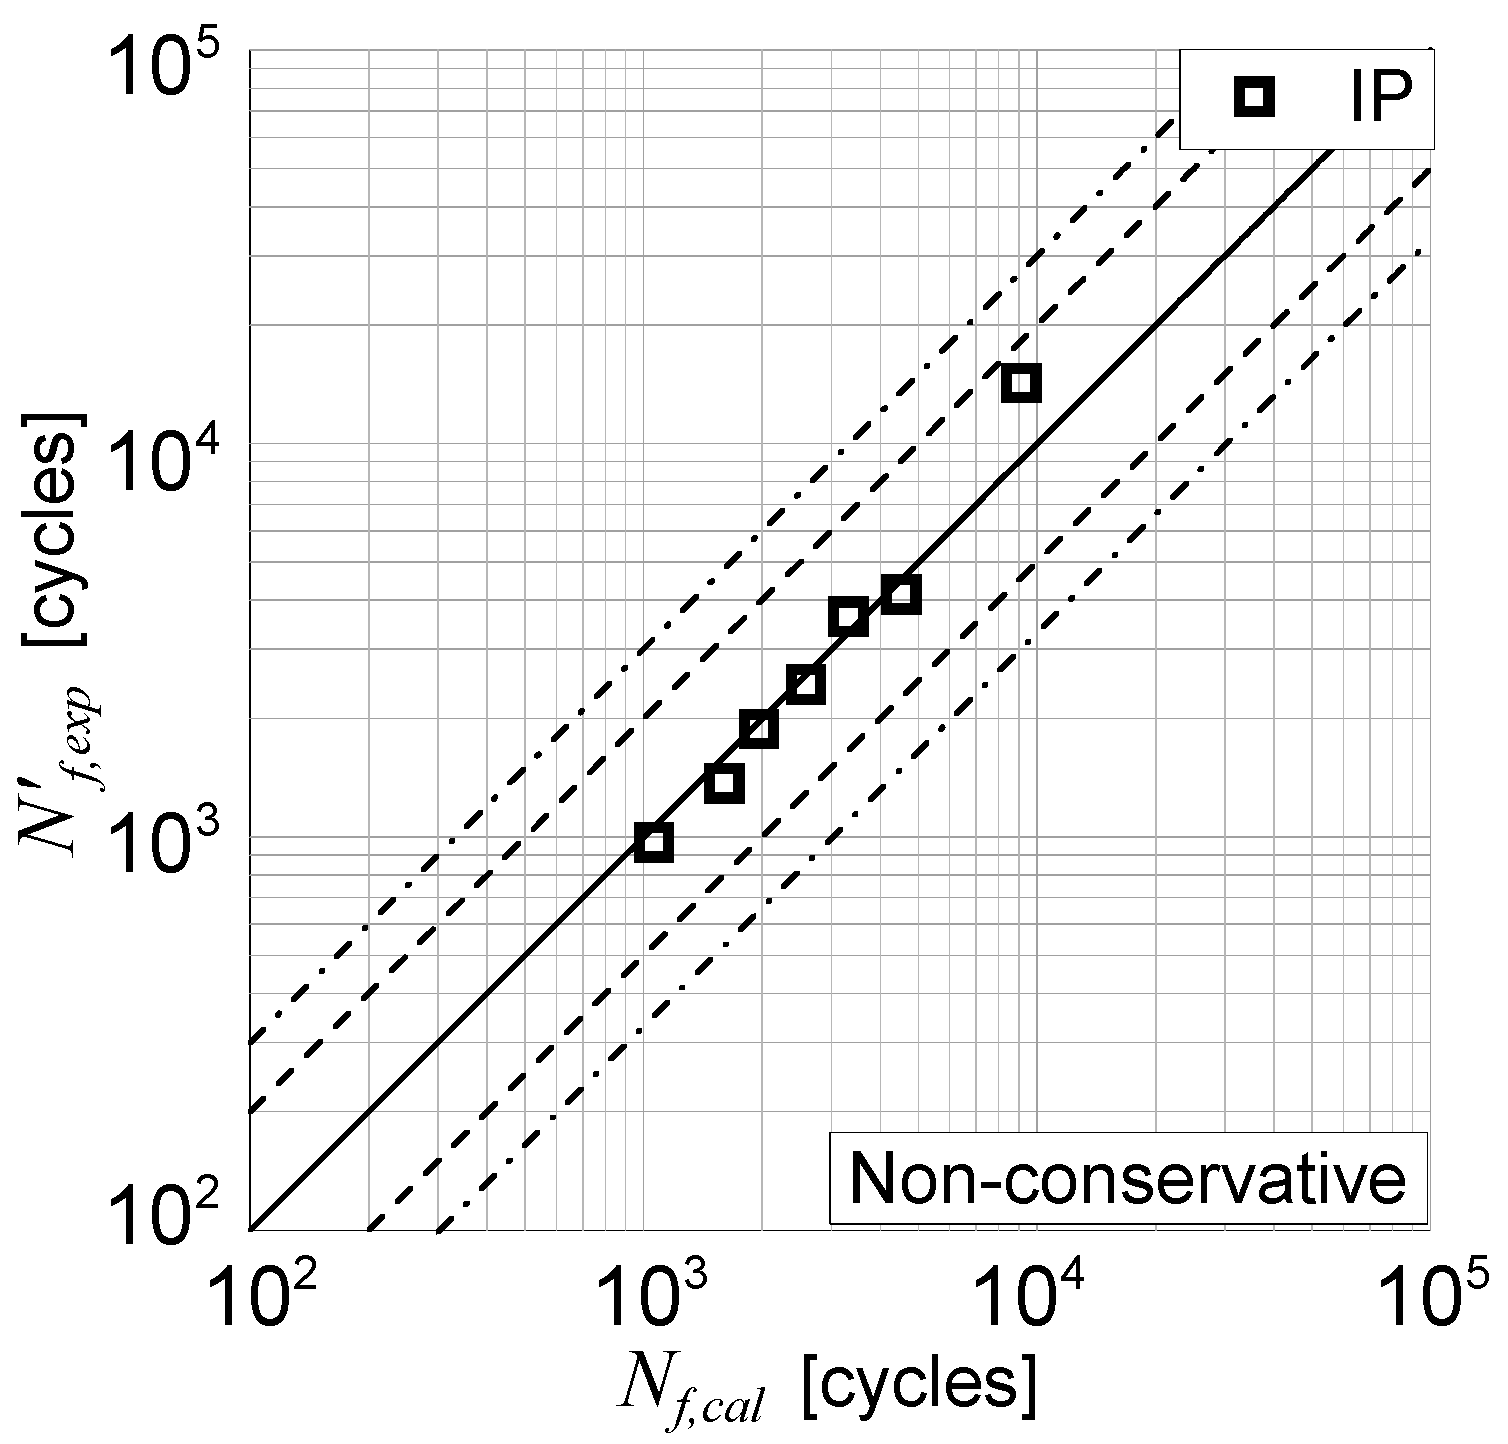
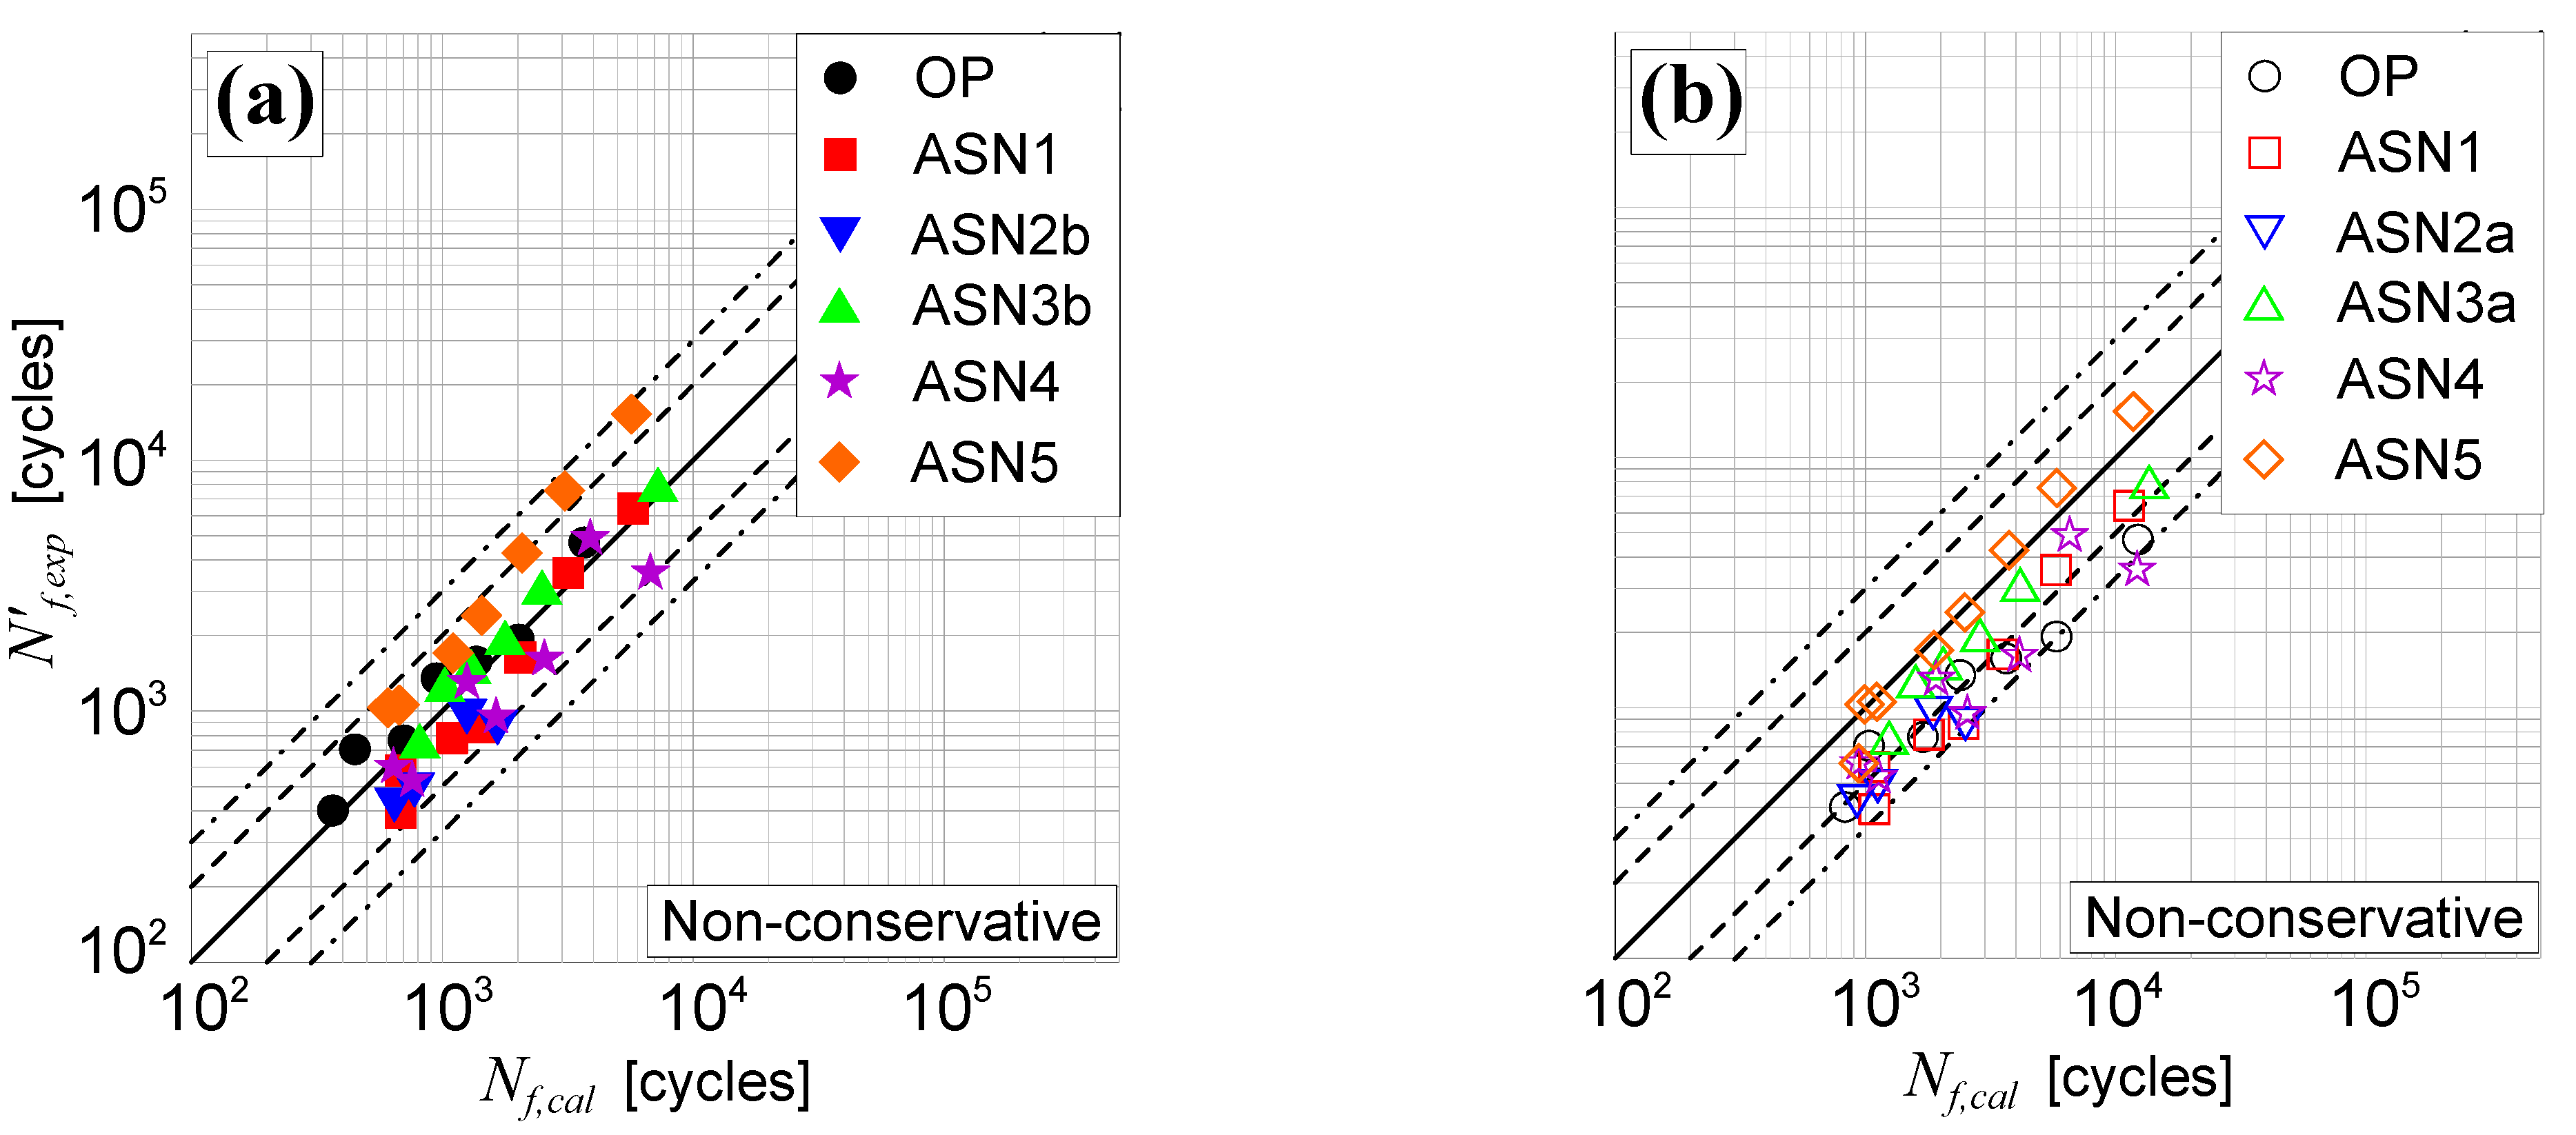
  • all the of the estimations fall into the scatter band 3, with 86% of them into the scatter band 2;
  • the T R M S value is 1.68;
  • the accuracy of the RED criterion, with a T R M S = 1.68 , is similar to that of the Fatemi-Socie (FS) criterion ( T R M S = 1.65 ) and slightly lower than that of the Smith, Watson and Topper (SWT) one ( T R M S = 1.85 ).
For the examined 355 structural steel, it has been observed that:
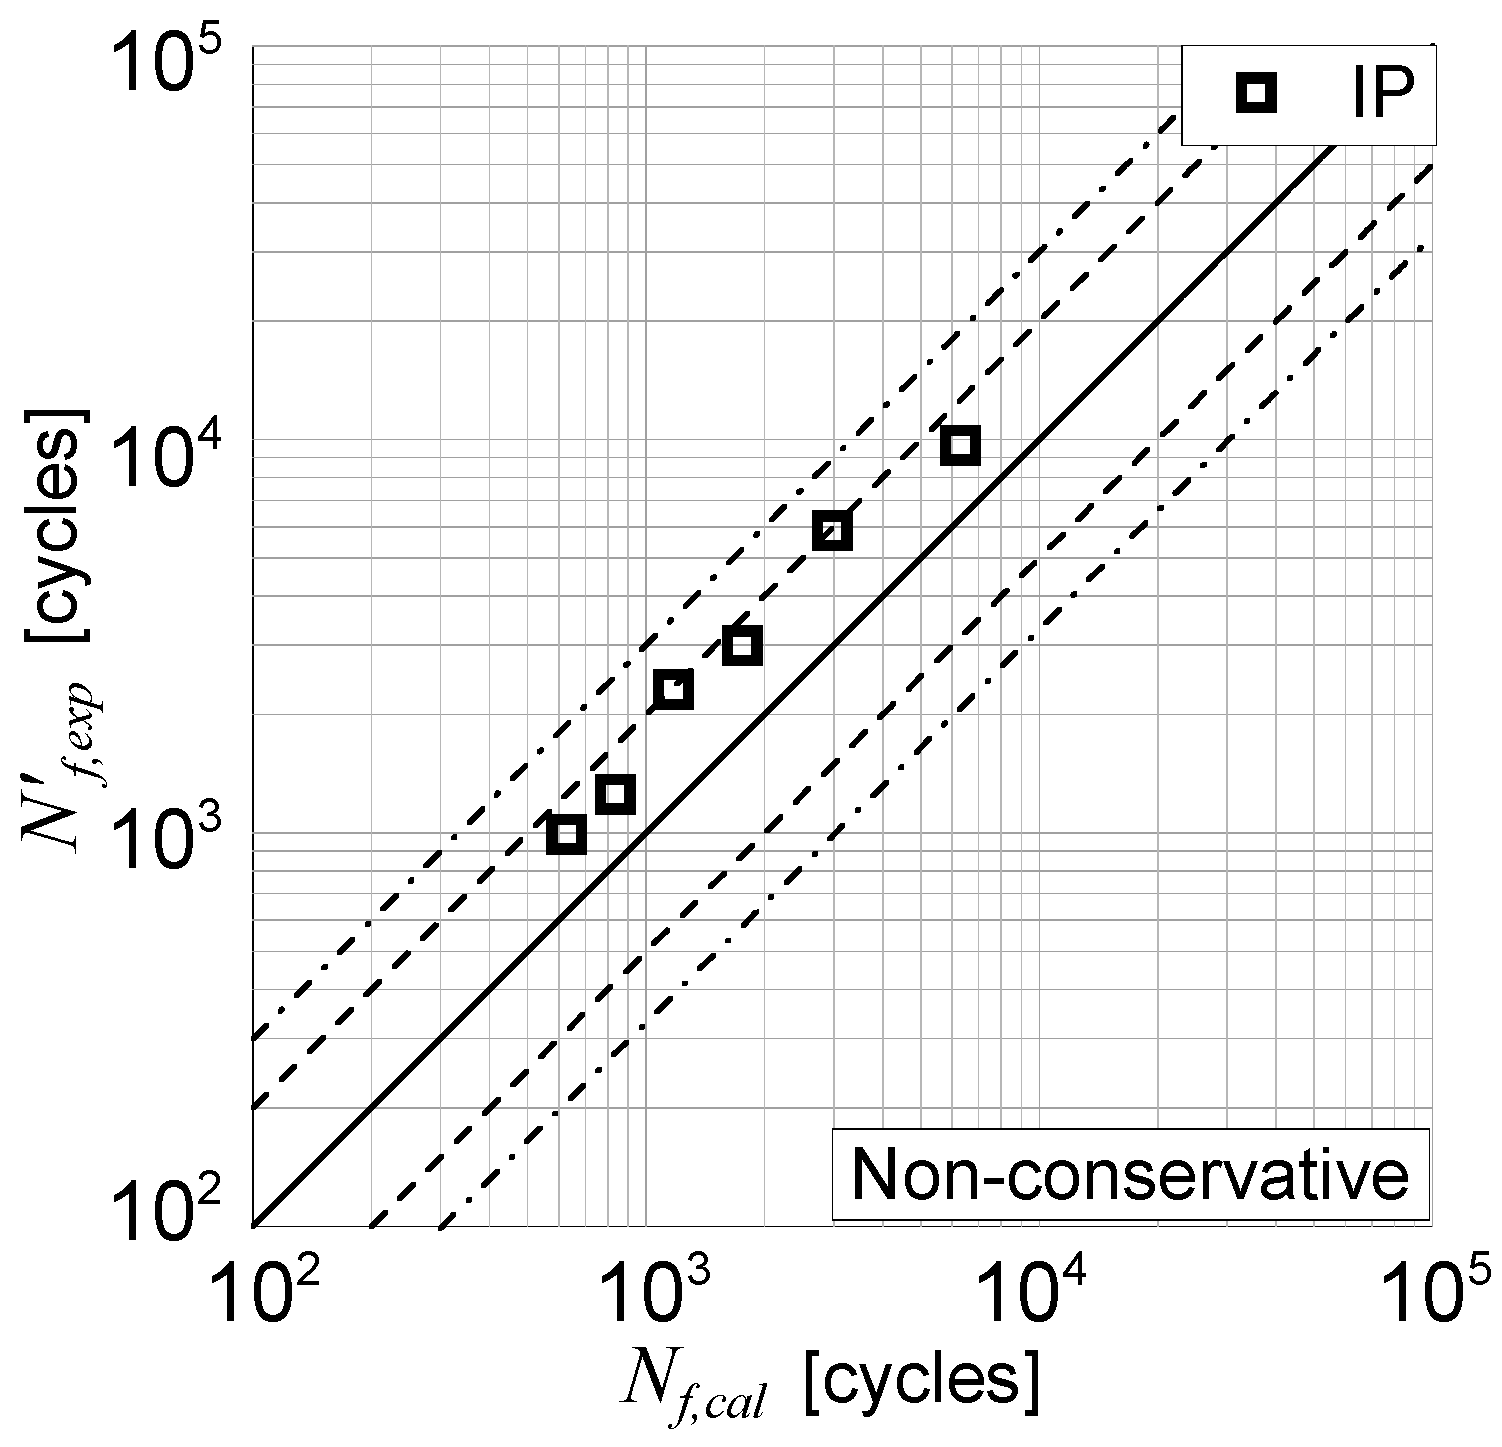
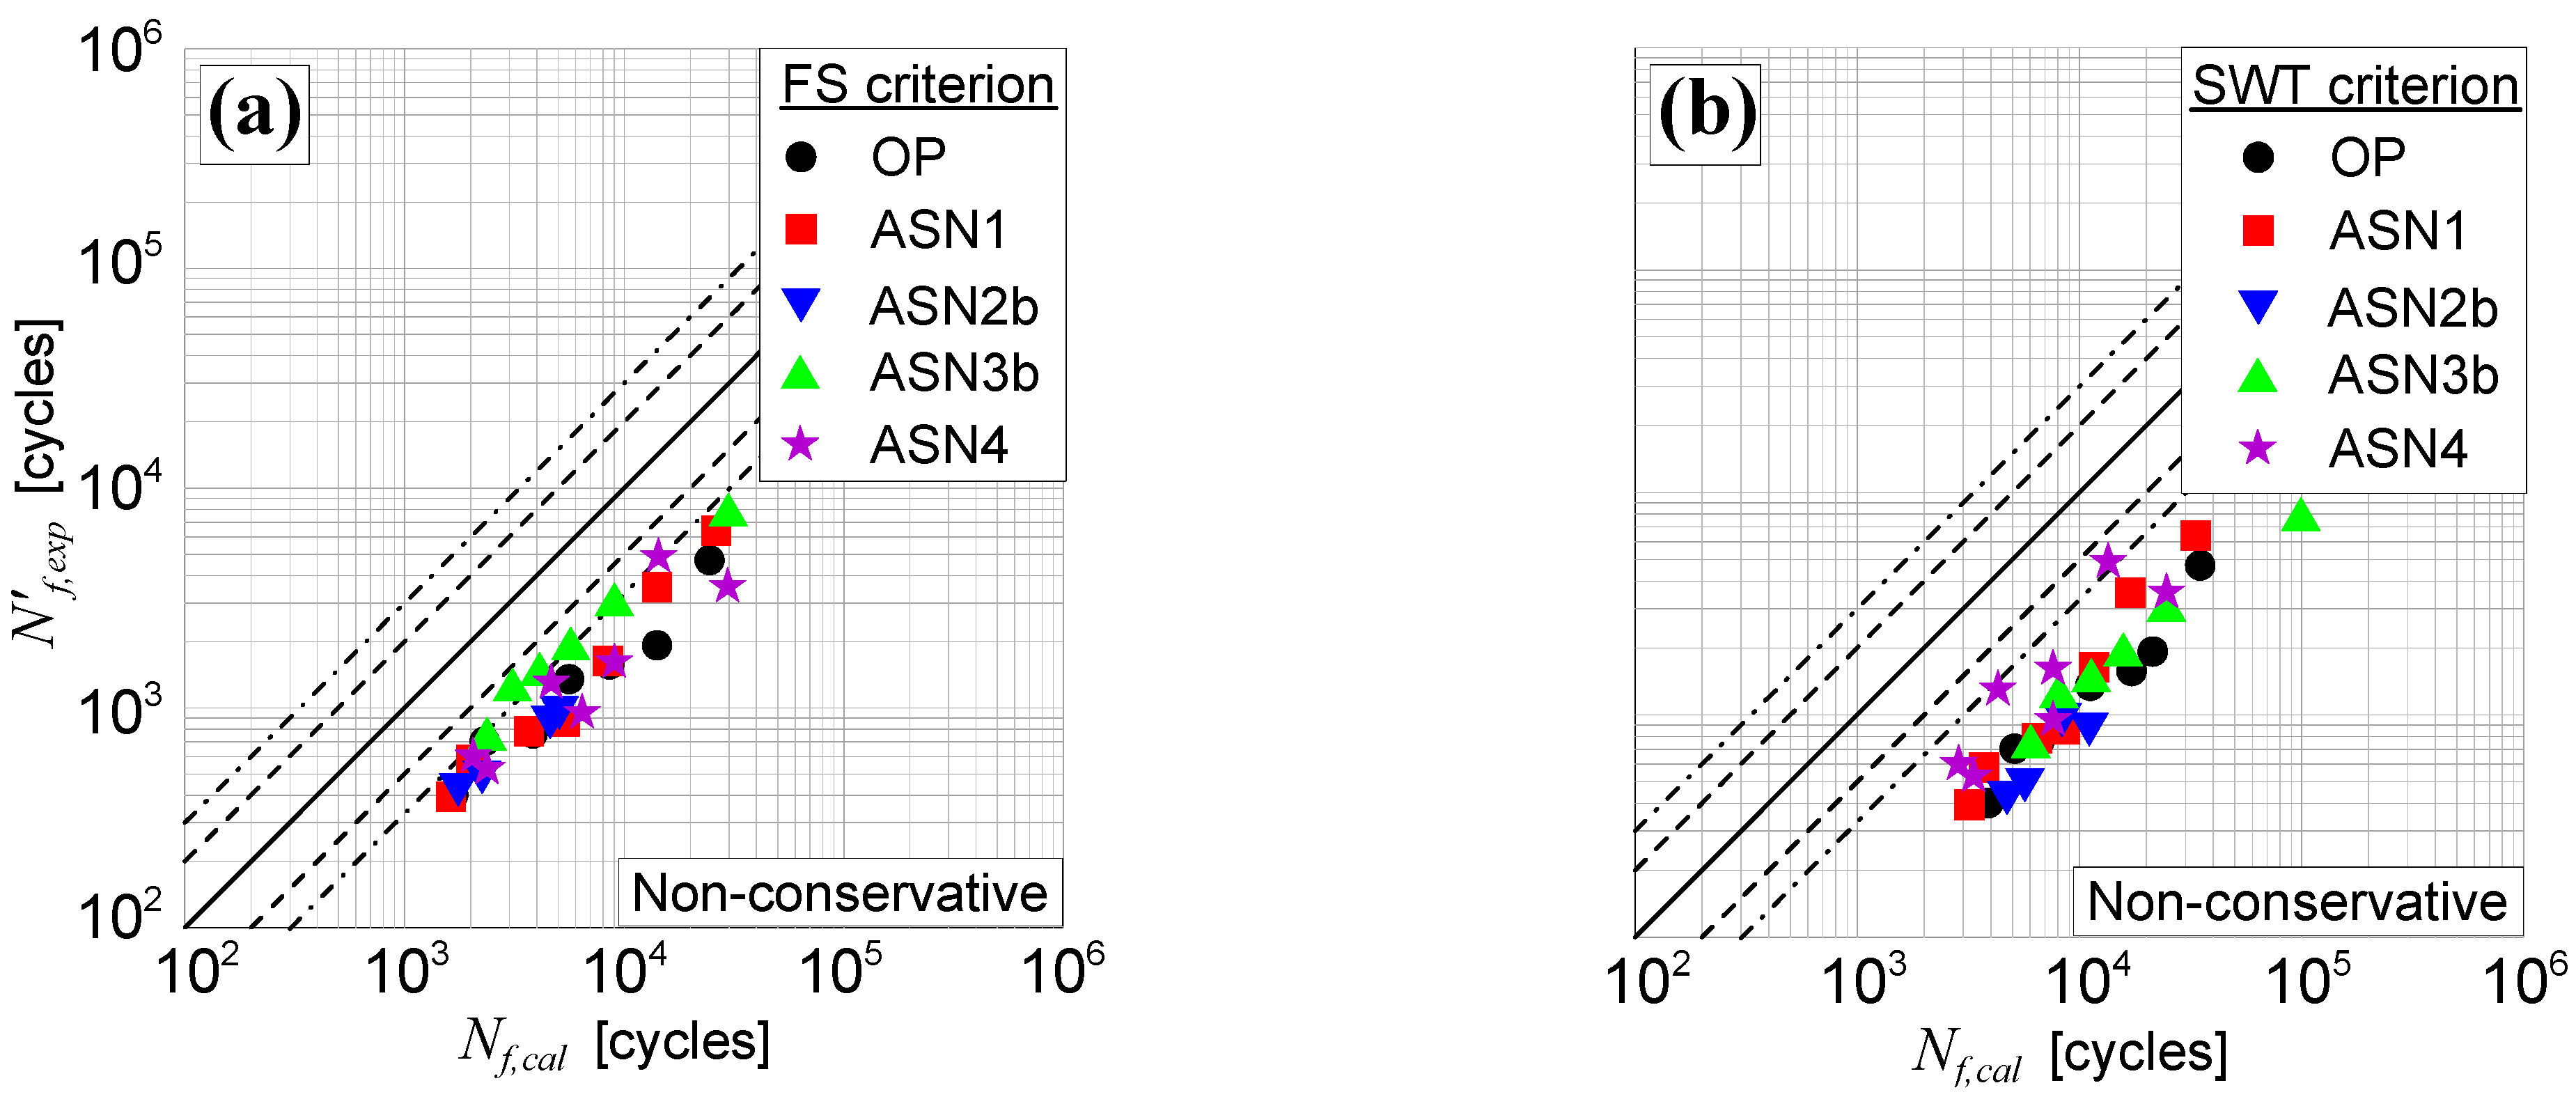
  • all the of the estimations fall into the scatter band 3, with 92% of them into the scatter band 2;
  • the T R M S value is 1.52;
  • the accuracy of the RED criterion, with a T R M S = 1.52 , is significantly better than that of both the FS criterion ( T R M S = 3.59 ) and the SWT one ( T R M S = 3.90 ).
In conclusion, the RED criterion has been validated for non-proportionality caused by both out-of-phase and asynchronous loading and it has been demonstrated that, in comparison with other criteria available in the literature, such a criterion holds a greater accuracy.

Funding

This research received no external funding.

Data Availability Statement

Data sharing not applicable.

Conflicts of Interest

The author declares no conflict of interest.

Nomenclature

1 , 2 , 3 directions of the principal strain axes at the time instant when ε 1 is maximum
E elastic modulus
k material constant representative of the material sensitivity to the change of fatigue properties
l i length of the path in the plane ε z γ z t / 3
N f , e x p experimental number of loading cycles to failure
N f , c a l number of loading cycles to failure
w normal vector to the critical plane
r t z fixed frame
S 0 , i area of the smallest circle which contains the i -th convex path
S i area enveloped by the i -th convex path
T R M S root mean square error
u v w local frame attached to the critical plane
α additional cyclic hardening coefficient
γ a torsional Manson–Coffin equation
γ z t , a amplitude of the applied shear strain
Δ critical plane
δ angle defining the normal to the critical plane
ε 1 , ε 2 , ε 3 principal strains
ε a tensile Manson–Coffin equation
ε e q , a p equivalent deformation amplitude for proportional loading
ε R E D , a refined equivalent deformation amplitude
ε z , a amplitude of the applied normal strain
η displacement vector on the critical plane
η N , a amplitude of the normal displacement vector η N
η C , a amplitude of the tangential displacement vector η C
ν e f f effective Poisson’s ratio
σ a f , 1 fully reversed normal strength
τ a f , 1 fully reversed shear strength
Φ i coefficient of non-proportionality of the i -th non-proportional strain path
φ i angle formed by the i -th non-proportional strain path with respect to the abscissa axis in the plane ε z γ z t / 3

References

  1. Skibicki, D. Phenomena and Computational Models of Non-Proportional Fatigue of Materials; Springer: London, UK, 2014. [Google Scholar]
  2. McDowell, D.L.; Stahl, D.R.; Stock, S.R.; Antolovich, S.D. Biaxial path dependence of deformation substructure of Type-304 Stainless-Steel. Metall. Mater. Trans. A 1988, 19, 1277–1293. [Google Scholar] [CrossRef]
  3. Jiao, F.; Osterle, W.; Portella, P.D.; Ziebs, J. Biaxial path-dependence of low-cycle fatigue behavior and microstructure of Alloy 800-H at room-temperature. Mater. Sci. Eng. A 1995, 196, 19–24. [Google Scholar] [CrossRef]
  4. Zhang, J.X.; Jiang, Y.Y. An experimental investigation on cyclic plastic deformation and substructures of polycrystalline copper. Int. J. Plast. 2005, 21, 2191–2211. [Google Scholar] [CrossRef]
  5. Nishino, S.; Hamada, N.; Sakane, M.; Ohnami, M.; Matsumura, N.; Tokizane, M. Microstructural study of cyclic strain-hardening behavior in biaxial stress states at elevated-temperature. Fatigue Fract. Eng. Mater. Struct. 1986, 9, 65–77. [Google Scholar] [CrossRef]
  6. Rios, E.R.; Andrews, R.M.; Brown, M.W.; Miller, K.J. Out-of-phase cyclic deformation and fatigue fracture studies on 316 stainless steel. In Biaxial and Multiaxial Fatigue, EGF 3; Mechanical Engineering Publications: London, UK, 1989. [Google Scholar]
  7. Bocher, L.; Delobelle, P.; Robinet, P.; Feaugas, X. Mechanical and microstructural investigations of an austenitic stainless steel under non-proportional loadings in tension-torsion-internal and external pressure. Int. J. Plast. 2001, 17, 1491–1530. [Google Scholar] [CrossRef]
  8. Vantadori, S. A novel multiaxial strain-based criterion considering additional cyclic hardening. Materials 2021, 14, 2542. [Google Scholar] [CrossRef]
  9. Ogawa, F.; Shimizu, Y.; Bressan, S.; Morishita, T.; Itoh, T. Bending and torsion fatigue-testing machine developed for multiaxial non-proportional loading. Metals 2019, 9, 1115. [Google Scholar] [CrossRef] [Green Version]
  10. Hu, D.; Pan, J.; Mi, D.; Mao, J.; Li, W.; Fu, Y.; Wang, R. Prediction of anisotropic LCF behavior for SLM Ti-6Al-4V considering the spatial orientation of defects. Int. J. Fatigue 2022, 158, 106734. [Google Scholar] [CrossRef]
  11. Zhan, L.; Wang, S.-Y.; Bruhns, O.T.; Xiao, H. High-efficiency algorithms for simulating metal failure effects under multiaxial repeated loadings. Int. J. Numer. Methods Eng. 2022, 123, 1277–1293. [Google Scholar] [CrossRef]
  12. Zhu, D.; Zhang, W.; Ding, Z. Dislocation Density Evolution in Low-Cycle Fatigue of Steels Using Dislocation-Based Crystal Plasticity. J. Eng. Mech. 2022, 148, 04021149. [Google Scholar] [CrossRef]
  13. Sun, T.; Xie, Y.; Pan, Y.; Zheng, Z.; Xie, C.; Huang, Z. Micromechanics-Based Low Cycle Fatigue Life Prediction Model of ECAPed Aluminum Alloy. Metals 2022, 12, 1127. [Google Scholar] [CrossRef]
  14. Anes, V.; Reis, L.; Freitas, M. Effect of Shear/Axial Stress Ratio on Multiaxial Non-Proportional Loading Fatigue Damage on AISI 303 Steel. Metals 2022, 12, 89. [Google Scholar] [CrossRef]
  15. Ellyin, F.; Gołoś, K.; Xia, Z. In phase and out-of-phase multiaxial fatigue. J. Eng. Mater. Technol. 1991, 113, 112–118. [Google Scholar] [CrossRef]
  16. Pejkowski, Ł.; Skibicki, D. Stress-strain response and fatigue life of four metallic materials under asynchronous loadings: Experimental observations. Int. J. Fatigue 2019, 128, 105202. [Google Scholar] [CrossRef]
  17. Zhou, J.; Huang, H.-Z.; Li, H. A novel energy-critical multiaxial fatigue life prediction for low cycle fatigue under mixed-mode loading. Metals 2018, 8, 1066. [Google Scholar] [CrossRef] [Green Version]
  18. Liu, J.; Zhang, Z.; Li, B.; Lang, S. Multiaxial fatigue life prediction of GH4169 alloy based on the critical plane method. Metals 2019, 9, 255. [Google Scholar] [CrossRef] [Green Version]
  19. Cruces, A.S.; Lopez-Crespo, P.; Bressan, S.; Itoh, T.; Moreno, B. On the Behaviour of 316 and 304 stainless steel under multiaxial fatigue loading: Application of the critical plane approach. Metals 2019, 9, 978. [Google Scholar] [CrossRef] [Green Version]
  20. Ronchei, C.; Carpinteri, A.; Scorza, D.; Zanichelli, A.; Vantadori, S. The RED criterion for fatigue life assessment of metals under non-proportional loading. Int. J. Fatigue 2022, 163, 107080. [Google Scholar] [CrossRef]
  21. Carvalho, D.; Silva, A.L.L.; Jesus, A.M.P.; Fernandes, A.A. Fatigue behaviour of structural steels. Comparison of strain-life and fatigue crack propagation data. Mecânica Exp. 2015, 25, 67–78. [Google Scholar]
  22. ASTM E739-10; Standard Practice for Statistical Analysis of Linear or Linearized Stress-Life (S-N) and Strain-Life (ε-N) Fatigue Data. ASTM International: West Conshohocken, PA, USA, 2015.
  23. Borodii, M.V. Analysis of experimental data on low-cycle fatigue in nonproportional deformation. Strength. Mater. 2000, 32, 7–12. [Google Scholar] [CrossRef]
  24. Borodii, M.V.; Strizhalo, V.A. Analysis of the experimental data on a low cycle fatigue under nonproportional straining. Int. J. Fatigue 2000, 22, 275–282. [Google Scholar] [CrossRef]
  25. Borodii, M.V. Obtaining a low-cycle fatigue strain criterion. Strength. Mater. 2001, 33, 217–223. [Google Scholar] [CrossRef]
  26. Vantadori, S.; Carpinteri, A.; Fortese, G.; Ronchei, C.; Scorza, D.; Zanichelli, A. Fatigue lifetime evaluation of notched components: Implementation of the control volume concept in a strain-based LCF criterion. Theor. Appl. Fract. Mech. 2018, 97, 400–408. [Google Scholar] [CrossRef]
  27. Araújo, J.A.; Dantas, A.P.; Castro, F.C.; Mamiya, E.N.; Ferreira, J.L.A. On the characterization of the critical plane with a simple and fast alternative measure of the shear stress amplitude in multiaxial fatigue. Int. J. Fatigue 2011, 33, 1092–1100. [Google Scholar] [CrossRef]
  28. Lagoda, T.; Kulesa, A.; Kurek, A.; Koziarska, J. Correlation of Uniaxial Cyclic Torsion and Tension-Compression for Low-Cycle Fatigue. Mater. Sci. 2018, 53, 522–531. [Google Scholar] [CrossRef]
  29. Pejkowski, Ł.; Seyda, J. Fatigue of four metallic materials under asynchronous loadings: Small cracks observation and fatigue life prediction. Int. J. Fatigue 2021, 142, 105904. [Google Scholar] [CrossRef]
  30. Fatemi, A.; Socie, D.F. A critical plane approach to multiaxial fatigue damage including out-of-phase loading. Fatigue Fract. Eng. Mater. Struct. 1988, 11, 149–165. [Google Scholar] [CrossRef]
  31. Smith, R.N.; Watson, P.; Topper, T.H. A stress–strain parameter for the fatigue of metals. J. Mater. 1970, 5, 767–778. [Google Scholar]
  32. Łagoda, T.; Vantadori, S.; Głowacka, K.; Kurek, M.; Kluger, K. Using the Smith-Watson-Topper Parameter and Its Modifications to Calculate the Fatigue Life of Metals: The State-of-the-Art. Materials 2022, 15, 3481. [Google Scholar] [CrossRef]
Figure 1. Geometry of the specimens made of (a) 304 stainless steel and (b) 355 structural steel (sizes in mm).
Metals 13 00636 g001
Figure 2. Strain paths examined [16] under proportional and non-proportional loading.
Metals 13 00636 g002aMetals 13 00636 g002b
Figure 3. Global, r t z , and local, u v w , frames.
Metals 13 00636 g003
Figure 4. Correlation between the experimental fatigue life, N f , e x p , of the 304 stainless steel specimens under proportional loading and the computational fatigue life, N f , c a l .
Metals 13 00636 g004
Figure 5. Correlation between the experimental fatigue life of the 304 stainless steel specimens under non-proportional loading and the strain amplitudes: (a) ε R E D , a (non-proportional damage parameter of the RED criterion) and (b) ε e q , a p   (proportional damage parameter of Ref. [26]).
Metals 13 00636 g005
Figure 6. Correlation between the experimental fatigue life of the 304 stainless steel specimens under non-proportional loading and theoretical one computed according to: (a) the presented RED criterion and (b) the criterion of Ref. [26].
Metals 13 00636 g006
Figure 7. Correlation between the experimental fatigue life of the 304 stainless steel specimens under non-proportional loading and computational one available in the literature [29] and obtained according to: (a) the FS criterion and (b) the SWT criterion.
Metals 13 00636 g007
Figure 8. Correlation between the experimental and computational fatigue life of the 355 structural steel specimens under proportional loading.
Metals 13 00636 g008
Figure 9. Correlation between the experimental fatigue life of the 355 structural steel specimens under non-proportional loading and the strain amplitudes: (a) ε R E D , a (non-proportional damage parameter of the RED criterion) and (b) ε e q , a p   (proportional damage parameter of Ref. [26]).
Metals 13 00636 g009
Figure 10. Correlation between the experimental fatigue life of the 355 structural steel specimens under non-proportional loading and theoretical one according to: (a) the present RED criterion and (b) the criterion of Ref. [26].
Metals 13 00636 g010
Figure 11. Correlation between the experimental fatigue life of the 355 structural steel specimens under non-proportional loading and theoretical one available in the literature [29] and computed according to: (a) the FS criterion and (b) the SWT criterion.
Metals 13 00636 g011
Table 1. Mechanical and fatigue properties of the 304 stainless steel (SS304) [20].
MATERIAL E σ y σ f b ε f c τ f G b 0 γ f c 0 ν e f f
[GPa][MPa][MPa][-][-][-][MPa][GPa][-][-][-][-]
Ref.[20][20][20][20][20][20] [20]
SS3041835501000−0.1140.171−0.40257768.3−0.1140.296−0.4020.34
Table 2. Mechanical and fatigue properties of the 355 structural steel (S355) [16,21].
MATERIAL E σ y σ f b ε f c τ f G b 0 γ f c 0 ν e f f
[GPa][MPa][MPa][-][-][-][MPa][GPa][-][-][-][-]
Ref.[16][16][21][21][21][21] [16]
S355208.63801001−0.090.608−0.61657879.0−0.091.053−0.6160.29
Table 3. Loading paths.
PATHTCTORIPOPASN1ASN2aASN2bASN3aASN3bASN4ASN5
λ = γ z t , a / ε z , a 0 3 3 3 3 / 2 3 3 / 2 2 3 3 3 / 5 3
f γ / f ε --1.001.000.504.004.000.200.256.000.70
β [°]--0900000000
Table 4. 304 stainless steel: synchronous (left) and asynchronous (right) loading conditions and experimental fatigue life.
PATH LOADING CONDITION ε z , a γ z t , a N f , e x p PATH LOADING
CONDITION
ε z , a γ z t , a N a , e x p N t , e x p N f , e x p
[-][-][cycles][-][-][cycles][cycles][cycles]
TC10.0040-9457ASN110.00280.0048596929852985
20.0050-250920.00320.0055318415921592
30.0055-187930.00400.00691019510510
40.0060-131640.00440.0076718359359
50.0065-113350.00480.0083736368368
60.0070-87560.00520.0090448224224
70.0080-56170.00560.0097429215215
TOR1-0.006950,395ASN2a10.00330.0029464518,5804645
2-0.008716,15320.00380.0033302612,1043026
3-0.0095927030.00470.0041123349301233
4-0.0104592040.00520.0045108543381085
5-0.0113476050.00560.00494921966492
6-0.0121344560.00610.00536042414604
7-0.0139287470.00660.00574121646412
IP10.00280.004914,255ASN3a10.00160.005453,65610,73110,731
20.00350.0061413620.00180.006229,09958205820
30.00390.0067362430.00220.007710,70821422142
40.00420.0073244040.00250.0085672713461346
50.00460.0080187950.00270.00934711942942
60.00490.0086137060.00290.01014231846846
70.00570.009896970.00310.01082508502502
OP10.00350.00612085ASN410.00310.0032553533,2075535
20.00400.006998720.00350.0036355021,2973550
30.00500.008762230.00440.0046142385351423
40.00550.009538840.00480.00509335598933
50.00600.010432550.00530.00557274359727
60.00650.011324660.00570.00595863513586
70.00700.012117070.00610.00643532115353
ASN510.00250.0043913063916391
20.00280.0049555138863886
30.00360.0061214114991499
40.00390.0068150610541054
50.00530.00911298909909
60.00460.0080998699699
70.00500.0086687481481
Table 5. 355 structural steel: synchronous (left) and asynchronous (right) loading conditions and experimental fatigue life.
PATH LOADING CONDITION ε z , a γ z t , a N f , e x p PATH LOADING CONDITION ε z , a γ z t , a N a , e x p N t , e x p N f , e x p
[-][-][cycles][-][-][cycles][cycles][cycles]
TC10.0020-38,545ASN110.00160.002812,81564076407
20.0030-753620.00200.0035710135503550
30.0040-559130.00240.00423269510510
40.0050-317840.00280.00481730359359
50.0060-184450.00320.00551565782782
60.0070-118760.00400.00691162581581
70.0080-85070.00440.0076789215215
TOR1-0.003579,399ASN2b10.00260.00448603440860
2-0.005211,20720.00290.00519513802951
3-0.0069306130.00370.00634841936484
4-0.0087283340.00400.00704231692423
5-0.01042439ASN3b10.00090.003331,98779977997
6-0.0121109020.00140.004912,46731173117
7-0.013987730.00160.0057785919651965
IP10.00210.0037968340.00190.0065603115081508
20.00280.0049586350.00210.0073511612791279
30.00350.0061299260.00240.00813050763763
40.00420.00732316ASN410.00180.0018355921,3543559
50.00490.0086125420.00220.0023488129,2834881
60.00570.009899130.00260.0027161696931616
OP10.00190.0033469740.00310.00329505700950
20.00240.0042192650.00350.0036130278121302
30.00290.0050157660.00440.00465303177530
40.00340.0059135170.00480.00506023609602
50.00390.0068765ASN510.00140.002521,80315,26215,262
60.00490.008570520.00180.003110,80375627562
70.00540.009440230.00210.0037608342584258
40.00250.0043343824072407
50.00280.0049242817001700
60.00360.0061151210581058
70.00390.0068147610331033
Table 6. 304 stainless steel: φ i , Φ i , ε R E D , a and N f , c a l values for each examined non-proportional loading condition.
PATH LOADING
CONDITION
φ i Φ i ε R E D , a N f , c a l
[rad][-][-][cycles]
OP12.370.620.00971207
22.370.620.0110840
32.370.620.0138431
42.370.620.0151336
52.370.620.0165262
62.370.620.0179206
72.370.620.0192171
ASN110.700.540.00713124
20.700.540.00812074
30.700.270.00911477
40.700.550.0112802
50.700.540.0121626
60.700.540.0131498
70.700.540.0142403
ASN2a10.470.360.00683553
20.470.360.00782335
30.470.360.00971229
40.470.360.0106921
50.470.360.0115734
60.470.360.0125578
70.470.360.0135465
ASN3a11.100.630.00732903
21.100.630.00831956
31.100.630.01021052
41.100.630.0113773
51.100.630.0123605
61.100.630.0133484
71.100.630.0142401
ASN410.560.370.00683545
20.560.370.00772453
30.560.370.00971215
40.560.370.0105945
50.560.370.0116712
60.560.370.0125579
70.560.370.0134471
ASN510.790.640.00723059
20.790.640.00812121
30.790.640.01021055
40.790.640.0111806
50.790.640.0150344
60.790.640.0131505
70.790.640.0141405
Table 7. Values for 304 stainless steel determined by applying the present RED criterion and the criterion of Ref. [26].
PATH T R M S
RED CriterionCriterion of Ref. [26]
OP1.401.683.662.47
ASN11.963.85
ASN2a1.252.13
ASN3a2.181.64
ASN41.291.89
ASN51.751.51
Table 8. 355 structural steel: φ i , Φ i , ε R E D , a and N f , c a l values for each examined non-proportional loading condition.
PATH LOADINGCONDITION φ i Φ i ε R E D , a N f , c a l
[rad][-][-][cycles]
OP12.370.620.00473683
22.370.620.00592016
32.370.620.00701367
42.370.620.0082949
52.370.620.0095701
62.370.620.0118448
72.370.620.0131366
ASN110.700.540.00405756
20.700.540.00493184
30.700.540.00592047
40.700.540.00681470
50.700.540.00771094
60.700.540.0096683
70.700.540.0096683
ASN2b10.820.440.00641661
20.820.440.00731254
30.820.440.0091775
40.820.440.0099645
ASN3b11.100.360.00377233
21.100.360.00542497
31.100.360.00621779
41.100.360.00721300
51.100.360.00801025
61.100.360.0089813
ASN410.560.380.00386745
20.560.370.00463886
30.560.370.00542551
40.560.370.00651639
50.560.370.00731253
60.560.370.0092760
70.560.370.0100637
ASN510.790.640.00405680
20.790.640.00503079
30.790.640.00592076
40.790.640.00691434
50.790.640.00771102
60.790.640.0097674
70.790.640.0102607
Table 9. Values for 355 structural steel determined by applying the present RED criterion and the criterion of Ref. [26].
PATH T R M S
RED CriterionCriterion of Ref. [26]
OP1.281.522.221.96
ASN11.402.20
ASN2b1.612.35
ASN3b1.171.47
ASN41.492.20
ASN51.971.17
Disclaimer/Publisher’s Note: The statements, opinions and data contained in all publications are solely those of the individual author(s) and contributor(s) and not of MDPI and/or the editor(s). MDPI and/or the editor(s) disclaim responsibility for any injury to people or property resulting from any ideas, methods, instructions or products referred to in the content.

