Article

A New Bending Force Formula for the V-Die Bending Process

by
Kongkiet Doungmarda
and
Sutasn Thipprakmas
*
Department of Tool and Materials Engineering, King Mongkut’s University of Technology Thonburi, Bangkok 10140, Thailand
*
Author to whom correspondence should be addressed.
Metals 2023, 13(3), 587; https://doi.org/10.3390/met13030587
Submission received: 27 December 2022 / Revised: 28 February 2023 / Accepted: 2 March 2023 / Published: 13 March 2023
(This article belongs to the Special Issue Sheet Metal Forming)

Abstract

:
The V-die bending force is an important parameter in respect of press machine capacity selection, but it has not been the focus of previous research. Furthermore, while the various modified formulas proposed in previous research were calculated using V-die bending theory, they are insufficient for predicting the actual V-die bending force. Based on the actual V-die bending mechanism, a new V-die bending force formula is proposed in this study, in which bending is generated not only in the bending allowance zone but also on the legs next to the bending allowance zone. Therefore, the bending force in these zones must be carefully considered. The finite element method (FEM) was used as an effective technique to clearly determine the actual V-die bending mechanism and to modify and develop a new V-die bending force formula. Laboratory experiments were carried out to validate the FEM simulation results as well as to confirm the accuracy of the proposed new V-die bending force formula. Two types of workpiece material, aluminum AA1100-O (JIS) and medium carbon-steel sheet-grade SPCC (JIS), were used as test materials. The results clearly show that the new V-die bending force formula offers more accuracy in V-die bending force prediction than predictions based on past formulas. The error in the V-die bending forces predicted using the new formula was approximately 5% compared with those of the experimental works.

1. Introduction

Metals are important materials that are still used in many industrial fields. To manufacture metal components whilst achieving the relevant product requirements and low production costs, process selection and working process parameter settings must be carefully considered. In terms of the sheet metal forming industry, in order to manufacture various curvature shapes, a die bending process is usually applied. However, the die bending process is classified based on curvature shapes, i.e., L-, V-, U-, and Z-bending processes [1]. The die bending types must be carefully selected and applied in order to manufacture products with various curvature shapes, whilst achieving the relevant product requirements and low production costs. In the past, much of the research in respect of die bending processes was carried out based on experimental works and numerical techniques. Spring-back, as a major problem that can degrade product quality, has mainly been studied [2,3,4,5,6,7,8,9,10,11,12,13,14,15,16,17,18,19,20]. Some research has been performed to improve the understanding of spring-back characteristics [2,3,4,5,6,7]. In warm forming conditions, Wang et al. [2] investigated the spring-back and neutral layer of AZ31B magnesium alloy V-bending. At rising temperatures and smaller punch radii, the neutral layer coefficient (k-value) decreased. This neutral layer shift led to a greater spring-back prediction. A material model that takes into account crucial material phenomena such as the Bauschinger effect, average Young’s modulus, elastic anisotropy, and plastic anisotropy was proposed by Sumikawa et al. [3]. The accuracy of the spring-back prediction using all four material behaviors was higher than that of conventional analyses. Li et al. [4] presented a comprehensive analysis of the impact of design and process parameters on twist spring-back. As an illustration, the angle of the twist spring-back is reduced the deeper the draw-bead depth. Thipprakmas and Komolruji [5] suggested that for the offset Z-bending process, in which the punch is moveable and the die is fixed, the amount of spring-back should not be equal to each other. In addition, the effects of the bend angle on the spring-back/spring-forward characteristics were also clearly identified by analyzing the changes in the stress distribution. Research has been conducted to examine spring-back properties in a variety of hard-to-form materials, such as high-strength steels, aluminum alloys and tailor welded blanks (TWBs) [8,9,10,11,12,13,14]. Zhang et al. [8] showed the tailor rolled blank (TRB) U-spring-back channel is directly proportional to the die clearance and inversely proportional to the length of the thickness transition zone, the thickness of the blank, and the friction coefficient. Wasif et al. [9] demonstrated that when bending JSC 440 steel into a V shape, thickness and width were the primary determinants of spring-back, whereas when bending JSC 590 steel, the change in blank width and the use of a hydraulic press with holding resulted in a negligible change in spring-back. It was demonstrated by Vorkov et al. [10] that a thorough experimental investigation of large-radius bending yields results regarding the impact of tool dimensions and material properties. When the ratio between the punch radius and the die opening is more than 1:4, it could be referred to as “big radius bending.” Additionally, earlier studies have suggested a number of methods to regulate and minimize the spring-back produced in die-bending processes [15,16,17,18,19,20]. In order to control spring-back and preserve a proper form of the inner bend radius of bent parts during the V-die bending process, Thipprakmas et al. [15,16] designed a coined-bead die. Nikhare [17] proposed a novel, patented method that uses rollers in the forming tool to eliminate spring-back. It was discovered that during the forming process, the rollers in the tool rotate, reducing the stress in the part and, consequently, the spring-back. Cheng et al. [18] proposed an innovative method of angle compensation based on the UDT (USTB-Durable T)-type angle adjustment method for efficiently controlling spring-back in a complex-sectional HSS roll forming process. Based on that research, the quality of bent products could be improved and the number of operations could be reduced. These improvements resulted in increases in productivity and decreases in production cost. In addition to that research, die bending force analyses have been conducted by some researchers [21,22,23]. Prediction of the die bending force is necessary for press machine capacity selection that reflects the production cost analysis. Excluding the traditional bending force based on the theory underlying the die bending process as shown in Equation (1) [23], the bending force formula has been modified to achieve more accuracy in bending force prediction [21,22]. Boljanovic [22] and Tekaslan [21] modified and proposed the die bending force formulas shown in Equations (2) and (3), respectively. By comparing the die bending force calculations to the experimental results shown in Figure 1, this die bending force calculations are not good enough for predicting the V-die bending force, particularly the maximum bending force. In recent years, numerical methods, such as the finite element method (FEM), have been successfully employed in metal forming operations [24,25,26,27,28,29]. It has been continually improved for both bulk metal forming processes and sheet metal forming processes. For instance, Shaikh et al. [24] used the Zener-Hollomon parameter to develop the strain-compensated Arrhenius-type model of the hot deformation behavior of 13CrMoNbV ferritic/martensitic steel. The anticipated and observed values of flow stress during hot compression at 1100–1275 °C and strain rates of 0.1–10 s−1 were well constrained by this model. According to Lin et al. [27], it is important to consider material characteristics (such as the Bauschinger effect and texture anisotropy) when running a spring-back simulation. The accuracy of spring-back prediction for materials (such as MP980) exhibiting a clear Bauschinger effect but insignificant texture anisotropy can be increased by choosing the appropriate yield criteria (for example, Hill48), taking into account elastic modulus degradation in combination with the Y-U model.
In terms of a die bending force calculation, although the FEM simulation could be used to predict it, the FEM simulation code and the processing time are needed. Both the production cost for commercial FEM code investment and the production time required for model preparation and process computation have increased as a result of these factors. Furthermore, it was unable to comprehend the die bending force in relation to the die bending mechanism and the bending process parameters by utilizing the FEM simulation technique. This results in a lack of understanding of how process variables affect the bending force of a die. In light of this, the goals of the present research are to (1) develop a new formula for calculating die bending force in relation to the V-die bending process with an error rate of less than 5% in comparison to experimental work, and (2) gain a clear understanding of the characteristics of die bending force in relation to die bending mechanisms as well as the effects of bending process parameters on die bending force in the V-die bending process.
F b = 1.33 σ u t s b T 2 l k
F b = 4 m σ u t s b T 2 4 c o s 2 φ 2 l k 2 R u d + R p + T s i n φ 2
F b = C × b T 2 σ u t s l k × 10
Here, as depicted in Figure 2,
b = width of the bend (mm), C = coefficient relation l k /T ( C = 1 + 4 × T l k )
F b = V-bending force (N), l k = V-die opening (mm)
m = correction coefficient hardening of the material ( m = 1.6 to 1.8)
T = material thickness (mm), R p = punch radius (mm)
R u d = die radius (mm), σ u t s = ultimate tensile strength (MPa)
φ = bend angle (ᵒ)
Figure 2. Illustration of a bending model and its parameters.
Metals 13 00587 g002

2. FEM Simulation Procedures

In the present research, in addition to reducing the number of experimental works, FEM simulation was used as a tool to clarify the bending mechanism related to the bending force calculation analysis. As shown in Figure 3, models of V-air bending (Figure 3a) and V-die bending (Figure 3b) were investigated. The symbols related to their uses based on past research, especially for the bend angle and V-punch angle, are clearly marked. The V-punch angle is marked with θ and the bend angle is marked with φ as shown in Figure 3(b2). These are related because the sum of these angles is 180°. A half-bending angle denoted by φ /2 was calculated using a half-V-shaped model, as shown in Figure 3(b3). In the present research, one direction of longitudinal bending in which the bend line is perpendicular to rolling and grain directions was focused on and investigated. Therefore, the two-dimensional plane strain model was applied, and the two-dimensional, implicit, quasi-static finite element method based on a commercial analytical code, DEFORM-2D, was used for the FEM simulation. In addition, the stress-strain curve for the rolling direction is required, and the stress-strain curves for other directions could be ignored. Therefore, the plastic properties of the workpiece are assumed to be isotropic and described by the von Mises yield function. Next, as shown in Table 1, the punch and die were set as rigid types, and the workpiece material was set as an elasto-plastic type with approximately 3500 rectangular elements. In addition, the adaptive remeshing technique was applied by setting every three steps to prevent a divergence calculation due to excessive deformation of the elements. The solution algorithm that was utilized in this FEM model is based on the Newton–Raphson iteration. As per the previous studies [5,16,30,31,32,33], the constitutive equations of materials, based on the elasto-plastic, power-exponent, isotropic hardening model and their properties derived from tensile testing data were used in this study. As per past research [5,16,30,31,32,33], based on the contact surface model defined by the Coulomb friction law, a friction coefficient (μ) of 0.10 was applied.

3. Experimental Procedures and Workpiece Characterization

The workpiece characterization was examined to obtain the important input information for FEM simulation such as Young’s modulus and the constitutive equation. Based on the dimensions of the ASTM standard (E8/E8M-13a), it had a gauge length of 50 mm. The tensile test specimen was created by using machining process. The tensile tests were also performed, following this standard, by using a five-ton universal testing machine with a test speed of 1 mm/min. Based on the tensile test data, the mechanical properties of Young’s modulus, Poisson’s ratio, and the ultimate tensile strength were examined. In addition, the constitutive equation of material based on the true stress-strain curve was created as listed in Table 1.
To validate the FEM simulation results, laboratory experiments were performed. As per the experiments in past research [16,30], Figure 4 shows the press machine, which includes a five-ton universal tensile testing machine (Lloyd Instruments Ltd., Hampshire, UK) and a set of V-bending dies. In the present research, in the experiments, five samples from each bending condition were used to inspect the obtained bend angles and bending force. The bend angle after unloading was measured using a profile projector (Mitutoyo Model PJ-A3000). The amount of spring-back was calculated based on the obtained bend angles, and the average spring-back values with the standard deviations (SDs) were reported. These were compared with the bend angles analyzed by the FEM simulation. The bending forces were also recorded and the average maximum bending force values with the standard deviations are reported. In practice, the magnitude of this force varies greatly with the amount of punch displacement. In the present research, the value of the maximum bending force was determined both experimentally and in the FEM simulation by setting the bending stroke where the gap between the punch and the die was equal to the material thickness, and then recording the maximum bending force. Again, the results were compared with the bending force analyzed by the FEM simulation.

4. Results and Discussion

4.1. Validation of the FEM Simulation

Although the commercial FEM code used in the present research is well-known and has been widely used in past research, validation of its use in the present research is still needed to clearly confirm the accuracy of V-die bending force prediction. The V-bending component geometries, especially for the bend angle and V-die bending force, are commonly used as the main indices by which to clearly validate the FEM simulation. Based on various types of material and bending process conditions, a comparison of the obtained bending angles from the FEM simulation and experimental results is shown in Figure 5. A comparison of the V-die bending forces from the FEM simulation and experimental results is also shown in Figure 5. As the results show, the average errors in respect of formed bending angles and V-die bending forces were both approximately 1%. These results are in agreement with past research [16,30] using the same commercial FEM code.

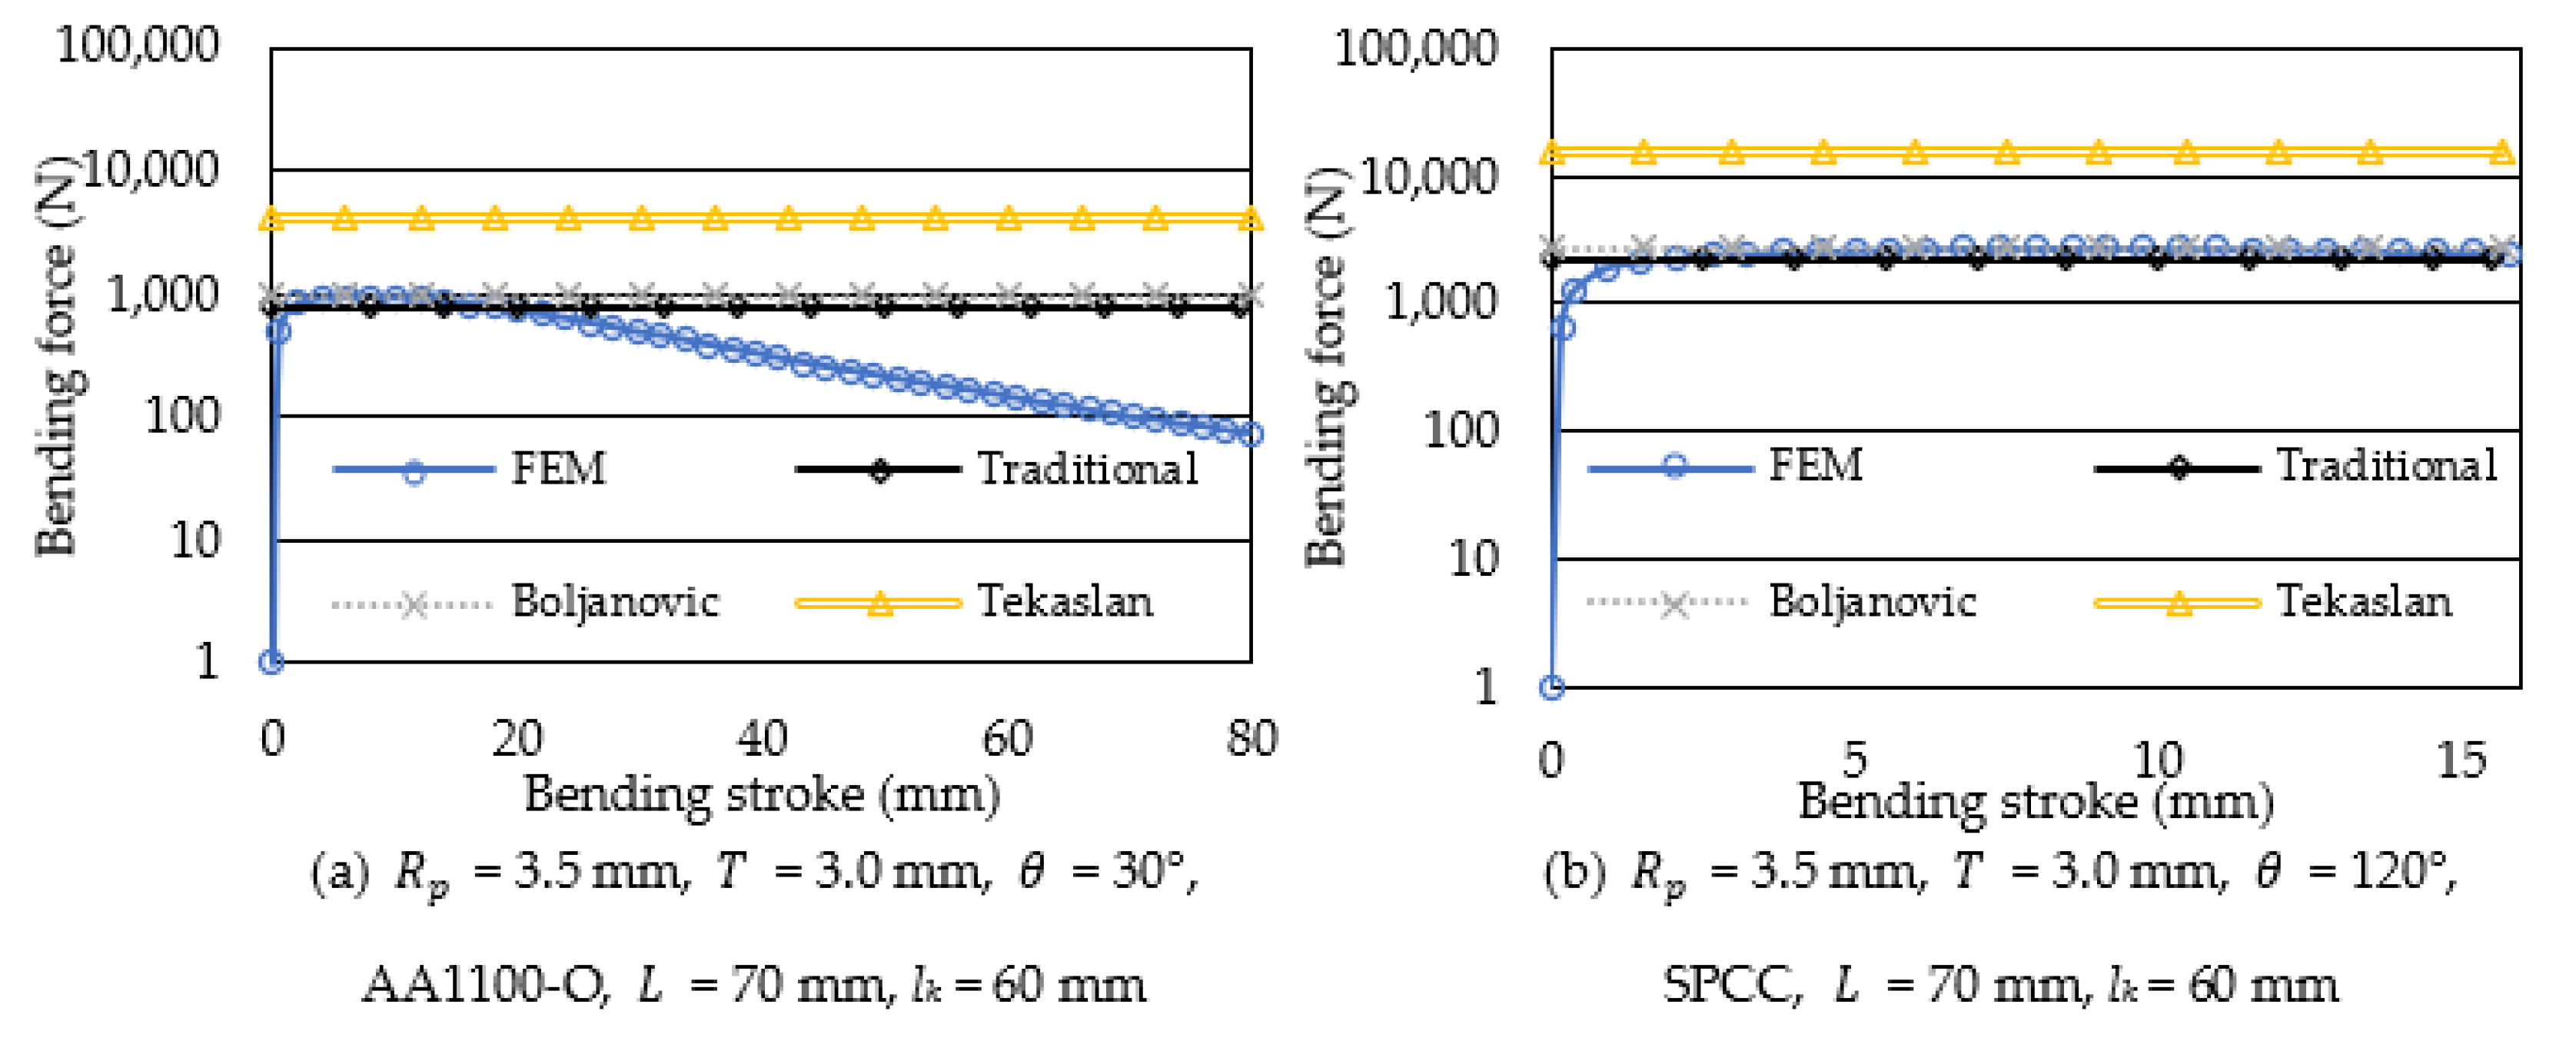
4.2. Comparison of Bending Force Obtained Using Bending Force Formula and FEM Simulation

As above mentioned, based on the traditional and modified V-die bending forces as listed in Equations (1)–(3), Figure 6 shows a comparison of bending forces obtained using the V-die bending force formulas and FEM simulation. The results show that the V-die bending forces predicted using the V-die bending force formulas do not completely agree with those predicted by FEM simulations. Although it is noted that the use of modified V-die bending force formulas achieved more accuracy in V-die bending force calculation compared with using the traditional V-die bending force formula, the errors for the calculated V-die bending forces were still very large compared with those predicted using FEM simulation. Namely, the V-die bending force calculated using the traditional V-die bending force formula was approximately 34.0 times less than that predicted using FEM simulation. After using the modified V-die bending force formulas of Boljanovic [22] and Tekaslan [21], the calculated values were less than those of FEM simulation prediction by approximately 27.4 and 4.9 times, respectively.
Next, as the same bending conditions and material types are used in the V-die bending process, an FEM simulation of the V-air bending process was also carried out. The predicted V-air bending forces compared with those calculated using traditional and modified V-die bending force formulas are shown in Figure 7. There is good agreement in respect of bending forces between the bending force formula values and the FEM simulation prediction. The average error in respect of the V-air bending force calculated using the V-die bending force formulas compared with that predicted using FEM simulation was approximately 1.5%. It was again noted that the use of modified V-die bending force formulas resulted in a smaller error. These results show that the use of V-die bending force formulas cannot be effective for the prediction of the bending force in the V-die bending process. However, they could be effectively used for prediction of the bending force in the V-air bending process. These results confirm that a V-die bending force formula is still lacking.

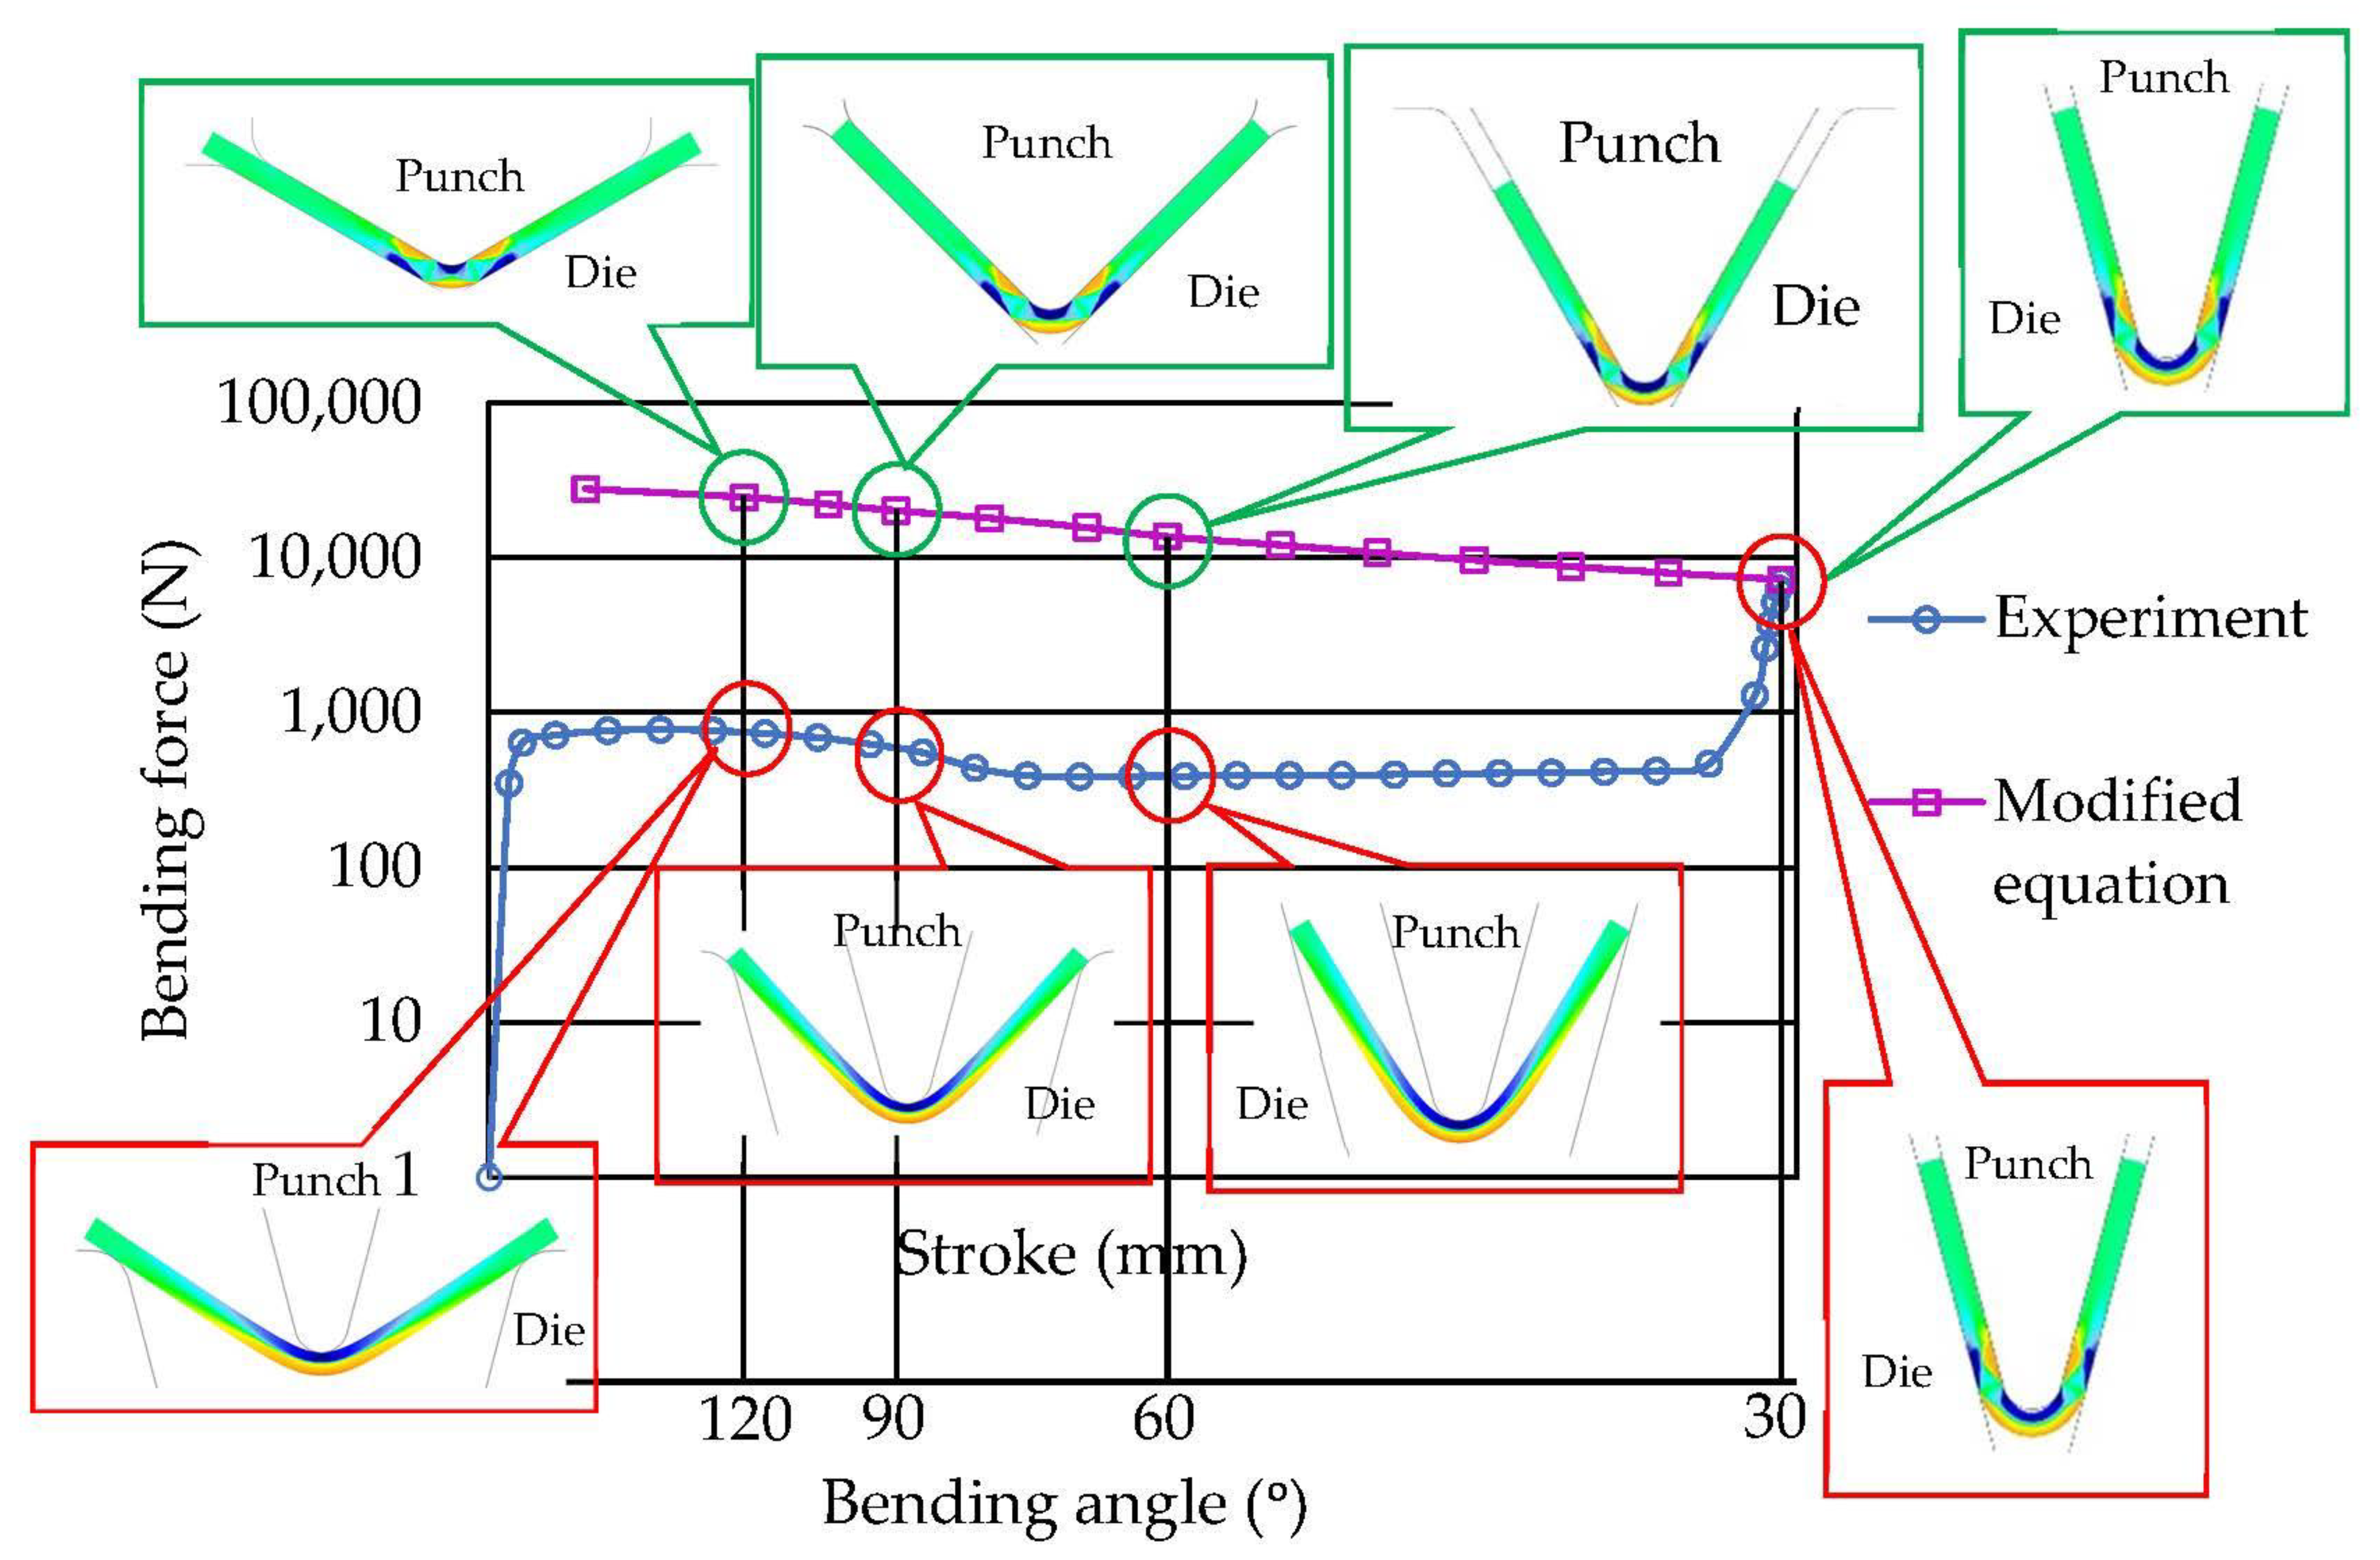
4.3. Proposed Concept for V-Die Bending Force Formula Improvement

To improve the V-die bending force formula, a different bending mechanism between the V-air and V-die bending processes must be clearly understood. Figure 8 shows a comparison of the bending mechanism between the V-air and V-die bending processes. As shown in Figure 8a, for a bending stroke of approximately 4 mm, the same manner of stress distribution analysis can be observed. The workpiece was bent based on a three-point bending mechanism in both the V-air and V-die bending processes. This bending mechanism agrees well with the bending theory and literature [15,16,30]. In terms of the bending force, the results again show the same manner of predicted bending force. The results were approximately 930 and 924 N in the case of the V-air and V-die bending processes, respectively. As the bending stroke increased, the workpiece was continuously bent by the three-point bending mechanism for both the V-air and V-die bending processes, and the same manner of stress distribution analysis could again be observed. As shown in Figure 8b, this resulted in increases in the bending allowance zone. Compression stress generated on the inner radius and tensile stress generated on the outer radius were also increased. Again, based on the same three-point bending mechanism in both the V-air and V-die bending processes, similar bending forces were predicted. These were approximately 972 and 966 N for the V-air and V-die bending processes, respectively. With a bending stroke of approximate 15.1 mm, the workpiece was continuously bent based on the three-point bending mechanism in the case of V-air bending process, as shown in Figure 8(c1). The bending allowance zone and the stress generated in this zone rarely changed. The bending force slightly decreased. In contrast, in the case of the V-die bending process shown in Figure 8(c2), the legs of the bent section made contact with the punch, and then the workpiece was not only bent based on a three-point bending mechanism. As the workpiece was bent on the bend radius, the legs were again bent towards the sides of the die simultaneously. A reversed bending allowance zone was formed on the legs of the bent sections, in addition to the bending allowance zone on the bend radius. This bending mechanism agreed well with the literature [15,16,30]. Based on these bending mechanisms, the bending force steeply increased to approximately 10,260 N. It was noted that the V-die bending force was approximately 12 times larger than the V-air bending force. With the end of the bending stroke as shown in Figure 8d, as the same manner of bending mechanism was used for the previous bending stroke, the V-air bending process exhibited only the three-point bending mechanism but the V-die bending process exhibited the reversed bending mechanism in addition to the three-point bending mechanism. The V-air bending force slightly decreased to approximately 852 N. In contrast, owing to the legs making full contact with the punch and die, the reversed bending stresses were steeply increased. Therefore, the V-die bending force significantly increased to approximately 27 kN. This was approximately 32 times larger than the V-air bending force. These results clearly show that, in order to calculate the V-die bending force, consideration is required not only of the force required to form the bending allowance zone on the bend radius, but also the force required to form the reversed bending allowance zone on the legs.

4.4. Effects of V-Die Bending Parameters on Reversed Bending Allowance Zone

4.4.1. Effects of Punch Radius on Reversed Bending Allowance Zone

Figure 9 shows a comparison of the stress distribution analyses for the workpiece before unloading with respect to the punch radius. The larger the punch radius applied, the larger the bending allowance zone generated. In addition, the reversed bending allowance zone decreased as the punch radius increased. This resulted in the differences in the calculated V-die bending forces. These types of stress distribution analyses, and zones of bending and reversed bending, agree well with bending theory and the literature [15,16,30]. The results show the decrease in the V-die bending force as the punch radius increases.

4.4.2. Effects of V-Punch Angle on Reversed Bending Allowance Zone

Figure 10 shows a comparison of the stress distribution analyses for the workpiece before unloading with respect to the V-punch angle. The results show that the larger the V-punch angle applied, the smaller the bending allowance zone generated. In addition, the reversed bending allowance zone increased as the V-punch angle increased. Again, this resulted in differences in the calculated V-die bending forces. These types of stress distribution analyses and zones of bending and reversed bending agree well with bending theory and the literature [15,16,30]. The results show the increase in the V-die bending force as the V-punch angle increases.

4.4.3. Effects of Workpiece Thickness on Reversed Bending Allowance Zone

Figure 11 shows a comparison of the stress distribution analyses for the workpiece before unloading with respect to the workpiece thickness. The results show that the bending allowance zone slightly increased as the workpiece thickness increased. In contrast, the reversed bending allowance zone largely increased as the workpiece thickness increased. Again, this resulted in differences in the calculated V-die bending forces. These types of stress distribution analyses and zones of bending and reversed bending agree well with bending theory and the literature [15,16,30]. The results show the increases in the V-die bending force as the workpiece thickness increases.

4.4.4. Effects of Workpiece Length on Reversed Bending Allowance Zone

Figure 12 shows a comparison of the stress distribution analyses for the workpiece before unloading with respect to workpiece length. The results show the same types of stress distribution analyses with respect to workpiece length. Furthermore, the areas of the bending and reversed bending allowance zones are similar. These types of stress distribution analyses and zones of bending and reversed bending agree well with bending theory and the literature [15,16,30]. Therefore, this resulted in the same calculated V-die bending forces. However, in this instance, as the sample length increased, the distance between supports increased in order to achieve complete V-die bending. As a result, the longer sample had a longer bending stroke than the smaller sample.

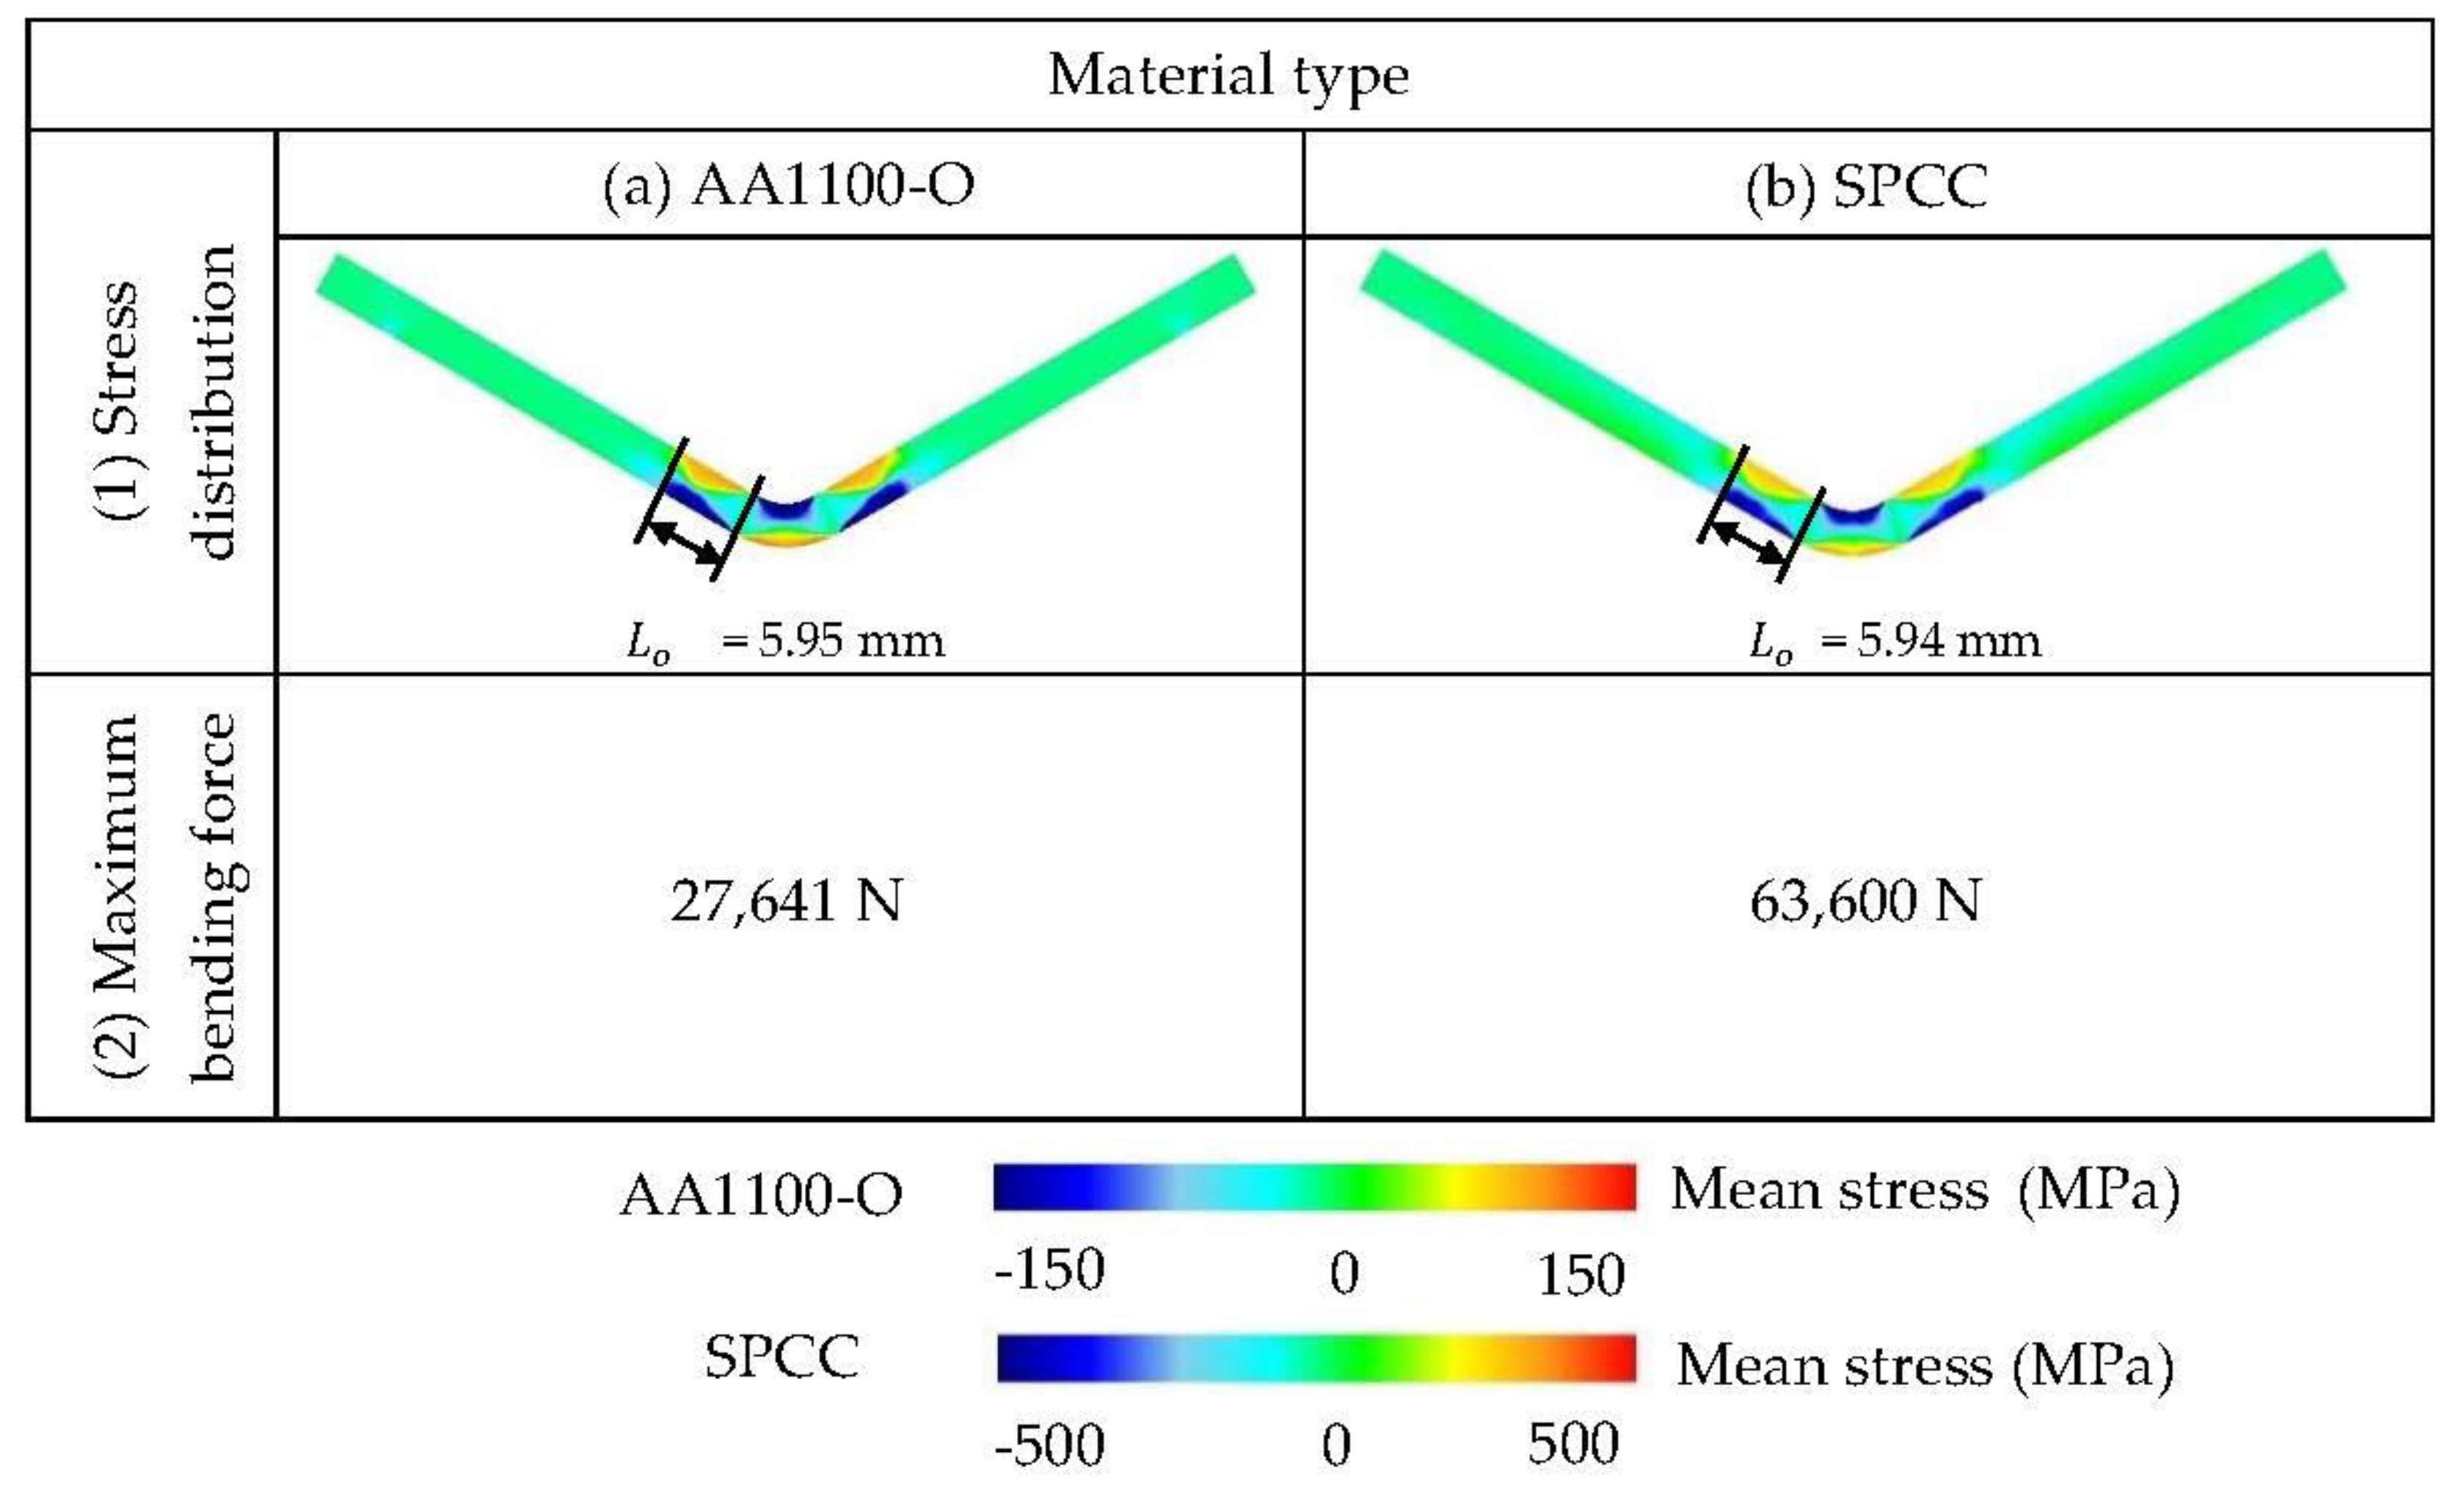
4.4.5. Effects of Material Type on Reversed Bending Allowance Zone

Figure 13 shows a comparison of the stress distribution analyses for the workpiece before unloading with respect to material type. The results show the different types of stress distribution analyses. The generated stresses for the bending and reversed bending allowances in the case of SPCC were larger than those in the case of AA1100-O. However, the areas of the bending and reversed bending allowance zones were similar. These types of stress distribution analyses and zones of bending and reversed bending agree well with bending theory and the literature [15,16,30]. Due to the differences in mechanical properties, i.e., ultimate tensile strength, the difference in calculated V-die bending forces can be noted.
As per bending theory and the literature [15,16,30], the results again confirm the effects of the V-die bending parameters on the stress distribution and bending allowance. They also clearly show the effects of the V-die bending parameters on the stress value and bending allowance zone and its size. The punch radius, V-punch angle, and workpiece thickness had significant effects on the size of the reversed bending allowance zone. The material type did not have any effect on the size of the reversed bending allowance zone, but it had a significant effect on the generated stress value in this zone.

4.5. Modified V-Die Bending Force Formula

As mentioned previously, the V-die bending force should not be only considered in terms of the bending allowance zone on the bend radius, but also in terms of the reversed bending allowance zones on the legs. In the present research, a new formula that includes the bending force on the reversed bending allowance zones was proposed. To derive a new formula, the fundamental concept for V-die bending force calculation shown in Equation (1) was considered. The new formula consists of two terms of bending forces applied for the bending allowance zone and the reversed bending allowance zone. In terms of the bending force on the bending allowance zone, the Boljanovic equation as shown in Equation (2) was selected [22]. As per previous research [21,22], this equation was derived based on the V-air bending mechanism. The calculated bending forces were also validated by experiments and their errors were approximately less than 10%. Therefore, this equation can be used for the calculation of the bending force on the bending allowance zone, where only the bending mechanism of V-air bending is generated.
Next, in terms of the bending force on the reversed bending allowance zones, as shown in Figure 8, the relationship between the V-die bending force and the bending stroke determines that the maximum V-die bending force is generated at the end of bending stroke before unloading. It can be observed that, by comparing it with the V-air bending process, the V-die bending force was much higher than that due to the formation of reversed bending allowance zones. Therefore, the area of the reversed bending allowance zones is the key factor related to the V-die bending force. Owing to the fact that the contacted zones were slightly increased step-by-step by the bending stroke, the generated stress was not uniform in this zone. At the end of the bending stroke before unloading, the legs made full contact with the punch and die. Specifically, the reversed bending allowance zones also made full contact with the punch and die. At this stage, the bending system was static and in equilibrium. Therefore, to simplify the calculation, the bending stress can be assumed to be a uniform loading. Therefore, at the end of the bending stroke before unloading, we can estimate the force used for making full contact with the punch and die based on a uniform loading contact, and the formula can be derived as shown in Equation (4).
Next, there were not any thickness changes in these zones, and the yield strength ( σ y ) was used as the normal pressure (P). The areas of these zones can be calculated based on the width of the bend (b) and the length of the reversed bending allowance zones ( L o ) as shown in Equation (5). To calculate the force in the punch movement direction, this calculated force must be modified by the bend angle as shown in Equation (6). In addition, there are two sides of the leg; therefore, this quantity is duplicated as shown in Equation (7). Finally, the new formula for V-die bending force calculation can be achieved as shown in Equation (8).
F r e v e r s e   b e n d i n g = P A
F r e v e r s e   b e n d i n g = σ y L o b
Here,
P = yield strength ( σ y ), A = reverse bending area = L o b
F r e v e r s e   b e n d i n g = σ y L o b cos φ 2
F r e v e r s e   b e n d i n g = 2 σ y L o b cos φ 2
F b = 4 m σ u t s b T 2 4 c o s 2 φ 2 l k 2 R u d + R p + T s i n φ 2 + 2 σ y L o b c o s φ 2
Hence,
b = width of the bend (mm), F b = V-bending force (N)
l k = V-die opening (mm)
m = correction coefficient hardening of the material ( m = 1.6 to 1.8)
T = material thickness (mm), R p = punch radius (mm)
R u d = die radius (mm), σ u t s = ultimate tensile strength (MPa)
σ y = yield strength (MPa), φ = bend angle (ᵒ)
L o = length of reversed bending allowance zone (mm)
As mentioned previously, the length of the reversed bending allowance zone directly relates to the V-die bending process parameters, including punch radius, bend angle, and workpiece thickness. Based on the FEM simulation technique in association with statistical techniques, the recommended length of the reversed bending allowance zone used for V-die bending force calculation can be obtained as shown in Table 2. It is noted that data that are not listed in this table can be estimated by the interpolating technique.
However, the modified V-die bending force formula mentioned above still has limitations. As per the main objective of the present research, to find out the value of the maximum bending force during the bending process of a V-die bending tool, the bending mechanism at the bending stroke where the maximum bending force was generated was focused on. This bending stroke was the stroke at the end of the bending phase, namely, before removing the tool. The bending mechanism at this bending stroke showed a complete difference from the previous bending stroke. Therefore, the limitation of the use of this modified V-die bending force formula was that the bending force for any bending angle corresponding to any bending stroke could not be accurately calculated. Figure 14 shows the comparison of the bending force calculated by the modified V-die bending force formula and obtained by FEM simulation during the bending process and at the complete bending stage. With the same bending angle, in the case of calculation during the bending process, the calculated bending force obtained by the modified V-die bending force formula showed a large error when compared with that obtained by FEM simulation. In contrast, in the case of the calculation at the complete bending stage, they were the same level of bending force with a small error. These results again confirmed and well corresponded with the above explanation, as well as clearly showing the limitations of the use of the modified V-die bending force formula. In addition, the influence of friction coefficient was also investigated based on the range of friction coefficient of 0.05–0.15 which was generally applied for sheet-metal forming process [15,17,19,27,28]. As shown in Figure 15, the maximum bending forces were slightly different. They were approximately 16,000 N, 16,300 N, and 17,200 N, respectively, in the case of friction coefficients of 0.05, 0.10, and 0.15. Therefore, the friction coefficient has not been included in the bending formula. The disadvantage of the developed formula was also the limited shape of the cross-section of the workpiece. This bending formal could not be possible to apply for bent parts with arbitrary cross-sections. However, these limitations are in the process of being addressed, and they will be reported in future works.

4.6. Confirmation of Uses of New V-Die Bending Force Formula

To confirm the uses of the new formula for V-die bending force calculation, three V-die bending conditions with two types of material, as listed in Table 3, were investigated based on the experimental works. Three V-die bending force values calculated using the traditional formula, the Boljanovic formula, and new formula were calculated and compared with the V-die bending forces obtained in experimental works. The calculated V-die bending forces agreed well with the experimental works, as well as with the theory behind V-die bending and the literature [15,16,30]. Specifically, for a material with a higher ultimate tensile strength, a higher calculated V-die bending force was obtained. In addition, as the material thickness increased, the calculated V-die bending force increased. Again, these results agree well with the theory behind V-die bending and the literature [30,31]. However, by using the traditional and Boljanovic V-die bending force formulas, the calculated V-die bending forces were much smaller than those of experimental works (over 8 times smaller). In contrast, by using the new V-die bending force formula, the calculated V-die bending force was closer to those of the experimental works. An error of less than 5% could be achieved. These results clearly show that the new V-die bending force formula can be suitably applied for V-die bending force calculation.

5. Conclusions

To determine the press machine capacity in the V-die bending process, the V-die bending force is important. Specifically, the more accurately the V-die bending force is calculated, the more precise the proper selection of the press machine capacity can be. In the present research, by using FEM and laboratory experiments, a new V-die bending force formula was proposed. The results could be concluded as follows:
The V-die bending forces calculated in the past using the traditional and modified V-die bending force formulas have large errors compared with those of experimental works. This evidence shows that those V-die bending force formulas cannot be effective for calculating the bending force in the V-die bending process.
There was a difference in bending mechanisms between the V-air and V-die bending processes. Specifically, the bending allowance zone on the bend radius was formed in the case of the V-air bending process; in contrast, a reversed bending allowance zone on the legs was also formed in the case of the V-die bending process.
Based on this finding, a new V-die bending force formula must be calculated by combining two terms: the bending force on the bending allowance zone on the bend radius and the bending force on the reversed bending allowance zone on the legs.
Only the length of the workpiece and the type of material did not have any effect on the length of the reversed bending allowance zone. Therefore, the recommended lengths of the reversed bending allowance zone related to the other V-die bending process parameters were listed. Using this length, the new V-die bending force formula could be fully used to calculate the V-die bending force.
The errors of bending forces calculated using the traditional formula and Boljanovic formula were approximately more than 600% when compared to the bending force obtained by experiments. In contrast, by using the new formula derived in this present research, the error of bending force was approximately less than 5% when compared to experimental results.

Author Contributions

Conceptualization, K.D. and S.T.; data curation, K.D. and S.T.; funding acquisition, S.T.; investigation, K.D.; methodology, K.D. and S.T.; project administration, S.T.; supervision, S.T.; writing—original draft, K.D.; writing—review and editing, S.T. All authors have read and agreed to the published version of the manuscript.

Funding

This research was funded by The “The Petchra Pra Jom Klao Master Scholarship” from King Mongkut’s University of Technology Thonburi, and Thailand Science Research and Innovation (TSRI) under Fundamental Fund 2022 (Project: Advanced Materials and Manufacturing for Applications in new S-curve industries).

Institutional Review Board Statement

Not applicable.

Informed Consent Statement

Not applicable.

Data Availability Statement

Not applicable.

Acknowledgments

The authors would especially like to express their gratitude to Arkarapon Sontamino, Department of Mechanical Engineering Technology, College of Industrial Technology, King Mongkut’s University of Technology, North Bangkok, for support with experiments in the present research.

Conflicts of Interest

The authors declare no conflict of interest.

References

  1. Lange, K. Handbook of Metal Forming; McGraw-Hill Inc.: New York, NY, USA, 1985. [Google Scholar]
  2. Wang, L.; Huang, G.; Zhang, H.; Wang, Y.; Yin, L. Evolution of springback and neutral layer of AZ31B magnesium alloy V-bending under warm forming conditions. J. Mater. Process. Technol. 2013, 213, 844–850. [Google Scholar] [CrossRef]
  3. Sumikawa, S.; Ishiwatari, A.; Hiramoto, J.; Urabe, T. Improvement of springback prediction accuracy using material model considering elastoplastic anisotropy and Bauschinger effect. J. Mater. Process. Technol. 2016, 230, 1–7. [Google Scholar] [CrossRef]
  4. Li, H.; Sun, G.; Li, G.; Gong, Z.; Liu, D.; Li, Q. On Twist springback in advanced high-strength steels. Mater. Des. 2011, 32, 3272–3279. [Google Scholar] [CrossRef]
  5. Thipprakmas, S.; Komolruji, P. Analysis of bending mechanism and spring-back characteristics in the offset Z-bending process. Int. J. Adv. Manuf. Technol. 2016, 85, 2589–2596. [Google Scholar] [CrossRef]
  6. Panthi, S.K.; Ramakrishnan, N.; Ahmed, M.; Singh, S.S.; Goel, M.D. Finite element analysis of sheet metal bending process to predict the springback. Mater. Des. 2010, 31, 657–662. [Google Scholar] [CrossRef]
  7. Lee, J.; Bong, H.; Lee, Y.; Kim, D.; Lee, M. Pulsed electric current V-Bending springback of AZ31B magnesium alloy sheets. Metall. Mater. Trans. A. 2019, 50A, 2720–2731. [Google Scholar] [CrossRef]
  8. Zhang, H.; Liu, L.; Hu, P.; Liu, X. Springback characteristics in U-channel forming of tailor rolled blank. Acta Metall. Sin. 2012, 25, 207–213. [Google Scholar]
  9. Wasif, M.; Iqbal, S.A.; Tufail, M.; Karim, H. Experiment analysis and prediction of springback in V-bending process of high-tensile strength steels. Trans. Indian Inst. Met. 2020, 73, 285–300. [Google Scholar] [CrossRef]
  10. Vorkov, V.; Aerens, R.; Vandepitte, D.; Duflou, J.R. Experimental investigation of large radius air bending. Int. J. Adv. Manuf. Technol. 2017, 92, 3553–3569. [Google Scholar] [CrossRef]
  11. Leu, D.K.; Zhuang, Z.W. Springback prediction of the vee bending process for high-strength steel sheets. J. Mech. Sci. Technol. 2016, 30, 1077–1084. [Google Scholar] [CrossRef]
  12. Zhang, Y.; Xu, X. Predicting springback radii and angles in air bending of high-strength sheet steel through gaussian process regressions. Int. J. Interact. Des. Manuf. 2022, 16, 863–870. [Google Scholar] [CrossRef]
  13. Lee, J.; Lee, K.; Kim, D.; Choi, H.; Kim, B. Spring-back and spring-go behaviors in bending of thick plates of high-strength steel at elevated temperature. Comput. Mater. Sci. 2015, 100, 76–79. [Google Scholar] [CrossRef]
  14. Karabulut, S.; Esen, I. Finite element analysis of springback of high-Strength Metal SCGA1180DUB while U-channeling according to wall angle and die radius. Res. Rev. J. Mater. Sci. 2022, 10, 1–25. [Google Scholar]
  15. Thipprakmas, S. Finite element analysis of sided coined-bead technique in precision V-bending process. J. Adv. Manuf. Technol. 2013, 65, 679–688. [Google Scholar] [CrossRef]
  16. Thipprakmas, S.; Sontamino, A. Influence of coined-bead die on spring-back characteristics in V-die bending process using the finite element method. Proc. Inst. Mech. Eng. B J. Eng. Manuf. 2021, 235, 1351–1362. [Google Scholar] [CrossRef]
  17. Nikhare, C. Springback reduction by using tool rollers. Int. J. Precis. Eng. Manuf. 2020, 21, 67–74. [Google Scholar] [CrossRef]
  18. Cheng, J.J.; Cao, J.G.; Zhao, Q.F.; Liu, J.; Yu, N.; Zhao, R. A novel approach to springback control of high-strength steel in cold roll forming. Int. J. Adv. Manuf. Technol. 2020, 107, 1793–1804. [Google Scholar]
  19. Lawanwong, K.; Hamasaki, H.; Hino, R.; Yoshida, F. Double-action bending for eliminating springback in hat-shaped bending of advanced high-strength steel sheet. Int. J. Adv. Manuf. Technol. 2020, 106, 1855–1867. [Google Scholar] [CrossRef]
  20. Ouakdi, E.H.; Louahdi, R.; Khirani, D.; Tabourot, L. Evaluation of springback under the effect of holding force and die radius in a stretch bending test. Mater. Des. 2012, 35, 106–112. [Google Scholar] [CrossRef]
  21. Tekaslan, Ö.; Gerger, N.; Şeker, U. Determination of spring-back of stainless steel sheet metal in “V” bending dies. Mater. Des. 2008, 29, 1043–1050. [Google Scholar] [CrossRef]
  22. Boljanovic, V. Sheet Metal Forming Processes and Die Design; Industrial Press Inc.: South Norwalk, CT, USA, 2014; pp. 61–70. [Google Scholar]
  23. Wick, C.; Benedict, T.; Veilleux, F. Tool and Manufacturing Engineers Handbook Volume II, Forming, 4th ed.; SME: Dearborn, MI, USA, 1984. [Google Scholar]
  24. Shaikh, A.; Churyumov, A.; Pozdniakov, A.; Churyumova, T. Simulation of the hot deformation and fracture behavior of reduced activation Ferritic/Martensitic 13CrMoNbV steel. Appl. Sci. 2020, 10, 530. [Google Scholar] [CrossRef] [Green Version]
  25. Renault, C.; Churyumov, A.; Pozdniakov, A.; Churyumova, T. Microstructure and hot deformation behavior of FeMnAlCMo steel. J. Mater. Res. Technol. 2020, 9, 4440–4449. [Google Scholar] [CrossRef]
  26. Prosviryakov, A.; Mondoloni, B.; Churyumov, A.; Pozdniakov, A. Microstructure and hot deformation behaviour of a novel Zr-Alloyed High-Boron steel. Metals 2019, 9, 218. [Google Scholar] [CrossRef] [Green Version]
  27. Lin, J.; Hou, Y.; Min, J.; Tang, H.; Carsley, J.E.; Stoughton, T.B. Effect of constitutive model on springback prediction of MP980 and AA6022-T4. Int. J. Mater. Form. 2020, 13, 1–13. [Google Scholar] [CrossRef]
  28. Choi, J.; Lee, J.; Bong, H.; Lee, M.; Barlat, F. Advanced constitutive modeling of advanced high strength steel sheets for springback prediction after double stage U-draw bending. Int. J. Solids. Struct. 2018, 151, 152–164. [Google Scholar] [CrossRef]
  29. Trzepiecinski, T.; Lemu, H.G. Effect of computational parameters on springback prediction by numerical simulation. Metals 2017, 7, 380. [Google Scholar] [CrossRef] [Green Version]
  30. Thipprakmas, S. Finite element analysis on the coined-bead mechanism during the V-bending process. Mater. Des. 2011, 32, 4909–4917. [Google Scholar] [CrossRef]
  31. Phanitwong, W.; Boochakul, U.; Thipprakmas, S. Design of U-geometry parameters using statistical analysis techniques in the U-bending process. Metals 2017, 7, 235. [Google Scholar] [CrossRef]
  32. Sontamino, A.; Thipprakmas, S. Development of a shaving die design for reducing rollover. Int. J. Adv. Manuf. Technol. 2019, 103, 1831–1845. [Google Scholar] [CrossRef]
  33. Thipprakmas, S.; Sontamino, A. Fabrication of clean cut surface on high strength steel using a new shaving die design. J. Mech. Sci. Technol. 2020, 34, 301–317. [Google Scholar] [CrossRef]
Figure 1. Comparison of the bending force obtained through experiments and calculated using formulas based on past research ( R p = 3.5 mm, T = 3.0 mm, θ = 120°, AA1100-O, L = 70 mm, lk = 60 mm).
Metals 13 00587 g001
Figure 3. The model of V-air and V-die bending.
Metals 13 00587 g003
Figure 4. Press machine and set of V-bending dies.
Metals 13 00587 g004
Figure 5. Comparison of V-bending shapes from FEM simulation and experimental results (AA1100-O, L = 70 mm, lk = 60 mm).
Metals 13 00587 g005
Figure 6. Comparison of bending forces obtained using the traditional, Boljanovic, and Tekaslan formulas, and FEM simulation results in the case of V-die bending with respect to various bending conditions.
Metals 13 00587 g006
Figure 7. Comparison of bending forces obtained using the traditional, Boljanovic, and Tekaslan formulas, and FEM simulation results in the case of V-air bending with respect to various bending conditions.
Metals 13 00587 g007
Figure 8. Comparison of bending force and stress distribution analyses between V-air and V-die bending processes ( R p = 3.5 mm, T = 3.0 mm, θ = 120°, AA1100-O, L = 70 mm, lk = 60 mm).
Metals 13 00587 g008
Figure 9. Illustration of stress distribution analyses and bending force with respect to punch radius ( T = 3.0 mm, θ = 60°, AA1100-O, L = 70 mm, lk = 60 mm).
Metals 13 00587 g009
Figure 10. Illustration of mean stress and bending force with respect to bend angles. ( R p = 3.5 mm, T = 3 mm, AA1100-O, L = 70 mm, lk = 60 mm).
Metals 13 00587 g010
Figure 11. Illustration of mean stress and bending force with respect to workpiece thickness ( R p = 9.0 mm, θ = 60°, AA1100-O, L = 70 mm, lk = 60 mm).
Metals 13 00587 g011
Figure 12. Illustration of mean stress and bending force with respect to workpiece length ( R p = 9.0 mm, T = 3 mm, θ = 60°, AA1100-O).
Metals 13 00587 g012
Figure 13. Illustration of stress distribution analyses and bending force predictions with respect to material type ( R p = 3.5 mm, T = 3 mm, θ = 120°, L = 70 mm, lk = 60 mm).
Metals 13 00587 g013
Figure 14. Comparison of the bending force calculated by the modified V-die bending force formula and obtained by FEM simulation during the bending process and at the complete bending stage. ( R p = 3.5 mm, T = 3 mm, θ = 30°, L = 70 mm, lk = 60 mm, AA1100-O).
Metals 13 00587 g014
Figure 15. Bending forces calculated by FEM simulation with respect to friction coefficients. ( R p = 3.5 mm, T = 3 mm, θ = 30°, L = 70 mm, lk = 60 mm, SPCC).
Metals 13 00587 g015
Table 1. Finite element simulation and experimental conditions.
Simulation modelPlane strain model
Object typeWorkpiece: elasto-plastic
Punch, die: rigid
Workpiece materialUltimate tensile strength ( σ u t s ): 92.5 MPa
AA1100-OYield strength ( σ y ): 88 MPa
Elongation (δ): 43.5%
Young’s modulus (E): 68,900 MPa
Poisson’s ratio (ν): 0.33
Ultimate tensile strength ( σ u t s ): 346.0 MPa
SPCCYield strength ( σ y ): 208 MPa
Elongation (δ): 47.0%
Young’s modulus (E): 208,000 MPa
Poisson’s ratio (ν): 0.33
Flow curve equation
AA1100-Oσ = 153.50ε0.20 + 88
SPCCσ = 554.43ε0.23 + 208
Friction coefficient (μ)0.10
Workpiece geometriesThickness ( T ) = 2–6 mm
Width ( b ) = 30 mm
Length ( L ) = 70 mm
Die geometriesTool radius ( R p ) = 3–30 mm
V-punch angle ( θ ) = 30°–150°
Die radius ( R u d ) = 5 mm
Punch velocity5 mm/min
Table 2. Recommended length of reversed bending allowance zone on legs ( L o ).
L o   ( mm )
Thickness θ (°) R p   ( mm )
36912151821242730
2 mm303.543.313.072.862.692.492.312.051.871.69
603.653.473.263.102.892.642.442.332.091.88
903.903.703.533.293.133.042.712.532.302.03
1204.294.023.703.513.353.152.942.742.542.30
1504.404.173.923.723.593.363.162.992.752.55
3 mm305.245.104.834.644.454.254.093.863.633.47
605.415.255.084.864.654.514.244.033.863.61
905.745.435.265.064.864.704.394.254.143.89
1205.955.615.515.315.084.894.684.444.324.17
1506.036.005.805.595.395.254.974.764.554.35
4 mm30 6.656.496.246.025.795.595.415.225.08
606.826.596.426.236.065.865.655.425.24
907.086.856.716.426.266.095.885.705.43
1207.227.096.926.636.516.195.995.875.67
1507.537.347.136.886.676.506.326.116.00
5 mm30 8.508.318.127.937.747.497.327.09
608.738.528.298.087.877.697.477.23
909.038.728.608.318.197.977.757.52
1209.208.968.848.538.408.217.947.77
1509.419.238.988.788.628.358.197.93
6 mm30 10.3510.129.889.709.479.289.09
6010.4110.2910.079.879.709.509.25
9010.7710.5610.4210.069.939.729.52
12010.9610.7510.5210.2910.189.889.73
15011.1710.9910.7810.5910.3710.29.95
Table 3. Comparison of V-die bending forces calculated using traditional, Boljanovic, and new formulas, and those obtained by experiment.
Bending ConditionExperimentTraditionalBoljanovicNew Formula
Bending Force
(N)
Bending Force
(N)
%ErrorBending Force
(N)
%ErrorBending Force
(N)
%Error
R p = 3.5 mm,
T = 3 mm
θ = 30°AA1100-O7150773925%951751%72962%
SPCC16,9522259750%2738619%17,4633%
θ = 60°AA1100-O14,2117911796%9831445%14,7343%
SPCC33,96122591503%27381240%35,5565%
θ = 120°AA1100-O27,1537913432%9832762%28,1894%
Disclaimer/Publisher’s Note: The statements, opinions and data contained in all publications are solely those of the individual author(s) and contributor(s) and not of MDPI and/or the editor(s). MDPI and/or the editor(s) disclaim responsibility for any injury to people or property resulting from any ideas, methods, instructions or products referred to in the content.

