Article

A New Porous Nozzle for Aluminum Melts Purification—Preparation and Mathematical–Physical Model

1
State Key Laboratory of Featured Metal Materials and Life-Cycle Safety for Composite Structures, Guangxi University, Nanning 530004, China
2
Centre of Ecological Collaborative Innovation for Aluminum Industry in Guangxi, Nanning 530004, China
3
Key Laboratory of High-Performance Structural Materials and Thermo-Surface Processing, Education Department of Guangxi Zhuang Autonomous Region, Guangxi University, Nanning 530004, China
4
Advanced Research Institute of Multidisciplinary Science (ARIM), Beijing Institute of Technology (BIT), Beijing 100081, China
5
China Tobacco Anhui Industrial Co. Ltd., Hefei 230088, China
*
Author to whom correspondence should be addressed.
Metals 2023, 13(3), 586; https://doi.org/10.3390/met13030586
Submission received: 11 December 2022 / Revised: 16 February 2023 / Accepted: 11 March 2023 / Published: 13 March 2023
(This article belongs to the Section Computation and Simulation on Metals)

Abstract

:
Aluminum and its alloy castings are used more and more widely, and it is particularly important to remove impurities in the alloy. According to the principle of bubble floatation for degassing aluminum melt, a new porous nozzle with controllable pores was developed, and a hydraulic simulation experimental device was studied with the nozzle. The effects of the particle size ratio of the coarse sand to fine sand and volume fraction of fine sand on the porosity of the porous nozzle were studied by orthogonal experiment, and permeability and compressive strength of the porous nozzle were used as test indicators to determine the optimal parameters of preparation for the porous nozzle. The optimal parameters are fine sand of 100 mesh, and fine sand of 50 wt.%, binder of 17.5 wt.%, pore-forming agent of 6 wt.%, and pressure of making sample of 5 MPa. The nozzle with optimal parameters was prepared and tested, and the permeability is 112.2 × 10⁻¹² m2 and the compressive strength is 2.3 MPa. In addition, a physical model of gas transmission in the porous nozzle was proposed. With the increase in the proportion of fine sand, the permeability of the porous nozzle decreases, the compressive strength increases, and the calculated porosity increases. The hydraulic simulation of melt injection was carried out, and the mathematical model for calculating the bubble diameter of bubble floatation was formulated. The model shows that the bubble diameter increases with the increase in gas flow rate. The experiment shows that the prepared porous nozzle has the merits of a simple preparation process and low-cost, which is expected to degas aluminum melts.

1. Introduction

Because of widespread availability, high corrosion resistance, light weight, and high electrical conductivity, aluminum alloy is one of the most popular alloys and is widely used in many fields [1,2,3]. Aluminum alloys easily oxidize and absorb hydrogen during melting, which results in many gas and nonmetallic inclusions in the melt and affects the purity of the melt [4,5,6]. After pouring, gas and nonmetallic inclusions are greatly harmful to the solidification organization of the alloy and produce a series of defects during castings, such as blowholes, pinholes, porosity, and slag. In addition, they damage the integrity of the matrix and have adverse effects on the strength, plasticity, and corrosion resistance, which affect the performance of the alloy and its components, and even cause the scrapping of the product [7,8,9]. Shi [10] pointed out that the hydrogen content in the car casting must be less than 0.07–0.10 mL/100 g Al, and it is required to be less than 0.06 mL/100 g Al for aviation precision castings. Therefore, during the melting and pouring process of aluminum alloy, it is necessary to remove gas and inclusions to ensure the quality of the castings [11]. There are many ways to remove gas and inclusions [12,13]. For example, bubble floatation, vacuum smelting method, fluxing method, filtration method, and combined refining method are adopted [7,10,14,15,16,17,18]. The rotating spray method of bubble floatation is a very efficient purification technology for aluminum melt [9], in which many bubbles enter into the aluminum melt. The hydrogen in the melt will diffuse into the bubbles continuously due to the hydrogen concentration gradient between the bubble and the melt. However, the equipment made by the rotating spray method is relatively complex and expensive, especially for some small foundry workshops [19]. It is also not conducive to the use of complex equipment for injection purification treatment due to the large melt volume. In addition, the gas injection usually uses chlorine as the purification gas. However, chlorine gas is toxic and harmful to the human body, and the use of chlorine has a corrosive effect on equipment and causes serious environmental pollution.
In response to this situation, a kind of new porous nozzle that is sintered by mixing mullite, silica sol, and the pore-forming agent was prepared. The nozzle is used to introduce inert gases (i.e., nitrogen, argon, etc.,) into aluminum melts to form very small and numerous bubbles [9]. Due to the partial pressure difference between bubbles and aluminum melts, hydrogen will enter the bubbles and float to the melt surface which is the fundamental processing of degassing. Moreover, bubbles will bring out a certain amount of oxide inclusions during the floating process, so they also serve the purpose of impurity removal. Therefore, this porous nozzle blowing process could become an alternative method for purification and inclusion removal in aluminum melts.
Based on the Furnas model [20,21,22] and linear accumulation theory [23,24,25], the optimal parameters of nozzle preparation were studied through orthogonal experiments, and permeability and compressive strength of the porous nozzle were used as test indicators. The effects of the particle size ratio of the coarse sand to fine sand and the volume fraction of fine sand on the porosity of mullite sand were systematically studied. The nozzle of this porous material has been tested for its performance, and a physical model of gas transmission in the porous nozzle was conducted.
Because the aluminum melt at superheat is nontransparent during the melting process, it is difficult to directly observe the floatation behavior of bubbles in the furnace [26]. Water is the most easily available transparent liquid, and can be used to simulate the aluminum alloy melt when the condition of the similarity principle is satisfied with motion similarity, geometric similarity, and dynamic similarity [27,28] (Attached Supplementary Materials find the details of the similarity principle). Therefore, a hydraulic simulation on the flotation movements can be observed transparently in real time, which can provide a significant and approximate understanding for actual aluminum alloy melting. Moreover, the blowing parameters of hydraulic simulation should be the preliminary degassing and purification parameters of actual aluminum alloy melt, which would be carried out in the further study.

2. Materials and Methods

2.1. Experimental Raw Materials

In this paper, a porous nozzle purification method was proposed, and a new porous nozzle with controllable pores was developed. The porous nozzle is composed of mullite sand, binder, and pore-forming agent. Among them, the binder is silica sol, whose function is to make the porous aggregates interconnected and have a certain strength after treatment. The pore-forming agent is polymethyl methacrylate (PMMA), an organic powder.
Mullite sand, pore-forming agent, and binder were mixed with a certain ratio and then loaded into the mold, and a finished porous nozzle was obtained after pressing, demolding, and sintering. The air permeability and compressive strength were tested. The schematic flow chart is shown in Figure 1. The porous was dried under the temperature of 50 °C for 2 h. The sintering process is at about 800 °C for 6 h. Other preparation parameters for porous nozzles are described below.

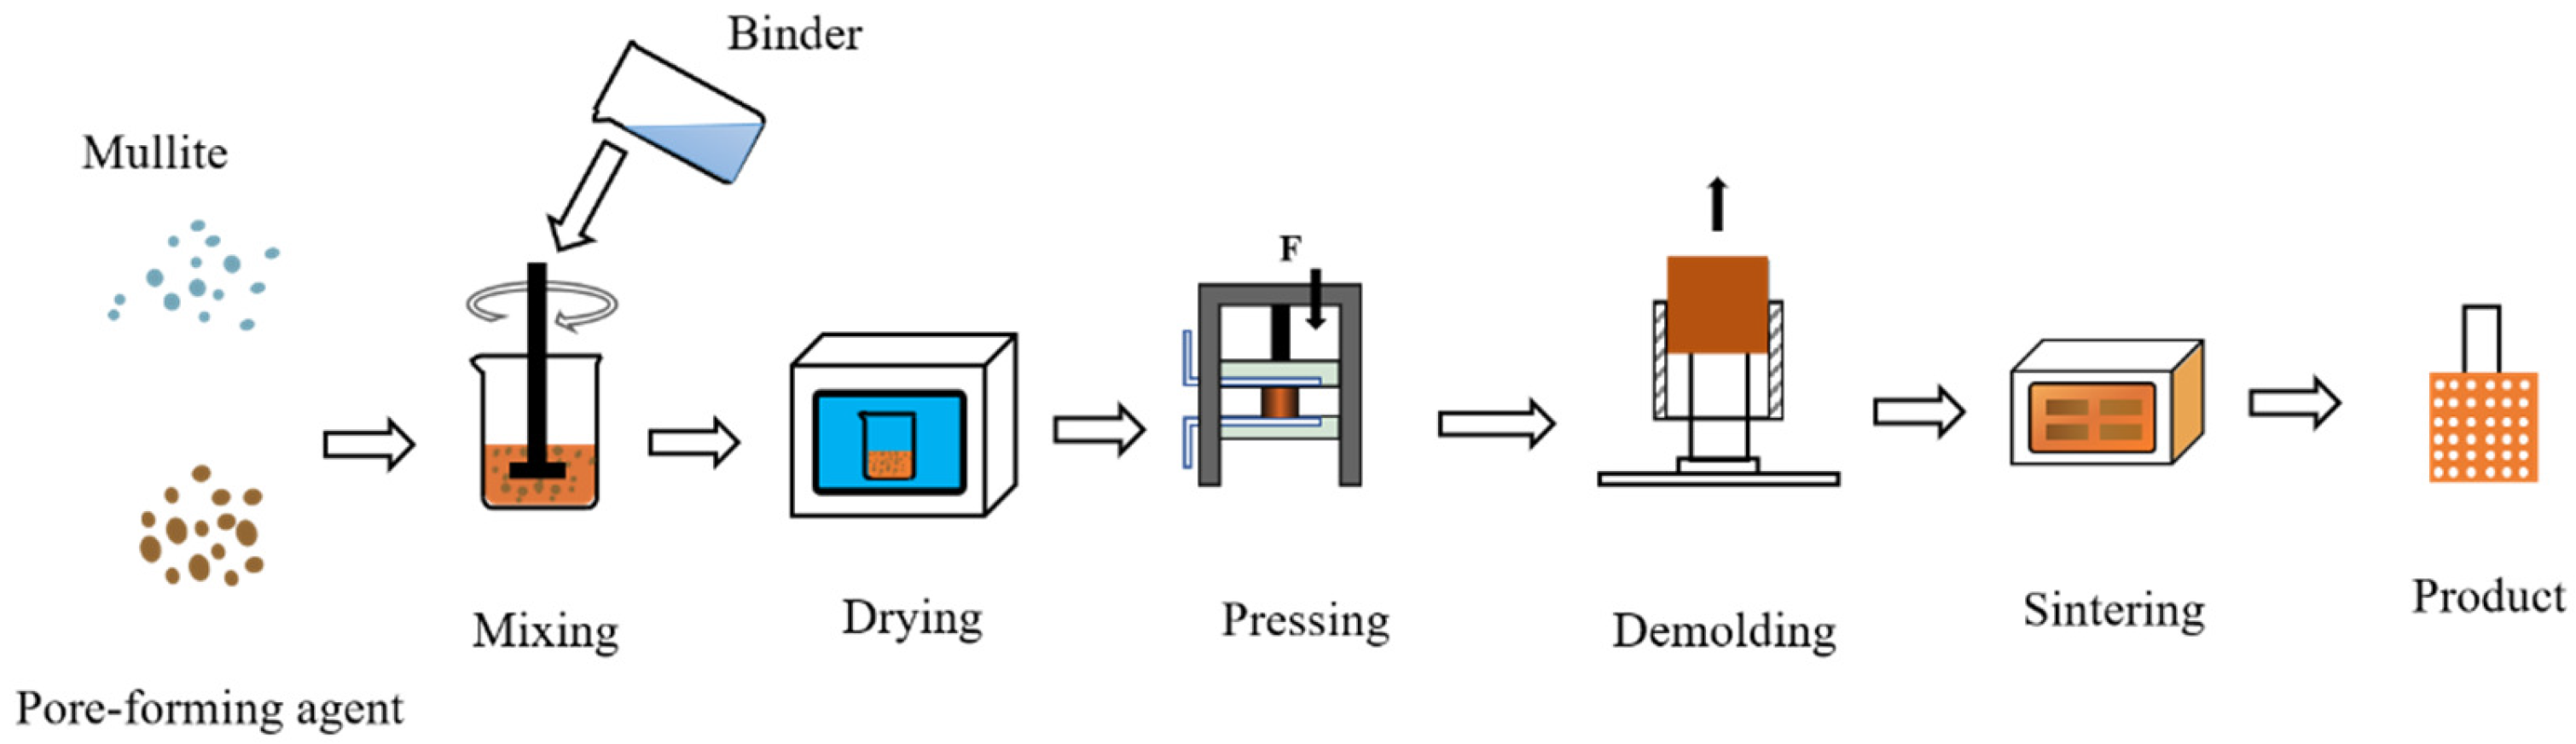
2.2. Adjustment of the Pore of the Porous Nozzle

What is needed for aluminum purification is a porous nozzle that can produce a large number of bubbles. The number of bubbles is related to the porosity and pore size of the nozzle. In this paper, the porosity and pore size of the nozzle can be adjustable. The pore size of the nozzle can be controlled by using different particle sizes of mullite sand. For porosity, there are two ways to control the porosity. One is controlling the proportion of the pore-forming agent, the other is controlling the particle size ratio of the nozzle and the volume fraction of fine sand, which coincides with the Furnas model [20].
According to the Furnas model [20], for the two-component mixture system, the porosity (φ) of the porous material can be calculated as follows:
φ = 1 E c ( 1 + E c ) E f   F 1 ( φ f ) F 2 ( R )
where Ec is the filling rate of coarse particles and Ef is the filling rate of fine particles [23,29], which can be calculated using a linear stacking model, φf is the volume fraction of fine particles, R is the particle size ratio of coarse particles and fine particles, F1 (φf) and F2 (R) are functions of φf and R respectively.
Zheng [20] obtained the expressions of effect equation F1 (φf) and F2 (R) through experimental analysis and data fitting, as shown in Equations (2) and (3) respectively:
F 1 ( φ f ) = e   φ f ln φ f C 1
F 2 ( R ) = exp ( C 2 R )
where C1 and C2 are constant, and e is a natural constant.
Equations (2) and (3) are substituted into Equation (1) to obtain:
φ = 1 E c ( 1 + E c ) E f   e   φ f ln φ f 5 4 E c exp ( 4 R )
The Furnas model describes the ideal double-particle size stacking system. When the particle size ratio of coarse sand to fine sand is reduced, the porosity is correspondingly increased. On the other hand, the porosity also depends on the volume fraction of the fine sand. With an increase in the volume fraction of fine sand, the porosity is correspondingly reduced.
Therefore, this paper considered both the particle diameter ratio of coarse particles and fine particles and the fine sand volume fraction as variables, and the orthogonal experiment was carried out. In addition, other factors that may affect the porosity of the nozzle were added as influential factors, such as the pressure of making sample, and the proportion of binder and pore-forming agent. To control the particle size ratio of coarse particles and fine particles, this paper fixed the particle size of coarse sand and changed the particle size of fine sand. Since both the selected coarse and fine particles are mullite sand, the mass fraction was used instead of the volume fraction for convenience.

2.3. Orthogonal Experimental Design

Generally, the porosity is high, and the air permeability is correspondingly high, so more bubbles come out of the nozzle. Permeability is closely related to the porosity of porous media. To obtain a nozzle with more porosity, the preparation process porous nozzle with a controlled gap was studied. Through orthogonal experimental design, the effect of the parameters of the nozzle preparation on its air permeability and compressive strength was quantitatively analyzed. Five relevant factors were investigated: the size of fine sand, the proportion of fine sand, the pressure of making sample, and the proportion of the pore-forming agent. Five levels were set for each factor. The permeability and the compressive strength experiments are carried out by GB/T 1969-1996 and GB/T 5072-2008 respectively.
Accordingly, an L25 (65) orthogonal array was selected to arrange the experiment to determine the optimal parameters of porous nozzle preparation. The number of factors and levels of the orthogonal experiment are shown in Table 1.

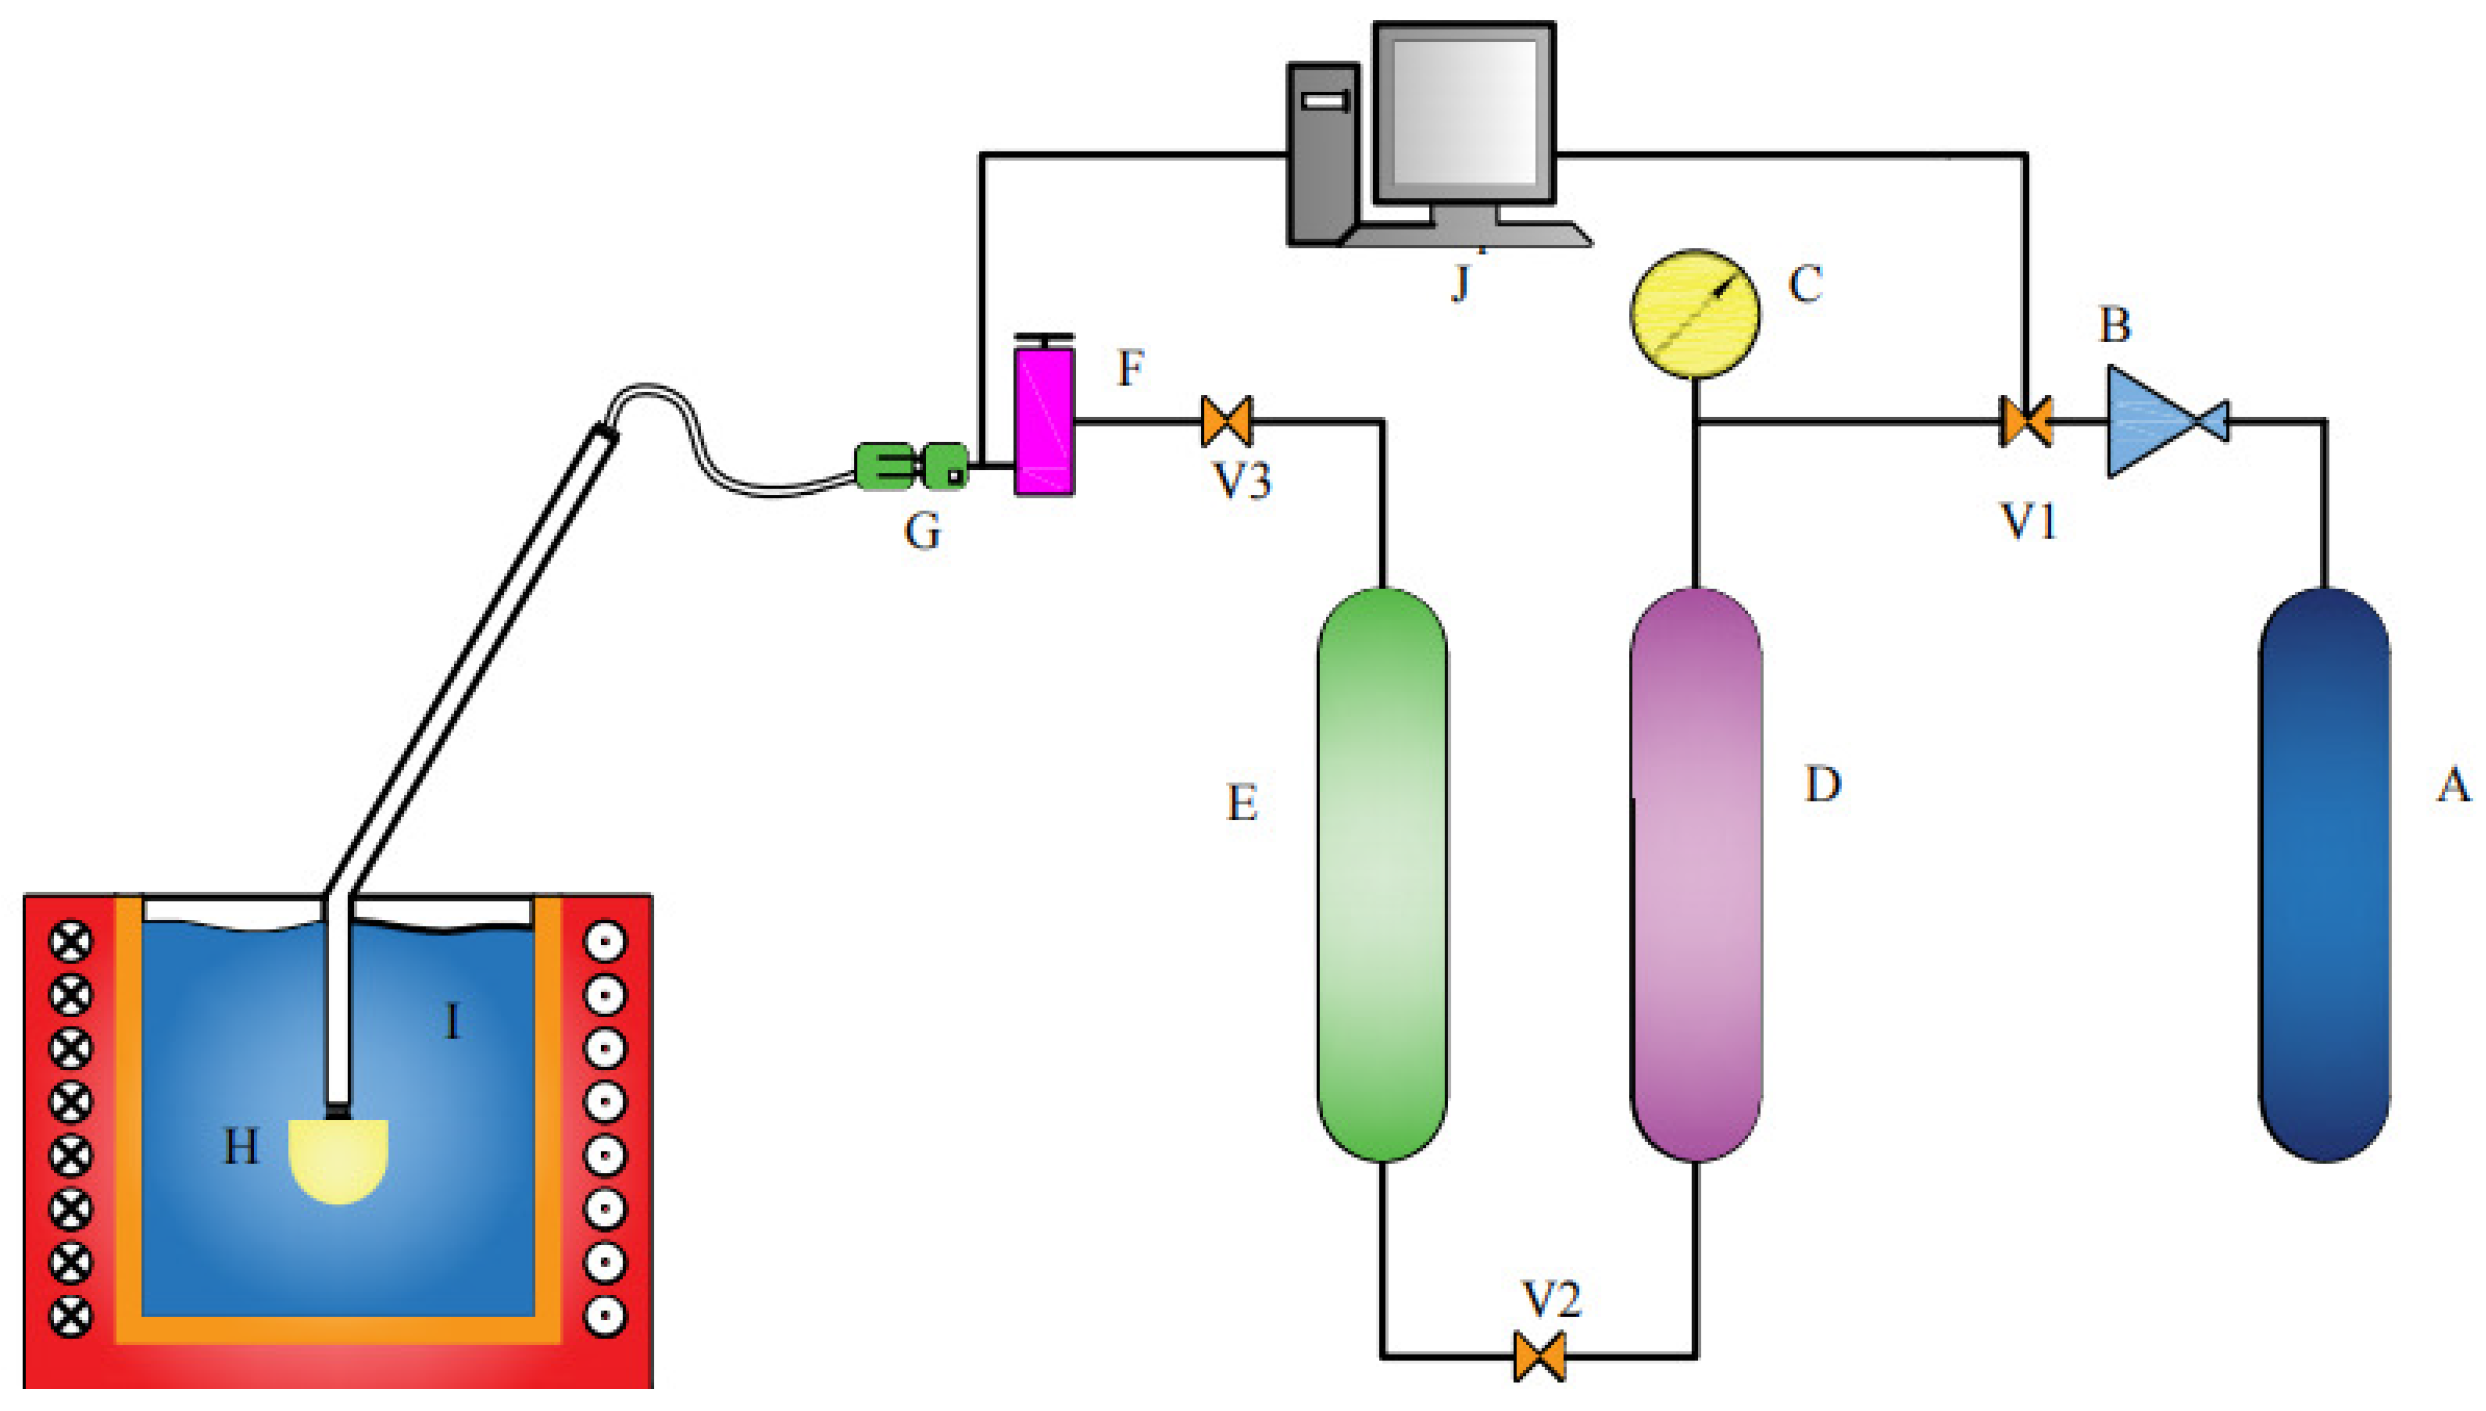
2.4. Hydraulic Simulation

This paper used a porous nozzle to carry out hydraulic simulation experiments and studied the bubble migration in the process of water simulation, and subsequently used this method to determine the appropriate process parameters. At the same time, the effect of preparation parameters of the porous nozzle on bubble quantity and bubble size can be analyzed through hydraulic simulation. The self-assembled hydraulics simulation device is shown in Figure 2.
The high-purity nitrogen is leaked out from the gas tank (A), and it is decompressed by the pressure regulating device (B) and then filtered by an air filter (D). To further reduce the water content, a molecular sieve (E) is used to thoroughly filter the moisture in nitrogen. The fully dried high-purity nitrogen is adjusted by the flow regulator (F) and Solenoid Valve (G). The gas pressure and flow in the injection process are controlled by a control panel (J). The high-purity nitrogen with the appropriate flow is introduced into the water through the porous nozzle (H) for hydraulic simulation. In the process of blowing, the nozzle is continuously blown into the gas, and the airflow will bring continuous gas pressure to prevent liquid droplets from entering the nozzle. A high-performance high-speed camera was used to photograph the water simulation process, as shown in Figure 3. The photos contain two types of information: one focuses on the observation of the bubble running state and the bubble distribution, and the other estimates the bubble diameter. The bubble diameter was estimated through the pictures taken at the moment when the bubble was just formed but did not escape to the liquid surface.

3. Experimental Results

Two methods can be used to achieve the purpose of controlling the porosity of the nozzle: controlling the proportion of the pore-forming agent and adjusting the proportion and size of fine sand, which can obtain a fine and uniformly and diffusely distributed bubble flow. The results of the orthogonal experiments are shown in Table 2.

3.1. Analysis of Orthogonal Experimental Results

Based on the experimental results in Table 2, a range analysis of the effects of the proportion of pore-forming agent, the proportion of fine sand, and the size of fine sand on the permeability and compressive strength was performed, as shown in Figure 4.

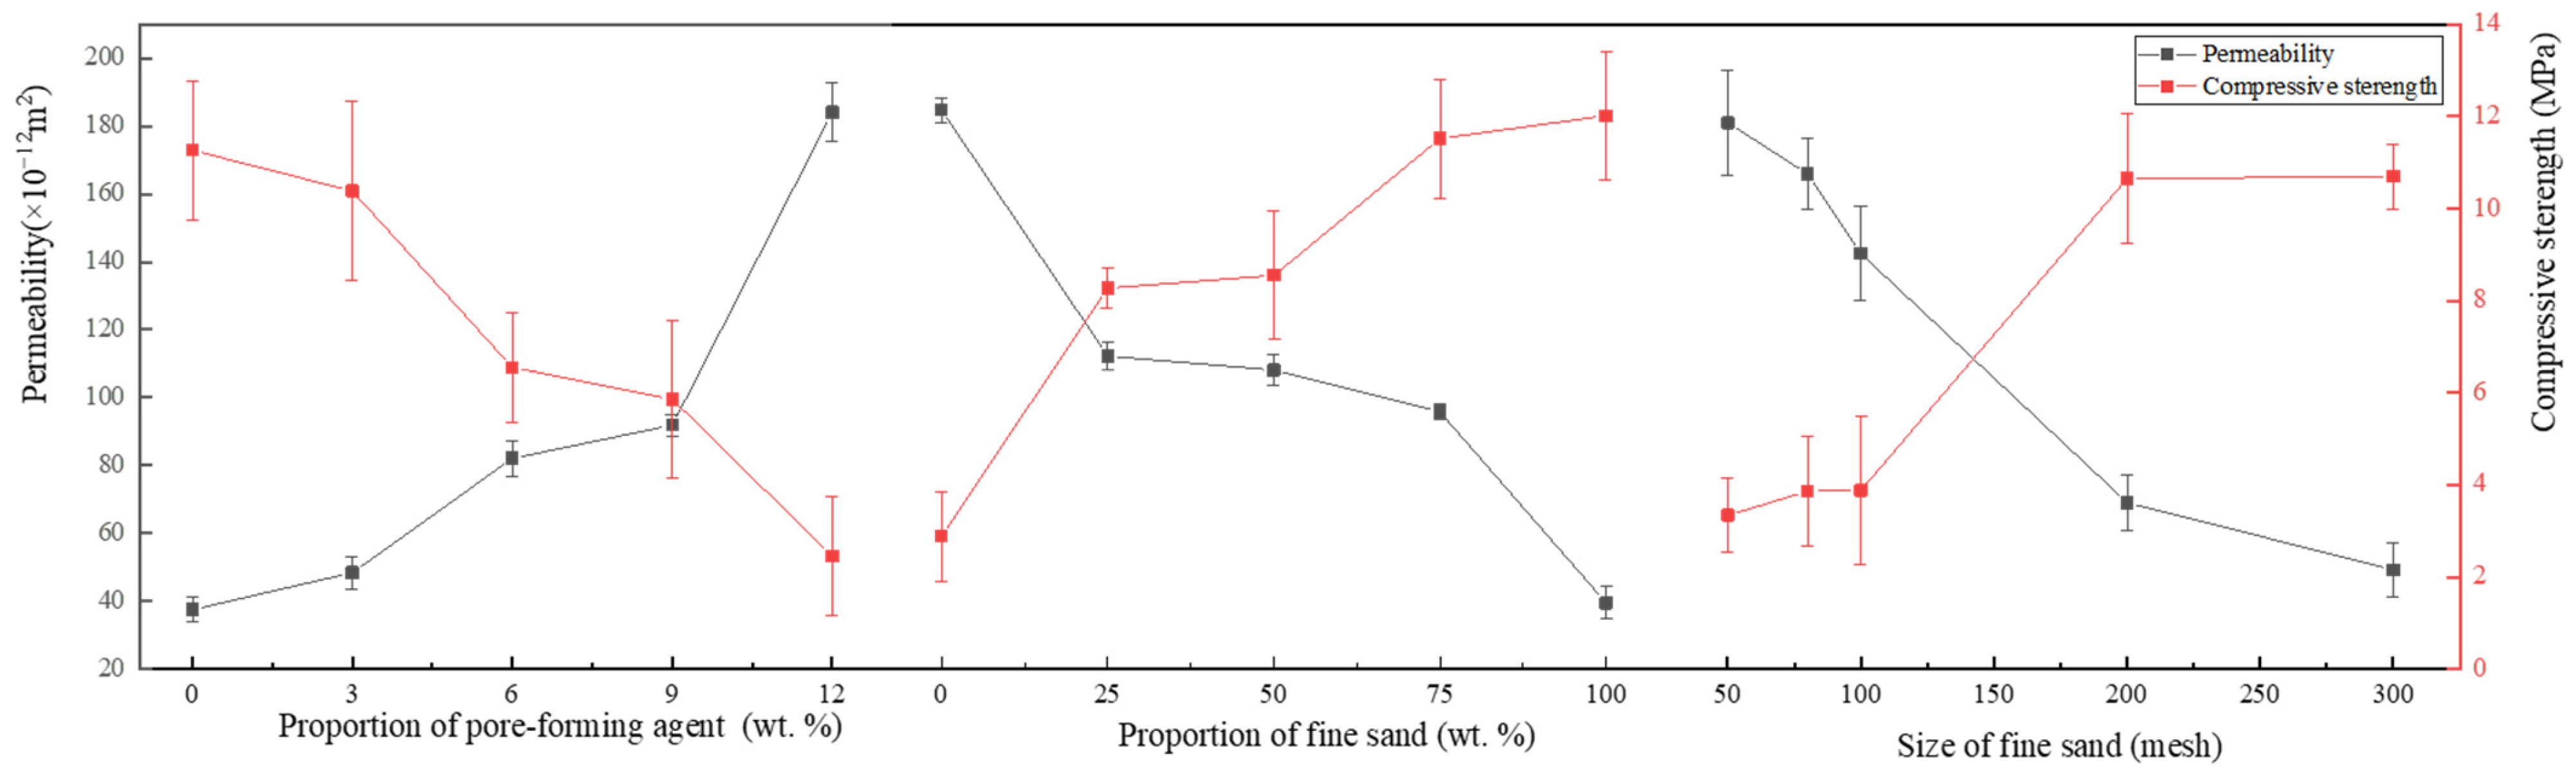
3.1.1. Effect of Pore-Forming Agent

As shown in Figure 4, with the increase in the proportion of pore-forming agents in the porous nozzle, the air permeability of the nozzle also increases. Because PMMA powder will be decomposed at high temperatures, the hole is formed in the remaining position. Therefore, the air permeability of the nozzle can be adjusted by varying the proportion of pore-forming agents, but more pore-forming agent does not necessarily mean a better choice. When the proportion of pore-forming agent exceeds 12 wt.%, the nozzle compressive strength is less than 3 MPa. Because the pore-forming agent will be decomposed during the sintering process, it will lead to a discontinuous framework of the nozzle and reduction of strength.

3.1.2. The Effect of the Size of the Raw Material Particle

It can be seen that with the increase in the proportion of fine sand, the permeability of the sample shows a decreasing trend, but the compressive strength increases with it (see Figure 4). The basic skeleton of the nozzle consists of coarse sand particles. Fine sand, pore-forming agent, and binder are filled into the gap between the coarse sand in the process of pressing by hydraulic press. Therefore, as the proportion of fine sand increases, and more gaps are filled, the air permeability gradually decreases and the compressive strength increases with it.
From Figure 4, it can be seen that with the increase in the size of fine sand, the air permeability of the sample tends to decrease; however, the compressive strength increases. Because the finer the fine sand, the easier it fills the gap and the air permeability reduces accordingly.
Summarily, the air permeability of the nozzle can be adjusted by changing the proportion of fine sand and the size of fine sand. When the proportion of fine sand is set to 50 wt.% and the size of fine sand reaches 100 mesh, higher air permeability and compressive strength can be obtained.

3.2. Analysis of Variance

According to the experimental results in Table 3, the analysis of variance of the air permeability and compressive strength can be seen in Table 3 and Table 4, and the following prediction model can be obtained by referring to the solution method of orthogonal experimental regression:
P c = 13.48 0.106 W b 1.435 S f 1.639 W f + 1.620 W p
S c = 0.792 + 0.002 W b + 0.439 S f + 0.444 W f 0.463 W p
where Pc is the permeability, Wb is the proportion of binder, Sf is the size of fine sand, Wf is the proportion of fine sand, Wp is the proportion of the pore-forming agent and Sc is the compressive strength.
As seen from this model, when the size of fine sand increases, in the case of fixed crude sand particle diameter, the particle size ratio of coarse particles to fine particles increases and the gas permeability is reduced. At the same time, with the increase in the volume fraction of fine sand, the gas permeability is reduced accordingly. In summary, the experimental results of this paper are fully consistent with the trend result derived from the Furnas model.

3.3. Optimization of Nozzle Preparation Parameter

From the results of the orthogonal experiments in Table 2 and analysis of variance, it is concluded that the change in proportion of the pore-forming agent has the greatest effect on the permeability and compressive strength; the proportion of fine sand takes the second place; the size of fine sand takes the third place; the proportion of binder takes the fourth place; the pressure of making sample has the smallest effect on the permeability and compressive strength. The optimal parameters of preparation of the nozzle were found to be a binder of 17.5 wt.%, fine sand of 100 mesh, fine sand of 50 wt.%, making the pressure of 5 MPa, and pore-forming agent of 6 wt.%. The nozzle with the optimal parameters of preparation was prepared and tested, and the permeability is 112.2 × 10⁻¹² m2 and the compressive strength is 2.3 MPa. Therefore, they can be determined as the optimal parameters.

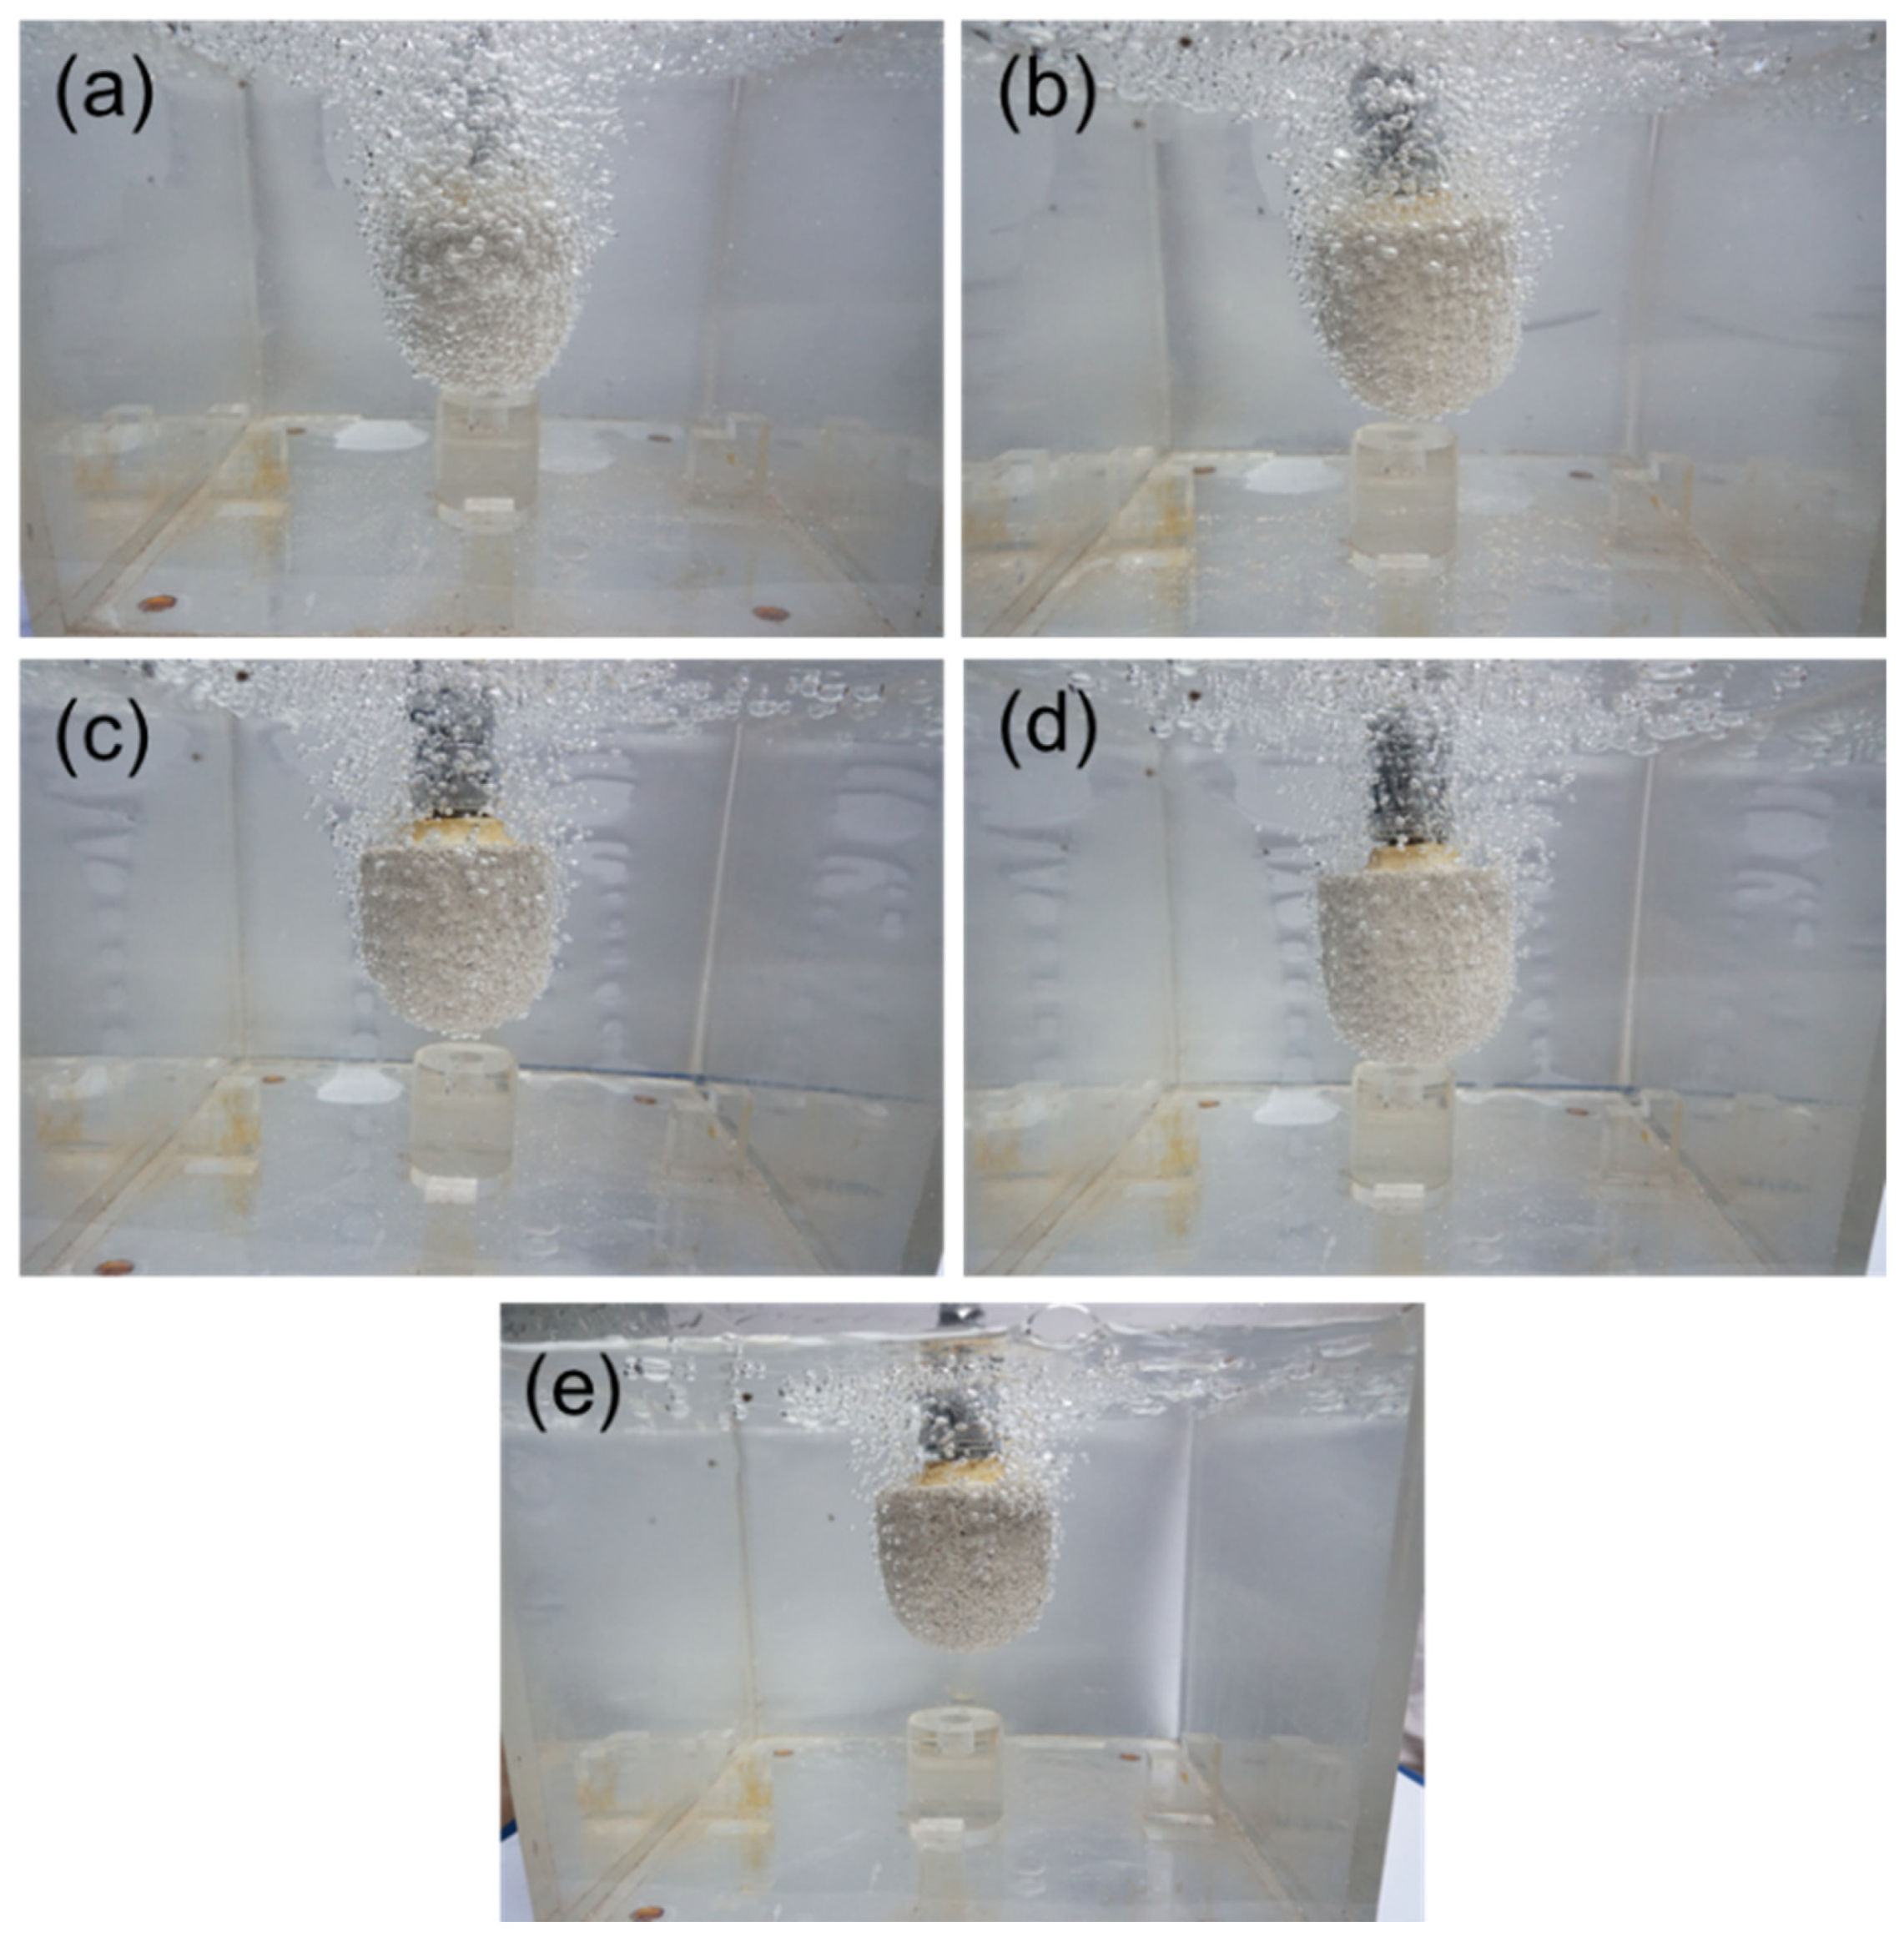
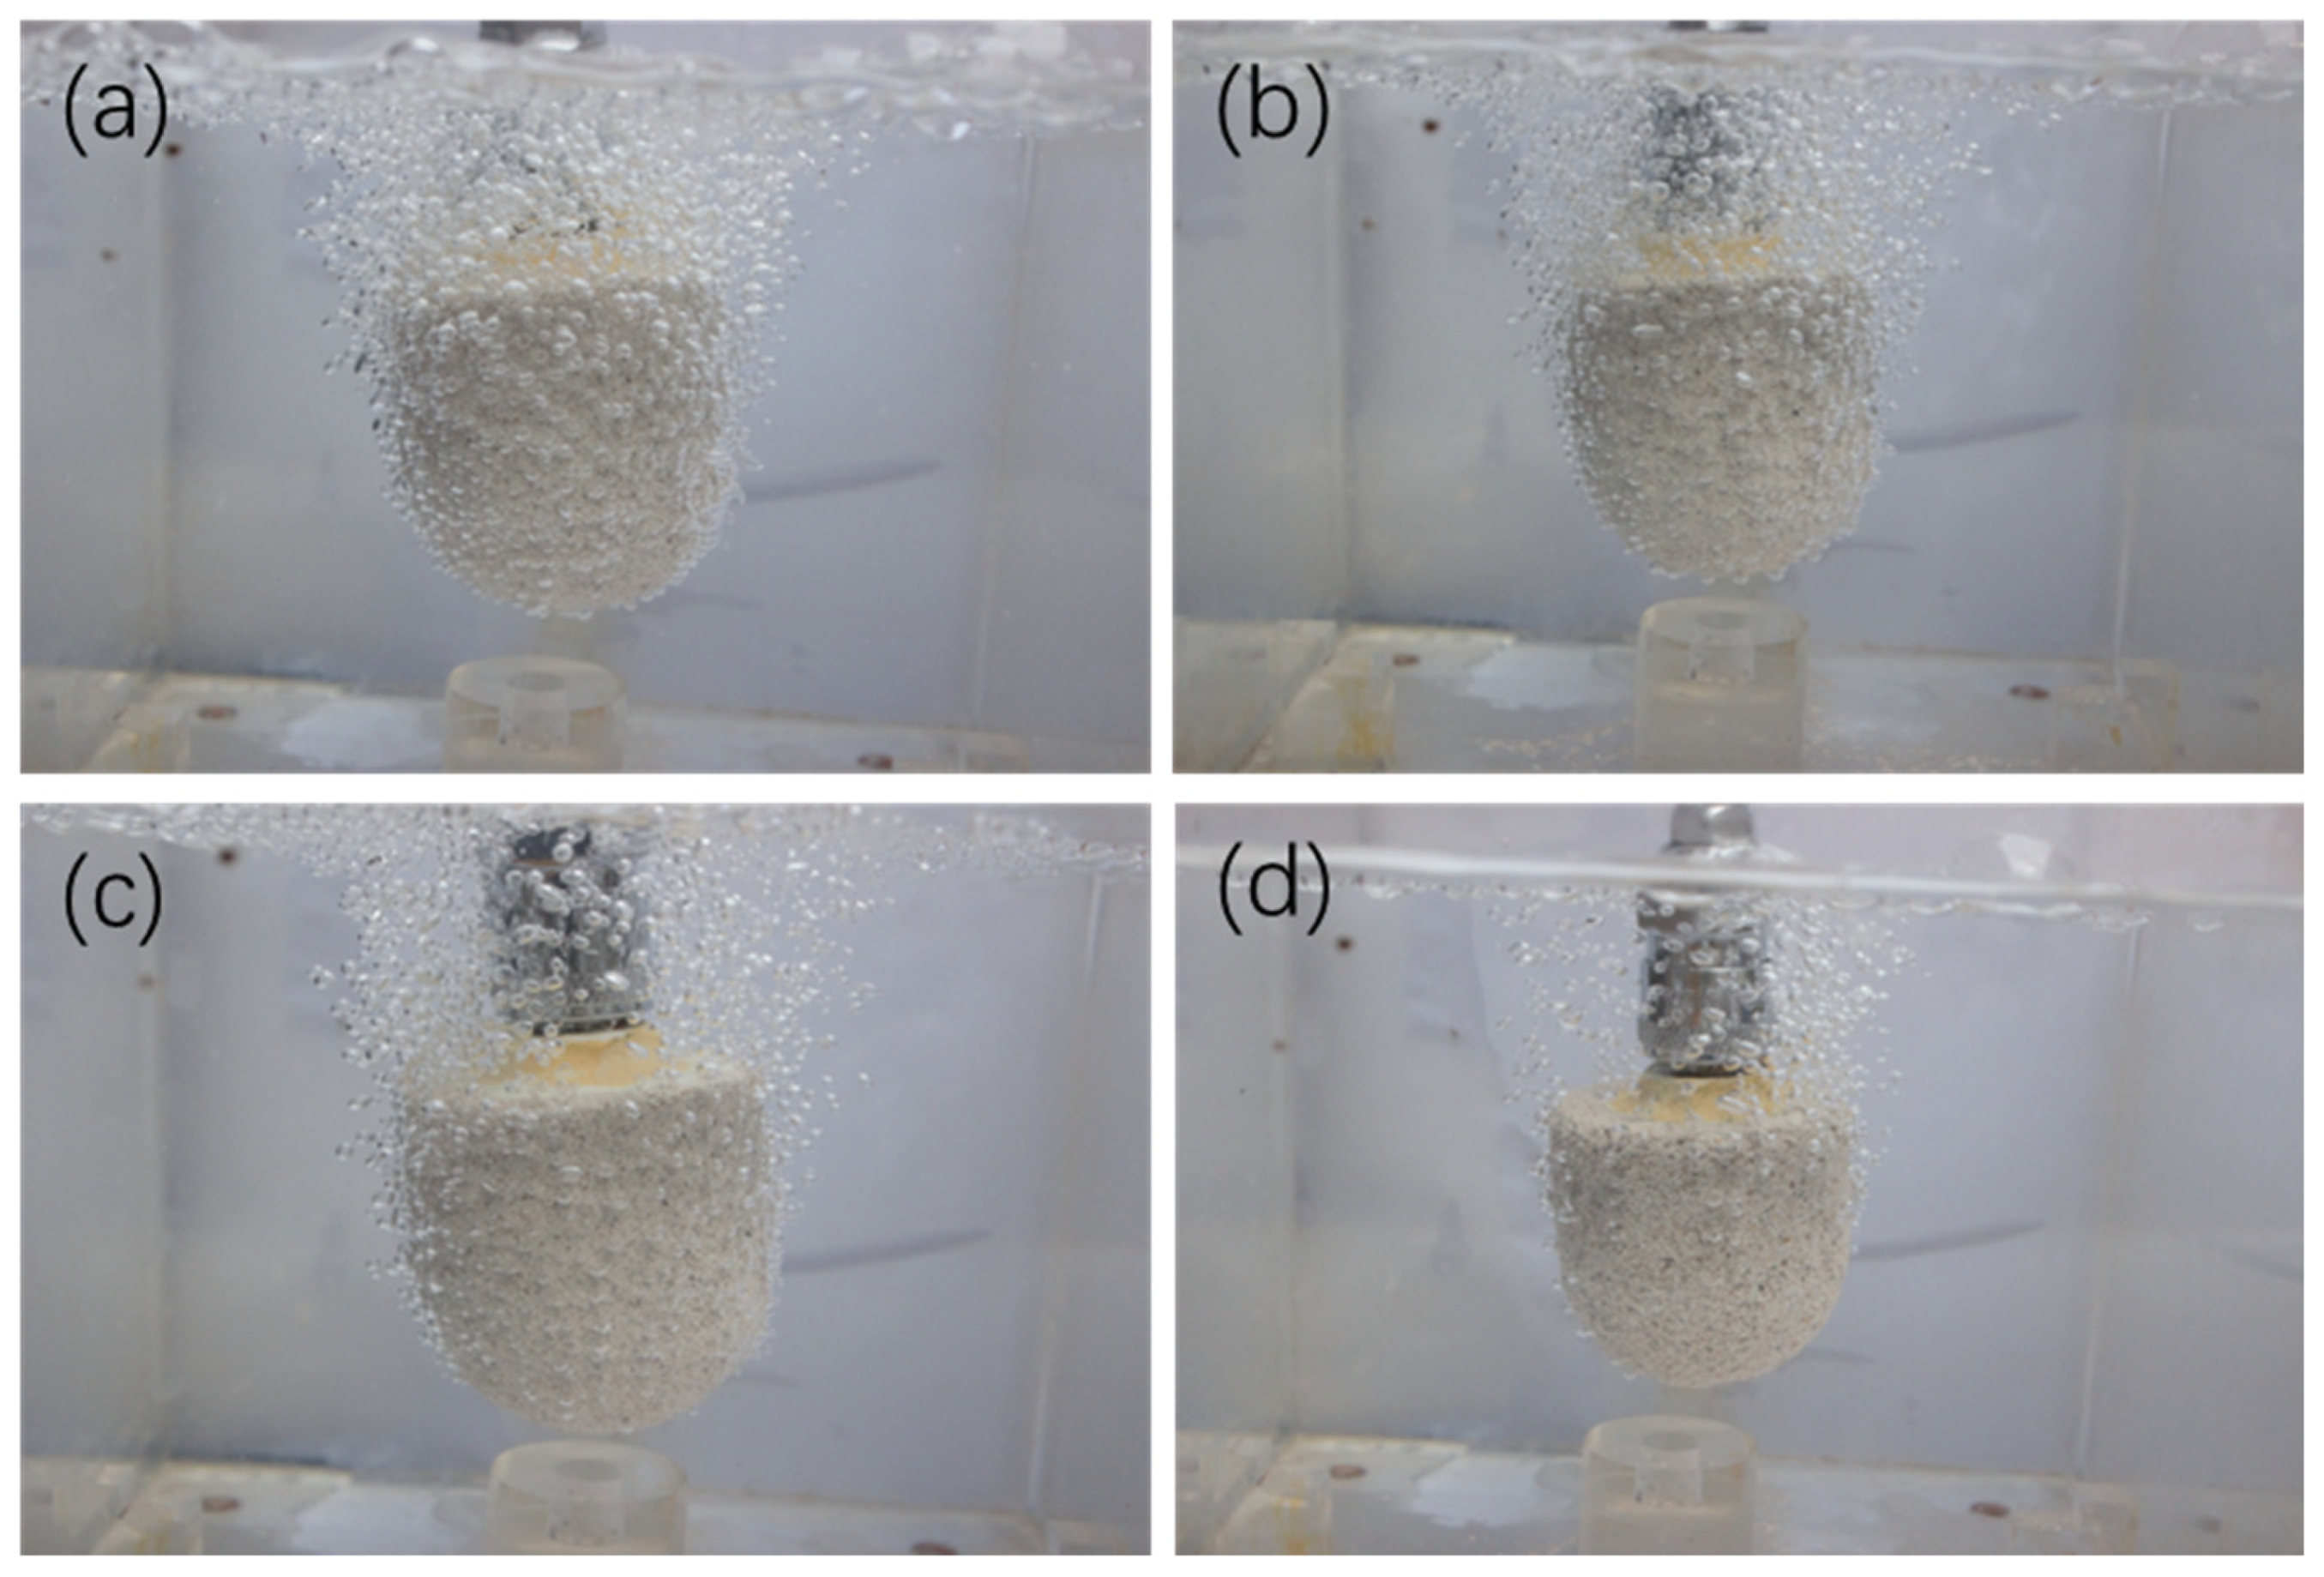
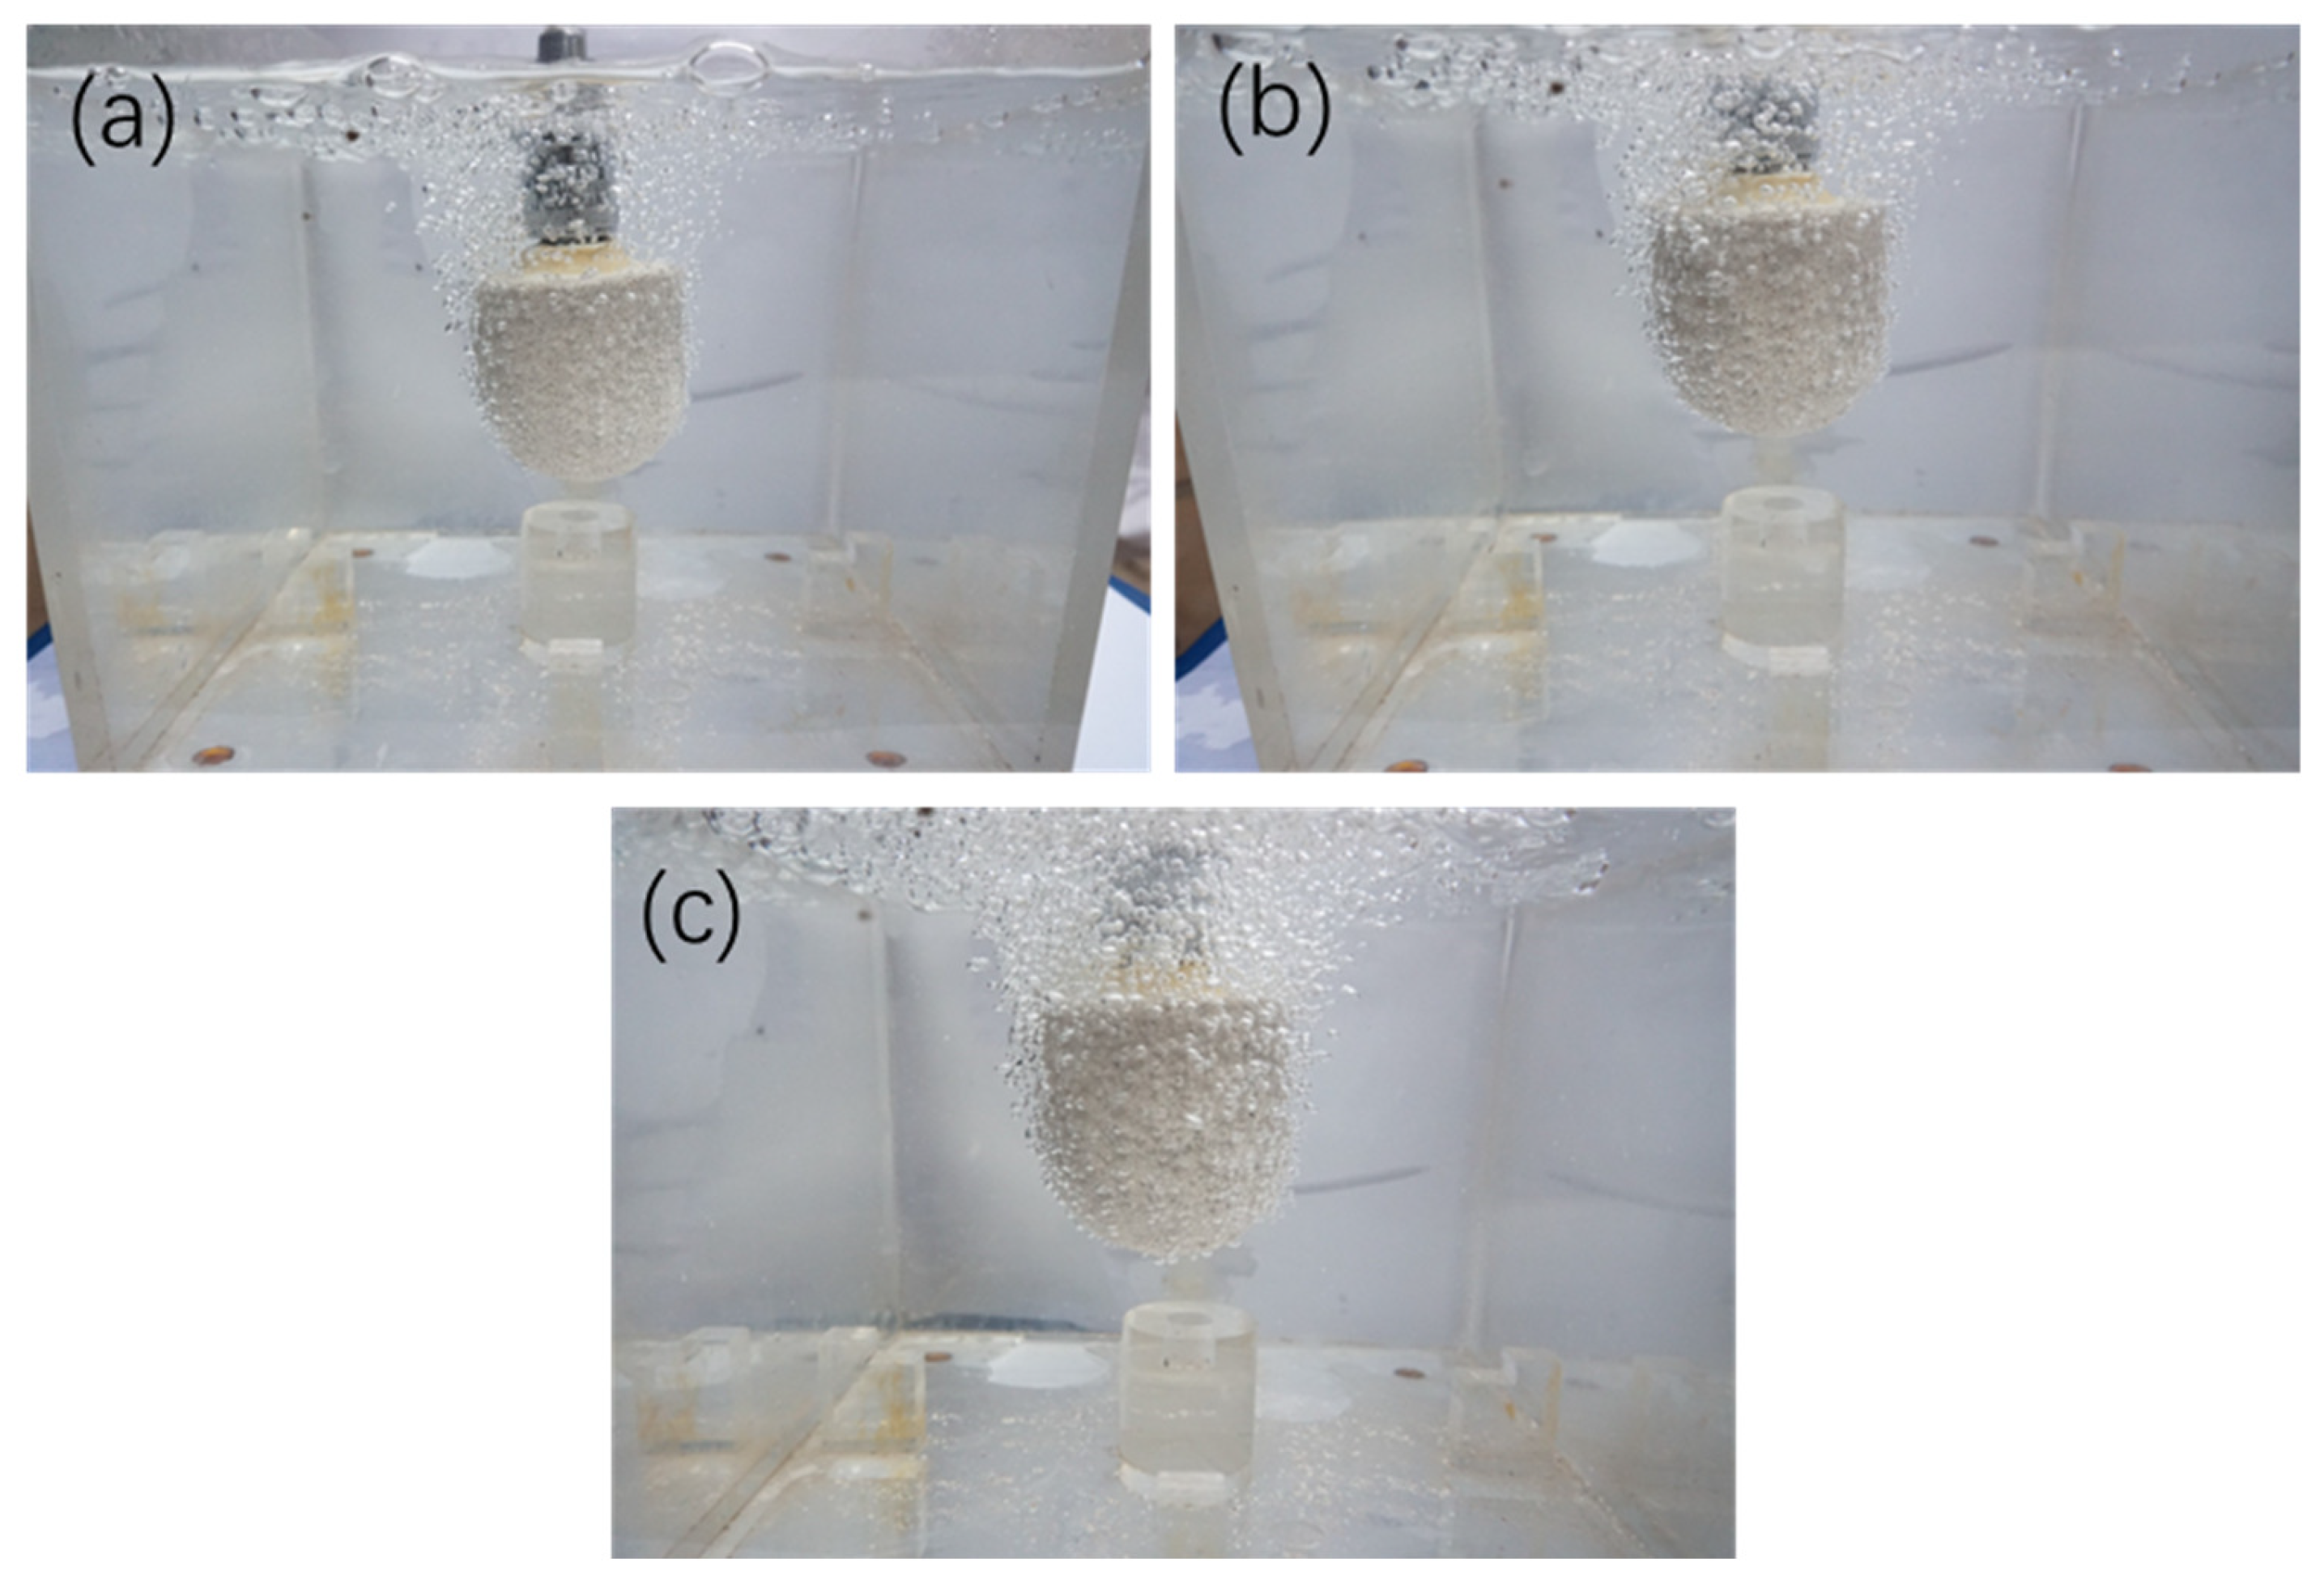
3.4. Results of Hydraulic Simulation

According to the taken photos during the hydraulic simulation, the bubble diameter was estimated and the number of bubbles was counted. The optimal preparation parameters of the nozzle have been obtained through orthogonal experiments. When the proportion of pore-forming agent is 6 wt.% and the size of fine sand is 100 mesh, the effects of different proportions of fine sand (0, 25 wt.%, 50 wt.%, 75 wt.%, 100 wt.%) are shown in Figure 5a–e, revealed by a set of hydraulic simulations. When the proportion of pore-forming agent is 6 wt.% and the proportion of fine sand is 50 wt.%, the effects of different sizes of fine sand (50 mesh, 100 mesh, 200 mesh, 300 mesh) are exhibited in Figure 6a–d, disclosed by another set of hydraulic simulations. When the size of fine sand is 100 mesh and the proportion of fine sand is 50 wt.%, the effects of different proportions of pore-forming agent (0, 3 wt.%, 6 wt.%) are compared through a third set of hydraulic simulations, see Figure 7a–c.
From Figure 5, it can be seen that with the increase in the proportion of fine sand of the porous nozzle, the number of bubbles from the porous nozzle decreases. The bubble size of the porous nozzle with the fine sand proportion of 50 wt.% is relatively small and the number of bubbles is relatively large. When the proportion of fine sand is greater than 50 wt.%, the number of bubbles blowing out of the porous nozzle is significantly reduced. There is only a little gas that can pass through the nozzle when the proportion of fine sand is 75 wt.% of the porous nozzle.
As seen from Figure 6, with the increase in the size of fine sand, the number of bubbles decreases. As seen from Figure 7, with the increase in the proportion of the pore-forming agent, the number of bubbles also increases. However, when the proportion of the pore-forming agent exceeds 6 wt.%, the nozzle is very easy to break down, and the compressive strength cannot meet the requirements anymore.
The above conclusions are consistent with the orthogonal experimental results from the physical model and the established prediction model. The less fine sand, the higher the permeability, and more bubbles will come out of the nozzle. Therefore, within the research scope of this paper, when the proportion of fine sand is 50 wt.%, the proportion of pore-forming agent is 6 wt.% and the size of fine sand is 100 mesh, the number and distribution of bubbles are ideal.

4. Discussion

4.1. Spatial Porosity of Porous Nozzle

The porosity is high, and the air permeability is correspondingly high, so more bubbles come out of the nozzle.
The porous nozzle is a mixture of mullite sand with different particle sizes, pore-forming agents, and binders, which shows a complex structure at the microscopic level.
Porosity is the macroscopic property of porous media, which refers to the ratio of the volume of pores to the total volume of porous media [30]. ϕ is given in terms of the porosity of porous media by Ref. [30]:
ϕ = V p / V b = ( V b V s ) / V b
where ϕ is a dimensionless quantity, which is usually expressed as a percentage, Vb is the total volume of porous media, Vp is the volume of pores within the total volume, and vs. is the volume of solids within the total volume (Vb).
Permeability is closely related to the porosity of porous media. The porosity is high, and the air permeability is correspondingly high [30]. Therefore, it is very important to study the spatial porosity of porous nozzles.
To facilitate the analysis of the performance of the porous nozzle, the particle size and pores of the formed porous nozzle are simplified, and the assumptions are as follows:
(1)
The particles are incompressible and undeformed, and all kinds of particles are rigid and inelastic regardless of the particle size;
(2)
Silica sol is distributed in a film shape and does not occupy the volume space of the porous nozzle.
With the above assumptions, the same judgment standard can be applied to the particle size and pore of the porous nozzle with the same raw materials and different component ratios. Therefore, each preparation parameter corresponds to an equivalent particle size. The determination process of the equivalent particle size is as follows.
When the porous medium is a mixture of m particles and each particle is composed of Ni rigid spheres with radius ri, the total area and the total volume of the solid rigid ball are given by Equations (8) and (9):
A s = i = 1 m 4 π r i 2 N i
V s = i = 1 m 4 3 π r i 3 N i = ( 1 ϕ ) V b
where As is the total area of the solid rigid sphere, ri is the radius of the ith rigid sphere, Ni is the number of ri rigid spheres of radius.
As a result, the specific surface area of porous media can be calculated by the following equation:
M = i = 1 m 4 π r i 2 N i / i = 1 m 4 3 π r i 3 N i / ( 1 ϕ ) = 3 ( 1 ϕ ) i = 1 m f i / r i = 3 ( 1 ϕ ) / r ¯
where M is the specific surface area of porous media, M = A s / V b , fi is the volume fraction of the ith particle, f i = 4 3 π r i 3 N i / V s , r ¯ is the harmonic mean of the radius or equivalent radius of a rigid sphere.
Therefore, for porous media composed of several groups of particles with different sizes, the equivalent particle size can be expressed in terms of the equivalent rigid sphere radius as follows.
d ¯ = 2 r ¯
where d ¯ is the equivalent particle size.
As a result, the equivalent particle size of porous materials with different combinations of size can be obtained. The true density of mullite is 2.6 g/cm3, and the theoretically calculated value of the porosity of the porous nozzle is the following equation:
ϕ = 1 V s V b = 1 m j ρ j V b
where mj is the quality of the jth material, ρj is the density of the jth material.
The height and radius of the porous nozzle are measured and calculated before sintering, and the final porosity calculation results are shown in Table 5. To facilitate comparative analysis, the data are plotted as the graph shown in Figure 8. With the increase in the proportion of fine sand, the calculated porosity gradually decreases. Which is consistent with the trend of previous experimental results.
Comparing the results with the previous orthogonal experiments and hydraulic simulation, it can be found that the porosity of the porous nozzle, the number of bubbles, and the permeability have a negative correlation with the proportion of fine sand. The three calculation methods are different, but the trend is consistent and can be confirmed by each other. The finer the sand, the smaller the porosity and permeability, so the fewer bubbles flow from the nozzle. It further shows that the porosity of the nozzle is controllable.

4.2. Gas Transmission of the Porous Nozzle

Under certain pressure, gas moves to the melt through the porous nozzle, which meets the conservation of mass and momentum. Based on this fact, the gas permeability of porous media can be calculated and deduced.
Before performing mathematical derivation, the following settings are made:
(1)
The framework of the porous nozzle does not change during gas transmission;
(2)
Gas transport is assumed to be a continuous medium.
From the definition of fluid velocity, seepage velocity is adopted, and the symbol u is used in this paper. The relationship between particle velocity of fluid v and u is written as u = , which is also called the Dupuit–Forchheimer relation for the percolation velocity (referred to as the DF relation).
The Eulerian viewpoint is used to describe the mass conservation equation. For the porous nozzle with fixed composition and process, the porosity of the porous nozzle is set as ϕ, and its pores are saturated by gas.
The general form of the continuity equation of unsteady passive seepage is:
( ρ ϕ ) t + ( ρ v ) = 0
The momentum conservation equation for ordinary viscous fluid (Navier–Stokes equation) is:
ρ D v D t = μ 2 v p + ρ g
where D D t = t + v x x + v y y + v z z , ρ is the density of the fluid, ϕ is the porosity of the porous nozzle, v is the vector of velocity, D is divergence, p is pressure, μ is the Kinematic viscosity of the fluid, g is the vector of gravitational acceleration, 2 is Laplace operator, t is time, x, y, z is component of coordinates.
For gas transport in the porous nozzle in this paper, the equation of motion under this condition can be obtained from the basic control equation. The gas transport in the porous nozzle is a passive steady-state percolation, and the continuity equation is given by:
( ρ u ) = 0
The viscous force of percolating fluid is different from that of ordinary fluid. The viscous force is inversely proportional to permeability k and directly proportional to seepage velocity u. It is necessary to replace μ/ 2u with u/k. In addition, the gas transport in the porous nozzle belongs to the category of percolation fluids mechanics. The left term is zero in the steady state, and here is the derived equation:
u = k μ ( p ρ g )
where k is the permeability of porous media.
Equation (16) is Darcy’s law [30] for three-dimensional fluid flow derived from the equation of momentum conservation. By combining Darcy’s law with the continuity equation and substituting Equation (15) into Equation (16), the following equation is obtained:
ρ k μ p ρ g = 0
It should be noted that the coefficients must be able to be measure accurately to make this equation have actual meaning in the equation of motion expressed by Darcy’s law. Low-density gas seepage transmission deviates from Darcy’s law due to the existence of the slip flow phenomenon (Klinkenberg effect [31]). The permeability k in Equation (16) needs to be modified, and Scheidegger solved the equation after modifying the permeability [32,33]:
u ( x ) = k g μ P 1 2 P 2 2 2 L P 1 2 P 1 2 P 2 2 x L
where kg is the gas permeability of porous media, μ is the dynamic viscosity of gas passing through the specimen at experimental temperature, L is the height of porous media, P1 is the pressure of gas entering porous media, P2 is the pressure of gas escaping from porous media.
When x = L, there is the following equation:
u ( x = L ) = k g μ P 1 2 P 2 2 2 L P 2
After rearrangement, there is the following equation:
k g = μ Q L A 2 P 2 P 1 2 P 2 2
where Q is the gas volume flow in porous media. The relationship between Q and u has been reported in much literature [34,35]. In general, Q is easy to be measured, and the gas permeability of porous media can be obtained by using Equation (20).
In practice, the gas is not always dry. Considering the content of water vapor in the gas, the permeability (Pc) is expressed by the following formula:
P c = K v   μ Q L A 2 P 2 P 1 2 P 2 2
where Kv is the correction factor considering the content of water vapor in the gas, which is taken as 0.977 at 20 °C. The permeability (Pc) of the porous nozzle in this paper is also measured on the basis of Equation (21).
Combined with the previous variance analysis results (Table 4), it can be found that with the increase in the proportion and the size of fine sand, more pores of the nozzle are filled, and higher the pressure of gas escaping from the porous nozzle becomes, therefore, the measured permeability is smaller. From Figure 8, the calculated porosity also decreases. It is shown that the changing trend of the measured permeability and calculated porosity is consistent, which are both related to the proportion of fine sand.

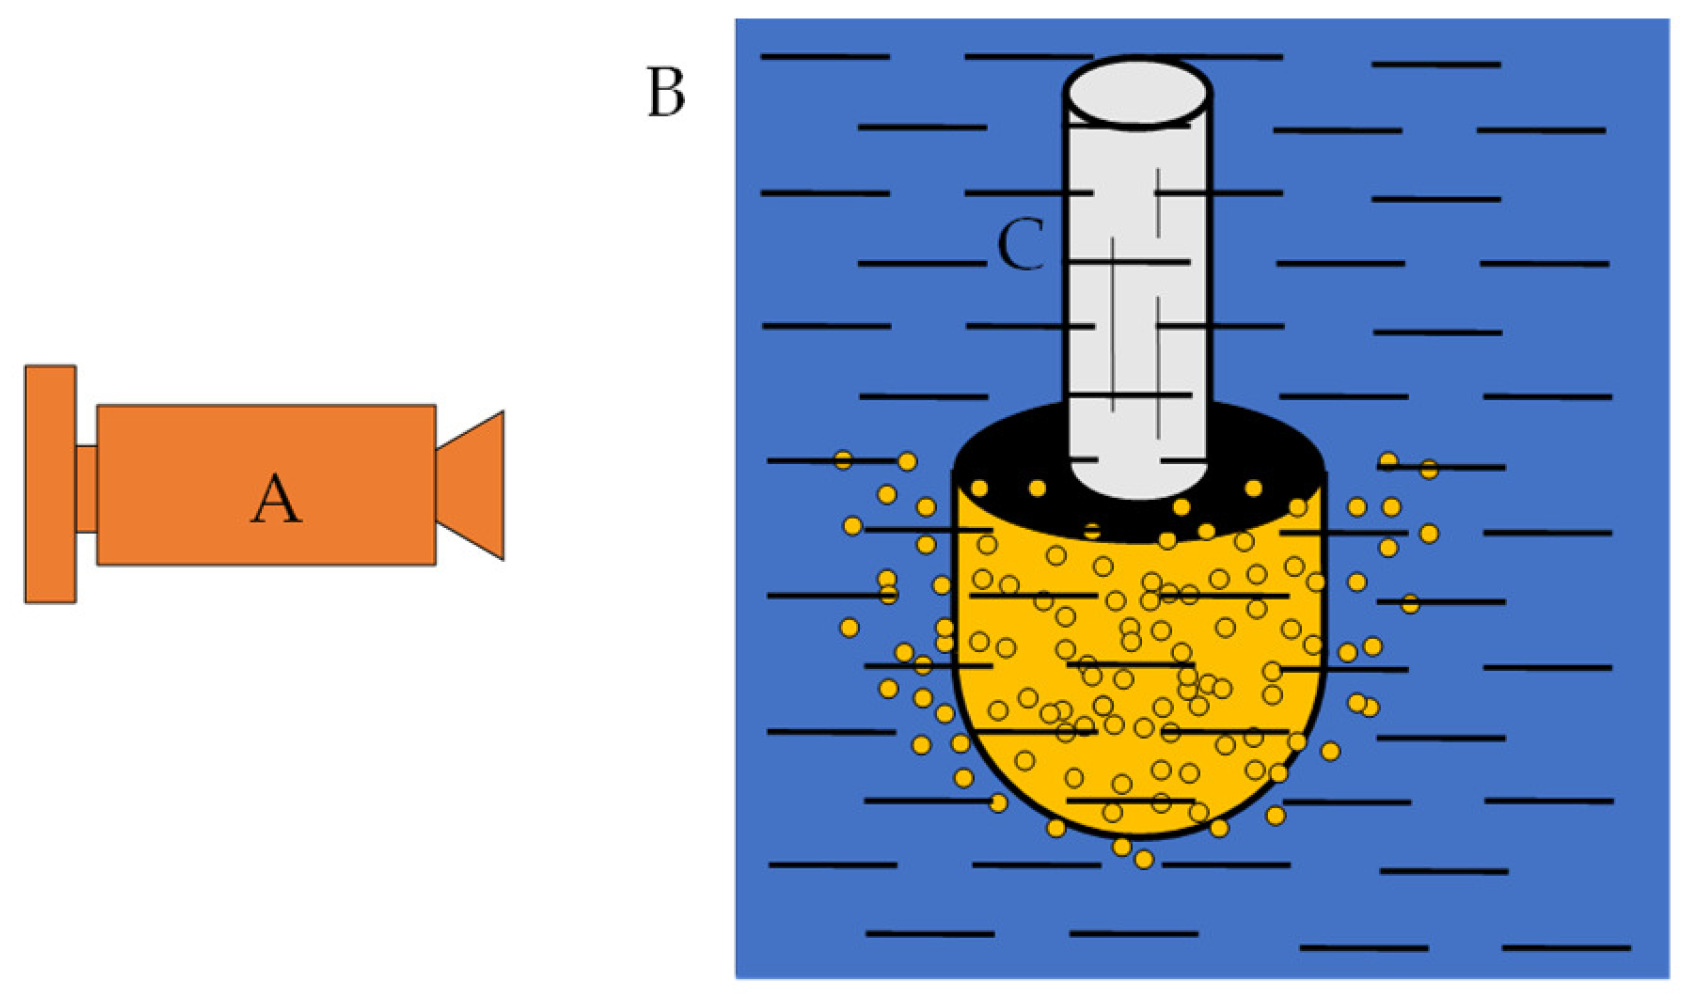
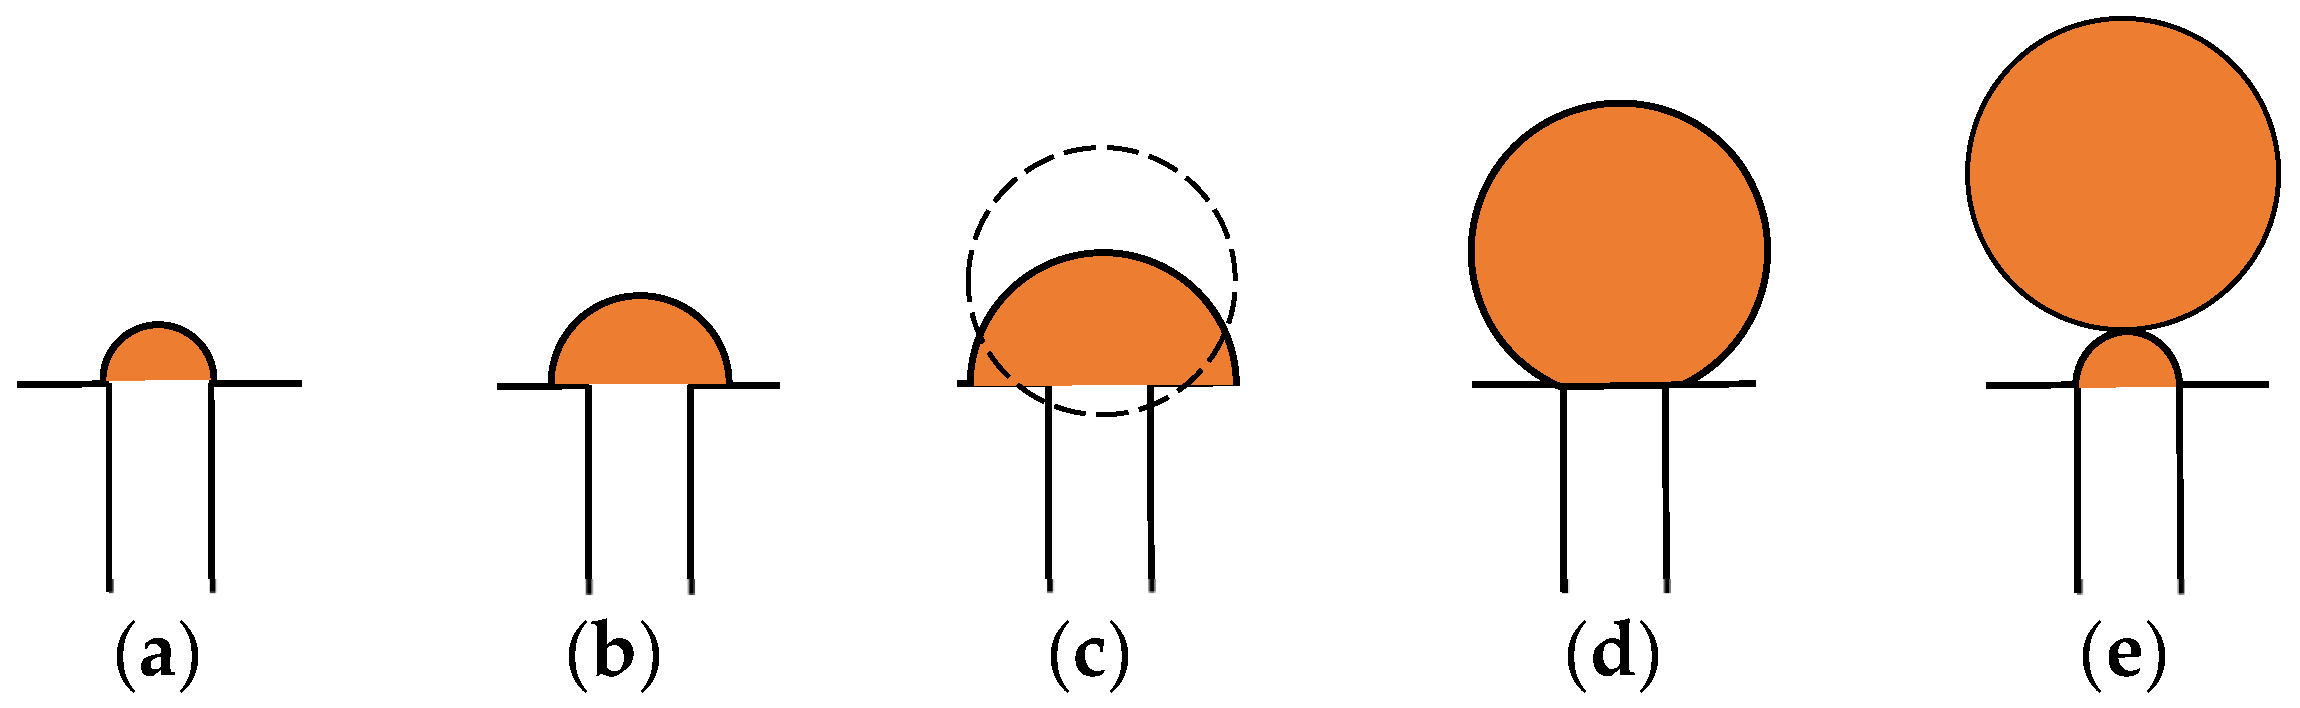
4.3. Model of the Bubble Formation Process

In the process of hydraulic simulation, a porous nozzle is used to inject gas into water. Therefore, the size of bubbles can be obtained according to the balance of forces acting on them. To study the formation process of bubbles, the following assumptions are made:
(1)
The liquid is a non-viscous fluid.
(2)
The gas flow is constant during the formation of the bubble.
(3)
The bubbles are spheres with the same volume.
In the process of bubble growth, bubbles are subject to the buoyancy of liquid, the impact force of airflow, the surface tension between gas and liquid on the bubble surface, and the inertial force of liquid acting on the bubble during nucleation and expansion of the bubble. Wraith [36] studied two stages of bubble formation when injecting gas with a nozzle: bubble growth and contraction, as shown in Figure 9. Figure 9a–c shows the growth stage of bubbles, and Figure 9d,e shows the contraction stage of bubbles.
At the outlet where the pores contact water, bubble nuclei formed due to the action of airflow. Because the bubbles are affected by the surface tension and the inertial force of the liquid acting on them, the bubbles are limited at the pore outlet and spread at the pore outlet in the form of hemispheres (see Figure 9b). With time, the accumulated gas gradually increases, and the volume of the bubble nuclei continues to increase. When a bubble nucleus reaches a certain size, the buoyancy of liquid and the impact force of air flow gradually dominate, and the bubble nucleus shrinks at the outlet of the pore (see Figure 9c). Once the shrinkage is completed, the bubble leaves the pore and leaves a new bubble nucleus in the pore.
From the bubble nucleus to leaving the pore, the bubbles are mainly subjected to buoyancy, surface tension, the impact force of airflow, and inertia forces. The forces reach a state of equilibrium when the bubble leaves the pore [36]:
F σ + F g = F b + F i
where Fσ is the surface tension of air bubbles, and Fσ = σπφg, Fg is inertia force, Fb is buoyancy, Fb = ρl g Vb, Vb = 1/6πdb3 is the volume of bubbles, Fi is impact force on the air bubble, Fi = ρgQ2/A, db is the diameter of the air bubble, σ is surface tension coefficient, Q is gas volume flow, ρl is the density of water, ρg is the density of gases, A = ϕA1 is the surface area occupied by the holes on the surface of the nozzle, and A1 is the surface area of the porous nozzle.
The force balance equation of the bubble has been studied by our group [37] when blowing out of the nozzle under the condition of constant gas flow:
ρ l g Q t + ρ g Q 2 A = σ π φ g + d d t k e ρ l Q t d L d t
where φg is the maximum spreading diameter of air bubbles between nozzle pores, L is the distance between the center of the bubble ball and the surface of the nozzle, t is the growth time of air bubbles, ke is the proportional factor, which is defined as the volume ratio of the liquid carried away by the bubbles to the volume of the bubbles.
Under the condition of a relatively low gas flow rate, only buoyancy in the water and the surface tension between the bubble surface are considered. The relationship between bubble diameter and bubble volume is given [37]:
d b = 6 σ φ g ρ l g 1 / 3
However, when the gas flow rate is large, the inertia force and the airflow impact force cannot be neglected. The maximum spreading diameter of the bubble in Equation (23) is expressed as φg = φ(t). Then, the integration of Equation (23) is made from 0 to t, as follows:
1 2 ρ l g Q t 2 + ρ g Q 2 A t = σ π 0 t φ ( t ) d t + k e ρ l Q t d L d t
Divide both sides by t and integrate again to get:
1 4 ρ l g Q t 2 + ρ g Q 2 A t = σ π 0 t 1 t 0 t φ ( t ) d t d t + k e ρ l Q L
The relationship between bubble volume and gas flow rate for constant gas flow rate is as follows.
V b = Q t
The bubble diameter is related to the bubble volume as follows.
V b = 1 6 π d b 3
The following expressions are obtained from Equation (27) and (28):
t = π d b 3 6 Q
Therefore, the expression of bubble diameter is obtained:
d b 6 + 24 ρ g Q 2 π ρ l g A d b 3 = 24 σ t ρ l g d b 3 0 t 1 t 0 t φ ( t ) d t d t + k e L 144 Q 2 π 2 g
When the gas flow rate is small (Q1 ≈ 0), the following expression can be deduced from Equation (30):
d b 3 = 24 σ t ρ l g 0 t 1 t 0 t φ ( t ) d t d t
By comparing with Equation (24), the following equation can be obtained:
t 0 t 1 t 0 t φ ( t ) d t d t = φ g 4
According to the bubble growth model in Figure 9, the forces in the equation are balanced when the bubble leaves the pore. At this time, the bubble sphere has been fully formed, so the distance between the center of the sphere and the surface of the pore is the radius of the bubble. According to Equation (32), L in Equation (30) is the radius of the bubble, so Equation (30) is rewritten as follows:
d b 5 + 24 ρ g Q 2 π ρ l g A 6 σ π φ g ρ l g d b 2 k e 72 Q 2 π 2 g = 0
Equation (33) is the relationship between the diameter of the bubble and the gas flow rate.
According to our current experimental system, ρl = 1 × 10³ kg·m−3, ρg = 1.25 kg·m−3, g = 9.8 m·s−2, σ = 7.28 × 10⁻² N/m, ke ≈ 7.8 × 10⁻⁵ and φg = 0.001 m. The nozzle is approximately regarded as a hemisphere with a radius of 1.5 cm, so A1 = 1.4 × 10⁻³ m2. Therefore, A = ϕA1 in Equation (33) is only related to the porosity of the nozzle. It can be seen from Table 5 that the porosity of the nozzle is affected by the proportion of fine sand in the nozzle. Therefore, it can be seen from Equation (33) that the bubble diameter is affected by the gas flow rate and the proportion of fine sand of the nozzle, and the effect of the gas flow rate on the bubble size under the different proportions of fine sand can be illustrated in Figure 10.
The bubble diameter of the nozzle with different composition ratios increases with the increase in gas flow. For the nozzle with a low proportion of fine sand, the bubble diameter is obviously affected. According to Equation (33), the bubble diameter is related to not only the gas flow but also the spreading at the bubble outlet.
When the proportion of fine sand is small, the pores of the nozzle themselves are large, and the initial diameter of the bubbles is large. When the bubbles are blown into the water, the different bubbles will inevitably overlap each other, which will result in bubbles partially coincident with each other when they leave the nozzle. Therefore, when the proportion of fine sand is small, the increase in bubble diameter is obvious. On the contrary, since the initial bubble diameter is small, it is not easy to spread and overlap, and the change in bubble diameter is small.
According to this result, in order to acquire bubbles with relatively smaller sizes, the low gas flow should be available. Otherwise, it is easy to cause the coalescence of bubbles. However, if the gas flow is too low, the number of bubbles generated is too small, which is not conducive to melt dehydrogenation. Therefore, the optimized gas flow depends on the experimental situation.
Mirgaux et al. [38] proposed mathematical modeling and CFD simulation of molten aluminum purification by flotation. It is found that flotation frequencies are related to bubble size, and local gas holdup (i.e., the number density of bubbles). However, they did not work out the calculation model of bubble size. The calculation of bubble size in bubble flotation was brought out in this paper, which is helpful for analyzing flotation frequencies. At the same time, the nozzle will produce more bubbles by using the selected optimal parameters, which is also useful to increase the number density of bubbles.

5. Conclusions

A new porous nozzle with controllable pores was developed. The permeability and compressive strength of porous nozzles were studied, and orthogonal experiments of porous nozzle parameter optimization were carried out. The hydraulic simulation experiments of porous nozzles were carried out. The variation of bubble diameter with a gas flow rate in the process of water simulation was analyzed. The conclusions can be drawn in the following:
(1)
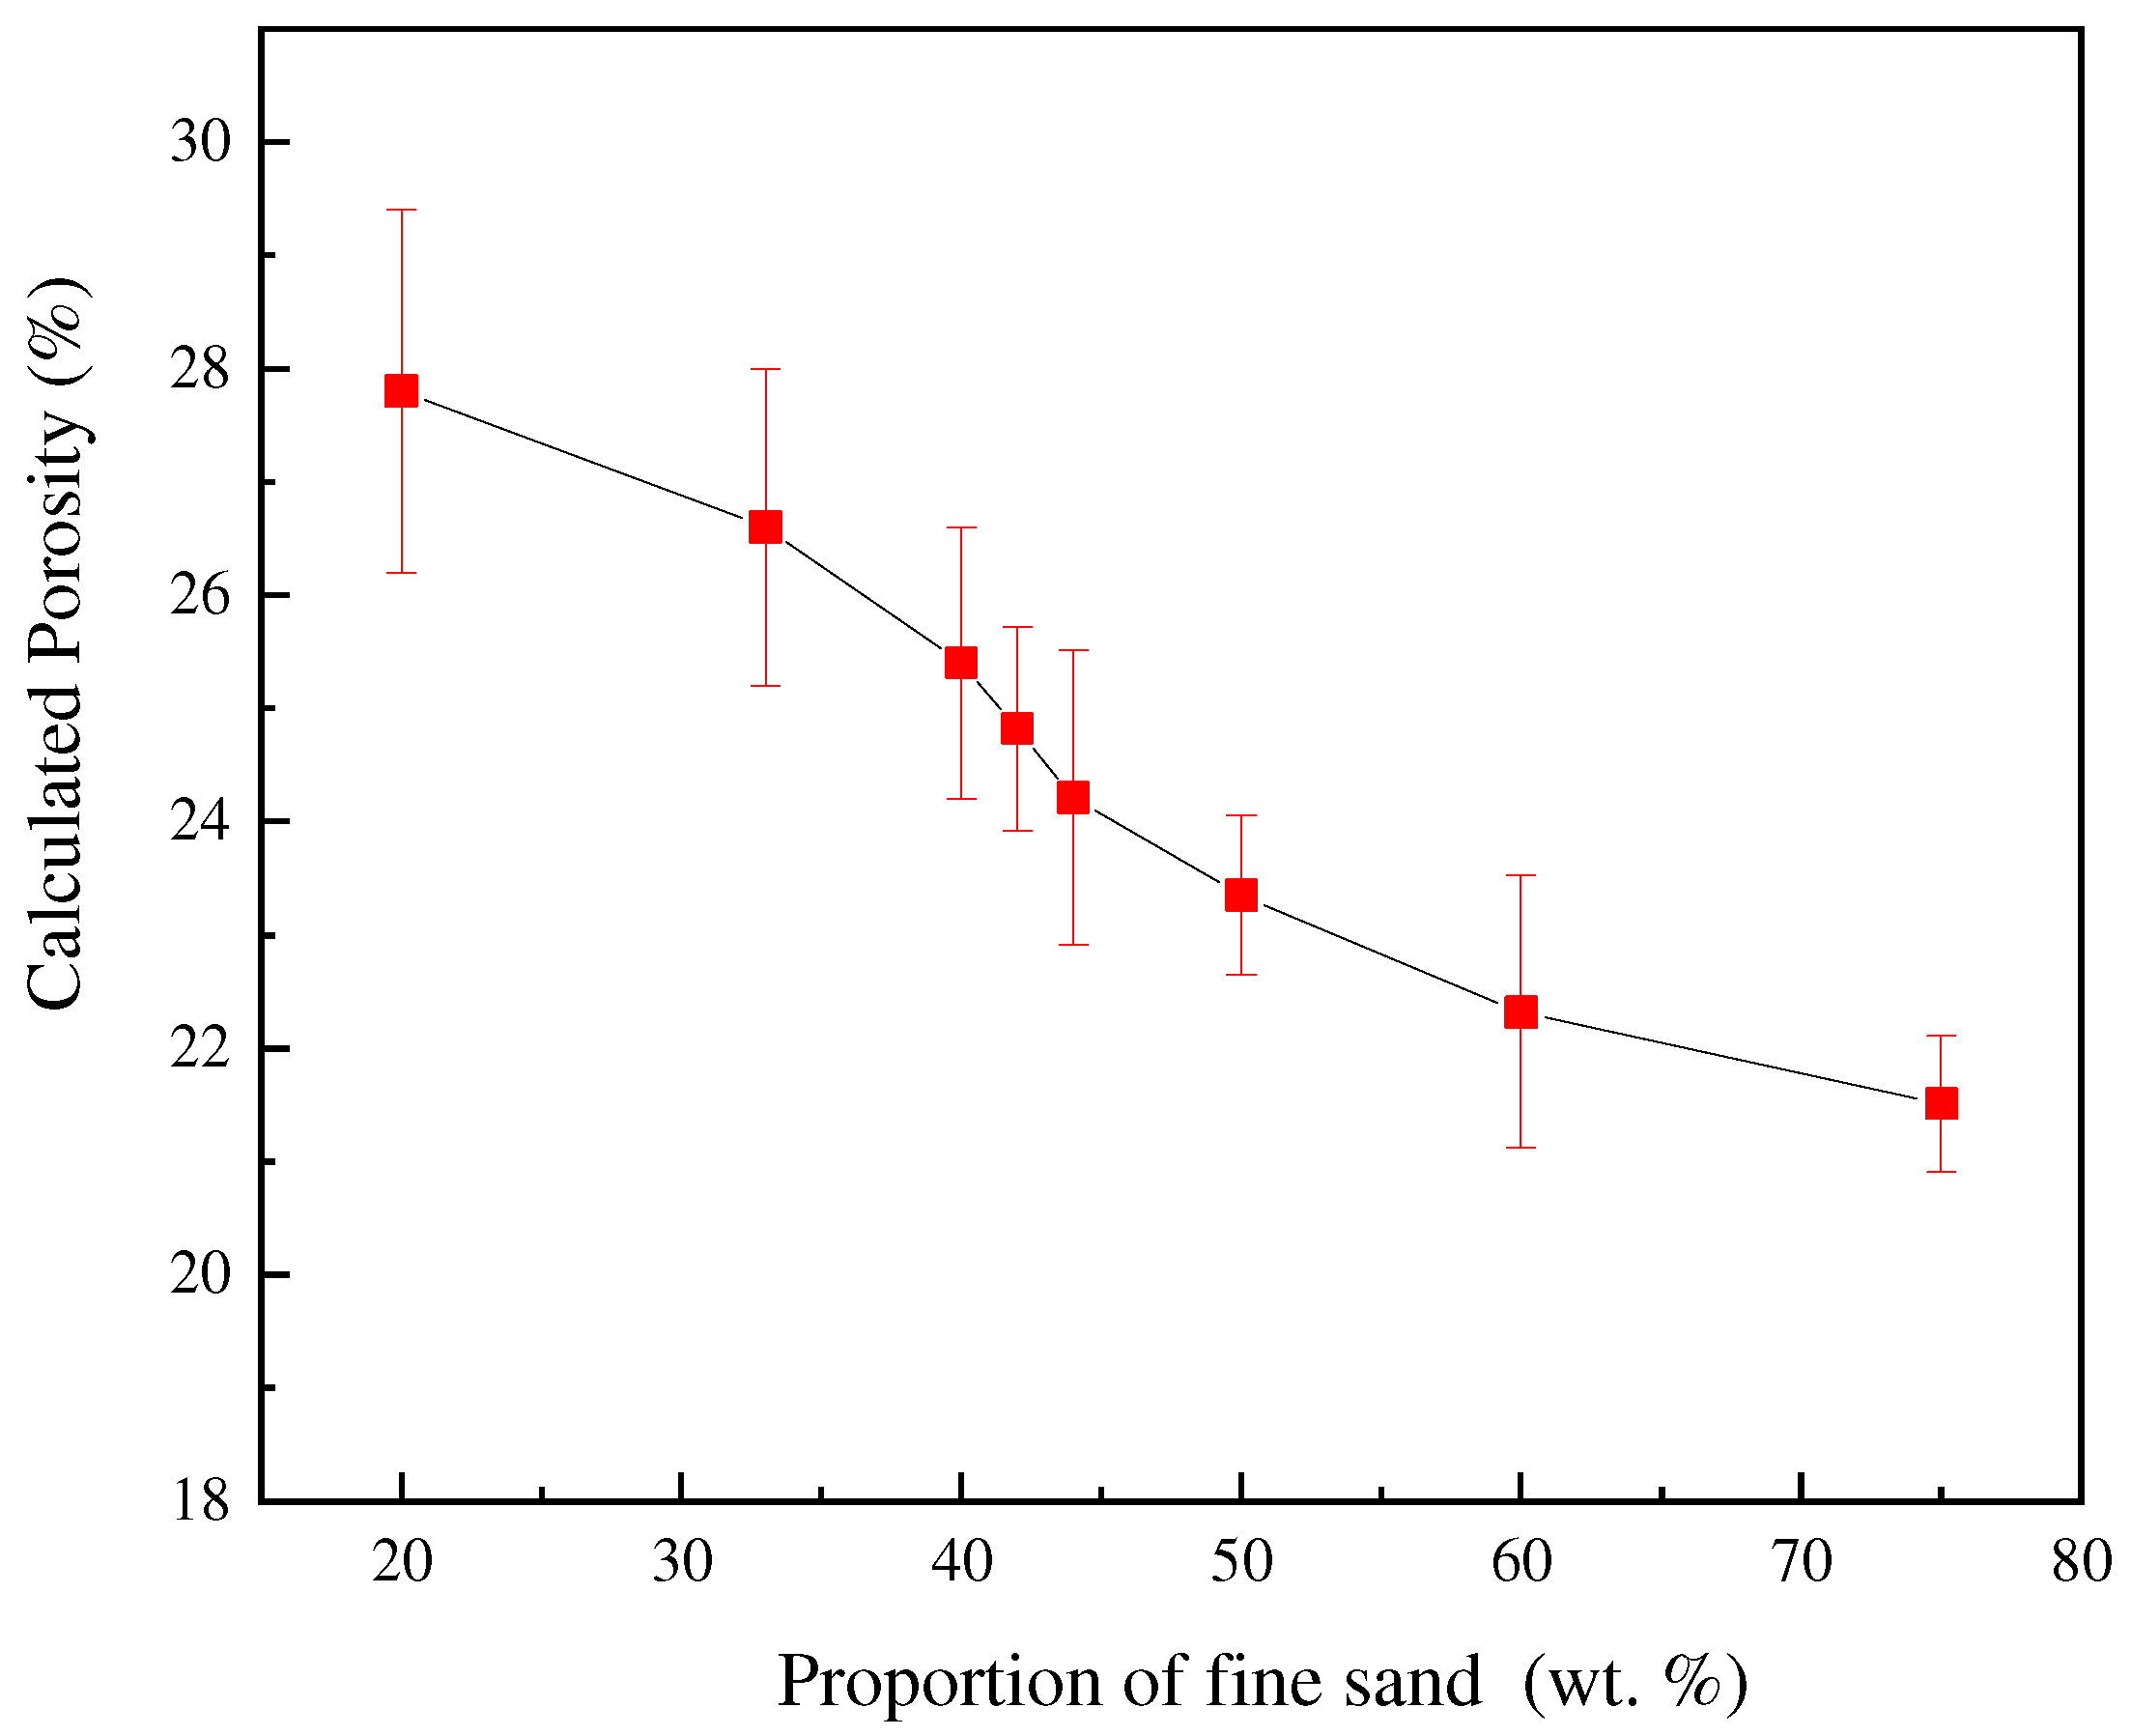
With the increase in the proportion of fine sand, the size of the fine sand increase and the proportion of added pore-forming agent decrease, the permeability of the porous nozzle decreases, the compressive strength increases, and the calculated porosity increases.
(2)
The optimal parameters of the porous nozzle are fine sand of 100 mesh, a binder of 17.5 wt.%, fine sand of 50 wt.%, pore-forming agent of 6 wt.%, and pressure of making sample of 5 MPa.
(3)
The nozzle with optimal parameters of preparation was prepared and tested, and the permeability is 112.2 × 10⁻¹² m2 and the compressive strength is 2.3 MPa.
(4)
Two methods can be used to achieve the purpose of controlling its porosity: One is controlling its permeability by directly controlling the proportion of pore-forming agent; the other is to adjust the proportion and size of fine sand, which can obtain a fine and uniformly and diffusely distributed bubble flow.
(5)
A physical model of gas transmission in the porous nozzle was proposed, and the calculation equation of gas permeability is given.
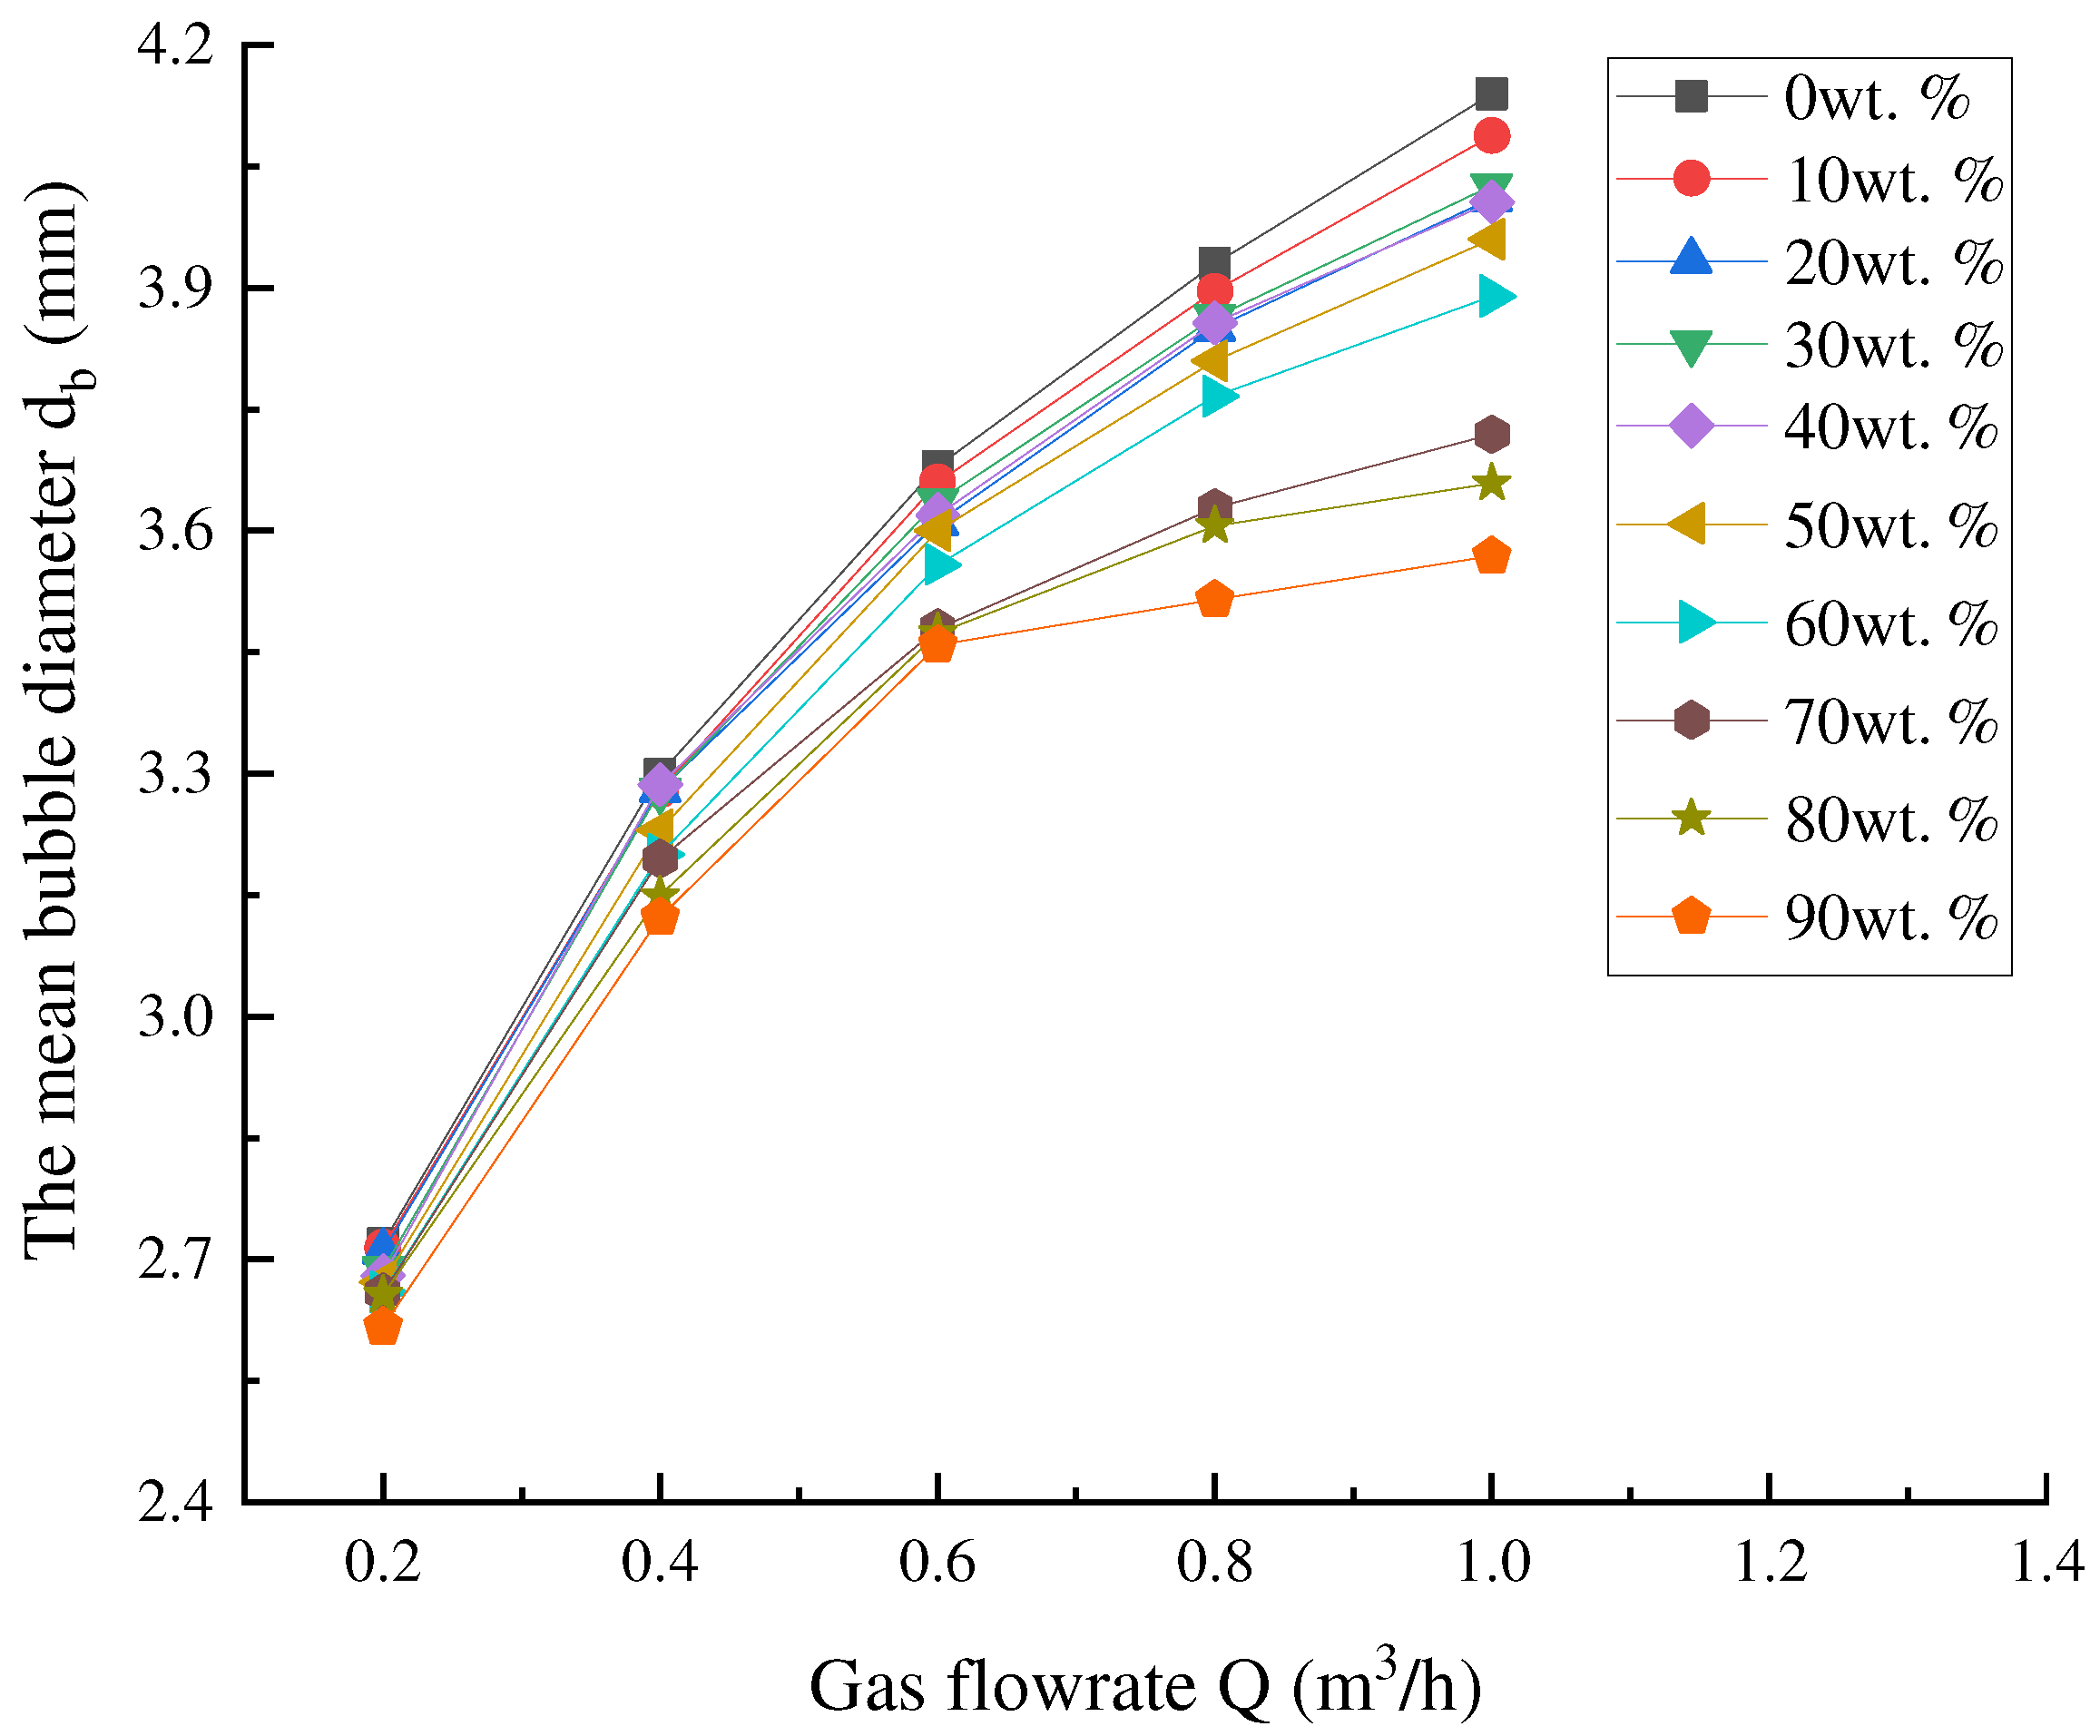
(6)
The mathematical model for calculating the bubble diameter of bubble floatation was formulated. The model shows that the bubble diameter of the nozzle increases with the increase in gas flow. For the nozzle with a low proportion of fine sand, the bubble diameter is obviously greatly affected.
The newly prepared porous nozzle has the merits of a simple preparation process and low-cost. It could produce tiny bubbles through the porosity itself rather than an electric rotary unit when the porous nozzle works and could be applied to the purification of aluminum alloy in the production line of aluminum processing enterprises, which could become an alternative method for purification and inclusion removal in aluminum melts.

Supplementary Materials

The following supporting information can be downloaded at: https://www.mdpi.com/article/10.3390/met13030586/s1. S1: Similarity Principle.

Author Contributions

Conceptualization, Y.T. and Z.X.; validation, Z.X. and Y.T.; formal analysis, G.Z.; investigation, Y.T., B.Y., W.L. and G.Z.; resources, Z.X.; data curation, Z.T. and J.Z.; writing—original draft preparation, Y.T.; software, Z.T., B.Y., J.W., A.J., L.X., H.T. and Q.Z. writing—review and editing, Y.T. and Z.X.; funding acquisition. Z.X., J.Z., W.L., J.W., A.J., L.X., H.T. and Q.Z.; All authors have read and agreed to the published version of the manuscript.

Funding

This work is supported by the National Natural Science Foundation of China-Guangxi Joint Fund (U20A20276), National Natural Science Foundation of China (51961008), and Guangxi Natural Science Foundation (2020GXNSFAA297269).

Institutional Review Board Statement

Not applicable.

Informed Consent Statement

Not applicable.

Data Availability Statement

Data supporting reported results can be found in this paper.

Conflicts of Interest

The authors declare no conflict of interest.

References

  1. Sun, W.; Zhu, Y.; Marceau, R.; Wang, L.; Zhang, Q.; Gao, X.; Hutchinson, C. Precipitation strengthening of aluminum alloys by room-temperature cyclic plasticity. Science 2019, 363, 972–975. [Google Scholar] [CrossRef] [PubMed]
  2. Yu, M.; Cui, J.; Tang, Z.; Shen, Z.; Zeng, J. Effect of Er-Rich Precipitates on Microstructure and Electrochemical Behavior of the Al-5Zn-0.03In Alloy. Metals 2022, 12, 131. [Google Scholar] [CrossRef]
  3. Tang, Z.; Cui, J.; Yu, M.; Zhu, W.; Xu, Z.; Zeng, J.; Xu, T.; Yang, H.; Tan, Y.; Yang, B. A new insight on the diffusion growth mechanism of intermetallic compounds in Al-Er system. Mater. Des. 2022, 224, 111341. [Google Scholar] [CrossRef]
  4. Ren, Y.; Chen, H.; Ma, W.; Lei, Y.; Zeng, Y. Purification of aluminium-silicon alloy by electromagnetic directional solidification: Degassing and grain refinement. Sep. Purif. Technol. 2021, 277, 119459. [Google Scholar] [CrossRef]
  5. Xu, Z.B.; Zou, Y.Z.; Wang, W.C.; Pang, X.Z.; Zeng, J.M. An Investigation on the Impurities of Aluminum Alloy in Melt Furnace. Adv. Mater. Res. 2010, 97–101, 1045–1048. [Google Scholar] [CrossRef]
  6. Hao, C.G.; Li, D.Z.; Zeng, J.M. Research on Porous Sprayer for Refining of Aluminium Melt. Adv. Mater. Res. 2012, 418–420, 1856–1859. [Google Scholar] [CrossRef]
  7. Damoah, L.; Zhang, L. AlF3 reactive Al2O3 foam filter for the removal of dissolved impurities from molten aluminum: Preliminary results. Acta Mater. 2011, 59, 896–913. [Google Scholar] [CrossRef]
  8. Zeng, J.; Ping, G.; Wang, Y. Investigation of Inner Vacuum Sucking method for degassing of molten aluminum. Mater. Sci. Eng. B 2012, 177, 1717–1720. [Google Scholar] [CrossRef]
  9. Li, Q.; He, K.; Wu, N.; Zeng, J. Purification of Aluminum melt in Crucibles by Bubble Flotation. Procedia Manuf. 2019, 37, 438–442. [Google Scholar] [CrossRef]
  10. Shi, B.; Pan, F.; Chen, X.; Tang, A.; Peng, J. Research and Development of Purification Technologies of Aluminum Alloy Melt. Mater. Rev. 2009, 23, 45–48. [Google Scholar]
  11. Gao, F.U.; Chen, W.; Qian, K. Synthetical technique of high-efficient melt-treatment of aluminum and its effect. Chin. J. Nonferrous Met. 2002, 2, 269–274. [Google Scholar]
  12. Zhan, H.H.; Zeng, J.M.; Chen, P.; Lin, Z.Y. A New Porous Mullite Nozzle for Refining Molten Aluminum. Appl. Mech. Mater. 2012, 117–119, 1701–1704. [Google Scholar] [CrossRef]
  13. Otaki, M. Melting and melt treatment of aluminum. J. Jpn. Inst. Light Met. 1994, 44, 461–471. [Google Scholar]
  14. David, E.; Kopac, J. Use of Separation and Impurity Removal Methods to Improve Aluminium Waste Recycling Process. Mater. Today Proc. 2015, 2, 5071–5079. [Google Scholar] [CrossRef]
  15. Éskin, G.I. Prospects of ultrasonic (cavitational) treatment of the melt in the manufacture of aluminum alloy products. Metallurgist 1998, 42, 284–291. [Google Scholar] [CrossRef]
  16. Zeng, J.; Li, D.; Xu, Z.; Wang, Y. Hydrogen Diffusion in Molten Aluminum A206 Casting Alloy. Adv. Sci. Lett. 2011, 4, 1740–1744. [Google Scholar] [CrossRef]
  17. Wu, R.; Qu, Z.K.; Sun, B.; Shu, D. Effects of spray degassing parameters on hydrogen content and properties of commercial purity aluminum. Mater. Sci. Eng. A 2007, 456, 386–390. [Google Scholar] [CrossRef]
  18. Ge, H.R.; Gan, W.K.; Lu, J.B.; Hu, Z.L.; Cao, D.G.; Yan, J.L.; He, C.Y.; He, H.; Zeng, J.M. The Purification of ZL114A Alloy by Means of Bubble Floatation. Adv. Mater. Res. 2014, 881–883, 1361–1364. [Google Scholar] [CrossRef]
  19. Szekely, A.G. The removal of solid particles from molten aluminum in the spinning nozzle inert flotation process. Metall. Trans. B 1976, 7, 259–270. [Google Scholar] [CrossRef]
  20. Zheng, J.; Carlson, W.B.; Reed, J.S. The packing density of binary powder mixtures. J. Eur. Ceram. Soc. 1995, 15, 479–483. [Google Scholar] [CrossRef]
  21. Furnas, C.C. Grading Aggregates-I.-Mathematical Relations for Beds of Broken Solids of Maximum Density. Ind. Eng. Chem. 1931, 23, 1052–1058. [Google Scholar] [CrossRef]
  22. Wang, T.; Ma, S.; Wang, X.; Hong, T.; Luo, Y. A 100% high-aluminum fly ash-based high-density mullite ceramic with a triple microstructure: Preparation and mechanical characterization. Constr. Build. Mater. 2020, 239, 117761. [Google Scholar] [CrossRef]
  23. Stovall, T.; Delarrard, F.; Buil, M. Linear parking density model of grain mixtures. Powder Technol. 1988, 48, 313–315. [Google Scholar]
  24. Yu, A.B.; Bridgwater, J.; Burbidge, A. On the modelling of the packing of fine particles. Powder Technol. 1997, 92, 185–194. [Google Scholar] [CrossRef]
  25. Liu, Q.; Jia, D.; Miao, J. Study of the linear and nonlinear packing model based on mixing of quartz sand. Powder Technol. 2020, 366, 382–394. [Google Scholar] [CrossRef]
  26. Dang, J.; Wu, D.; Cheng, J. Study on the dynamic degassing of aluminium alloy melt with rotary impeller in small melting-pot. J. North China Inst. Technol. 1998, 19, 132–137. [Google Scholar]
  27. Dsa, B.; Zd, A.; Ao, W.A.; Gga, B.; Ming, W.A. Motion and mass transfer models for single bubble in an aluminum melt under a compound field of ultrasonic and rotating flow. Results Phys. 2020, 19, 103386. [Google Scholar]
  28. Tzanakis, I.; Lebon, G.; Eskin, D.G.; Pericleous, K.A. Characterizing the cavitation development and acoustic spectrum in various liquids. Ultrason. Sonochemistry 2016, 34, 651–662. [Google Scholar] [CrossRef] [Green Version]
  29. Yen, K.; Chaki, T.K. A dynamic simulation of particle rearrangement in powder packings with realistic interactions. J. Appl. Phys. 1992, 71, 3164–3173. [Google Scholar] [CrossRef]
  30. Bear, J. Dynamics of Fluids in Porous Media; Dover Publications: New York, NY, USA, 1988; pp. 25–56. [Google Scholar]
  31. Pavan, V.; Oxarango, L. A New Momentum Equation for Gas Flow in Porous Media: The Klinkenberg Effect Seen Through the Kinetic Theory. J. Stat. Phys. 2007, 126, 355–389. [Google Scholar] [CrossRef]
  32. Wu, Y.S.; Pruess, K.; Persoff, P. Gas Flow in Porous Media With Klinkenberg Effects. Transp. Porous Media 1998, 32, 117–137. [Google Scholar] [CrossRef]
  33. Arabjamaloei, R.; Ruth, D.W. Lattice Boltzmann based simulation of gas flow regimes in low permeability porous media: Klinkenberg’s region and beyond. J. Nat. Gas Sci. Eng. 2016, 31, 405–416. [Google Scholar] [CrossRef]
  34. Fowler, J.L.; Hertel, K.L. Flow of a Gas Through Porous Media. J. Appl. Phys. 1940, 11, 496–502. [Google Scholar] [CrossRef]
  35. Neuman, S.P. Theoretical derivation of Darcy’s law. Acta Mech. 1977, 25, 153–170. [Google Scholar] [CrossRef]
  36. Wraith, A.E. Two stage bubble growth at a submerged plate orifice. Chem. Eng. Sci. 1971, 26, 1659–1671. [Google Scholar] [CrossRef]
  37. Zhu, K.; Xu, Z.; Zhao, S.; Zeng, J. Bubble Flotation for Purification of High Manganese Steel with Porous Blower. Procedia Manuf. 2019, 37, 375–379. [Google Scholar] [CrossRef]
  38. Mirgaux, O.; Ablitzer, D.; Waz, E.; Bellot, J.P. Mathematical Modeling and Computer Simulation of Molten Aluminum Purification by Flotation in Stirred Reactor. Metall. Mater. Trans. B 2009, 40, 363–375. [Google Scholar] [CrossRef]
Figure 1. The manufacturing process of a porous nozzle.
Metals 13 00586 g001
Figure 2. Assembly sketch of the equipment for hydraulic analogy. A—Nitrogen-gas tank; B—relief valve; C—manometer; D—air filter; E—molecular sieve; F—gas flowmeter; G—solenoid valve; H—porous nozzle; I—water; J—control panel; V1-V2-V3—common valve.
Metals 13 00586 g002
Figure 3. Sketch of the position of the camera. A—high-speed camera; B—beaker wall; C—porous nozzle.
Metals 13 00586 g003
Figure 4. Effects of the proportion of pore-forming agent, the proportion of fine sand and the size of fine sand on the permeability and compressive strength.
Metals 13 00586 g004
Figure 5. The hydraulic simulation photo of the porous nozzle with different proportions of fine sand: (a) 0, (b) 25 wt.%, (c) 50 wt.%, (d) 75 wt.%, (e) 100 wt.%.
Metals 13 00586 g005
Figure 6. The hydraulic simulation photo of the porous nozzle with different sizes of fine sand: (a) 50 mesh, (b) 100 mesh, (c) 200 mesh, (d) 300 mesh.
Metals 13 00586 g006
Figure 7. The hydraulic simulation photo of the porous nozzle with different proportions of pore-forming agent: (a) 0, (b) 3 wt.%, (c) 6 wt.%.
Metals 13 00586 g007
Figure 8. Effect of different fine sand proportions on calculated porosity.
Metals 13 00586 g008
Figure 9. The growth physical model of a bubble [37]: (a) The bubble nucleus; (b) the spherical propagation of the bubble; (c) the transition stage; (d) the contraction of the bubble; (e) a bubble separating from porosity with new nucleus left.
Metals 13 00586 g009
Figure 10. Effect of gas flow rate on the bubble size under the different proportions of fine sand.
Metals 13 00586 g010
Table 1. Preparation parameters of the nozzle with different levels.
LevelThe Proportion of Binder/wt.%Size of Fine Sand/MeshThe Proportion of Fine Sand/wt.%The Pressure of Making Sample/MPaThe Proportion of Pore-Forming agent/wt.%
11050030
212.5802543
3151005056
417.52007569
520300100712
Table 2. Experimental results of the orthogonal experiment.
Sample No.Amount of BinderSize of Fine SandThe Proportion of Fine SandThe Pressure of Making SampleThe Proportion of Pore-Forming agentErrorPermeability
/×10−12 m2
Compressive Strength/MPa
111111170.95
212222246.56
313333397.54.2
41444442.79816
51555557.19.5
6212345224.50.3
7223451267.50.2
823451259.79
92451236.0116
10251234160.80.7
1131352448.594.4
1232413598.63
1333524161.23.2
14341352272.70.1
1535241337.4510
16414253225.20.5
1742531415.669.3
18431425138.320.9
194425316.616
2045314226.76.9
2151543246.96.5
22521543144.20.8
23532154147.90.9
245432153.9419
255543212.7520
Table 3. Variance analysis of air permeability of nozzle.
Variance SourceDegree of FreedomDeviations Sum of SquareF Valuep ValueSignificance
Regression6373.0826.210.001Significant
Binder10.5650.060.815Insignificant
Size of fine sand1102.97710.290.005Significant
The proportion of fine sand1134.27213.410.002Significant
The pressure of making sample13.8860.390.541Insignificant
The proportion of pore-forming agent1131.15613.100.002Significant
Experimental error10.2260.020.882Insignificant
Systematic error18180.213
Total24553.295
Table 4. Variance analysis of compressive strength.
Variance SourceDegree of FreedomDeviations Sum of SquareF Valuep ValueSignificance
Regression630.98447.940.000Significant
Binder10.00030.000.983Insignificant
Size of fine sand19.655314.850.001Significant
The proportion of fine sand19.837915.130.001Significant
The pressure of making sample10.72151.110.306Insignificant
The proportion of pore-forming agent110.698316.460.001Significant
Experimental error10.07120.110.744Insignificant
Systematic error1811.7021
Total2442.6866
Table 5. Effect of different fine sand proportions on calculated porosity.
The proportion of fine sand (wt.%)0102030405060708090
Porosity (%)26.6026.1925.4024.8224.2123.3522.3221.0019.8118.41
Disclaimer/Publisher’s Note: The statements, opinions and data contained in all publications are solely those of the individual author(s) and contributor(s) and not of MDPI and/or the editor(s). MDPI and/or the editor(s) disclaim responsibility for any injury to people or property resulting from any ideas, methods, instructions or products referred to in the content.

