Article

Effect of Liquid Metal Embrittlement Indent Cracks on Zinc Coated 3rd Generation AHSS Mechanical Performance

1
CAMJ Group, Mechanical and Mechatronic Engineering Department, University of Waterloo, Waterloo, ON N2L 3G1, Canada
2
Manufacturing Systems Research Laboratory, General Motors R&D, Warren, MI 48092, USA
*
Author to whom correspondence should be addressed.
Metals 2023, 13(3), 491; https://doi.org/10.3390/met13030491
Submission received: 23 January 2023 / Revised: 20 February 2023 / Accepted: 21 February 2023 / Published: 27 February 2023
(This article belongs to the Special Issue Advanced Welding Technology in Metals II)

Abstract

:
Third-generation advanced high-strength steels (3G-AHSS) are typically galvanized to prevent corrosion of the outer body structure. However, the zinc coating on the surface, combined with the locally elevated temperatures generated during the resistance spot welding (RSW) process, can provide the prerequisites for liquid metal embrittlement (LME). This work uses two strategies to control LME crack formation: current pulsation and varying the electrode geometry. These two methods were compared to a baseline welding schedule for a 3G-980-GI coated AHSS. The effectiveness of each method was discussed in terms of the overall weld cracking index and local cracking index. The results showed that increasing the current pulses results in a slower energy input into the weld, which can help to reduce LME crack formation. Introducing more pulses (five to seven pulses) reduced LME crack formation while maintaining the same welding time. Regarding the electrode geometry, the results showed an increase in LME cracking index for currents below the expulsion level Imax-10% when the electrode face diameter increased, whereas at the current level Imax-200A, the electrode radius was the most important factor to control LME crack index. For the current level above the expulsion, Imax+10%, a drastic decrease in the LME cracking index was observed when a large electrode surface diameter was used. The electrode radius was not a significant factor in controlling LME. The mechanical properties of selected conditions were examined using the lap shear test and the results showed no significant effect of LME cracks on the shear tensile strength. The location of the failure indicated that most of the cracks are located in the indented area (type A), which does not influence the lap shear strength.

1. Introduction

In recent years there has been mounting global concern regarding greenhouse gas emissions, and several industries, including the automotive industry, are facing more stringent emissions standards [1]. As vehicle weight directly correlates with fuel consumption and emissions, weight reduction has been deemed an important directive in the automotive industry [2]. Third-generation advanced high-strength steels (3G-AHSS) have been developed to solve this problem as they offer superior mechanical properties at a lower price compared to the second generation of AHSS [3]. These steels are typically coated with a thin zinc coating to improve longevity by protecting the steel substrate from corrosion [4].
In automotive assembly, 3G-AHSS are typically joined using resistance spot welding (RSW), a process where a high current is passed through the steel sheets causing local melting and allowing the materials to fuse at the sheet–sheet interface [5]. Although RSW is typically used on various steels, there have been some issues regarding the formation of weld defects when welding some grades of coated 3G-AHSS with this process, specifically the formation of liquid metal embrittlement (LME) cracks. LME is a cracking mechanism that occurs due to the presence of Zn on the steel surface. Due to the lower melting point of zinc (≈419 °C) compared to steel (≈1500 °C), the zinc melted during the welding process [6,7]. Subsequently, the liquid zinc can penetrate the steel substrate along the grain boundaries of the steel due to the tensile stresses caused by the welding electrode during the welding process, leading to the formation of LME cracks in LME susceptible steels, which could reduce the strength of the spot weld joint [8,9].
Three factors must be present for LME to occur: a liquid metal, susceptible microstructure, and tensile stresses [7]. Some 3G-AHSS grades have been found susceptible to LME due to their high alloying content and multi-phase microstructure [10]. Several process parameters can be changed during the welding process to change the LME response of the weld. Process parameters that have been assessed in the literature include but are not limited to varying electrode force [3,11,12], current pulsing [13], varying the current through the welding cycle (current ramping) [14], and increasing holding time [9]. Other parameters related to varying the electrode geometry [15,16,17] and the effect of electrode misalignment on LME cracks [18,19] were also investigated. Kim et al. [20] evaluated the LME cracking for galvannealed Zn coated (GA)-transformation-induced plasticity (TRIP) AHSS by varying several parameters, including the welding force, electrode shape, and holding time. Kim used a statistical approach to understand the effect of these parameters on the LME severity and found that increasing welding force will reduce the LME cracks while increasing the welding current and time will increase the LME cracks [20]. The effect of welding force on cracking behaviour was investigated, a decrease in Type B (shoulder) cracks when high welding force was used, which was attributed to the increase in the cooling rate and a decrease in the peak temperature near the shoulder area [3,21]. Current pulsing was found to be effective at reducing LME cracks due to the slow increase of heat generation at the electrode/sheet interface, which was found to stabilize the coating without weakening the material sufficiently to cause electrode collapse [13]. Using a ramped-down current pulse to apply the welding current was investigated by DiGiovanni et al. [22]. It was found that this technique could reduce tensile stresses after electrode release inside the indentation area, thus reducing LME severity.
Further work on ramping showed that reductions in LME cracking were due to changes in surface temperature, resulting in the material surface spending less time in the liquid zinc region and a reduced thermal shock upon electrode release [8]. Selecting appropriate electrode geometry was reported as an effective way to mitigate LME cracking, as it can affect the current density and the contact area, altering the temperature and thermal stresses around the weld pool. Murugan et al. [17] studied the effect of electrode design on LME cracking and found that the electrode radius is a key parameter to controlling LME cracking while increasing the electrode diameter had a minor effect on LME cracking [17]. Another study by Barthelmie et al. [23] found that utilizing a larger electrode diameter and higher clamping force reduces the LME cracking by 50% for high Mn AHSS sheets.
As mentioned above, several studies have shown that it is possible to control the severity of LME by altering the RSW process variables. However, there is no direct comparison of the effectiveness of these different process parameters in terms of LME severity. In addition, it is critical to understand and control the formation of cracks in certain areas, as it has been shown that crack location directly influences the strength loss of the welded joint caused by LME. Moreover, a comprehensive study that compares the influence of multiple techniques is missing in the available literature. To understand how the various RSW parameters investigated in past studies control LME and their relative effectiveness in changing LME, they need to be assessed on a single material. Therefore, this work investigates the effect of current pulsing and various electrode geometries, diameters, and radii on LME cracking. To accomplish this, testing was done on a highly LME-susceptible galvanized (GI)-coated 3G-980 AHSS. This study aims to provide an industrially relevant solution that can be adapted to improve the weldability of coated 3G-AHSS.

2. Experimental Procedure
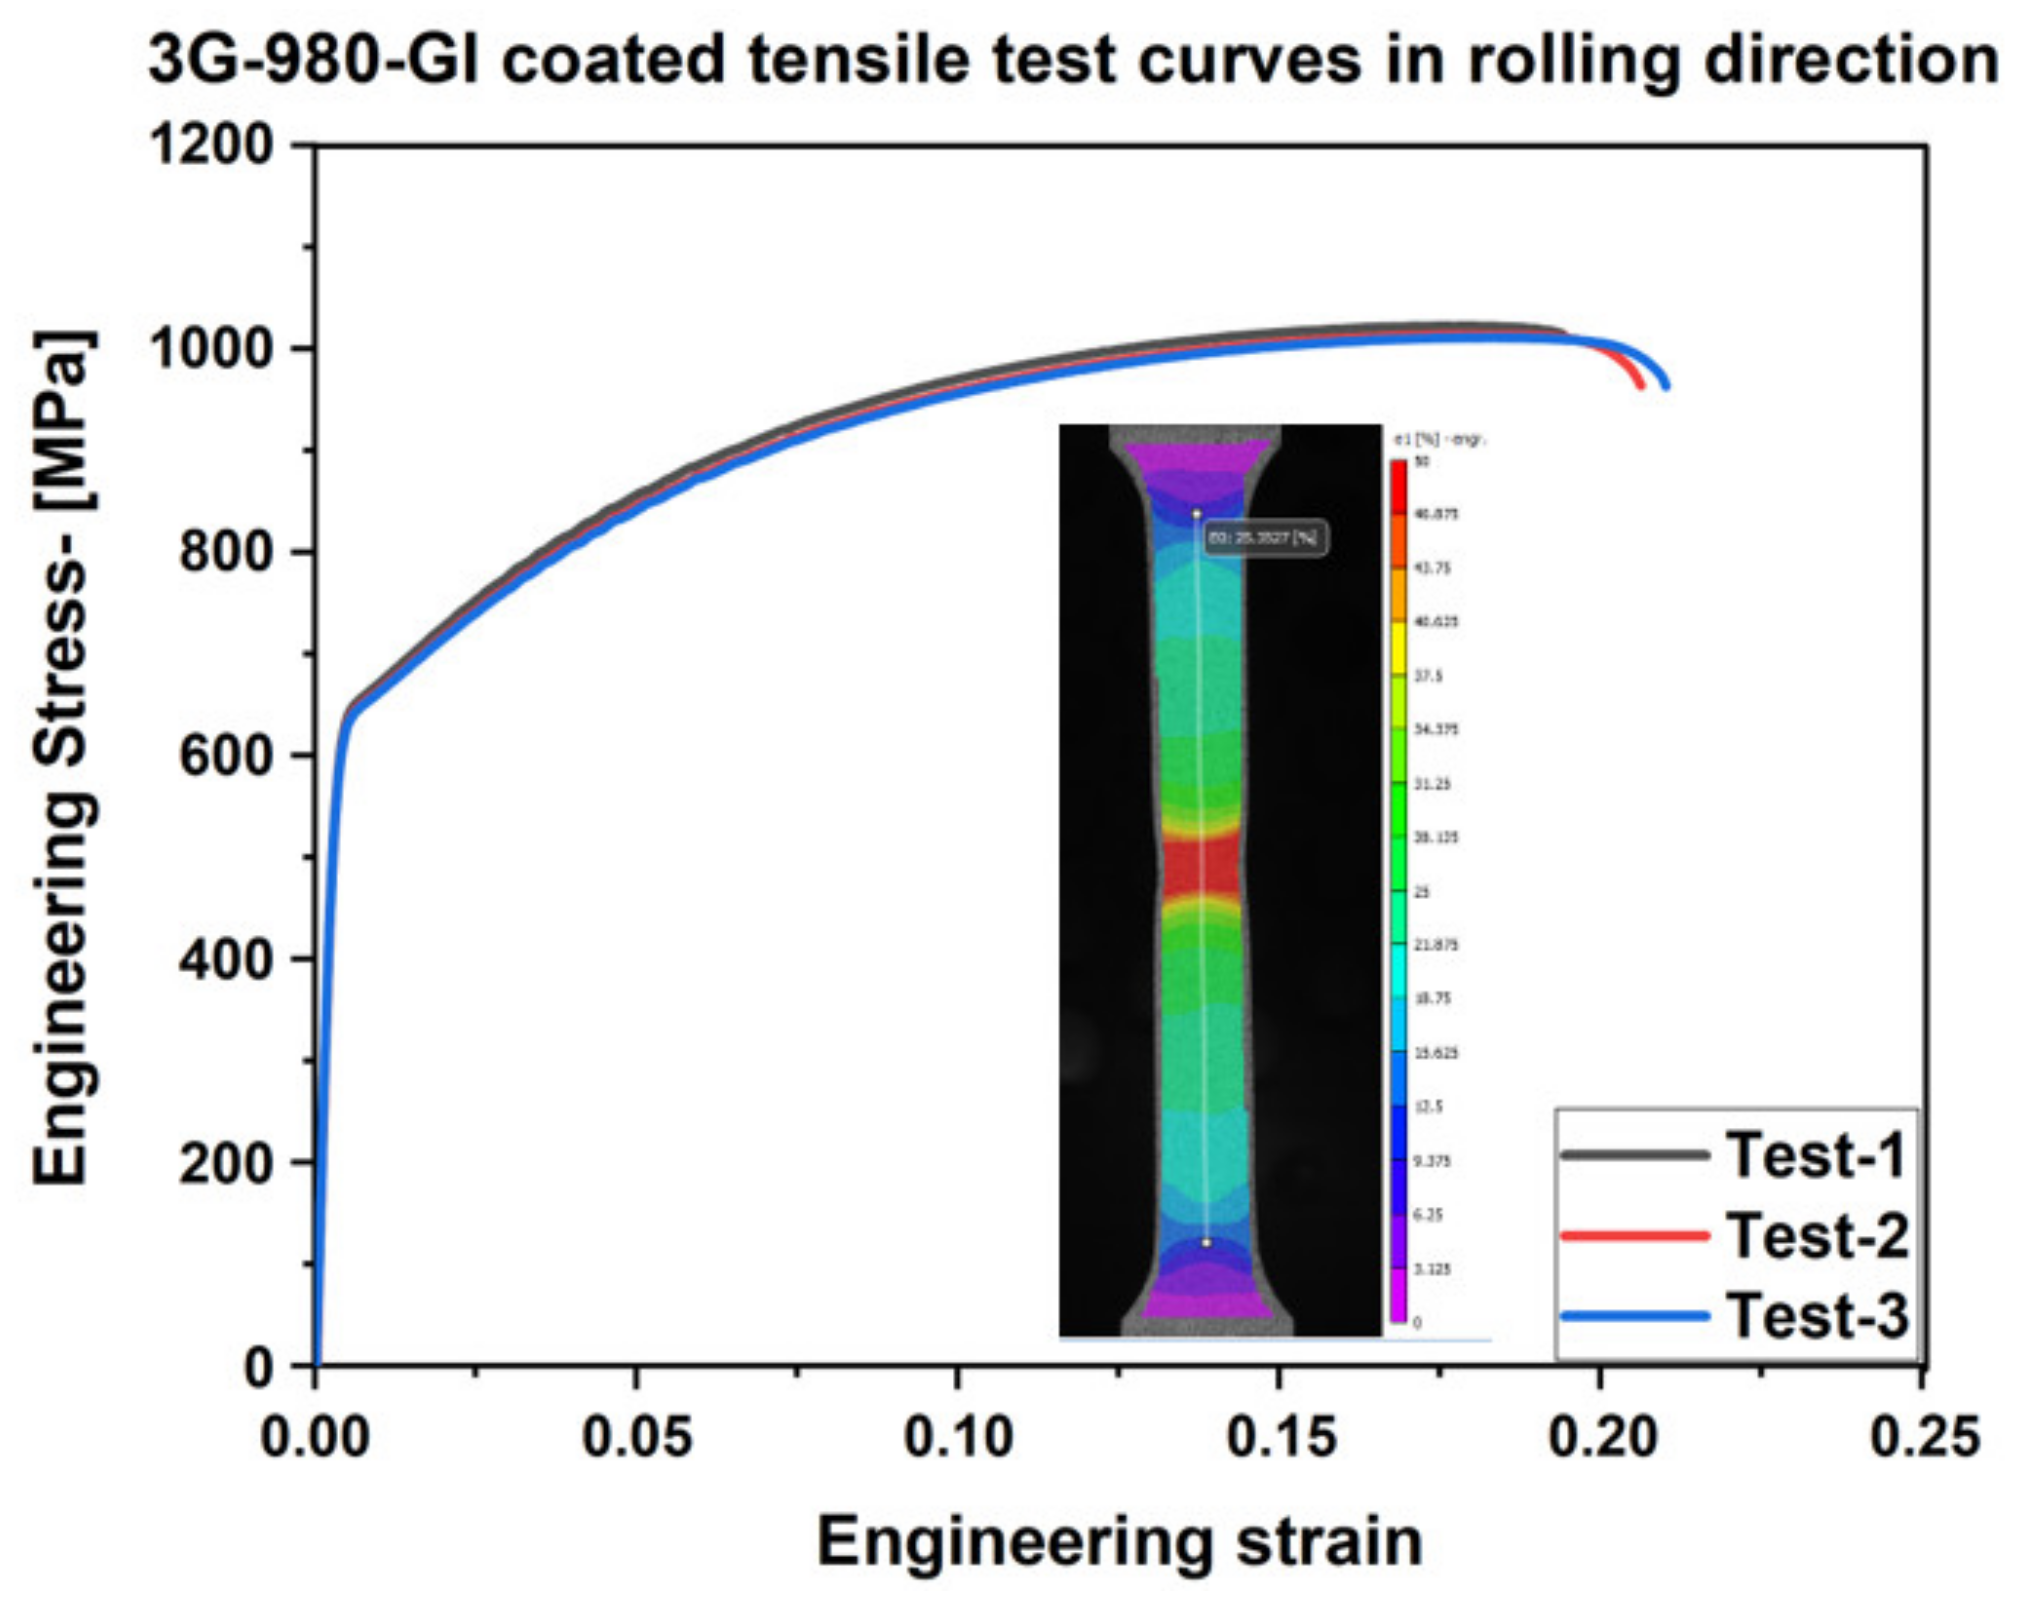
2.1. Materials

In this study, one of the highly susceptible galvanized (GI) coated 3G-980 AHSS with a nominal thickness of 1.4 mm was chosen to investigate different LME crack reduction strategies. The mechanical properties of the base material were examined at room temperature using ASTM-E8 standard tensile testing procedure [24], the gauge length within tensile coupons was machined parallel to the rolling direction, and the engineering stress–strain curves are shown in Figure 1.The strain was measured using stereoscopic DIC software, Vic 3D R9.1, from Correlated Solutions Inc. (Irmo, SC, USA) with a 50 mm virtual extensometer. The chemical composition and the summary of the mechanical properties of the material are listed in Table 1. The carbon equivalent of the material was calculated using the formula suggested by Yurioka et al. [25]; the carbon equivalent of the investigated material was relatively high (0.63) compared to conventional AHSS. The as-received material microstructure consisted of multiple phases, including ferrite, martensite, bainite, and retained austenite, achieving high strength and ductility simultaneously.

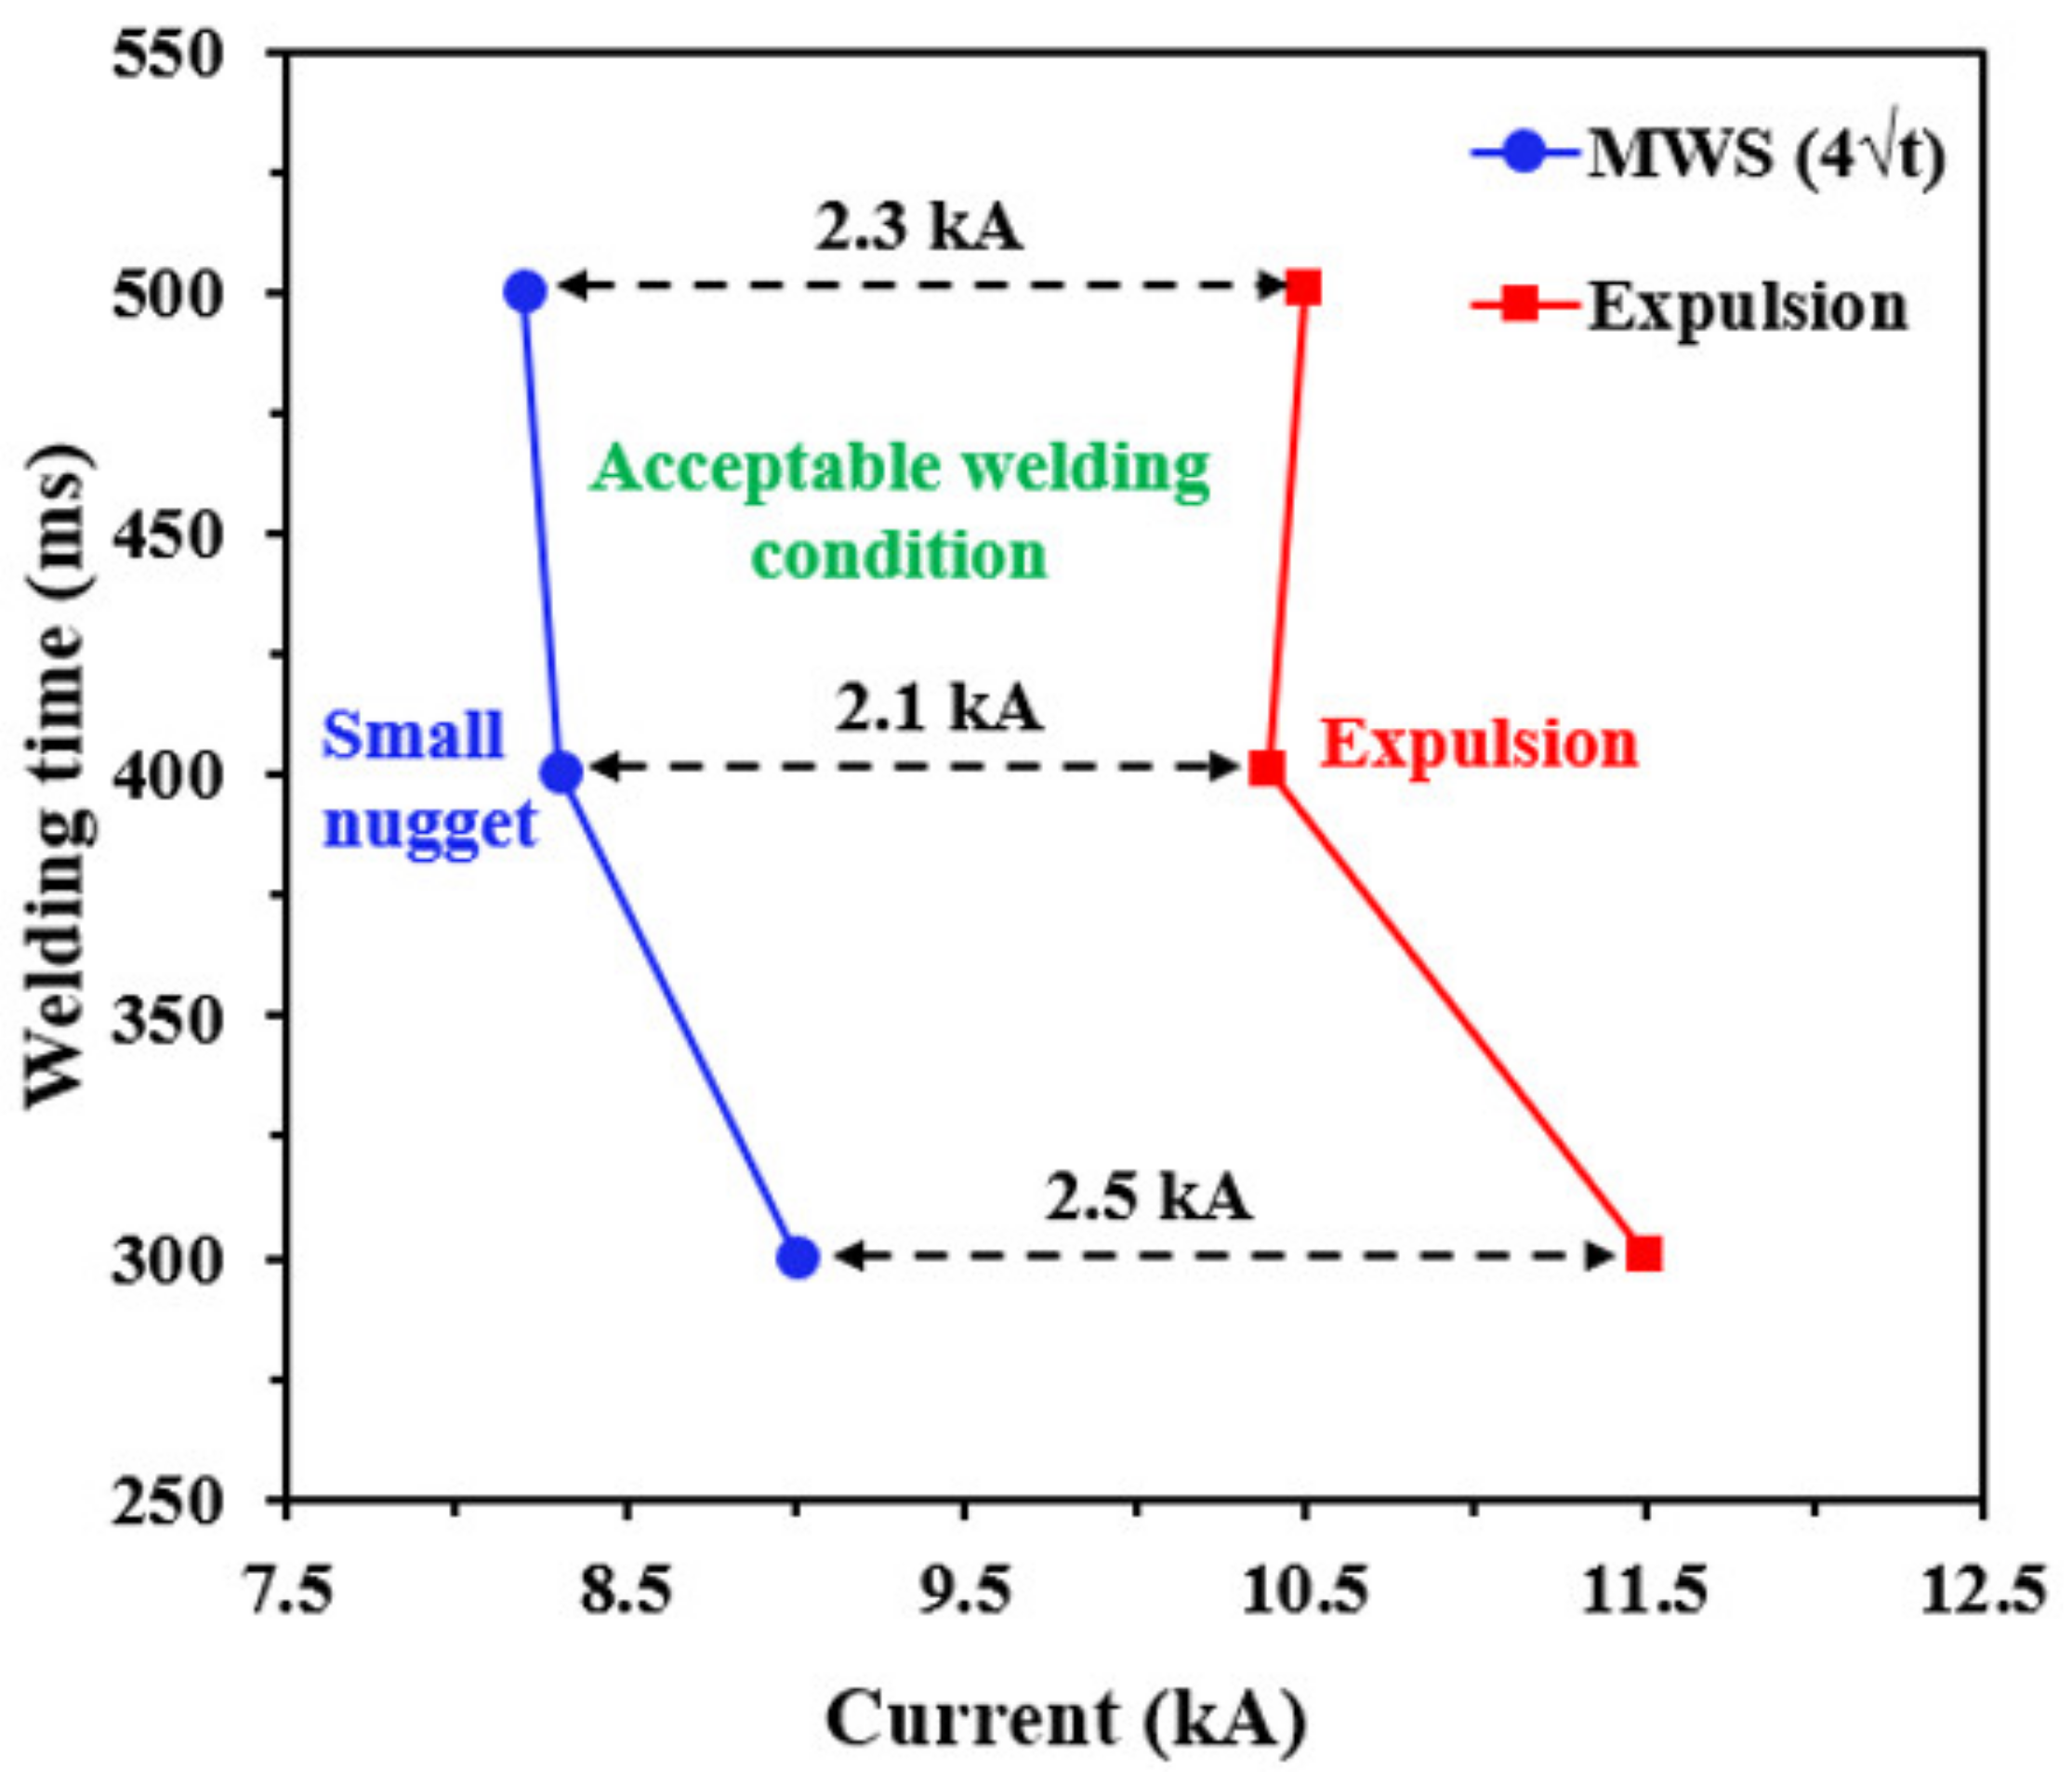
2.2. Welding Process Development

The resistance spot welding process was performed using a medium-frequency (~1 kHz) direct current robot equipped with a Rexroth Bosch controller. This work uses the welding schedule recommended by the AWS D8.9 standard for the baseline condition with a pair of 7 mm flat-faced Cu-Cr electrodes [26]. The weldability lobe, which shows the minimum and maximum allowable welding current, was developed by varying the welding time 25% above and below the recommended schedule by AWS D8.9 as shown elsewhere [27]. Chisel tests were used to examine the welds and determine the nugget size. The minimum nugget size was determined using the sheet thickness formula ( 4 t ), where t is the sheet thickness. The weldability window’s current was incrementally increased by 100 A until expulsion was observed. The current resulting in expulsion was noted as Imax. The clamping force was fixed at a value of 4.9 kN based on the AWS D8.9 recommended value; the welding lobe for the material is shown in Figure 2.

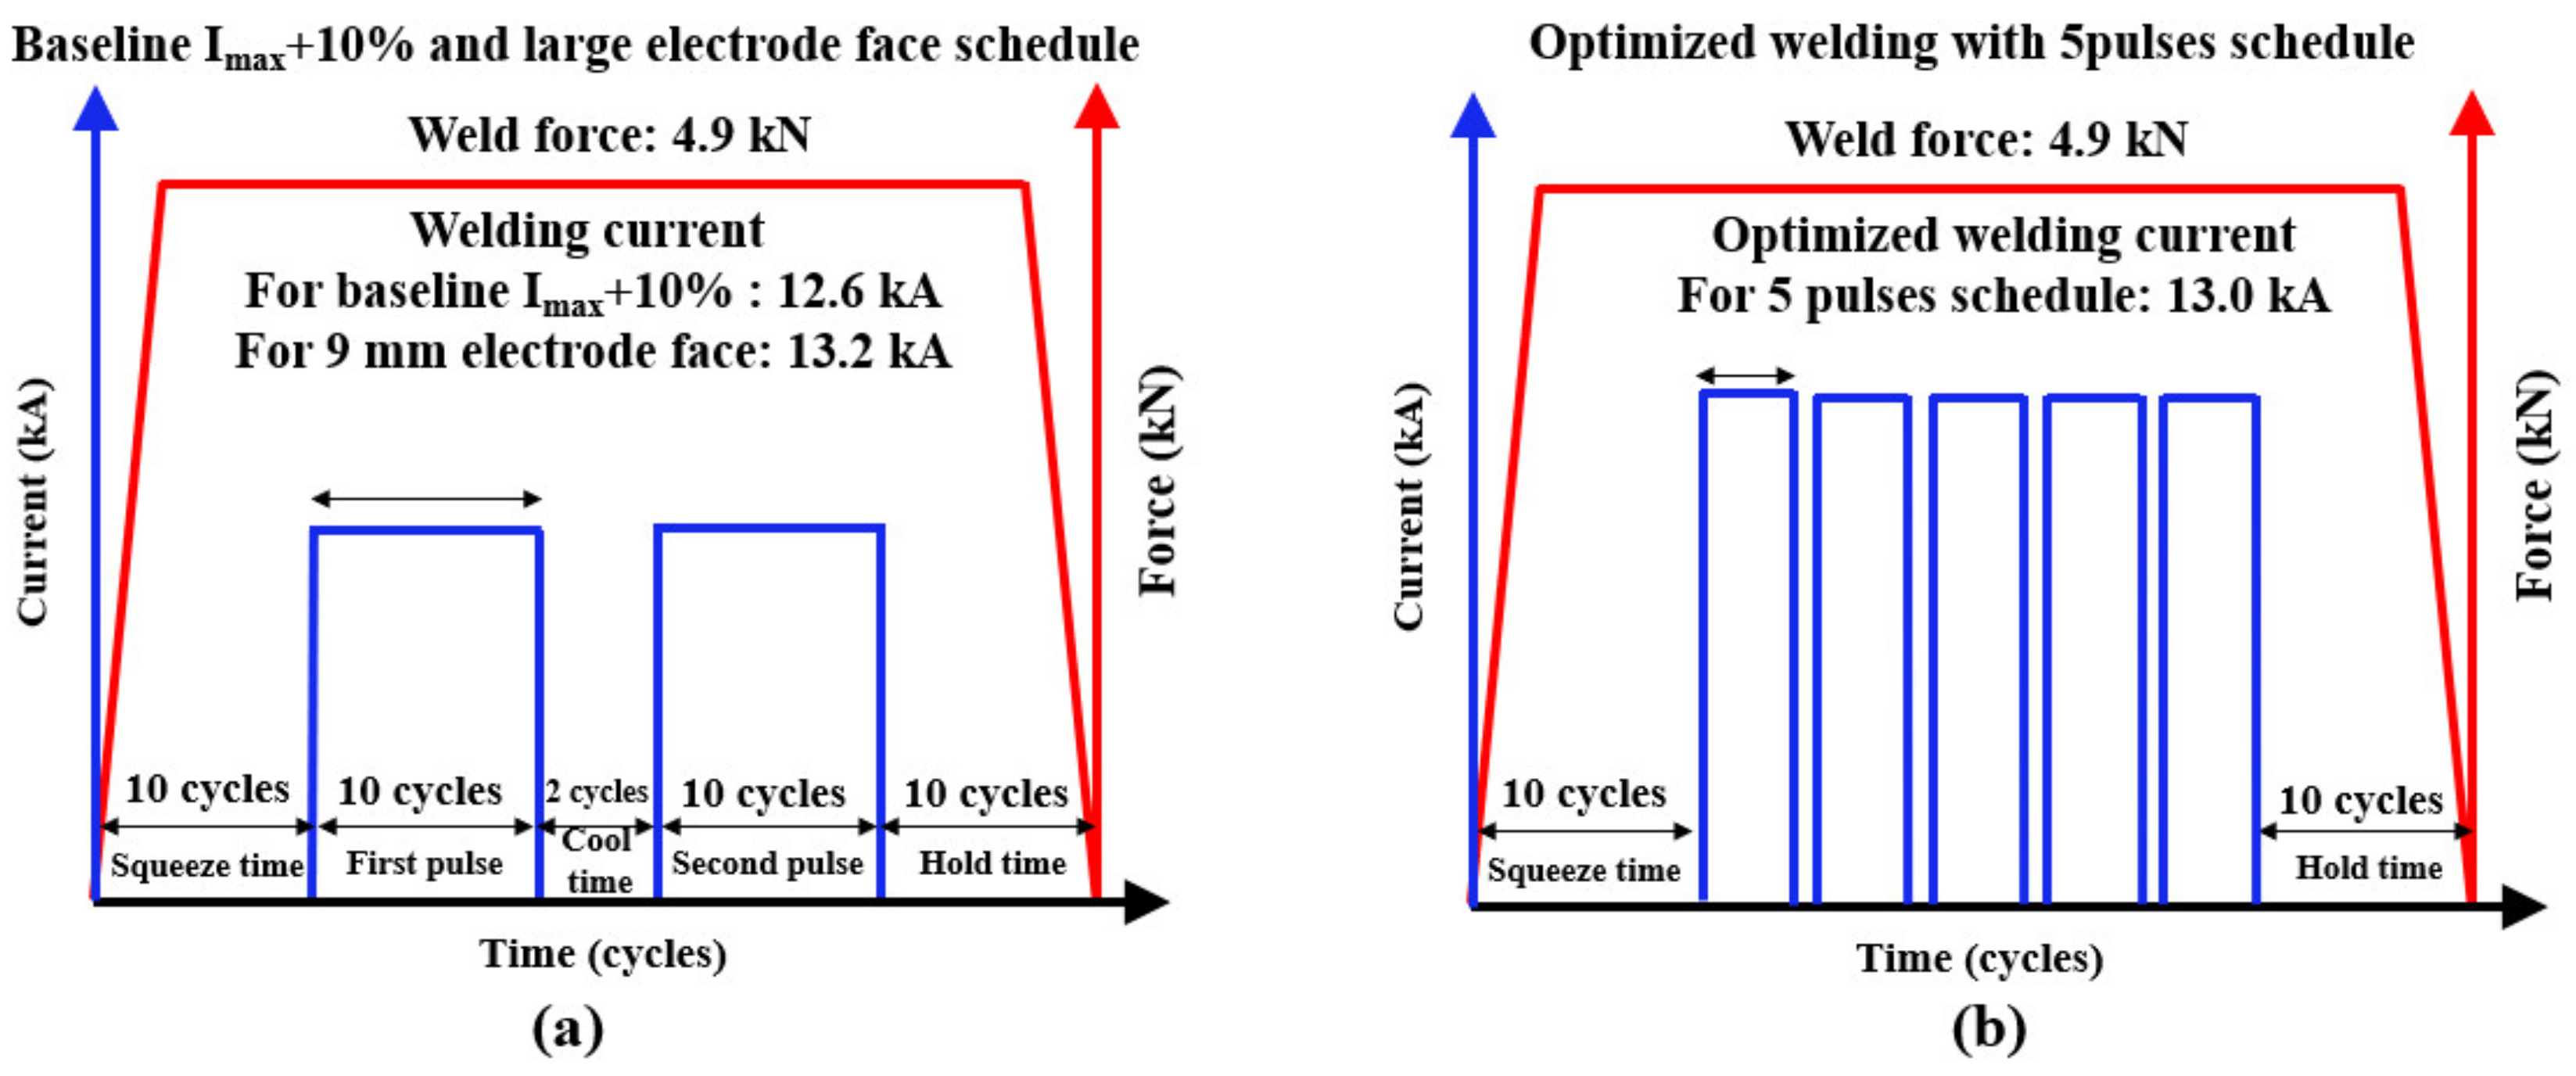
2.3. Welding Schedules for the Baseline and LME Mitigation Strategies

This work evaluates two LME mitigation strategies: variation of current pulse timing and electrode face geometry. It is well known that a variation in welding parameters and boundary conditions, such as electrode shape or current modulation, will change the temperature fields and stress development during the welding process, making a direct comparison of different LME mitigation strategies impossible. Therefore, it was assumed that equal energy is required to develop welds of the same nugget diameter regardless of the combination of the welding parameters. Therefore, equal nugget diameters were produced using parameters with comparable heat input. Employing different LME mitigation strategies allowed for cracks from every weld to be compared and to directly assess the effectiveness of each LME mitigation strategy. Under this assumption, a baseline was defined by finding the Imax for a baseline two-pulses welding schedule (see Figure 3 and Table 2), chosen based on AWS D8.9M:2012 standard. Weld nugget diameters were measured for the welding currents corresponding to Imax − 200 A, Imax − 10%, and Imax + 10%. Five specimens per condition were welded, and LME severity was measured using the cracking index (CI) metric (discussed in the following section). The nugget diameters generated for the various current levels of the baseline conditions were used as the target nugget diameters, regardless of the real Imax, using a given modified welding schedule. The welding currents corresponding to the Imax − 200 A, Imax − 10%, and Imax + 10% conditions were chosen for each given LME mitigation strategy so that the nugget diameter of the tested condition matched the nugget diameter of the baseline weld when welded at the current setting of Imax − 200 A, Imax − 10%, or Imax + 10%. LME severity was determined as follows: producing welds with a lower CI (lower LME severity) than the baseline was considered favourable and producing welds with a higher CI (higher LME severity) than the baseline was considered unfavourable.
The instantaneous heat input was calculated for each weld condition by extracting the dynamic resistance curves and welding current from the welding controller; consequently, current and resistance curves were integrated over the welding time using the heat joule law shown in Equation (1) [28]. To account for the heat loss, the weld nugget was assumed to be a spheroidal shape; knowing the nugget dimensions allowed estimation of the nugget volume using this equation ( V = 4 3 π × D 2 4 × h 2   ) , where V is the volume of the nugget, D is the diameter of the nugget, and h is the width of the nugget. The nugget diameter and width were measured from the nugget cross-sectional view via optical stereoscopy. Equation (2) was then used to calculate the melted mass. The energy needed to melt the nugget was estimated using Equation (3), knowing the material’s melted mass and specific heat. Finally, the heat loss was estimated by subtracting the melting heat from the total heat input given to the weld. It is worth mentioning that this estimation does not consider the heat losses due to radiation; however, that will allow for ranking the effect of actual heat of different welding schedules and techniques on LME cracking [12].
T o t a l   h e a t   i n p u t   Q = t 0 t 1 I 2 t . R t   d t
M e l t e d   m a s s   m = V × ρ
M e l t i n g   h e a t   Q m = m   . R T T C p   T   d T
H e a t   l o s s = T o t a l   h e a t   i n p u t   Q M e l t i n g   h e a t   ( Qm )
where I is the current in Ampere, R is the welding resistance in Ohm, t is the time in seconds, ρ is the density of the material, T is the temperature in °C, and C p is the specific heat capacity of the material in (J/g.°C), Heat and heat loss are measured in joules.

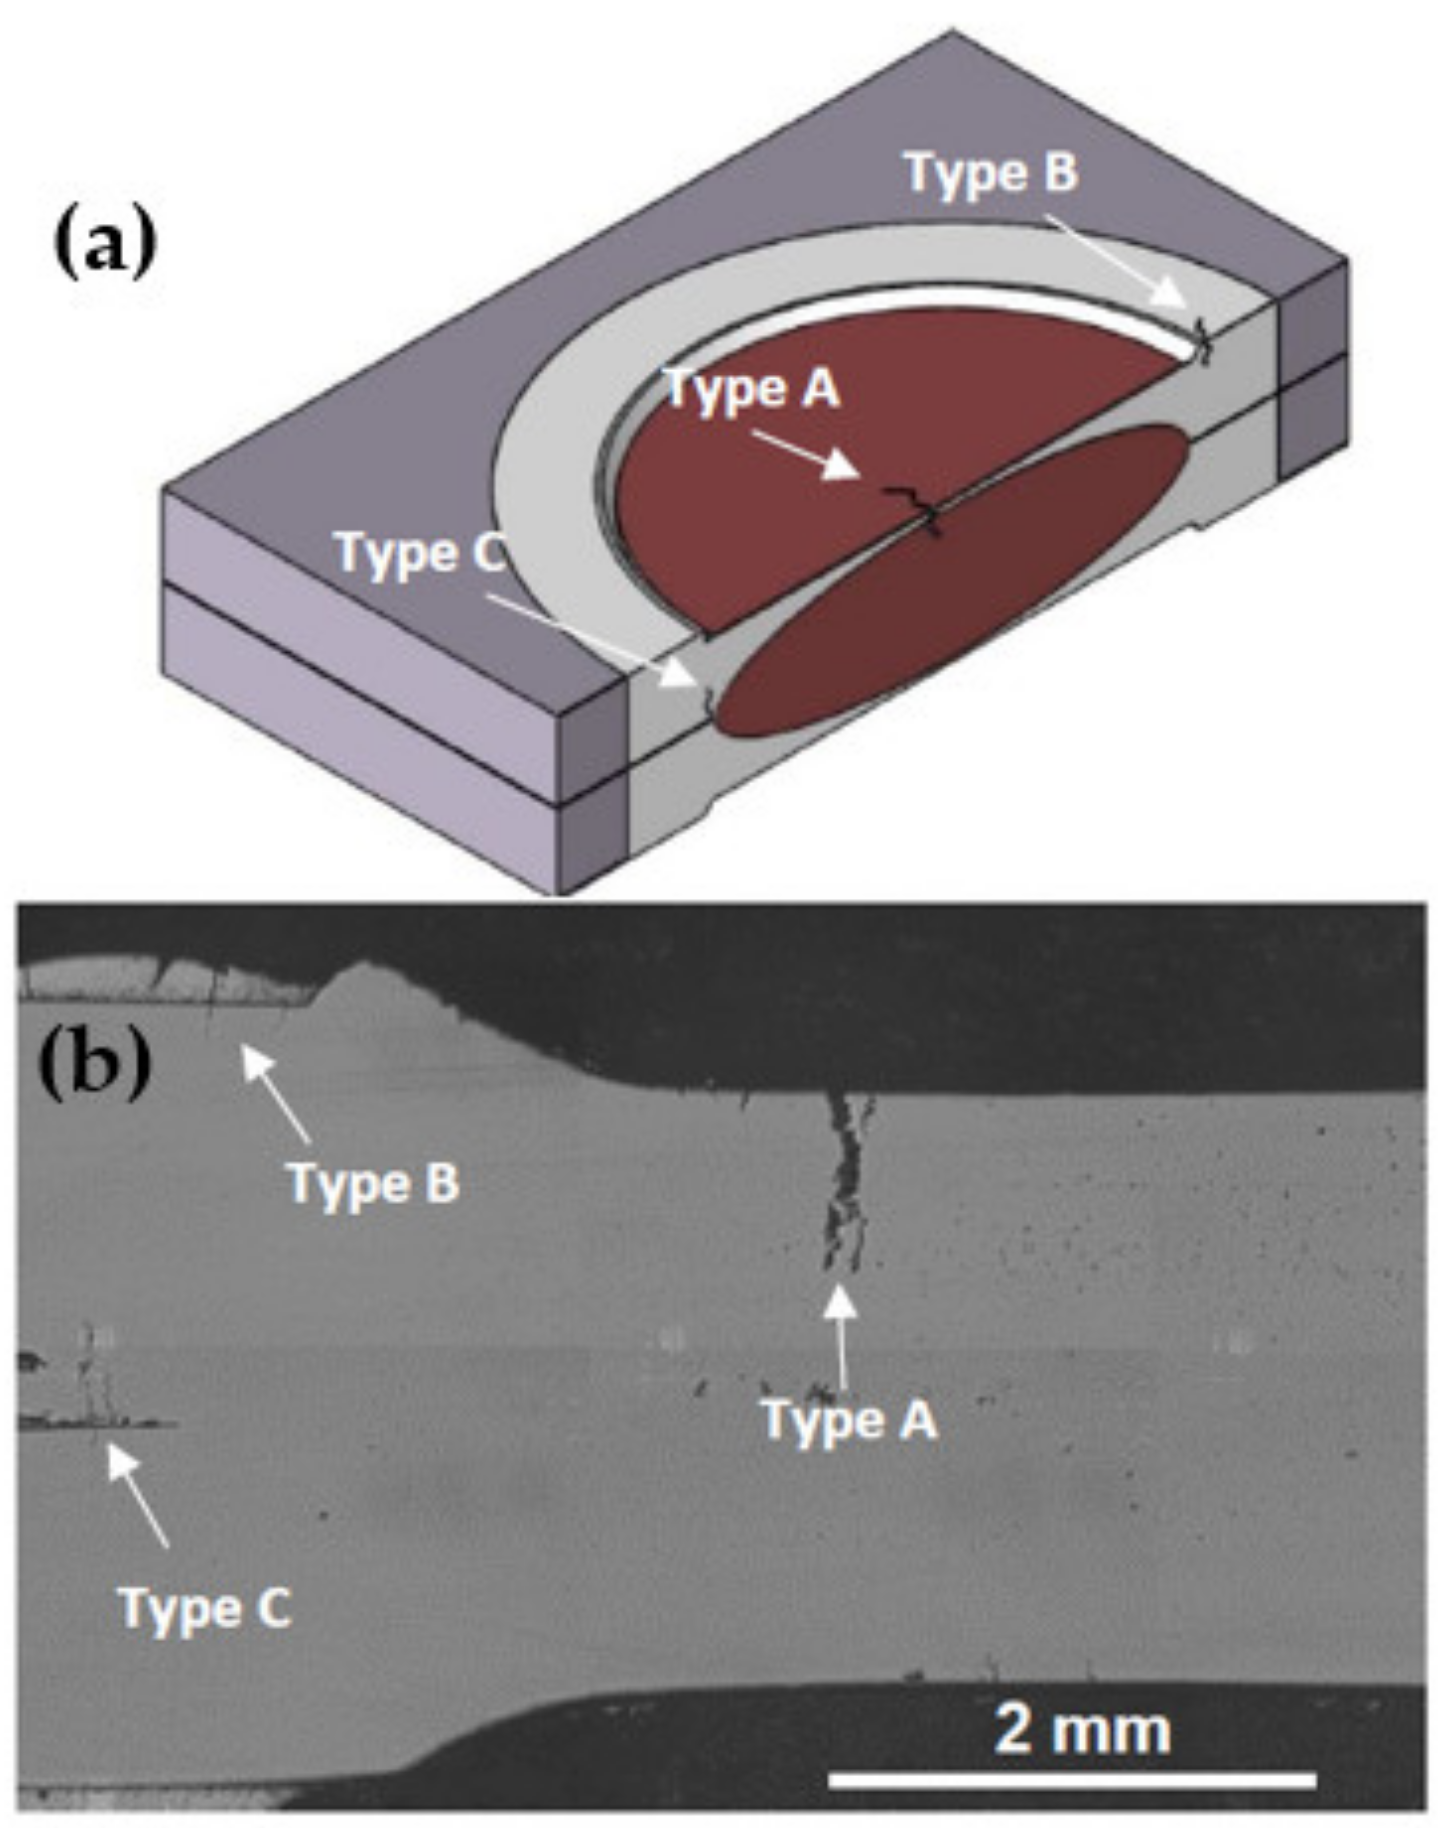
2.4. Cracking Index Measurements and Cutting Procedure

The LME cracks were assessed by measuring the cracks from the weld cross-section and quantifying them based on the crack index (CI) method developed by Wintjes et al. [29]. RSW welds were cross-sectioned through the weld diameter so that the cross-sections intersected the most severe surface cracks (see articles by DiGiovanni et al. [14,30]). The cross-sections were polished to a 1 μm diamond finish and cleaned with methanol, and cracks were measured on the unetched surface. The CI was developed based on three key parameters: the log-normal median crack length (𝐿), the number of cracks per weld or crack frequency (𝑛), and sheet thickness (t) as per Equation (5) below:
C I = n L t
To determine the cracking index, crack depth perpendicular to the material surface was measured at 200× magnification using a Carl Zeiss Axio Vert.A1 optical microscope. Crack location, crack depth, and the number of cracks per weld was recorded and used to calculate the LME cracking index (Equation (2)). The error bars on the CI graphs represent the 95% confidence interval. Details on how the error bars were calculated may be found in the original study by Wintjes [31]. The schematic diagram in Figure 4a,b shows the crack type based on Choi et al. classification [32], which divided the cracks into the following locations: face or indent (Type A), shoulder (Type B), and notch (Type C). Cracks were measured with a straight line from the crack opening location to the crack tip, as shown in Figure 4b below.

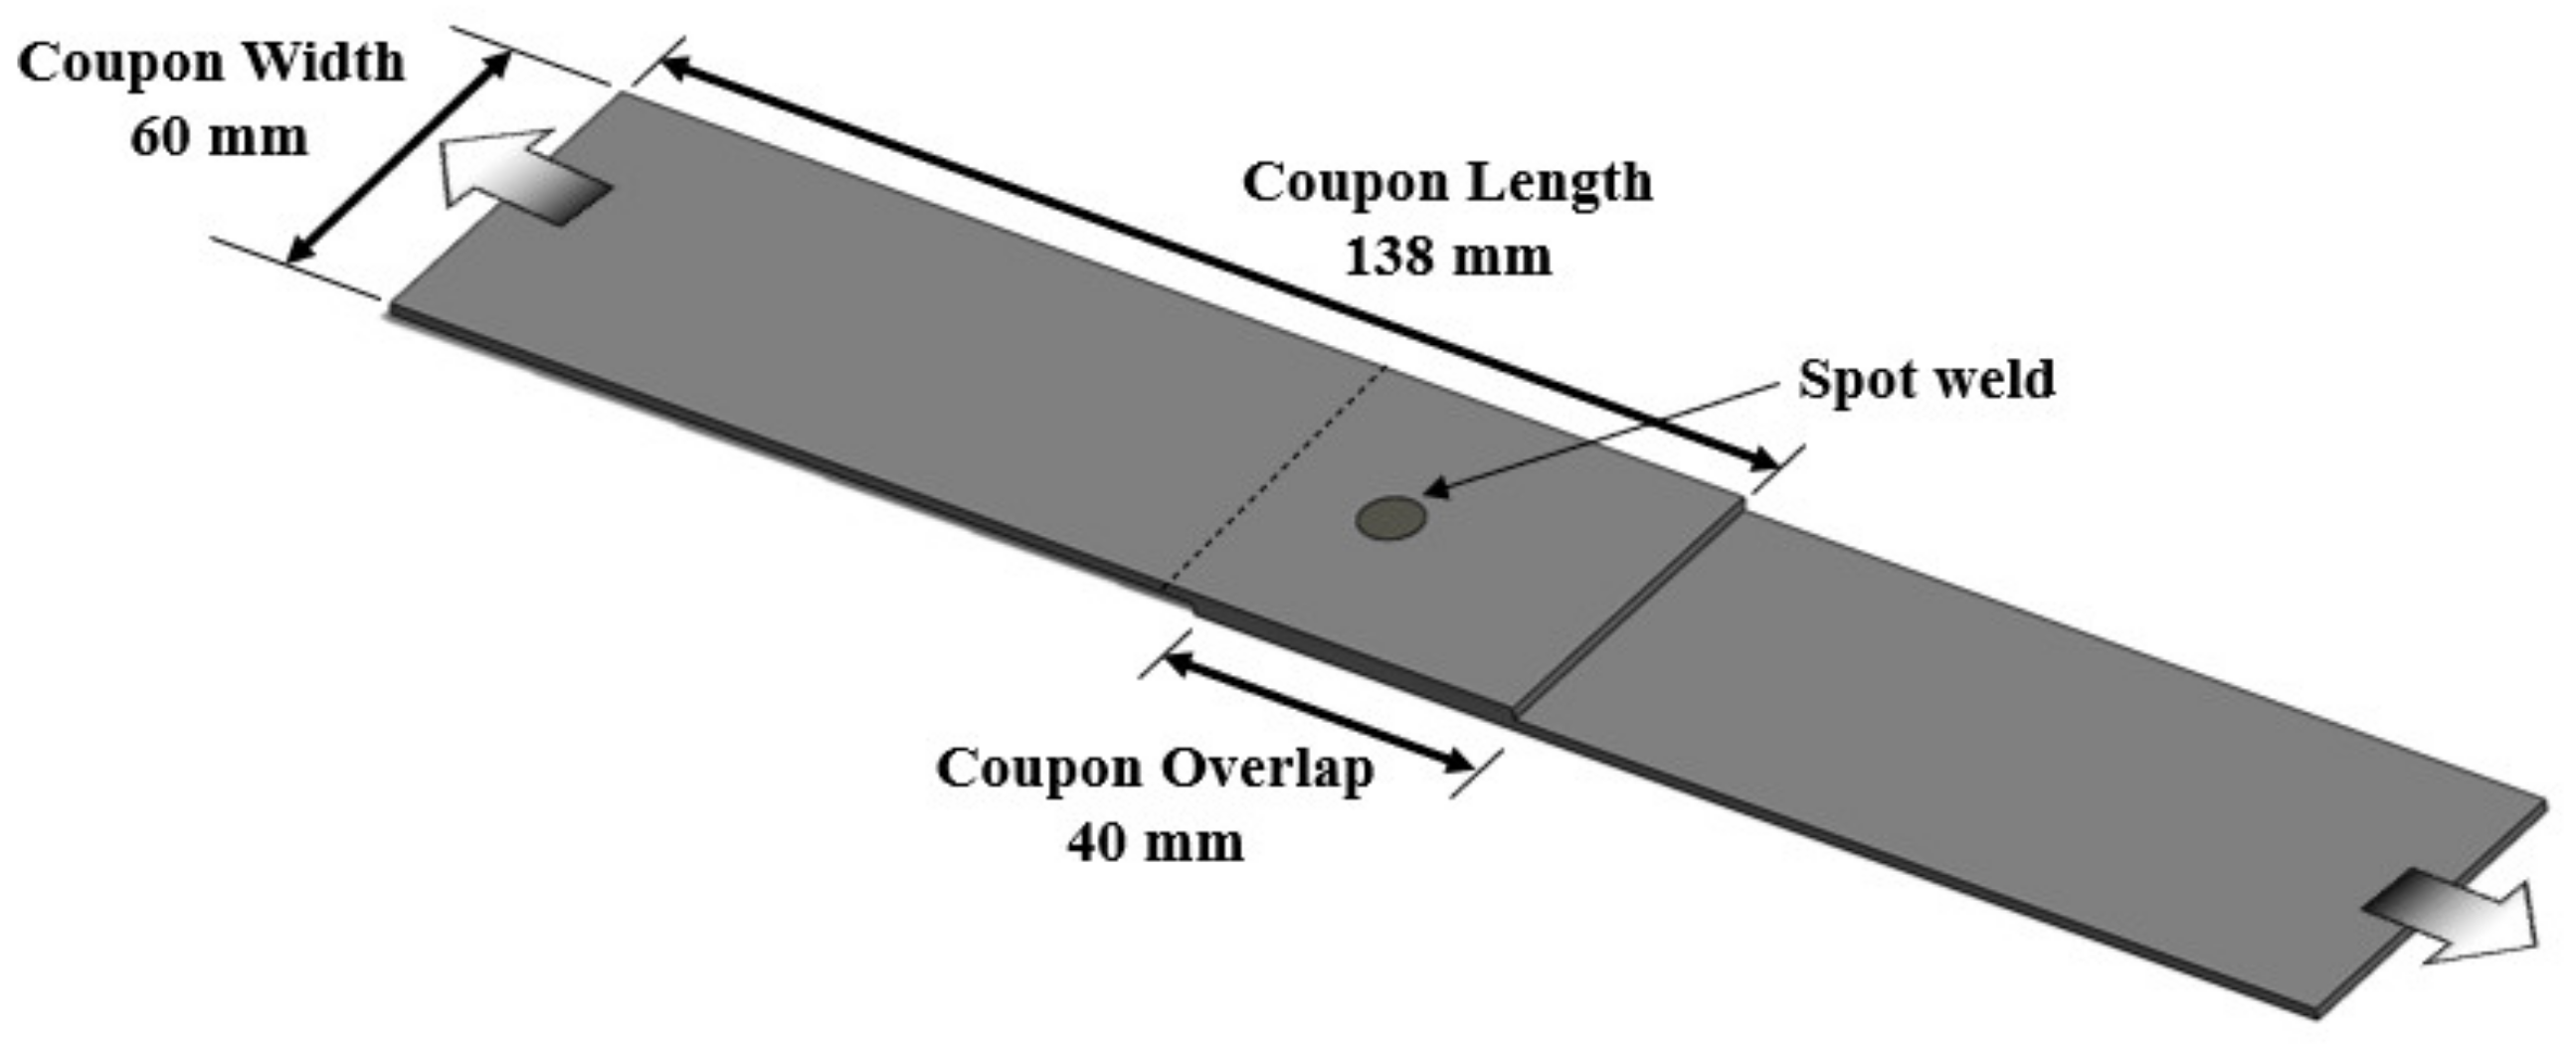
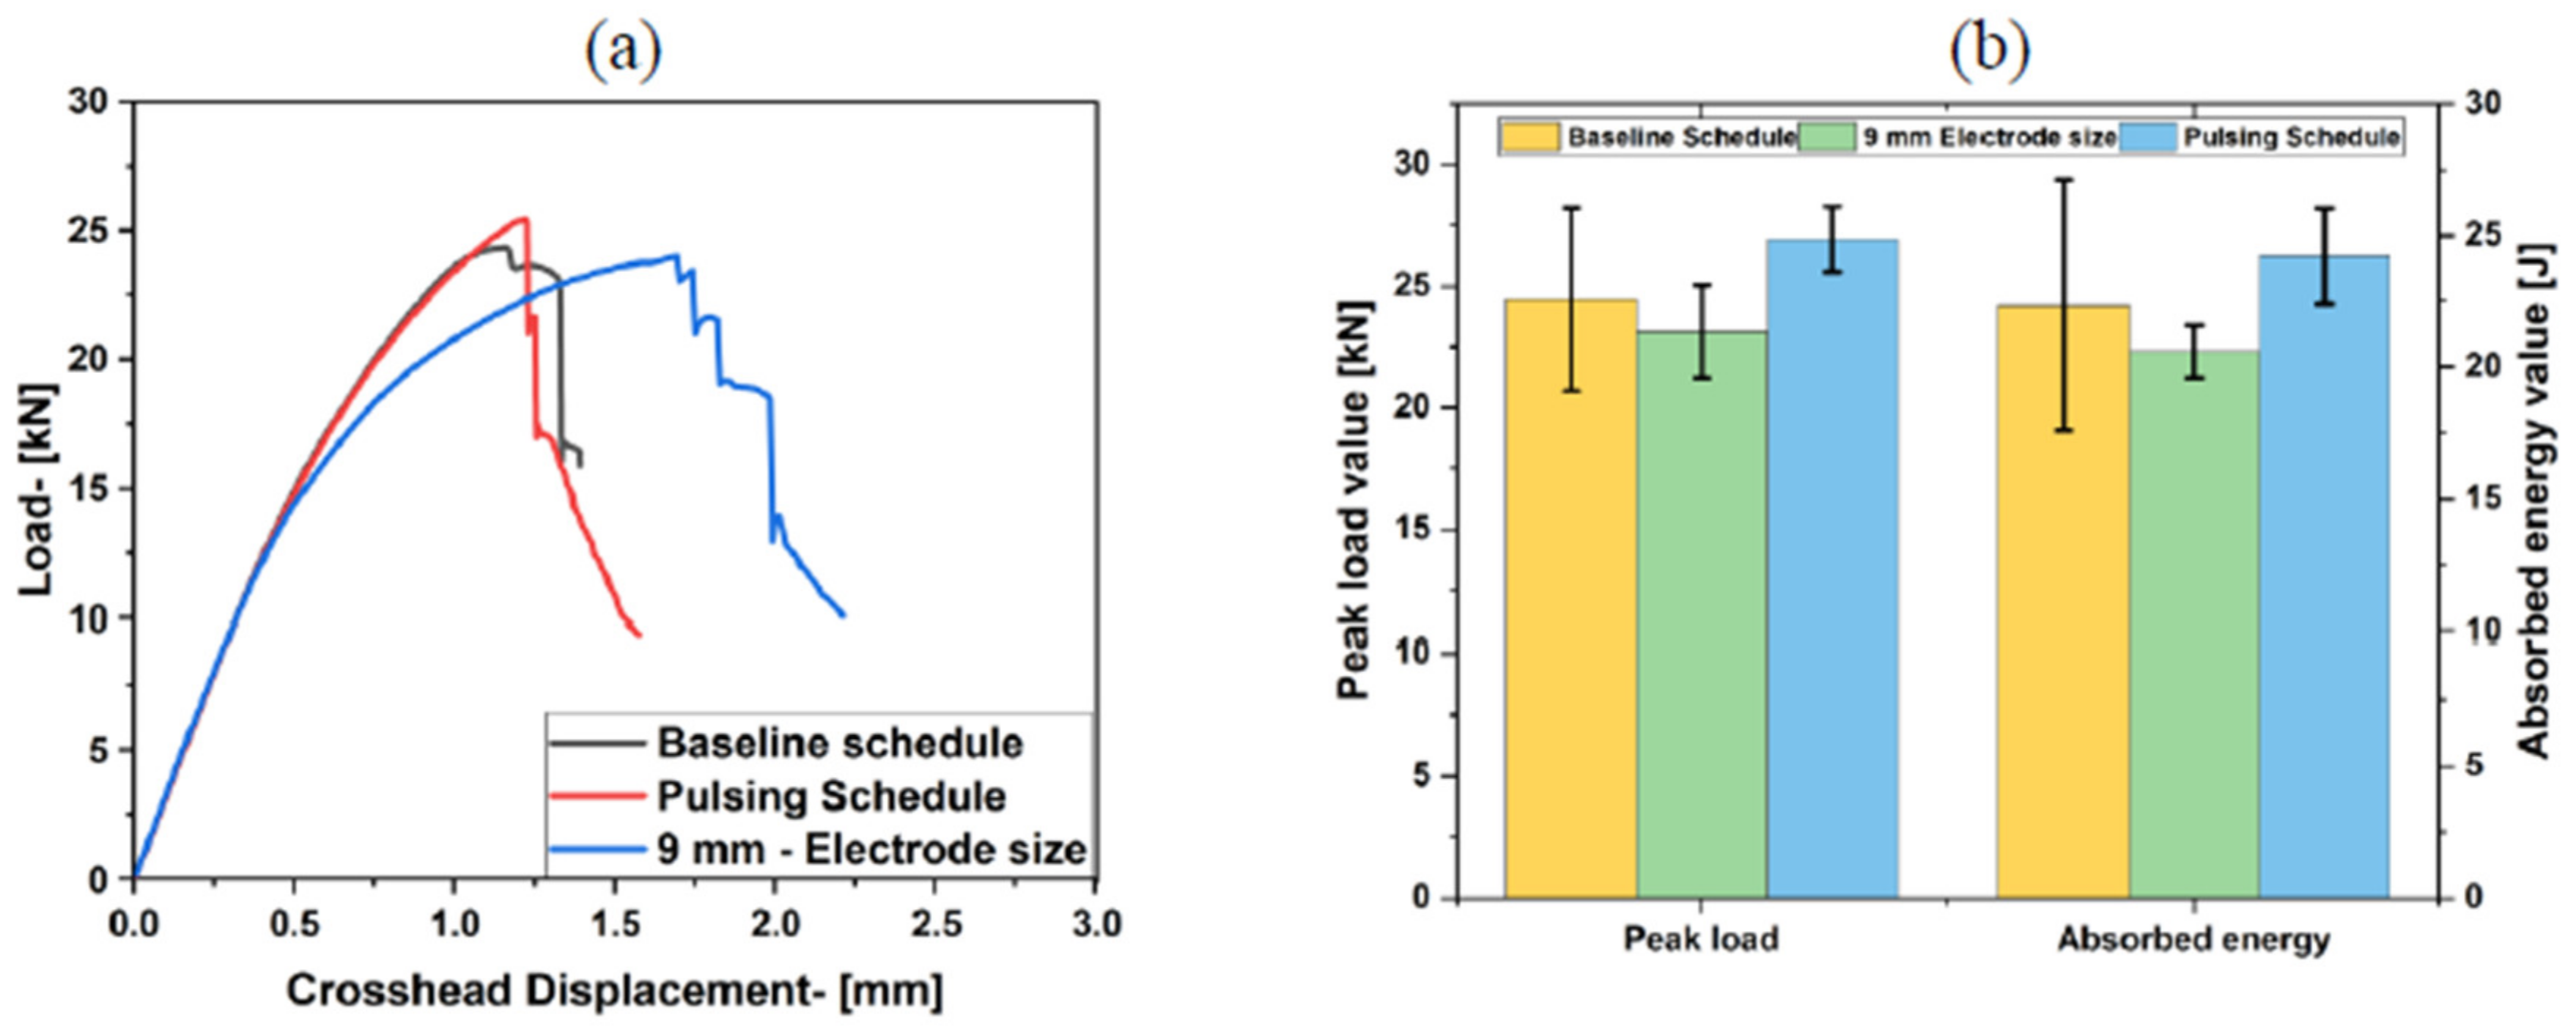
2.5. Mechanical Testing

Figure 5 shows a schematic of the lap shear coupon geometry. The coupon’s overlap and width were determined to meet the minimum value for lap shear tensile testing [33]. The tensile lap shear test was carried out using an MTS frame with a maximum load capacity of 100 kN at a constant crosshead speed of 10 mm/min. Shims with the same sheet thickness were used to maintain alignment and minimize load eccentricity during the lap shear test. The peak load and the area under the load–displacement curve up to the peak load (absorb energy) were determined to evaluate the mechanical performance of each weld condition. The data presented in this work represent an average of four repetitions, and the error bars show 95% confidence interval values. The failure initiation and the failure path were observed from the cross-sections of lap shear samples tested up to 90% of their peak load (interrupted tests); the interrupted lap shear test was performed to confirm the fracture location and to investigate the effect of LME cracks on the joint static strength.

3. Results and Discussion

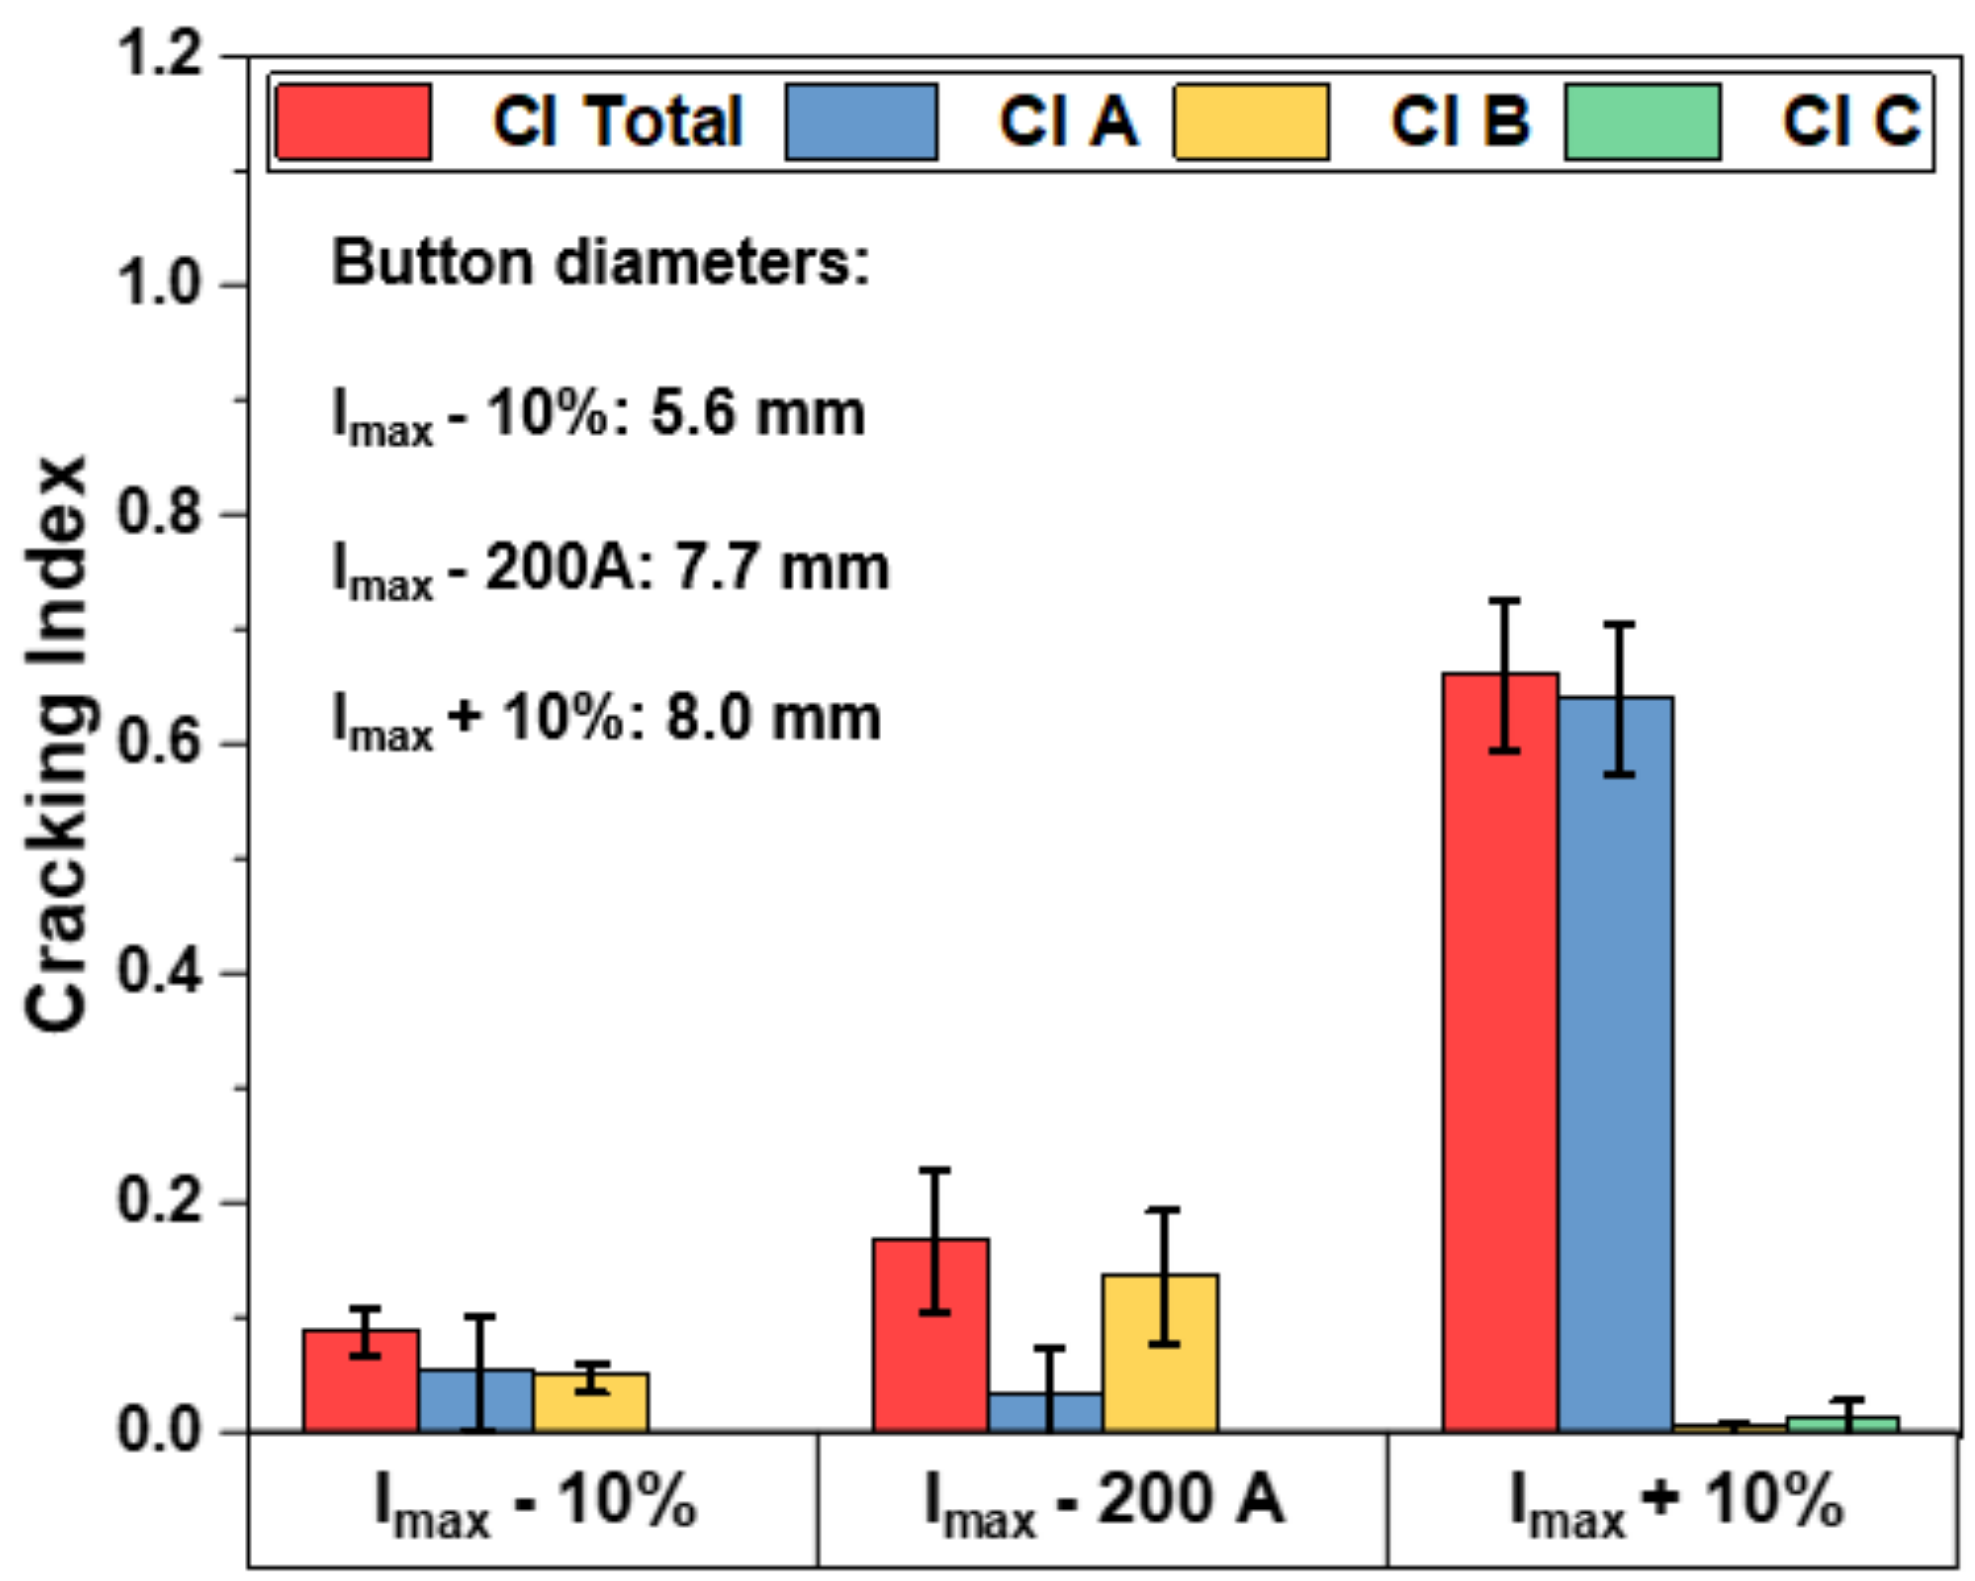
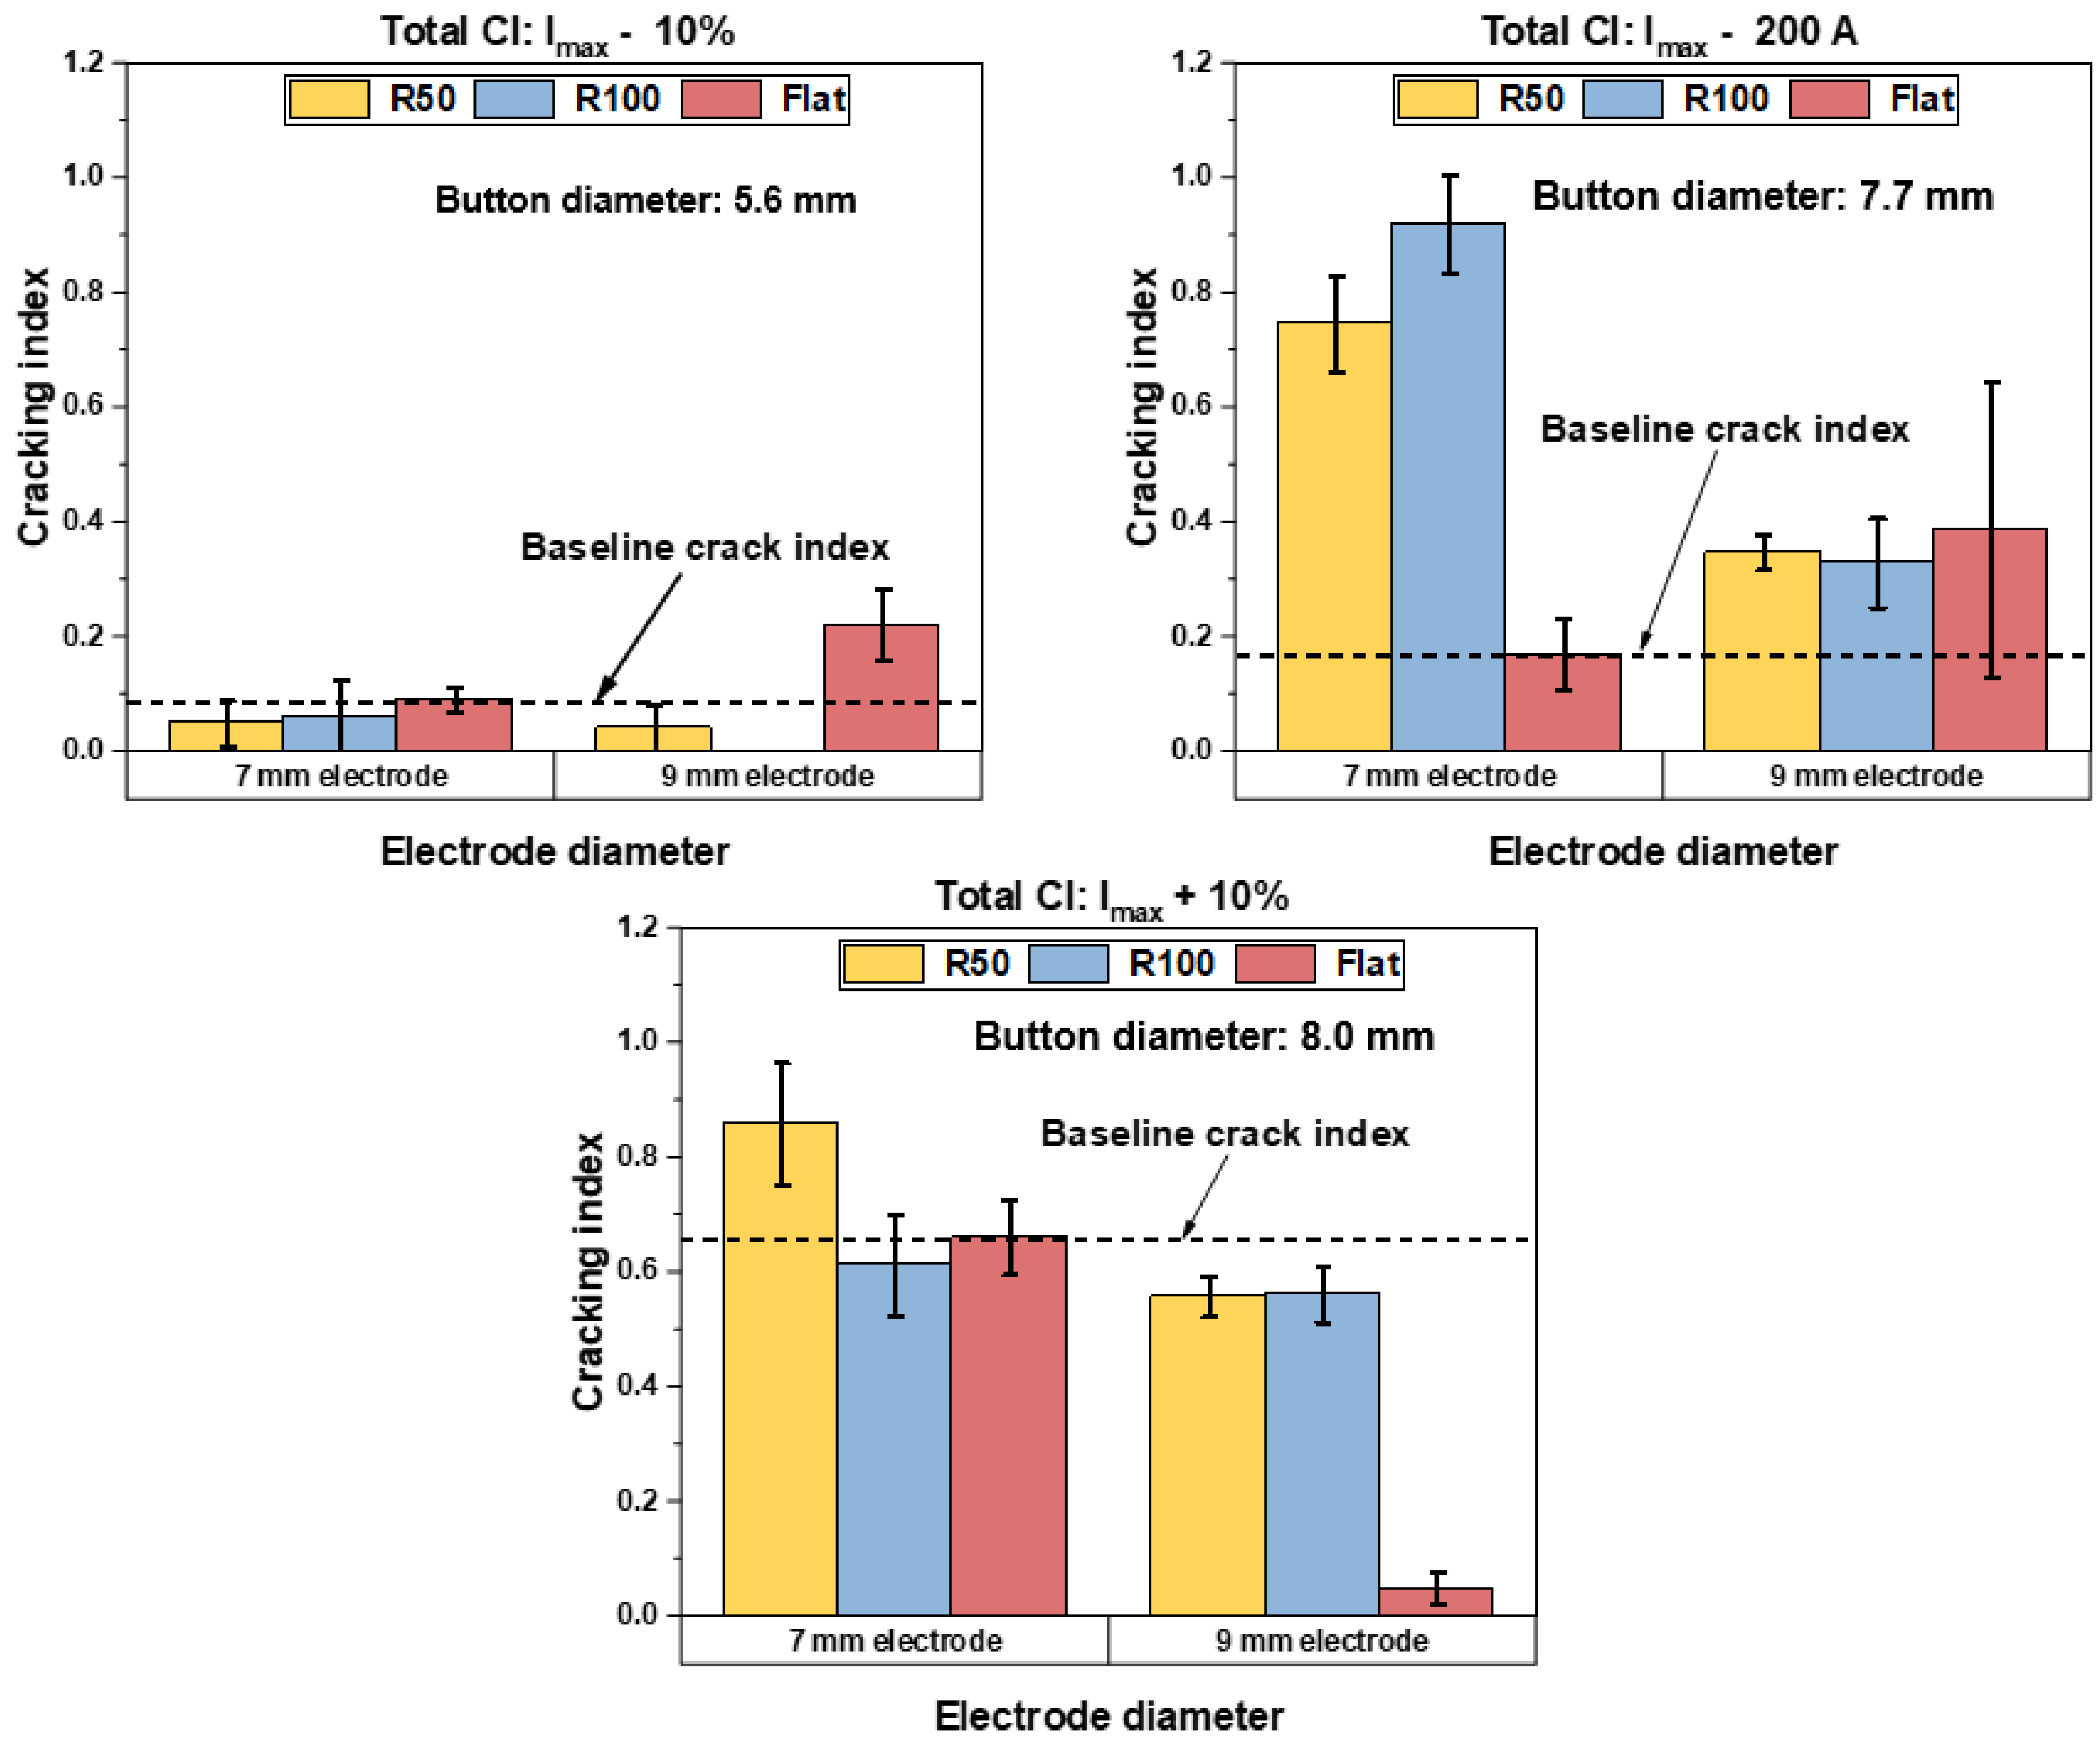
3.1. Baseline Cracking

A flat face electrode with a 7 mm diameter was used for welding the baseline condition (weld schedule as per Table 2). The baseline CI is shown in Figure 6. These results clearly illustrate an increase in cracking severity with an increase in welding current. However, a major increase in Type A cracking was noticed when the current was increased to Imax + 10%. Type B cracking increases when the welding current increases from Imax − 10% to Imax − 200 A, although at Imax + 10%, Type B CI was extremely low. An increase in Type B cracking caused the increase of the total CI at Imax − 200 A; for Imax + 10%, Type A cracks significantly contributed to the increase in total CI. Overall, Type C cracking was not observed in the conditions below Imax, and extremely low Type C cracks were observed in the Imax + 10% case, which had a minor effect on the total CI. The individual crack index and the total crack index for each current level are listed in Table 3.

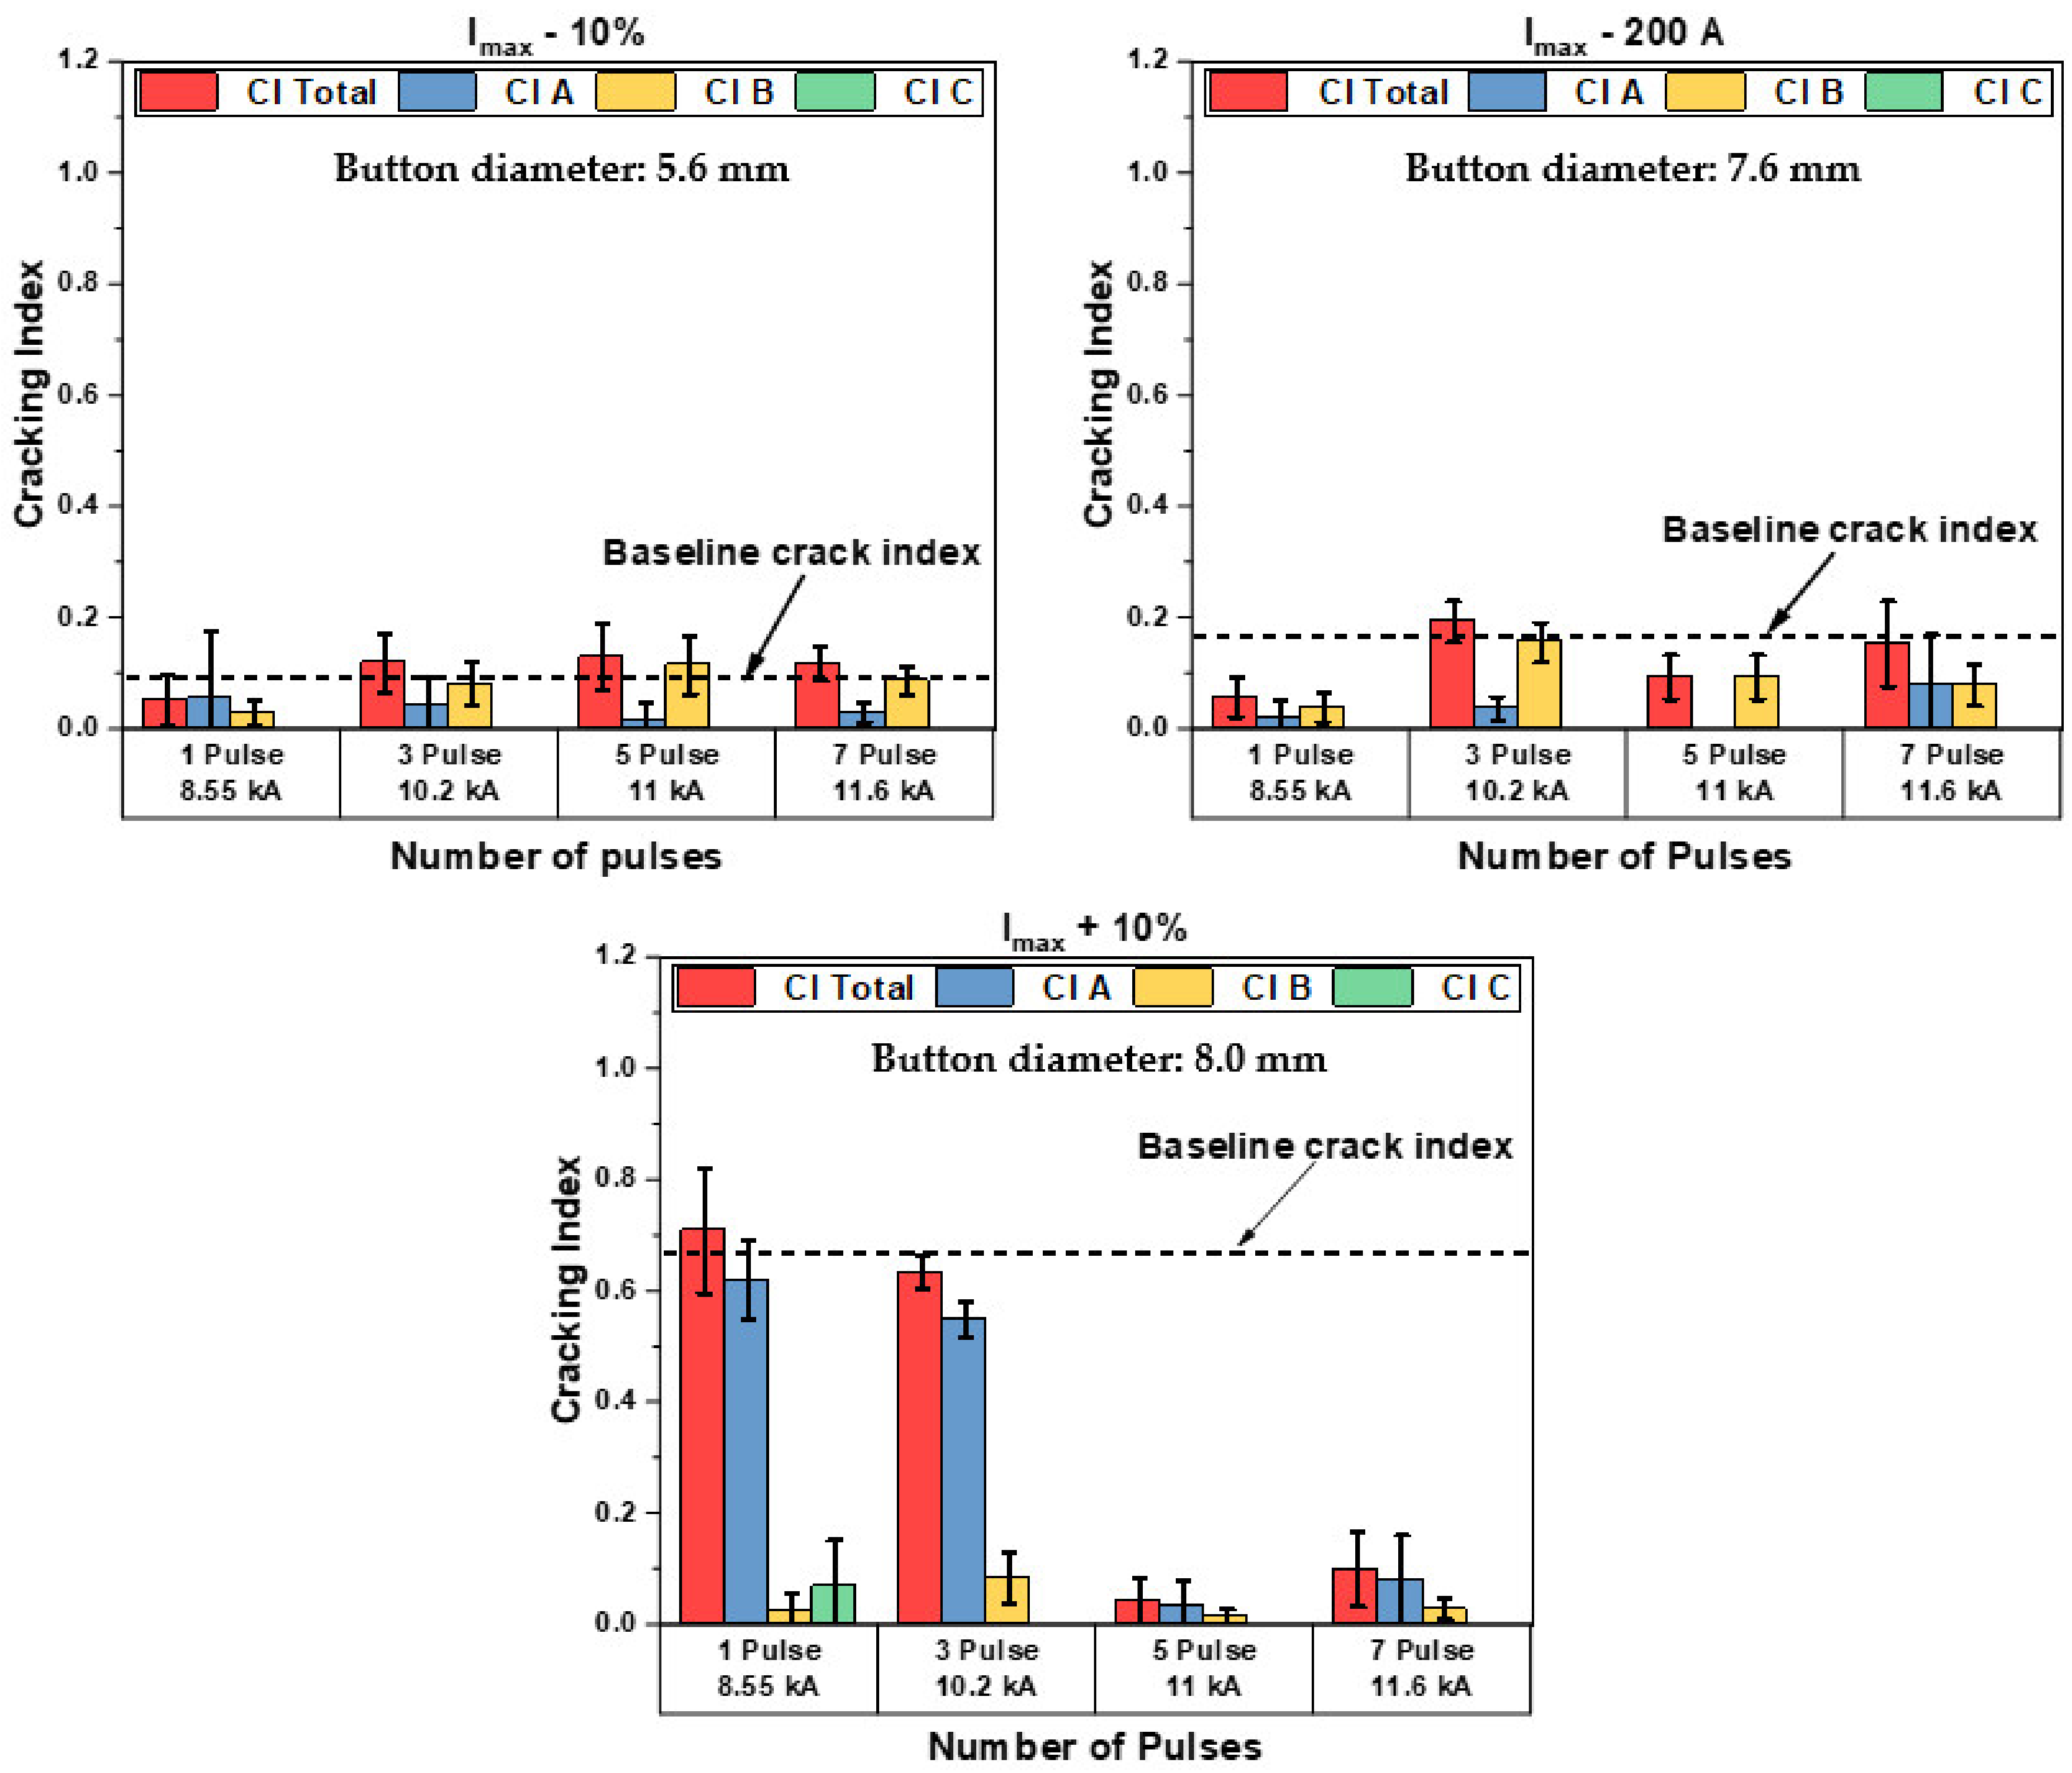
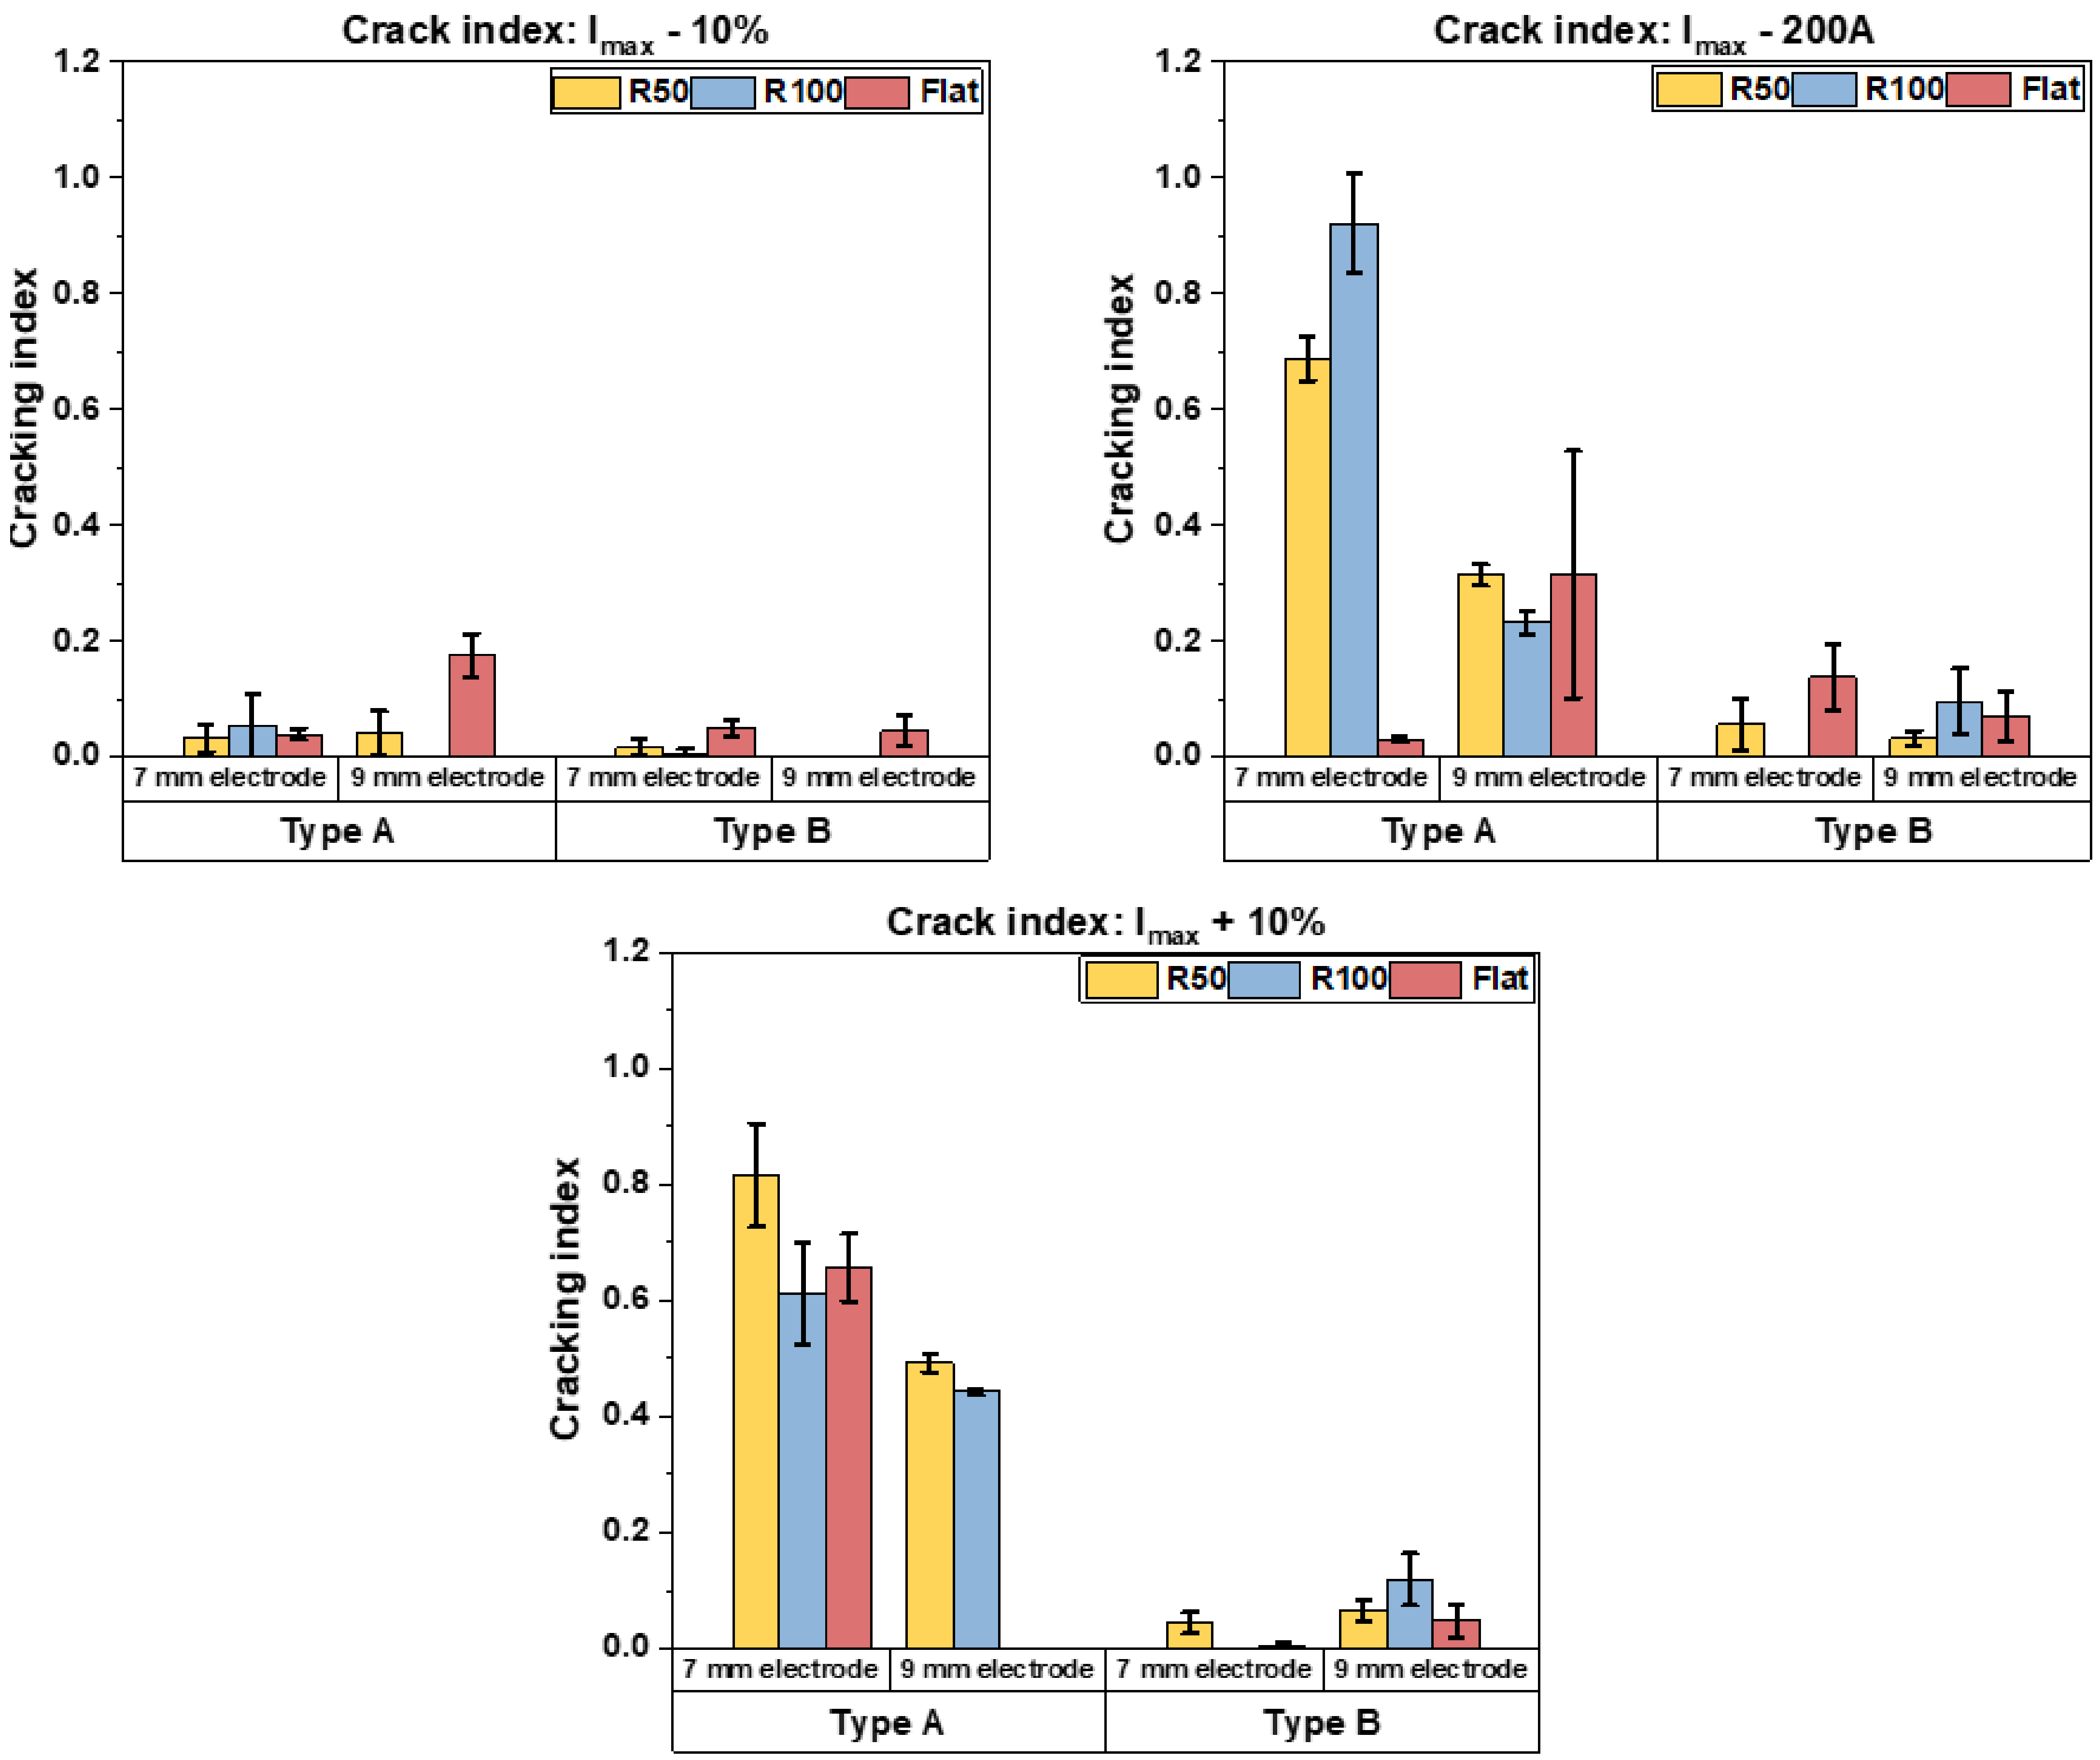
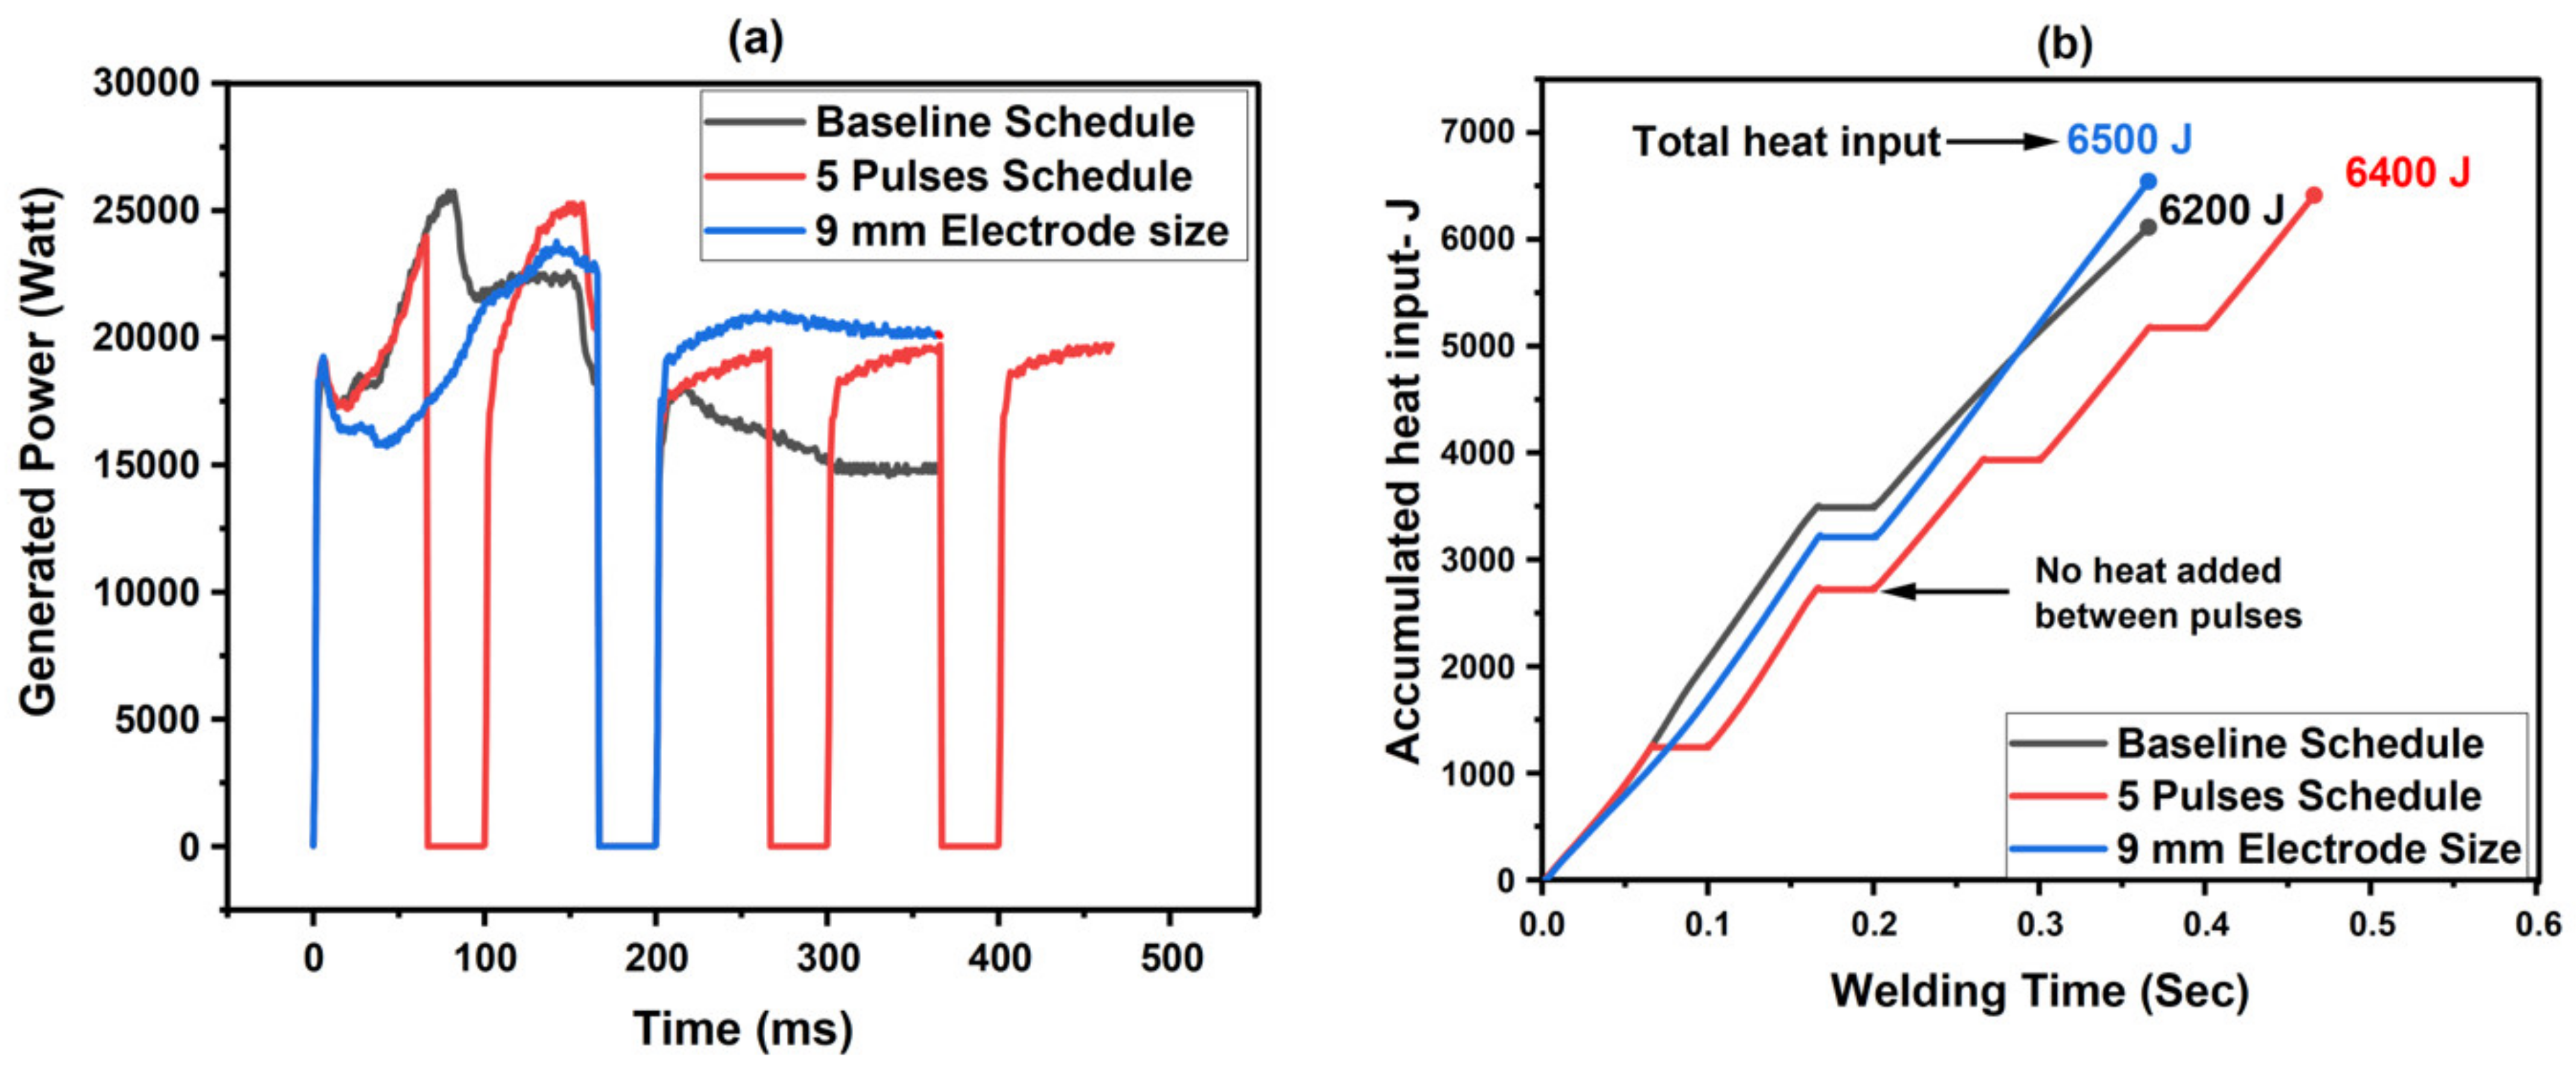
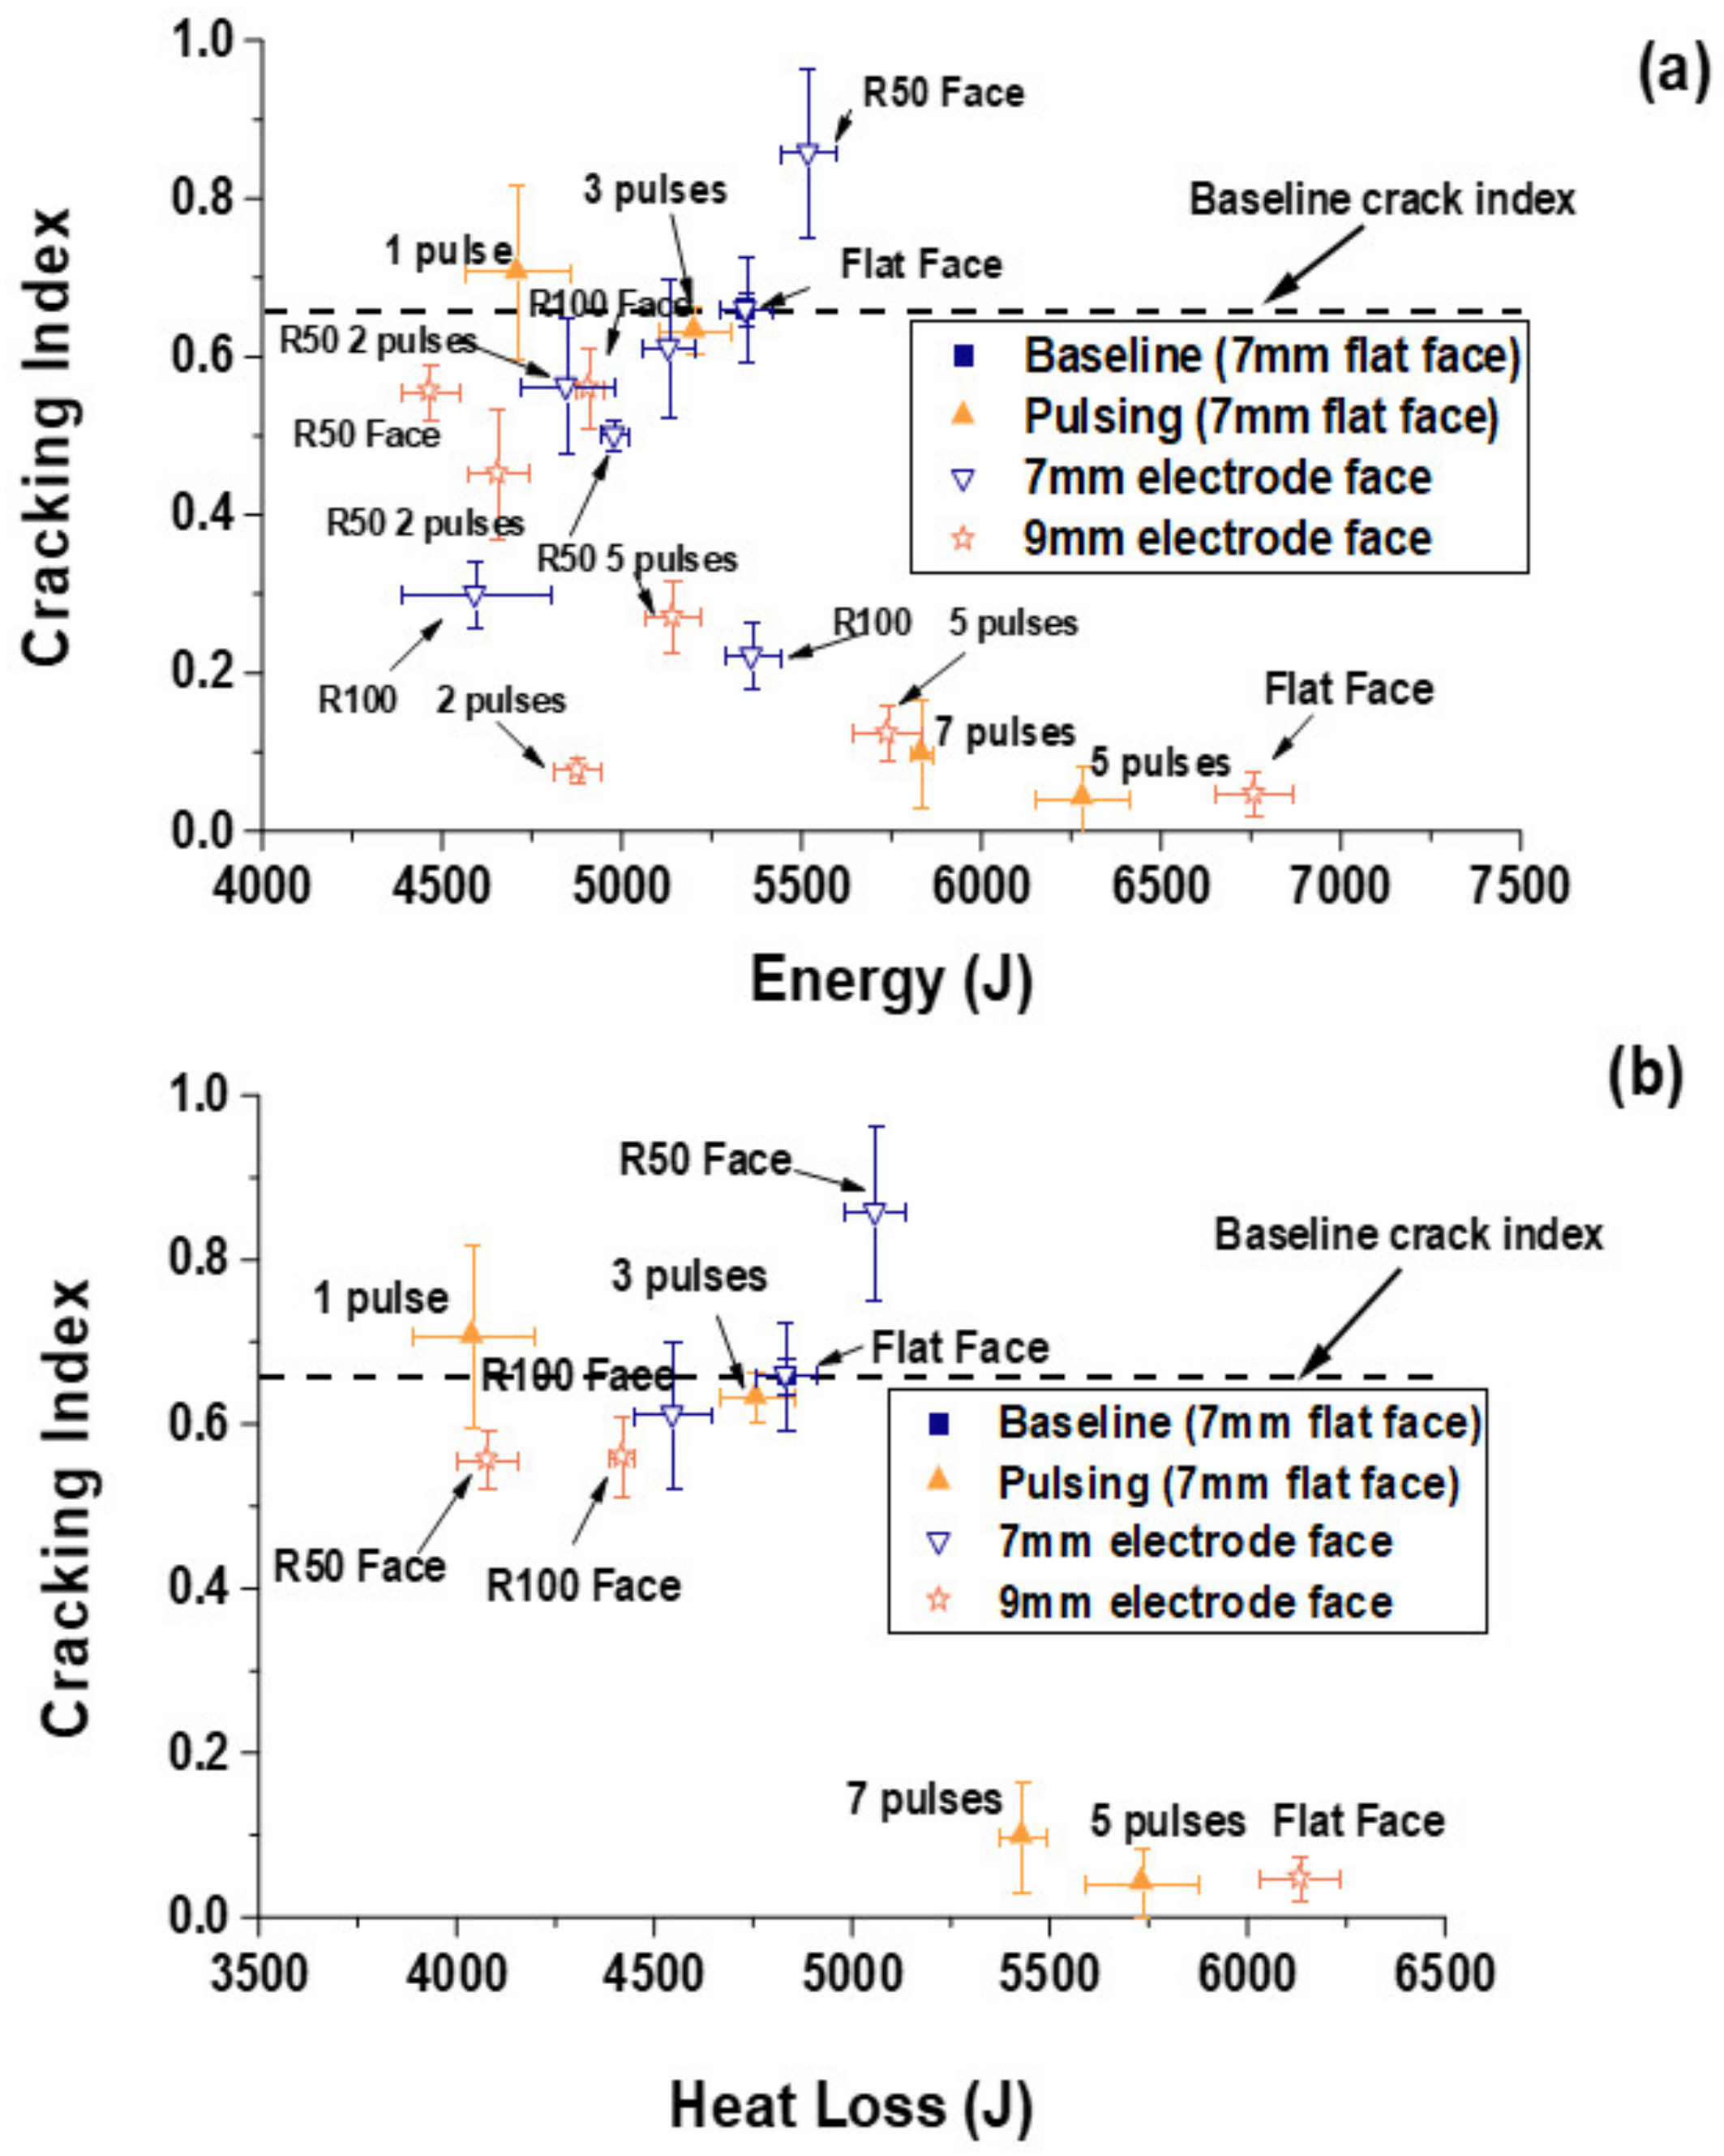
3.2. Effect of Current Pulsing on LME

Current pulsing controls heat buildup and nugget growth throughout the weld cycle. Introducing more cooling periods allows for a more gradual nugget growth, which influences the temperature and stresses as the nugget grows [13]. A preliminary study was conducted to determine the optimum welding time for the current pulsing variability, and then the optimum time was used to study the effect of the pulsing on the LME cracking index. In the preliminary test, the baseline welding schedule, which was made with two equally long pulses of 167 ms separated by 33 ms cool time, was chosen. The LME severity of the baseline conditions shown in Figure 6 was used as a baseline, shown as (dashed line) to assess the effectiveness of the mitigation techniques to reduce the LME cracks. The welding current was reduced with increasing welding time to maintain the baseline nugget diameter and ensure the net heat input for all welds was similar. Fewer pulses with a high current result in a more rapid energy generation in the welding process, whereas more pulses with a less welding current result in lower energy input. LME severity was reduced with the increase of pulse number (and correspondingly increase of welding time) and a reduction of welding current. The final pulse study was carried out by dividing the optimal 333 ms welding pulse into either one, three, five, or seven pulses. A 33 ms cool time was used to separate each pulse, which resulted in the following pulsing schedules:
  • One pulse: 333 ms
  • Three pulses: 111 ms–33 ms–111 ms–33 ms–111 ms
  • Five pulses: 67 ms–33 ms–67 ms–33 ms–67 ms–33 ms–67 ms–33 ms–67 ms
  • Seven pulses: 48 ms–33 ms–48 ms–33 ms–48 ms–33 ms–48 ms–33 ms–48 ms–33 ms–48 ms–33 ms–48 ms
During the pulsing study, a proportional reduction of Type A and B cracking was observed along with the reduction of the total CI. No Type C cracks were observed. The lowest LME severity was observed for the welding schedule with five pulses (welding time 333 ms), so this welding time was further investigated in the following section. The results suggested that current pulsing welds with longer total weld time led to a slower energy input into the weld, and therefore, utilizing them can be a promising approach for LME mitigation in high LME susceptible materials.
After welds were made using these conditions, it was seen that current pulsing had limited or no effect on decreasing LME at current levels below expulsion (see Figure 7), and the total CI was below 0.2. According to previous investigations by Wientjes et al. [31], an LME CI below 0.2 will not result in a significant strength decrease. While above when using current above the expulsion current (Imax + 10%) a severe LME crack index was seen. In terms of individual crack type, Type B cracking was very low, while Type A cracking decreased with the increasing number of impulses. Therefore, the total CI decreased from the baseline of 0.7 to a minimum of 0.1 at five pulses and was not significantly higher at seven pulses.

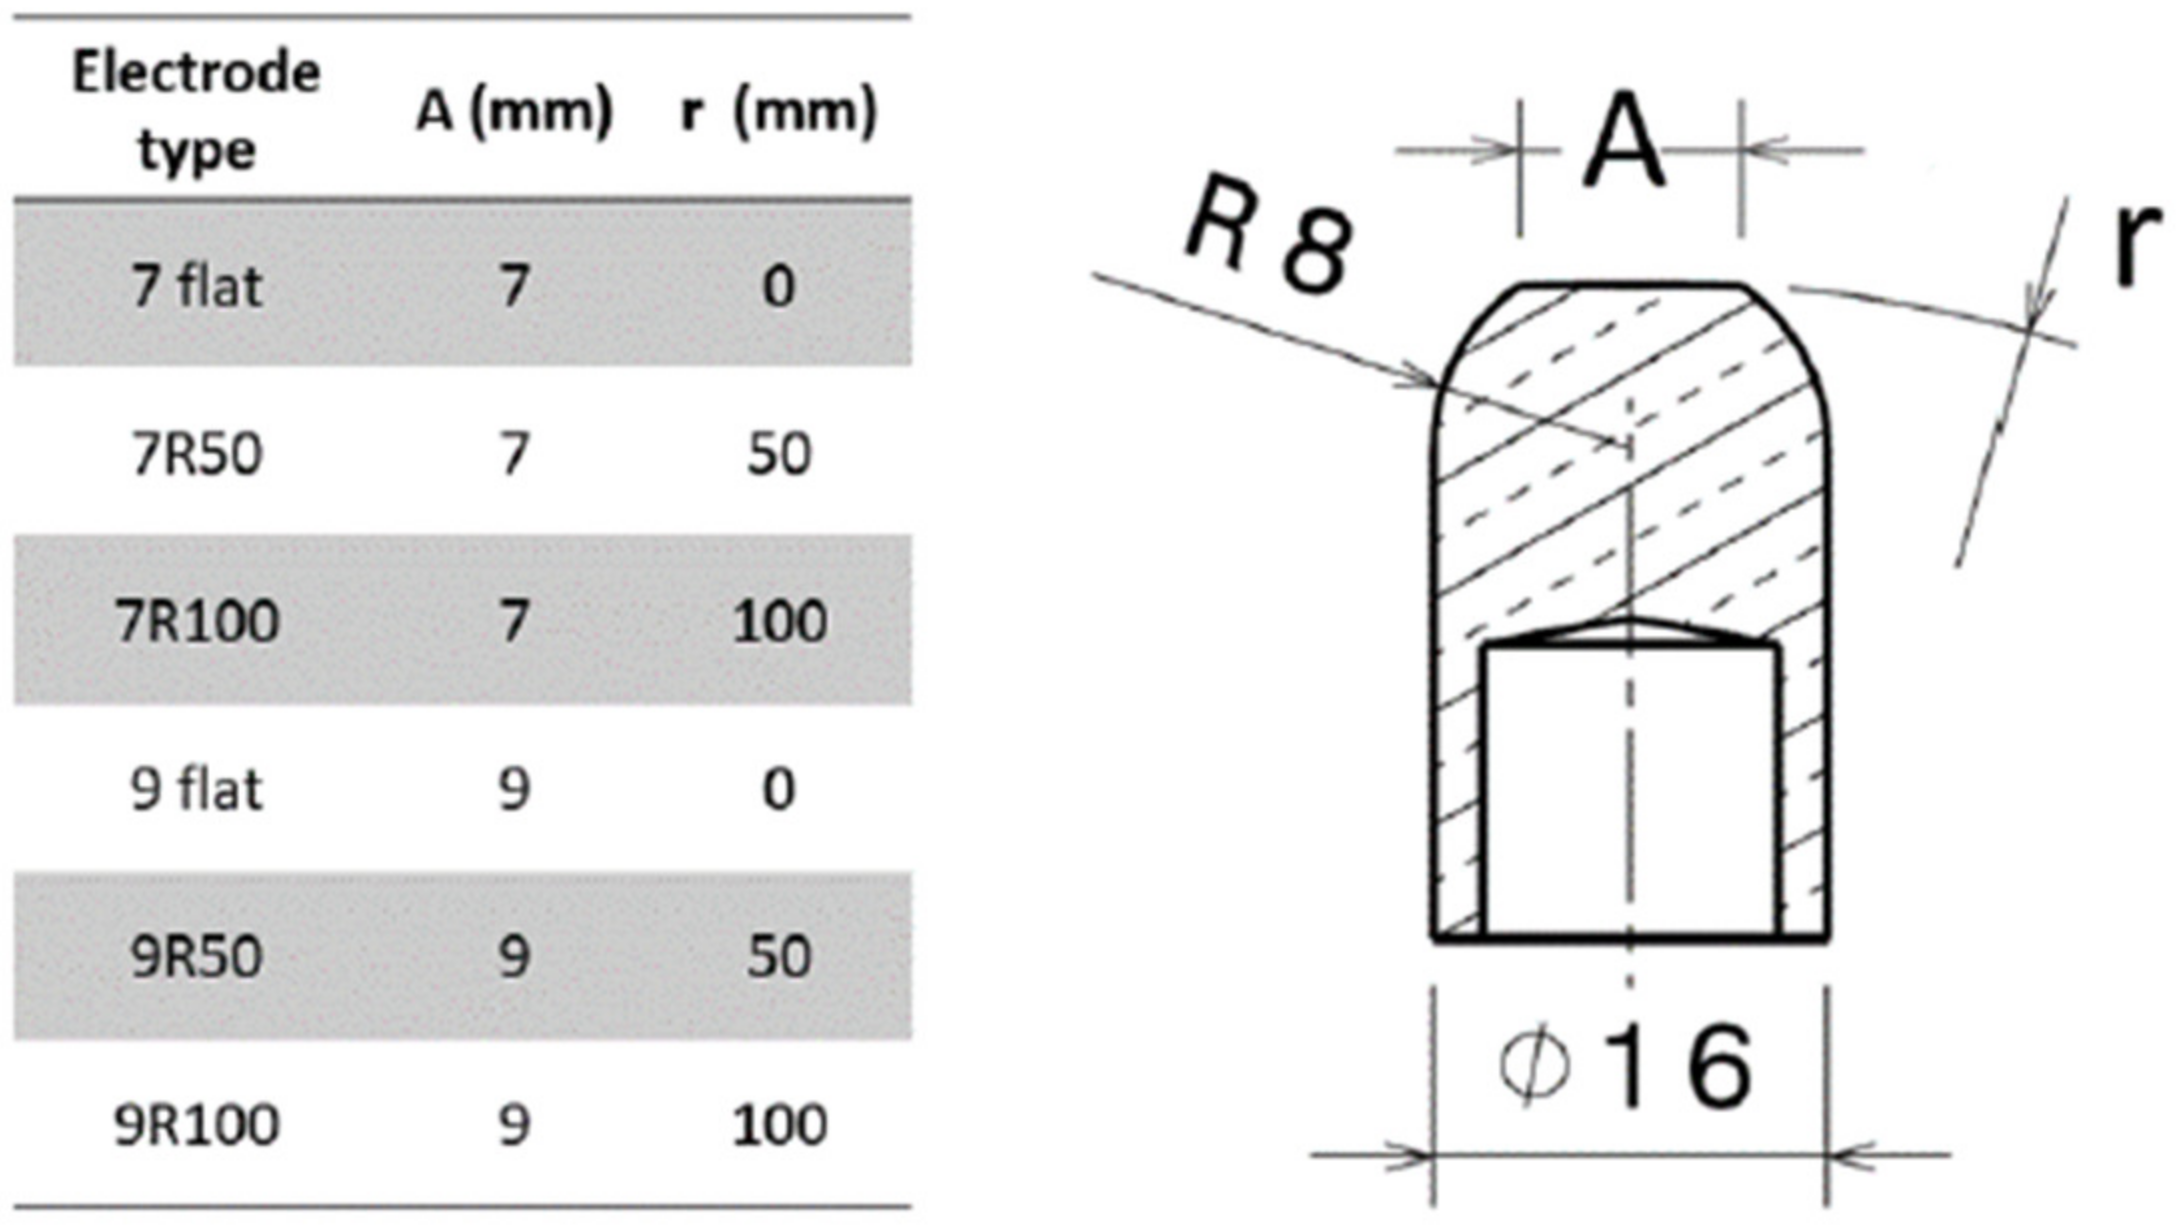
3.3. Effect of Electrode Geometry on LME

This study aimed to quantify the impact of electrode face diameter and radius on forming LME cracks. The selected electrode geometry affects the mechanical stress caused by the electrodes as they squeeze the two sheets of steel together throughout the welding process [17]. The effect of electrode geometry on LME formation was evaluated using ball nose (RWMA B) electrodes (see Figure 8), and their face diameter (A) and face radius (r) were varied. Two electrode face diameters of 7 mm (AWS D8.9) and 9 mm (AWS D8.9 + 2 mm) were investigated, each with three-electrode face radii: 0 mm (flat), 50 mm, and 100 mm.
The baseline for the electrode geometry study was defined using a flat electrode face for each electrode diameter. For the 9 mm electrode, welds were made using welding parameters producing button diameters matching the welds made with the 7 mm electrodes. The influence of electrode geometry on the total cracking index can be seen in Figure 9. It should be noted that no Type C cracks were observed in the weld cross-sections; therefore, the total crack index seen in Figure 9 only represents indent and shoulder cracks. Welds with R50 and R100 for a 7 mm electrode as well as R50 with a 9 mm electrode showed higher LME cracking index at both welding currents of Imax − 200 A and Imax + 10% as compared to Imax − 10%; however, no increase in the total CI was observed between welds when the current was increased from Imax − 200 A to Imax + 10%. When welding above the expulsion current (Imax+ 10%), a drastic decrease in LME severity was observed for a 9 mm flat electrode regardless of the weld size. Therefore, conditions showing the lowest LME (expulsion condition) were obtained using electrodes with a 9 mm face and 7.9 mm weld diameter; these results are consistent with the results reported in the literature [16,17].
The LME crack location has been reported as a crucial factor that controls the joint strength and failure path in RSW joints [34]. Mitigating the critical crack location, such as shoulder or notch cracks (Type B and C), could improve the lap shear strength. Therefore, it is important to show the crack index for each location. Figure 10 illustrates the influence of electrode face geometry on shoulder cracks (Type B), which had a lower crack index value (below 0.2) in all investigated conditions. The results suggest that the major contribution to the total crack index is Type A cracks located in the indent area. Therefore, the results indicated that the face diameter predominately affected LME cracks in the electrode indent area (Type A).

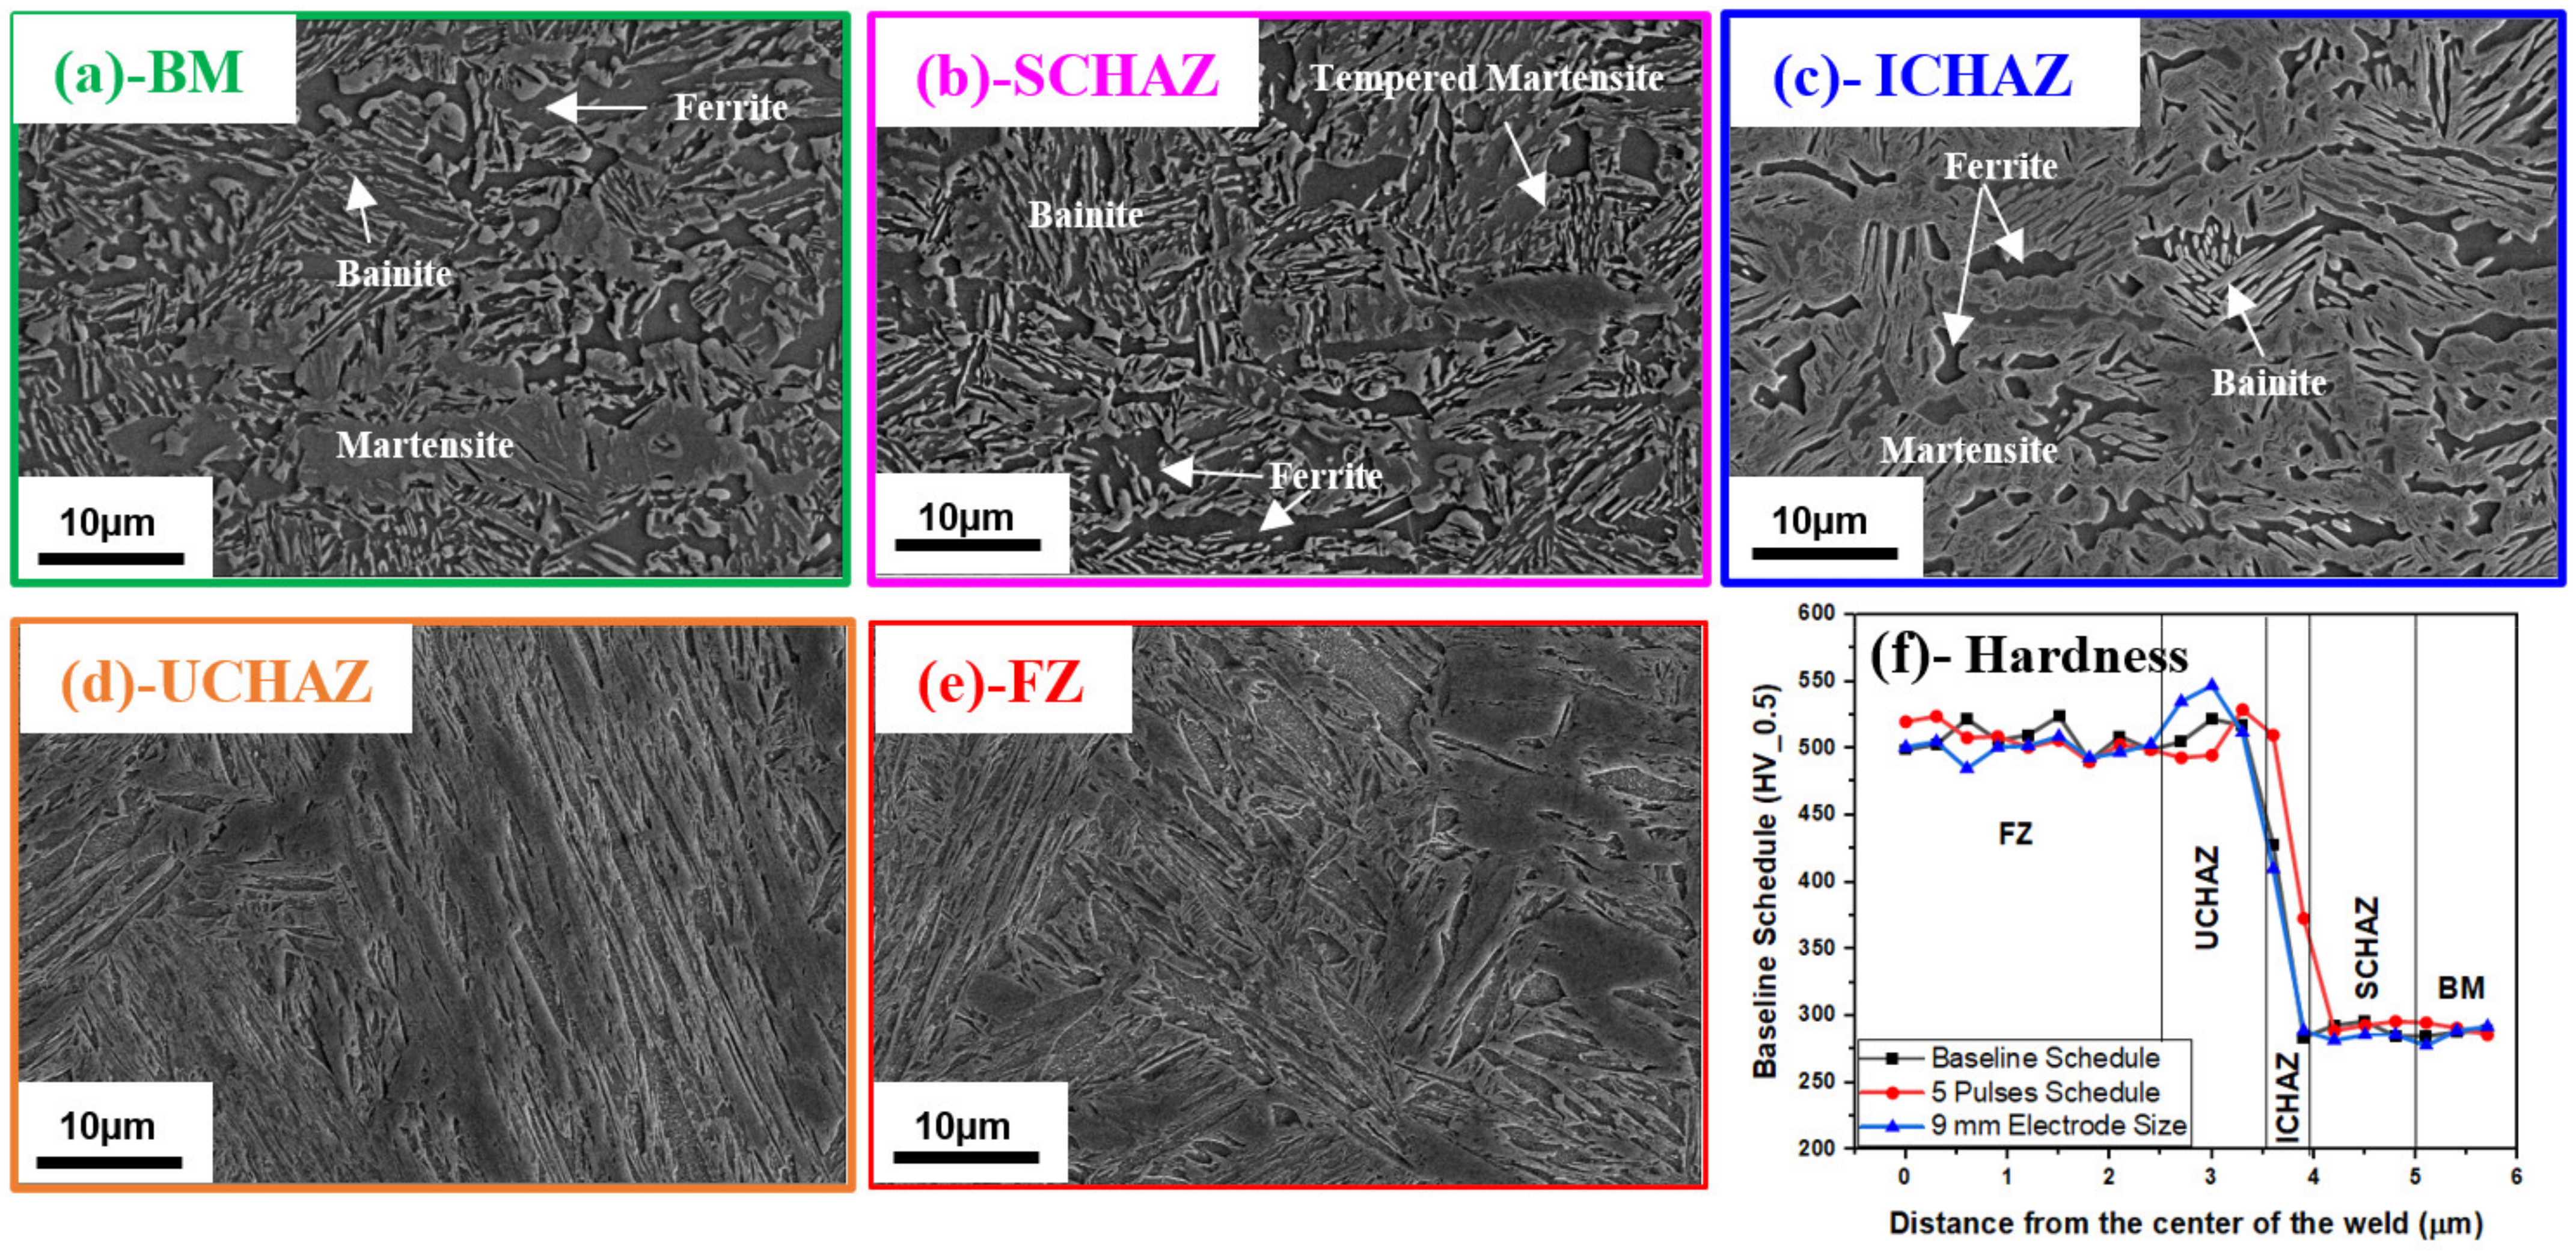
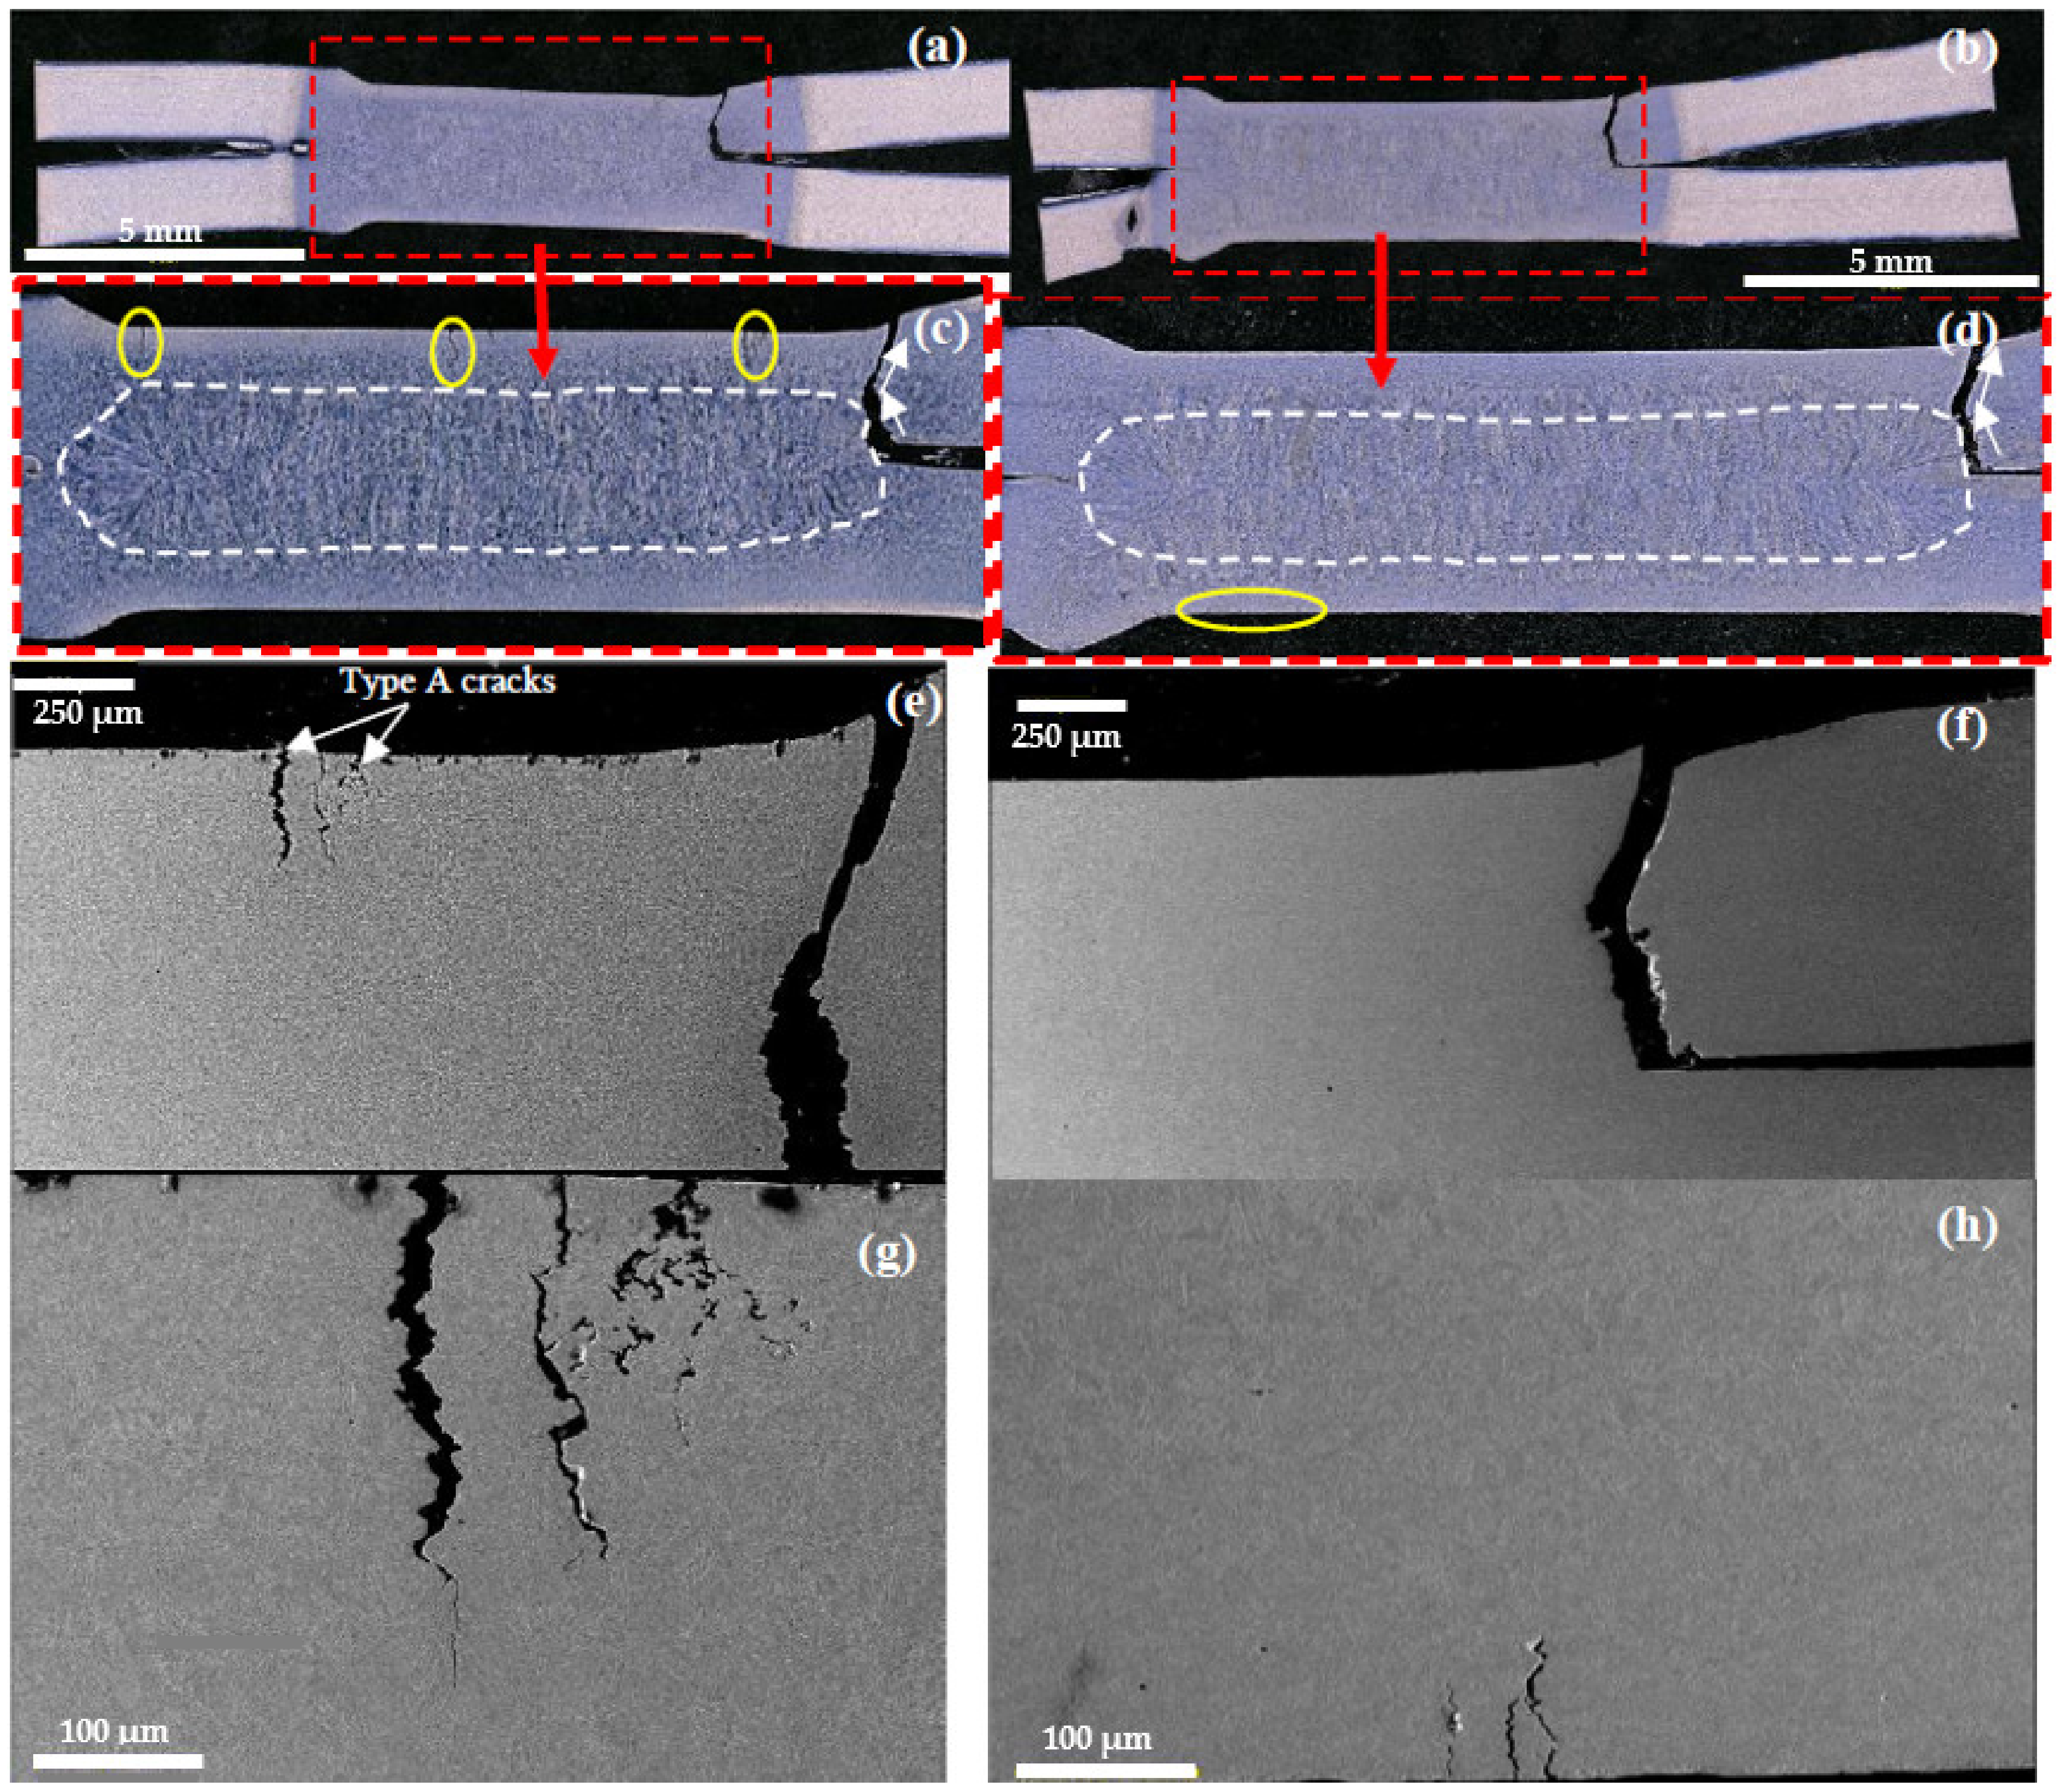
3.4. Microstructure Characterization

Note that welding parameters such as welding current and time control the heat input, which affects the development of the microstructure and subsequent mechanical properties of the weld joint. The total generated power and the accumulated heat input curves showed that all conditions have similar total heat input values (see Figure 11), which implies that the microstructure will be similar for the baseline, five-pulse, and 9 mm electrode face welding conditions. The hardness profiles shown in Figure 12 also confirmed that the microstructure between these welding conditions is very similar. However, the size of the HAZ changes slightly in the five-pulse weld condition due to the extended welding time. The baseline microstructure was investigated shown in Figure 12; the 3G-980 base material (BM) microstructure consists of a ferrite matrix with embedded martensite and bainite; the hardness of the BM is 294 ± 3 HV0.5. The microstructure of the sub-critical heat affected zone (SCHAZ), where the temperature during the welding process was below the critical temperature (AC1≈700 °C), was similar to the BM microstructure. It is expected to see martensite tempering in the SCHAZ; however, the martensite fraction in the BM was not significant. Therefore, tempered martensite does not lower the hardness; instead, the hardness value increases to 301 ± 4 HV0.5. This slight hardness increase seen in SCHAZ can be attributed to the formation of nano-size spherical complex carbide particles such as (M2C), which lead to pinning dislocation movements as reported by Ramachandran et al. [35]. The intercritical heat-affected zone (ICHAZ) microstructure combines 75% martensite, 15% ferrite, and 10% bainite. The upper critical heat-affected zone (UCHAZ) and fusion zone (FZ) have a fully martensitic microstructure, and the hardness value was 520 ± 11 HV0.5 and 505 ± 3 HV0.5, respectively.
Representative lap shear tensile testing load–displacement curves are shown in Figure 13a for the three conditions; the peak load and the absorbed energy (area under the load-displacement curve up the peak load) were averaged and summarized in the bar chart shown in Figure 13b. The average data of four repeats with 95% confidence interval error bars showed that all three conditions exhibited the same peak load and energy trend, suggesting that LME cracks have no significant effect on the mechanical performance when the weld is tested under lap joint configuration.
The failure location was investigated via interrupted lap shear tests (loading up to 90% of the peak load) to check the effect of LME indent cracks on the failure initiation and propagation behaviour. Figure 14a–d shows that the failure was initiated from the notch area and propagated toward the HAZ (shoulder area). As shown in the SEM micrographs in Figure 13e–h, the results indicated that indent cracks did not affect the shear strength and failure path under simple shear loading conditions. These results agree with the published literature by DiGiovanni et al. [8], who reported that the crack in the center of the nugget remains unaffected by tensile lap shear testing. The shear loading induces failure at the welding notch area, which will promote failure toward the weld shoulder area if there is no softening near the fusion zone area or as known (halo ring). In addition, the fusion zone microstructure is fully martensitic compared to the microstructure of the SCHAZ and BM, which will impose more deformation due to the high strain capacity in the SCHAZ and BM microstructure compared to the weld nugget and that will promote failure outside the fusion zone as reported in the lap shear DIC strain maps by Ghahfarokhi et al. [36]. The authors believe that other loading conditions, such as tensile or bending, will show a similar trend as long as the majority of the cracks are located in the indent area (Type A) cracks. Even though the average strength and absorbed energy have not changed significantly, having cracks or voids in a structural component will reduce the mechanical performance of the joint [37].

3.5. Heat Input and Heat Loss

To better understand how the changes in heat input into the weld affect LME crack severity, the total energy input into the weld was calculated from the measured current and voltage using Joule’s law. For details on calculating the total energy, see the methodology section and the article by Song et al. [12]; the total energy versus the total crack index for the Imax + 10% condition is shown in Figure 15a. A major LME reduction is achieved at high energy inputs; this LME reduction is observed using pulsed welding schedules and flat-faced electrodes with large face diameters. However, this result is counter-intuitive based on the results showing that LME increases with increasing current, as shown in the present study (Figure 6) and past studies [20]. Figure 11 shows the total heat input versus the welding time for each condition, which confirms that all welding parameters produced the same welding heat input. It was believed that the variations in heat input calculated from the dynamic current and voltage must indicate a variation in heat removal during the welding process. Therefore, the welding energy parameter from Figure 15a was rearranged as a heat loss parameter; this has been done by subtracting the calculated heat necessary to form the ovoid nugget volume seen on the weld cross-section from the total heat input calculated from the dynamic current and voltage output from the welder (Figure 15b). For details regarding the calculation of heat loss see Equations (1)–(4) in the Methodology Section. Using heat loss to rank welding schedules shows that heat extraction is a major predictor of LME severity. Moderate to high values of LME severity (CI of 0.5 to 0.7) result from low levels of heat extraction. However, as heat extraction increases to greater than 5 kJ, LME severity can be reduced to below a CI of 0.1. It may also be seen that welding parameters resulting in moderate energy extraction between 4500 J and 5000 J when welding using 9 mm R100, and 7 mm R50 electrodes also resulted in high LME severity (CI > 0.8). [15,22]. It is expected that high levels of heat extraction reduce LME by tailoring temperature distribution between the electrode/sheet interface (where LME occurs) and the faying surface (where the nugget is grown), agreeing with past work showing that controlling surface temperature during the welding cycle and after electrode extraction can mitigate LME [35]. However, it is unknown what role electrode diameter and face radius play in controlling local surface temperatures [22]. Therefore, future work will focus on this by developing a finite element (FE) model that can predict the surface temperature when welding using different techniques, which will help to understand this in more detail.

4. Conclusions

The present work highlighted the effects of current pulsing and electrode shape on LME cracking on highly susceptible GI-coated 3G-980 AHSS. The main conclusions of this study are outlined below:
  • Effect of current pulsing
Current pulsing during the welding process with a longer total weld time, leading to a slower energy input into the weld, is a promising approach to reduce LME cracks. Specifically, introducing a higher number of pulses (five pulses) while maintaining the same welding time reduced LME crack index from 0.7 to 0.05 when the current level was above expulsion.
2.
Effect of electrode geometry
Increasing electrode diameter increased LME for conditions below Imax while drastically decreasing LME formation when the current level was above expulsion (Imax+10%). Using electrodes with a larger face diameter of 9 mm is preferred over 7 mm, since an 170% reduction in LME crack index was observed. Moreover, a flat face electrode is preferred over a radius one.
3.
Effect of LME crack type on mechanical properties
The results of lap shear testing showed no loss of joint shear strength due to LME cracks. Examination of the fracture surface indicated that the majority of the cracks were in the indent area (type A), which was not part of the fracture path, and therefore did not affect the joint strength.
Future efforts will focus on performing mechanical testing in different load orientations, such as cross-tension, coach peel, and KS-II test, to investigate the effect of LME indent cracks on joint performance.
4.
Effect of heat extraction on optimized weld parameters to reduce LME severity
The reduction in LME cracks associated with an increased number of current pulsing and electrode flat-faced can be attributed to the high heat extraction associated with these welding parameters. However, other parameters, specifically welds made with 9 mm R100 and 7 mm R50 electrodes, also had high levels of heat extraction level but exhibited high LME severity. Further FE modelling work is required to determine the conditions under which heat extraction is and is not beneficial for LME reduction.

Author Contributions

Conceptualization, investigation, and writing—original draft preparation, A.R.H.M.; methodology, data curation, and validation, M.P. and K.P.; formal analysis, M.S. and O.S.; writing—review and editing, E.B., O.S. and M.S.; project administration and supervision, E.B.; funding acquisition, H.G.-A. All authors have read and agreed to the published version of the manuscript.

Funding

This work was funded by the Auto/Steel Partnership (A/SP) as part of an industrial welding solutions project (ASP-2.3).

Data Availability Statement

The data will be made available upon request.

Acknowledgments

The authors would like to thank A/SP for the financial support and the ASP project team for the valuable technical discussion, particularly Eric McCarty of A/SP. The electron microscopy was performed at Canadian Centre for Electron Microscopy (supported by NSERC and other Canadian government agencies).

Conflicts of Interest

The authors declare no conflict of interest.

References

  1. Ashiri, R.; Shamanian, M.; Salimijazi, H.R.; Haque, A.; Bae, J.-H.; Ji, C.-W.; Chin, K.-G.; Park, Y.-D. Liquid metal embrittlement-free welds of Zn-coated twinning induced plasticity steels. Scr. Mater. 2016, 114, 41–47. [Google Scholar] [CrossRef]
  2. Bayraktar, E.; Kaplan, D.; Grumbach, M. Application of impact tensile testing to spot welded sheets. J. Mater. Process. Technol. 2004, 153–154, 80–86. [Google Scholar] [CrossRef]
  3. Choi, D.-Y.; Sharma, A.; Uhm, S.-H.; Jung, J.P. Liquid Metal Embrittlement of Resistance Spot Welded 1180 TRIP Steel: Effect of Electrode Force on Cracking Behavior. Met. Mater. Int. 2019, 25, 219–228. [Google Scholar] [CrossRef]
  4. Jeon, W.-S.; Sharma, A.; Jung, J.P. Liquid Metal Embrittlement of Galvanized TRIP Steels in Resistance Spot Welding. Metals 2020, 10, 787. [Google Scholar] [CrossRef]
  5. Chuko, W.; Gould, J. Development of appropriate resistance spot welding practice for transformation-hardened steels. Weld. J. 2002, 81, 1–7. [Google Scholar]
  6. DiGiovanni, C.; Shojaee, M.; Biro, E.; Zhou, N. Effect of external loading on liquid metal embrittlement severity during resistance spot welding. Manuf. Lett. 2022, 33, 11–14. [Google Scholar] [CrossRef]
  7. Razmpoosh, M.H.; DiGiovanni, C.; Zhou, Y.; Biro, E. Pathway to understand liquid metal embrittlement (LME) in Fe-Zn couple: From fundamentals toward application. Prog. Mater. Sci. 2021, 121, 100798. [Google Scholar] [CrossRef]
  8. DiGiovanni, C.; Biro, E.; Zhou, N.Y. Impact of liquid metal embrittlement cracks on resistance spot weld static strength. Sci. Technol. Weld. Join. 2019, 24, 218–224. [Google Scholar] [CrossRef]
  9. Böhne, C.; Meschut, G.; Biegler, M.; Rethmeier, M. Avoidance of liquid metal embrittlement during resistance spot welding by heat input dependent hold time adaption. Sci. Technol. Weld. Join. 2020, 1–8. [Google Scholar] [CrossRef]
  10. Davenport, M. Generation 3 Steels—A Guide to Applications of Gen3 AHSS; United States Steel Corporation: Pittsburgh, PA, USA, 2016. [Google Scholar]
  11. Bartier, O.; Hernot, X.; Mauvoisin, G. Theoretical and experimental analysis of contact radius for spherical indentation. Mech. Mater. 2010, 42, 640–656. [Google Scholar] [CrossRef] [Green Version]
  12. Song, S.; Shojaee, M.; Midawi, A.; Sherepenko, O.; Ghassemi-Armaki, H.; Biro, E. Influence of expulsion and heat extraction resulting from changes to electrode force on liquid metal embrittlement during resistance spot welding. J. Mater. Res. Technol. 2023, 23, 1458–1470. [Google Scholar] [CrossRef]
  13. Wintjes, E.; DiGiovanni, C.; He, L.; Bag, S.; Goodwin, F.; Biro, E.; Zhou, Y.N. Effect of Multiple Pulse Resistance Spot Welding Schedules on Liquid Metal Embrittlement Severity. J. Manuf. Sci. Eng. 2019, 141, 1–23. [Google Scholar] [CrossRef]
  14. DiGiovanni, C.; Biro, E. A review of current LME test methods and suggestions for developing a standardized test procedure. Weld. World 2021, 65, 865–884. [Google Scholar] [CrossRef]
  15. DiGiovanni, C.; He, L.; Pistek, U.; Goodwin, F.; Biro, E.; Zhou, N.Y. Role of spot weld electrode geometry on liquid metal embrittlement crack development. J. Manuf. Process. 2020, 49, 1–9. [Google Scholar] [CrossRef]
  16. Murugan, S.; Mahmud, K.; Park, Y.-D. The influence of electrode geometry on liquid metal embrittlement cracking in resistance spot welding of advanced high strength steel. In Proceedings of the International Institute of Welding Annual Meeting (IIW2018), Bali, Indonesia, 15–20 July 2018; Volume 3, pp. 1876–1918. [Google Scholar]
  17. Murugan, S.P.; Mahmud, K.; Ji, C.; Jo, I.; Park, Y.-D. Critical design parameters of the electrode for liquid metal embrittlement cracking in resistance spot welding. Weld. World 2019, 63, 1613–1632. [Google Scholar] [CrossRef]
  18. DiGiovanni, C.; Kalashami, A.G.; Goodwin, F.; Biro, E.; Zhou, N. Occurrence of sub-critical heat affected zone liquid metal embrittlement in joining of advanced high strength steel. J. Mater. Process. Technol. 2021, 288, 116917. [Google Scholar] [CrossRef]
  19. Siar, O.; Dancette, S.; Dupuy, T.; Fabrègue, D. Impact of liquid metal embrittlement inner cracks on the mechanical behavior of 3 generation advanced high strength steel spot welds. J. Mater. Res. Technol. 2021, 15, 6678–6689. [Google Scholar] [CrossRef]
  20. Kim, Y.G.; Kim, I.J.; Kim, J.S.; Chung, Y.I.; Choi, D.Y. Evaluation of Surface Crack in Resistance Spot Welds of Zn-Coated Steel. Mater. Trans. 2014, 55, 171–175. [Google Scholar] [CrossRef] [Green Version]
  21. Siar, O.; Benlatreche, Y.; Dupuy, T.; Dancette, S.; Fabrègue, D. Effect of Severe Welding Conditions on Liquid Metal Embrittlement of a 3rd-Generation Advanced High-Strength Steel. Metals 2020, 10, 1166. [Google Scholar] [CrossRef]
  22. DiGiovanni, C.; Bag, S.; Mehling, C.; Choi, K.W.; Macwan, A.; Biro, E.; Zhou, N.Y. Reduction in liquid metal embrittlement cracking using weld current ramping. Weld. World 2019, 63, 1583–1591. [Google Scholar] [CrossRef]
  23. Barthelmie, J.; Schram, A.; Wesling, V. Liquid Metal Embrittlement in Resistance Spot Welding and Hot Tensile Tests of Surface-refined TWIP Steels. IOP Conf. Ser. Mater. Sci. Eng. 2016, 118, 012002. [Google Scholar] [CrossRef]
  24. ASTM International Committee E8. Standard Test Methods for Tension Testing of Metallic Materials 1; ASTM international: West Conshohocken, PA, USA, 2013. [Google Scholar] [CrossRef]
  25. Yurioka, N.; Suzuki, H.; Ohshita, S.; Saito, S. Determination of Necessary Preheating Temperature in Steel Welding. Weld. J. 1983, 62. [Google Scholar]
  26. AWS D8.9M:2012; Test Methods for Evaluting the Resistance Spot Welding Behavior of Automotive Sheet Steel Materials. American National Standard Institute: Washington, DC, USA, 2012.
  27. Shojaee, M.; Midawi, A.R.H.; Barber, B.; Ghassemi-Armaki, H.; Worswick, M.; Biro, E. Mechanical properties and failure behavior of resistance spot welded third-generation advanced high strength steels. J. Manuf. Process. 2021, 65, 364–372. [Google Scholar] [CrossRef]
  28. Kimchi, D.H. ; Menachem; Phillips. Resistance Spot Welding Fundametals and Applications for the Automotive Industry, 1st ed.; Morgan & Claypool Publishers: San Rafael, CA, USA, 2018. [Google Scholar] [CrossRef]
  29. Wintjes, E.; DiGiovanni, C.; He, L.; Biro, E.; Zhou, N.Y. Quantifying the link between crack distribution and resistance spot weld strength reduction in liquid metal embrittlement susceptible steels. Weld. World 2019, 63, 807–814. [Google Scholar] [CrossRef]
  30. DiGiovanni, C.; He, L.; Hawkins, C.; Zhou, N.Y.; Biro, E. Significance of cutting plane in liquid metal embrittlement severity quantification. SN Appl. Sci. 2021, 3, 1–8. [Google Scholar] [CrossRef]
  31. Wintjes, E. A Statistical Approach to Quantifying Impact of Multiple Pulse Resistance Spot Welding Schedules on Liquid Metal Embrittlement Cracking. Master’s Thesis, University of Waterloo, Waterloo, ON, Canada, 2019. [Google Scholar]
  32. Choi, D.; Uhm, S.; Enloe, C.; Lee, H.; Kim, G. Horvath, Liquid metal embrittlement of resistance spot welded 1180TRIP steel—Effects of crack geometry on weld mechanical performance. In Proceedings of the Materials Science & Technology Conference and Exhibition 2017 (MS&T’17), Pittsburgh, PA, USA, 8–12 October 2017; Association for Iron and Steel Technology: Warrendale, PA, USA; pp. 454–462. [CrossRef]
  33. Zhou, M.; Hu, S.J.; Zhang, H. Critical Specimen Sizes for Tensile-Shear Testing of Steel Sheets. Weld. J. 1999, 78, 305-s. [Google Scholar]
  34. DiGiovanni, C.; Han, X.; Powell, A.; Biro, E.; Zhou, N.Y. Experimental and Numerical Analysis of Liquid Metal Embrittlement Crack Location. J. Mater. Eng. Perform. 2019, 28, 2045–2052. [Google Scholar] [CrossRef]
  35. Ramachandran, D.C.; Midawi, A.R.; Shojaee, M.; Sherepenko, O.; Ghassemi-Armaki, H.; Biro, E. A comprehensive evaluation of tempering kinetics on 3rd generation advanced high strength steels. Materialia 2022, 101644, submitted for publication. [Google Scholar] [CrossRef]
  36. Sarmast-Ghahfarokhi, S.; Zhang, S.; Midawi, A.R.; Goodwin, F.; Zhou, Y.N. The failure mechanism of resistance spot welded third-generation medium-Mn steel during shear-tension loading. J. Manuf. Process. 2022, 79, 520–531. [Google Scholar] [CrossRef]
  37. Betiku, O.T.; Shojaee, M.; Sherepenko, O.; Midawi, A.R.H.; Chertov, A.M.; Ghassemi-Armaki, H.; Maev, R.G.; Biro, E. Optimizing post-weld performance of press-hardened steel resistance spot welds by controlling fusion zone porosity. Weld. World 2022, 66, 1733–1746. [Google Scholar] [CrossRef]
Figure 1. Engineering stress–strain curve for the 3G-980-GI coated material.
Metals 13 00491 g001
Figure 2. Weldability window for the 3G-980 GI coated material.
Metals 13 00491 g002
Figure 3. (a) Welding schedule for baseline; (b) optimized current pulsing schedule.
Metals 13 00491 g003
Figure 4. (a) Cutting method and different LME cracking types observed through the weld cross-section; (b) cross-section of a weld with different LME cracks.
Metals 13 00491 g004
Figure 5. The lap shear test coupon used in this study.
Metals 13 00491 g005
Figure 6. Baseline Cracking Index shows the various weld locations’ total and individual crack index values.
Metals 13 00491 g006
Figure 7. Effect of the current pulsing crack index for different current levels.
Metals 13 00491 g007
Figure 8. Schematic for the electrode shape with table shows different electrode faces and radii.
Metals 13 00491 g008
Figure 9. Bar charts show the effect of electrode geometry on the LME total crack index LME cracks.
Metals 13 00491 g009
Figure 10. Bar charts show individual LME cracks using different electrode face profiles; most cracks are located in the indent area (Type A), while not many shoulder cracks (Type B) were observed.
Metals 13 00491 g010
Figure 11. (a) Heat generation during welding process for each condition; (b) accumulated heat input versus welding time.
Metals 13 00491 g011
Figure 12. SEM micrographs showing (ae) microstructures for different zones across the weld; (f) hardness profiles from the center of the fusion zone toward the base material.
Metals 13 00491 g012
Figure 13. Lap shear data. (a) Representative load–displacement curves for each weld condition; (b) average peak load and absorbed energy at the peak load.
Metals 13 00491 g013
Figure 14. Interrupted lap shear test cross-section showing the weld nugget and failure locations for (ad) baseline two-pulse schedule and (e–h) improved five-pulse schedule.
Metals 13 00491 g014
Figure 15. Change of cracking index with the variation of boundary conditions for Imax+10%. (a) The change of total energy input; (b) the change of total heat loss.
Metals 13 00491 g015
Table 1. Chemical composition and mechanical properties of 3G-980-AHSS.
MaterialThickness (mm)Chemical Composition (%wt.)Mechanical Properties
C(Mn+Si)CeqYS (MPa)UTS (MPa)El (%)
3G-980 GI1.40.223.180.63634 ± 81015 ± 622 ± 0.8
Table 2. Weld parameters per AWS D8.9 standard. Note that the pulsing schedule was developed in this study.
MaterialForce-kNPulse Schedule-msSeq/Hold Time-msElectrode-mm
3G-980-GI4.92167-33-1671677 mm flat
567-33-67-33-67-33-67-33-67
2167-33-1679 mm flat
Table 3. Baseline crack index at different current levels.
Crack TypeThe Individual Crack Index and Total Crack Index
Current Level ABCCI-Total
Imax − 10%0.05 ± 0.050.05 ± 0.0100.09 ± 0.021
Imax − 2000.03 ± 0.040.13 ± 0.0500.169 ± 0.06
Imax + 10%0.64 ± 0.060.004 ± 0.000.013 ± 0.010.661 ± 0.06
Disclaimer/Publisher’s Note: The statements, opinions and data contained in all publications are solely those of the individual author(s) and contributor(s) and not of MDPI and/or the editor(s). MDPI and/or the editor(s) disclaim responsibility for any injury to people or property resulting from any ideas, methods, instructions or products referred to in the content.

