Article

Simulation of Fluidization Quality for Various Reduced−Gas Composition and Agitation Speed Circumstances in a Gas-Solid Fluidized Bed with an Inclined Agitator

Key Laboratory of Ecological Metallurgy of Multi−Metal Intergrown Ores of Ministry of Education, School of Metallurgy, Northeastern University, Shenyang 110819, China
*
Author to whom correspondence should be addressed.
Metals 2023, 13(2), 376; https://doi.org/10.3390/met13020376
Submission received: 14 January 2023 / Revised: 4 February 2023 / Accepted: 10 February 2023 / Published: 13 February 2023
(This article belongs to the Topic Energy-Saving and Emission Reduction in Metallurgy)

Abstract

:
Blast furnace ironmaking is one of the most serious carbon dioxide emission processes. To reduce energy consumption and CO2 emissions, fluidized bed ironmaking technology with hydrogen as a reducing agent has attracted more and more attention. An inclined agitator was added to the fluidized bed reactor to address the sticking issue in the conventional fluidized bed ironmaking process. In this research, numerical simulation was used to examine the impacts of reducing gas composition and agitation speed on the gas-solid fluidization quality in the cold fluidization of iron ore powder in the fluidized bed with an inclined agitator. The results indicate that the fluidization effect of iron ore powder is better when the volume ratios of H2 to CO and H2 to N2 are 1:1. Under the intensive shear action of the agitator, the standard deviation of pressure drop constantly decreases with the increase in agitation speed, and the decreasing range is smaller and smaller. The fluidization state of the iron ore powder particles in the bed stabilized when the agitation speed reached 160 rpm.

1. Introduction

Developing iron with fluidized bed technology alludes to the fluidized bed direct reduction process of producing iron [1]. In 1950, this technology was industrialized. Following that, several fluidization methods have been developed, including H−Iron, Nu−Iron, FIOR, FINMET, CIRCORED, DIOS, HISMELT, CIRCOFER, and FINEX, among others [2,3,4,5,6,7,8,9,10]. However, only FINMET, CIRCORED, FINEX, and HISMELT have accomplished industrialization in recent years.
The reduction of kinetic conditions such as heat and mass transfer between iron ore powder and gas is improved with finer iron ore powder particle size in fluidized bed ironmaking technology, which does not employ pellets or coke [11,12,13]. In addition, using hydrogen as the reductant in the reduction of iron ore powder can significantly speed up the process [14,15], which is of great significance in reducing energy consumption and carbon dioxide emissions. However, in industrial production, uneven gas-solid distribution affects the fluidization quality and the effectiveness of heat and mass transfer, and the iron ore powder particles in the classic fluidized bed are prone to sticking [16,17,18,19]. The rate of iron ore powder reduction is constrained, which has an impact on the process’ ability to run continuously.
For the reduction process of iron ore powder in the fluidized bed, the most acceptable reason for the sticking is the bonding effect of iron whiskers and highly active new metal iron. In the process of fluidization, when iron ore powder particles are bonded together, the mutual movement resistance between particles increases, which allows the phenomenon of de−fluidization to occur [20,21,22]. Many scholars have carried out a series of studies on how to prevent sticking. First of all, the problem of sticking can be reduced by controlling the reaction temperature and properly increasing the fluidization gas velocity [23,24], but the effect is limited. Secondly, coating or isolation treatment of iron ore powder particles can reduce the bonding problem between iron ore powder particles in the reduction process to a certain extent [25,26]. Third, the use of mechanical interference force can act on the bonded particles in the bed to increase the momentum of particles and prevent the phenomenon of de−fluidization. The use of mechanical and acoustic vibrations can promote the uniform distribution of gas and solid [27], but its applicability is limited due to its low agitating energy. In addition, adding stirring equipment is also a feasible method to solve the problem of iron ore powder sticking in the reduction process. Han [28] studied the influence of frame agitators on the fluidization behavior of D−type particles through numerical simulation and experiment. The results show that stirring can improve the fluidization quality. However, this method is rarely used in the fluidized bed ironmaking process. Song [29] added a direct agitator device to the fluidized bed of ultrafine iron oxide powder. It is concluded that the addition of an agitator device can improve the fluidization quality of iron oxide powder.
A novel idea was made to use an inclined agitator to prevent particle sticking during the fluidized ironmaking process, which can further increase the effectiveness of the agitator device. Li [30] conducted simulation and experimental research on the fluidization behavior of glass beads using air. It was proven that compared with a vertical agitator, an inclined agitator can better break bubbles, reduce pressure fluctuations, and improve the quality of gas-solid fluidization in the fluidized bed. The inclined agitator increases the bubble’s shear property, drives particles into the bubble, and expands the effect zone in the axial direction.
Many factors affect the sticking of iron ore powder particles in the actual high−temperature reduction process, such as gas composition, agitation speed, gas speed, and other conditions that have a great impact on the fluidization state of iron ore powder particles. Therefore, this paper does not consider the change of reduction temperature and gas composition and instead researches the influence of reduction gas composition and agitation speed on gas-solid flow during the fluidization of iron ore powder in a fluidized bed with an inclined agitator by numerical simulation. The type of agitator used is a three round blade propelling agitator. Using the Eulerian model, a three−dimensional numerical simulation of the fluidization process in the fluidized bed with an inclined agitator at room temperature is conducted to determine the optimal fluidization parameters for uniform gas-solid distribution in the fluidized bed. In the actual high−temperature reduction process in the future, the efficiency of heat and mass transfer between the gas-solid phase in the fluidized bed can be improved, which is of great significance to improve the reduction efficiency of metallic iron.

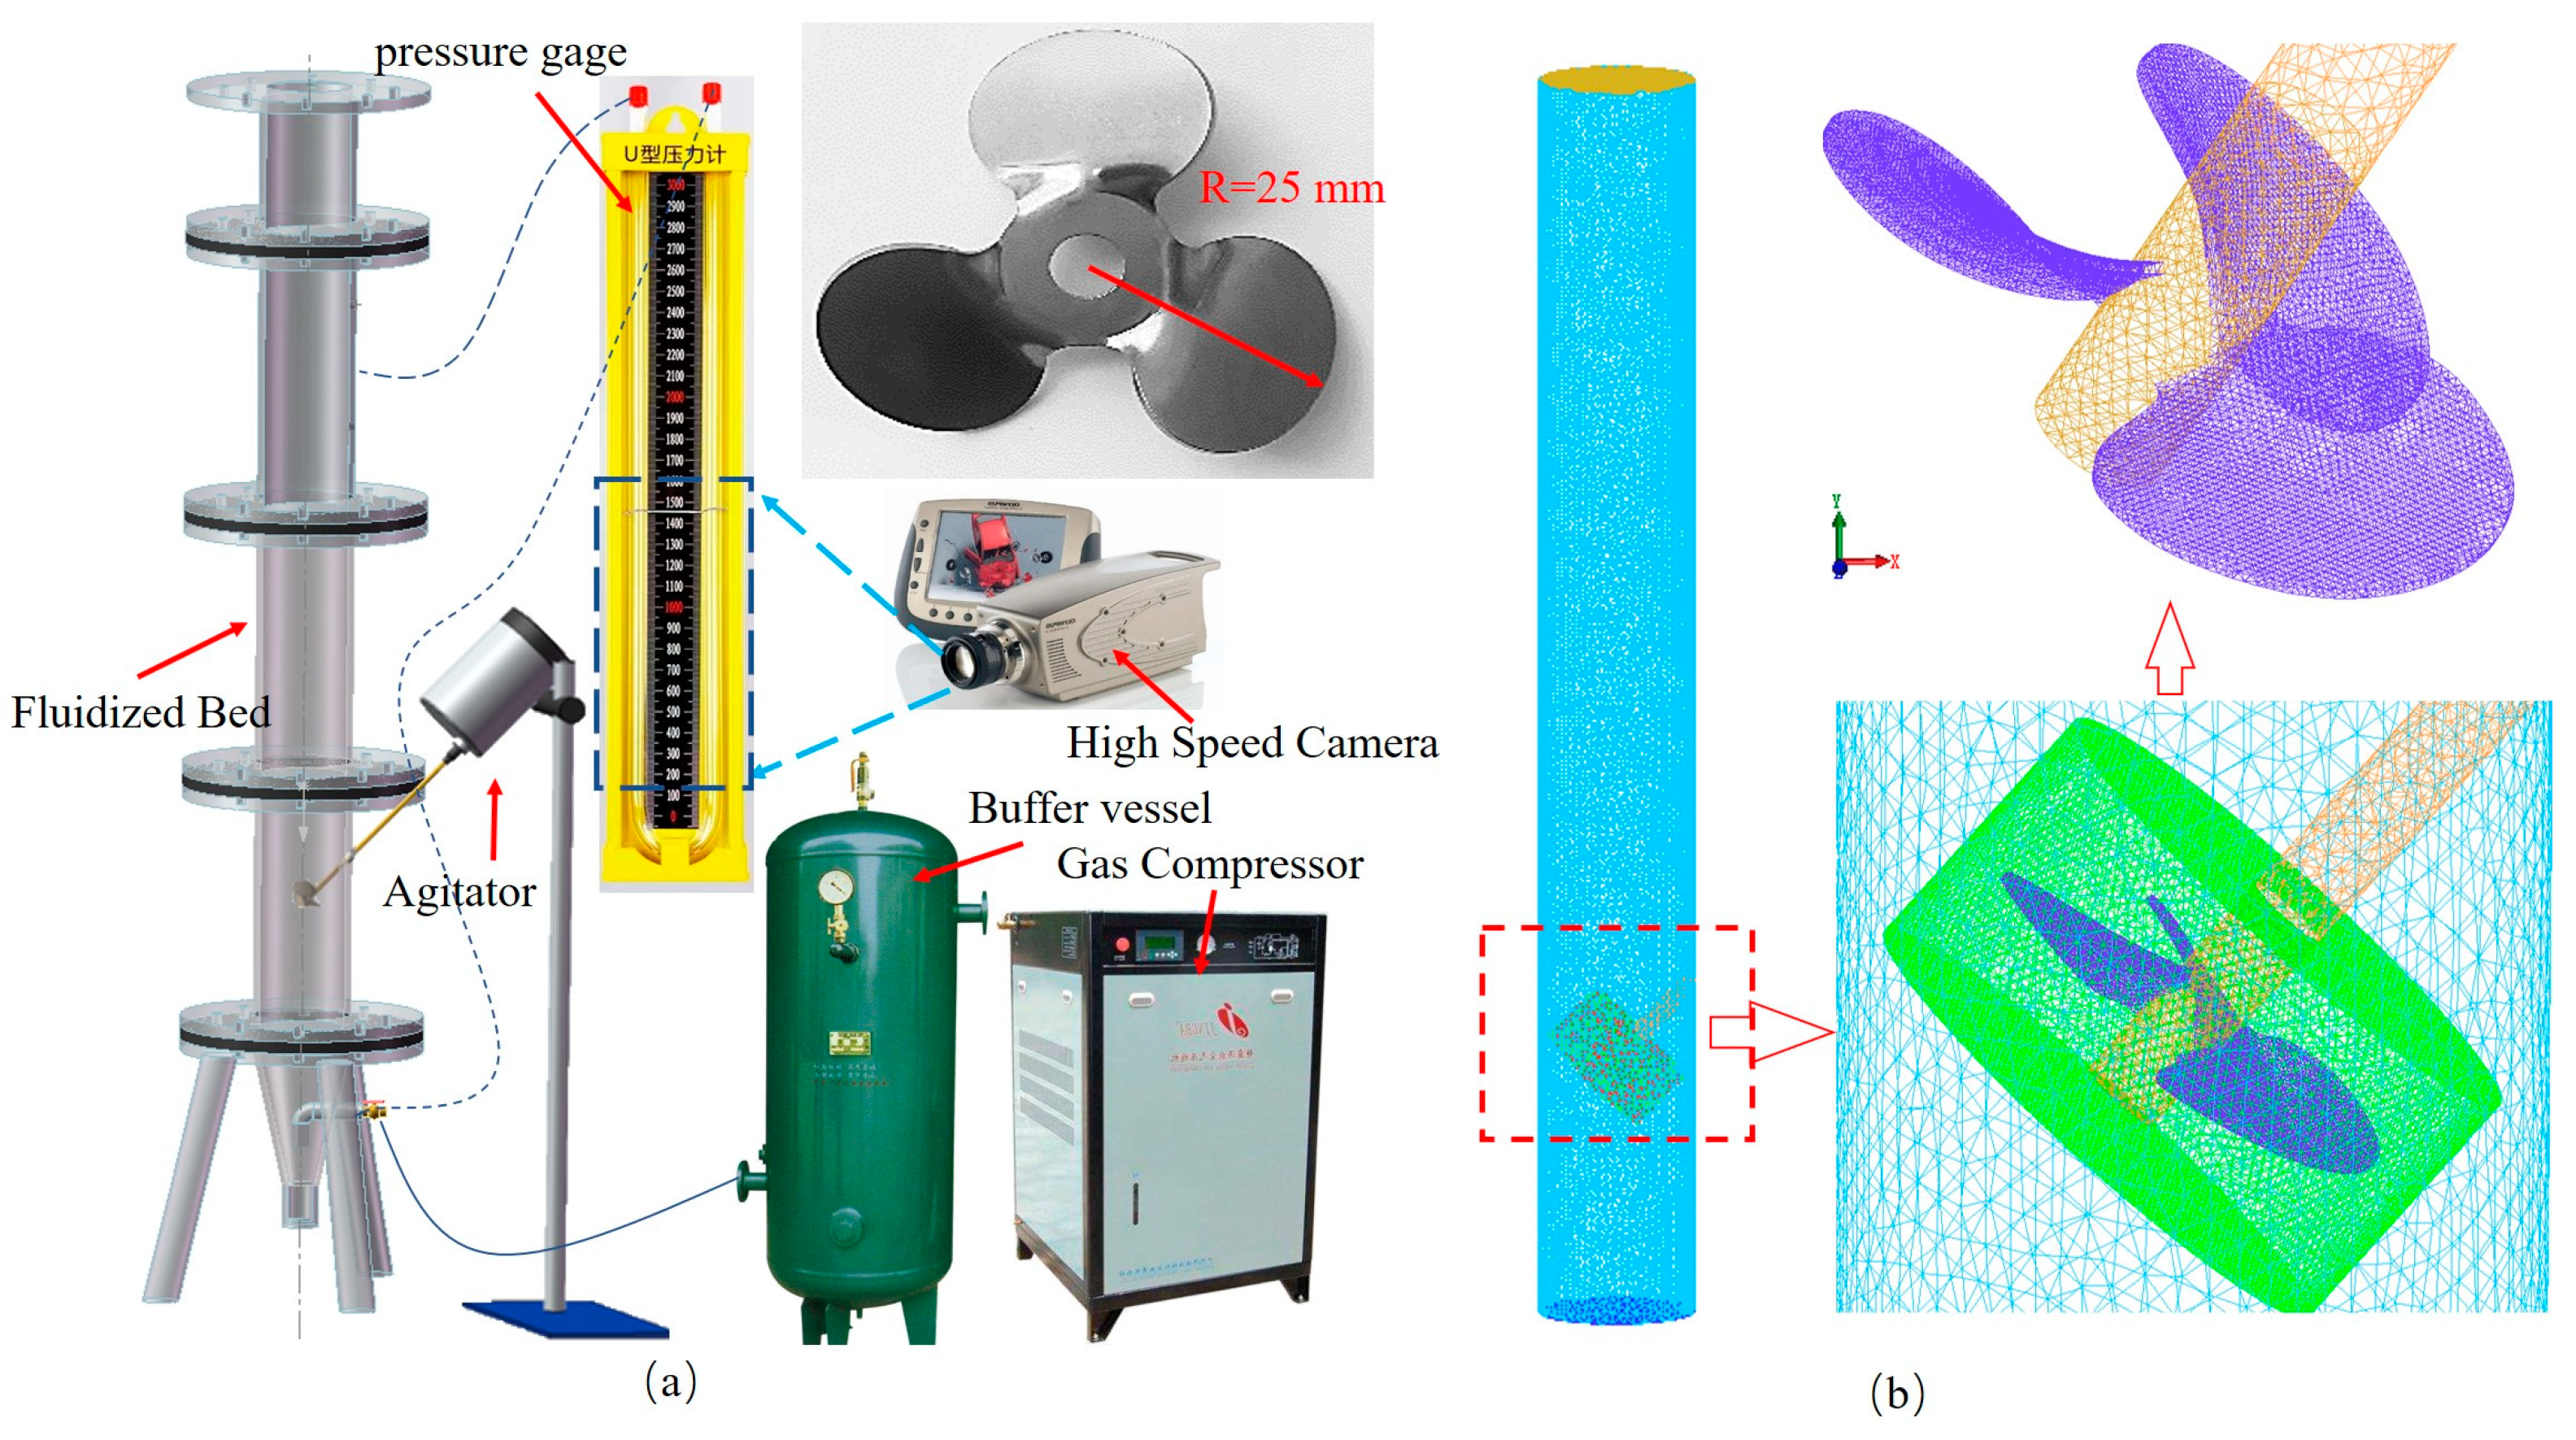
2. Simulation Strategy

SOLIDWORKS 2019 and ANSYS ICEM 2019 are applied to the establishment of geometric models and grid models. ANSYS FLUENT 2019 is applied to the numerical simulation of the fluidized bed with an inclined agitator in this paper. The Eulerian–Eulerian two−fluid model, which consists of a set of continuity and momentum equations for gas and solid phases, is used to simulate the agitated fluidized bed. The kinetic theory of granular flows is used to determine the solid phase’s properties. The properties of the solid phase are obtained by applying the kinetic theory of granular flows.
Due to the complex flow state of reducing gas and iron ore powder particles in the fluidized bed with an inclined agitator, the following model assumptions are made in this paper.
(1)
The slip between the wall and the gas-solid phase is not considered;
(2)
The lift between gas and solid is not considered;
(3)
Due to the large density difference between gas and solid, the virtual mass force is not considered;
(4)
The dispersion force of turbulence is not considered.
Figure 1a shows the physical simulation experimental system at room temperature. The system is used to verify the accuracy of the numerical model. It includes the fluidized bed, gas supply system, mixing equipment, and optical system. The inner diameter of the fluidized bed is 70 mm, and the radius of the agitator is 25 mm. An unstructured grid is applied to build a grid model of the fluidized bed with an inclined agitator, as shown in Figure 1b. Volume fraction as a function of time and space is introduced, and the sum of the volume fraction of the phases is equal to 1. The simulation results are obtained by solving the gas-solid phase’s continuity equation, momentum equation, and closure equation. The sliding grid method is used to simulate the fluidized bed with an inclined agitator. The RNG kε (Renormalization group kε) turbulence model is chosen for this investigation based on the available computational power and the precision of the calculation results. The phase−coupled SIMPLE algorithm is used as the pressure–velocity coupling method and the equation is solved by the unsteady method. The governing equations are as follows.

2.1. Governing Equations

Continuity equations:
t ρ g ε g + div ε g ρ g u g = 0 ,
t ρ s ε s + div ε s ρ s u s = 0 ,
Momentum equation:
t ε g ρ g u g + div ε g ρ g u g u g = div τ g + ε g ρ g g ε g div p β u g u s ,
t ε s ρ s u s + div ε s ρ s u s u s = div τ s + ε s ρ s g ε s div p div p s + β u g u s
where ε is the volume fraction, g is the gravity acceleration, p is the thermodynamic pressure, β is the interface momentum transfer coefficient, τg is the stress tensor of the gas phase, ps is the particle pressure caused by the particle−particle interactions, and τs is the stress tensor of solid, εg + εs = 1.
Stress tensor of gas phase:
τ g = μ g div u g + div u g T 2 3 μ g div u g I .
Stress tensor of solid:
τ s = μ s div u s + div u s T 2 3 div u s I + ξ s div u s I .
Particle pressure:
p s = ε s ρ s Θ + 2 ρ s ( 1 + e s ) ε s 2 g 0 Θ ,
where es is the collision recovery coefficient of solid particles, and g0 is the radial distribution function.
Solids bulk viscosity:
ξ s = 4 3 ε s 2 ρ s d s g 0 ( 1 + e s ) Θ π 1 / 2 .
Solids shear viscosity:
μ s = 4 5 ε s 2 ρ s d s g 0 ( 1 + e s ) Θ π 1 / 2 + 10 ρ s d s π Θ 96 ( 1 + e s ) ε s g 0 1 + 4 5 g 0 ε s ( 1 + e s ) 2 .
Radial distribution function:
g 0 = 1 ε s ε s , max 1 / 3 1 .
Turbulence kinetic energy k:
ρ k t + ρ w k z = z [ α k μ eff k z ] + P - ρ ε .
Turbulent dissipation rate ε:
ρ ε t + ρ w ε z = z α ε μ eff ε z + C 1 ε ε k P C 2 ε ρ ε 2 k ,
μ eff = μ + ρ C u k 2 / ε ,
C 1 ε = C 1 ε η ( 1 η / η 0 ) ( 1 + β η 3 ) ,
η = k / ε 2 E i j E i j ,
E i j = 1 2 ( u i x j + u j x i ) ,
where μeff is the corrected turbulent viscosity; Cu is the viscosity coefficient, Cu = 0.85; C* and η are model coefficients; Eij is the time average strain rate; η0 = 4.377, β = 0.012, αK = αε = 1.39, C = 1.42, and C = 1.68.
Li’s study [30] is based on the Ergun and Wen–Yu drag models, combined with the Arastoopour model and connected by the smooth function proposed by Lu [31], to obtain a drag model suitable for B−type particles. The modified drag force model is as follows.
β m = φ β Ergun + Φ φ β Syamlal O Brien + 1 Φ β Wen Yu .
Wen–Yu model:
β Wen Yu = 3 4 C D ε s ρ g u s u g d s ε g 2 . 65 ,
C D = 24 R e s ( 1 + 0.15 R e s 0 . 687 ) R e s < 1000 0.44 R e s 1000 ,
R e s = ε g ρ g | u s u g | d s μ g .
Syamlal–O’Brien model:
β Syamlal   O Brien = 3 ε g ( 1 ε g ) ρ g 4 V rs 2 d s C D 1 u s u g ,
C D 1 = 0.63 + 4 . 8 R e p / V rs 2 ,
v r,s = 0.5 ( A 0.06 R e s + 0.06 Re s 2 + 0.12 R e s ( 2 B A ) + A 2 )
B = 0.8 ε g 1.28 ε s 0.85 ε g 2.65 ε s > 0.85 ,
A = ε g 4.14 .
Ergun model:
β Ergun = 150 ε s 2 μ g ε g d s 2 + 1.75 ε s ρ g d s u s u g .
Smooth function:
φ = arctan 150 × 1.75 ε s 0.4 π + 0.5 ,
Φ = arctan 150 × 1.75 ε s 0.1 π + 0.5 .

2.2. Boundary Conditions and Simulation Parameters

The gas composition investigated in this study includes pure hydrogen, H2, and CO at a volume ratio of 1:1, H2 and N2 at a volume ratio of 1:1, and pure carbon monoxide. The agitation speeds are 0, 80, 160, 240, and 320 rpm, respectively. The operating pressure is 101.325 kPa. The wall of the fluidized bed and agitator adopt the non−slip boundary condition. Other physical parameters and operating parameters are shown in Table 1. The modified drag model is imported into FLUENT software by UDF (user−defined functions).

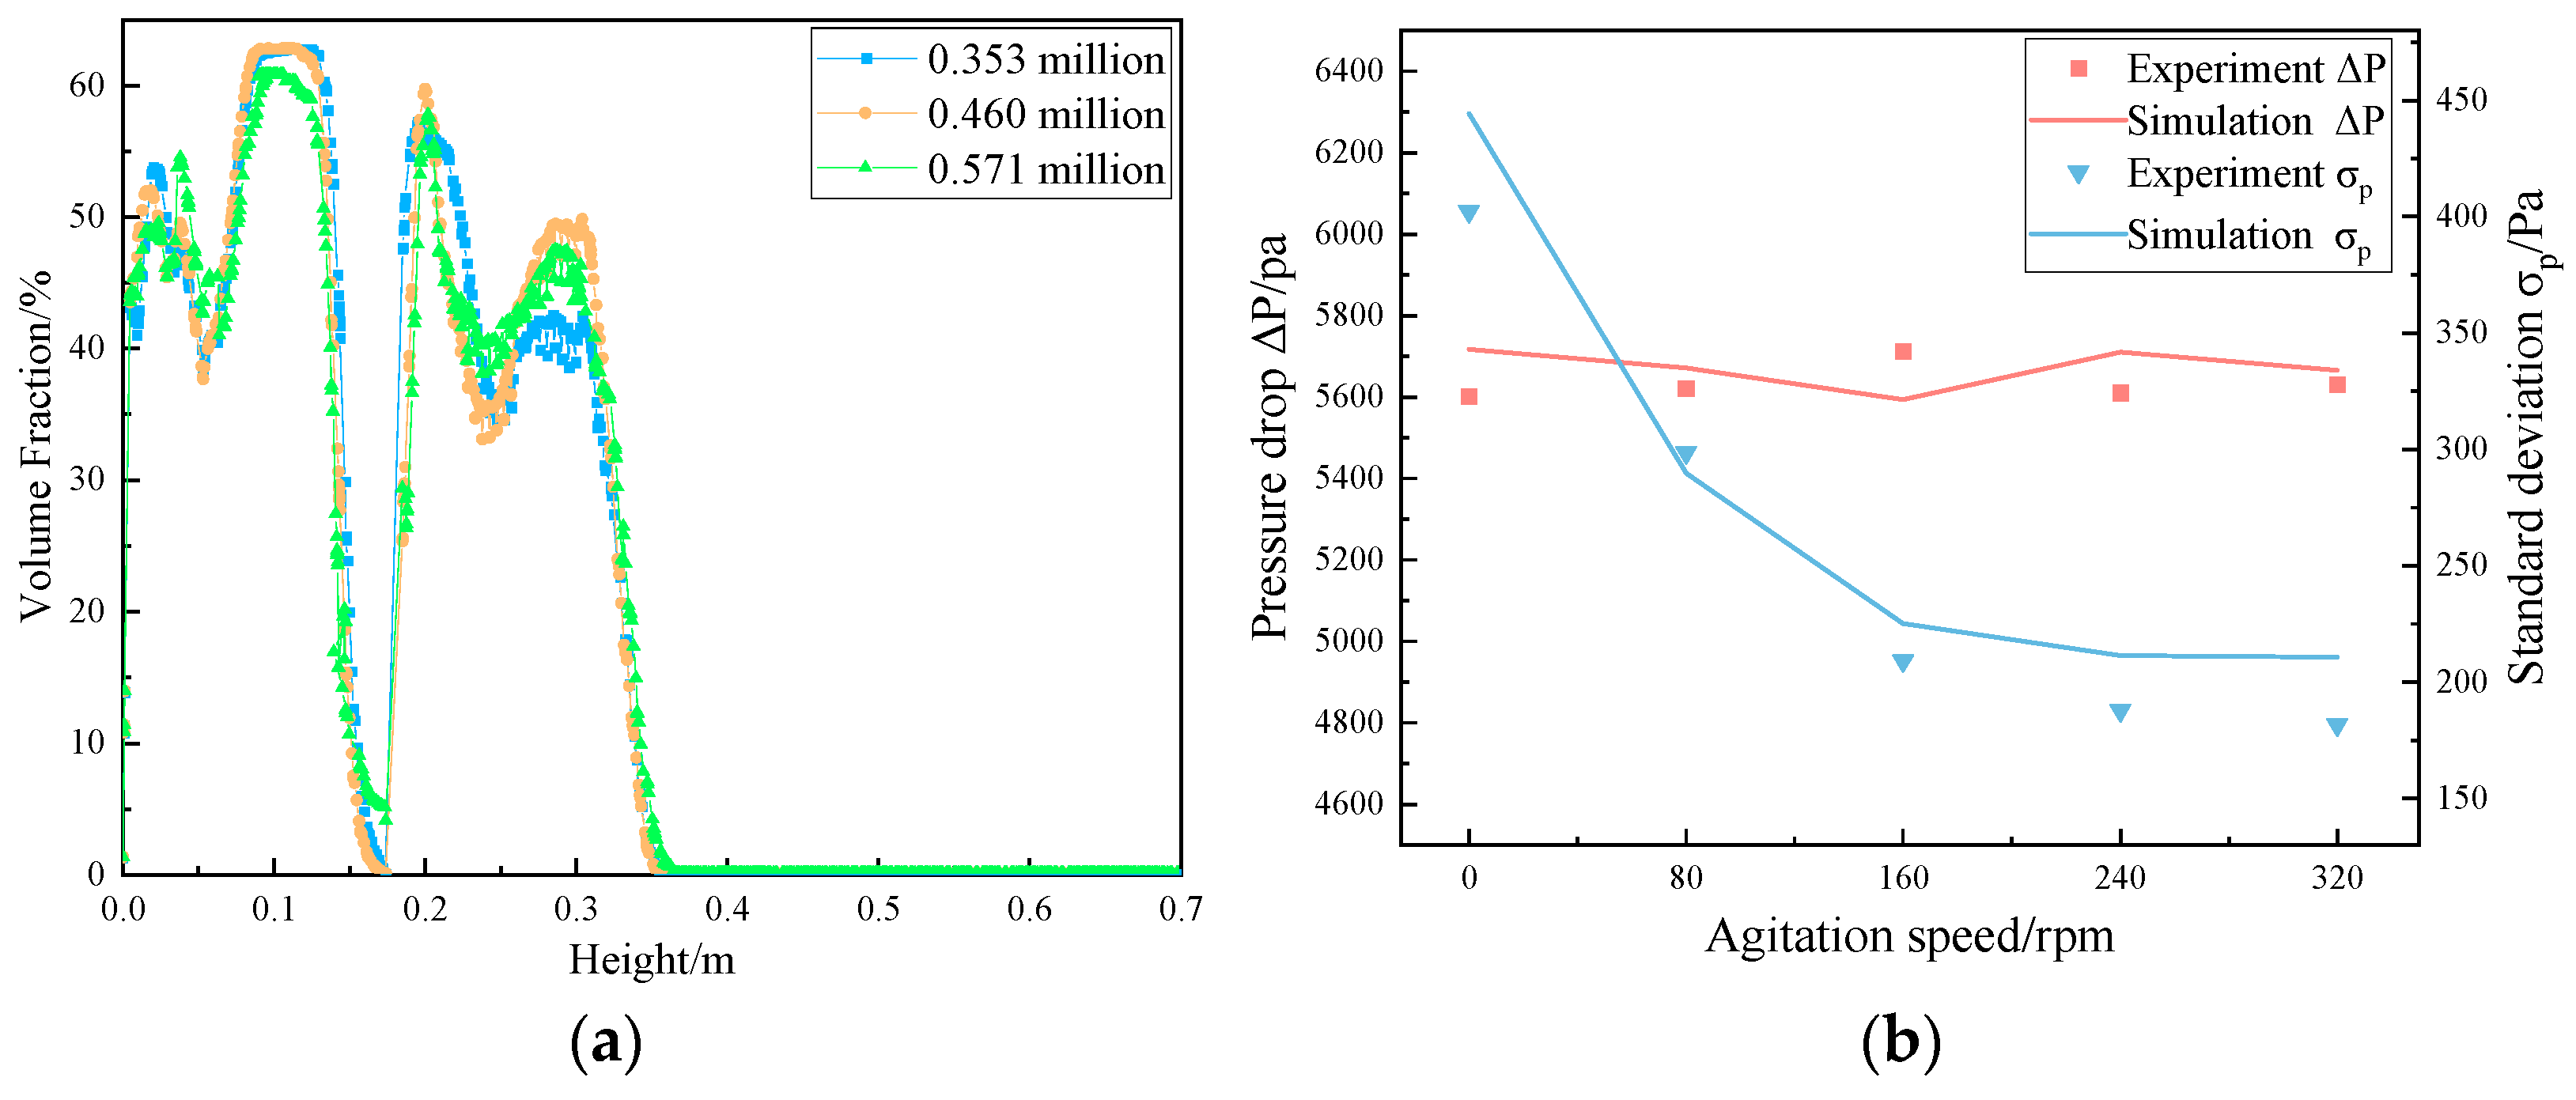
2.3. Verification of Simulation Results

Through the verification of grid independence, a certain grid density is selected to use relatively small computing resources to obtain better computing accuracy. Under certain conditions (pure hydrogen, gas velocity 0.5 m/s, agitation speed 160 rpm), the fluidization of iron ore powder in a fluidized bed with an inclined agitator under different grid number conditions is simulated. The number of grids is 353 thousand, 460 thousand, and 571 thousand. Figure 2a shows the volume fraction distribution of axial iron ore powder particles in the bed at 1 s for various grid numbers. The simulation results of the three cases are comparable. In this study, 353 thousand grids are chosen to conserve computational resources and guarantee the precision of simulation results.
To ensure the accuracy of the numerical model, the simulation results of the gas-solid flow numerical model in a fluidized bed with an inclined agitator are verified by physical simulation in this paper. In the numerical simulation, carbon monoxide gas is used to fluidize iron ore powder particles. Because the density, viscosity, and other physical parameters of carbon monoxide at room temperature are very different from air, and to ensure the safety of the experiment, air is used to fluidize iron ore powder in physical simulation. Because the density, viscosity, and other physical parameters of air at normal temperature are similar to carbon monoxide, and to ensure the safety of the experiment, air is used to fluidize iron ore powder particles in physical simulation. The geometric model and operating parameters of the fluidized bed with an inclined agitator are consistent with the numerical simulation process. The particle size of iron ore powder is 400 μm. The gas velocity is 0.5 m/s. A high−speed camera is used to record the pressure drop changes of the bed at different agitation speeds. The bed pressure drop is calculated every 0.2 s after fluidization. A total of 50 groups of data are recorded. The average value of bed pressure drop is calculated and three repeated experiments are carried out. The results are shown in Figure 2b. The results of the physical simulation are in good agreement with those of the numerical simulation. In addition, the standard deviation of bed pressure drop effectively reflects the fluctuation of bed pressure as an important influence index in the research of the fluidized bed. To further verify the numerical model, the standard deviation of bed pressure drop under different agitation speeds in the physical simulation is calculated (Figure 2b), and the obtained results are the same as the distribution model of the numerical simulation, which is in good agreement.
The main reason for the deviation is that in the simulation process, the particle size of iron ore powder is assumed to be a single particle size, while in the actual physical simulation process, the particles are irregular spheres, and the particle size distribution is a range. Another reason is that some forces with little bearing on the particle fluidization process will be disregarded to simplify the computation model. The general feasibility of numerical simulation is demonstrated by the simulation results obtained using the numerical model, which is in good agreement with the experimental results.

3. Results and Discussion

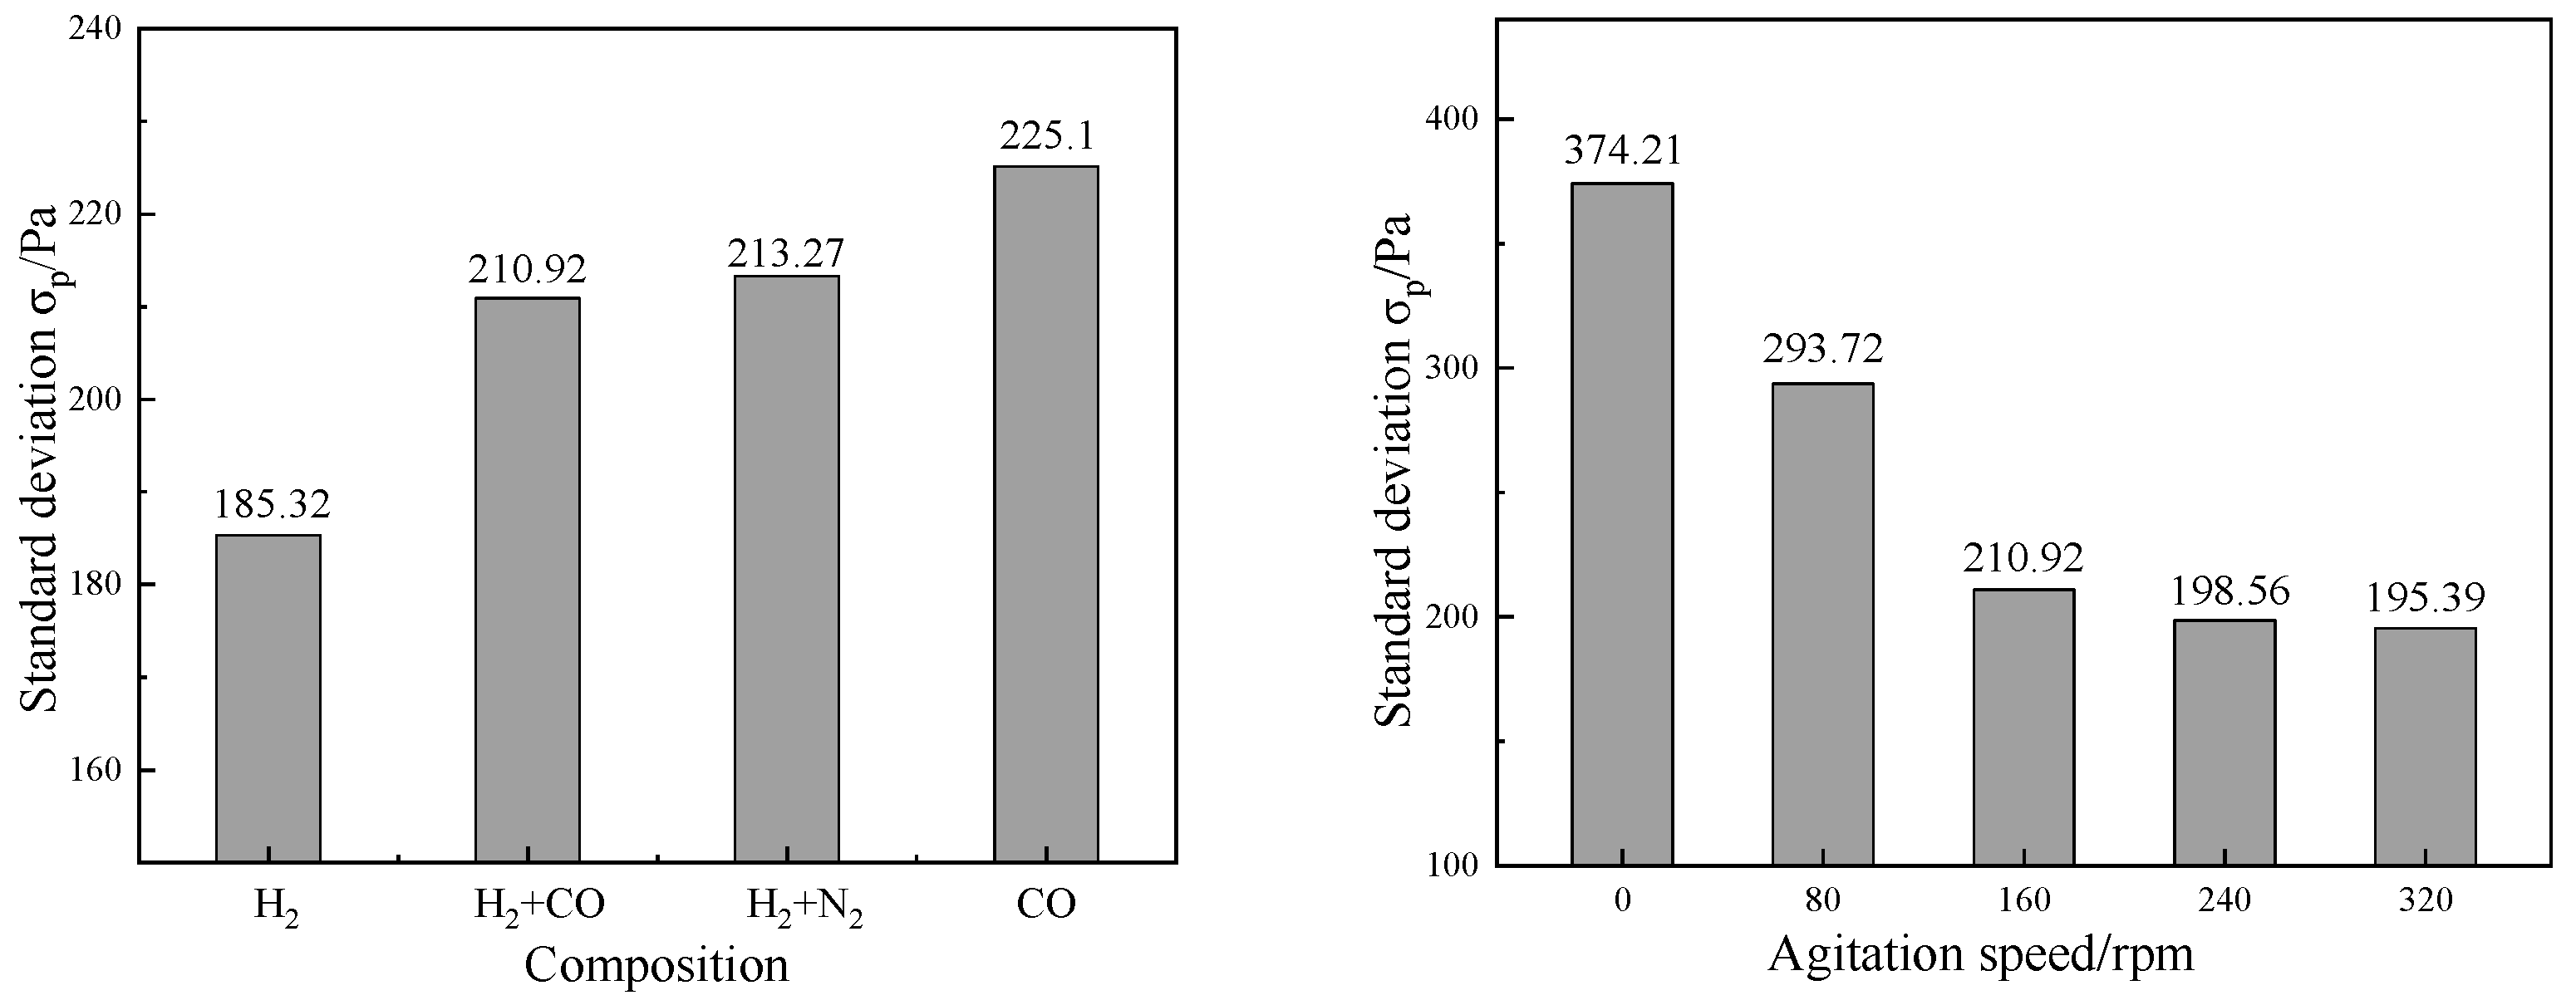
3.1. Standard Deviation of Pressure Drop

The gas volume fraction changes due to the interaction between gas and solid particles in the fluidized bed. The bed vibration is caused by the collision between particles and agitator or particles and wall, which can make the bed pressure fluctuate in different amplitude. The standard deviation of bed pressure drop is an important parameter which can effectively reflect the fluctuation of bed pressure. Therefore, the standard deviation of bed pressure drop can judge the stability of a fluidized bed. Figure 3a shows the standard deviation of pressure drop in the fluidized bed with different gas compositions when the agitator speed is 160 rpm. Figure 3b shows the standard deviation of pressure drop of the fluidized bed at different agitator speeds when the volume ratio of hydrogen to carbon monoxide is 1:1. Although the standard deviation of pressure drop during the fluidization of pure hydrogen is the smallest, a large number of particles in the bed are in an aggregated state, which reduces the contact area between gas and solid, and will affect the reduction of iron ore fines. In the other three cases, the standard deviation of pressure drop in the atmosphere with the volume ratio of hydrogen to carbon monoxide of 1:1 is the smallest. Additionally, as the agitator speed increases from 0 rpm to 160 rpm, the standard deviation of pressure drop decreases rapidly. However, when the agitator speed continues to increase, the decrease in the standard deviation of pressure drop becomes smaller and smaller. This shows that the fluidized state of iron ore powder particles in the bed is relatively stable when the agitator speed reaches 160 rpm in the atmosphere with the volume ratio of hydrogen to carbon monoxide of 1:1 and the standard deviation of pressure drop in the fluidized bed is 210.92. However, increasing the agitator speed has little effect on the fluidization quality of iron ore powder particles and will increase energy consumption.

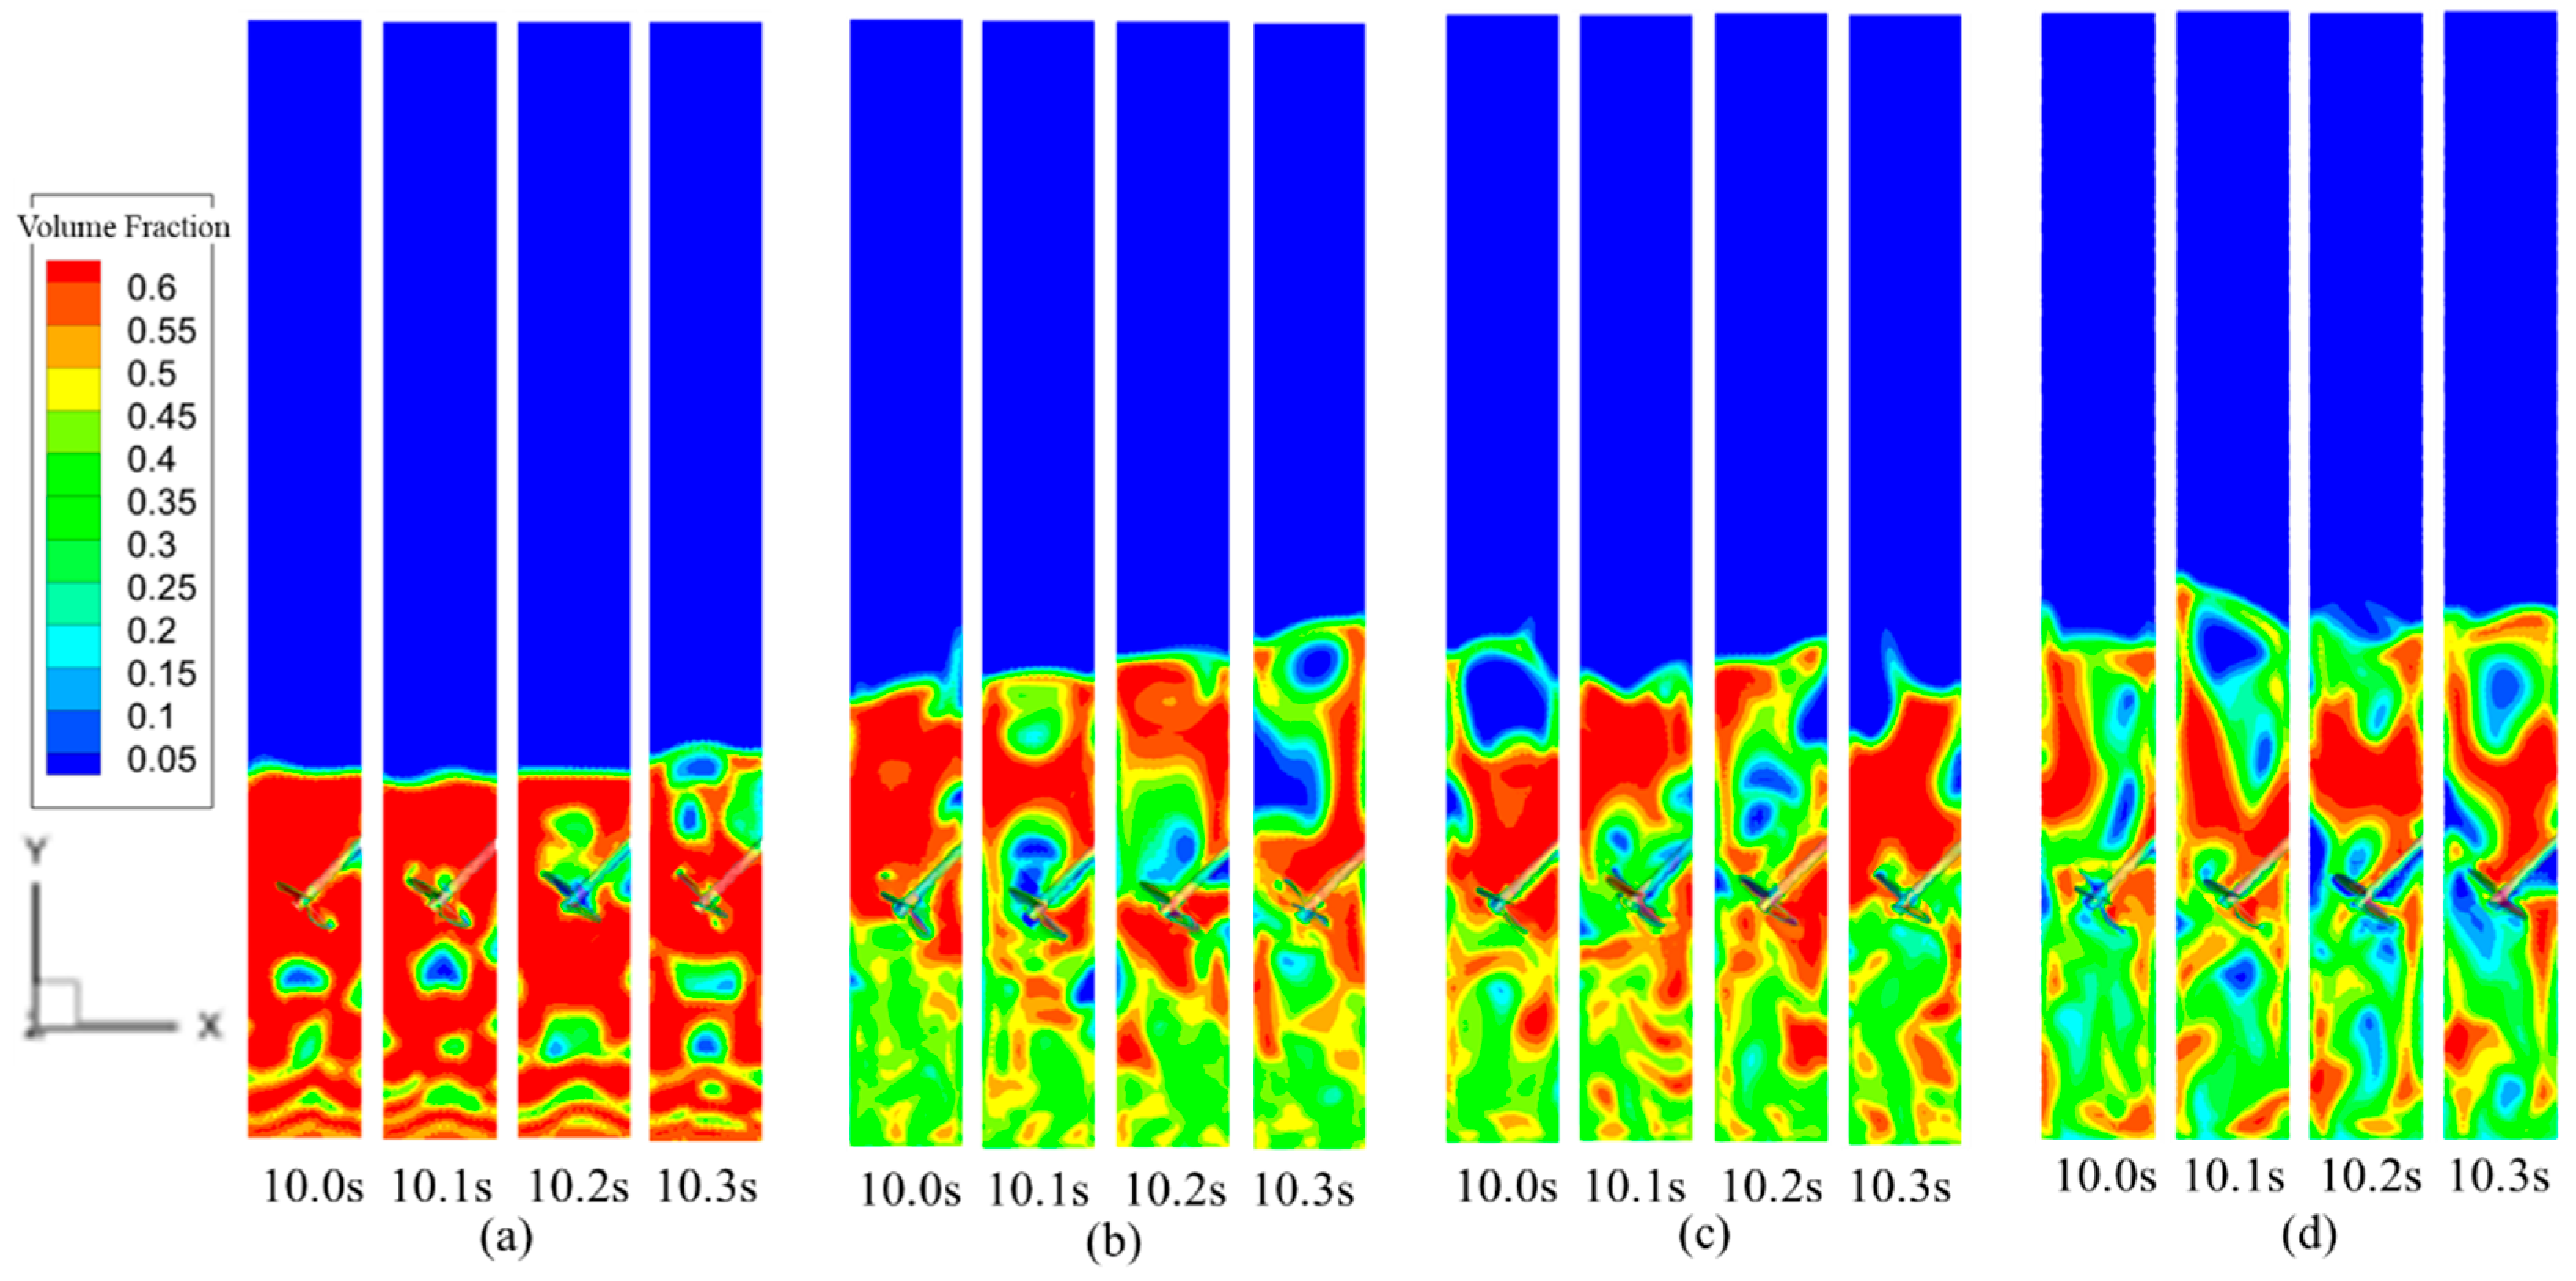
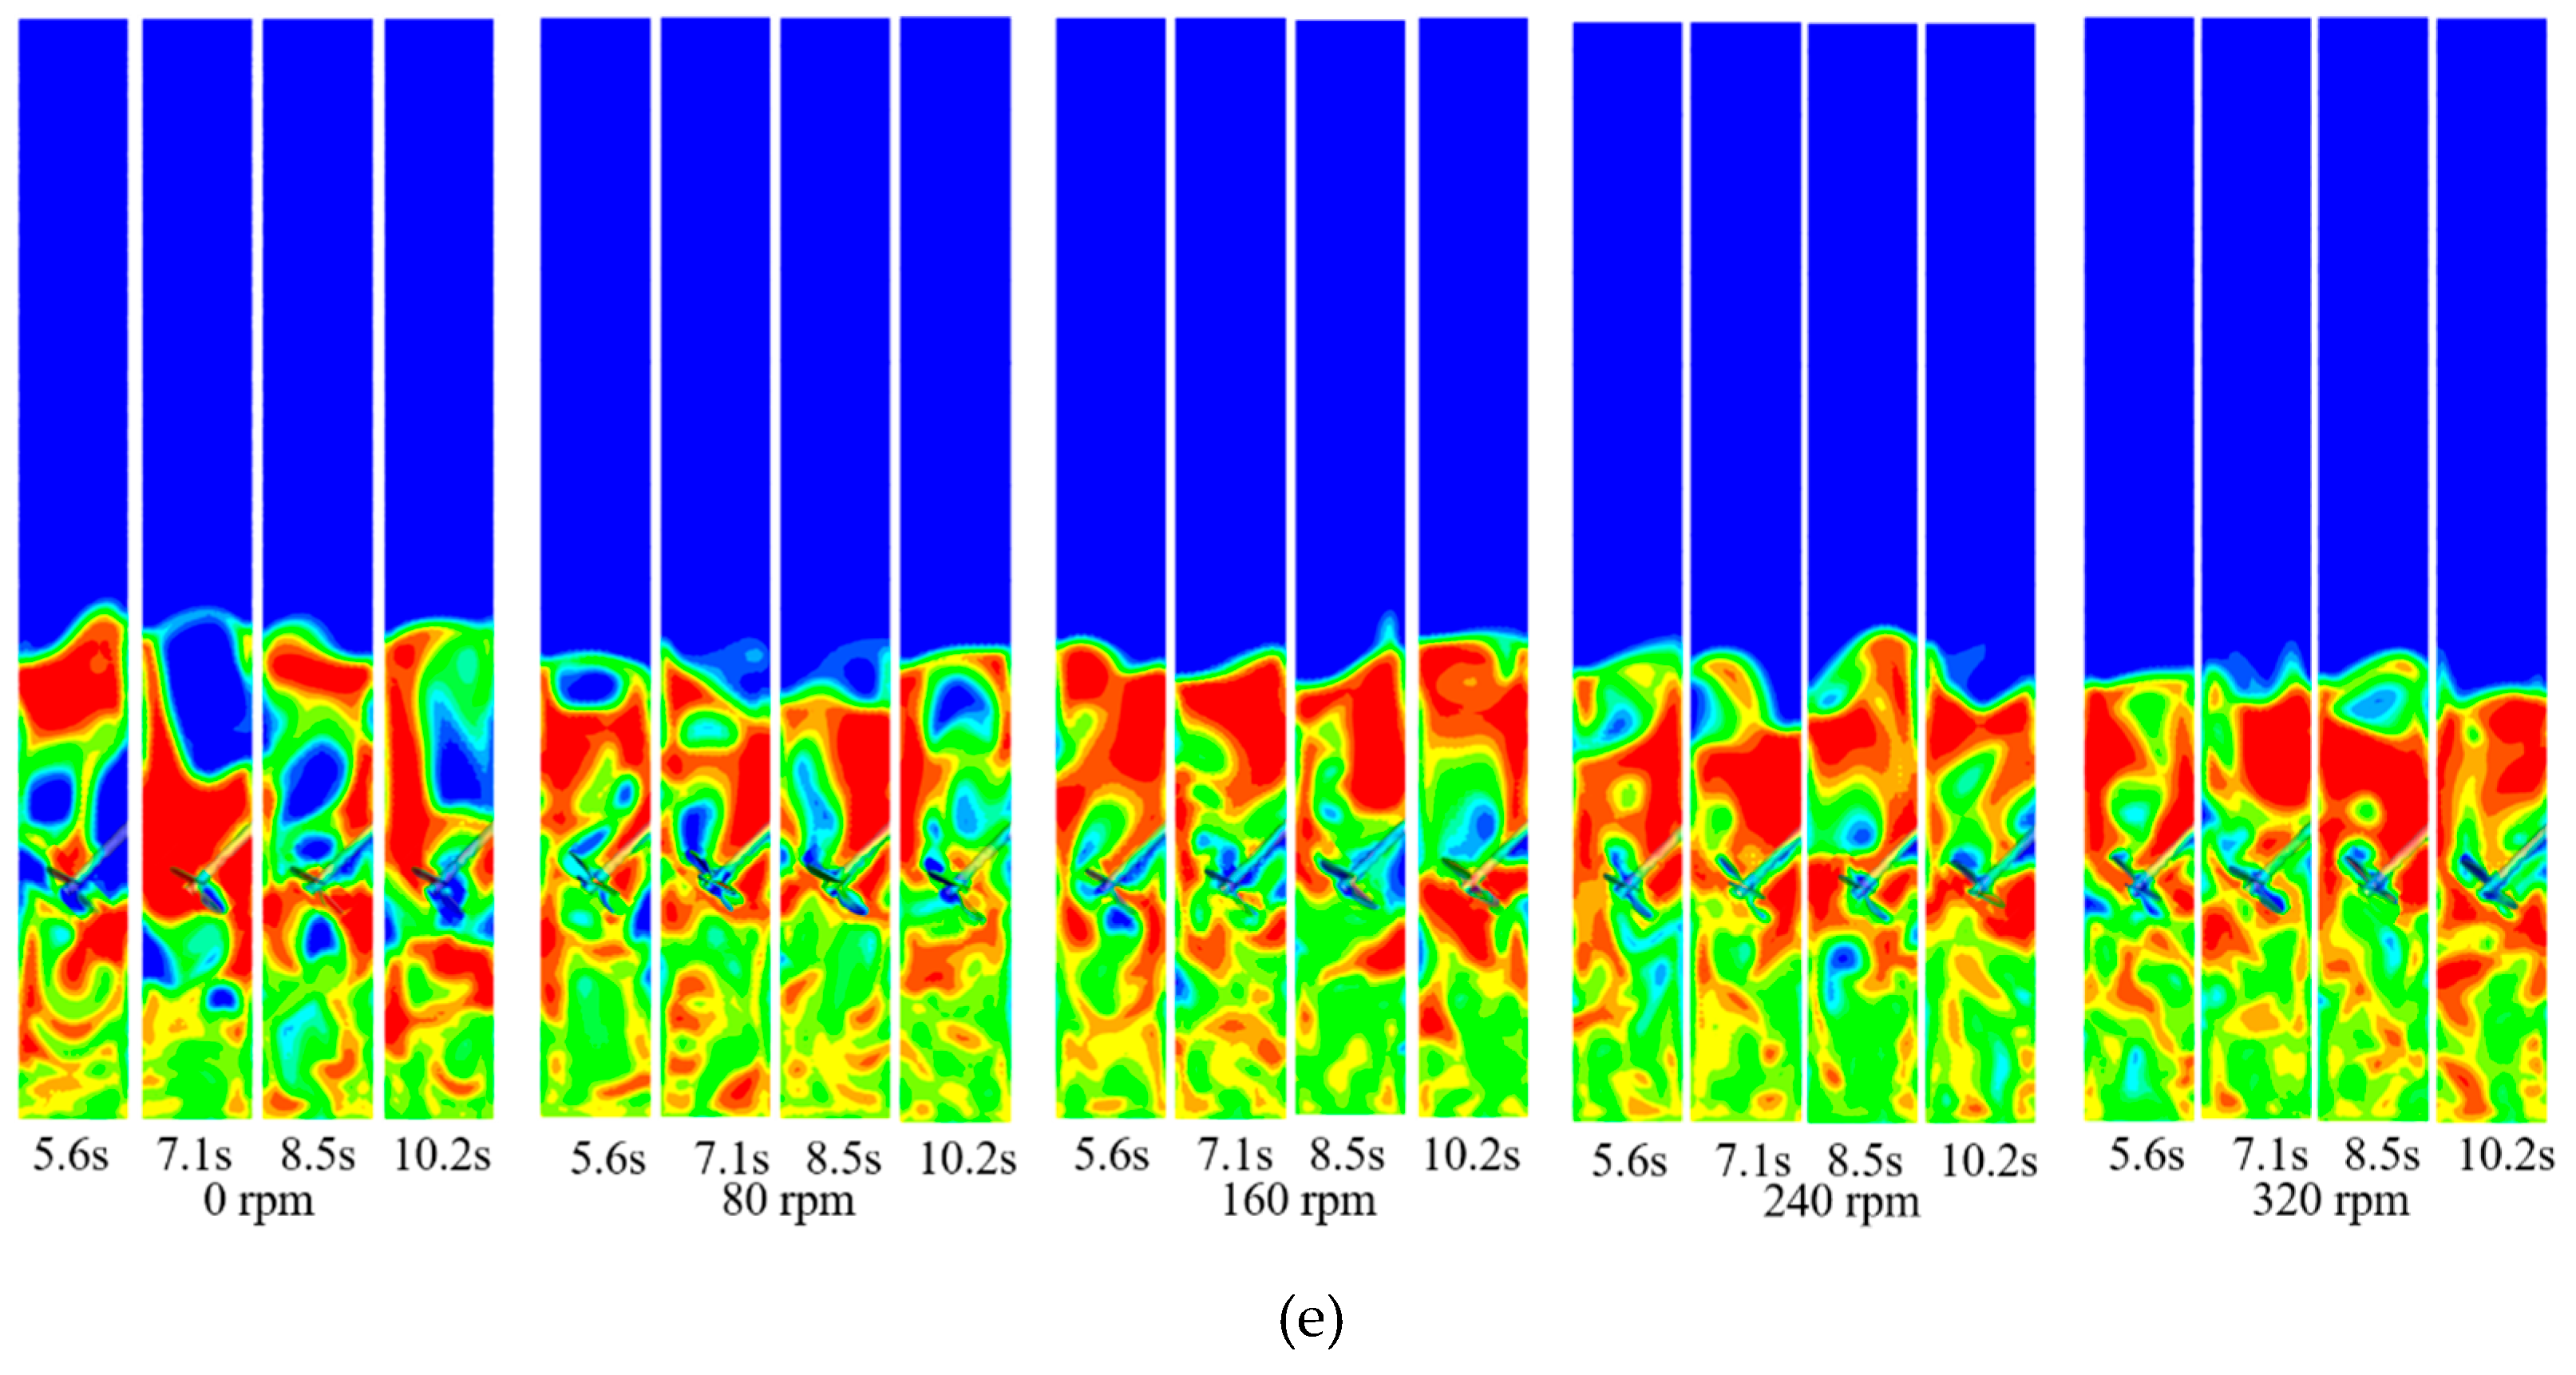
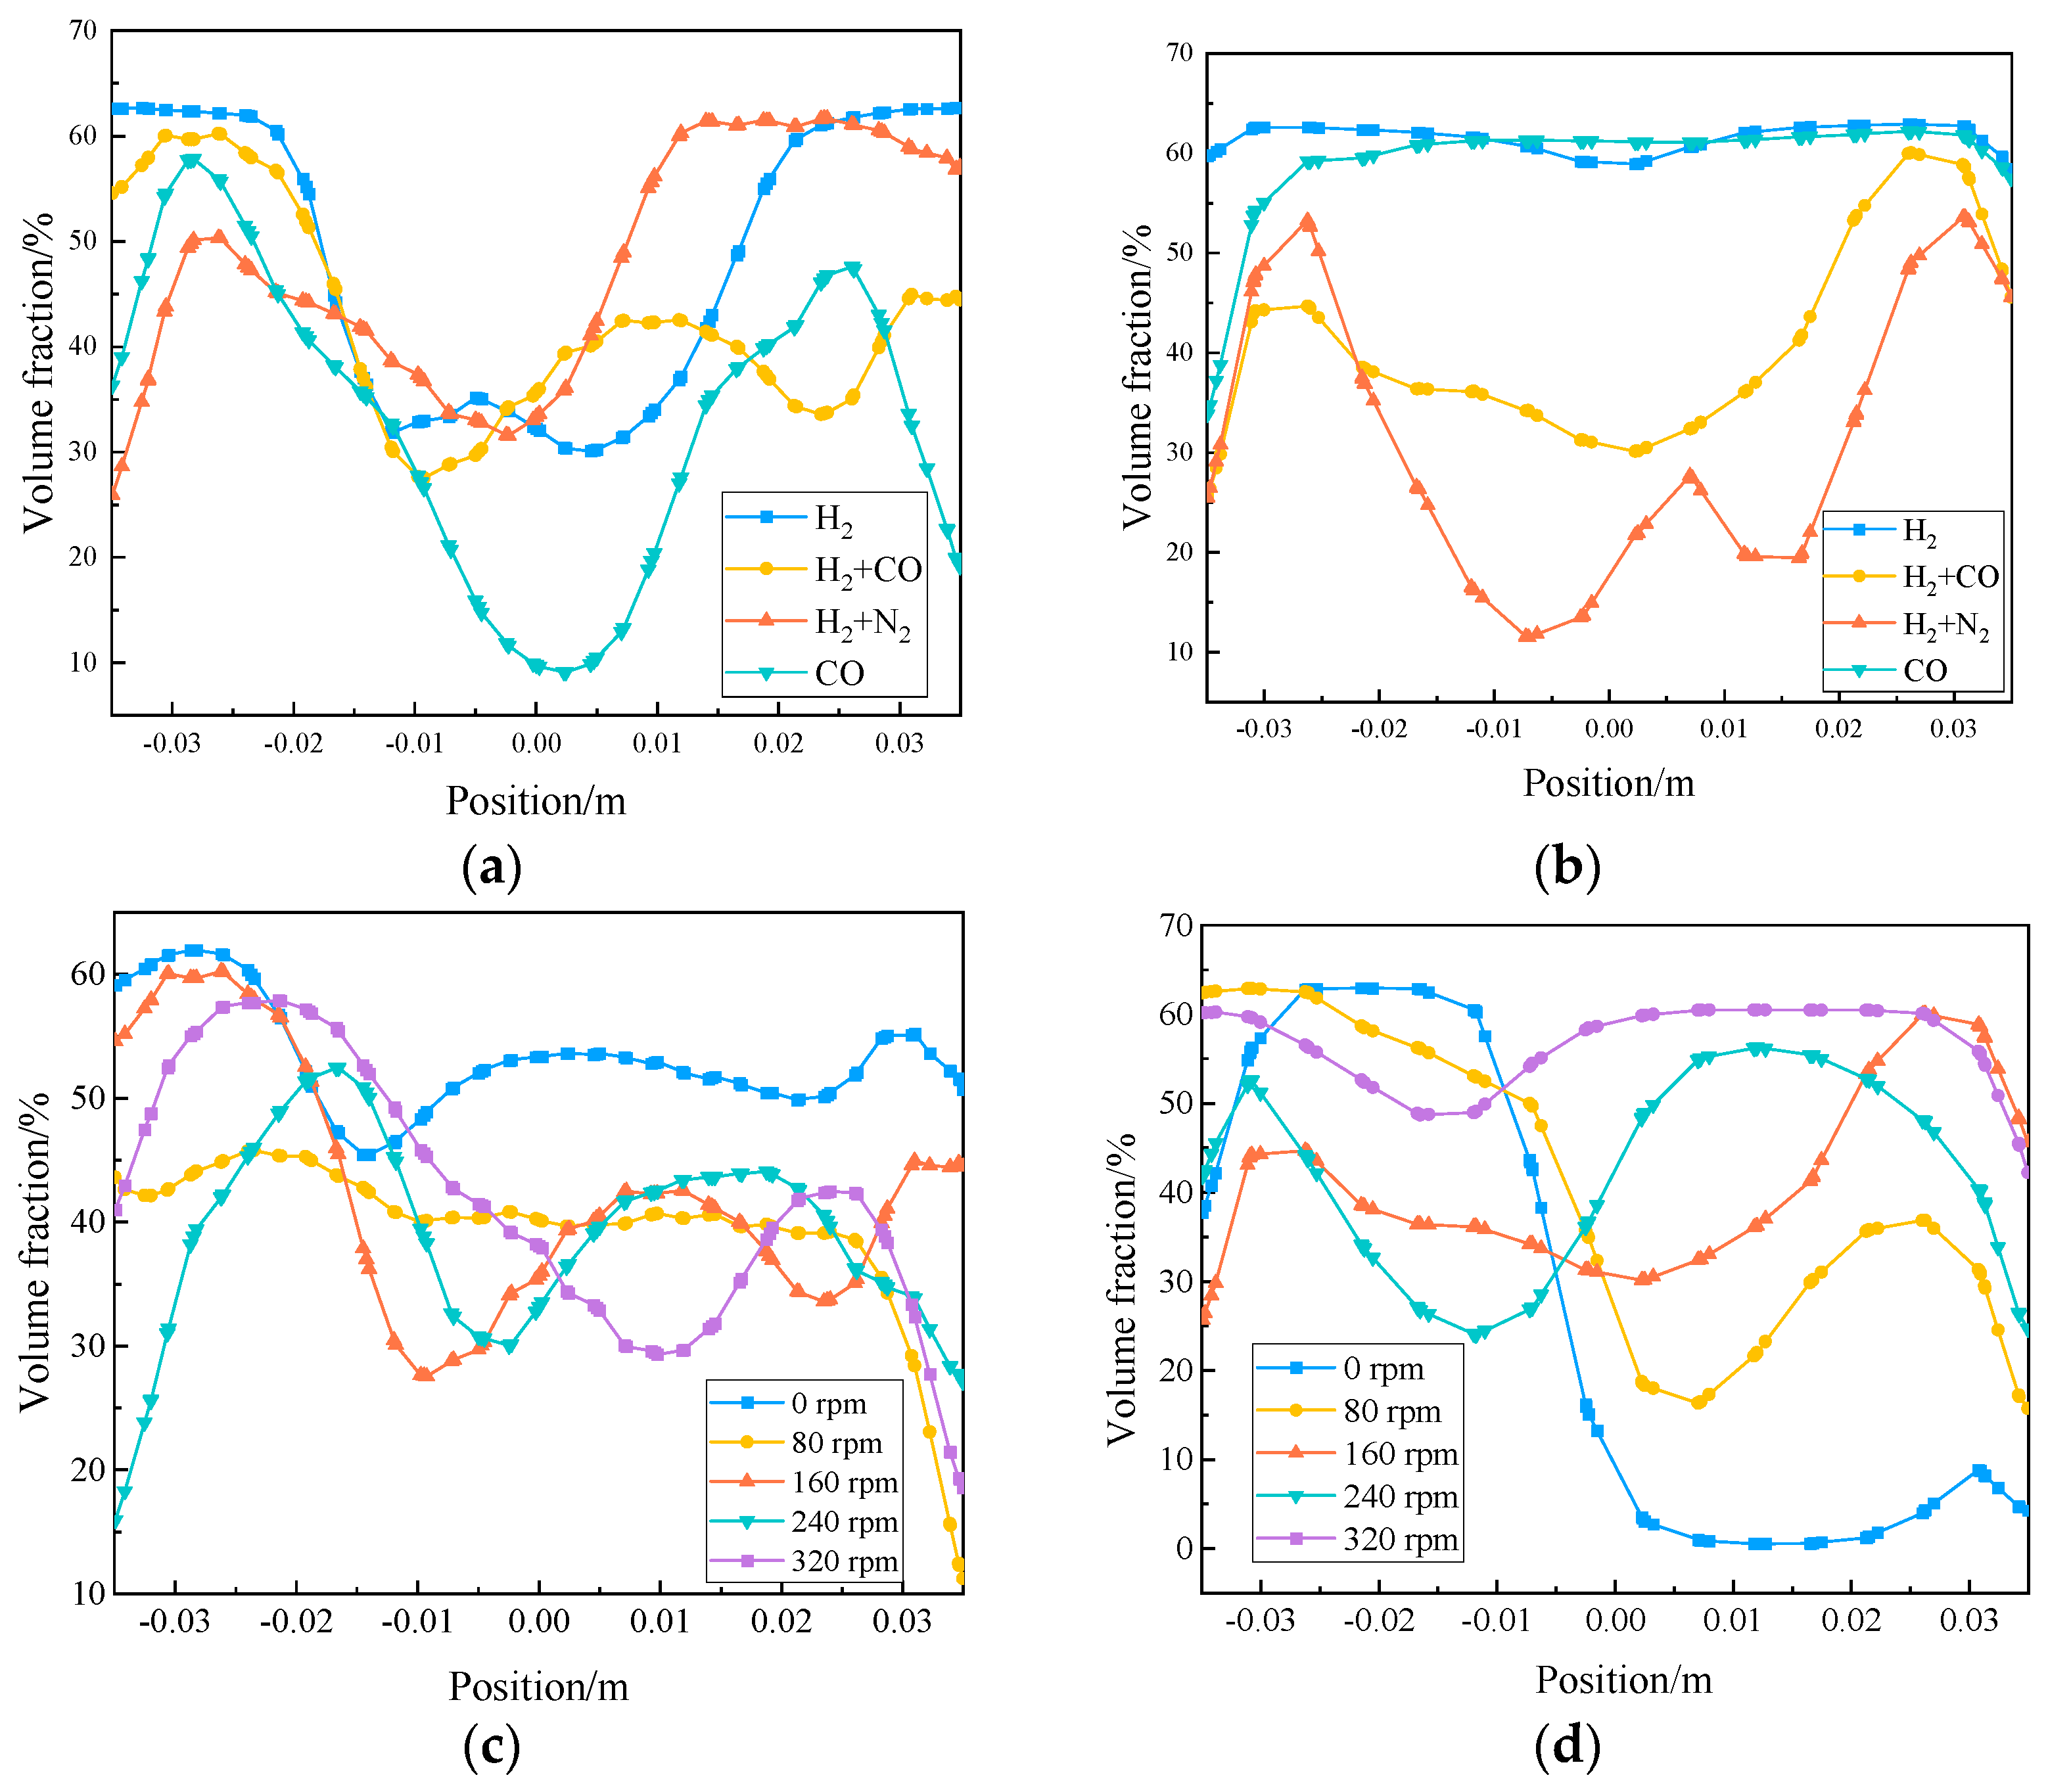
3.2. Distribution of Iron Ore Powder

Figure 4a–d illustrates the gas-solid two−phase distribution in the fluidized bed under various gas composition conditions when the agitation speed is 160 rpm. The figure depicts that when the gas composition is pure hydrogen, the bed expansion rate is the smallest, the majority of the particles are aggregated, and the iron ore powder is more likely to stick when reduced at high temperatures. During this process, the bubbles continue to expand. At 10.1 s, the bubbles reach the bottom of the agitator, and at 10.2 s, the bubbles are broken and continue to rise under the powerful shear of the agitator. Therefore, higher operating pressure and gas velocity are required when pure hydrogen is used. Similar distribution states are displayed in Figure 4b–d. The fluidization state in the lower part of the fluidized bed is relatively excellent, and the bubbles are broken under the action of the agitator, which improves the uniformity of gas-solid mixing. When the bubble leaves the agitator and continues to rise, the bubble size becomes larger and larger, and finally, the bubble breaks with the falling of iron ore powder particles. Among them, in Figure 4d, the lower part of the fluidized bed has a low solid holdup, and more obvious bubbles are generated.
Figure 4e depicts the distribution of gas-solid two−phase volume fraction in the fluidized bed when the volume ratio of H2 to CO is 1:1 and the agitation speed is 0, 80, 160, 240, and 320 rpm, respectively. It can be seen from the figure that there is no shear effect of the agitator paddle when the agitation speed is 0 rpm. From the bottom of the bed to the upper part of the bed, the bubbles keep growing during the rising process. Compared with the stirring conditions, there are more bubbles in the bed at 0 rpm, and the bubble size is larger. Again, the quality of gas-solid fluidization is effectively improved under the action of the agitator. With the increase in agitation speed, the size of bubbles in the bed above the agitator paddle decreases, and the uniformity of gas-solid two−phase mixing improves. When the speed is higher than 160 rpm, the gas−solid distribution is closer.
Figure 5a,b shows the radial volume fraction distribution of iron ore powder particles at the bed height of 0.07 m and 0.21 m under different gas composition conditions with an agitation speed of 160 rpm at 10.2 s. Figure 5c,d shows the radial volume fraction distribution of iron ore powder particles at the bed height of 0.07 m and 0.21 m under different agitation speeds in an atmosphere with a volume ratio of H2 to CO of 1:1. The figure shows that, under the various aforementioned conditions, the volume fraction of iron ore powder particles drops within the range of 0.01 m from the fluidized bed’s side wall. In a pure CO atmosphere, the radial volume fraction distribution of iron ore powder particles at 0.07 m in the bed fluctuates greatly, while particles gather at 0.21 of the bed height. The average radial volume fraction of iron ore powder is high when the volume ratio of H2 to CO is 1:1, the agitation speed is 0 rpm, and the bed height is 0.07 m. At different agitation speeds, the mean radial volume fraction of iron ore powder particle decreases, which is due to the disturbing effect of the propelling agitator on the lower part of the bed. Large bubbles are produced in the bed, and the radial volume fraction of iron ore powder fluctuates significantly when the agitation speed is 0 rpm and the bed height is 0.021 m. Under the action of the agitator, the fluctuation of the radial volume fraction of iron ore powder particles in the bed is significantly reduced. In addition, it is seen that some iron ore powder particles are still accumulating in the bed above the agitator paddle.

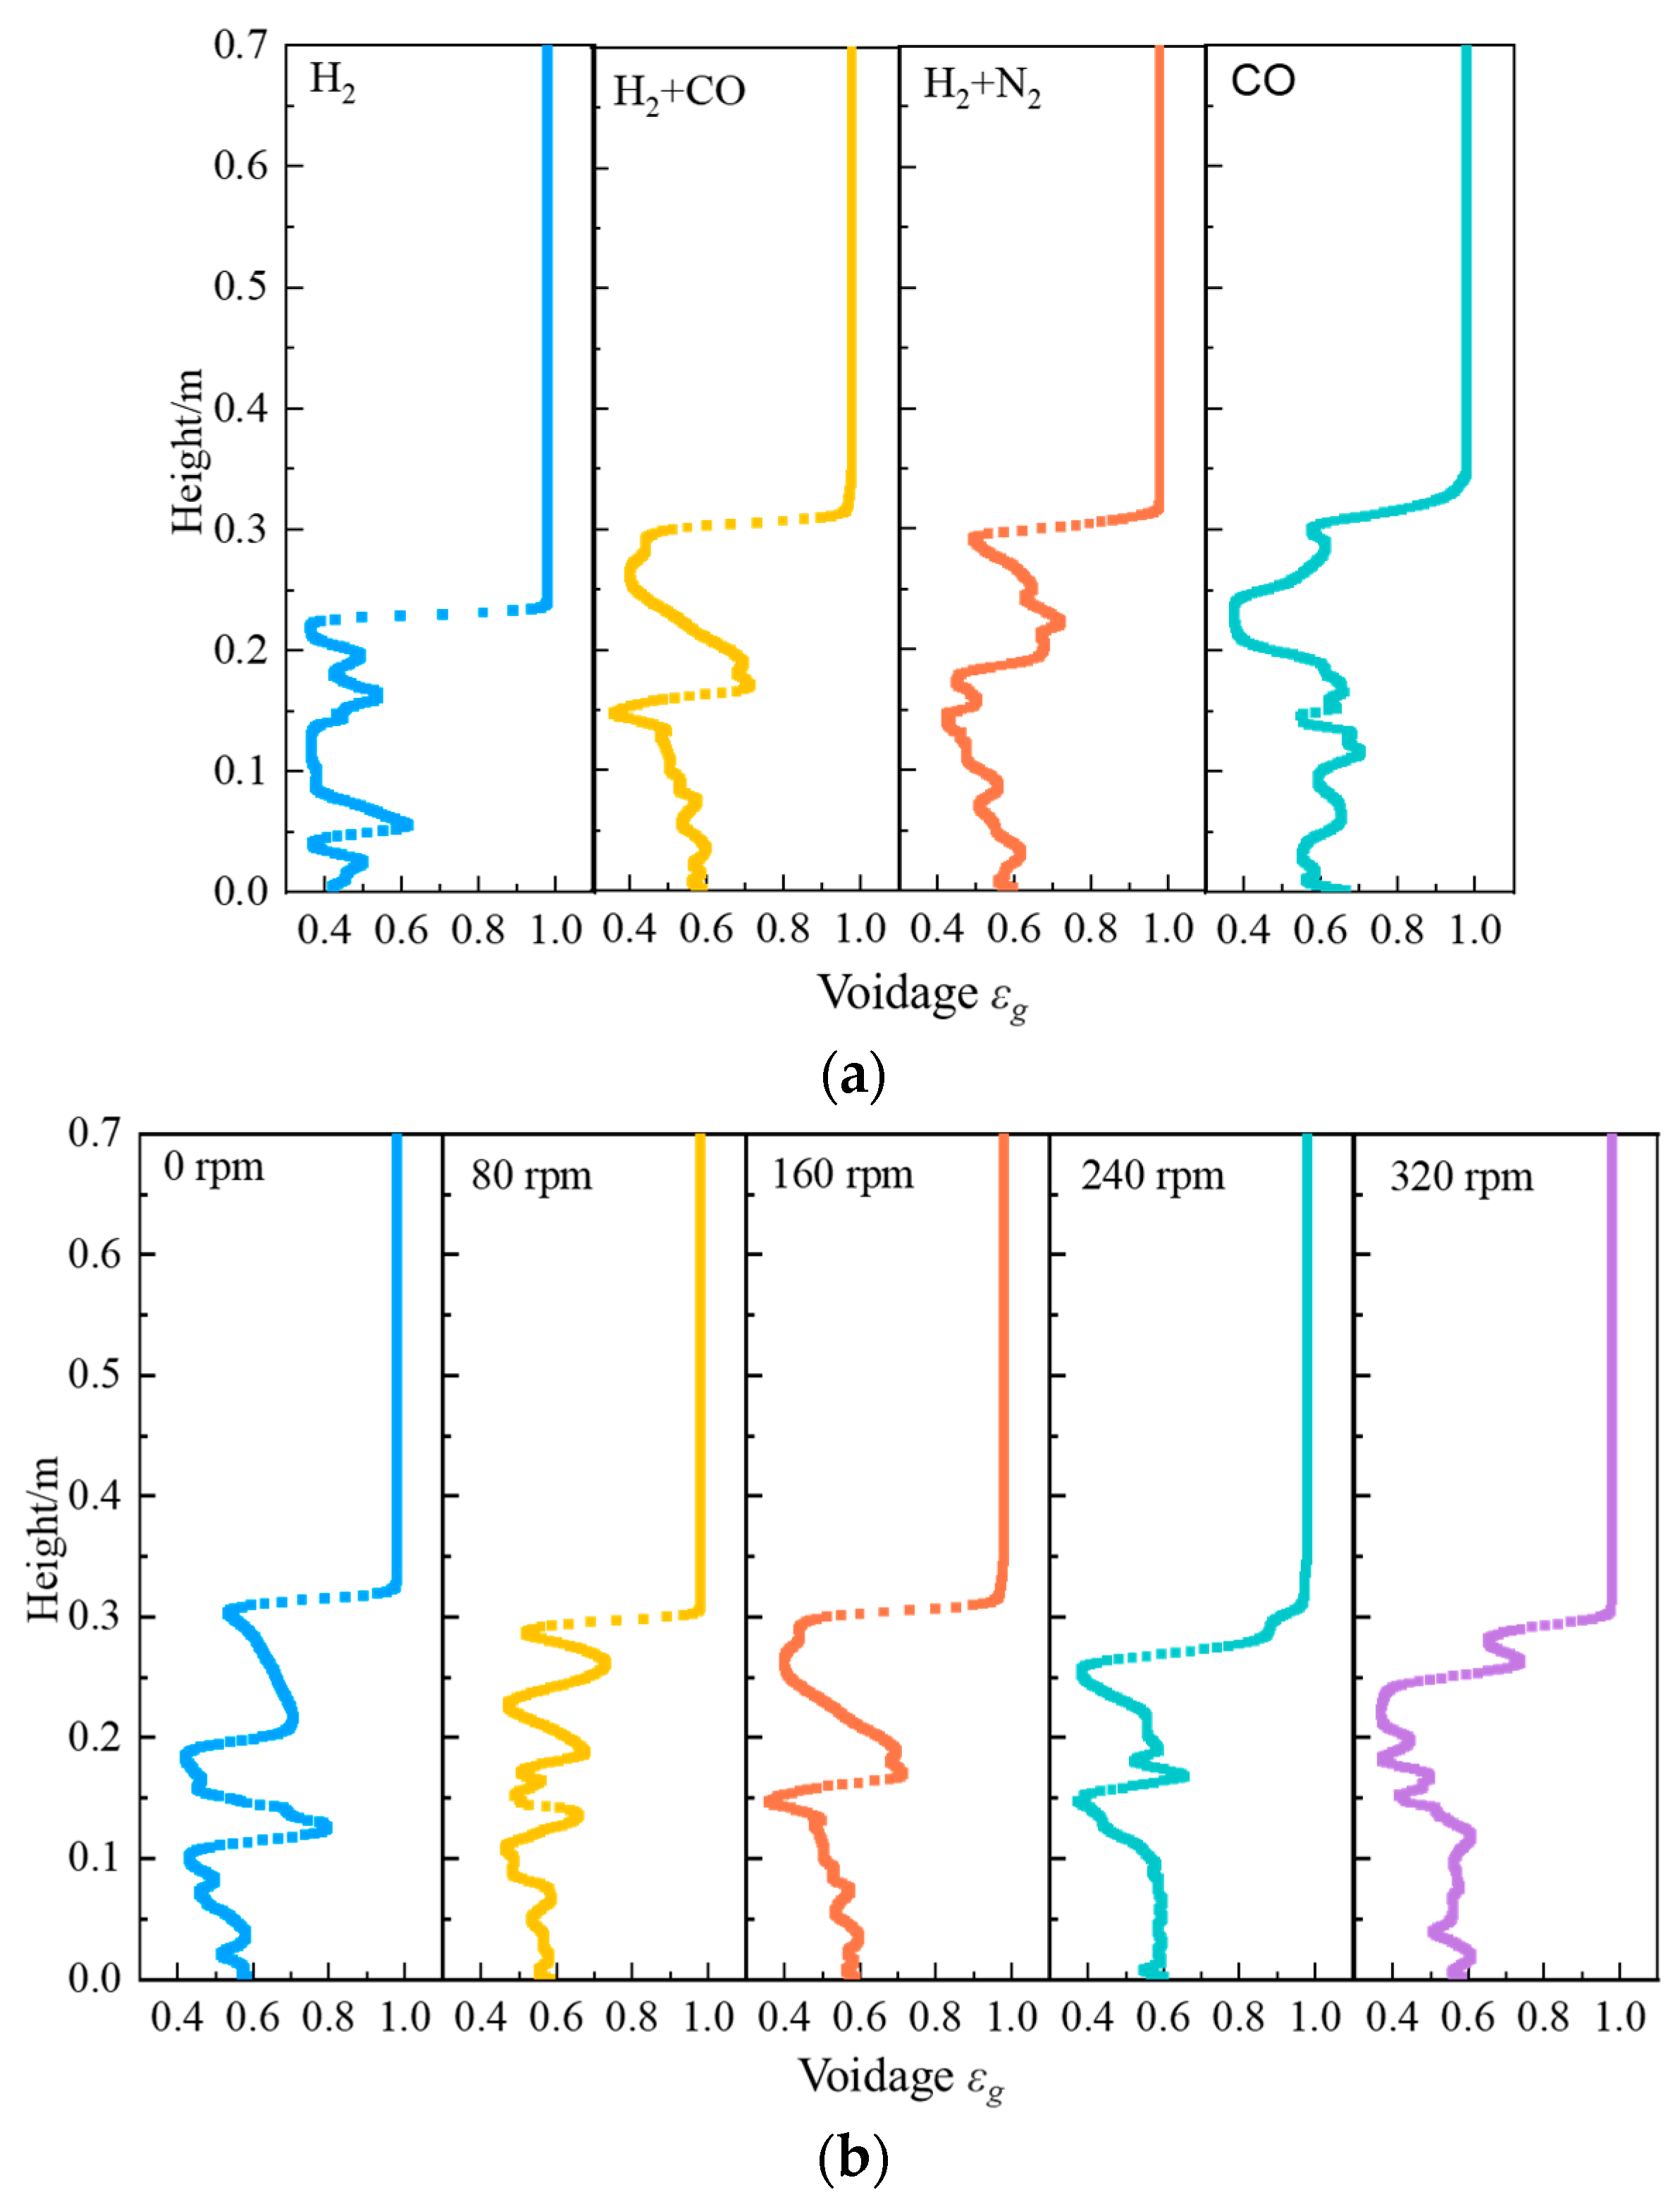
3.3. Axial Average Gas Holdup

Figure 6a,b shows the axial average gas holdup in the fluidized bed at the time of 10.2 s for various gas compositions with an agitation speed of 160 rpm and the axial average gas holdup in the fluidized bed at various agitation speeds in the atmosphere with a volume ratio of 1:1 for H2 to CO. It can be seen from Figure 6a that the average gas holdup in the axial direction of the fluidized bed presents an “S” type distribution. A large number of iron ore particles are accumulated in the bed when pure hydrogen is present, which results in a low level of the axial average gas holdup. Under the other three conditions, the fluctuation of average gas holdup in the lower part of the fluidized bed is lower than that in the upper part of the fluidized bed due to the continuous rise and growth of bubbles in the bed. The average gas holdup of pure CO gas at the inlet is the largest. It can be seen from Figure 6b that the average gas holdup in the bed below 0.1 m is generally steady in the atmosphere with a volume ratio of H2 to CO of 1:1. Still, the average gas holdup in the bed above 0.1 m fluctuates more than that in the lower section. The axial average gas holdup in the bed varies significantly when the agitation speed is 0 rpm, reaching a maximum value of 0.80. This results from the bubbles in the bed frequently forming and floating while also growing and breaking. Because of the unequal distribution of the gas and solid in this situation, the operation is unstable. The gas usage rate will also decrease concurrently with the reduction process for iron ore powder. The axial average gas holdup’s fluctuation amplitude decreases when the agitation speed is 80 rpm. When the agitation speed is 160 rpm, the axial average gas holdup fluctuation of the bed increases slightly, yet its maximum value is 0.71. The axial average gas holdup on the bed above 0.1 m in height fluctuates less when the agitation speed is increased, indicating that the distribution of gas-solid two−phase in the bed is influenced by agitation speed, and the strong shear force will assist in ensuring that the two phases are distributed uniformly in the bed.

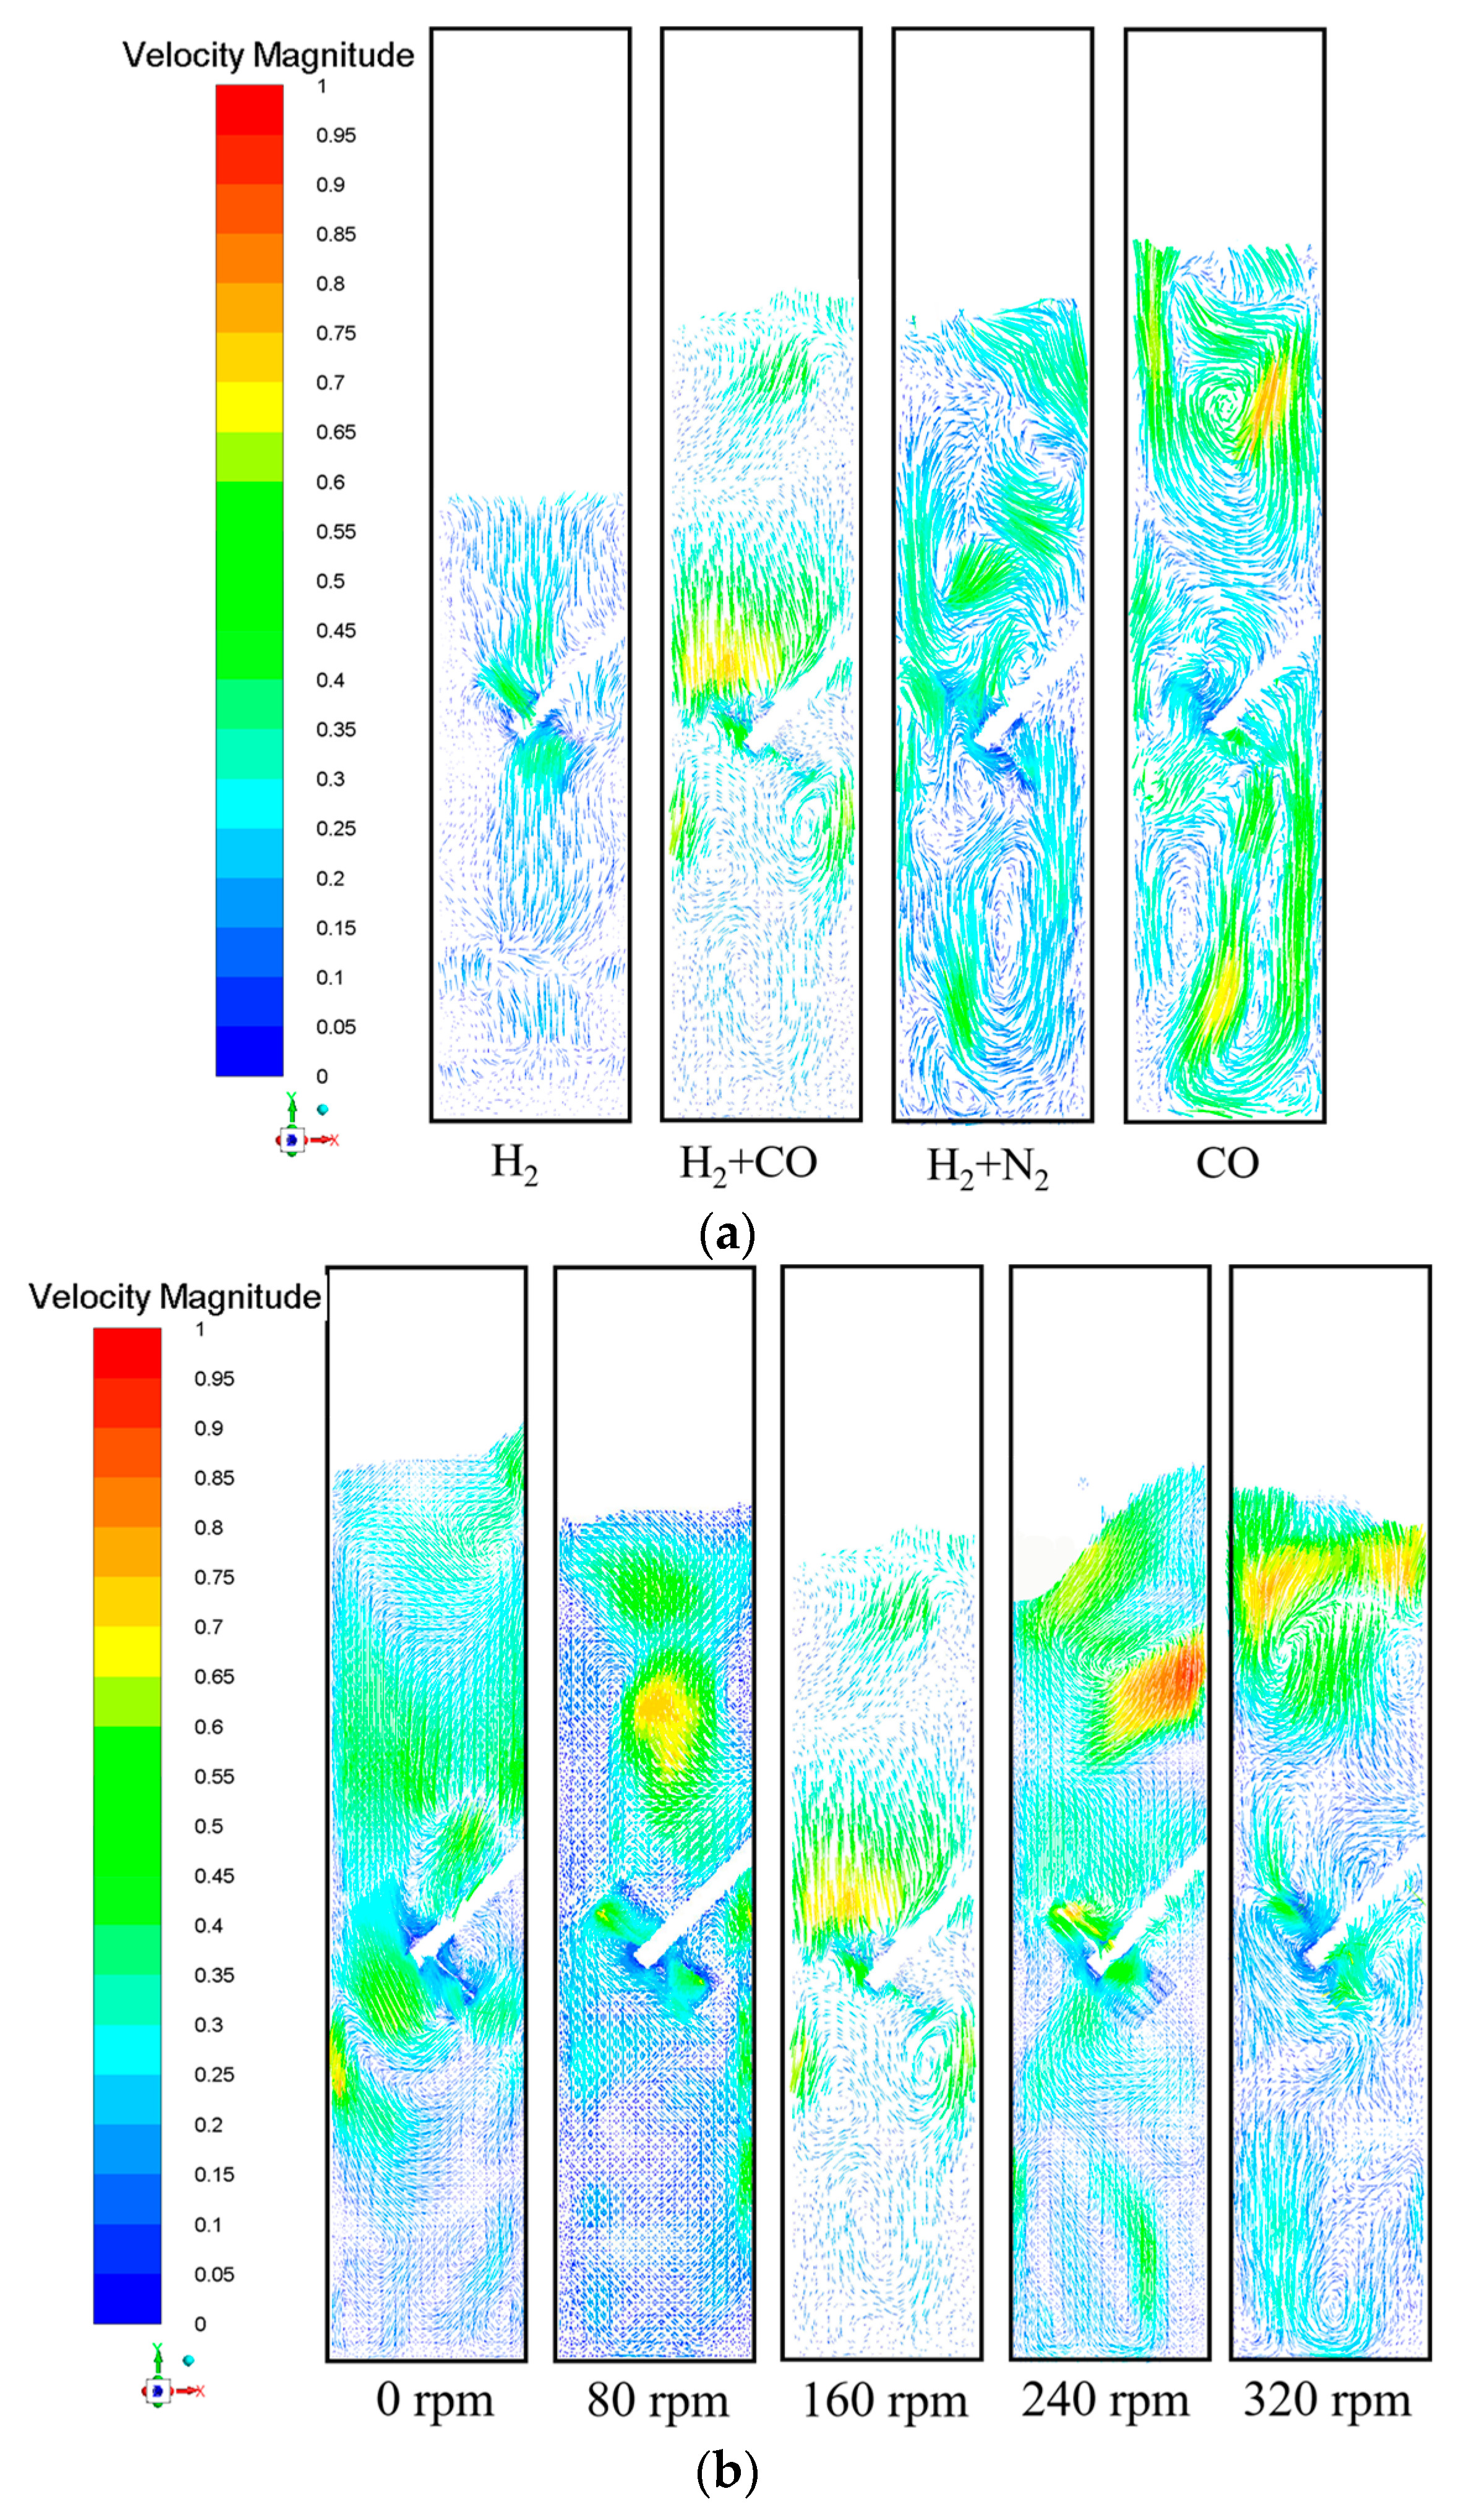
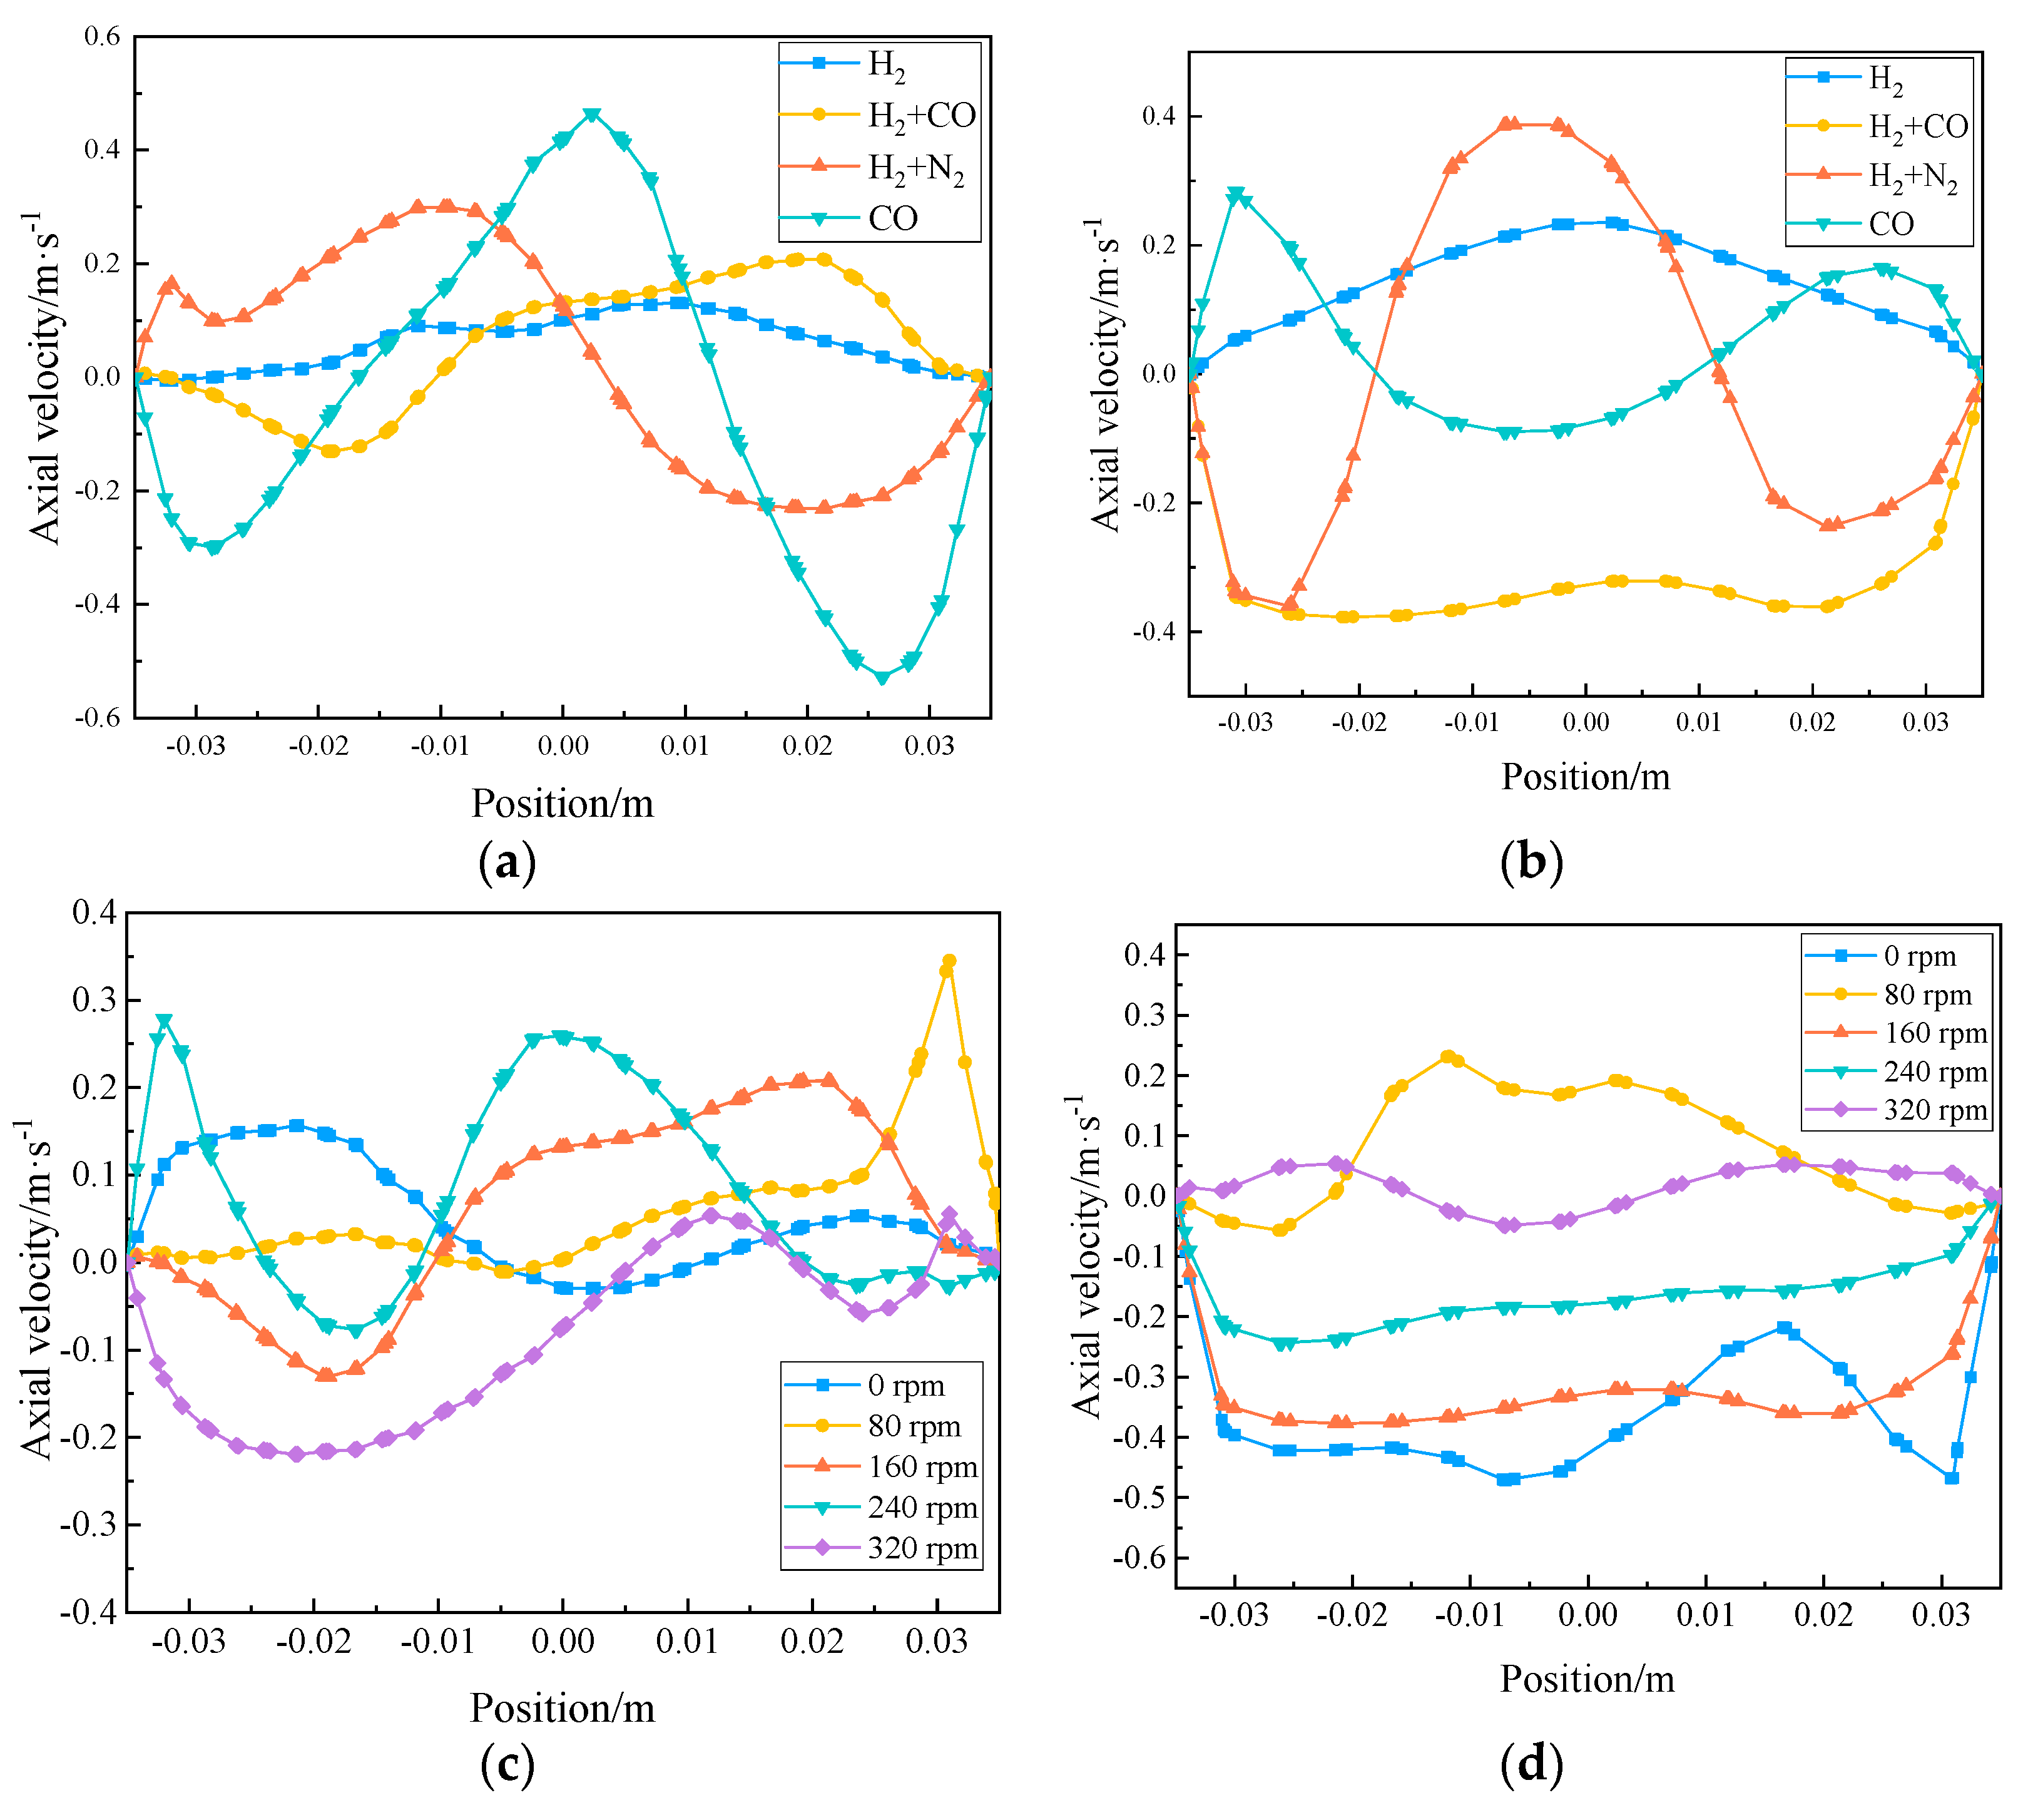
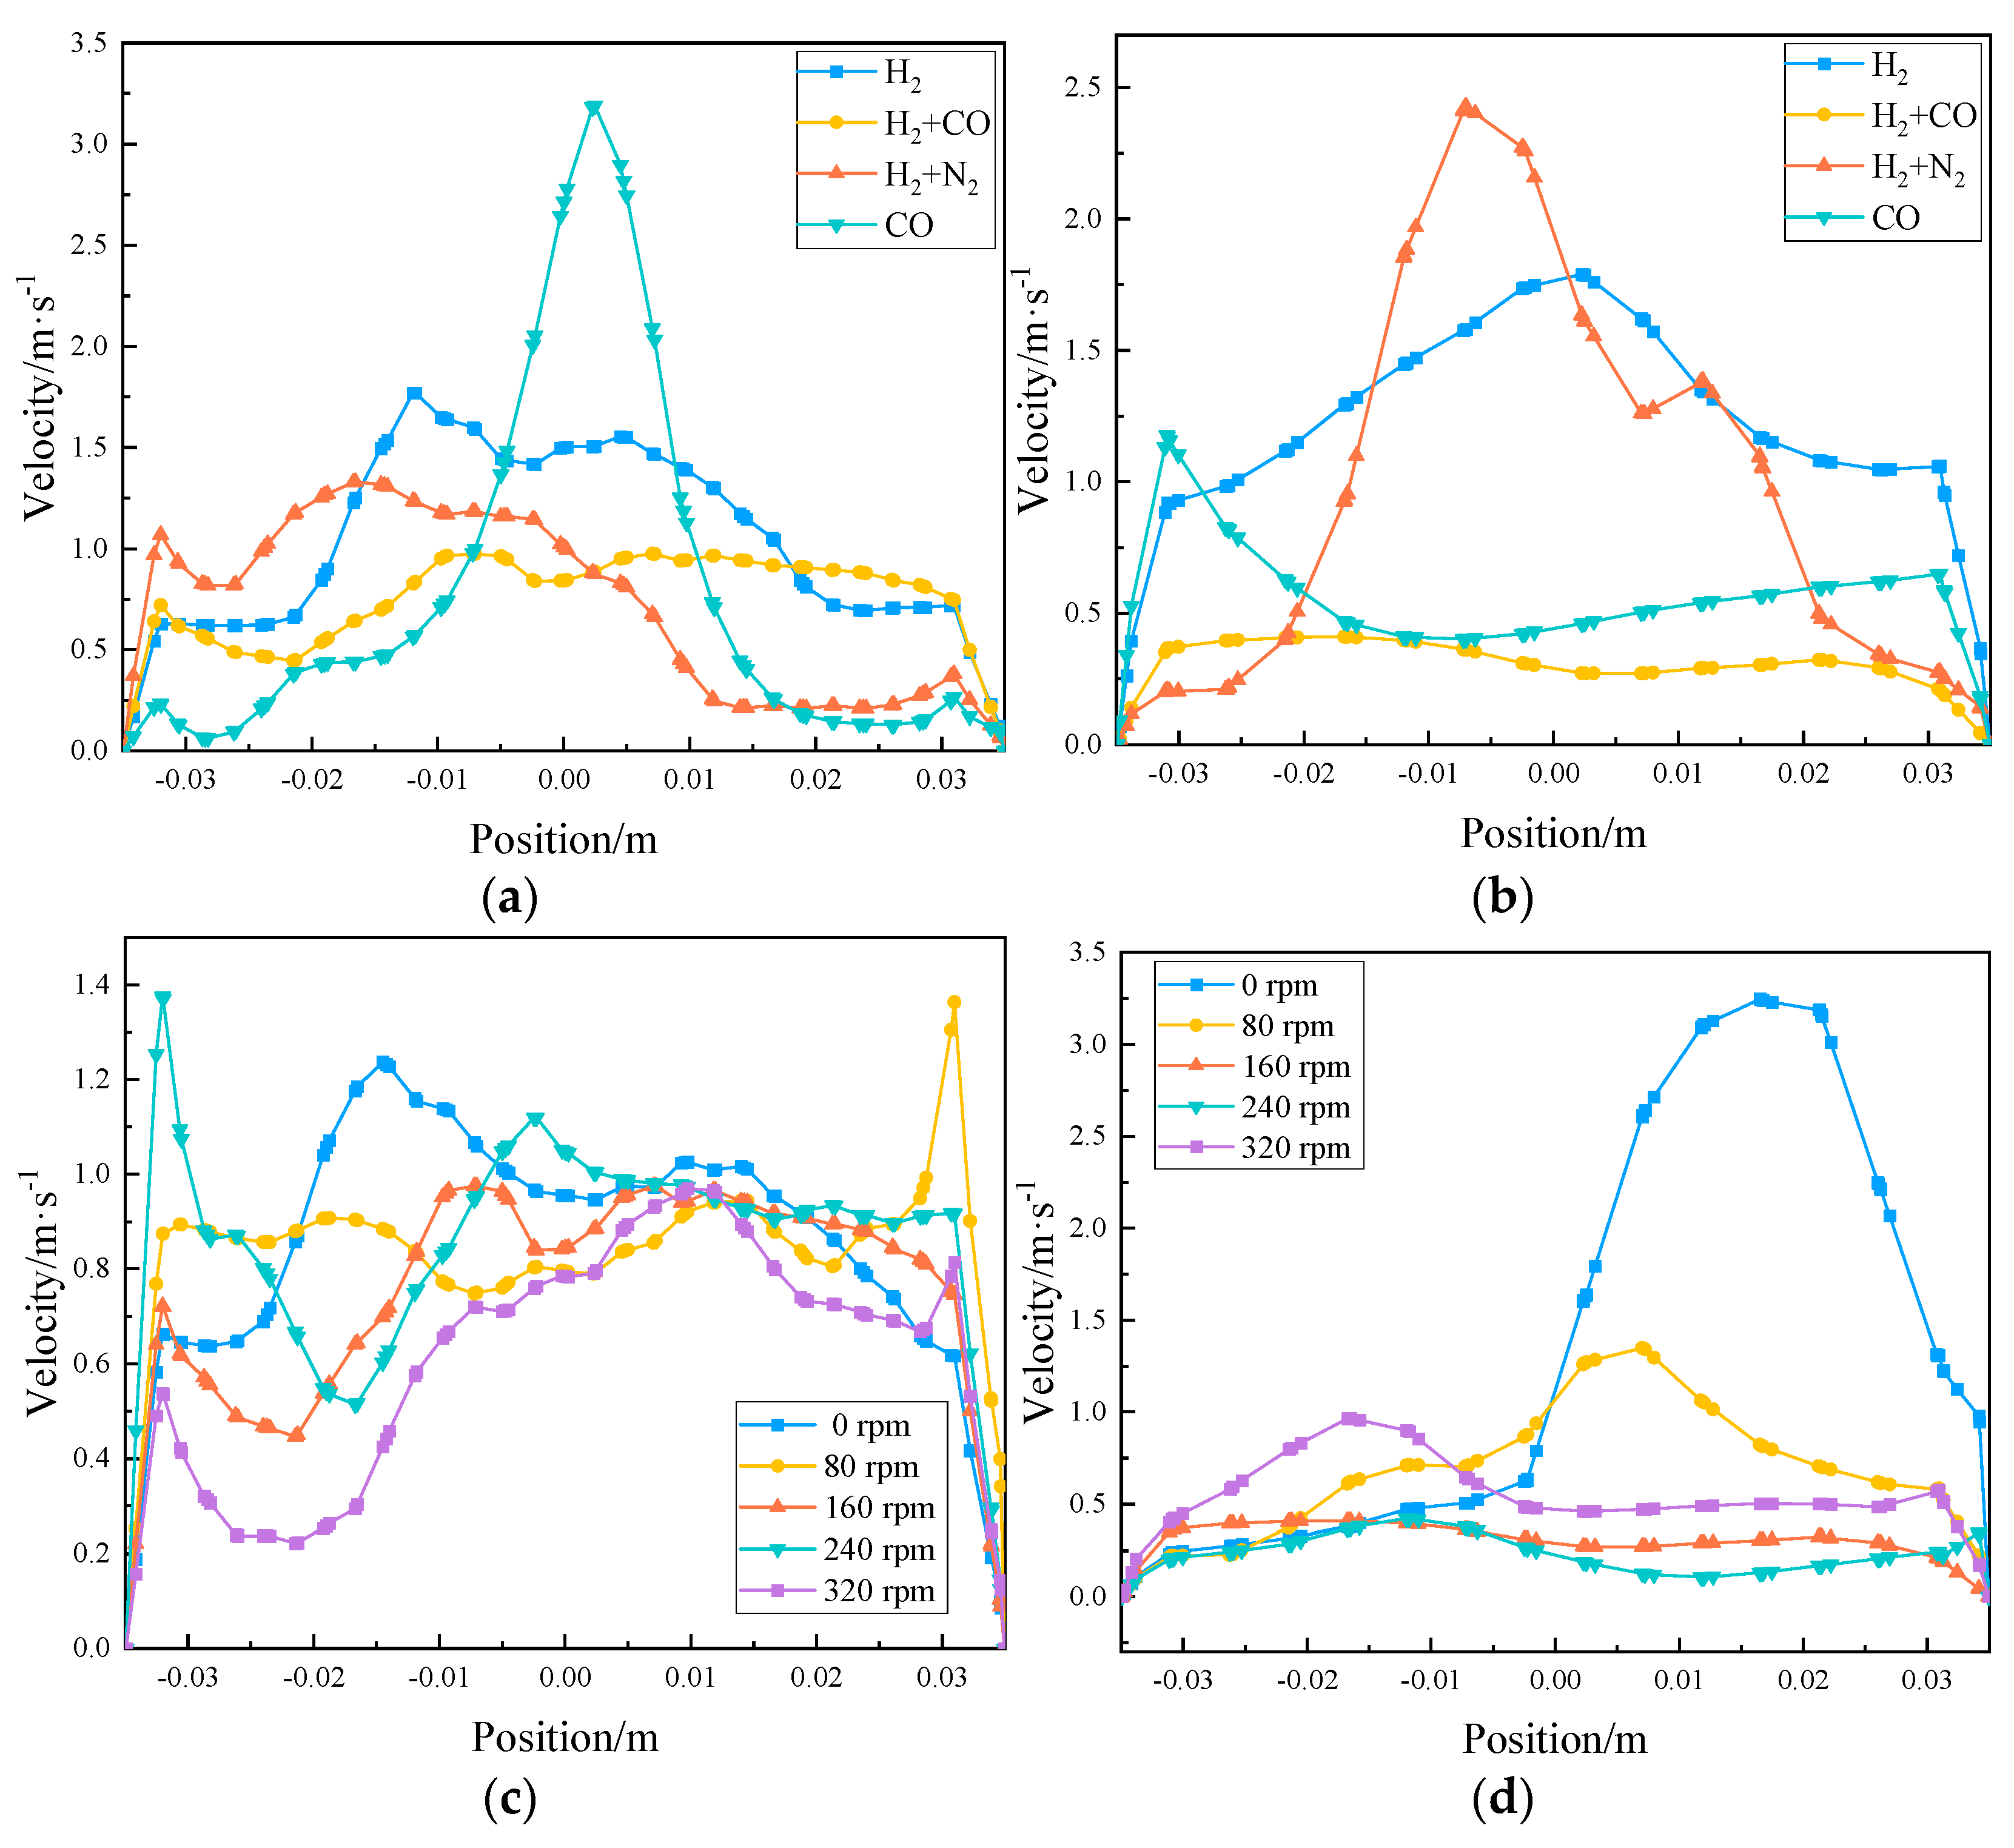
3.4. Velocity Distribution

Figure 7 shows the velocity vector cloud diagram of iron ore powder particles with an agitation speed of 160 rpm at 10.2 s. The particle velocity vector distribution under different gas composition conditions is shown in Figure 7a. In the pure hydrogen atmosphere, most of the iron ore powder particles in the bed have low velocity due to their aggregation, and the particle velocity is higher only near the agitator. Combined with the volume fraction distribution cloud diagram of iron ore powder in Figure 4, circulation is formed above and below the agitator paddle in the other three cases driven by the reducing gas, and the velocity of iron ore powder particles in the circulation is higher than that in other positions. In a pure CO atmosphere, the maximum particle velocity of iron ore powder particles in circulation can reach 0.87 m/s.
The particle velocity vector distribution under different agitation speeds in an atmosphere with a volume ratio of H2 to CO of 1:1 is shown in Figure 7b. When the agitation speed is 0 rpm, due to the existence of the agitator paddle, some iron ore powder particles will disperse around the agitator paddle in the process of upward movement. In combination with Figure 4e, many large−sized bubbles are generated in the bed, which will drive the iron ore powder particles to accelerate their movement, so some particles in the bed have a large speed. However, under the condition of the agitator, the bubble size is significantly reduced under the action of the shear force of the agitator paddle, which forms an irregular circulation around the paddle, improves the movement speed of iron ore particles near the paddle, and promotes the mixing of gas and solid phases in the bed.
When the bed height is 0.07 m and 0.21 m at 10.2 s, Figure 8 displays the axial velocity distribution of iron ore powder particles in the diameter direction under various conditions. The rising and falling states of the iron powder particles can be represented by the positive and negative axial velocities. According to Figure 7a, in a pure CO atmosphere, circulation is generated at 0.07 m of the bed height, and the bubbles in the middle drive the rise of iron ore powder particles and fall on both sides. In the atmosphere with a volume ratio of H2 to CO of 1:1, the distribution of gas and solid is relatively uniform at the height of 0.07 m, and the absolute value of the axial velocity of iron ore powder particles is relatively small. Under the condition of no stirring, the maximum axial velocity of iron ore powder particles at the bed height of 0.21 m reaches 0.48 m/s, and the particles are rapidly falling back. Combined with Figure 4e, it can be seen that when the large bubble overflow bed breaks, iron ore powder particles will fall back and produce a large axial velocity. With the increase in agitation speed, the strong shear force reduces the size of the bubble and makes the absolute value of the axial velocity of the iron ore powder particles gradually decrease. To some extent, it shows that the fluidization of iron ore powder particles tends to be stable under the action of stirring.
Figure 9 depicts the radial gas velocity distribution under various circumstances at 10.2 s with a bed height of 0.07 m and 0.21 m. When the agitation speed is 160 rpm in a pure CO atmosphere, the maximum gas velocity in the middle of the bed at 0.07 m height reaches 3.18 m/s, which also indicates that the accelerated rise of bubbles drives the upward movement of iron ore powder particles. The radial velocity distribution of the gas phase in the atmosphere with a volume ratio of H2 to CO of 1:1 is relatively uniform. At 0.21 m, the radial velocity distribution of the gas phase fluctuates greatly in pure hydrogen and the atmosphere with a volume ratio of H2 to N2 of 1:1. When the volume ratio of H2 to CO is 1:1, at 0.07 m, the radial velocity distribution of gas is similar under different agitation speeds, while at 0.21 m, when the agitation speed is 0 rpm, the gas velocity on the right side of the bed is larger, reaching 3.23 m/s, where large bubbles are generated.

4. Conclusions

In this paper, the flow of iron ore powder particles in the fluidized bed with an inclined agitator at room temperature was simulated by numerical simulation. The accuracy of the numerical model was verified by the pressure drop and the standard deviation of the pressure drop obtained by physical simulation experiments. The pressure fluctuations, particle volume fraction distribution, axial average gas holdup, and particle velocity distribution in the fluidized bed with an inclined agitator under different operating conditions were researched in depth. The main conclusions were withdrawn as follows:
(1)
When the gas composition is pure hydrogen, due to its special properties, the bed expansion rate is the smallest. At this time, a large number of iron ore powder particles in the fluidized bed are in a state of aggregation. Therefore, higher working pressure and gas velocity are required under pure hydrogen conditions.
(2)
Adding a certain amount of carbon monoxide or nitrogen into the hydrogen and matching the appropriate gas velocity can reduce the vibration caused by the generation and breaking of bubbles in the bed and promote the uniform mixing of gas and solid. The fluidization quality is improved to a certain extent.
(3)
The standard deviation of pressure drop decreases with the increase in mixing speed. When the agitation speed reaches 160 rpm, the fluidization state of iron ore powder particles in the bed tends to be stable. At this time, the intensive shear force of the agitator significantly reduces the number of bubbles in the bed and achieves a good fluidization effect.
(4)
The increase in agitation speed increases the collision frequency between iron ore powder particles, especially the particles around the agitator. At the same time, the increase in particle velocity makes it easier to enter the bubble and promotes the uniform mixing between gas and solid phases.
In this paper, the best operating parameters were obtained by numerical simulation at room temperature to make the distribution of iron ore powder in the fluidized bed more uniform. This was of great significance to strengthen the gas-solid heat and mass transfer in the actual reduction process and improve the reduction efficiency of iron. However, the reduction in temperature and the change in gas-solid two−phase composition had a great impact on the fluidization of iron ore powder particles and the adhesion between particles. In future work, the crushing effect of the inclined agitator on the non−uniform structure in the bed during the actual reduction process will be further researched through high−temperature experiments and numerical simulation methods so as to solve the sticking of reduced iron ore powder particles in the traditional fluidized bed.

Author Contributions

Writing–original draft preparation C.L.; writing–review and editing, Y.L. and X.L.; data curation, Y.W.; funding acquisition, Y.L. and T.Z. All authors have read and agreed to the published version of the manuscript.

Funding

This research was founded by the National Natural Science Foundation of China, grant number 52204419.

Data Availability Statement

Not applicable.

Conflicts of Interest

The authors declare no conflict of interest.

References

  1. Squires, A.M.; Johnson, C.A. The H−iron process. JOM 1957, 9, 586–590. [Google Scholar] [CrossRef]
  2. Reed, T.F.; Argarwal, J.C.; Shipley, E.H. NU−Iron, A Fluidized−Bed Reduction Process. JOM 1960, 12, 317–320. [Google Scholar] [CrossRef]
  3. Brown, J.W.; Campbell, D.L.; Saxton, A.L.; Carr, J.W., Jr. FIOR—The Esso fluid iron ore direct reduction process. JOM 1966, 18, 237–242. [Google Scholar] [CrossRef]
  4. Hillisch, W.; Zirngast, J. Status of FINMET plant operation at BHP DRI, Australia (January 2001). Rev. Metall. 2001, 98, 231–237. [Google Scholar] [CrossRef]
  5. Lang, S.; Kopf, M.; Valery, R. Circored fine ore direct reduction plus DRI smelting: Proven technologies for the transition towards green steel. TMS 2022, 2, 61–67. [Google Scholar] [CrossRef]
  6. Schenk, J.L. Recent status of fluidized bed technologies for producing iron input materials for steelmaking. Particuology 2011, 9, 14–23. [Google Scholar] [CrossRef]
  7. Kitagawa, T. Present Status of the Development of Smelting Reduction Technologies. Tetsu-To-Hagane 2002, 88, 430–443. [Google Scholar] [CrossRef]
  8. Li, Y.; Li, H.; Hua, W.; Qing, S.; Hu, J.; Hou, Y.; Li, H.; Li, L. Smelting Potential of HIsmelt Technology for High−Phosphorus Iron Ore and Ilmenite. In Proceedings of the 2011 International Conference on Computer Distributed Control and Intelligent Environmental Monitoring, Changsha, China, 19–20 February 2011; pp. 1283–1286. [Google Scholar] [CrossRef]
  9. Bresser, W.; Hirsch, M.; Saatci, A. Process for the heat treatment of fine−grained iron ore and for the conversion of the heat treated iron ore to metallic iron. Miner Eng. 1997, 10, 656. [Google Scholar] [CrossRef]
  10. Jeong, S.J. System dynamics approach for the impacts of FINEX technology and carbon taxes on steel demand: Case study of the POSCO. Int. J. Precis. Eng. Manuf.-Green Technol. 2015, 2, 85–93. [Google Scholar] [CrossRef] [Green Version]
  11. Hessling, O.; Tottie, M.; Sichen, D. Experimental study on hydrogen reduction of industrial fines in fluidized bed. Ironmak. Steelmak. 2021, 48, 936–943. [Google Scholar] [CrossRef]
  12. Feng, R.; Li, J.; Cheng, Z.; Yang, X.; Fang, Y. Influence of particle size distribution on minimum fluidization velocity and bed expansion at elevated pressure. Powder Technol. 2017, 320, 27–36. [Google Scholar] [CrossRef]
  13. Zhang, B.; Gong, X.Z.; Wang, Z.; Guo, Z. Relation between Sticking and Metallic Iron Precipitation on the Surface of Fe2O3 Particles Reduced by CO in the Fluidized Bed. ISIJ Int. 2011, 51, 1403–1409. [Google Scholar] [CrossRef]
  14. Spreitzer, D.; Schenk, J. Reduction of Iron Oxides with Hydrogen—A Review. Steel Res. Int. 2019, 90, 1900108. [Google Scholar] [CrossRef]
  15. Pang, J.M.; Guo, P.M.; Zhao, P.; Cao, C.; Zhao, D.; Wang, D. Reduction of 1−3 mm iron ore by H2 in a fluidized bed. Int. J. Miner. Metall. Mater. 2009, 16, 620–625. [Google Scholar] [CrossRef]
  16. Du, Z.; Zhu, Q.; Fan, C.; Pan, F.; Li, H.; Xie, Z. Influence of Reduction Condition on the Morphology of Newly Formed Metallic Iron During the Fluidized Bed Reduction of Fine Iron Ores and its Corresponding Agglomeration Behavior. Steel Res. Int. 2016, 87, 789–797. [Google Scholar] [CrossRef]
  17. Piotrowski, K.; Mondal, K.; Lorethova, H.; Stonawski, L.; Szymański, T.; Wiltowski, T. Effect of gas composition on the kinetics of iron oxide reduction in a hydrogen production process. Int. J. Hydrogen Energy 2005, 30, 1543–1554. [Google Scholar] [CrossRef]
  18. Yang, M.; Xiao, W.; Yang, X.; Zhang, P. Processing Mineralogy Study on Lead and Zinc Oxide Ore in Sichuan. Metals 2016, 6, 93. [Google Scholar] [CrossRef]
  19. Xu, Q.; Li, Z.; Liu, Z.; Wang, J.; Wang, H. The Effect of Pressurized Decarbonization of CO on Inhibiting the Adhesion of Fine Iron Ore Particles. Metals 2018, 8, 525. [Google Scholar] [CrossRef]
  20. Hayashi, S.; Iguchi, Y. Factors Affecting the Sticking of Fine Iron Ores during Fluidized Bed Reduction. ISIJ Int. 1992, 32, 962–971. [Google Scholar] [CrossRef]
  21. Komatina, M.; Gudenau, H.W. The sticking problem during direct reduction of fine iron ore in the fluidized bed. Metalurgija-Sisak Zagreb 2004, 10, 309–328. [Google Scholar] [CrossRef]
  22. Wong, P.L.M.; Kim, M.J.; Kim, H.S.; Choi, C.H. Sticking behaviour in direct reduction of iron ore. Ironmak. Steelmak. 1999, 26, 53–57. [Google Scholar] [CrossRef]
  23. Shao, J.H.; Guo, Z.C.; Tang, H.Q. Influence of Temperature on Sticking Behavior of Iron Powder in Fluidized Bed. ISIJ Int. 2011, 51, 1290–1295. [Google Scholar] [CrossRef]
  24. Srinivasan, N.S. Reduction of iron oxides by carbon in a circulating fluidized bed reactor. Powder Technol. 2002, 124, 28–39. [Google Scholar] [CrossRef]
  25. Guo, L.; Yang, Z.; Gao, J.; Zhong, Y.; Guo, Z. Effect of coating Mg(OH)2 with heterogeneous deposition method on sticking during fluidized bed reduction of iron ore. ISIJ Int. 2016, 56, 736–743. [Google Scholar] [CrossRef]
  26. Szafran, R.G.; Ludwig, W.; Kmiec, A. New spout−fluid bed apparatus for electrostatic coating of fine particles and encapsulation. Powder Technol. 2012, 225, 52–57. [Google Scholar] [CrossRef]
  27. Levy, E.K.; Celeste, B. Combined effects of mechanical and acoustic vibrations on fluidization of cohesive powders. Powder Technol. 2006, 163, 41–50. [Google Scholar] [CrossRef]
  28. Han, Y.; Wang, J.J.; Gu, X.P.; Feng, L.; Hu, G. Homogeneous Fluidization of Geldart D Particles in a Gas−Solid Fluidized Bed with a Frame Impeller. Ind. Eng. Chem. Res. 2012, 51, 16482–16487. [Google Scholar] [CrossRef]
  29. Song, Y.F.; Zhu, Q.S. Experimental study on fluidization and reduction of ultrafine iron oxide powder in an agitation fluidized bed. Chin. J. Process Eng. 2011, 11, 361–367. [Google Scholar]
  30. Li, X.L.; Liu, Y.; Wang, T.; Li, N.; Zhang, T. Experimental and numerical investigations on the hydrodynamics of gas−solid fluidized bed with an inclined agitator. Powder Technol. 2021, 380, 26–38. [Google Scholar] [CrossRef]
  31. Huilin, L.; Yurong, H.; Wentie, L.; Ding, J.; Gidaspow, D.; Bouillard, J. Computer simulations of gas−solid flow in spouted beds using kinetic–frictional stress model of granular flow. Chem. Eng. Sci. 2004, 59, 865–878. [Google Scholar] [CrossRef]
Figure 1. Experimental system and grid model. (a) Experimental system; (b) grid model.
Metals 13 00376 g001
Figure 2. Grid independence verification and experimental verification. (a) Grid independence verification; (b) experimental verification.
Metals 13 00376 g002
Figure 3. Standard deviation of pressure drop in the fluidized bed. (a) Different gas compositions. (b) Different agitation speeds.
Metals 13 00376 g003
Figure 4. Cloud chart of volume fraction distribution of iron ore powder. (a) Pure H2. (b) The volume ratio of H2 to CO is 1:1; (c) the volume ratio of H2 to N2 is 1:1. (d) Pure CO. (e) Different agitation speeds when the volume ratio of H2 to CO is 1:1.
Metals 13 00376 g004aMetals 13 00376 g004b
Figure 5. Radial volume fraction distribution of iron ore powder particles at the height of 0.07 and 0.21 m. (a) Different gas compositions at 0.07 m; (b) Different gas compositions at 0.21 m; (c) Different agitation speeds at 0.07 m; (d) Different agitation speeds at 0.21 m.
Metals 13 00376 g005
Figure 6. Axial average gas holdup of the fluidized bed. (a) Different gas compositions. (b) Different agitation speeds.
Metals 13 00376 g006
Figure 7. Velocity vector diagram of iron ore powder particles. (a) Different gas compositions. (b) Different agitation speeds.
Metals 13 00376 g007
Figure 8. Axial velocity distribution of iron ore powder particles in diameter direction at 0.07 and 0.21 m height. (a) Different gas compositions at 0.07 m; (b) Different gas compositions at 0.21 m; (c) Different agitation speeds at 0.07 m; (d) Different agitation speeds at 0.21 m.
Metals 13 00376 g008
Figure 9. Radial gas velocity distribution at heights 0.07 and 0.21 m. (a) Different gas compositions at 0.07 m; (b) Different gas compositions at 0.21 m; (c) Different agitation speeds at 0.07 m; (d) Different agitation speeds at 0.21 m.
Metals 13 00376 g009
Table 1. Relevant simulation parameters.
ParametersValues
The density of iron ore powder, ρp (kg/m3)3300.40
The particle size of iron ore powder, ds (μm)400.00
The volume fraction of initial iron ore powder powder particles0.62
Gas velocity, ug (m/s)0.50
Initial Bed Height, H0 (m)0.21
Particle collision coefficient, ess0.90
Time step, Δt (s)0.0001
Inlet boundaryVelocity−inlet
Outlet boundaryPressure−outlet
Operating temperature (K)293.15
Disclaimer/Publisher’s Note: The statements, opinions and data contained in all publications are solely those of the individual author(s) and contributor(s) and not of MDPI and/or the editor(s). MDPI and/or the editor(s) disclaim responsibility for any injury to people or property resulting from any ideas, methods, instructions or products referred to in the content.

