Article

Intelligent Systems to Optimize and Predict Machining Performance of Inconel 825 Alloy

by
Abdulsalam Abdulaziz Al-Tamimi
* and
Chintakindi Sanjay
*
Industrial Engineering Department, College of Engineering, King Saud University, Riyadh 11421, Saudi Arabia
*
Authors to whom correspondence should be addressed.
Metals 2023, 13(2), 375; https://doi.org/10.3390/met13020375
Submission received: 2 January 2023 / Revised: 9 February 2023 / Accepted: 10 February 2023 / Published: 12 February 2023

Abstract

:
Intelligent models are showing an uprise in industry and academia to optimize the system’s outcome and adaptability to predict challenges. In machining, there is difficulty of unpredictability to the part performance especially in super alloys. The aim of this research is to propose an intelligent machining model using contemporary techniques, namely, combinative distance-based assessment (CODAS), artificial neural network (ANN), adaptive neuro-fuzzy inference systems, and particle swarm optimization (ANFIS-PSO) approach for minimizing resultant force, specific cutting energy, and maximizing metal removal rate. Resultant force response has shown to be affected by feed rate and cutting speed with a contribution of 54.72% and 41.67%, respectively. Feed rate and depth of cut were statistically significant on metal removal rate contributing with the same value of 38.88%. Specific cutting energy response resulted to be statistically significant toward feed rate with 43.04% contribution and 47.81% contribution by depth of cut. For the CODAS approach, the optimum parameters are cutting speed of 70 m/min, feed of 0.33 mm/rev, and depth of cut of 0.6 mm for the seventh experiment. The estimated values predicted by the ANN and ANFIS method were close to the measured values compared to the regression model. The ANFIS model performed better than the ANN model for predicting turning of the Inconel 825 alloy. As per quantitative analysis, these two models are reliable and robust, and their potential as better forecasting tools can be used for hard-to-machine materials. For hybrid ANFIS-PSO, the optimum parameters for minimizing resulting force were (82, 0.11, 0.15), for minimizing specific cutting energy (45, 0.44 and 0.6) and maximizing metal removal rate (101, 0.43, 0.54). The hybrid model ANFIS-PSO has proven to be a better approach and has good computational efficiency and a lower discrepancy in assessment.

1. Introduction

In the last two decades, the environmental impact worldwide has led to productivity, reduction of energy consumption, and quality consciousness as the main factors for research in today’s manufacturing scenario. The economic, environmental, and legislative drivers have raised awareness of energy consumption and associated environmental impact of manufacturing processes. For sustainability performance, cleaner manufacturing is based on products that conserve natural resources and do not pollute the environment [1]. Considering this, green manufacturing has been proposed and drawn attention from both academia and industry. Appropriate environmental measurements, such as energy consumption, product quality, and production rate, are important for improving manufacturing processes [2]. The prediction of machining parameters has become necessary considering the need to increase production rate, reduce cost of production, and ensure sustainability and product quality. In conventional manufacturing, specific cutting energy can be considered as an adequate parameter to understand the energy consumption and machinability of materials that are primarily responsible for environmental impacts. Understanding machining processes and its complexity provides sufficient knowledge about energy consumption. For sustainable production, there should be a balance between energy consumption and machining quality [3]. However, with the non-linear nature of the machining process, applying and identifying a suitable and adequate technique is crucial to achieve green and reliable machining performance.
Machinability of super alloys has always been a challenge, as they are suitable for high-temperature applications and are commonly used in critical structures. It has better corrosion resistance in oxidizing environments, and chromium provides oxidizing resistance as well as a stable austenite structure [4]. It is the most suitable material due to its widespread applications in several industries, namely nuclear, aerospace, and chemical industries, to make components such as pressure vessels, propeller shafts, and expansion bellows for deep-sea applications such as marine engine parts and aircraft engine parts industries. However, Inconel alloy 825 has few limitations as it is hard and tough, forms a built-up edge, has work hardening behavior, and possesses lower thermal conductivity and harder continuous chips [5]. This alloy is an expensive material that is difficult to cut due to tool wear. Due to strain hardening, the heat generated in the cutting zone will be higher, increasing thermal stresses and causing faster tool wear. Therefore, 825 alloy is a critical material and still require understanding its behavior and to optimize its processing parameters.
Optimization has become an integral part of each complex machining process, and optimization of cutting factors is logically studied in manufacturing engineering to improve machine performance in terms of cost and accuracy. Many researchers adopted traditional approaches for optimization of machining factors, namely, factorial design, the Taguchi method, and response surface methodology (RSM), to obtain optimal solutions [6,7,8]. Advanced statistical tools such as grey-based Taguchi analyses was employed for machining AZ91D magnesium alloy to determine the best process parameters [9]. Non-traditional optimization methods are important in various engineering applications. Objective function optimization is used to determine by combining input cutting factors to optimize a single response or multiple responses [6,10]. The literature have proposed various soft computing approaches, namely multi-criteria decision-making techniques (MCDM), namely genetic algorithms, particle swarm optimization (PSO), and technique for order of preference by similarity to ideal solution (TOPSIS), and simulated annealing [11,12,13]. The combinative distance-based assessment (CODAS) approach developed by Ghorabaee was used for the selection of suppliers, cutting fluid and materials, market segmentation, material handling equipment, and airline performance [11,14]. In CODAS, the desirability of alternatives is assessed using two variables. The essential and fundamental metric has to do with how far away alternatives are from the negative-ideal in Euclidean space. This kind of distance necessitates the use of a l2-norm indifference space for the criteria. The taxicab distance, which is connected to the l1-norm indifference space, serves as the secondary metric. It is obvious that the alternative that is further from the negative-ideal solution is the more desired one. If two options are not comparable using the Euclidean distance, the taxicab distance is used as a backup measurement in this procedure. Two forms of indifference space could be considered in the CODAS process, even though the l2-norm indifference space is favored. Ghorabaee et al. [11,14] proposed the CODAS approach, which uses primary Euclidean distance and Taxicab distance as the secondary measures for decision-making, and the fuzzy CODAS approach and linguistic variables for the evaluation of market segments. Bolturk et al. [15] proposed a comparative study in the manufacturing industry for the selection of suppliers based on Pythagorean fuzzy-based CODAS and ordinary fuzzy CODAS. Mathew et al. [12] studied CODAS for choosing two material handling equipment according to the weighted aggregated sum product assessment approach. Stojci et al. [13] discussed a review paper based on applications of multiple-criteria decision-making approaches in the field of sustainable engineering using classification into five factors based on transport, energy, supply chains, construction, infrastructure, and logistics. Sofuoglu et al. [16] developed a decision-making approach based on four normalization methods for the selection of cutting fluid and compared it with the Spearman correlation test. In comparison to other MCDM methods such as TOPSIS and evaluation based on distance from average solution (EDAS), CODAS technique of using two distances provides it with a more desirable feature to reach its conclusion [17]. It has been extensively used in various fields and have proved its feasibility and efficiency [17,18]. The CODAS multi-criteria decision-making method has shown promising potentials for optimally selecting machining parameters in non-conventional manufacturing [18,19].
Data-driven models are more effective due to their computing power, high reliability, and easier data acquisition [20]. Soft computing methods are used for modelling machining processes as they are robust and yield reliable and accurate solutions, becoming an alternative method to conventional statistical methods. To achieve higher machining performance, it will be necessary to adjust the cutting parameters autonomously and adapt to current situations. Machine learning and deep learning play a critical role in the development of intelligent systems for descriptive, diagnostic, and predictive analytics for machine tools and process health monitoring. In example, fuzzy logic systems were used to predict machining settings for metal alloys for different type of machining (turning, drilling and ultrasonic vibration assisted turning) and proved that it is capable of being an accurate prediction method [21,22]. Artificial intelligence (AI) models are robust and reliable systems that are more proficient in reducing time and cost and are suitable for the optimization of complex machining operations [8]. AI models have been used for the estimation of response factors for varied materials and alloys. Muthuram et al. [23] suggested a hybrid predictive model in turning for titanium alloy using artificial neural network (ANN) and genetic algorithms for the prediction of metal removal rate (MRR) and surface roughness. Shivakotia et al. [24] conducted adaptive neuro-fuzzy inference systems (ANFIS) modeling and experimental work in turning for stainless steel 202, based on the Taguchi method for estimating surface integrity and metal removal rate. Sofuoglu et al. [25] developed a suitable cutting depth in turning without chatter vibrations for AISI 1050 steel. Sada et al. [26] suggested a comparative analysis between ANN and ANFIS in turning for AIS steel to estimate tool wear and MRR and indicated that ANN is relatively better as compared to the ANFIS approach, based on prediction errors. Gopal [27] presented the effect of tool geometry in turning using ANN and RSM to predict temperature for aluminum-6061 by an Al2O3 coated carbide tool. Chiu et al. [28] studied an intelligent machining system according to the hybrid PSO and an ANFIS predictor using speed, accuracy, and surface smoothness. Literature shows that a limited amount of work was conducted using ANN, hybrid ANFIS-PSO, and optimization of cutting factors by combinative distance-based assessment method for optimization of process parameters for 825 alloy.
This paper focuses on using several optimization and prediction artificial intelligence-based meta models investigating three processing parameters (cutting speed, feed rate and depth of cut) to optimize the machining behavior in turning high-strength metal 825 alloy. This is the first paper, to the authors best of knowledge, to consider CODAS optimization model to select the best configuration to machine 825 alloy. In addition, three different prediction models (regression, ANFIS, and ANN) were considered and compared. A hybrid ANFIS-PSO prediction/optimization model was used to train the neural fuzzy network and optimize machinability of Inconel 825. The selected output factors were resultant force, metal removal rate, and specific cutting energy, to understand the impact of cutting parameters.

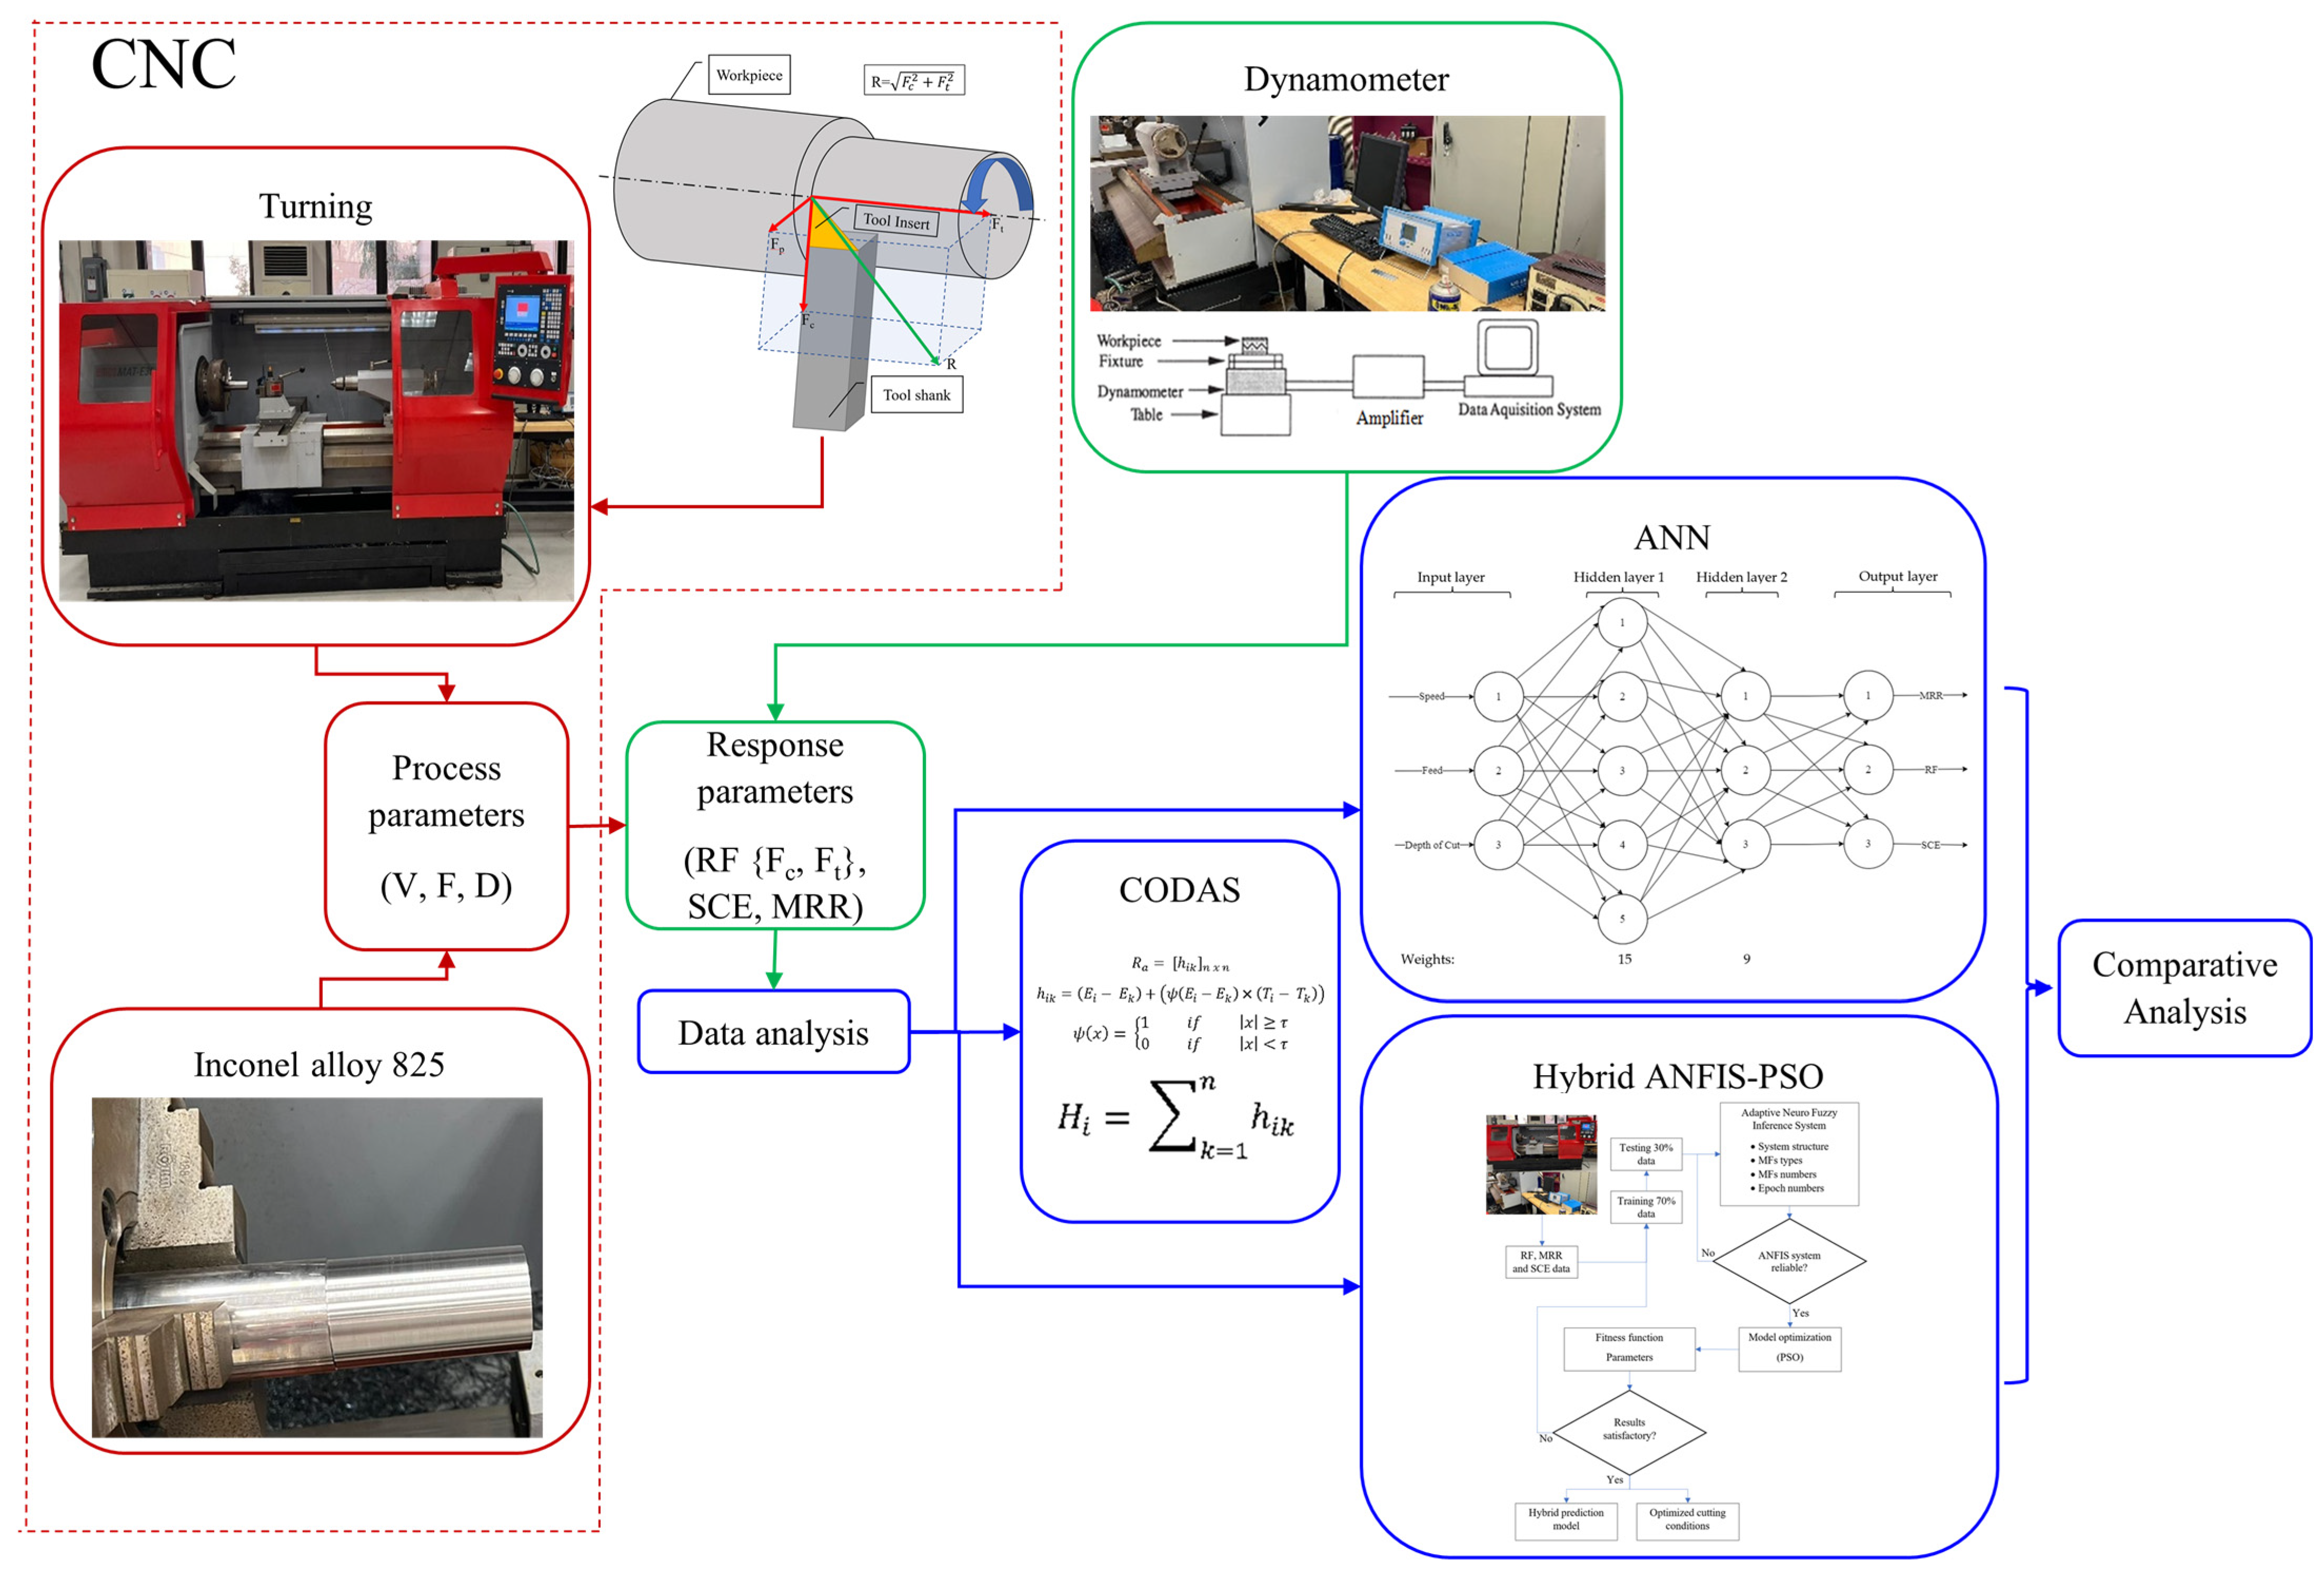
2. Materials and Methods

Experimental procedures and setup were accomplished according to Figure 1. The Kennametal PVD-coated TiAlN coated carbides were selected as CNMG 120408 MS Grade KCU10 with a nose radius of 0.8 mm intended to machine super alloys with DCLNR2525M12 tool holder [29].
The trials were conducted in an orthogonal cutting setting using a CNC lathe EMCO MATE 300 (EMCO, Hampshire, UK) in dry cutting condition. Inconel 825 alloys are chemically composed of ~23% chromium, ~22% iron, 3% molybdenum, ~3% copper, ~1% manganese, ~1.2% titanium, 0.2% aluminum, 0.5% silicon, 0.05% carbon, 0.03% sulfur, and balanced percentage with nickel. The properties of the 825 alloy are represented in Table 1. The dimensions of the considered workpiece were 300 mm in length and 70 mm in diameter. A Kistler tool dynamometer (Kistler Instrument Corp., Amherst, NY, USA) was used to measure the cutting force and the thrust force.
To determine the resultant force, metal removal rate, and specific cutting energy the following equations were considered:
Resultant   force ,   RF = F c 2 + F t 2   ( N )
Metal removal rate, MRR = F × D × 1000 V (mm3/min)
Specific cutting energy, SCE = Fc/F × D (N/mm2)
where Fc is the cutting force, Ft is the thrust force, F is the feed rate, D is the depth of cut, and V is the cutting speed.

Design of Experiment

Three machining factors were experimentally considered with four levels for each factor as shown in Table 2 and using an L16 array to represent the design of the experiment study [30,31]. The focus responses in this study were resultant force, specific cutting energy, and metal removal rate. The statistical significance for factors were analyzed using ANOVA and considered a p-value of less than 0.05 (95% confidence level). The fitted models were determined to describe the experimental data and compute the determination coefficient.

3. Results and Discussion

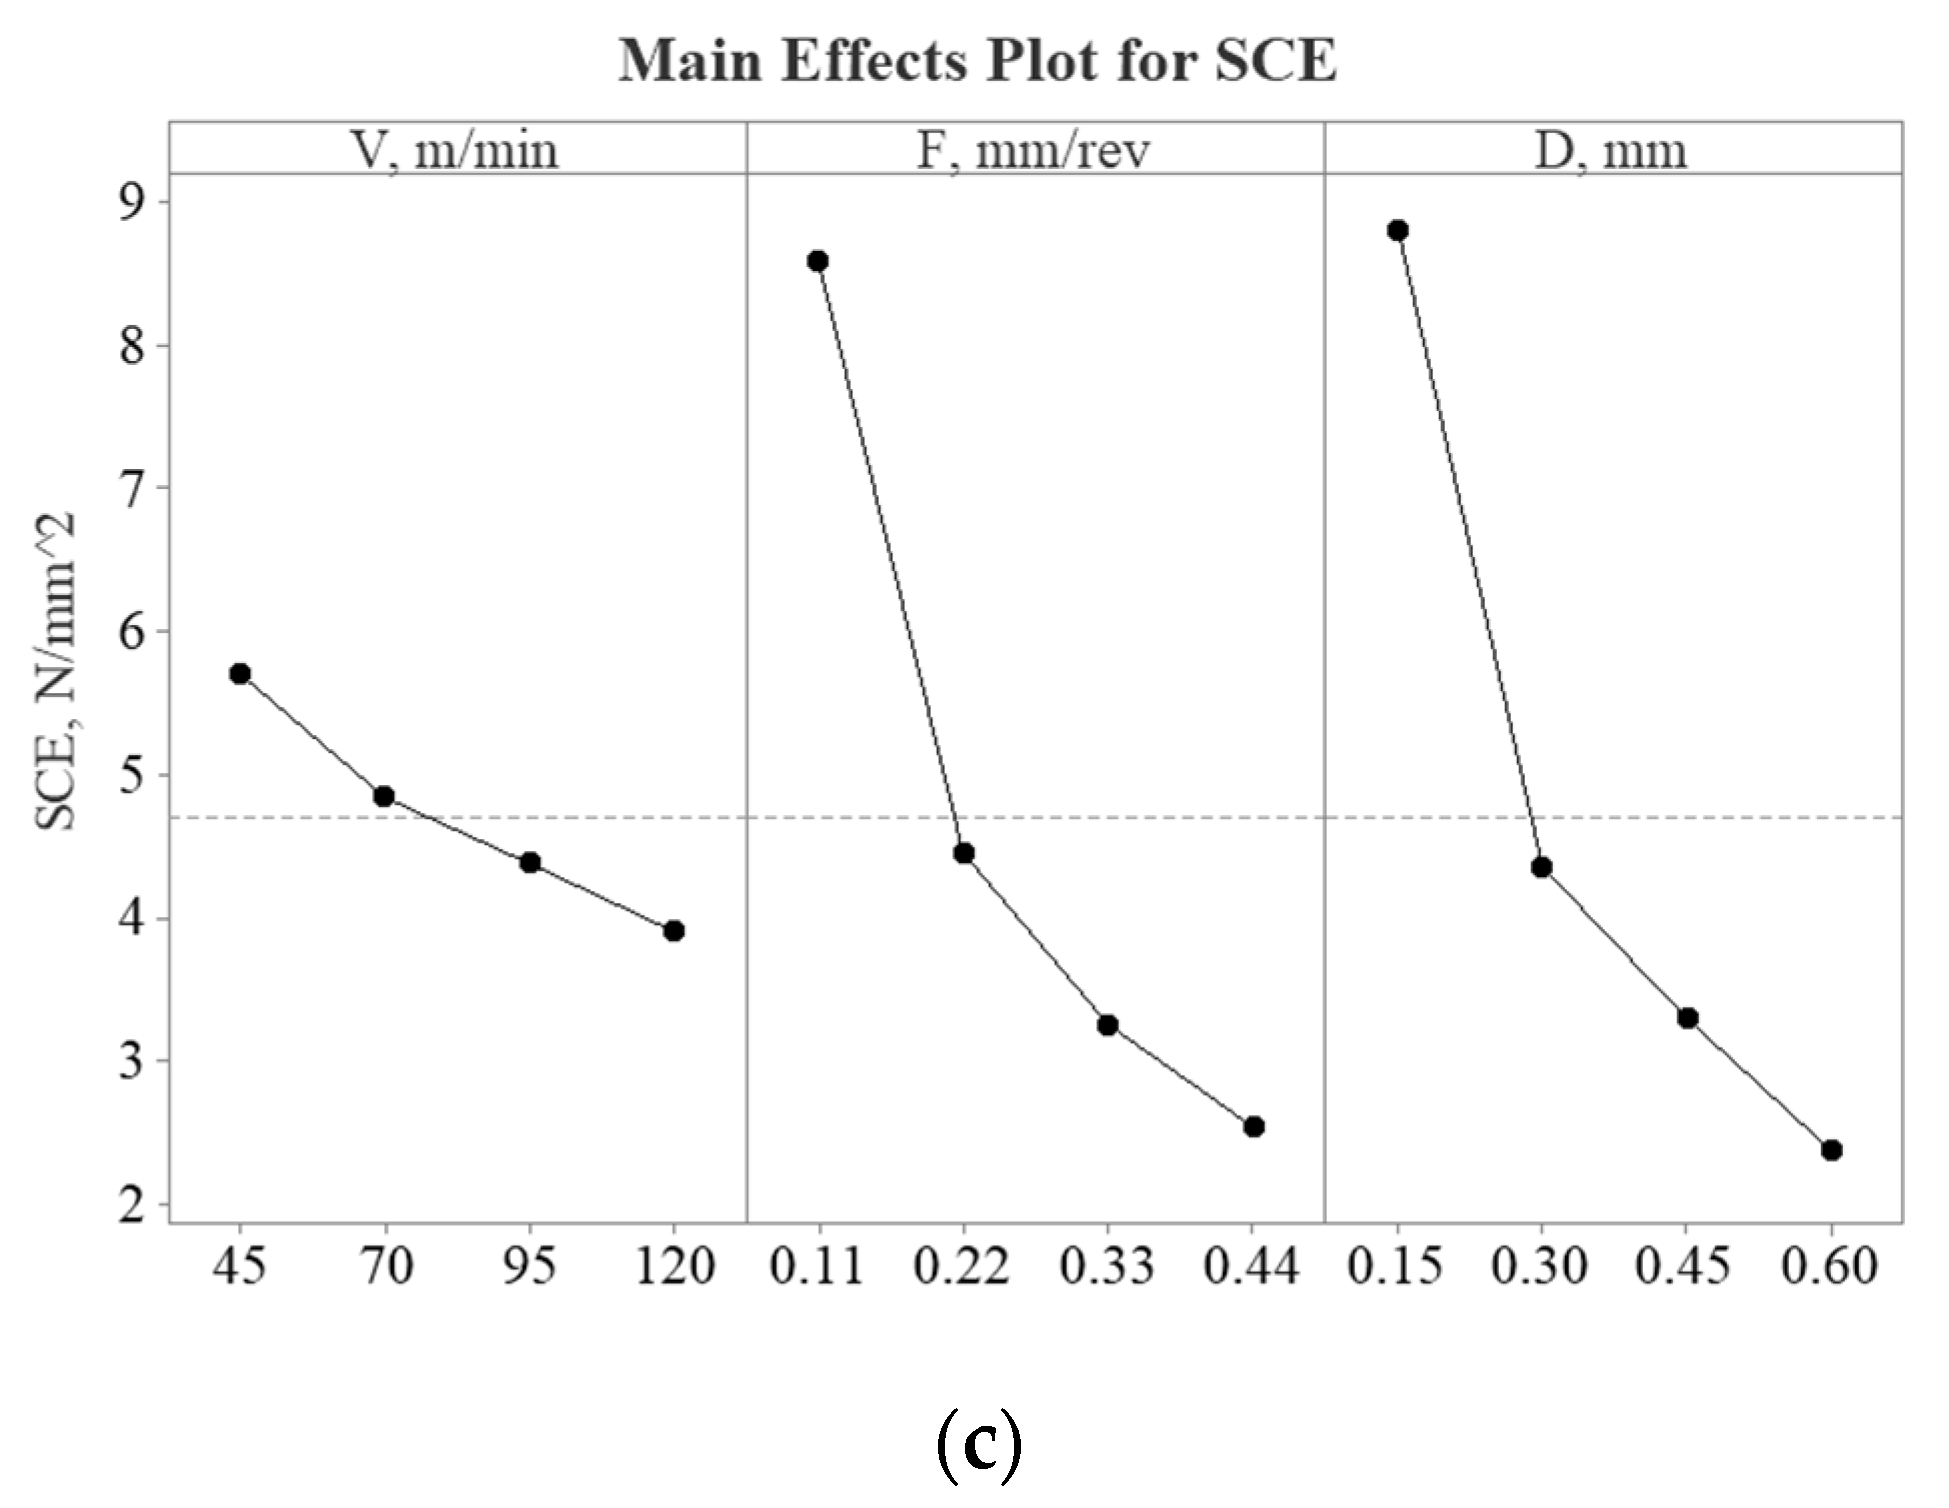
3.1. Effect of Input Parameters

The experimental results of the L16 array are presented in Table 3. The ANOVA for the resultant force, metal removal, and specific cutting energy are shown in Table 4. The statistical analysis, ANOVA, has shown that the fitted models describe the experimental data and that the determination coefficient is high, which is an indicator of better fit for the observations. Adjusted R2 of more than 0.75 is a fair value to show the accuracy of measured data [32]. In the ANOVA, it was observed that the R2 is 0.95, 0.90, and 0.94 for RF, MRR, and SCE, respectively, presenting the fitness of the data fitness and residual’s normality. Experiments have shown that the maximum resultant force were resulted at Exp.16 with 401.21 N (Fc = 323 N and Ft = 238 N) while minimum were in Exp.1 of 310.63 N (Fc = 258 N and Ft = 173 N). Further analysis showed that the average resultant force among all experiments was 366.74 N being close to what was resulting in Exp.10 and Exp.13 of 360 N (Fc = 300 N and Ft = 199 N) and 365.8 N (Fc = 293 N and Ft = 219 N), respectively. The highest contributor factor to the resultant force was feed rate of 45.52%, followed by cutting speed of 41.67% and depth of cut of 7.89%, where F and V are the significant factors (p ≤ 0.05). The results agree with the literature showing that the cutting speed and feed rate significantly influence the resultant force [33]. This means that there was an increase in the contact surface of the workpiece on the cutting tool as the depth of cut was at minimum, the cutting speed and feed rate were at the maximum level. Hence, the workpiece would have less force exerted from the tool. Overall, feed rate was observed to highly influence the resultant forces as higher forces were resulted when rate increased. The reason behind this could be the cutting tool contact rate with the workpiece is increasing, wielding higher forces. Regarding MRR, the maximum removal rate was noticed in both Exp. 7 and 8 with 13,860 mm3/min and minimum MRR resulted from Exp. 1 of 742.5 mm3/min. This is a clear indication from Equation (2), where all factors are proportionally related when increasing leads to a higher MRR. The MRR was most affected equally by feed rate and depth (38.88% contribution) and with only 12.33% contribution from cutting speed. Specific cutting energy has resulted in a maximum value of 15.64 N/mm2 from Exp.1 and a minimum of 1.20 N/mm2 from Exp.4. The energy was decreasing the most when increasing the feed rate and depth of cut which clearly is prescribed by the contribution of both factors of 43.04% and 47.81%, respectively. However, there is insignificant contribution from cutting speed (3.44%) to the SCE. Furthermore, the experiment showed that at speeds of 45 and 70 m/min, a feed rate of 0.11 mm/rev and a cut depth of 0.15 mm are above the average and result in higher SCE > 4.75 N/mm2. Larger SCE will require longer cutting time and will lead to higher temperature at the cutting zone leading to rapid tool wear and minimum tool life, which has a direct influence on the quality of products. A lower value of cutting energy will indicate a better and smoother machining process.
The main effect plots of RF, MRR, and SCE are shown in Figure 2. RF and MRR has shown to be increasing with higher values of cutting speed, feed rate and depth of cut. While SCE is decreased with increasing all process factors of cutting speed, feed rate, and depth of cut. This means that SCE is inversely proportional to RF and MRR. It was noticed that with a higher depth of cut (>0.45 mm), a critical value was resulted at 0.6 mm which will cause the RF to decrease. This shows that RF, MRR, and SCE are key responses on determining the machinability of 825 super alloys and the possibility of tailoring it. SCE and MRR are one of the most important indicators of machining performance and are adequate parameters to study cutting operation, energy consumption, and understanding the machinability of materials [34]. The ideal balance is to increase the MRR and keep the force at a minimum to avoid unnecessary energy consumption.

3.2. Combinative Distance-Based Assesment Method

CODAS model considers two types of distances for selective alternatives based on multiple criteria such as Euclidean distance and Taxicab distance. The obtained distances will be in a negative-solution and the ideal scenario is based on which alternative achieves the greater distance. In this paper, the taxicab distance is selected as a secondary measure and the Euclidean distance as a primary measure. To determine the optimal setting to machine the 825 alloy using CODAS, assume that there are n experiments and m response. The required steps are considered as follows:
Step 1: The design decision-making matrix (𝑋), as represented in Table 5, was calculated by the following Equation (4):
X = [ x i j ] n x m = x 11 x 12 x 1 m x 21 x 21 x 2 m x n 1 x n 2 x n m
where 𝑥𝑖𝑗 (𝑥𝑖𝑗 ≥ 0) indicates performance value for 𝑖th alternative on 𝑗th criterion 𝑖 ∈ (1, 2, …, 𝑛) and 𝑗 ∈ (1,2, …, 𝑚).
Step 2. Obtain normalized decision matrix using Equation (5).
n i j = x i j max i x i j   i f   j N b min i x i j x i j   i f   j N c
where 𝑁𝑏 and 𝑁𝑐 represent the set of benefit and non-beneficial criteria, respectively. The maximum values are in the beneficial area and the minimum values in the non-beneficial area are converted to 1.
Step 3. Calculate the weighted normalized decision matrix considering Equation (6). Using weight criteria, the values of weighted normalized performance will be obtained for estimating negative-ideal solutions and Euclidean distances between alternatives will be obtained.
r i j = w j n i j
where 𝑤𝑗 (0 < 𝑤𝑗 < 1) denotes weight of 𝑗th criteria, and ∑ 𝑤𝑗 = 1.
Step 4. For the experimental results, the negative ideal solution (point) is calculated by Equations (7) and (8):
n s = n s j 1   x   m
n s j = min i r i j
Step 5. Attaining Taxicab and Euclidean distances for alternatives using negative-ideal solution, Equations (9) and (10) are used.
E i = j = 1 m r i j n s j 2
T i = j = 1 m r i j n s j
Step 6. Calculate the relative assessment matrix using Equations (11)–(13).
R a = h i k n   x   n
h i k = E i E k + ψ E i E k × T i T k
ψ x = 1                     i f                     x τ 0                     i f                     x < τ
where 𝑘 ∈ (1, 2, …, 𝑛), 𝜓 represents threshold function for equality for Euclidean distances for two alternatives and τ is threshold factor and is set using a decision-maker.
The suggested value range is 0.01–0.05 difference in Euclidean distances of two alternatives and is less than 𝜓. Afterwards, these two alternatives will be compared using a Taxicab distance. In this study, we have selected τ = 0.02 for prediction [15].
Step 7. An assessment score for each alternative is defined using Equation (14).
H i = k = 1 n h i k
Step 8. Rank each alternative based on decreasing assessment value. The best optimal score is with the highest H i .
Table 6 presents optimization of Inconel 825 turning responses with CODAS. In this study, the focus was investigating the case of MRR and its relationship with the resulted force to generate less energy during. As the main aim is to achieve better machinability with balancing the consumed energy, MRR was employed with highest impact (50% of weight) in the CODAS optimization approach, following it the SCE with 35% and RF with 15% weight. The CODAS assessment score showed that experiment 7 has the highest rank among all experiments with cutting speed of 70 m/min, feed rate of 0.33 mm/rev, and 0.6 mm depth of cut and would result in the best optimal turning condition of Inconel 825 alloy. The optimum resulted cutting speed of 70 m/min confers with the literature [35]. Kumar et al. [20] reported in special coated tools when machining Inconel 825 alloy, a higher cutting speed of 100 m/min, a lower feed rate of 0.14 mm/rev, and 0.15 mm of depth of cut will result in less tool flank wear and cutting force generation, and better surface roughness and chip formation. Furthermore, Thakur et al. [36] provided sufficient investigation of Inconel 825 in dry turning and the influence of process factors on chip morphology, chip thickness ratio, tool wear, surface, and sub-surface integrity. However, the literature mentioned focuses only on optimizing the machinability of the Inconel 825 alloy to improve tool wear, chip formation, surface roughness, cutting forces, and cutting temperatures regardless of the material and energy consumed [2,31,37,38,39].

3.3. Optimization of Neural Network Parameters

3.3.1. ANN

To model the turning of Inconel 825 alloy, a feed-forward multi-layer perceptron model was considered using Easy NN-Plus V14.0g software (Neural Planner Software Ltd., Stockport, UK). During ANN, several trials were conducted to achieve the predictive model with the least relative error (RE) [40]. The ANN model used a 3-5-3-3 MLP consisting of three layers such as input layer, two hidden layers, weights of each hidden layer, and output as shown in Figure 3. The number of neurons and hidden layers were selected by trial-and-error process. The momentum was set to 0.8, learning rate 0.6, target error 0.01, and calculated up to 100,000 learning cycles. The weights between the layers were automatically set as 15 from the input layer to 1st hidden layer, 15 from 1st to 2nd hidden layer, and 9 from 2nd hidden layer to the output layer. Weights between layers were automatically set by the software [41]. Two out of sixteen experiments (12.5%) were considered to validate the neural network and the remaining percentage (87.5%) trained the network. The network was stopped at 62,801 cycles after achieving within 10% of the validating examples shown in Figure 4.

3.3.2. Adaptive Neuro-Fuzzy Inference System

The capability to develop applications of intelligent system applications is an effective approach to the estimation of prediction models for solving linear and non-linear processes. The first order Sugeno fuzzy model, identical to ANFIS, combines the least squares and back propagation gradient descent approaches. It consists of six layers as inputs, namely fuzzification, fuzzy rule, normalization, defuzzification, and summation. Figure 5 represents an output and two membership functions (MF) for each input. This network has one output, y, and two inputs, x1 and x2. First-order polynomials are taken as output and two fuzzy sets as input. The considered four rules are as follows:
  • Rule 1: IF x1 is A1 AND x2 is B1 THEN y  =  f1  =  k10 + k11x1 + k12x2
  • Rule 2: IF x1 is A2 AND x2 is B2 THEN y  =  f2  =  k20 + k21x1 + k22x2
  • Rule 3: IF x1 is A2 AND x2 is B1 THEN y  =  f3  =  k30 + k31x1 + k32x2
  • Rule 4: IF x1 is A1 AND x2 is B2 THEN y  =  f4  =  k40 + k41x1 + k42x2
As shown in Table 7, Layer 1 interprets A1, A2, B1, and B2 as membership functions. Layer 2 has a bell-shaped structure and fuzzification neurons. Within Layer 3, each neuron is represented by a single sugeno-type fuzzy rule. The rule neurons obtain input from individual fuzzification neurons and determine the firing strength of the rule. Moreover, it will indicate output of rule 1 represents firing strength. Layer 4 is considered the normalization layer, the firing strength is the ratio of sum of the firing strengths for all rules, and the firing strength is the output of neuron i. Defuzzification Layer 5 is a defuzzification layer where each neuron will be connected to an individual normalization neuron and determine a weighted consequent value. A single summation neuron of Layer 6 will calculate the sum of responses for all defuzzification neurons and the actual output of ANFIS.
It should be noted that ki0, ki1, and ki2 are result factors set (consequent parameters) for i rule and ai, bi, and ci are premise parameters, μi is firing strength for rule 1 and n is the total rule neurons and a, ak, b, c, ck, d, and σ are membership function parameter sets. For the ANFIS model, Matlab software 2022a (The MathWorks, Inc., Natick, MA, USA) was used. Evaluation criteria are based on measured data such as test data (12.5%) and training data (87.5%). Different fuzzy membership function numbers (2 2 2 and 3 3 3) and forms (triangular, trapezoidal, gaussian, bell-shaped and sigmoidal) were considered and compared to minimize the model RMSE error. The fuzzy inference factors have a constant output function and 50 epochs. For the resultant force, the selected membership function factor was Gaussian with 2 2 2 resulting of an average of 1.40% RMSE and R2 of 0.96. In terms of metal removal rate, a triangular membership function form with numbers of 2 2 2 shows an RMSE of 0.0003% and R2 of 0.99. Whilst the specific cutting energy output, a trapezoidal MF type and numbers of 3 3 3 was chosen that resulted with 1.40% RMSE and 0.99 R2. In other studies, Gaussian MF have shown to be a suitable type to predict MRR and surface roughness [42]. However, MF type itself is not an important factor to shape the model performance. The most important in fuzzy logic is to break the 0–1 modeling [43]. In this study, simple shapes such as triangular and trapezoidal MF type was seen to satisfy the 0 and 1 model for MRR and SCE, respectively. Whilst resultant force showed to be modeled best when using Gaussian MF, it is known for its smoothness and concise notation [43].

3.3.3. Model Efficiency and Performance Criteria

To confirm model efficiency and validity of the model, regression models were developed for all three outputs using Minitab 17.0 software (Minitab LLC., State College, PA USA). Multilinear regression analysis was considered including machining parameters (cutting speed, feed rate and depth of cut) for each response (resultant force, metal removal rate and specific cutting energy) [44]. All regression models were run using confidence interval of 95% with two-sided type, adjusted (Type III) for sum of squares and no transformation of Box-Cox transformation. The ANN, ANFIS, and regression models are presented in Figure 6. In all cases, ANFIS and ANN presented better prediction modeling than regression. Based on different statistical error measurements, the predicted values obtained by ANN and ANFIS for are within an acceptable range of measured values for all given responses. Based on relative error, the predicted values obtained by the ANFIS method were closer to the measured values when comparing to the ANN model in cases of MRR and SCE. However, when predicting the resultant forces, ANN presented a lower RE of 0.16% against the ANFIS model 0.91%. In terms of MRR, the accuracy of the ANFIS model showed 0.0003% RE and ANN resulted in 2.21% RE. Prediction of specific cutting energy was accurately predicted by 1.18% and 8.47% RE for ANFIS and ANN models, respectively. Meanwhile, for ANN analysis, the corresponding values of the resultant force for MAE are 0.16%, RMSE 0.24%, MAPE is 0.16%, and the coefficient of correlation is 0.99. In MRR case, MAE is 2.21%, RMSE is 4.74%, and MAPE is 2.21%, and the coefficient of correlation is 0.99. The SCE ANN prediction model presented an MAE of 4.22%, RMSE of 5.17%, and MAPE of 8.47% and the coefficient of correlation is 0.99. On the other hand, in the ANFIS model, the corresponding values for the MAE of the resulting force are 0.90%, RMSE 1.40%, MAPE 0.91%, and the correlation coefficient is 0.98. In SCE, ANFIS prediction error resulted in MAE of 0.47%, 1.40% RMSE, 1.66% MAPE, and coefficient of correlation of 0.99. Whereas for metal removal rate, 0.0003% MAE, RMSE, MAPE, and coefficient of correlation of 1 were seen.
The validation experiments and their prediction value for all models with errors are shown in Table 8. The ANN showed to have a better prediction model for only the SCE response while ANFIS is better for others. In the validation examples of the two experiments, overall ANFIS presented a better predication model. However, in SCE validating examples, ANN model had lower errors. Based on statistical measurements, the ANFIS model is better than the ANN model for predicting the resultant force and the metal removal rate. Whilst ANN model is a better predictive procedure to forecast specific cutting energy of Inconel 825 alloy in turning operation. Nevertheless, according to the quantitative analysis, the developed six forecasting models are reliable and robust, and their potential for better forecasting tools can be used for hard-to-machine materials.

3.4. Particle Swarm Optimization of ANFIS Method

Kennedy and Eberhart introduced PSO in 1995 as one of the well-known nature-inspired optimization techniques. The first step in the PSO algorithm is to create a random population. The best values for each set of choice variables should be given for each component of nature. Each element in the solution space corresponds to a vector. In addition to the location vector, the algorithm also includes a velocity vector that forces the population to move around in the search space. The two vectors that make up velocity are pbest and gbest. The best position a particle has ever achieved is pbest, while the best position a particle in its immediate global vicinity has ever reached is gbest. Each particle in this method offers a solution after each iteration. PSO cooperates for both local and global best particles. The efficiency of PSO will be determined by the right formulation of the fitness function. The mathematical description of PSO is described by the following equations:
V i t + 1 = w V i t + C 1 P i t x i t + C 2 g t x i t x i t + 1 = x i t + V i t + 1
V i j t + 1 = w V i j t + r 1 C 1 P i j t x i j t + r 2 C 2 g j t x i j t
x i j t + 1 = x i j t + V i j t + 1
where V i is the velocity of each particle i in function of time, x i is the particle position that belongs to particle population X, w is the inertia weight, P i t is the best experience of particle i , g t is the common experience among the members of swarm, r 1 and r 2 are random numbers in the range of 0 to 1, C 1 and C 2 are acceleration coefficients and named personal learning coefficient and global learning coefficient, respectively.
The output and input parameters will be correctly mapped by the fitness function. As a fitness function, the predicted model for the output is employed. The ANFIS-PSO framework is presented in Figure 7. In comparison to the hybrid method, the traditional mathematical/statistical model may not be successful in mapping complicated manufacturing processes. The input data and measured data are considered when choosing the training parameters for ANFIS to increase the predictive model’s accuracy. ANFIS is evaluated considering 135 different models of different membership types (Triangular, Trapezoidal, Gaussian, Bell-shaped, Sigmodal) and numbers (2, 2, 2 to 4, 4, 4) during testing 30% of the experimental data that is correlated with RMSE to determine the lowest testing error for selecting effective learning factors. Furthermore, PSO factors are configured for the execution of optimization iterations as shown in Table 9 that comprises of fitness function and constraints of output responses based on the ANFIS model [45,46]. Every particle in the swarm acts as a solution and communicates with other particles to improve their quality. In the optimization process, swarm initialization will be proceeded by evaluation and density assessment solutions. The pbest method compares each particle’s present position to its previous pbest position. In contrast, the gbest approach uses undominated solutions that were modified in the prior phase. In this study, the developed ANFIS-PSO Matlab code [47] was modified according to this study requirements and is used to minimize the resultant force and specific cutting energy whilst maximize the metal removal rate for improved machinability of Inconel 825 alloy.
Evaluation of the ANFIS model of the testing data resulted in the least RMSE of 7.84% resulted for the RF response using the triangular membership type with 3 2 2 membership numbers. For SCE, the bell-shaped membership type and 3 4 2 numbers resulted in the least RMSE error of 7.03%. Lastly, MRR ANFIS-PSO model, triangular membership type with 2 2 2 numbers showed the minimal RMSE error of 0.77%. The optimum levels proposed for hybrid ANFIS-PSO for the factors considered and their predicted values are shown in Table 10. Optimization of the parameters for the resultant force (82, 0.11, 0.15) and the predicted value is 242 N. The PSO entails that a slight increase in speed with the least value feed and depth of cut would result in the minimum resultant force. While in the case of MRR (101, 0.43, 0.54), the predicted value is 24,145 mm3/min. The MRR optimum configuration presents a meaningful outcome as both the feed rate and the depth of cut are the main contributors, as shown in the ANOVA analysis in Table 4. In case of SCE, the optimum parameters are (45, 0.44, and 0.6) with a prediction of 1.20 N/mm2 with 0% relative error. These optimal levels of SCE are consistent with the statistical method considered for ANOVA. The PSO predicted that reducing cutting speed along with maximizing feed rate and depth of cut would result in the lowest specific cutting energy [48]. This shows that the hybrid model of ANFIS-PSO is a viable approach to predict and optimize the machining of Inconel 825 alloy concurring with other studies [40].

4. Conclusions

For this research work, the effects of input factors on resultant force, specific cutting energy, and metal removal rate based on the L16 array are investigated. The scope of this study is to optimize the machining parameters for the Inconel 825 alloy and create a reliable and robust prediction model. The machine parameters were optimized using statistical analysis, CODAS, and ANFIS-PSO approaches. The prediction model was created using the ANN, ANFIS, and hybrid ANFIS-PSO approach. These meta-heuristic algorithms are computational intelligence methods commonly used for the optimization and prediction of machining parameters. This research paper presented and contributed several contributions to knowledge and is summarized as follows:
  • As shown in Figure 2, optimized parameters can be used for machining the 825-super alloy by increasing the cutting speed to 120 m/min, feed rate to 0.44 mm/rev, and depth of cut to 0.4 mm which consequently will increase the metal removal rate, reduce energy consumption, and satisfy the requirements of green manufacturing.
  • Given in Table 6, the optimized parameters resulted by the CODAS to improve Inconel 825 machinability (i.e., increase MRR and decrease SCE) were to set the cutting speed to 70 m/min, feed rate to 0.33 mm/rev, and depth of cut to 0.6 mm.
  • In Table 10, the ANFIS-PSO model shows that minimizing RF optimum parameters were 82 m/min cutting speed, 0.11 mm/rev feed rate, and 0.15 m depth of cut. To maximize MRR, ANFIS-PSO resulted the factors to be set at 101 m/min cutting speed, 0.43 mm/rev feed rate, and 0.54 mm depth of cut. Lastly, to minimize SCE, the optimum levels were 45 m/min cutting speed, 0.44 mm/rev, and 0.6 mm depth of cut.
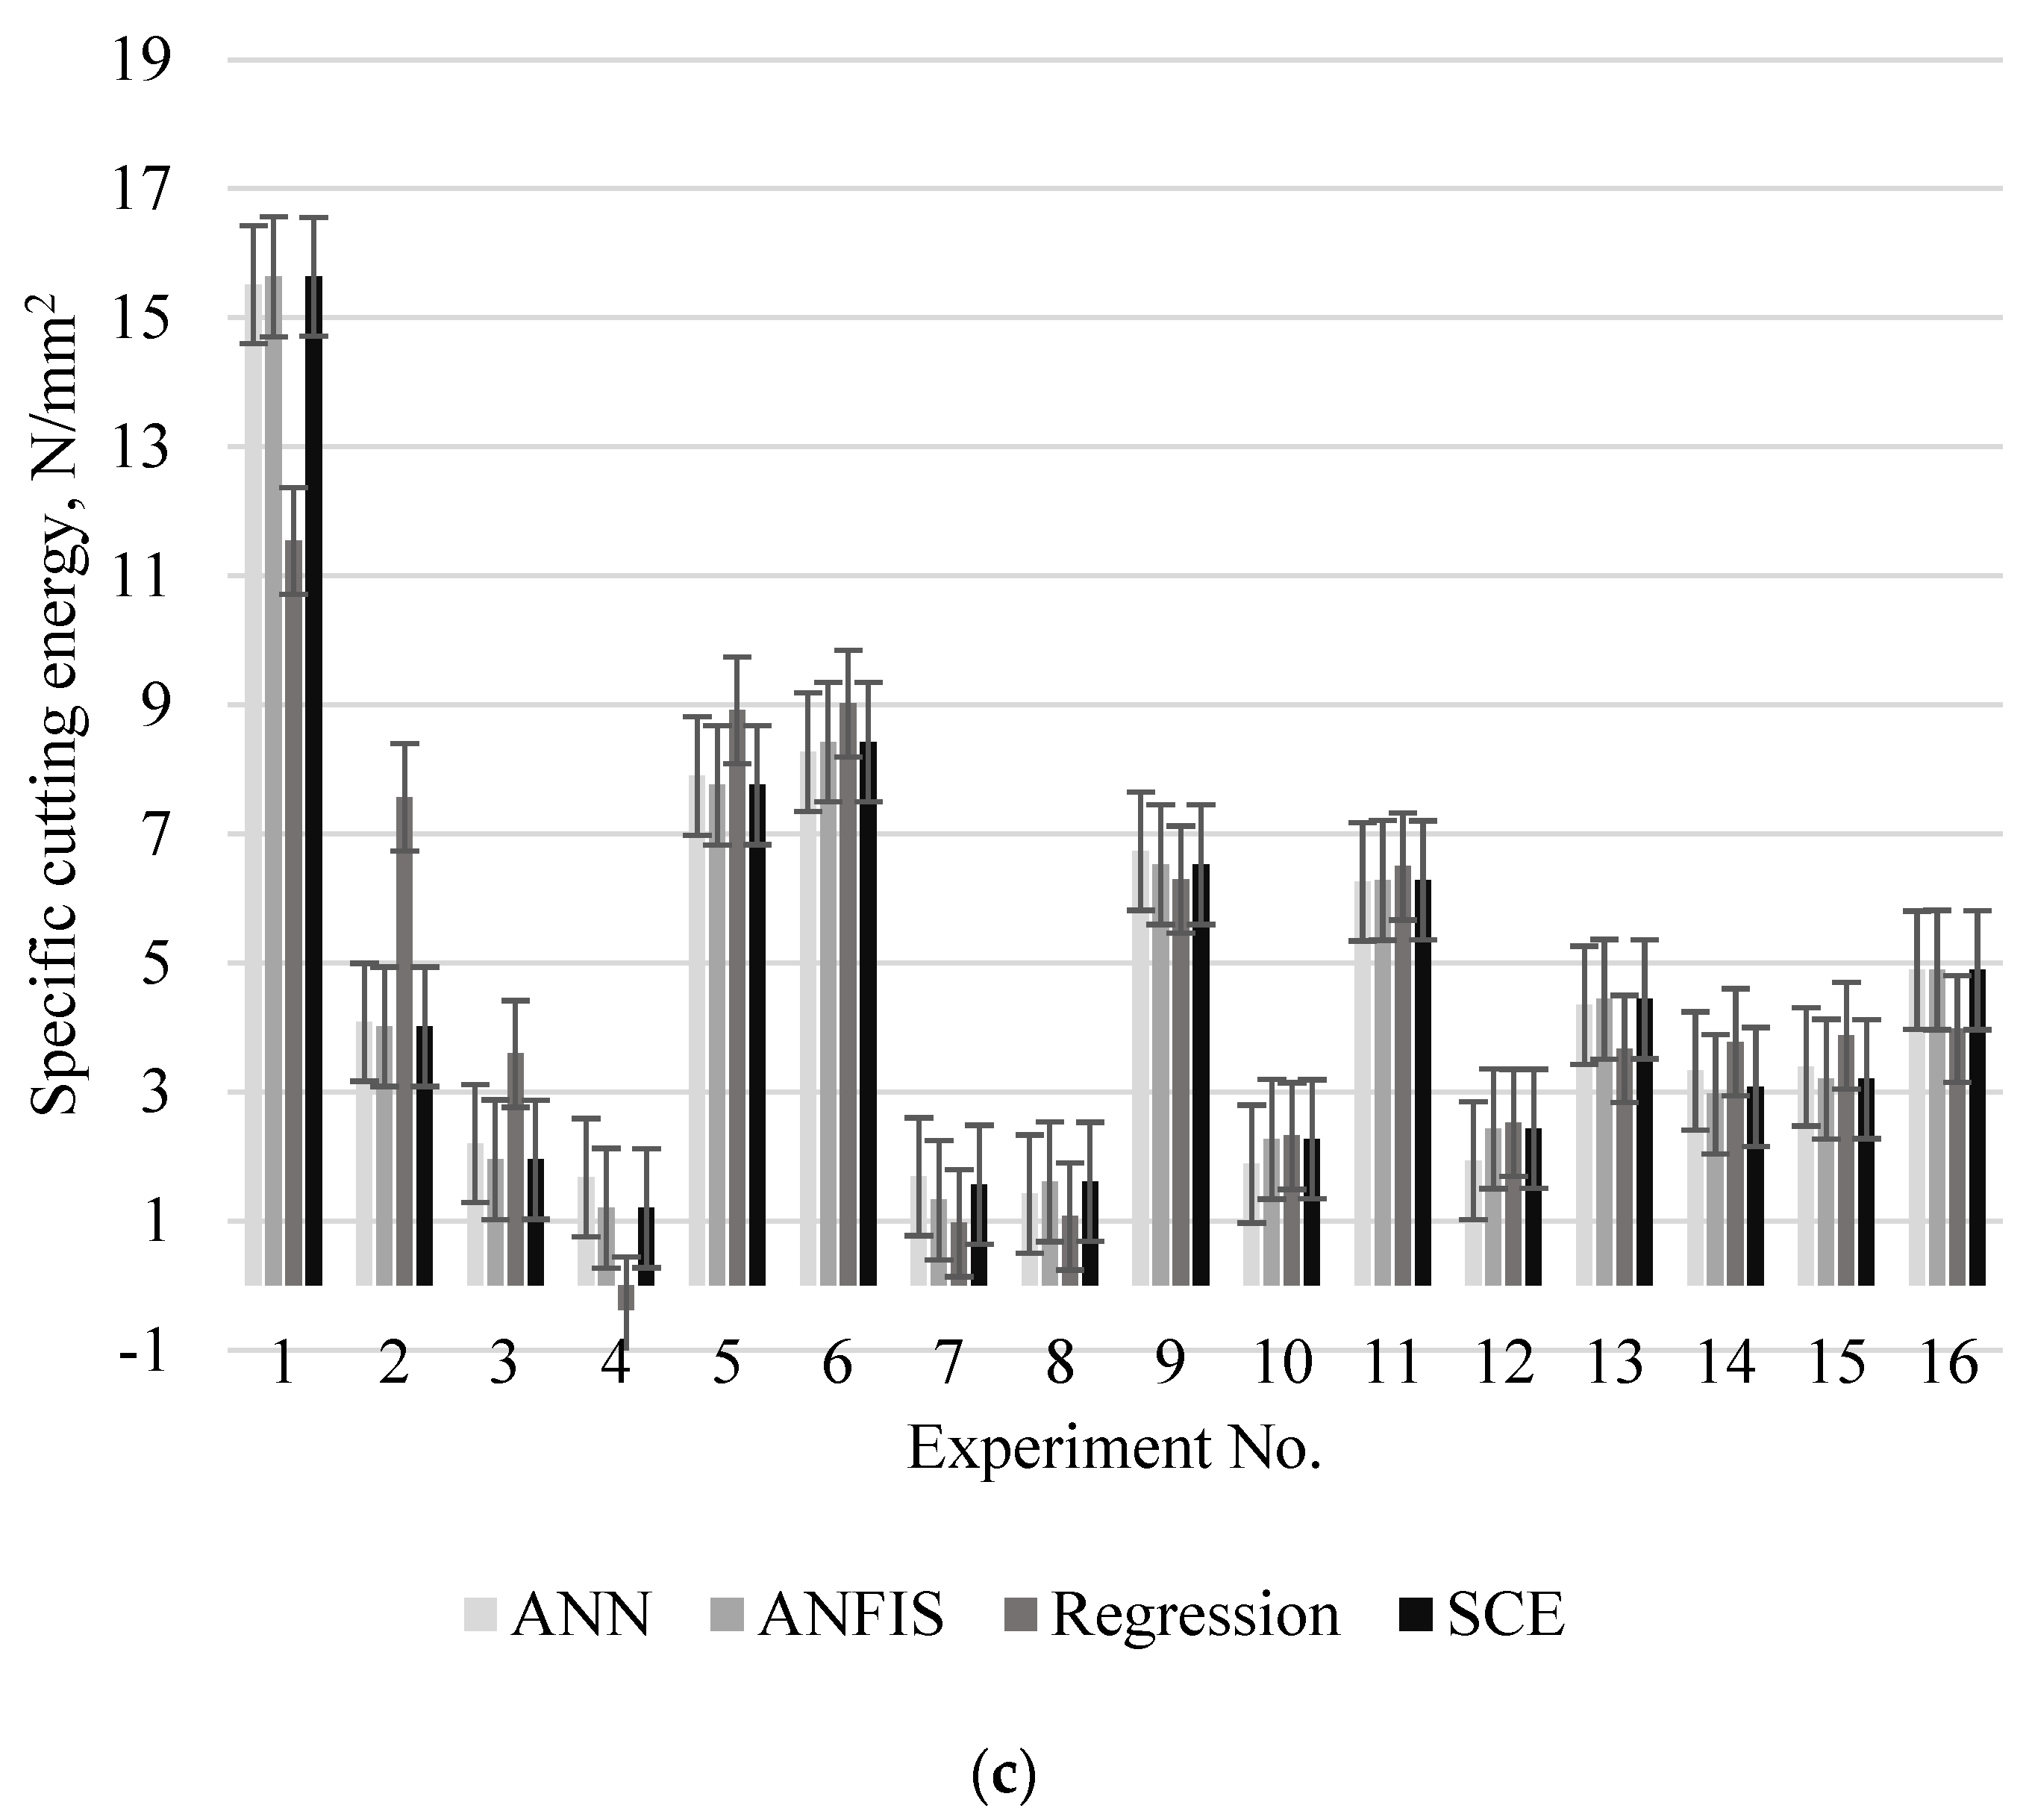
  • Considering statistical errors and based on the provided data in Figure 6, the hybrid model ANFIS-PSO has proved to be a better method based on comparison to other predictive models on the time factor, the lower discrepancy in assessment, and having good computational efficiency.
  • According to results and the literature, data-driven models have shown high potential in predicting and measuring machining parameters more accurately compared to analytical and statistical methods. The developed hybrid ANFIS-PSO method can be implemented for different super alloy in complex machining processes, including grinding, milling, and non-traditional machining processes. Further analysis of workpiece surface roughness, chip formation, and cutting temperature must be considered to increase the intelligence of the proposed prediction model.

Author Contributions

Conceptualization, C.S.; methodology, A.A.A.-T.; software, A.A.A.-T.; validation, A.A.A.-T. and C.S.; formal analysis, A.A.A.-T.; investigation, A.A.A.-T.; resources, C.S. and A.A.A.-T.; data curation, A.A.A.-T.; writing—original draft preparation, C.S. and A.A.A.-T.; writing—review and editing, A.A.A.-T. and C.S.; visualization, A.A.A.-T. All authors have read and agreed to the published version of the manuscript.

Funding

This research received no external funding.

Data Availability Statement

No new data were created or analyzed in this study. Data sharing is not applicable to this article.

Acknowledgments

Researchers Supporting Project number (RSP2023R299), King Saud University, Riyadh, Saudi Arabia.

Conflicts of Interest

The authors declare no conflict of interest.

References

  1. Pawade, R.S.; Sonawane, H.A.; Joshi, S.S. An analytical model to predict specific shear energy in high-speed turning of Inconel 718. Int. J. Mach. Tools Manuf. 2009, 49, 979–990. [Google Scholar] [CrossRef]
  2. Thakur, A.; Gangopadhyay, S.; Maity, K.P.; Sahoo, S.K. Evaluation on Effectiveness of CVD and PVD Coated Tools during Dry Machining of Incoloy 825. Tribol. Trans. 2016, 59, 1048–1058. [Google Scholar] [CrossRef]
  3. Reddy, M.C.; Venkata Rao, K.; Suresh, G. An experimental investigation and optimization of energy consumption and surface defects in wire cut electric discharge machining. J. Alloy. Compd. 2021, 861, 158582. [Google Scholar] [CrossRef]
  4. Singh, A.; Anandita, S.; Gangopadhyay, S. Microstructural Analysis and Multiresponse Optimization During ECM of Inconel 825 Using Hybrid Approach. Mater. Manuf. Process. 2015, 30, 842–851. [Google Scholar] [CrossRef]
  5. Thakur, A.; Mohanty, A.; Gangopadhyay, S.; Maity, K.P. Tool Wear and Chip Characteristics during Dry Turning of Inconel 825. Procedia Mater. Sci. 2014, 5, 2169–2177. [Google Scholar] [CrossRef]
  6. Rahul; Abhishek, K.; Datta, S.; Biswal, B.B.; Mahapatra, S.S. Machining performance optimization for electro-discharge machining of Inconel 601, 625, 718 and 825: An integrated optimization route combining satisfaction function, fuzzy inference system and Taguchi approach. J. Braz. Soc. Mech. Sci. Eng. 2017, 39, 3499–3527. [Google Scholar] [CrossRef]
  7. Mohanty, S.D.; Mahapatra, S.S.; Mohanty, R.C.; Khuntia, S.K.; Mohapatra, J.A. Perceptive Approach for Multi-objective Optimization of Die-Sinking EDM Process Parameters with Utility Concept and Taguchi Method for Sustainable Machining. In Proceedings of the Recent Advances in Mechanical Engineering; Springer: Singapore, 2023; pp. 133–141. [Google Scholar]
  8. Murthi, C.S.; Arunachalam, V.P. Optimization of High-speed CNC Face Milling of Inconel 825 Alloy, Using Box Behnken based Response Surface Methodology. J. Balk. Tribol. Assoc. 2018, 24, 586–599. [Google Scholar]
  9. Saravanakumar, A.; Rajeshkumar, L.; Sisindri Reddy, G.; Narashima Prasad, K.; Pranava Adithya, M.; Suryaprakash Reddy, P.; Harsha Vardhan, P.; Bala Narasimhudu, P. Multi-response Optimization of Turning Parameters for AZ91D Magnesium Alloy Using Gray-Based Taguchi Approach. Proceedings of Recent Advances in Mechanical Engineering; Springer: Singapore, 2023; pp. 389–397. [Google Scholar]
  10. Cesén, M.; Vila, C.; Ayabaca, C.; Zambrano, I.; Valverde, J.; Fuentes, P. Cost optimization of the AISI-1018 turning process under sustainable manufacturing. Mater. Today Proc. 2022, 49, 58–63. [Google Scholar] [CrossRef]
  11. Ghorabaee, M.K.; Amiri, M.; Zavadskas, E.K.; Hooshmand, R.; Antuchevičienė, J. Fuzzy extension of the CODAS method for multi-criteria market segment evaluation. J. Bus. Econ. Manag. 2017, 18, 1–19. [Google Scholar] [CrossRef]
  12. Mathew, M.; Sahu, S. Comparison of new multi-criteria decision making methods for material handling equipment Selection. Manag. Sci. Lett. 2018, 8, 139–150. [Google Scholar] [CrossRef]
  13. Stojčić, M.; Zavadskas, E.K.; Pamučar, D.; Stević, Ž.; Mardani, A. Application of MCDM Methods in Sustainability Engineering: A Literature Review 2008–2018. Symmetry 2019, 11, 350. [Google Scholar] [CrossRef]
  14. Ghorabaee, M.K.; Zavadskas, E.K.; Turskis, Z.; Antucheviciene, J. A new combinative distance-based assessment (CODAS) method for multi-criteria decision-making. Econ. Comput. Econ. Cybern. Stud. Res. 2016, 50, 25–44. [Google Scholar]
  15. Bolturk, E. Pythagorean fuzzy CODAS and its application to supplier selection in a manufacturing firm. J. Enterp. Inf. Manag. 2018, 31, 550–564. [Google Scholar] [CrossRef]
  16. Sofuoğlu, M.A. A new hybrid decision-making strategy of cutting fluid selection for manufacturing environment. Sādhanā 2021, 46, 94. [Google Scholar] [CrossRef]
  17. Adalı, E.A.; Tuş, A. Hospital site selection with distance-based multi-criteria decision-making methods. Int. J. Healthc. Manag. 2021, 14, 534–544. [Google Scholar] [CrossRef]
  18. Kumari, A.; Acherjee, B. Selection of non-conventional machining process using CRITIC-CODAS method. Mater. Today Proc. 2022, 56, 66–71. [Google Scholar] [CrossRef]
  19. Karthik Pandiyan, G.; Prabaharan, T.; Jafrey Daniel James, D.; Sivalingam, V. Machinability Analysis and Optimization of Electrical Discharge Machining in AA6061-T6/15wt.% SiC Composite by the Multi-criteria Decision-Making Approach. J. Mater. Eng. Perform. 2022, 31, 3741–3752. [Google Scholar] [CrossRef]
  20. Kumar, S.; Kumar, A.; Kumar, V.; Singh, N.K. Study of Machining of Inconel 825 Super Alloy Using Powder Mixed EDM Process. Mater. Today Proc. 2018, 5, 18129–18134. [Google Scholar] [CrossRef]
  21. Muhammad, R. A Fuzzy Logic Model for the Analysis of Ultrasonic Vibration Assisted Turning and Conventional Turning of Ti-Based Alloy. Materials 2021, 14, 6572. [Google Scholar] [CrossRef]
  22. Riaz, A.A.; Muhammad, R.; Ullah, N.; Hussain, G.; Alkahtani, M.; Akram, W. Fuzzy Logic-Based Prediction of Drilling-Induced Temperatures at Varying Cutting Conditions along with Analysis of Chips Morphology and Burrs Formation. Metals 2021, 11, 277. [Google Scholar] [CrossRef]
  23. Muthuram, N.; Frank, F.C. Optimization of machining parameters using artificial Intelligence techniques. Mater. Today Proc. 2021, 46, 8097–8102. [Google Scholar] [CrossRef]
  24. Shivakoti, I.; Kibria, G.; Pradhan, P.M.; Pradhan, B.B.; Sharma, A. ANFIS based prediction and parametric analysis during turning operation of stainless steel 202. Mater. Manuf. Process. 2019, 34, 112–121. [Google Scholar] [CrossRef]
  25. Sofuoglu, M.A.; Orak, S. Prediction of stable cutting depths in turning operation using soft computing methods. Appl. Soft Comput. 2016, 38, 907–921. [Google Scholar] [CrossRef]
  26. Sada, S.O.; Ikpeseni, S.C. Evaluation of ANN and ANFIS modeling ability in the prediction of AISI 1050 steel machining performance. Heliyon 2021, 7, e06136. [Google Scholar] [CrossRef]
  27. Gopal, M. The Effect of Machining Parameters and Optimization of Temperature Rise in Turning Operation of Aluminium-6061 Using RSM and Artificial Neural Network. Period. Polytech. Mech. Eng. 2021, 65, 141–150. [Google Scholar] [CrossRef]
  28. Chiu, H.W.; Lee, C.H. Intelligent Machining System Based on CNC Controller Parameter Selection and Optimization. IEEE Access 2020, 8, 51062–51070. [Google Scholar] [CrossRef]
  29. Kennametal. KCUX. NPR/L. Available online: https://www.kennametal.com/us/en/products/fam.kcux-nprl.100002164.html?pdpQuery=KCU10:relevance:obsoleteFacet:false:allCategoriesKMT:47535256&sort=&pageSize=16&category=undefined (accessed on 2 February 2023).
  30. Thakur, A.; Dewangan, S.; Patnaik, Y.; Gangopadhyay, S. Prediction of Work Hardening during Machining Inconel 825 Using Fuzzy Logic Method. Procedia Mater. Sci. 2014, 5, 2046–2053. [Google Scholar] [CrossRef]
  31. Thakur, A.; Gangopadhyay, S.; Mohanty, A. Investigation on Some Machinability Aspects of Inconel 825 During Dry Turning. Mater. Manuf. Process. 2015, 30, 1026–1034. [Google Scholar] [CrossRef]
  32. Daramola, O.O.; Tlhabadira, I.; Olajide, J.L.; Daniyan, I.A.; Sadiku, E.R.; Masu, L.; VanStaden, L.R. Process Design for Optimal Minimization of Resultant Cutting Force during the Machining of Ti-6Al-4V: Response Surface Method and Desirability Function Analysis. Procedia CIRP 2019, 84, 854–860. [Google Scholar] [CrossRef]
  33. Chen, Z.; Lin Peng, R.; Zhou, J.; M’Saoubi, R.; Gustafsson, D.; Moverare, J. Effect of machining parameters on cutting force and surface integrity when high-speed turning AD 730™ with PCBN tools. Int. J. Adv. Manuf. Technol. 2019, 100, 2601–2615. [Google Scholar] [CrossRef]
  34. Buddaraju, K.M.; Sastry, G.R.K.; Kosaraju, S.; Saxena, K.K. Experimental studies and mathematical modelling of Inconel 600 with CVD coated TiN/TiCN/Al2O3/ZrCN inserts under dry machining Conditions. Indian J. Eng. Mater. Sci. 2022, 29, 385–393. [Google Scholar]
  35. Venkatesan, K.; Manivannan, K.; Devendiran, S.; Mathew, A.T.; Ghazaly, N.M.; Aadhavan; Bennyg, S.M.N. Study of Forces, Surface Finish and Chip Morphology on Machining of Inconel 825. In Proceedings of the 14th Global Congress on Manufacturing and Management (GCMM-2018), Brisbane, QLD, Australia, 5–7 December 2019; pp. 611–618. [Google Scholar]
  36. Thakur, A.; Gangopadhyay, S.; Maity, K.P. Effect of cutting speed and CVD multilayer coating on machinability of Inconel 825. Surf. Eng. 2014, 30, 516–523. [Google Scholar] [CrossRef]
  37. Cagan, S.C.; Buldum, B.B. Machinability investigation of Incoloy 825 in high-speed turning under dry conditions. Mater. -Rio De Jan. 2021, 26, e13066. [Google Scholar] [CrossRef]
  38. Gupta, M.K.; Pruncu, C.I.; Mia, M.; Singh, G.; Singh, S.; Prakash, C.; Sood, P.K.; Gill, H.S. Machinability Investigations of Inconel-800 Super Alloy under Sustainable Cooling Conditions. Materials 2018, 11, 2088. [Google Scholar] [CrossRef]
  39. Vasudevan, H.; Rajguru, R.; Jain, S.; Kaklotar, M.; Desai, J.; Mathur, S. Optimization of Machining Parameters in the Turning Operation of Inconel 825 Using Grey Relation Analysis. In Proceedings of the International Conference on Intelligent Manufacturing and Automation: ICIMA 2018; Springer: Singapore, 2019; pp. 413–424. [Google Scholar]
  40. Venkata Rao, K.; Parimi, S.; Suvarna Raju, L.; Suresh, G. Modelling and optimization of weld bead geometry in robotic gas metal arc-based additive manufacturing using machine learning, finite-element modelling and graph theory and matrix approach. Soft Comput. 2022, 26, 3385–3399. [Google Scholar] [CrossRef]
  41. de Almeida, R.; Goh, Y.M.; Monfared, R.; Steiner, M.T.A.; West, A. An ensemble based on neural networks with random weights for online data stream regression. Soft Comput. 2020, 24, 9835–9855. [Google Scholar] [CrossRef]
  42. Naresh, C.; Bose, P.S.C.; Rao, C.S.P. Artificial neural networks and adaptive neuro-fuzzy models for predicting WEDM machining responses of Nitinol alloy: Comparative study. SN Appl. Sci. 2020, 2, 314. [Google Scholar] [CrossRef]
  43. Ali, S. (Ed.) Introductory Chapter: Which Membership Function is Appropriate in Fuzzy System? In Fuzzy Logic Based in Optimization Methods and Control Systems and Its Applications; IntechOpen: Rijeka, Croatia, 2018; p. Ch. 1. [Google Scholar]
  44. Acayaba, G.M.A.; Escalona, P.M.d. Prediction of surface roughness in low speed turning of AISI316 austenitic stainless steel. CIRP J. Manuf. Sci. Technol. 2015, 11, 62–67. [Google Scholar] [CrossRef]
  45. Ghordoyee Milan, S.; Roozbahani, A.; Arya Azar, N.; Javadi, S. Development of adaptive neuro fuzzy inference system –Evolutionary algorithms hybrid models (ANFIS-EA) for prediction of optimal groundwater exploitation. J. Hydrol. 2021, 598, 126258. [Google Scholar] [CrossRef]
  46. Eberhart, R.; Kennedy, J. A new optimizer using particle swarm theory. In Proceedings of the Sixth International Symposium on Micro Machine and Human Science, Nagoya, Japan, 4–6 October 1995; IEEE: Piscataway, NJ, USA, 2000; pp. 39–43. [Google Scholar]
  47. Heris, M.K. Evolutionary ANFIS Training in MATLAB. Yarpiz 2015. [Google Scholar]
  48. Thamrin, I. Analysis of the effect of the cutting speed on specific cutting energy in turning process. In Proceedings of the Sriwijaya international Conference on Science, Engineering, and Technology, Palembang, Indonesia, 25–26 October 2019. [Google Scholar]
Figure 1. Experiment schematic representation and setup.
Metals 13 00375 g001
Figure 2. Input parameters effect on (a) RF, (b) MRR, and (c) SCE.
Metals 13 00375 g002aMetals 13 00375 g002b
Figure 3. Artificial neural network multi-layer perceptron model.
Metals 13 00375 g003
Figure 4. Neural network training and validating graph.
Metals 13 00375 g004
Figure 5. ANFIS model.
Metals 13 00375 g005
Figure 6. Model efficiency of the ANFIS model for (a) RF, (b) MRR and (c) SCE.
Metals 13 00375 g006aMetals 13 00375 g006b
Figure 7. ANFIS-PSO framework.
Metals 13 00375 g007
Table 1. Physical, mechanical, and chemical properties for 825 alloys.
PropertiesValues
Poisson’s ratio0.29–0.34
Density (gm/cm3)8.14
Yield strength (MPa)310
Hardness Brinell (HB)190–240
Elongation (%)45
Tensile strength (MPa)690
Melting point °C1370–1400
Table 2. Levels and control factors.
Factors Level 1Level 2Level 3Level 4
Cutting speed, V, m/min457095120
Feed rate, F, mm/rev0.110.220.330.44
Depth of cut, D, mm0.150.30.450.6
Table 3. Taguchi orthogonal experimental array.
Exp. No.V m/minF mm/revD mmFc
N
Ft
N
Resultant Force NMRR
mm3/min
SCE
N/mm2
1450.110.15258173310.63742.5015.64
2450.220.3265184322.6229704.02
3450.330.45290200352.286682.501.95
4450.440.6317212381.3611,8801.20
5700.110.3256215334.3123107.76
6700.220.15278198341.3023108.42
7700.330.6310212375.5513,8601.57
8700.440.45319225390.3713,8601.61
9950.110.45323209384.724702.506.53
10950.220.6300199360.0012,5402.27
11950.330.15311219380.374702.506.28
12950.440.3321231395.4812,5402.43
131200.110.6293219365.8079204.44
141200.220.45305227380.2111,8803.08
151200.330.3317230391.6511,8803.20
161200.440.15323238401.2179204.89
Table 4. ANOVA for response parameters.
Resultant Force ANOVA
FactorsDFSeq SSAdj SSAdj MSF-Valuep-ValueContribution
Cutting speed34676.94676.91558.9516.90.00241.66%
Feed rate35108.65108.61702.8718.460.00245.52%
Depth of cut3885.1885.1295.053.20.1057.89%
Residual error6553.4553.492.23--4.93%
Total1511,224----100.00%
Fitness statisticsR2 = 0.95Adjusted R2 = 0.88
Metal removal rate ANOVA
FactorsDFSeq SSAdj SSAdj MSF-Valuep-ValueContribution
Cutting speed339,625,98839,625,98813,208,6632.490.15812.33%
Feed rate3124,894,688124,894,68841,631,5637.850.01738.88%
Depth of cut3124,894,688124,894,68841,631,5637.850.01738.88%
Residual error631,839,63831,839,6385,306,606--9.91%
Total15321,255,000----100.00%
Fitness statisticsR2 = 0.9Adjusted R2 = 0.75
Specific cutting energy ANOVA
FactorsDFSeq SSAdj SSAdj MSF-Valuep-ValueContribution
Cutting speed317,026,06917,026,0695,675,3561.210.3843.44%
Feed rate32.13 × 1082.13 × 10870,922,81015.10.00343.05%
Depth of cut32.36 × 1082.36 × 10878,785,71616.770.00347.81%
Residual error628,185,70428,185,7044,697,617--5.70%
Total154.94 × 108----100.00%
Fitness statisticsR2 = 0.94Adjusted R2 = 0.86
Table 5. Decision-making matrix Step 1: Final input table.
Process ParametersBeneficialNon Beneficial
Speed m/minFeed mm/revDepth mmMetal Removal Rate mm3/minResultant Force NSpecific Cutting Energy N/mm2
Weights---0.50.150.35
Min450.110.15477310.63112.07
Max1200.440.68910401.211459.39
Table 6. CODAS optimization of Inconel 825 alloy turning.
Exp. (i|j)Weight Criteria0.150.50.35EiTiAssessment Score
NormalizationWeight Normalization
RF
N
MRR mm3/minSCE N/mm2RF
N
MRR mm3/minSCE N/mm2HiRank
11.0000.0540.0770.1500.0270.0270.0340.034−4.12216
20.9630.2140.2990.1440.1070.1040.1150.186−2.83813
30.8820.4820.6150.1320.2410.2150.2860.419−0.1248
40.8150.8571.0000.1220.4290.3500.5160.7313.5683
50.9290.1670.1550.1390.0830.0540.0670.107−3.60214
60.9100.1670.1430.1370.0830.0500.0640.100−3.64214
70.8271.0000.7640.1240.5000.2680.5310.7223.8131
80.7961.0000.7450.1190.5000.2610.5280.7103.7642
90.8070.3390.1840.1210.1700.0640.1480.185−2.32012
100.8630.9050.5290.1290.4520.1850.4540.5972.5754
110.8170.3390.1910.1220.1700.0670.1480.189−2.30911
120.7850.9050.4940.1180.4520.1730.4500.5732.5065
130.8490.5710.2700.1270.2860.0950.2680.338−0.4109
140.8170.8570.3900.1230.4290.1360.4160.5181.9686
150.7930.8570.3750.1190.4290.1310.4150.5091.9467
160.7740.5710.2450.1160.2860.0860.2660.318−0.44610
Negative ideal solution0.1160.0270.027----
Table 7. Fuzzy inference system layering equations.
Layer NumberEquationLayer NumberEquation
1 y i 1 =   x i 1 4 y i 4 = μ i i = 1 n μ i = μ ¯ ,   i = 1 ,   n
2 y i 2 = 1 1 + x i 2 a i c i 2 b i 5yi(5) = xi(5) [ki + kix1 + kix2] =   µ ¯ [ki0 + ki1x1 + ki2x2]
3 y i 3 = i = μ A j x x μ B j y = μ i 6 y = i = 1 n   µ ¯ k i + k i x 1 + k i x 2
Membership function equationsTriangular = m a x m i n x a b a , c x c b , 0
Trapezoidal = m a x m i n x a b a , 1 , d x d c , 0
Gaussian = e x c 2 2 σ 2
Bell-shaped = 1 1 + x c a 2 b
Sigmodal = 1 1 + e a k x c k
Table 8. Experimental and predicted error values of ANN, ANFIS, and regression models for all response.
Exp. No.Resultant Force, NMetal Removal Rate, mm3/minSpecific Cutting Energy, N/mm2
RealANNANFISRealANNANFISRealANNANFIS
737639336513,86012,41813,8591.5661.6891.326
1438038038011,88012,02311,8793.0813.3282.968
Avg. RE%2.321.49 5.810.0003 7.979.46
RMSE%3.162.098.380.00037.808.70
MAE%2.261.506.490.00037.408.19
MAPE%2.331.495.810.00037.979.46
Table 9. Parameters of PSO.
No.ParametersValue
1Population size100
2Epoch50
2Inertia weight1
3Inertia weight damping ratio0.99
4No. of iterations 1000
5Number of variables 3
6Personal learning coefficient (C1)1
7Global learning coefficient (C2)2
8Lower range45 m/min,
0.11 mm/rev,
0.15 mm
9Upper range120 m/min,
0.44 mm/rev,
0.6 mm
Table 10. Optimum parameters by ANFIS-PSO.
ResponseSpeed
m/min
Feed mm/revDepth
mm
PredictedActual% RE
Resultant force 820.110.15242N/A
MRR 1010.430.5424,145N/A
SCE450.440.61.201.200
Disclaimer/Publisher’s Note: The statements, opinions and data contained in all publications are solely those of the individual author(s) and contributor(s) and not of MDPI and/or the editor(s). MDPI and/or the editor(s) disclaim responsibility for any injury to people or property resulting from any ideas, methods, instructions or products referred to in the content.

