
Overlapping Pellet Size Detection Method Based on Marker Watershed and GMM Image Segmentation


Abstract
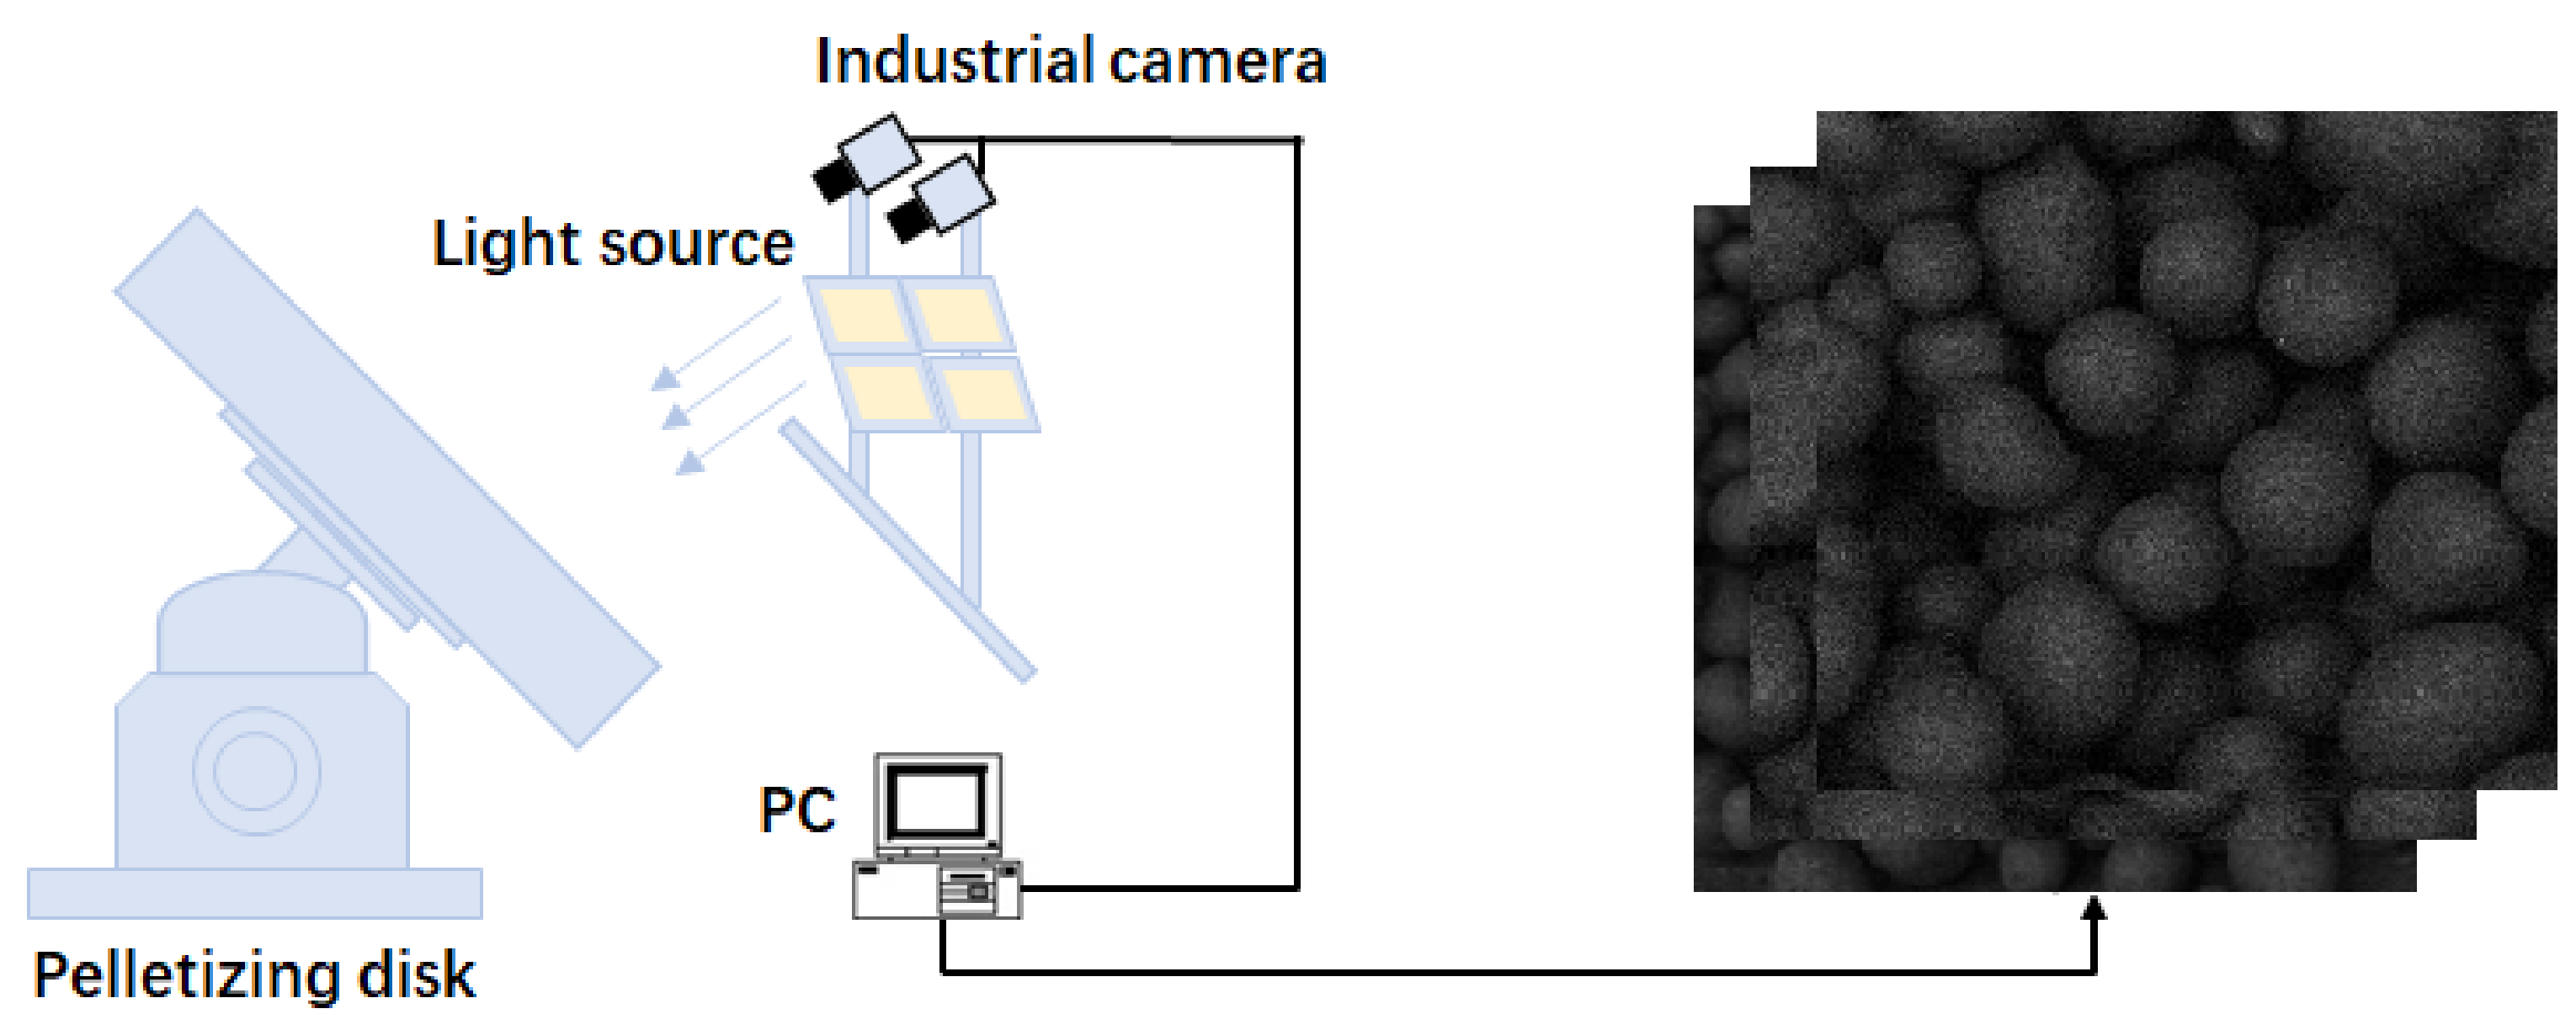
:1. Introduction
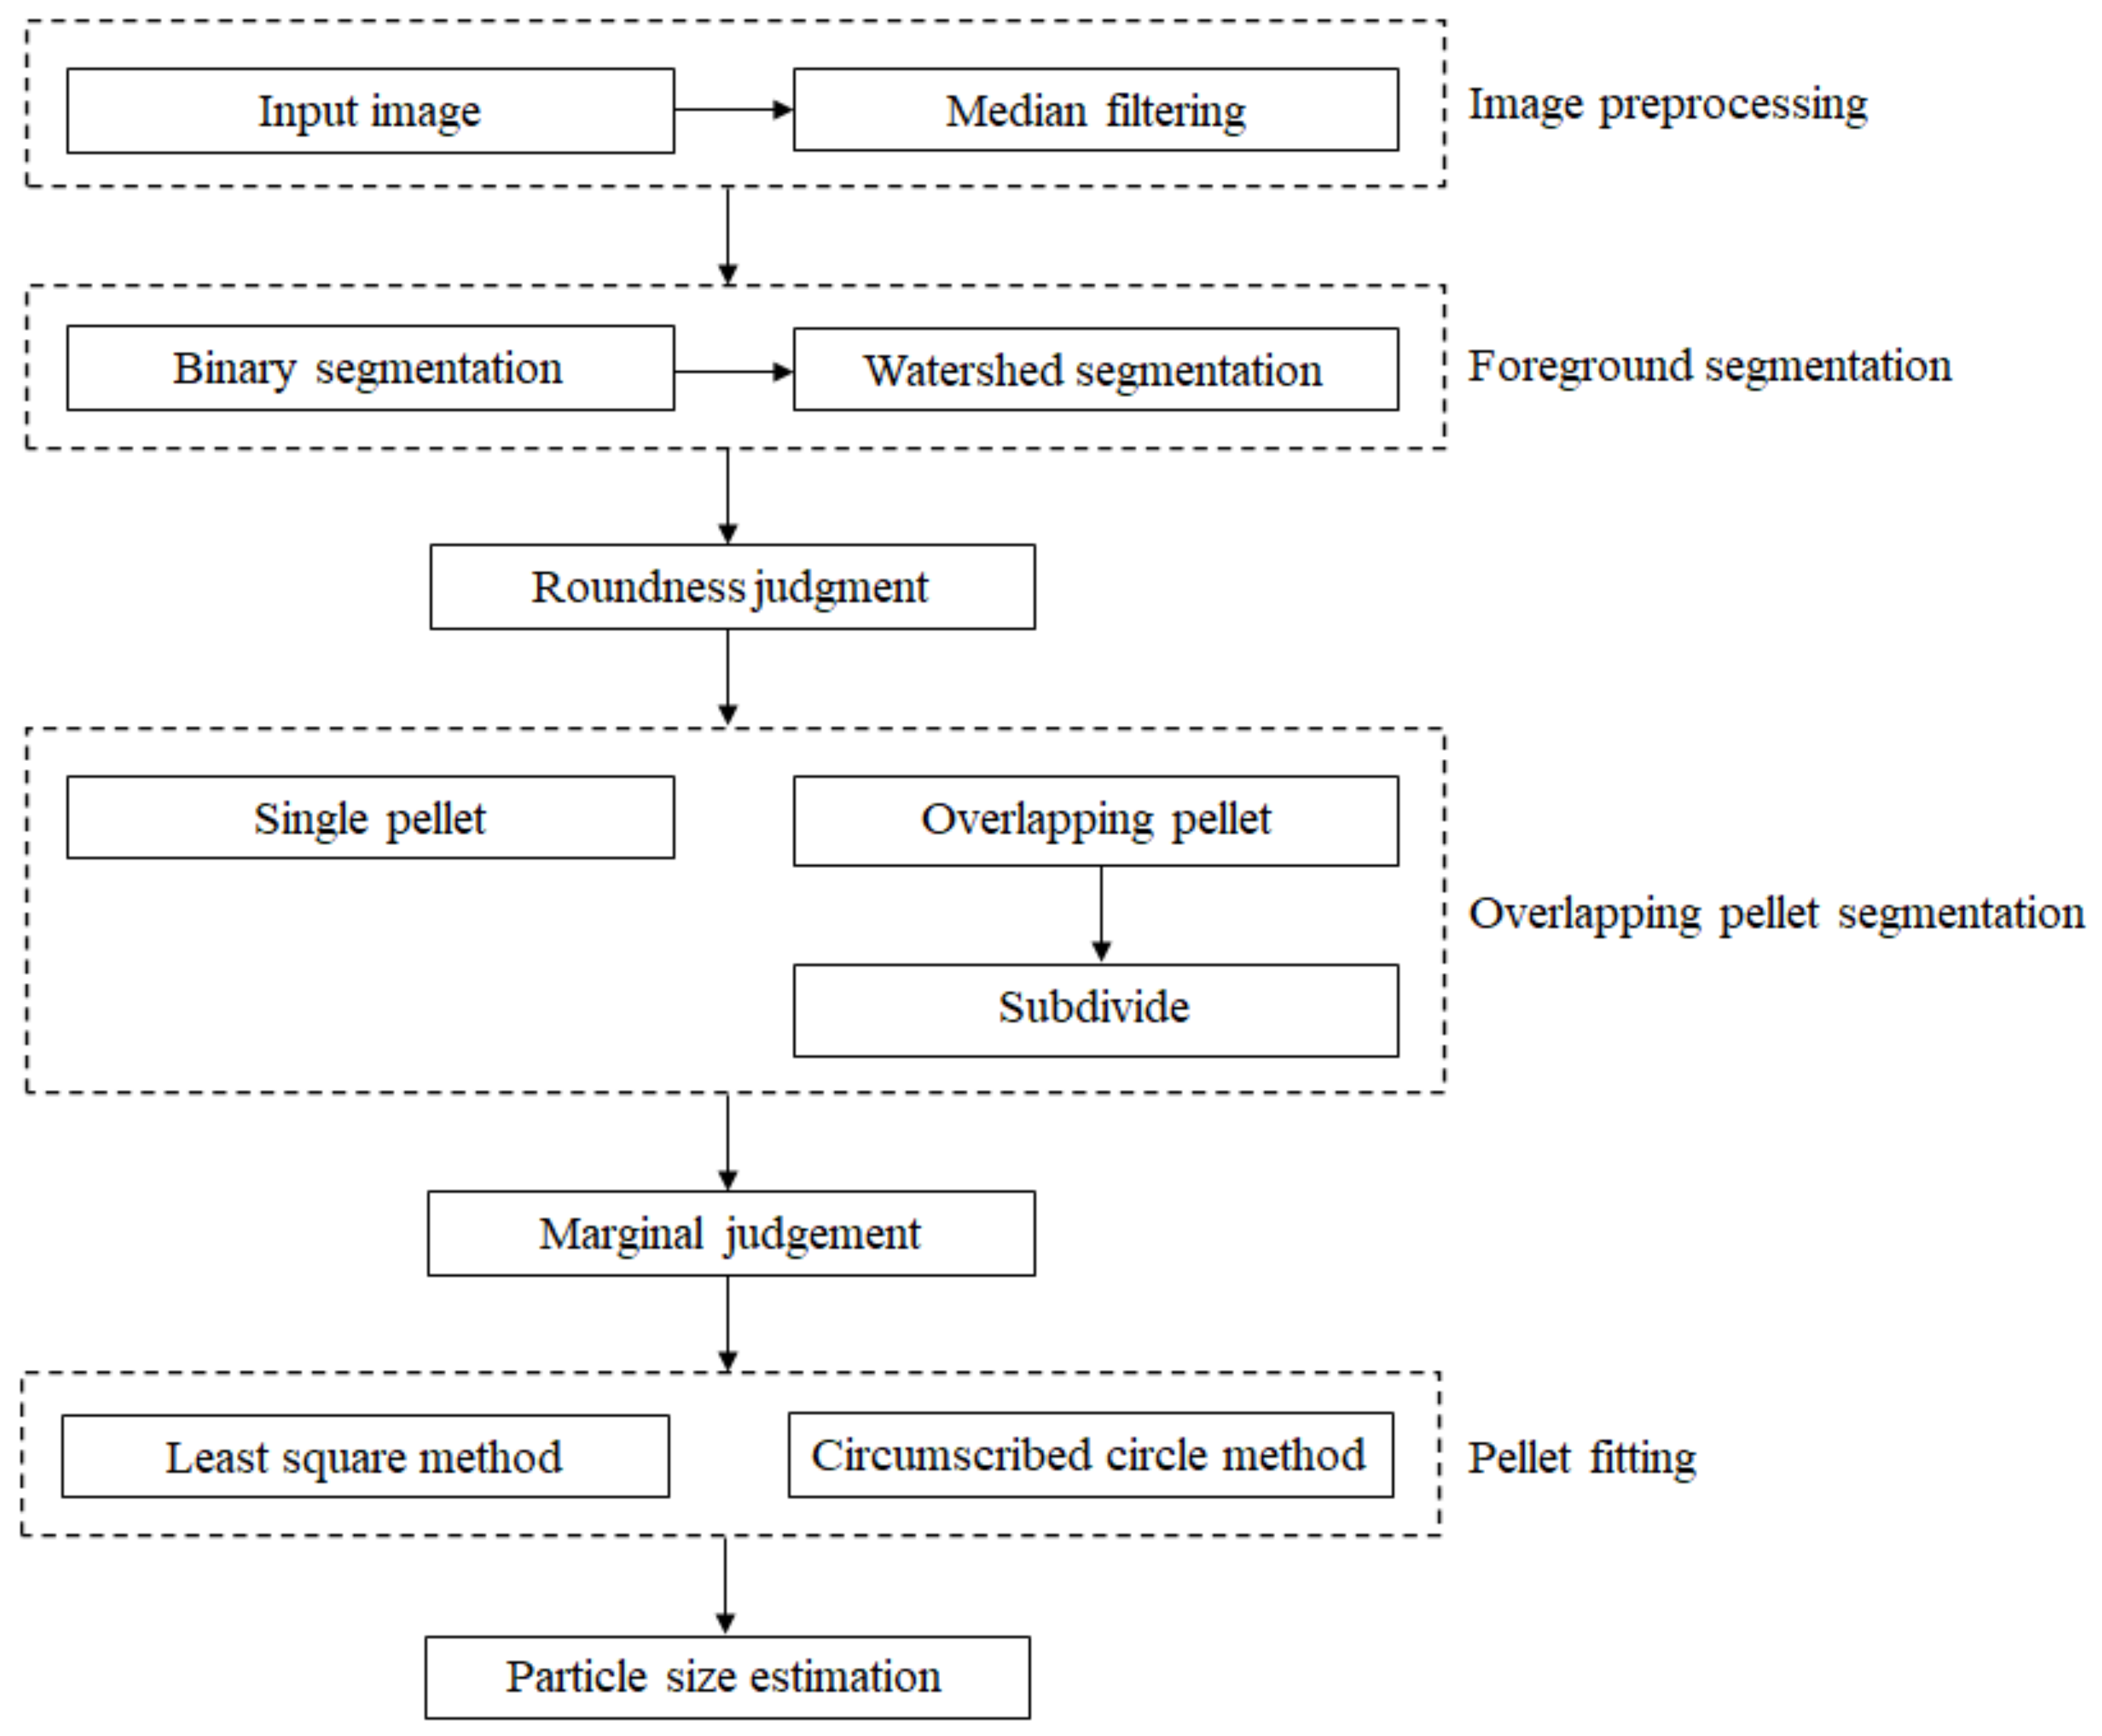
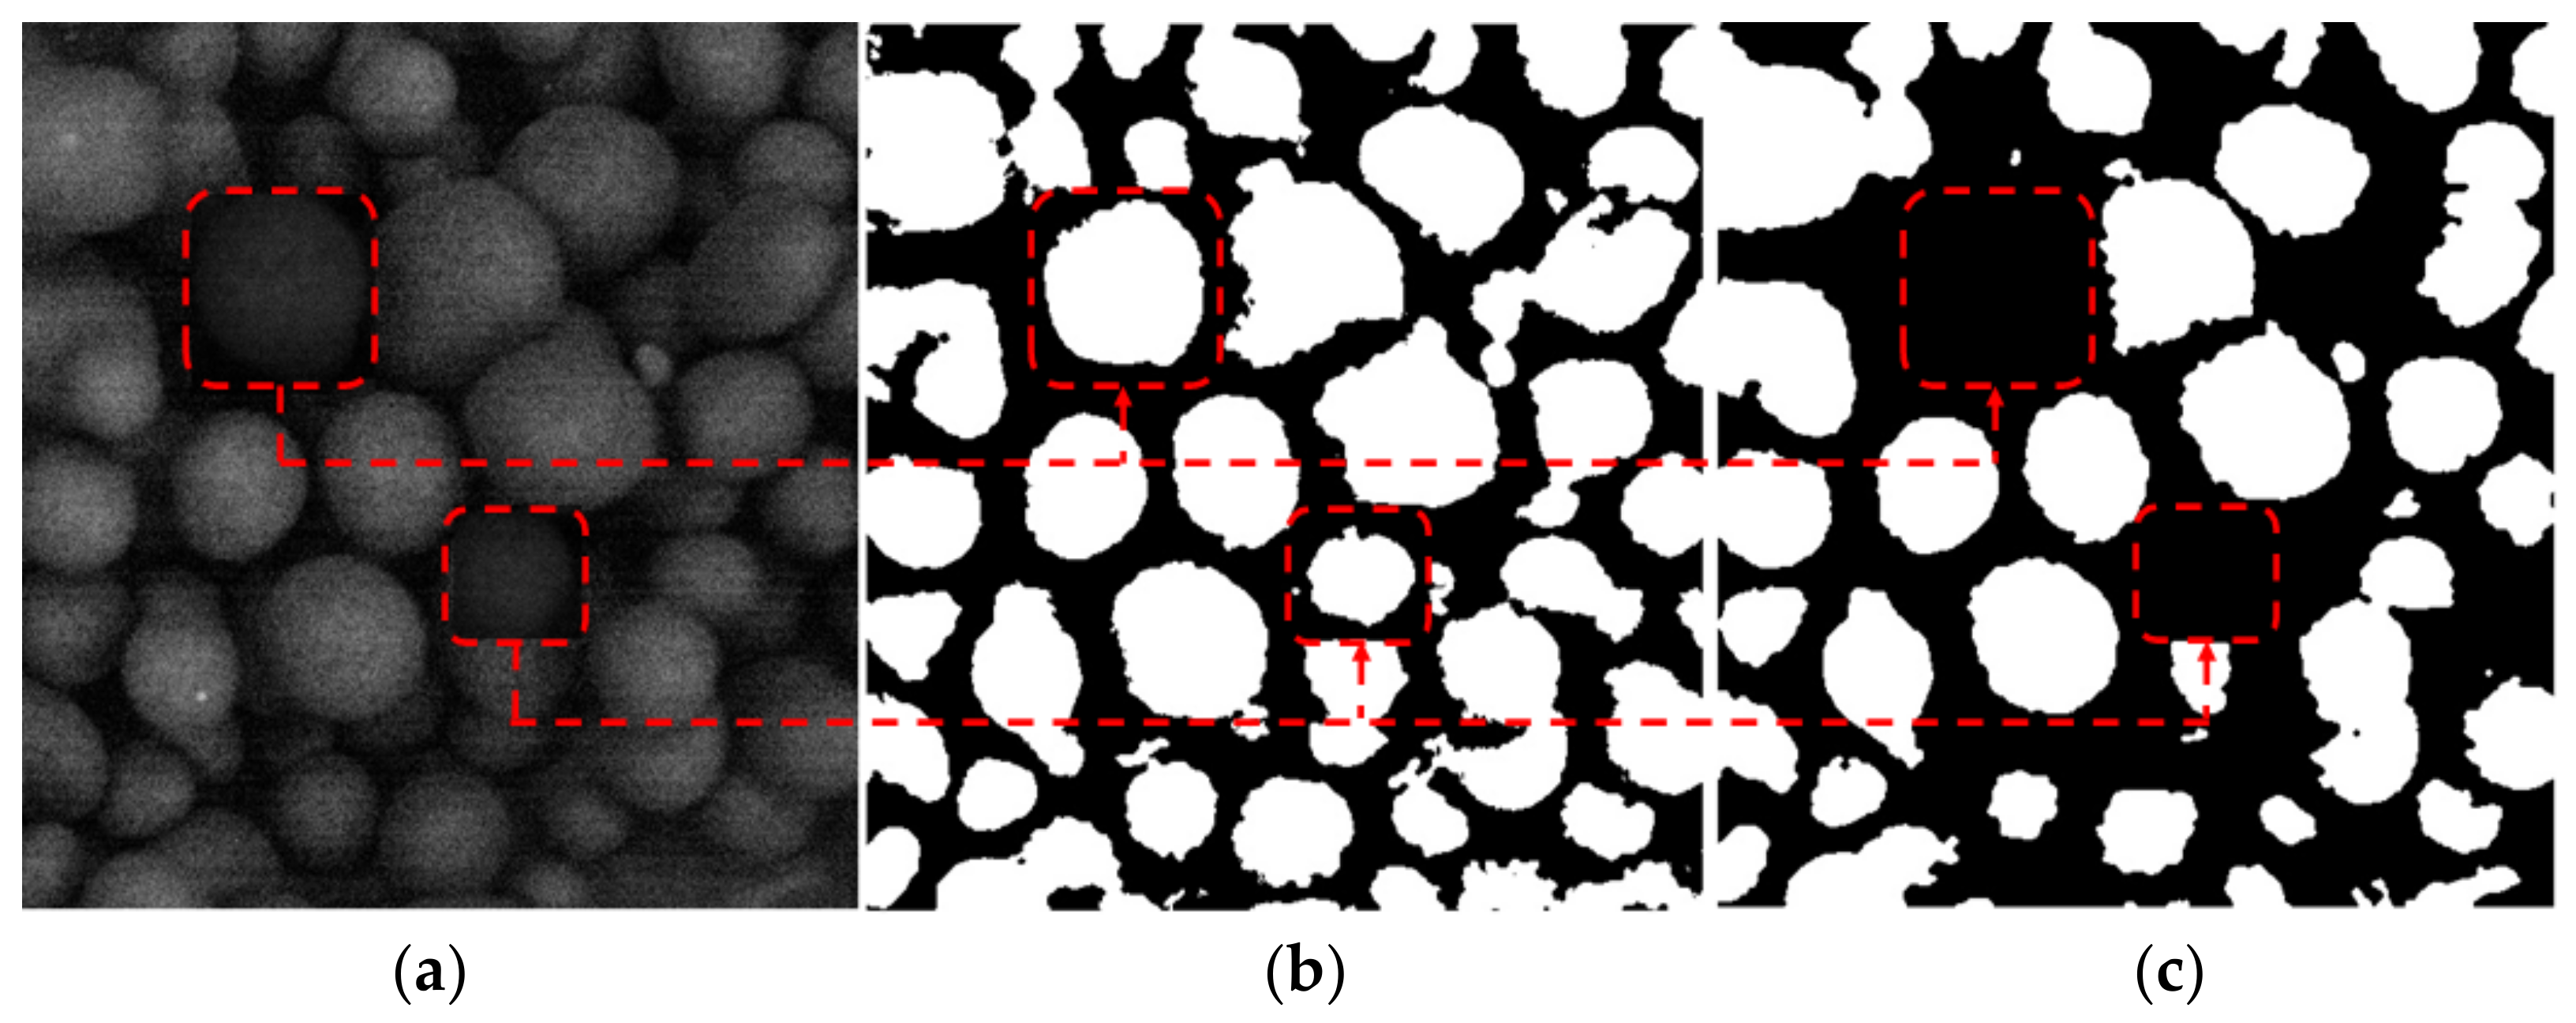
- The adaptive binary segmentation method is used to segment the foreground area and the background area, which overcomes the traditional global threshold binary segmentation that is susceptible to light brightness and light unevenness factors, and it ensures the anti-interference under different lighting environments.
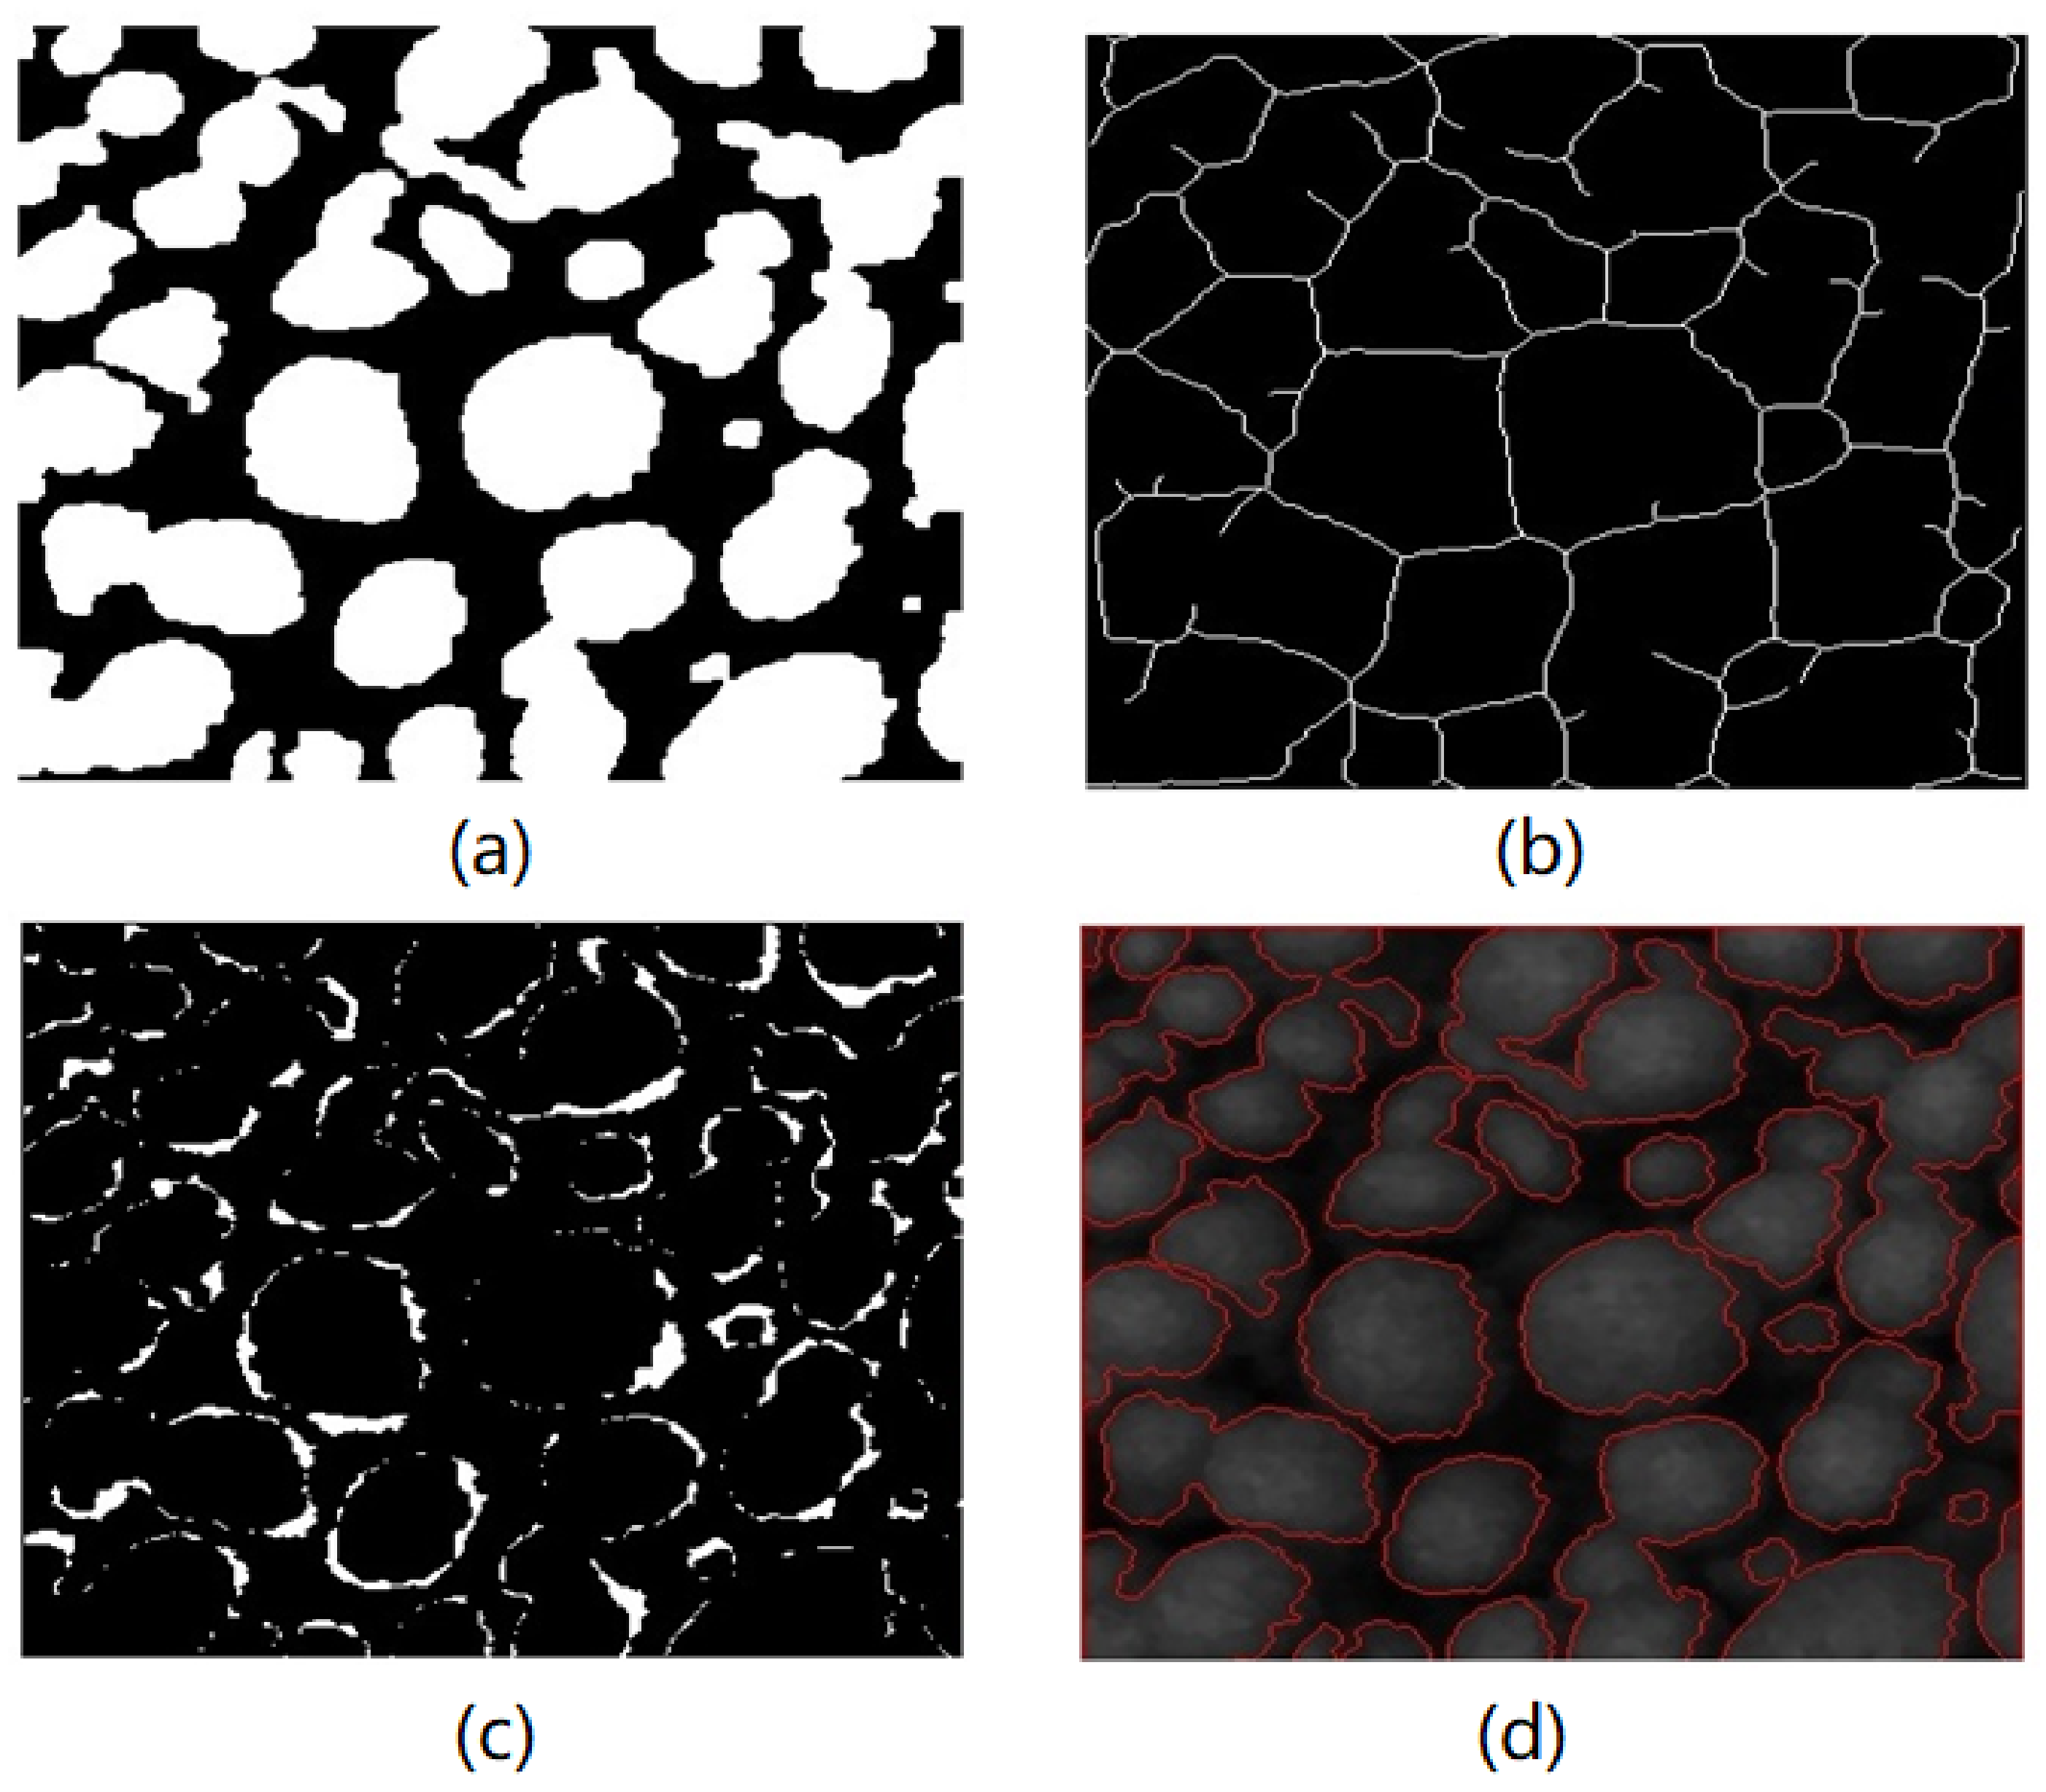
- Further subdivision of the foreground and background areas using morphological operations and marker watershed segmentation can effectively compensate for the disadvantages created by the imprecise foreground and background edges obtained using binary segmentation, and it can improve the accuracy of segmentation.
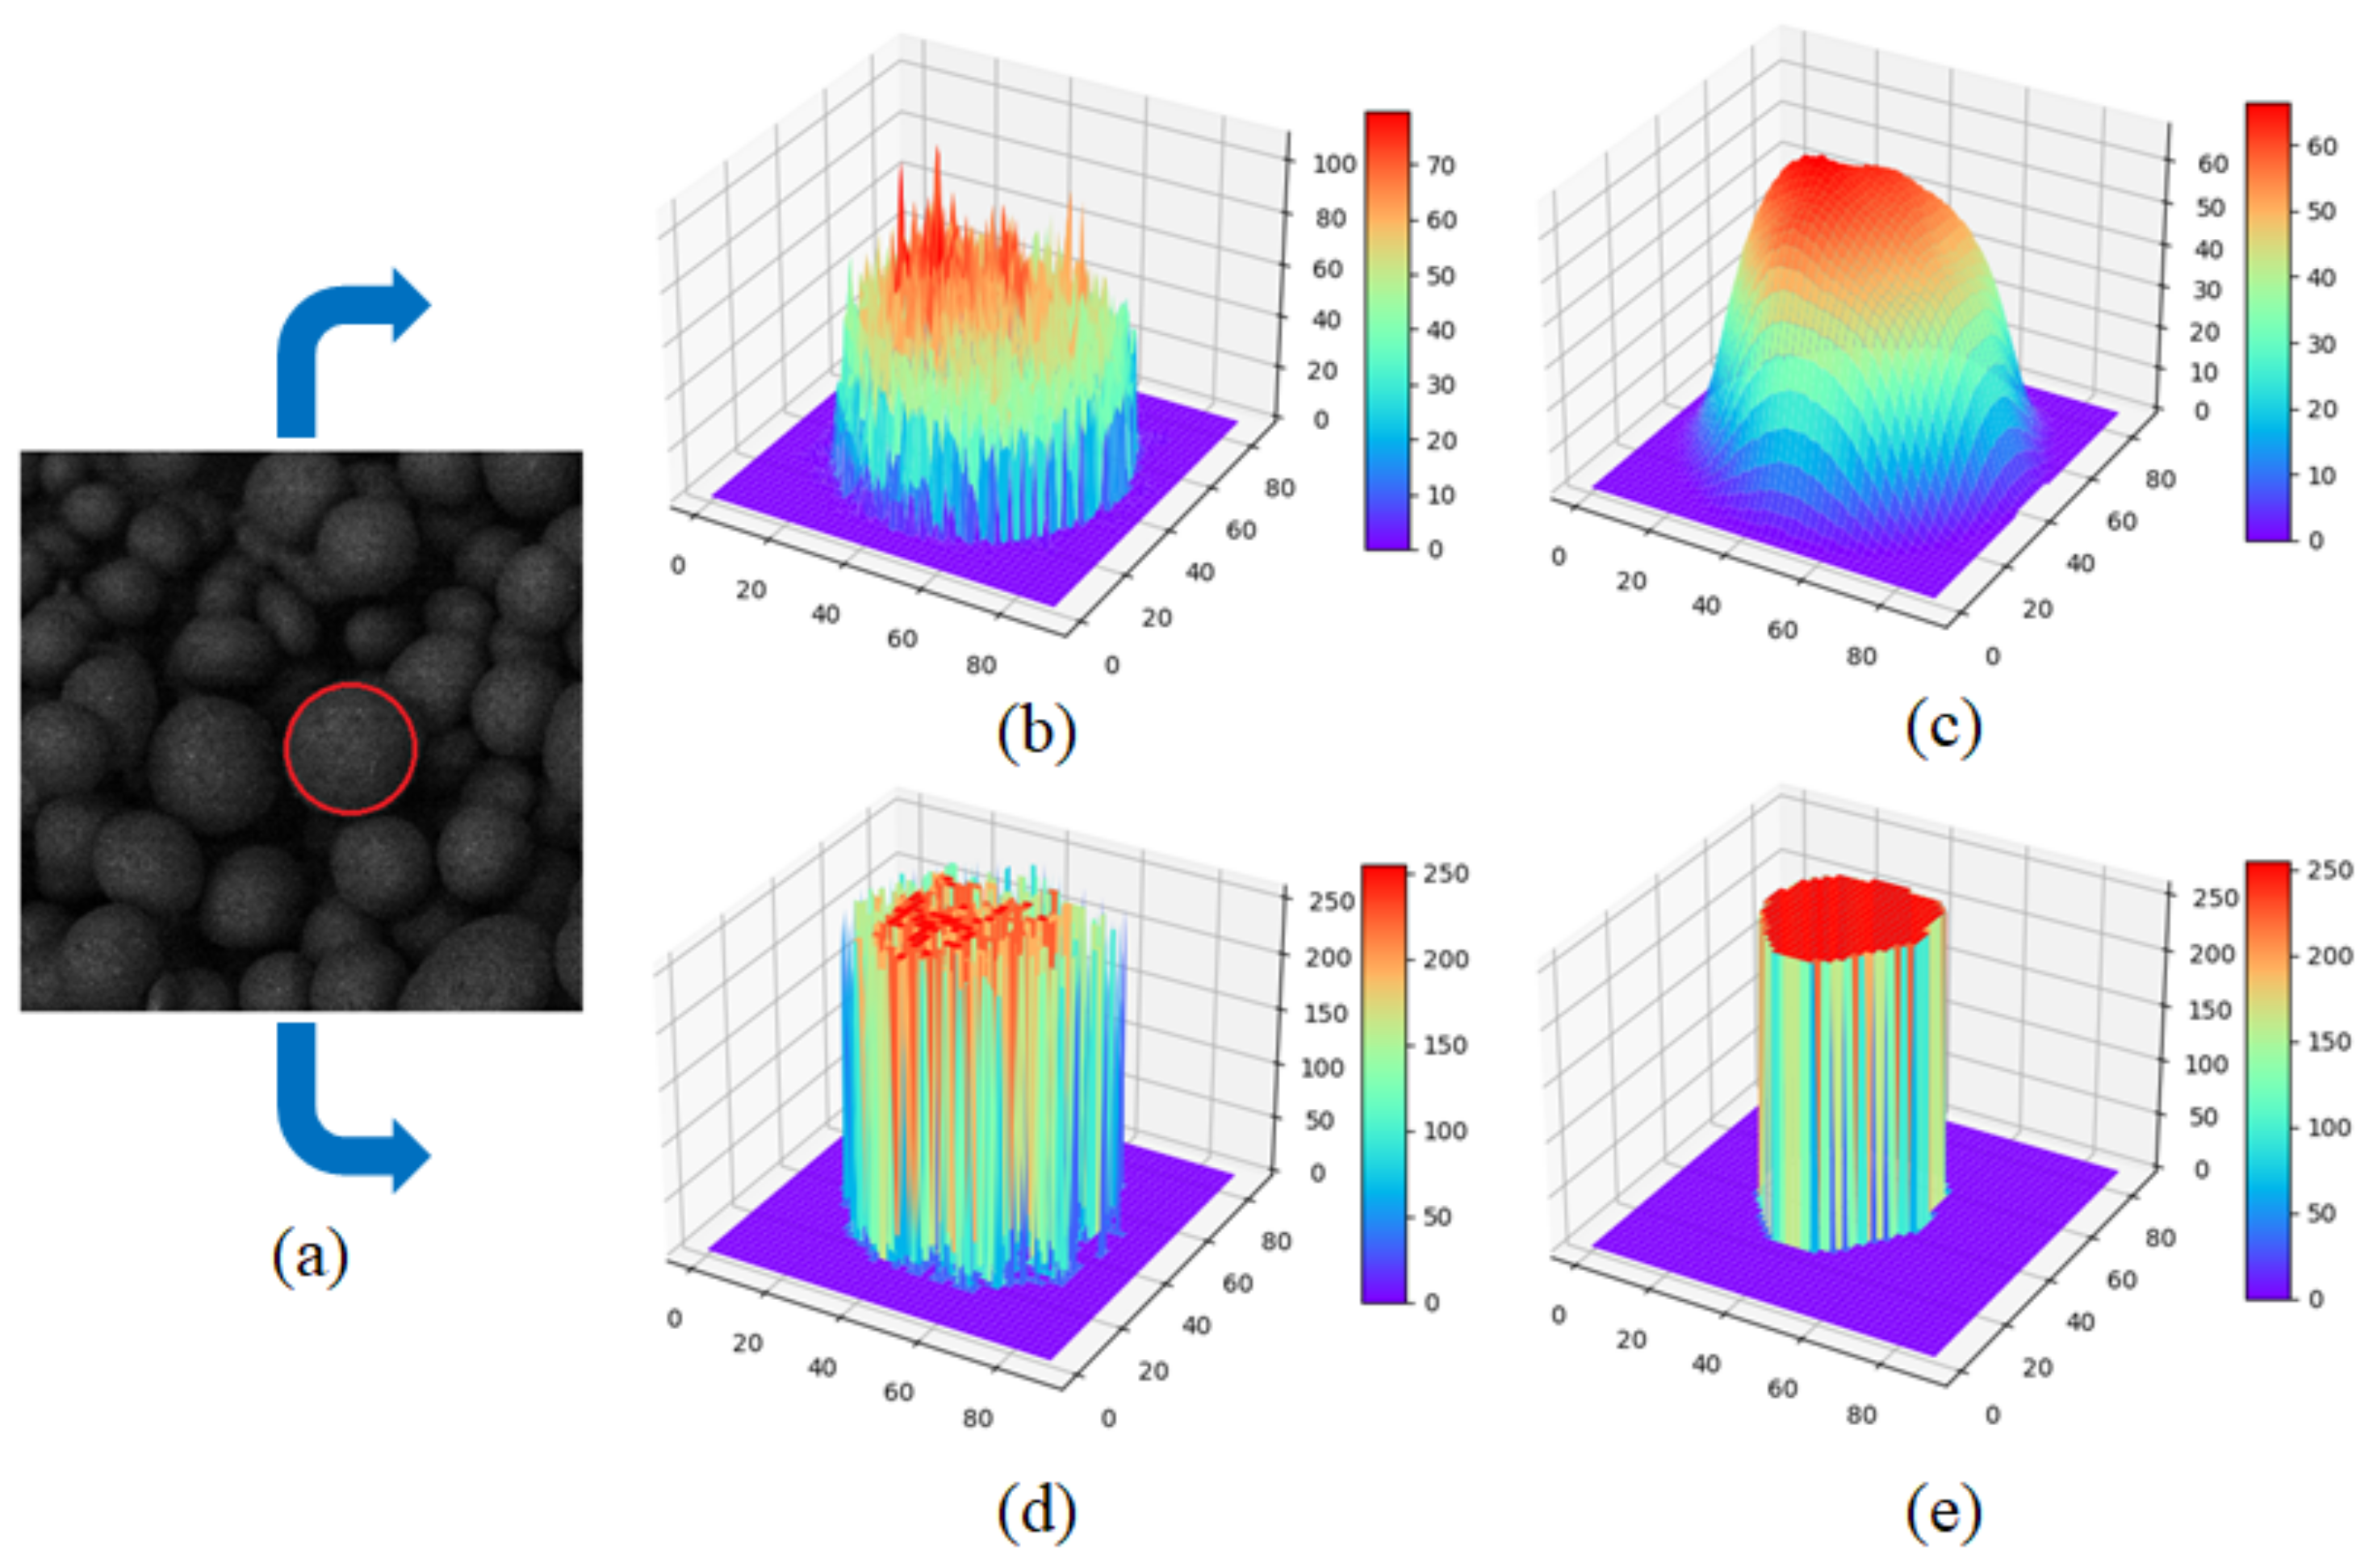
- A model of binary image segmentation based on a Gaussian mixture model is established where the binary image of the overlapping pellets is used as a template and its corresponding grayscale image is extracted, a Gaussian reconstruction is performed on the extracted grayscale image, and the number of clusters and the initial value of the center are calculated by the reconstructed grayscale map. Then, the coordinates of each pixel of the binary image are used as samples, and the initial value and the samples are brought into the hybrid Gaussian model, which can realize the pixel-level segmentation of the binary image of the pellets.
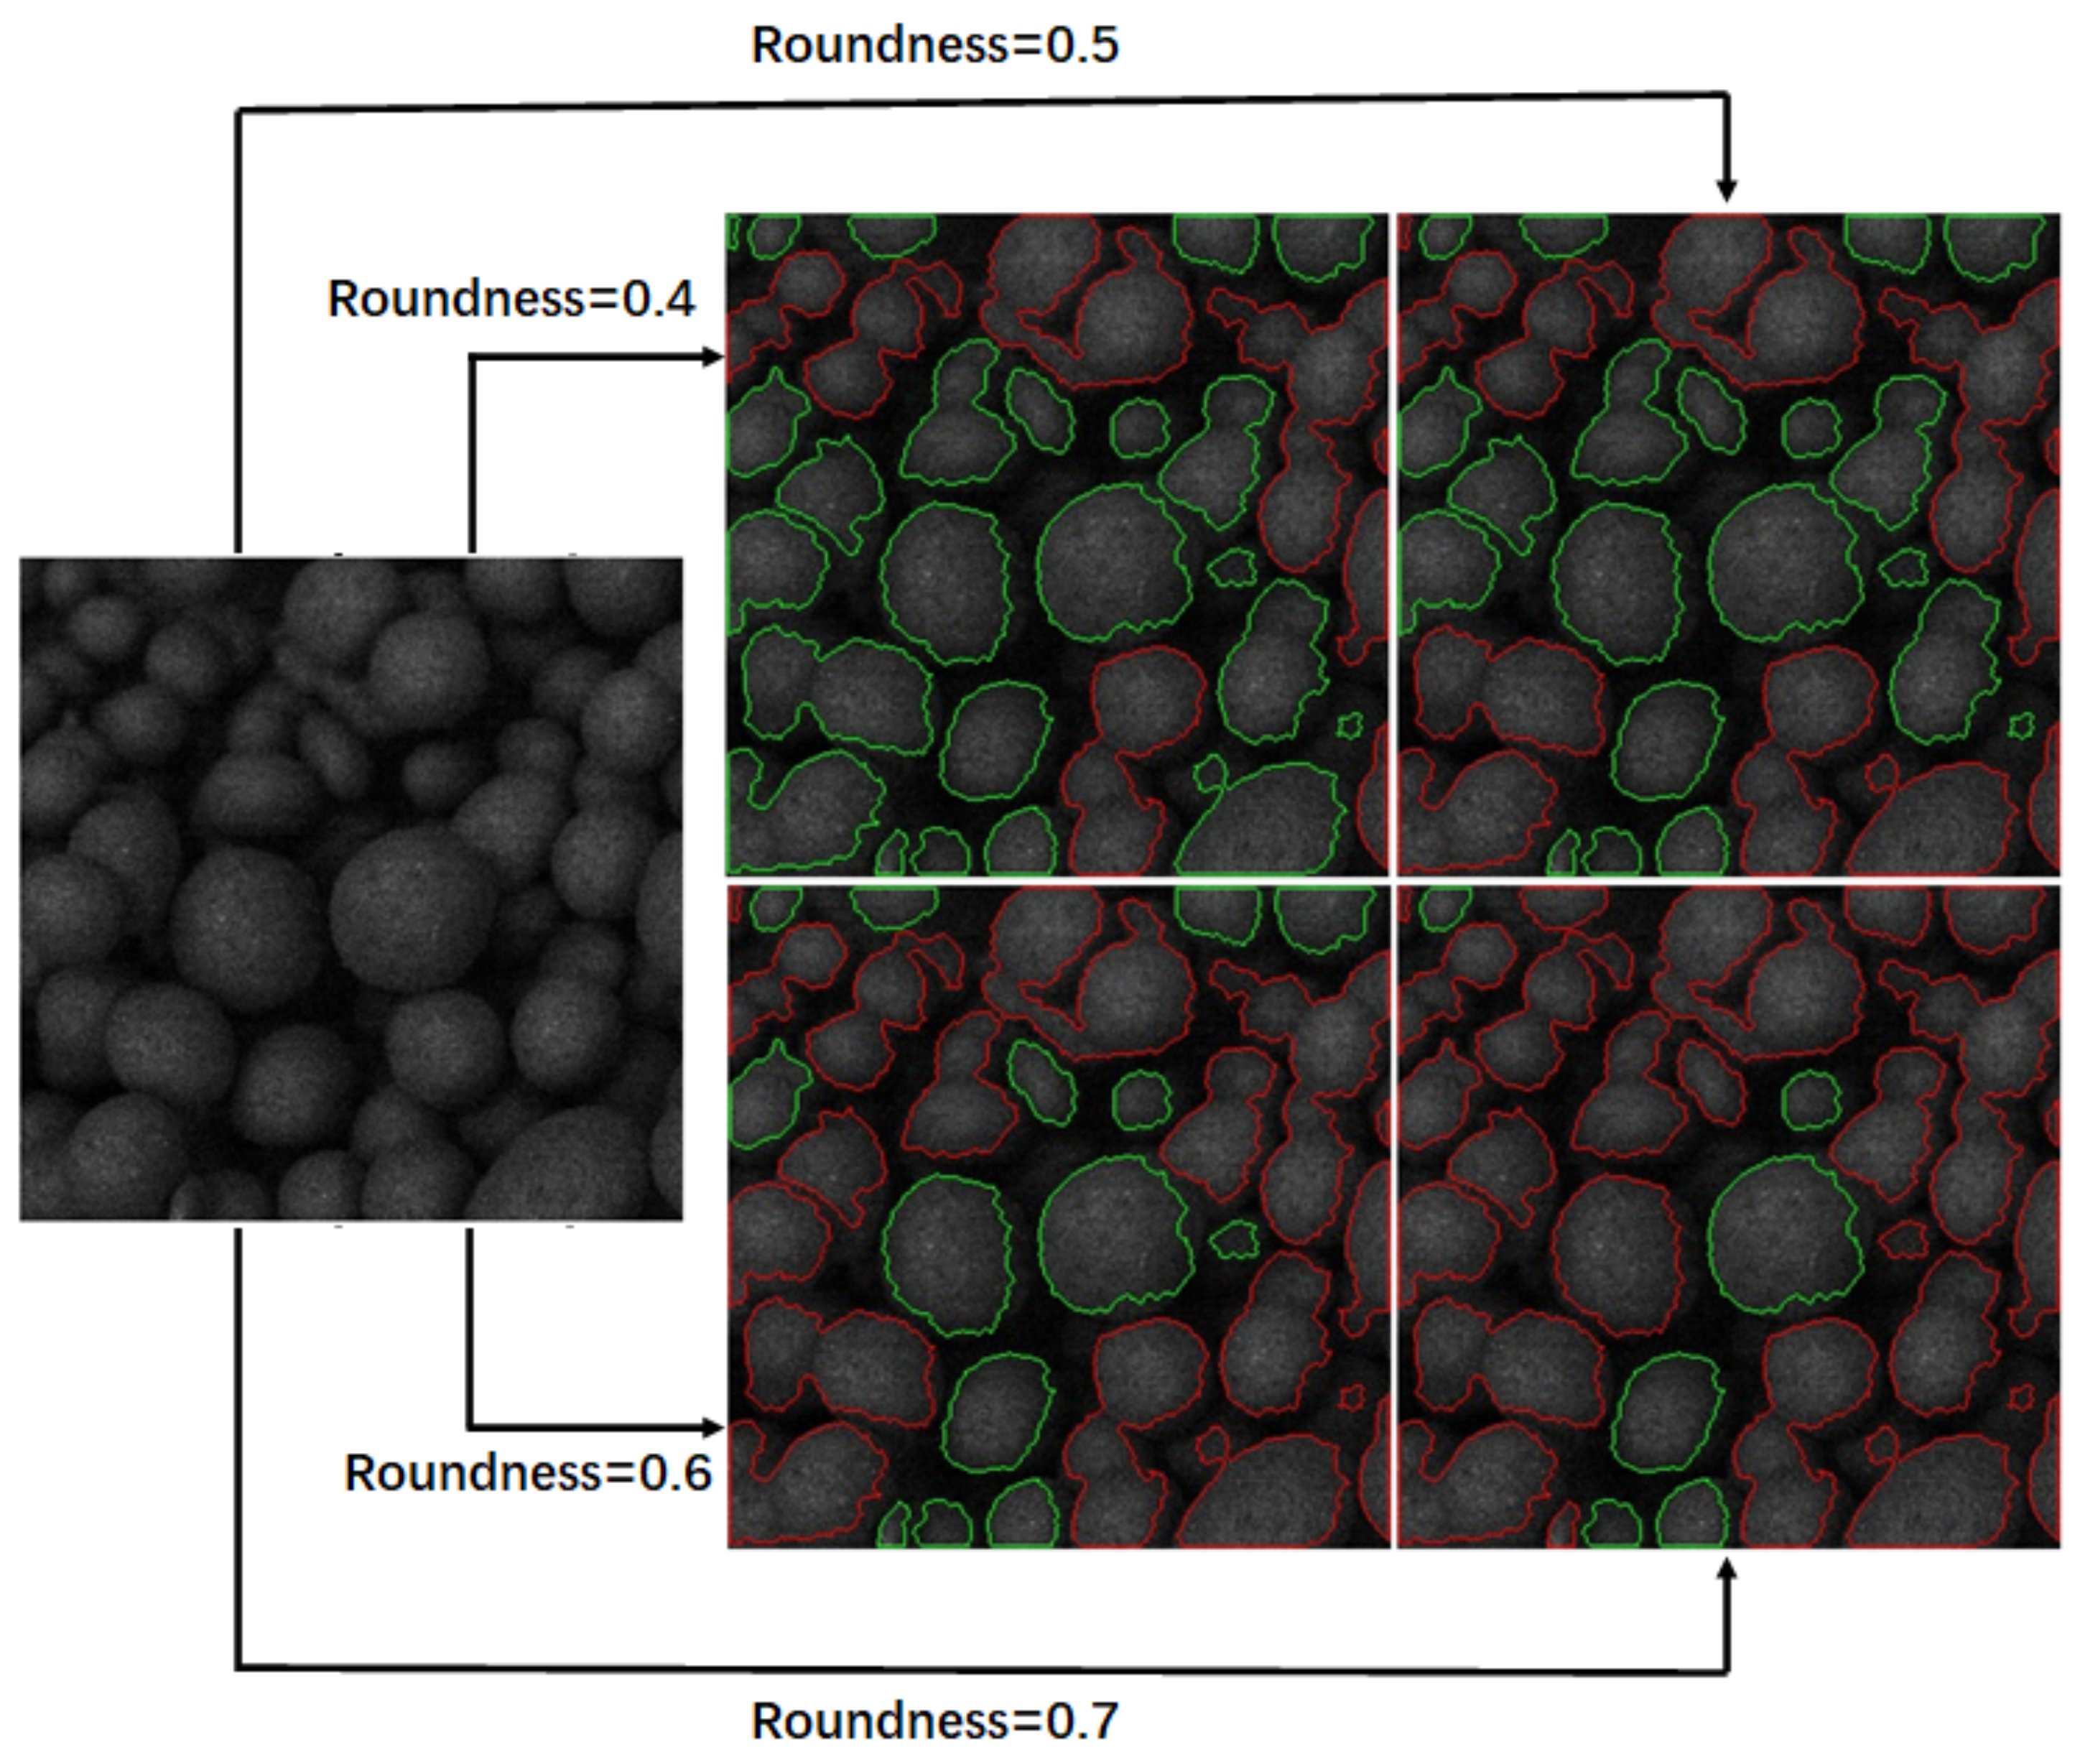
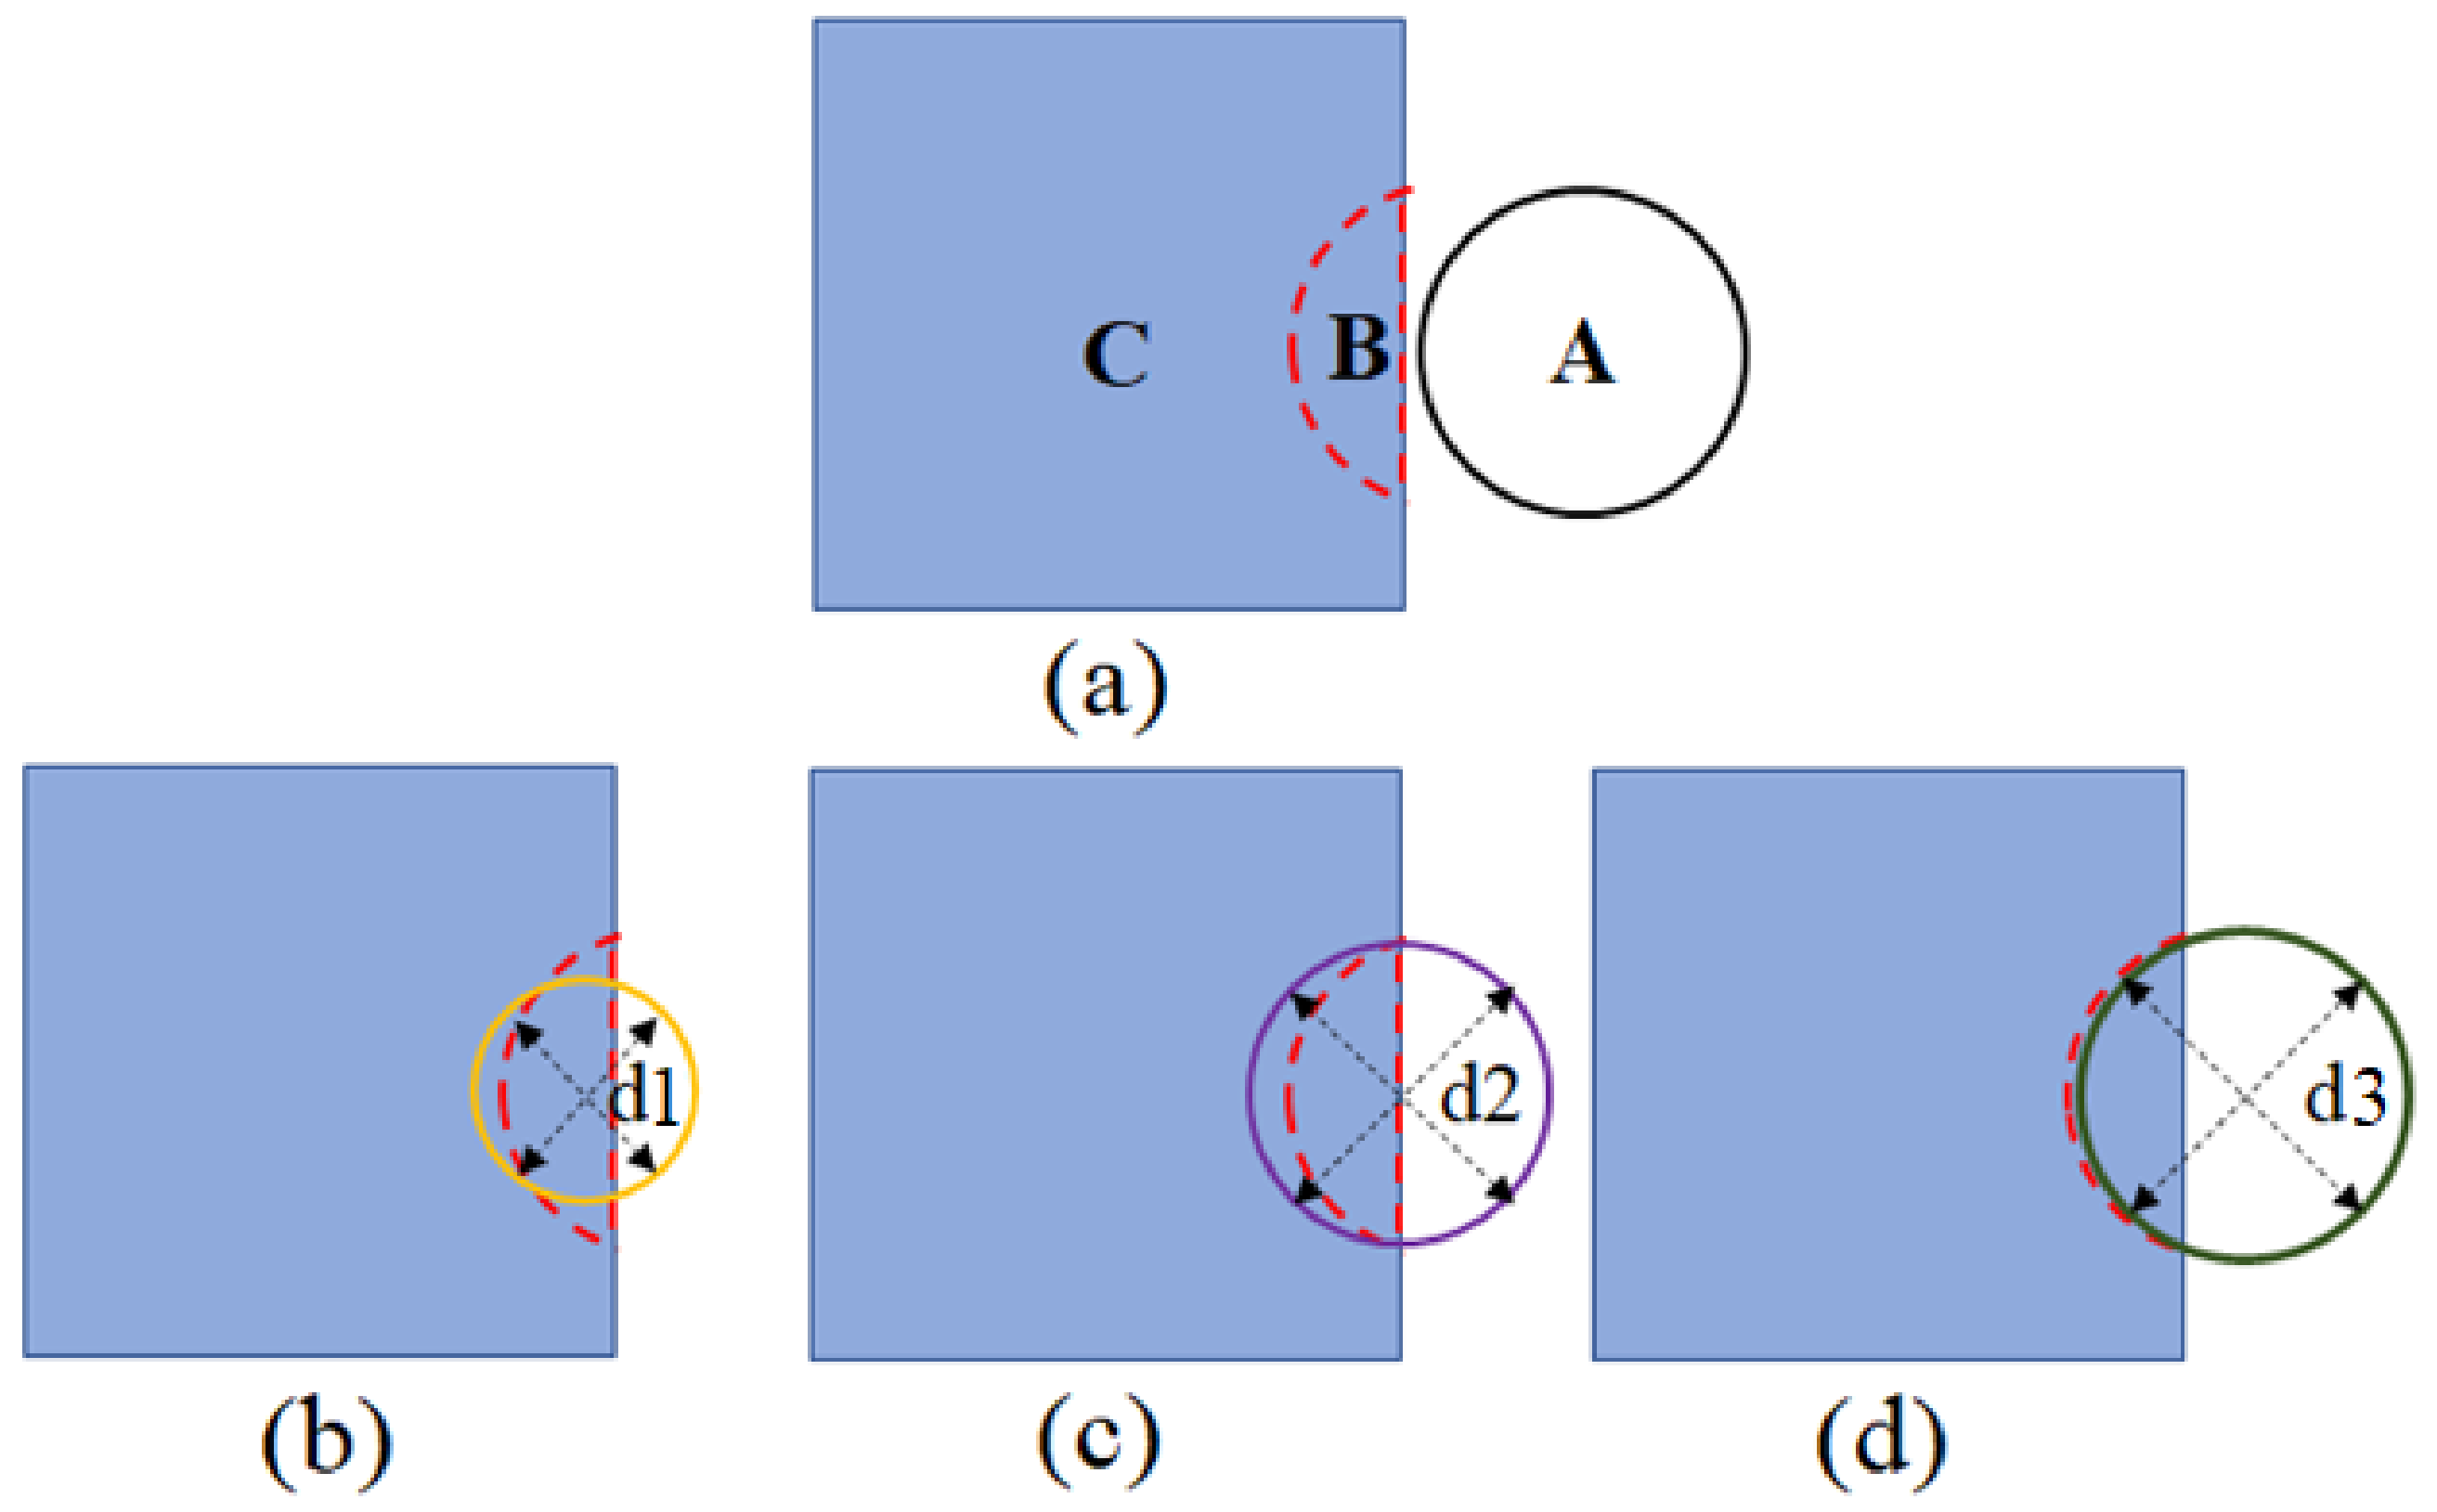
- A method is proposed for the size estimation of the edges of incomplete pellets, and the least squares method is used to fit the circle to estimate the number of pellets in the edge area, which can effectively overcome the disadvantage of the small sizes of the pellets estimated by the circumscribed circles.
2. Algorithm Principle
2.1. Foreground Segmentation
2.1.1. Median Filtering
2.1.2. Binary Segmentation
2.2. Foreground Refinement
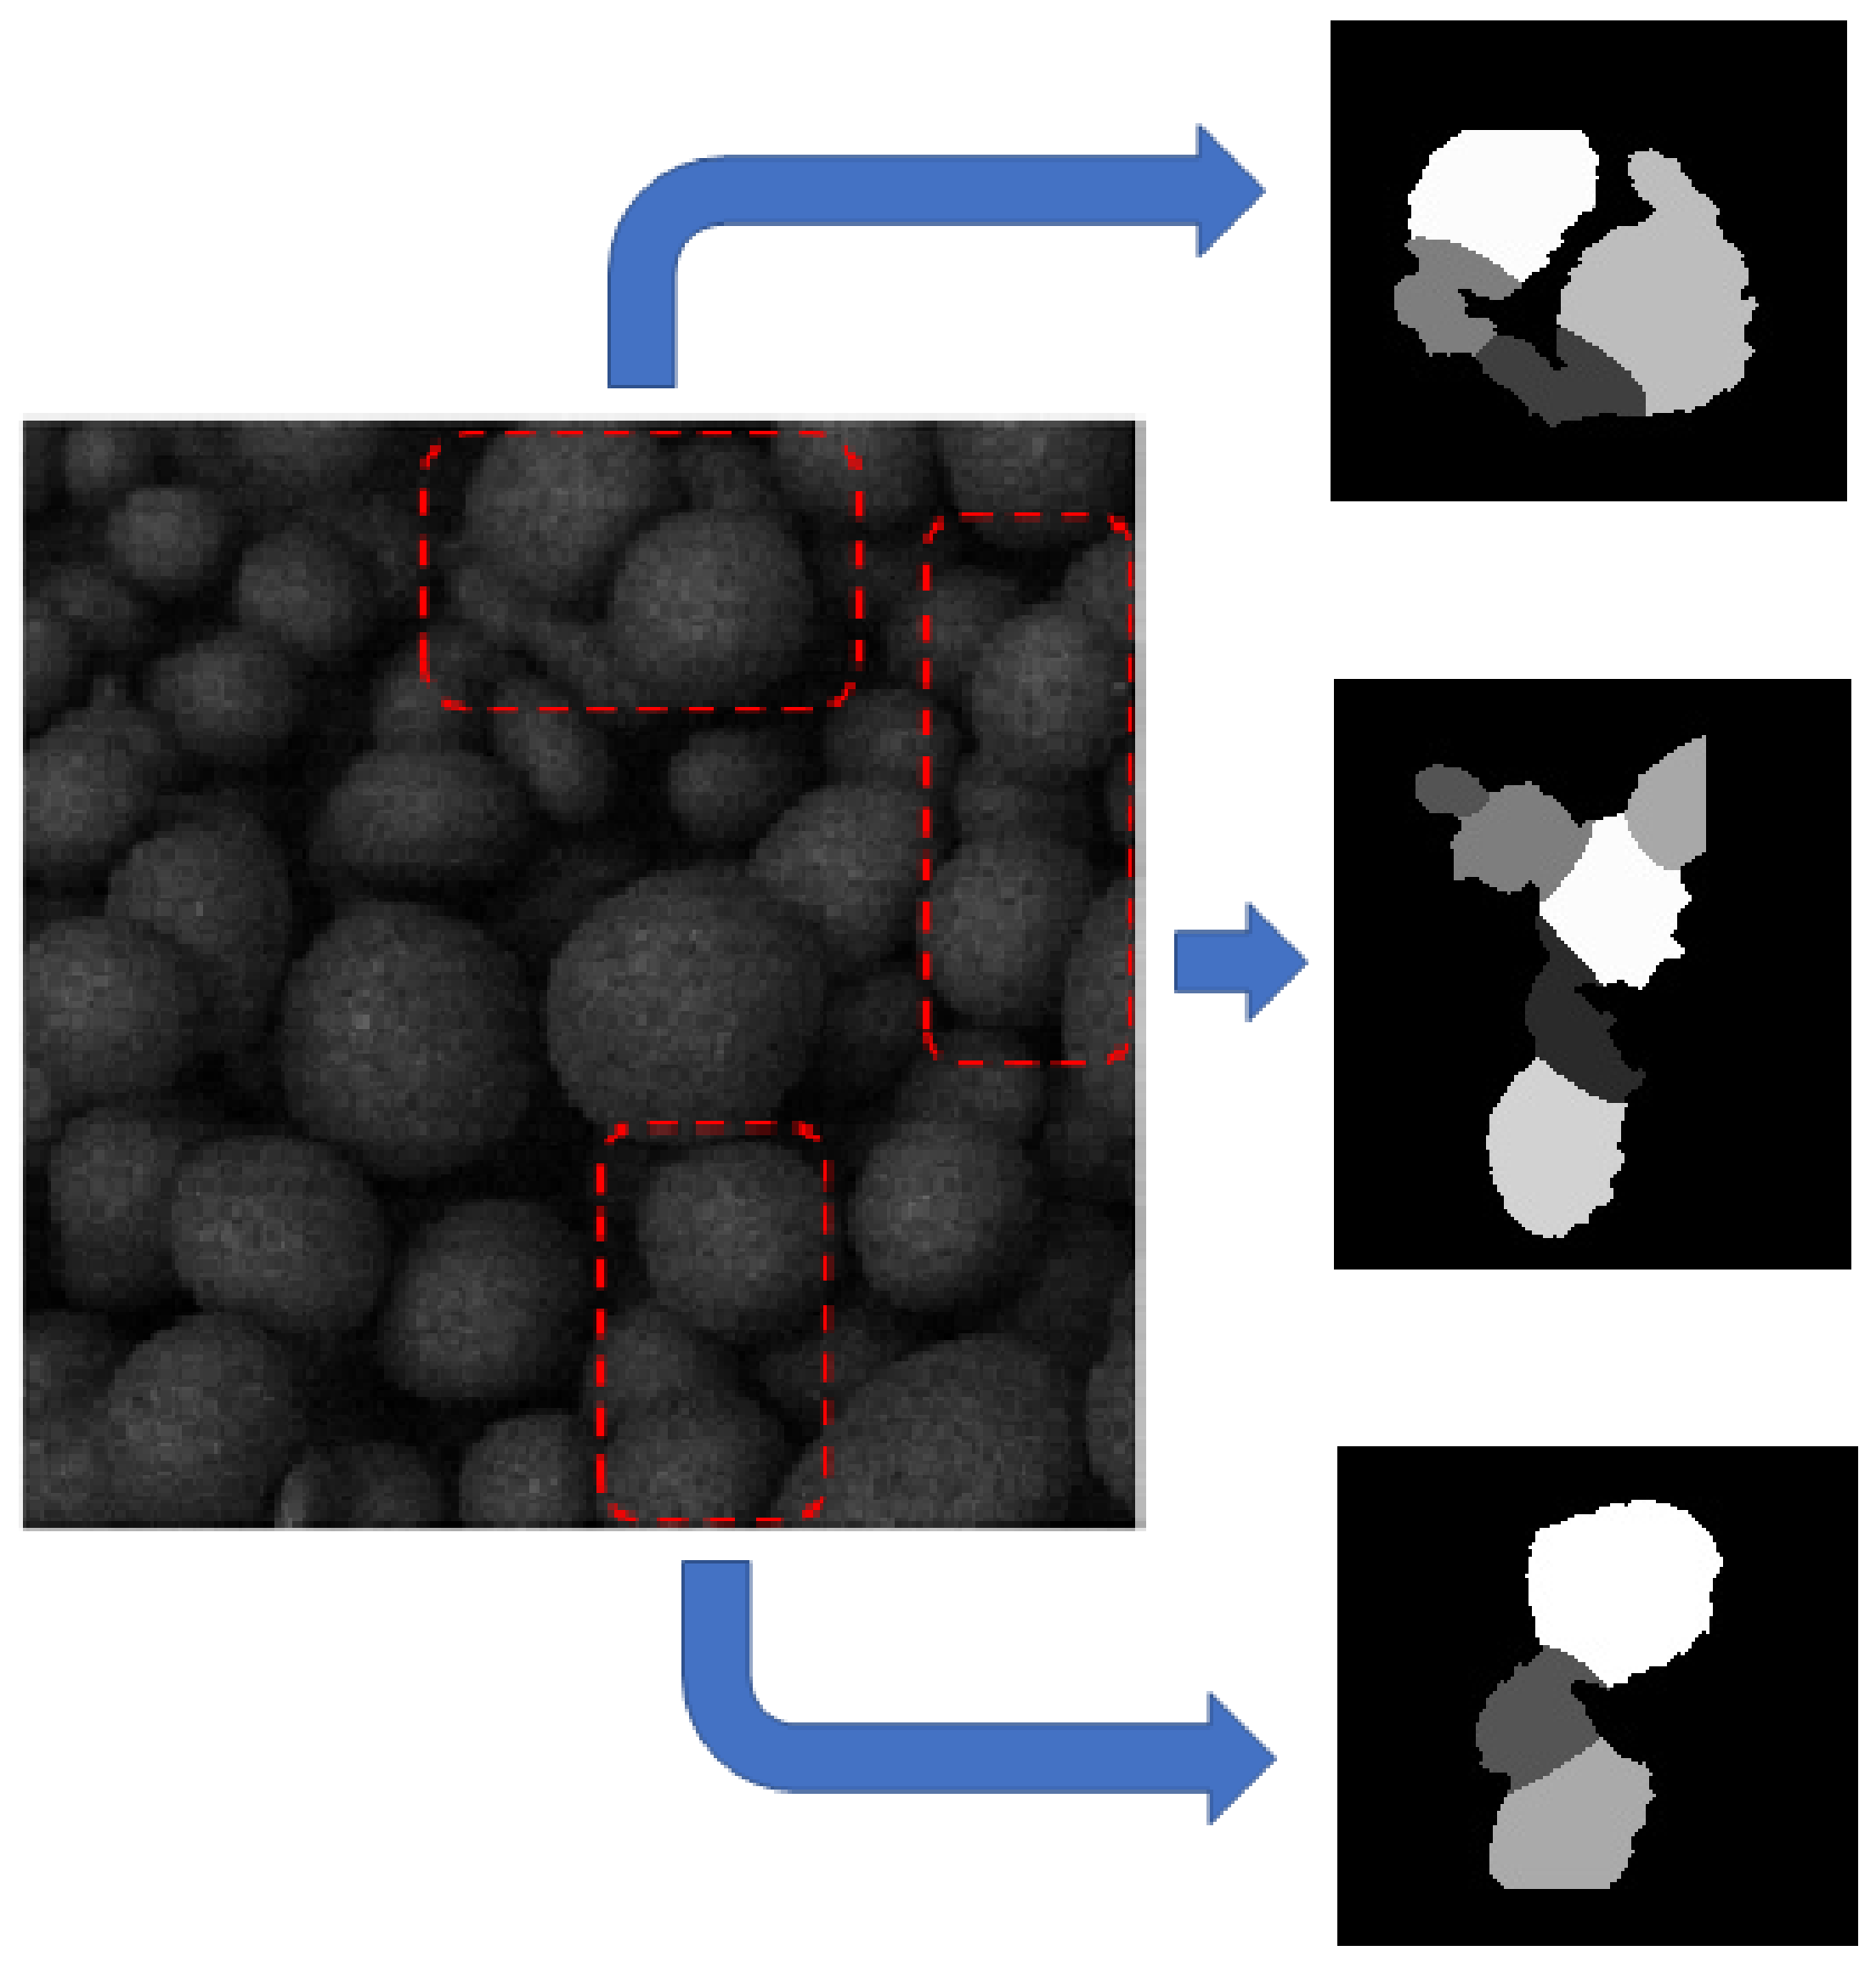
2.3. Overlapping Pellet Segmentation
2.3.1. Overlapping Pellets Discrimination
2.3.2. Re-Segmentation of Overlapping Pellets
2.4. Pellet Size Estimation
2.5. Evaluation Mechanism of Edge Pellets
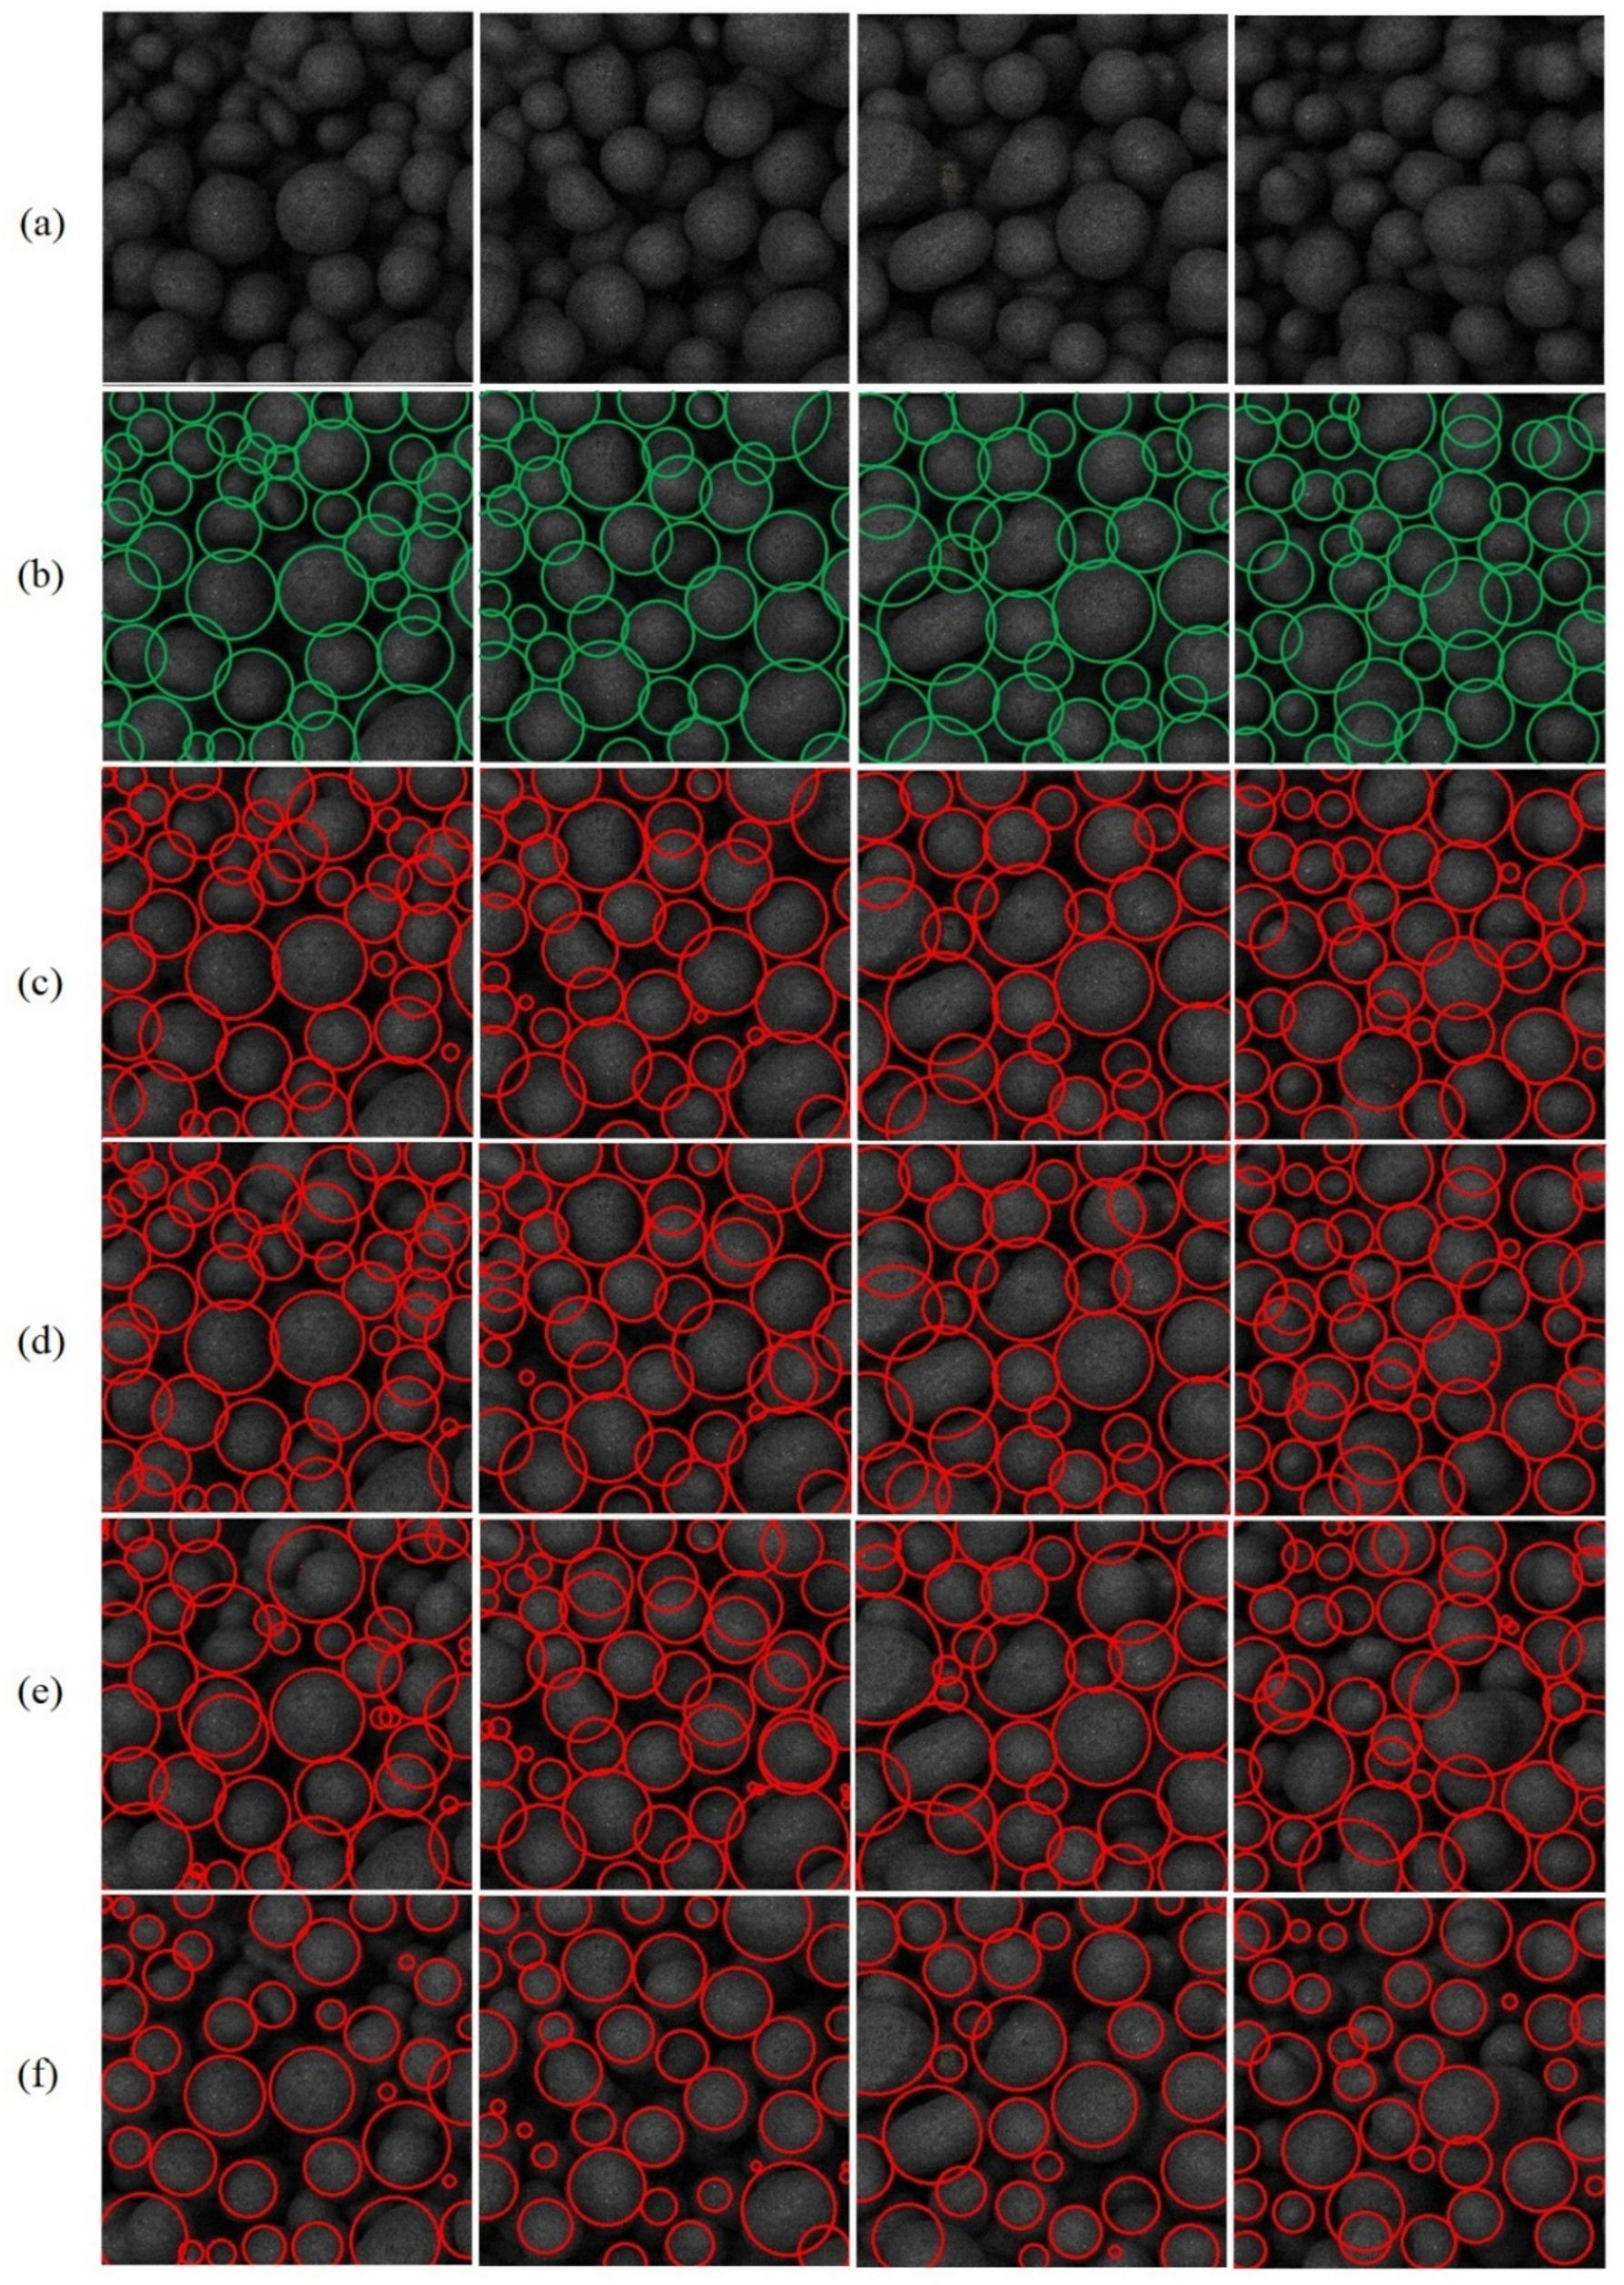
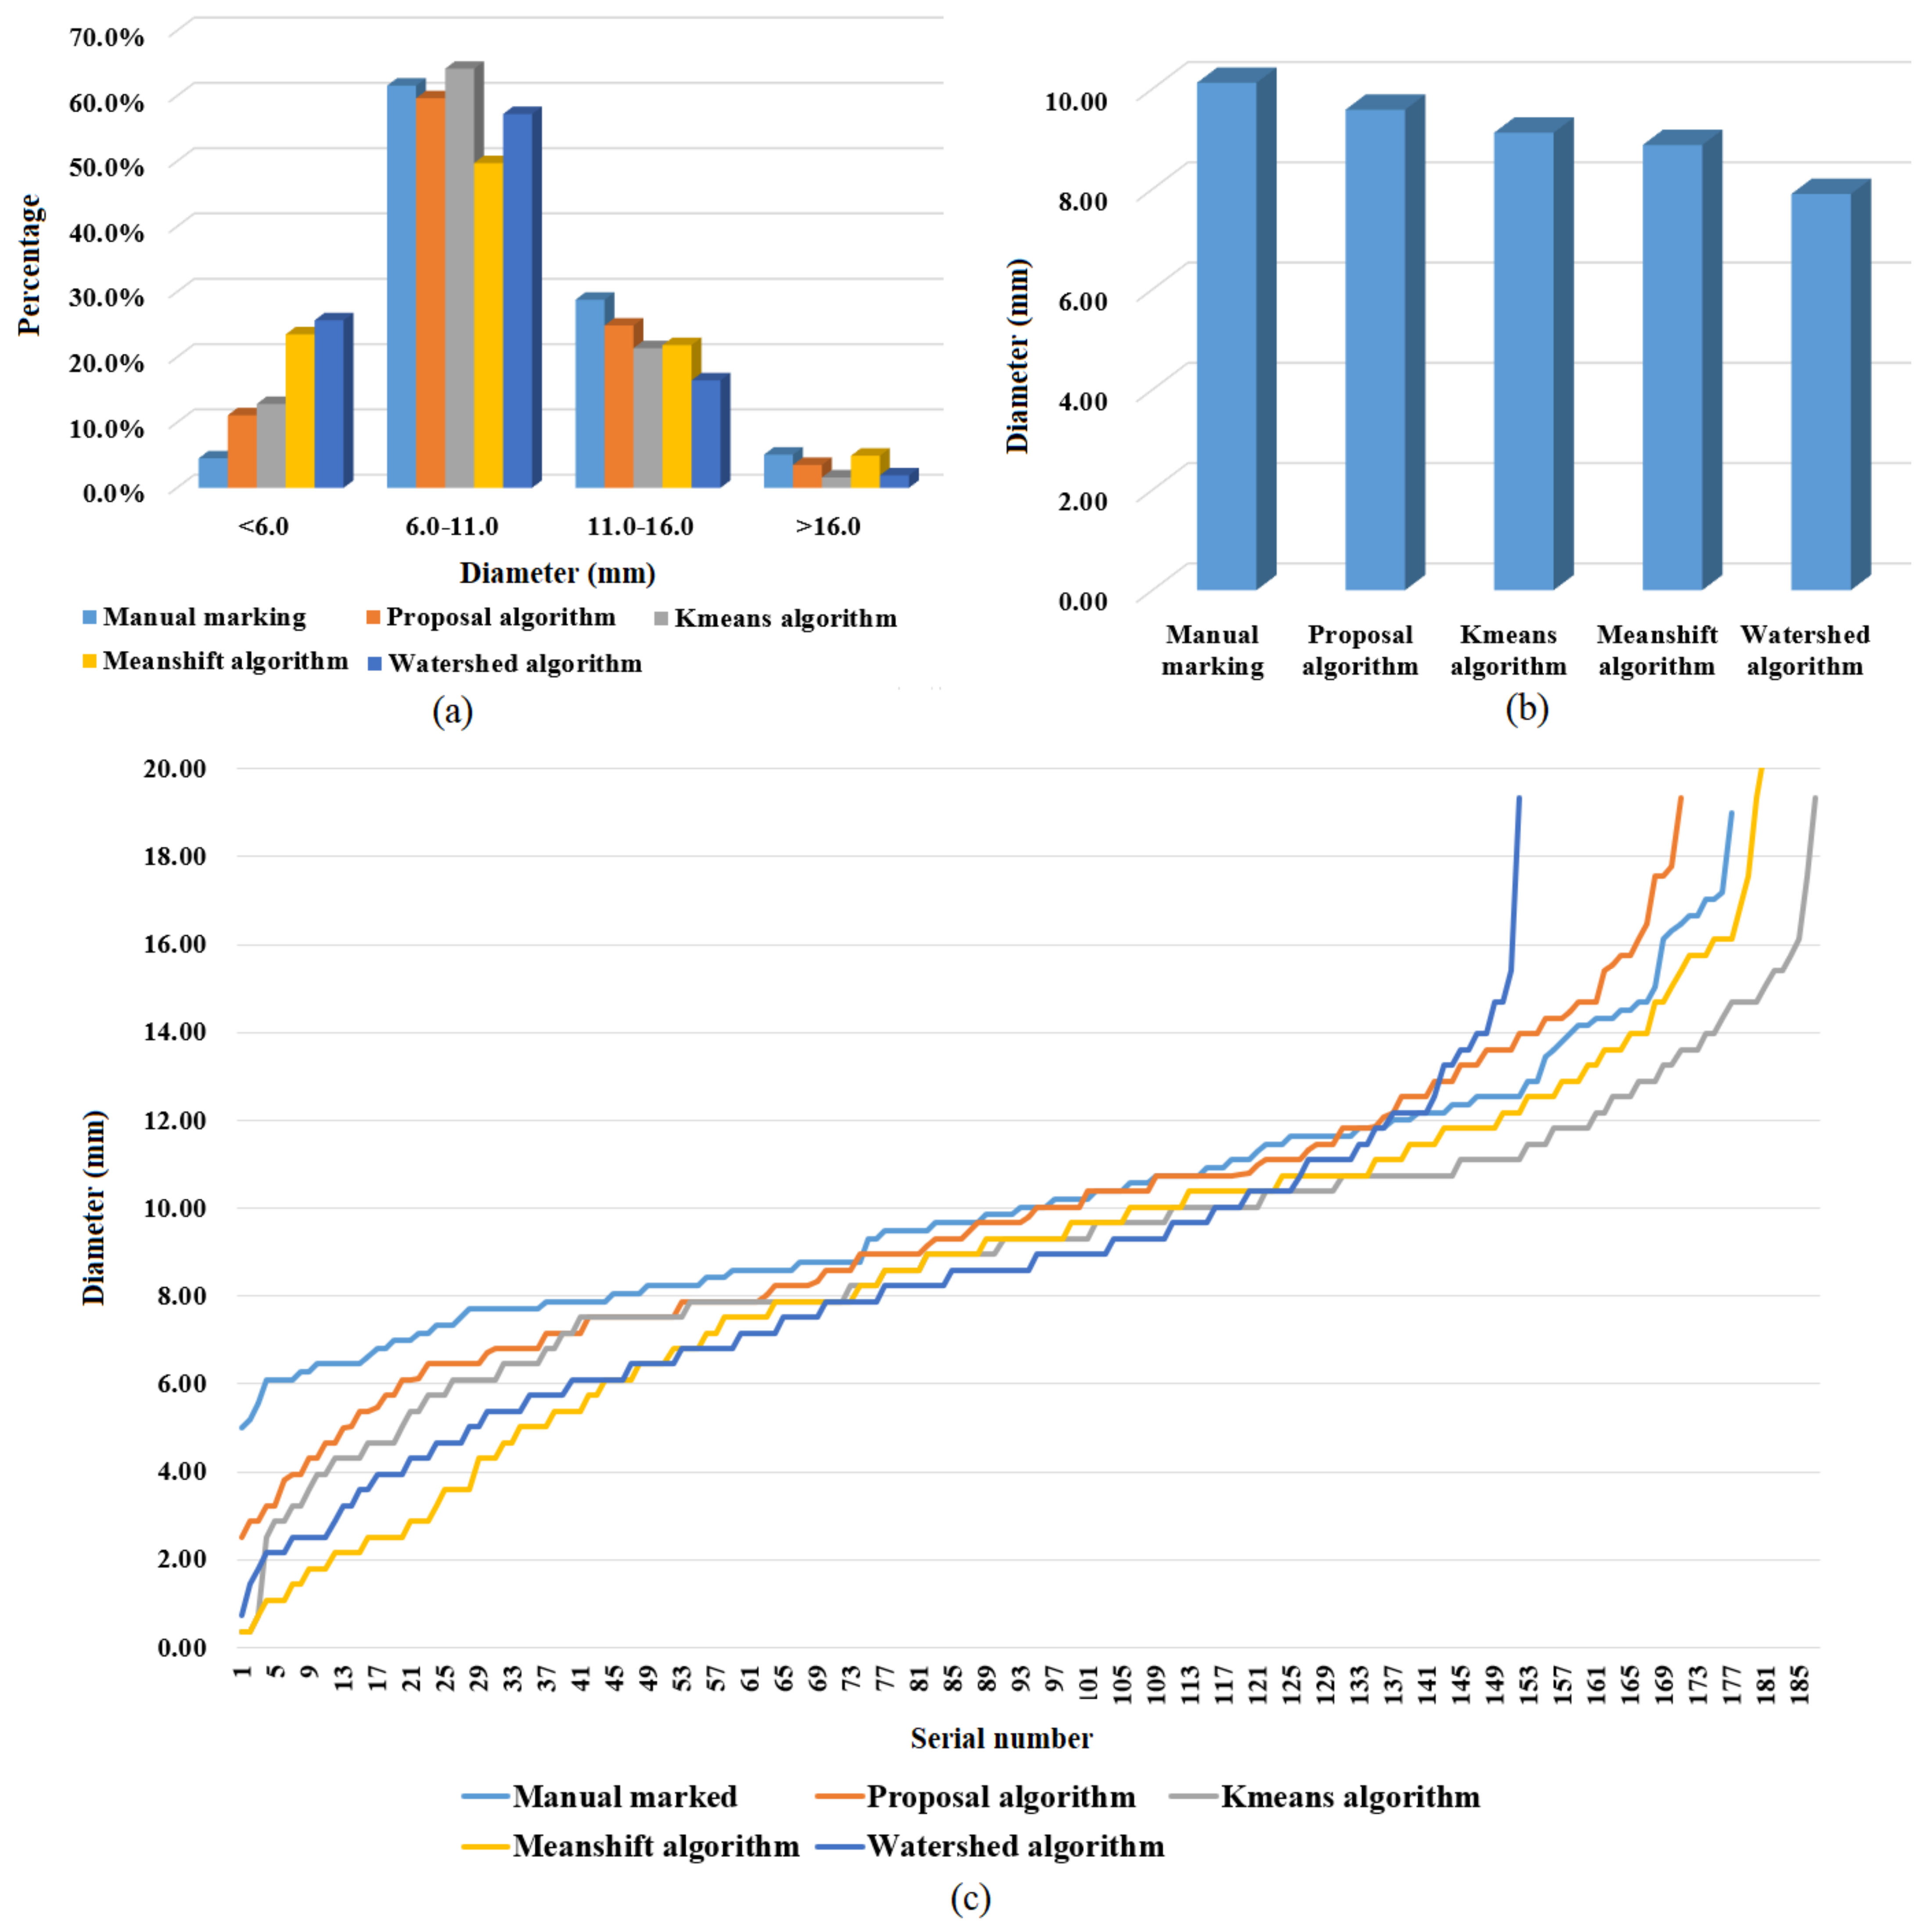
3. Experimental Results and Analysis
4. Conclusions
Author Contributions
Funding
Data Availability Statement
Acknowledgments
Conflicts of Interest
References
- Guo, Y.; Liu, K.; Chen, F. Effect of basicity on the reduction swelling behavior and mechanism of limestone fluxed iron ore pellets. Powder Technol. 2021, 393, 291–300. [Google Scholar] [CrossRef]
- Jägers, J.; Wirtz, S.; Scherer, V. An automated and continuous method for the optical measurement of wood pellet size distribution and the gravimetric determination of fines. Powder Technol. 2020, 367, 681–688. [Google Scholar] [CrossRef]
- Novikova, A.; Markl, D.; Zeitler, J.A. A non-destructive method for quality control of the pellet distribution within a MUPS tablet by terahertz pulsed imaging. Eur. J. Pharm. Sci. 2018, 111, 549–555. [Google Scholar] [CrossRef] [PubMed]
- Lumin, C.A.; Zhen, C.B.; Ansheng, F.C. Image analysis algorithm and verification for on-line molecular sieve size and shape inspection. Adv. Powder Technol. 2014, 25, 508–513. [Google Scholar] [CrossRef]
- Zhou, S.Y.; Liu, X.Y.; Chen, Y.R. Evaluation of Deep Network-based Methods for Crack Detection of Iron Ore Green Pellet. ISIJ Int. 2022, 62, 1694–1704. [Google Scholar] [CrossRef]
- Sun, Q.; Zheng, J.; Li, C. Improved watershed analysis for segmenting contacting particles of coarse granular soils in volumetric images. Powder Technol. 2019, 356, 295–303. [Google Scholar] [CrossRef]
- Tripathi, A.; Kumar, V.; Agarwal, A. Quantitative DEM simulation of pellet and sinter particles using rolling friction estimated from image analysis. Powder Technol. 2021, 380, 288–302. [Google Scholar] [CrossRef]
- Liu, X.Q.; Peng, W.B.; Zhang, B. A surface cracks detection method for nuclear fuel pellets using an improved fully convolutional network. J. Nucl. Sci. Technol. 2021, 59, 555–563. [Google Scholar] [CrossRef]
- Wu, X.; Liu, X.; Duan, J. Online size distribution measurement of dense iron green pellets using an efficient and multiscale nested U-net method. Powder Technol. 2021, 387, 584–600. [Google Scholar] [CrossRef]
- Heydari, M.; Amirfattahi, R.; Nazari, B. An industrial image processing-based approach for estimation of iron ore green pellet size distribution. Powder Technol. 2016, 303, 260–268. [Google Scholar] [CrossRef]
- Wu, X.; Liu, X.Y.; Sun, W. An image-based method for online measurement of the size distribution of iron green pellets using dual morphological reconstruction and circle-scan. Powder Technol. 2019, 347, 186–198. [Google Scholar] [CrossRef]
- Zafari, S.; Eerola, T.; Sampo, J. Segmentation of Overlapping Elliptical Objects in Silhouette Images. IEEE Trans. Image Process. 2015, 24, 5942–5952. [Google Scholar] [CrossRef] [PubMed]
- Wang, Y.; Tan, Z.P.; Chen, Y.C. An adaptive gravitational search algorithm for multilevel image thresholding. J. Supercomput. 2021, 77, 10590–10607. [Google Scholar] [CrossRef]
- Cai, Y.; Ming, C.; Qin, Y. Skeleton extraction based on the topology and Snakes model. Results Phys. 2017, 7, 373–378. [Google Scholar] [CrossRef]
- Křupka, A.; Říha, K. Minimal prerequisites for measuring two-dimensional contour roundness in a particle classification context. Powder Technol. 2015, 284, 486–495. [Google Scholar] [CrossRef]
- Liu, D.; Wang, Y.; Tang, Z. A robust circle detection algorithm based on top-down least-square fitting analysis. Comput. Electr. Eng. 2014, 40, 1415–1428. [Google Scholar] [CrossRef]
- Li, X.M.; Shi, Z.Y. The relationship between the minimum zone circle and the maximum inscribed circle and the minimum circumscribed circle. Precis Eng. 2009, 33, 284–290. [Google Scholar] [CrossRef]
- Siddiqui, F.U.; Isa, N.A. Mat. Optimized K-means (OKM) clustering algorithm for image segmentation. Oppo-Electron. Rev. 2012, 20, 216–225. [Google Scholar]
- Feng, j.; Zhan, K.; Chen, S.J. Image segmentation method of mine pass soil and ore based on the fusion of the confidence edge detection algorithm and mean shift algorithm. Gospod. Surowcami Miner. 2022, 37, 133–152. [Google Scholar]
- Paiva, P.V.V.; Cogima, C.K.; Dezen-Kempter, E. Historical building point cloud segmentation combining hierarchical watershed transform and curvature analysis. Parttern Recogn. Lett. 2020, 135, 114–121. [Google Scholar] [CrossRef]


| Algorithm | AC/% | NTotall | NRight | NOver | NUder | NMiss |
|---|---|---|---|---|---|---|
| Watershed segmentation algorithm | 70.94% | 960 | 681 | 32 | 66 | 181 |
| Meanshift segmentation algorithm | 55.94% | 960 | 537 | 102 | 198 | 123 |
| K-means segmentation algorithm | 85.21% | 960 | 818 | 56 | 15 | 71 |
| Proposed segmentation algorithm | 91.98% | 960 | 883 | 22 | 0 | 56 |
Disclaimer/Publisher’s Note: The statements, opinions and data contained in all publications are solely those of the individual author(s) and contributor(s) and not of MDPI and/or the editor(s). MDPI and/or the editor(s) disclaim responsibility for any injury to people or property resulting from any ideas, methods, instructions or products referred to in the content. |
© 2023 by the authors. Licensee MDPI, Basel, Switzerland. This article is an open access article distributed under the terms and conditions of the Creative Commons Attribution (CC BY) license (https://creativecommons.org/licenses/by/4.0/).
Share and Cite
Ma, W.; Wang, L.; Jiang, T.; Yang, A.; Zhang, Y. Overlapping Pellet Size Detection Method Based on Marker Watershed and GMM Image Segmentation. Metals 2023, 13, 327. https://doi.org/10.3390/met13020327
Ma W, Wang L, Jiang T, Yang A, Zhang Y. Overlapping Pellet Size Detection Method Based on Marker Watershed and GMM Image Segmentation. Metals. 2023; 13(2):327. https://doi.org/10.3390/met13020327
Chicago/Turabian StyleMa, Weining, Lijing Wang, Tianyu Jiang, Aimin Yang, and Yuzhu Zhang. 2023. "Overlapping Pellet Size Detection Method Based on Marker Watershed and GMM Image Segmentation" Metals 13, no. 2: 327. https://doi.org/10.3390/met13020327