Article

Mechanical Properties of B1500HS/AA5052 Joints by Self-Piercing Riveting

Key Laboratory for Conveyance and Equipment, Ministry of Education, East China Jiaotong University, Nanchang 330013, China
*
Author to whom correspondence should be addressed.
Metals 2023, 13(2), 328; https://doi.org/10.3390/met13020328
Submission received: 29 November 2022 / Revised: 1 February 2023 / Accepted: 3 February 2023 / Published: 6 February 2023
(This article belongs to the Topic Advanced Forming Technology of Metallic Materials)

Abstract

:
Self-piercing riveting (SPR) is a suitable technology to join various materials and has attracted more attention in the automotive industry. In this work, the effects of forming parameters on the forming qualities and mechanical properties of B1500HS steel/AA5052 aluminum alloy SPR joints were analyzed. The results show that the sheet stack sequence has little influence on the peak tensile load and rigidity of SPR joints. When the steel sheet is placed on the aluminum sheet, the failure displacement, energy absorption, and ductility factor are, respectively, 2.77, 2.13, and 2.28 times larger than those of the joints with the aluminum sheet placed on the steel sheet. The SPR joints with steel sheets placed on aluminum sheets have better mechanical stability. Meanwhile, when the steel sheet is placed on the aluminum sheet, the fatigue life of the joint can be increased by about 98.4%, 88.3%, and 118.1%, respectively, under high, medium, and low fatigue loads. A joint with opposite riveting direction has the optimal fatigue performance and the fatigue life is 1.64 and 2.14 times those of the other two-rivet joints. Generally, the fatigue fractures of aluminum alloy sheets in SPR joints occurred in fatigue tests. The fatigue fracture of a joint with a steel sheet stacked on an aluminum sheet extends uni-directionally to the edge of the sheet from the riveting point, while a symmetric fatigue crack of aluminum occurs for joints with the opposite sequence. The distribution of fatigue cracks is related to fatigue load, and fatigue cracks mainly originate in the fretting wear area of the contact interface between the rivet leg, upper sheet, and lower sheet.

1. Introduction

With the continuous growth of vehicle ownership, social problems, such as energy consumption and environmental pollution, are becoming increasingly prominent [1]. Lightweight has become an inevitable trend in the automotive industry. Generally, the multi-material hybrid design principle is adopted in lightweight car bodies, i.e., various kinds of lightweight materials are applied in the appropriate structure parts [2]. Due to the different physical and chemical properties of lightweight materials [3], manufacturing defects usually occur in welding. Therefore, appropriate connection technology is the key to the connection of dissimilar lightweight materials [4,5]. Self-piercing riveting (SPR) technology can achieve the stable connection of various lightweight materials by plastic deformation of rivets and sheets [6,7], and has been widely applied in automotive manufacturing [8,9].
The SPR joint property can be effectively improved by optimizing the joint’s structure, size, rivet material, and die types [10]. Liu et al. [11] developed a simulation model to investigate the effect of die shape and size on the deformation behavior of SPR joint, and found that the die diameter and pip height significantly influence the flared rivet shank radius. Additionally, the filling condition of the die cavity is a key factor in SPR joint forming. Haque [12] comprehensively described the relationship between the process variables (die, rivet, punch, material, and blank holder) and several key parameters. Mori et al. [13] analyzed the SPR properties of different combined three-layer steel/aluminum sheets and found that by setting a softer sheet as the upper sheet, the joinability can be improved. Ma et al. [14] studied the influence of a rivet and die on the rivetability and mechanical performance of steel/aluminum hybrid SPR joints, and found that the rivetability can be improved using a softer rivet and larger die.
In the practical application of mechanical structures including SPR joints, sudden structural failure should be avoided and fatigue failure is the main failure mode. Under the cyclic load, relatively tiny movement on the contact interface of components in the SPR joint structure occurs. Generally, fatigue cracks are prone to generate in the contact areas between rivet/sheet and sheet/sheet because of the fretting wear, tensile stress, and serious stress concentration [15,16,17]. Zhang et al. [18] analyzed the fretting behaviors and fatigue crack propagation mechanism of the TA1 SPR joint and found that fatigue crack initiates at the faying interface, where heavy fretting wear is generated. Lee et al. [19] evaluated the influence of residual stress on the fatigue lifetime of the AZ31/Al5052 SPR joint and found that the fatigue life can be significantly extended by introducing compressive residual stress. Kang et al. [20] evaluated the monotonic and fatigue strengths of SPR joints at different loading angles and reported that the fatigue cracks are initiated in the contact zones of rivets and sheets. Bang et al. [21] investigated the mechanical properties of steel/aluminum lap joints that are connected by friction stir spot welding and SPR technologies, respectively, and found that the strength of the SPR joint is higher.
In order to improve the mechanical properties of SPR joints, SPR technology can be combined with the bonding process [22], the welding process [23], and other processes [24]. Huang et al. [25] combined SPR technology and the shot peening process, and the static strength and fatigue strength of the SPR joint are effectively improved by inducing residual compressive stress in the sheet during the shot peening process. Moroni [26] investigated the mechanical properties of joints connected by SPR, bonding, and hybrid joining technologies, and observed that the fatigue properties of hybrid joints are better than other joints. Heidrich et al. [27] measured the static and fatigue strengths of the resistance rivet spot welding joint and SPR joint and found that the fatigue strength of the resistance rivet spot welding joint strongly depends on the sheet thickness, and the fatigue strength of the resistance rivet spot welding joint exceeds the SPR joint when the thick steel sheet is adopted. Deng et al. [28] proposed a thermally assisted SPR process to improve the rivetability of ultra-high strength steel, and the property of steel/aluminum joints can be improved using reasonable heating parameters.
The B1500HS steel and AA5052 aluminum alloy thin sheets have a widespread application in the automotive industry; however, the mechanical properties and failure mechanism of B1500HS/AA5052 SPR joints with different configurations are seldom reported. In this work, the mechanical properties of dissimilar B1500HS/AA5052 SPR joints were studied experimentally. The influence of sheet sequence, rivet number, and riveting direction on the tensile property were analyzed. Additionally, the fatigue properties of joints with different configurations were conducted, and the failure mechanism of SPR joints was also discussed.

2. Materials and Methods

2.1. Materials and SPR Joints

The lightweight materials used in the work are commercial B1500HS steel and AA5052 aluminum alloys. The chemical compositions and the corresponding mechanical properties of the sheets are shown in Table 1 and Table 2. The rivets provided by Henrob Limited used in this work are semi-tubular rivets, and the hardness is H4 series. The die with a hump was adopted, and the diameter and depth of the die are 10.0 mm and 2.0 mm, respectively. The geometry and sizes of the rivet and die are presented in Figure 1. Commonly, better-forming quality can be obtained when the rivet height exceeds the total thickness of the sheets by about 2.5–3.0 mm [29,30]. In order to compensate for the upsetting amount of the rivet and obtain a certain rivet spread value in the self-locking structure, the size of the adopted rivet was φ5.3 mm × 6.0 mm. The inner diameter and head diameter of the rivet were 3.3 mm and 7.8 mm, respectively. The RV300023 riveting machine (Henrob Limited, Flintshire, UK), with a maximum working pressure of 45.0 kN, was employed in riveting tests.
The forming process, geometry, and, sizes of SPR specimens are presented in Figure 2. The SPR forming process can roughly be divided into 4 stages: clamping, puncture, expansion, and forming (Figure 2a–d) [31]. The size of the B1500HS steel sheet is 135 mm × 36 mm × 1 mm and the AA5052 sheet is 135 mm × 36 mm × 2 mm. The size of the overlap area is 36 mm × 36 mm (Figure 2e). By changing the stacking sequence of sheets, two kinds of single-rivet SPR joints were fabricated: SA (B1500HS+AA5052) and AS (AA5052+B1500HS), and then three kinds of two-rivet joints were fabricated: SAT (B1500HS+AA5052, with same riveting direction), AST (AA5052+B1500HS, with same riveting direction), and SAF (with opposite riveting direction), as seen in Figure 2f. The mechanical property tests and common failure modes of SPR joints are presented in Figure 3. Figure 3a–d is the tensile failure modes of joints with different sheet stack sequences. The SPR joint failure mode is significantly influenced by joint configuration [32]. Due to the smaller thickness of the B1500HS steel sheet, when the B1500HS was placed on the AA5052 sheet, the tensile failure is the tear of B1500HS. When the AA5052 sheet was placed on B1500HS, the tensile failure is the pulling out of the rivet from the lower sheet. Figure 3e,f is the fatigue failure modes of joints.

2.2. Finite Element Simulation of SPR Process

The reasonable finite element model is the key to accurate simulation of the SPR process [33,34]. The simulation of the SPR process of dissimilar B1500HS/AA5052 materials was conducted using Simufact forming software, and the plastic deformation behaviors of the SPR structure were analyzed. The mesh of the rivet was created by the “Quadtree” mesher, and the element size and element count are 0.1 mm and 1938. The meshes of the upper sheet and lower sheet were created by the “Advancing Front Quad” mesher, and the element size and element count are 0.15 mm and 2679 (B1500HS), and 0.15 mm and 4919 (AA5052), respectively. In the SPR forming simulation, the upper sheet was punctured, and the critical thickness of fracture is set as 0.05 mm. Because of the symmetrical structure of the SPR joint, a 1/2 numerical model was created, the symmetrical surface of sheets was set as the boundary, and the displacement of sheets along the X-axis, Y-axis, and Z-axis was fixed. The materials of the rivet and AA5052 aluminum alloy are imported from the Simufact forming material database, and the material model of B1500HS is created using the stress–strain curve. The rivet and sheets are elastic–plastic, while the other components are rigid. The contacts of the components in the SPR process are set manually, i.e., rivet upper sheet, rivet lower sheet, punch rivet, blank holder upper sheet, upper sheet lower sheet, and die lower sheet. The friction coefficient between the lower sheet die is 0.22, and the other friction coefficient is 0.12. The specific parameters are shown in Table 3.

2.3. Forming Quality of SPR Joint

The SPR joint was dissected along the meridian line of the rivet center using a line-cutting machine. The profile was calibrated and measured to obtain the rivet head height H, residual bottom thickness Δb, and undercut Δu of SA and AS joints, as shown in Figure 2e. Here, H denotes the vertical distance between the rivet head surface and the upper sheet after SPR joint forming. Δb stands for the minimum vertical distance between the lowest point of the rivet and the lower surface of the lower sheet, and Δu is the horizontal distance between the lowest point of the upper sheet and the rivet tip. In the automotive industry, when the section parameter values are in the following ranges, −0.5 mm ≤ H ≤ 0.3 mm, Δb ≥ 0.2 mm, Δu ≥ 0.4 mm [35,36], the better SPR joint could be obtained, and the section parameters of the SA joint and AS joint were compared and analyzed according to this standard.

2.4. Tensile and Fatigue Tests

RGM4030 tensile testing machine provided by Regal Instrument Co., Ltd. (Shenzhen, China) was used in the tensile tests of SPR samples. The tensile speed was 2.0 mm/min, and the loading mode as well as the common tensile failure mode of the SPR joint are presented in Figure 3. In order to avoid the dispersion of test data, the tensile tests of all groups of the samples were repeated 5 times, and 3 samples with the minimum dispersion were chosen from the 5 specimens in each group for the following analysis.
A QBG-50 fatigue testing machine provided by Qianbang Testing Equipment Co., Ltd. (Changchun, China) was adopted for the fatigue tests. The fatigue loading mode and the common fatigue failure mechanism are shown in Figure 3e. Generally, the fatigue failure of the steel/aluminum SPR joint is the fatigue fracture of the aluminum sheet, and the effect of loading frequency on the fatigue property of aluminum is not obvious [37,38]. In the fatigue tests, the stress ratio R was 0.1 and the loading frequency was 85 Hz [29,39]. So, the balance of test efficiency and test data accuracy can be realized. Once the macroscopic crack appears or the static/dynamic load exceeds the limit value, fatigue failure occurs. Five fatigue tests were repeated for each group of samples. Before the tensile and fatigue tests, the spacers with a thickness of 1.0 mm and 2.0 mm were placed in the clamping area to ensure that the loading direction was aligned with the long axis. So, the influence of structural bending on test results can be avoided, as shown in Figure 2e.

3. Results and Discussion

3.1. SPR Forming Process and Quality

The punch load-displacement (Fp-L) curve and load change rate-displacement (k-L) curve of the SPR process are obtained, as shown in Figure 4. The load change rate is denoted by k and k = ΔFpL, i.e., the slope of the Fp-L curve. As seen in Figure 4, the SPR forming process of the SA and AS joints can be roughly divided into four stages.
Clamping stage: the rivet moves downward under the impetus of the punch and then contacts initially with the upper sheet surface without penetration (Zone I), and the punch load increases approximately linearly.
Puncture stage: the rivet continues to move downward and a small degree of plastic deformation of the upper sheet generates. When the rivet pierces into the upper sheet, the radial expansion appears under the resistance of the sheet (Zone II). Due to the plastic deformation of the sheet, the displacement continues to increase while the load increment is small, and the k value in the k-L curve fluctuates around 0. When the upper sheet is penetrated, the punch load is released, and the punch load drops slightly.
Expansion stage: the rivet penetrated the upper sheet and then gradually pierces into the lower sheet. In this stage, the plastic deformation and work hardening occur in the lower sheet, resulting in large shear resistance in the vertical direction, as the rivet tip moves along the direction of the least resistance and more obvious expansion occurs [40] (Zone III).
Forming stage: with the continuous movement of the rivet, the radial expansion becomes more significant, and the punch load and its change rate increase sharply. Finally, a stable mechanical self-locking structure is obtained (Zone IV).
The hardness of the B1500HS sheet is higher than the AA5052 sheet, so in the SA joint (upper steel and lower aluminum), the harder steel sheet has to be pierced first, and the larger resistance the rivet encounters in the puncture stage [13]. Therefore, the displacement of the SA joint in the second stage is about 1.5 mm smaller than that of AS joint in the second stage. In addition, the lower sheet of the SA joint is thicker and easy to deform than that of AS joint, and the displacement of the rivet in the SA joint is about 1.2 mm larger when compared with that of AS joint in the third stage. The load increment of the SA joint in the third stage is smaller than the AS joint (Figure 4).
SPR tests are conducted and the joint profiles with different sheet stack sequences are prepared. Figure 5 shows the profiles of the SA joint and the AS joint. As seen in Figure 5a, the experiment results fit with the simulation results, and a certain clearance (Region I) exists in the rivet tube, i.e., the tube is not filled completely after joint forming. Meanwhile, a relatively large degree of upsetting deformation (Region II, III) of the rivet tube occurs in the SA joint. As seen in Figure 5b, the semi-tubular area of the rivet is filled completely for the AS joint. However, the rivet does not completely penetrate the upper sheet in the AS joint (Region IV). In addition, there are small differences between the experiment and simulation results in Region V. From the comparison of the original profile and the deformed profile of rivets (Figure 5c), the existence of upsetting of rivets in the SA joint can be found, and the plastic deformation degree of the SA joint is larger than the AS joint.
The SPR forming quality is significantly influenced by the process parameters and joint configurations [41,42]. The section parameters of the two kinds of joints are measured by a Dino optical microscope, and the comparison is exhibited in Figure 6. The residual bottom thicknesses of the two joints are above or near the standard value (0.2 mm), the head height lies between 0 ± 0.1 mm, and the undercut of the SA joint exceeds 0.4 mm, while the undercut of AS joint is smaller than the standard value. Meantime, the residual bottom thickness of the SA joint is slightly larger than the AS joint, while the undercut is much larger than the AS joint.
Figure 6 reveals that there is a great difference in forming parameters in these two joints. Due to the bigger hardness of B1500HS steel, the deformation of the rivet in the SA joint is resisted, and the upsetting and circumferential expansion occur in the puncture stage. Moreover, under the large punch load, the steel sheet in the rivet tube pushes down the aluminum alloy sheet, leading to the easier filling of the groove. When the die is fully filled, greater resistance generates because of the die hump and the work hardening of the sheet, which prevents the downward movement of the rivet, and then the expansion deformation of the rivet is further increased, i.e., the undercut value of the SA joint is larger than that of the AS joint. Meanwhile, the distance between the lowest point of the rivet tip and the lower surface of the lower sheet is relatively large, i.e., the Δb of the SA joint is larger than the AS joint. Comparatively, as for AS joint, the downward displacement of the rivet is bigger and the expansion deformation degree is smaller because the softer AA5052 sheet is stacked on the B1500HS sheet. After the final forming of the joint, the Δb and the Δu of the AS joint are smaller than the SA joint.

3.2. Tensile Property

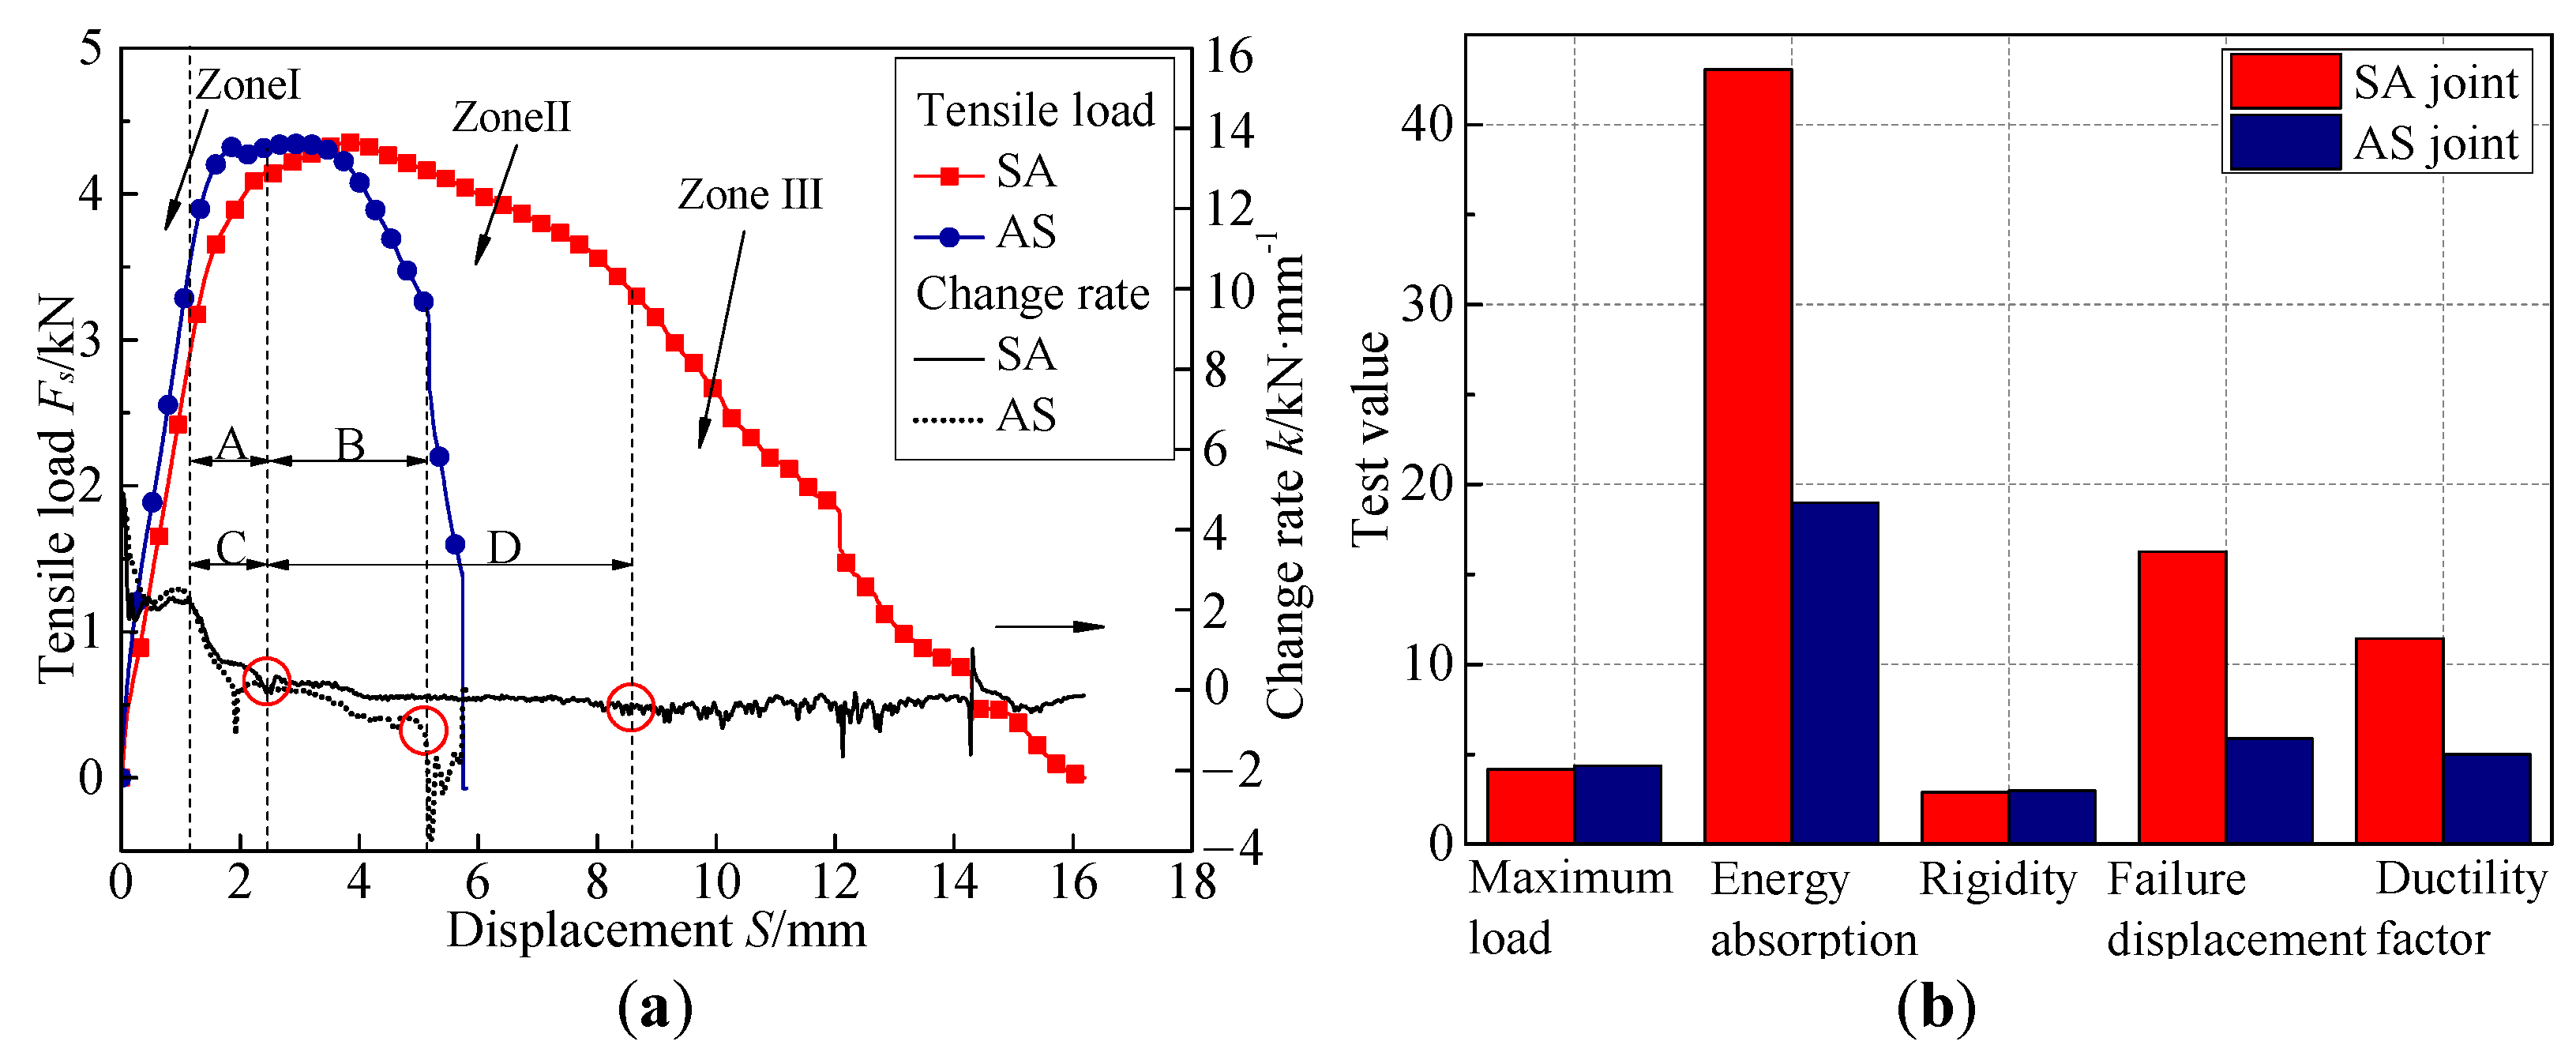
3.2.1. Tensile Property of Single-Rivet Joint

The tensile test process of the SA joint is shown in Figure 7. The element types of sheets in Figure 7 include two kinds: tetrahedral (134) (refinement areas) and hexahedral (other areas), and the numbers of elements along the plate thickness are, respectively, 3 and 4. The time/velocity control mode is adopted in tensile simulation, the velocity is 2 mm/s and the time is 8 s. When the total displacement is completed, the simulation is ended. It can be found that the simulation fits well with the experiment. The tensile property parameters, tensile load-displacement (Fs-S) curves, and load change rate-displacement (k-S) curves of SPR samples are presented in Figure 8.
The Fs-S curves of the SA joint and AS joint can be approximately divided into three zones:
(I) Elastic zone: Initially, the tensile load increases linearly and rapidly, and the k reaches the maximum value (around 5.0 kN/mm), which is the typical elastic deformation stage. The tensile load rises to about 3.0 kN linearly when the displacement is increased from zero to 1.1 mm. The change rate of the load drops from 5.0 kN/mm rapidly and then fluctuates steadily at 2.3–2.6 kN/mm, indicating that the increment of the tensile load is relatively constant, as demonstrated in Figure 8a. The tensile load in this stage consists of two parts: ① friction resistance caused by sheet contact pressure during SPR forming and ② the shear resistance between components in the SPR structure [43].
(II) Plastic zone: As for the AS joint, this zone can be divided into two phases. In phase A, it can be discovered that the slope drops gradually, i.e., the growth rate of the tensile load slows down. It can be observed that the value of k drops, and the tensile load drops slightly at the same time. The reason is that with the increase in tensile displacement, the contact surface of the sheets begins to separate and warp, resulting in reduced contact friction resistance. Then, the riveting structure begins to twist and tilt, and the proportion of shear load that the rivets bore increases. The tensile load of the AS joint increases and reaches the peak value at the displacement of about 3.0 mm, and then decreases rapidly. In phase B, the k-S curve is relatively gentle and the value fluctuates around 0, indicating that the changing amplitude of the tensile load is small with the displacement increment. Under the tensile load, the rivet inclines along the force direction, and the rivet leg squeezes the sheet material, leading to the plastic deformation of the sheets. For the SA joint, this zone can be divided into phases C and D, and the variation trends of curves are similar to those of the AS joint. Compared with the AS joint, more plastic deformation of the SA joint can be produced under the same tensile load, so the structural integrity can be maintained. It can also be found in Figure 8a that the displacement of phase D is about 6.0 mm, while the displacement of phase B is about 2.7 mm, evidencing that the SA joint has better resistance to deformation in the tensile test. The tensile load in this zone can also be divided into two parts: ① contact friction resistance between sheets and ② shear resistance between the rivet and sheet. Rivet deflection in the tensile direction leads to the increase in friction resistance between the rivet and sheet, and the upper sheet contacted with the rivet head is subjected to shear force, while the lower sheet is subjected to tensile force.
(III) Failure zone: The Fs decreases slowly in the Fs-S curve of the SA joint in this zone until the final failure, and the k fluctuates around 0 with a total displacement of about 7.5 mm. This result agrees with the comparisons of energy absorption and ductility factors in Figure 8b, evidencing that the SA joint can effectively resist tensile deformation and maintain mechanical stability. In the last stage of the tensile test of the SA joint, the components in the SPR joint separate gradually. The tensile load decreases more rapidly, and the fluctuation, as well as the sharp drop of k, can be observed. However, the Fs of AS joint decreases rapidly within a small displacement interval (less than 1.0 mm), and the sharp drop of k happens simultaneously, indicating that the mechanical capacity declines rapidly when the joint is subjected to higher tensile load, and the AS joint has no ability to delay structural deformation consequently.
The tensile property indexes, including maximum load, energy absorption, rigidity, failure displacement, and ductility factor of the SA joint and AS joint are presented in Figure 8b. It can be discovered that inconspicuous differences exist in the maximum load and rigidity, i.e., the bearing capacity of the two joints is similar. However, compared with the AS joint, the energy absorption, failure displacement, and ductility factor of the SA joint are increased by about 113%, 177%, and 128%, respectively, indicating that the SA joint has better deformation and failure resistance.
In the tensile test of the SA joint, due to the smaller sheet thickness of the upper sheet (1 mm), the obvious warping deformation of the B1500HS sheet occurred. Finally, the B1500HS is torn and the sheet is completely detached from the rivet, while the rivet is still maintained in the AA5052 sheet, evidencing that the strength of the rivet tail region is higher than that of the rivet head region, as shown in Figure 3b. In the AS joint, the AA5052 sheet presents gradual warping deformation and the B1500HS sheet maintains its original shape. Because of the larger thickness of the upper sheet, the rivet is ultimately pulled out from the lower sheet and maintained in the upper sheet. Meanwhile, the crack generates in the forming region of the lower sheet (Figure 3d), indicating that the strength of the rivet head region is higher than that of the rivet tail region.
The difference in mechanical properties between the SA and AS joints depend on the different joint structure [44]. For the SA joint, the deformation of the SPR structure mainly occurred in the lower sheet with larger thickness and strength. So, under the tensile load, the upper sheet is severely torn for the existence of the rivet head, while the rivet leg still stays in the lower sheet. With the increase in displacement, the load decreases gradually (Figure 8a). The tensile property indexes, including energy absorption and ductility factor, are relatively larger (Figure 8b). In contrast, for the AS joint, the deformation of the SPR joint can be found in the thinner steel sheet, and the undercut value is smaller, which cannot provide sufficient resistance compared with the rivet head side. So, under tensile load, the rivet leg is easier to be pulled out from the lower sheet, and consequently, the failure displacement is smaller. Furthermore, the energy absorption and ductility of the AS joint are smaller than those of the SA joint.

3.2.2. Tensile Property of the Two-Rivet Joint

The tensile tests of three kinds of two-rivet SPR joints are carried out as well. The Fs-S and k-S curves can also be divided into an elastic zone, plastic zone, and failure zone, as shown in Figure 9a.
In the elastic zone, the tensile load of the three samples increases linearly and rapidly. When the displacement is increased to about 1.8 mm, the load increases to about 5.0 kN. The maximum change rate of the load is about 6.6 kN/mm, then decreases to about 4.0 kN/mm, and then fluctuates. As the displacement continues to increase to about 3.0 mm, the k decreases significantly and fluctuates slightly around zero. As reflected in the Fs-S curves, the increased rate of the tensile load is smaller in zone II, i.e., the plastic deformation occurs. The displacements of these three samples in zone II are about 7.5 mm (SAT) and 5.0 mm (AST, SAF), respectively, and the tensile loads reach peak values. Due to the bending of sheets in tensile tests, the contacted interface separation occurs, and the friction resistance between sheets decreases consequently. The friction resistance between the rivet and sheet is also decreased because of the deflection of the rivet along the tensile direction. The whole wall of the upper sheet is subjected to a shear force that comes from the rivet head, while the lower sheet is subjected to the tensile force. The deflection of the rivet extrudes the sheets and the load is transferred to the sheet material, and the material finally yields. The tensile loads of all the samples decrease rapidly after peak values, and the change rates synchronously increase. With the displacement increment, the expansion of the rivet hole results in further compressional deformation. The tensile failure modes of two-rivet joints are similar to that of single-rivet joints. In the SAT joint, the B1500HS sheet tears, while the rivet tails maintain in the AA5052 sheet. In the AST joint and SAF joint, the rivets are pulled out from the B1500HS sheet, and the rivets still maintain the AA5052 sheet. From the Fs-S curves of the SAT and AST joints, it can be observed that after a rapid drop in the final stage, the joints still maintain smaller bearing capacity, evidencing that the tensile failure of the rivets is not completely synchronized.
The tensile property parameters are shown in Figure 9b. Tiny differences exist between the maximum load and rigidity of the three joints. Compared with the AST sample, the energy absorption values of the SAT and SAF samples increase by 76.9% and 47.3%, respectively, and the failure displacement can be increased by 53.1% and 36.2%, while the ductility factors of the SAT, AST, and SAF samples are 6.86, 4.57, and 5.71, respectively. As discussed above, when the thinner steel sheet is adopted as the upper sheet, better deformation resistance and mechanical stability can be obtained. Therefore, the energy absorption and ductility factor of the SAT joint are obviously larger than the AST joint. Because of the opposite riveting direction in the SAF joint, it can also further be concluded that the mechanical property of the SAF joint is somewhere between the SAT joint and the AST joint. This conclusion can be validated by the comparison of energy absorption, failure displacement, and ductility factor (Figure 9b).
In the tensile tests of single-rivet joints (SA, AS), the maximum tensile loads are almost the same for the two kinds of joints, and the average value is about 4.3 kN. In the tensile tests of two-rivet joints (SAT, AST, and SAF), the maximum tensile loads are also similar, the average value is about 8.0 kN, and the average tensile load of the two-rivet joints is about 1.86 times larger than that of the single-rivet joints. As shown in Figure 8b and Figure 9b, the energy absorption of two-rivet joints can also be improved significantly. However, the rigidity and ductility factors of the two-rivet joints are similar to that of the single-rivet joints. So, it can be concluded that the bearing capacity and deformation resistance of the SPR joint can be greatly improved by two-rivets riveting.

3.3. Fatigue Property

3.3.1. Fatigue Property of a Single-Rivet Joint

As for the SA and AS joints, if 50% of the maximum tensile load is set as the fatigue load, the average fatigue cycles of these two joints (7.3 × 10⁶ and 4.4 × 10⁶) exceed 2 million and cannot be used for fatigue load-fatigue life (F-N) curve fitting [45,46]. Then, if 70% of the maximum tensile load is set as the fatigue load, the order of magnitude of the SA joint fatigue life is 106 (average of 1.1 × 10⁶), while that of the AS joint is 105 (average of 5.1 × 10⁵). So, the loads corresponding to the three magnitudes of the SA joint are determined as 2.96 kN (106), 3.05 kN (106), 3.48 kN (105), and 4.22 kN (104). When the load adopted is 2.83 kN, the fatigue cycles of the SA joint exceed 2 million and are not used for F-N curve fitting. Moreover, for the AS joint, the loads adopted in the fatigue test are 2.61 kN (106), 3.05 kN (105), 3.48 kN (105), and 4.22 kN (104), respectively.
Based on the fatigue life data, the F-N curve is obtained by exponential asymptotic function, as shown in Figure 10 and Equations (1)–(2).
SA joint:
lgN = 5.13 − 1.39lg(F − 2.81)
AS joint:
lgN = 5.51 − 2.57lg(F − 2.16)
where N is the number of fatigue cycles and F is the fatigue load, kN.
As shown in Figure 10, no intersection exists between the F-N curves of the SA joint and the AS joint. The fatigue lives of SA joints are all higher by 98.4%, 88.3%, and 118.1% than AS joints under high, medium, and low loads. The fatigue property of the SA joint is better than the AS joint, and the AS joint is always more prone to fatigue failure prematurely. When the loads are 2.96 kN and 2.61 kN, the fatigue cycles are almost close to 2 million times. As the load further reduces, the fatigue cycles exceed 2 million times, and the F-N curve tends to be horizontal.
After the SPR joint-forming process, dense surface contact is formed between components due to the forming pressure. When the joint is subjected to tensile load or cyclic load, it is the “bearing” structure (formed by rivets and sheets), as well as the interface friction between components, that sustains loading. In Figure 6, the residual bottom thickness of the SA joint is larger compared with the AS joint. Meanwhile, the undercut value of the SA joint is also larger than the AS joint, and the rivet pierced deeper into the lower sheet. Then, under cyclic load, the self-locking structure can withstand greater fretting wear [47]. Under the cyclic loading, the fretting damage accumulation rate of the SA joint is delayed and the initiation, as well as propagation of fatigue micro-cracks, are also delayed. Consequently, higher fatigue life is obtained. As for the AS joint, the deformation degree of the rivet is relatively insufficient, and the relative motion speed and motion amplitude of the rivet and sheets are larger than the SA joint. So, the fretting wear and even fatigue crack initiation come about prematurely.

3.3.2. Fatigue Property of a Two-Rivet Joint

In the tensile tests, there are little differences in maximum loads among the SAT, AST, and SAF samples. A total of 70% of the maximum tensile load (8.14 kN) is set as the load in the fatigue test. As demonstrated in Figure 11, the fatigue life of SAT sample is about 1.30 times that of the AST sample, while the fatigue life of the SAF sample is 2.14 times that of the AST sample and 1.64 times that of SAT sample. So, it can be concluded that the fatigue performance of two-rivet joints is related not only to sheet stack sequence but also to the riveting directions [48].
Compared with the AST sample, two riveting structures in the thicker aluminum alloy sheet in the SAT sample are obtained. According to the section measurement and comparison (Figure 6), the undercut and residual bottom thickness of the SA joint are higher than the AS joint, i.e., two self-locking structures with higher quality are obtained in the SAT joint. When the sample is subjected to cyclic load, the self-locking structure, as well as the friction between sheets, bear the cyclic load [49]. The loading cycle will be extended if the self-locking structure is of good quality. Therefore, the fatigue life of the SAT sample is higher than the AST sample. Compared with the SAT and AST samples, the two rivets in the SAF sample are embedded into sheets in opposite directions. The forming parameters of one self-locking structure are lower relatively. The SPR structures formed on the surface of upper and lower sheets can better inhibit the relative tiny motion of the two sheets under cyclic load, and consequently, the fretting wear accumulation can be delayed [50,51]. Meanwhile, the locking function of two rivets can restrain the motion of sheets along the direction perpendicular to the load. So, the friction force can be kept at a larger amount and the contact friction between the two sheets can be kept for a long time. So, the failure of the SPR structure can be delayed.
Based on the above fatigue life in Figure 11a, the F-N curve of the SAF joint is obtained by exponential asymptotic function, as shown in Equation (3):
lgN = 6.16 − 2.18lg(F − 3.39)
where N is the number of fatigue cycles and F is the fatigue load, kN.
In Figure 11b, it can be discovered that the fatigue life of the SAF sample increases notably with the decrease in fatigue load. Under the action of cyclic loading, the tiny relative motion of components in the SPR structure causes the fretting wear on the contact surface of the rivet and sheets. The damage to the joint gradually accumulates with the increase in fatigue cycles, and the microscopic damage evolves into the macroscopic fracture failure of the sheet in the last stage of fatigue loading. The static load and dynamic load in the fatigue test decrease with a decrease in the applied load level. Consequently, the motion amplitude of components in the SPR structure decreases, the wear speed of the material in the contact surface area slows down, and the initiation of a fatigue crack is delayed.
In the fatigue tests of two-rivet joints, when 70% of the maximum tensile load (8.14 kN) is taken as fatigue load, the fatigue life of SAT, AST, and SAF joints are about 1.85 × 10⁵, 1.42 × 10⁵, and 3.04 × 10⁵, respectively. However, in the fatigue tests of single-rivet joints, when 97% of the maximum tensile load (4.35 kN) is adopted, the fatigue life of the SA joint and AS joint are about 8.5 × 10⁴ and 4.3 × 10⁴. The fatigue life ratios of two-rivet joints to single-rivet joints are about 2.17, 4.30, 1.67, 3.30, 3.57, and 7.07. The fatigue load (5.69 kN) of two-rivet joints is higher than that of single-rivet joints (4.22 kN). So, it can be concluded that the fatigue strength of two-rivet joints is significantly better than single-rivet joints at high load levels.
Taking the SA, AS, and SAF joints into consideration, the fatigue life of the three joints is shown in Table 4. The value (4.22 kN) is the fatigue load in the fatigue test of single-rivet joints, and the others (4.88, 5.69, and 6.51 kN) are the fatigue loads used in the fatigue tests of SAF joints. In the value ranges of fatigue load, the fatigue life of the SAF joint is always significantly higher than that of the SA and AS joints. With the increase in fatigue load, the fatigue life ratios of SAF joints to SA and AS joints decrease. Compared with the single-rivet joints, the fatigue property of two-rivet joints can be notably improved by riveting in opposite directions.

3.4. Fatigue Failure Mechanism of the SPR Joint

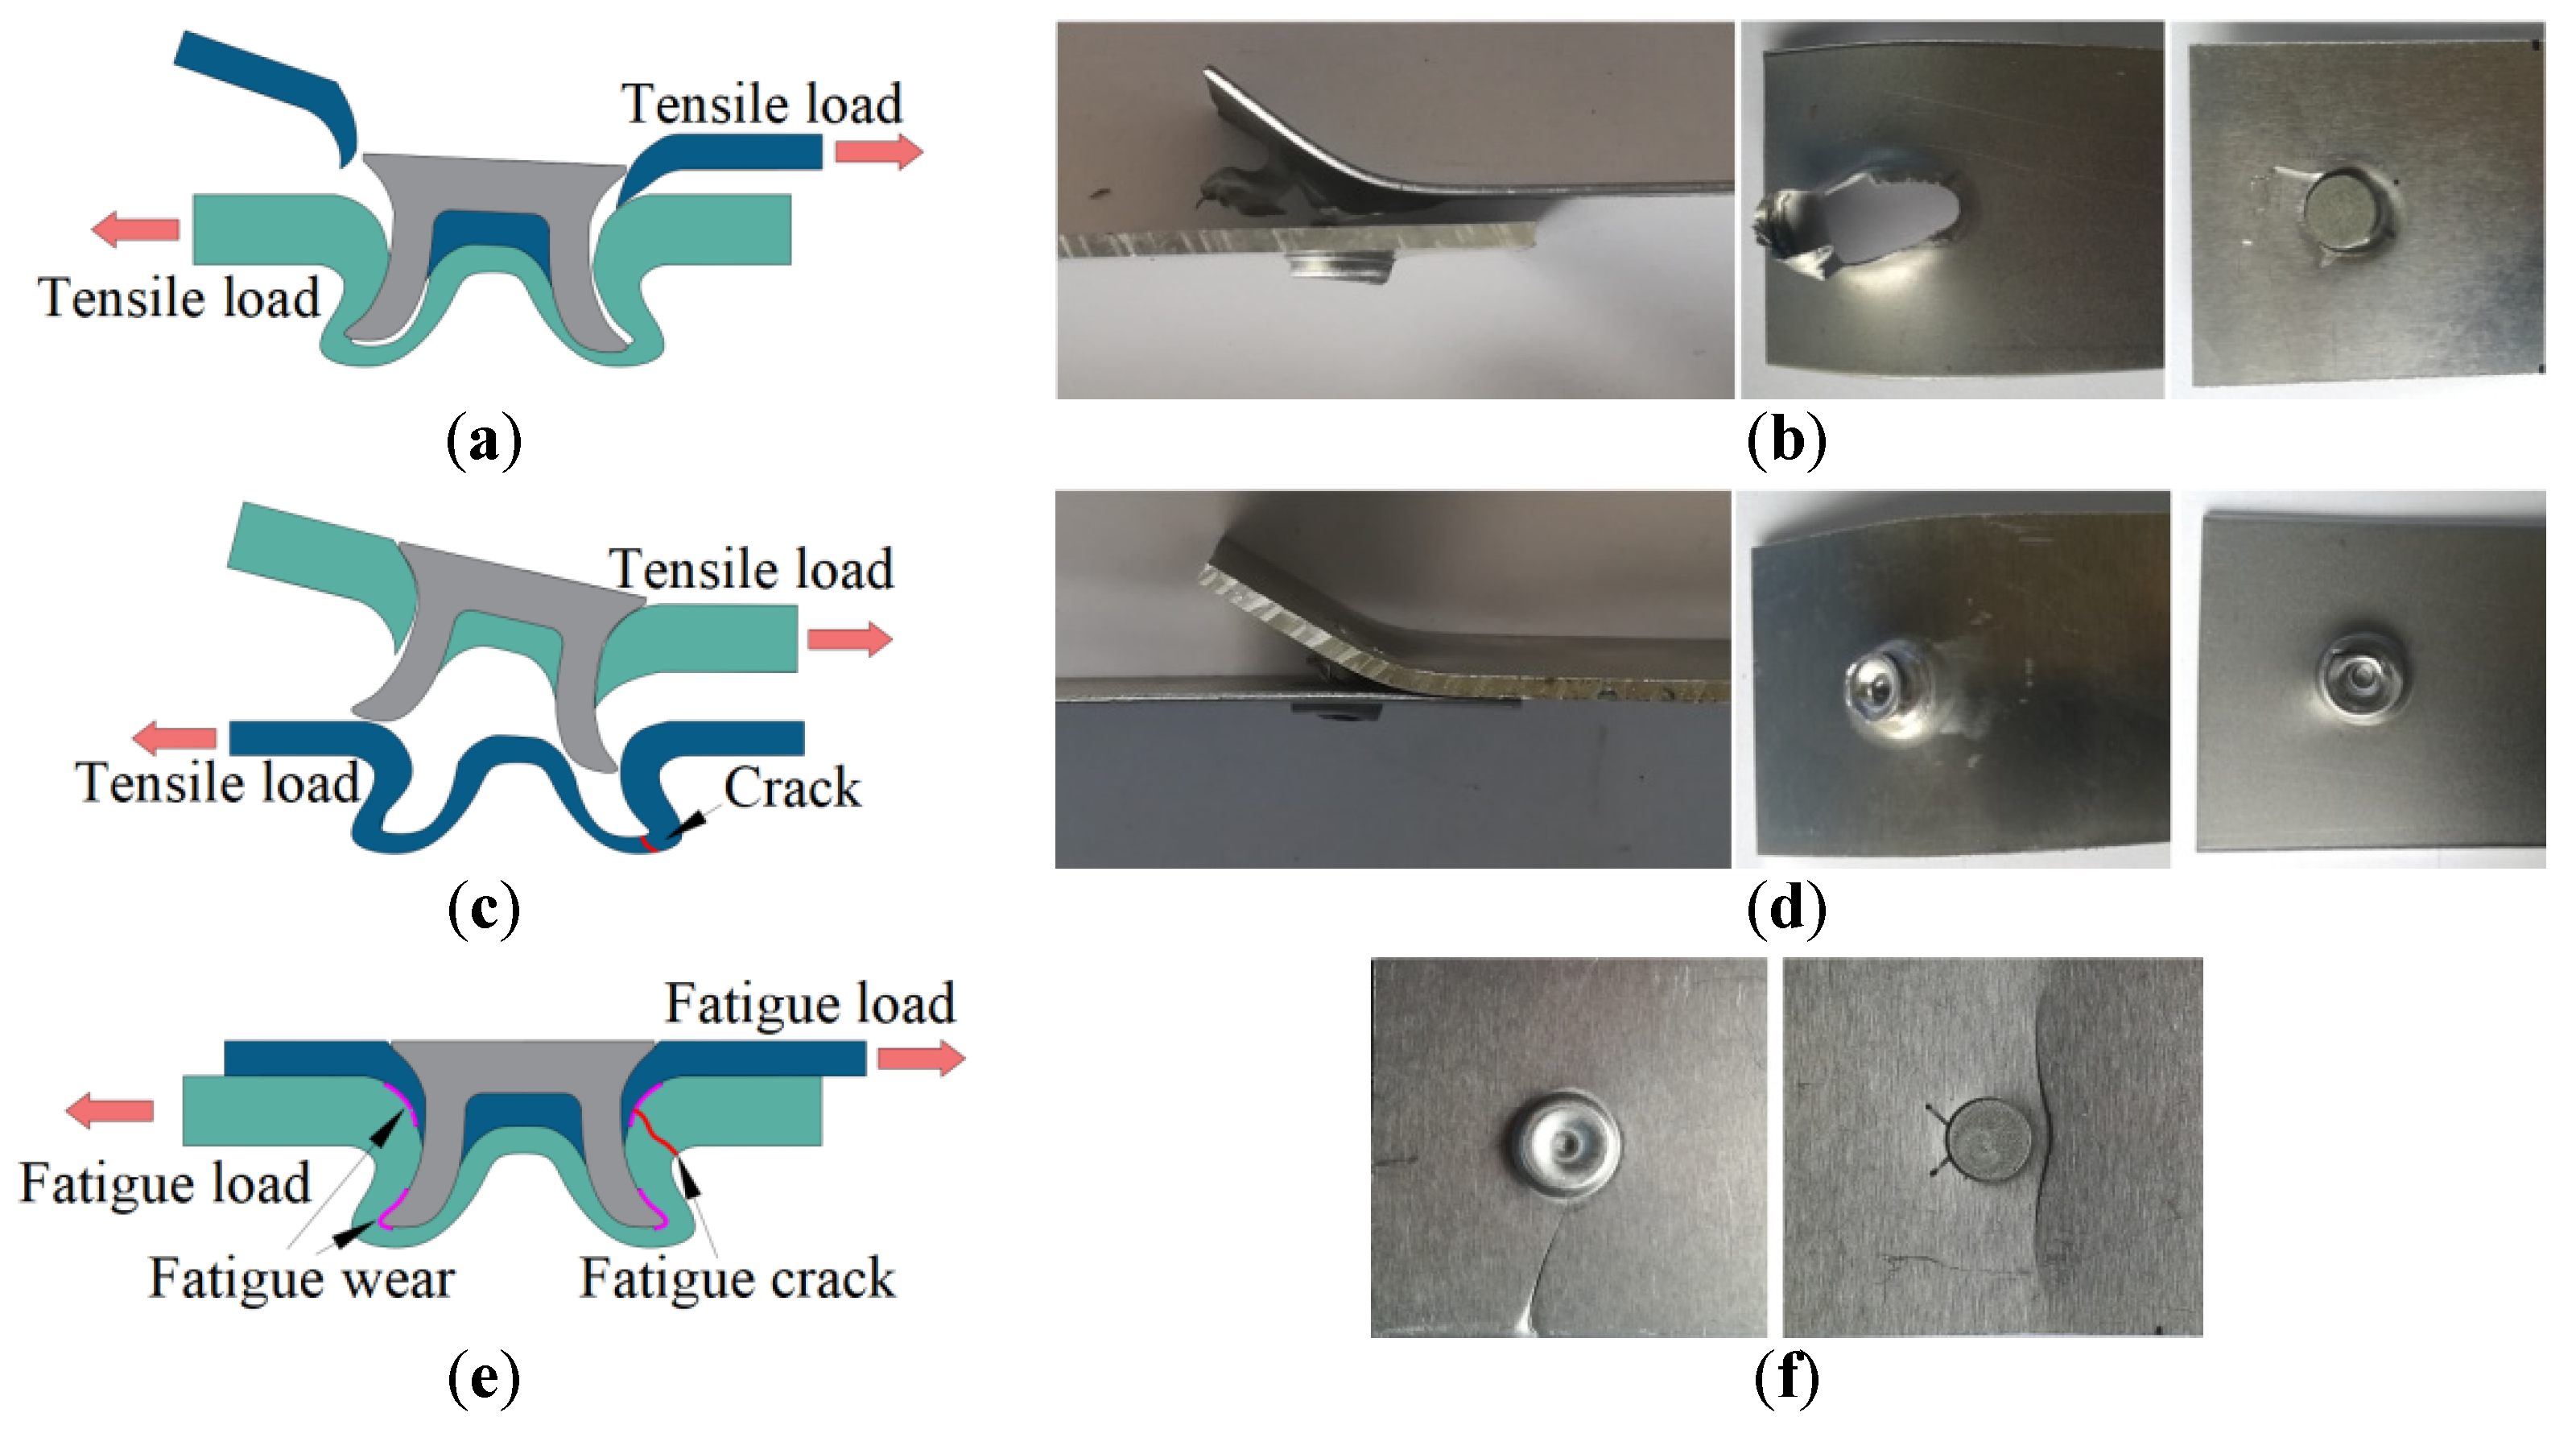
3.4.1. Fatigue Failure Modes

Under cyclic load, the failure modes of steel/aluminum SPR joints are usually the macroscopic fracture of aluminum sheets [27,52]. In the fatigue tests of B1500HS/AA5052 SPR joints, the fatigue fractures of AA5052 sheets occurred and no fatigue cracks appeared on B1500HS sheets. The fatigue fractures of AA5052 sheets are presented in Figure 12. As for the SA joint, the crack extends unidirectionally from the riveting point to the edge of the sheet, and an obvious necking phenomenon can be found at the crack end, and no macroscopic cracks appear on the other side (Figure 12a). The wing-like fatigue crack in the AS joint distributes symmetrically along the direction of sheet width, and the crack does not extend to the edge of the AA5052 sheet (Figure 12b). Moreover, the location where the fatigue crack distribution tends to move away from the riveting point as the fatigue load decreases (Figure 12c). The distribution of fatigue cracks is evidence that the fatigue load has a relatively great effect on fatigue crack initiation location. The crack mainly initiates in the contact area between the rivet and sheet under a bigger load. The crack initiates in the contact zone of the upper and lower sheets far away from the riveting point when the joints are subjected to a smaller load.
As for the SAT, AST, and SAF joints, the fatigue failure modes are all the fractures of AA5052 sheets, and the failure sites are near the rivet and far away from the short edge of the AA5052 sheet in the overlap area. Similar to the single-rivet joint, the fatigue crack of the SAT sample distributes on one side of the riveting point (Figure 12d), and the fatigue cracks of the AST and SAF samples extend to both edges along the sheet width direction (Figure 12e,f). Once the observable macroscopic crack appears, it will rapidly extend along the sheet width direction until the final fatigue failure.

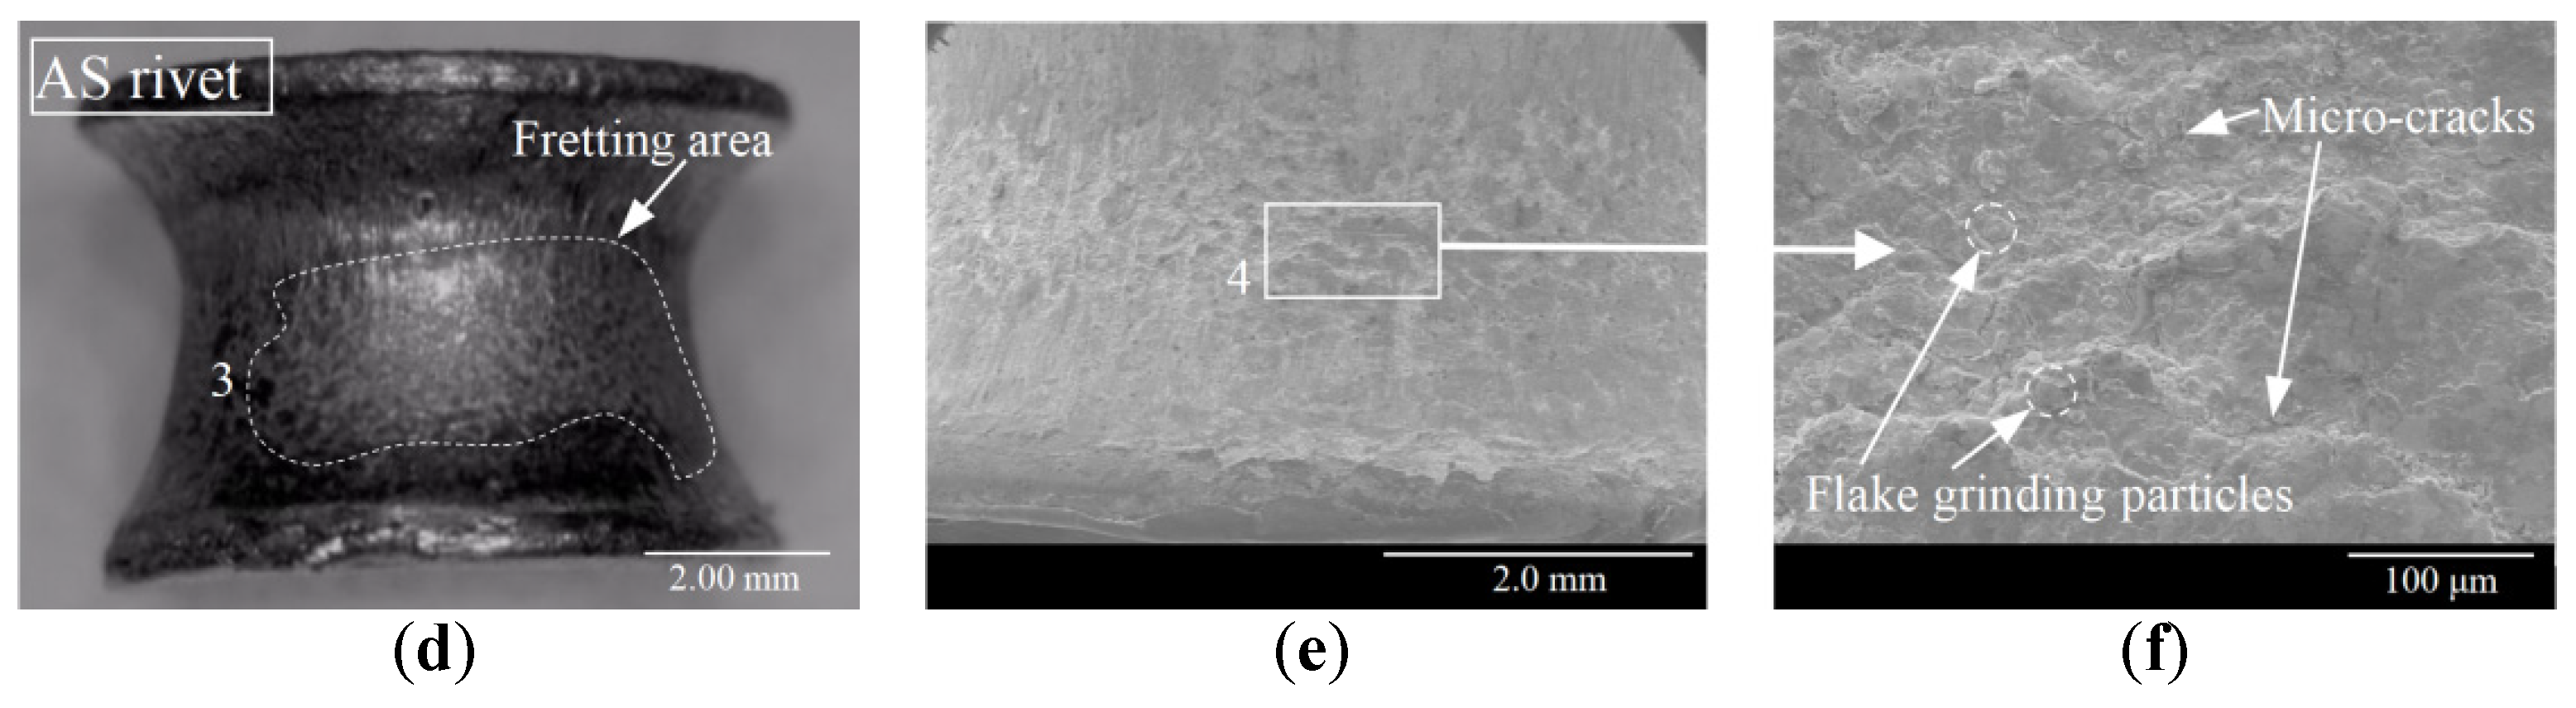
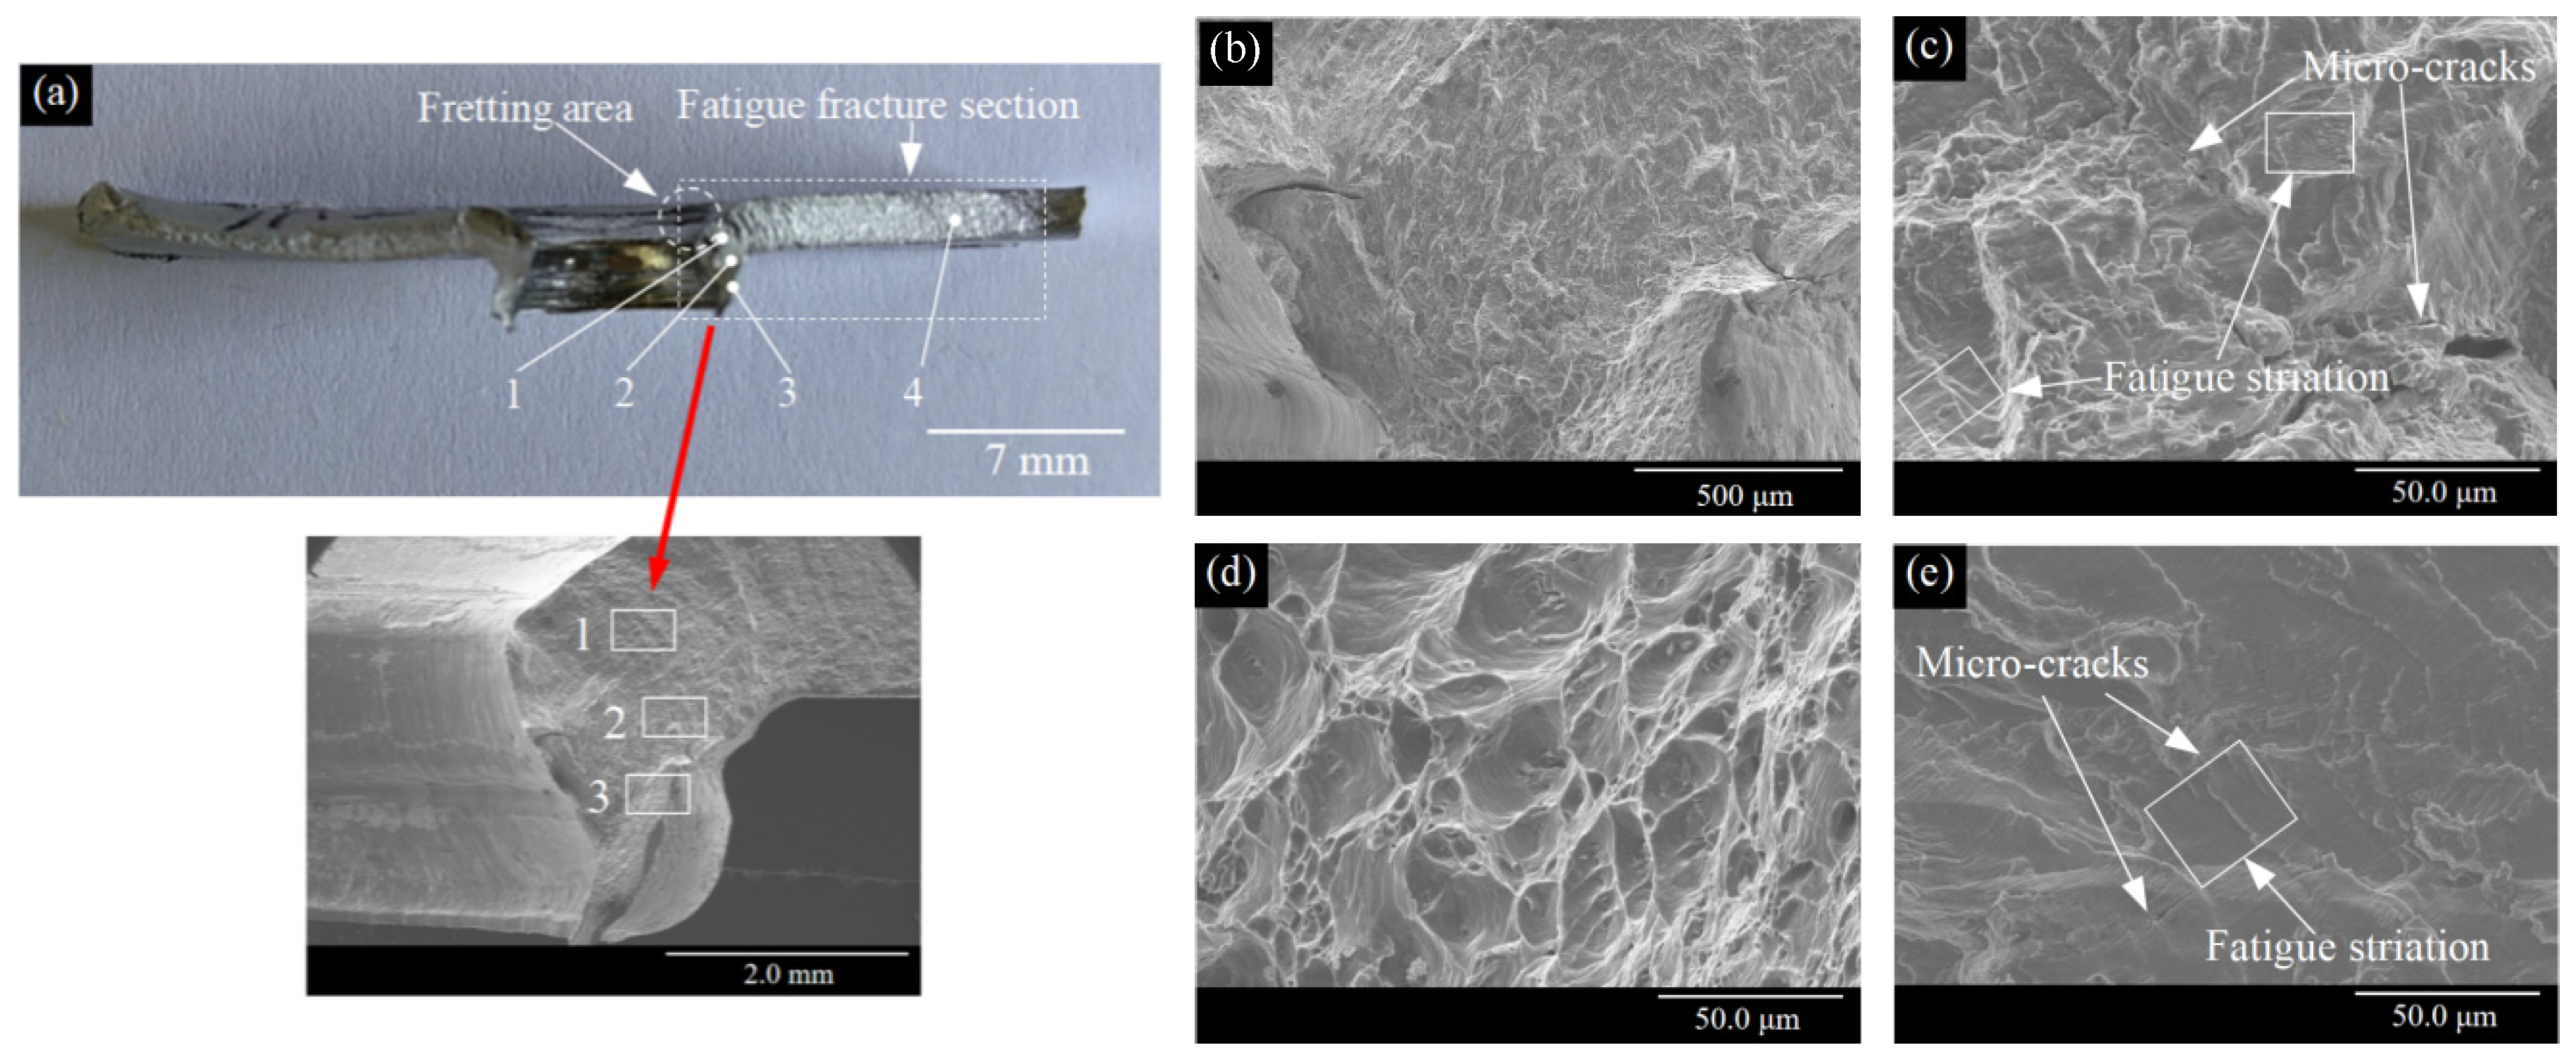
3.4.2. Fatigue Failure Mechanisms

To analyze the fatigue failure mechanism of rivets in SPR joints, the samples after the fatigue test were tensile deformed in an RGM4030 tensile testing machine until complete sheet fracture along the fatigue crack. Then, the sheets were dissected along the meridian line of the rivet center using a line-cutting machine, and finally, the rivets could be taken out. Figure 13 shows the macro-morphology and micro-morphology of the SA rivet and AS rivet, and obvious macroscopic cracks (area 1 and area 2) can be found on the outer surface of the rivet in the SA joint, indicating that considerable damage to the rivet is produced, and two kinds of fatigue crack forms, i.e., the fracture of the AA5052 sheet and the fracture of the rivet in the SA joint are generated (Figure 13a). Figure 13b,c is the magnified morphology of area 1 and area 2, respectively. There is an obvious black wear trace in the area where cracks distribute. The cracks propagate along the rivet circumference from the wear area. Many micro-cracks distribute on both sides of the macro-cracks, and lots of granular debris can be observed, evidencing that fretting wear occurs in the middle and lower area of the outer surface of the rivet under cyclic loading. The fretting wear will promote the initiation and propagation of cracks in the rivet [52].
As for the AS joint, a large area of wear traces (Figure 13d, area 3) can be noticed on the external surface of the rivet. Figure 13f is the magnified morphology of area 4 (Figure 13e), and many micro-cracks, flake grinding particles, and material delamination can be found. However, no macroscopic fatigue cracks are formed. Compared with the SA joint, premature fatigue failure occurs when the AS joint is subjected to the same fatigue load. Due to the physical property difference between the sheet and the rivet, the propagation rates of micro-cracks in the AA5052 sheet caused by fretting wear are higher than the rivet. Therefore, the fatigue failure mode of AS joint is only the AA5052 sheet fracture, while there is no macroscopic fracture of the rivet.
The fatigue cracks of AA5052 sheets in the SA joint and the SAT joint are initiated from the riveting point and then extended laterally to one edge of the sheets. The fatigue fracture section (right area) and the morphology of the fatigue crack are shown in Figure 14. Obvious fretting wear can be observed in the contact area between sheets [53], and the typical areas of the fatigue crack section are demarcated as areas 1, 2, 3, and 4, respectively (Figure 14a). The morphology of area 1 is mainly the step-like cleavage, which is an important feature of the fatigue crack source. So, it can be inferred that fatigue cracks originate in this area (Figure 14b). Distinct fatigue striations and some secondary cracks exist in area 2, which are typical characteristics of crack propagation (Figure 14c). As seen in area 3, there are lots of dimples, indicating that the sample fails instantly as soon as the fatigue crack propagates to area 3 (Figure 14d). On the other hand, the micro-cracks are propagated along the width direction of the AA5052 sheet. Figure 14e is the micro-morphology of area 4 and obvious fatigue striation, as well as micro-cracks, can be found, which indicates that this area belongs to the fatigue crack propagation phase. A certain number of dimples can also be observed at the end of the fatigue crack, indicating the fatigue ductile fracture.
All the fatigue cracks of the AS, AST, and SAF joints initiate from the middle area of the AA5052 sheet and propagate to both sides along the width direction of sheets, showing approximate symmetrical distribution. The typical areas of the fatigue crack section are demarcated as areas 1, 2, 3, and 4, respectively (Figure 15a). In the lower and middle areas of the AA5052 sheet, i.e., area 1 (Figure 15b), obvious step-like cleavage can be observed, and the long micro-cracks distribute along the width of the sheet, which is the initiation of fatigue cracks. In the upper region of area 1, fatigue striations and more flake delamination can be observed, which are characteristics of fatigue crack propagation.
As shown in Figure 15c, brittle fracture morphology exists in the upper region of the fracture section (area 2), which indicates that the fatigue crack initiates from the contact surface between the upper and lower sheets and then propagates along the thickness direction to the upper surface of the sheet. The morphology in Figure 15d can be roughly divided into two distinct areas, i.e., area 3 and area 4. Area 3 belongs to the crack growth morphology, and typical fatigue striations can be observed by the magnification of area 3 (Figure 15e). At the same time, there are many secondary cracks in area 3. Lots of dimples exist in area 4, indicating that rapid ductile fracture occurs at the end of the fatigue crack.
Black irregular areas (Figure 14a) can be discovered on the contact interface of the rivet, the lower sheet, and the interface between the upper and lower sheets. These black irregulars are gradually generated and expanded in the fatigue test, and the fretting wear results from the relatively tiny movement of the rivet and sheets on the contact interface under alternating load. According to the above analysis, disorderly micro-cracks exist in these areas, showing that fretting wear zones are the initiation locations of fatigue cracks. Under the fatigue load and interface normal force produced in the SPR forming process, continuous fretting and sliding of components occur on the contact interface. Consequently, the surface material is detached from the sheets due to the shear friction and adhesion caused by friction heat. The fallen debris from sheets moves on the surface of the sheet and transforms to a certain cold-welding point under extrusion. Meanwhile, the slight oxidation of particles occurs during the continuous fretting process, and the debris becomes black. With the increase in fatigue cycle times, the tear degree of surface materials increases, further resulting in increased loose debris and delamination. The increased stress concentration caused by scratches and delamination promotes the initiation of micro-cracks. The cracks are merged into macro-cracks and consequently extend along the thickness and width of the aluminum alloy sheet, finally leading to the fatigue fracture of the AA5052 sheet.
The EDS energy spectrometer is employed to analyze the elemental composition and mass fraction in the fretting wear area (Figure 16a) between the upper and lower sheet, and lots of Al, O, Mg, Fe, and other elements exist in the fretting wear area (Figure 16b,c). Among these elements, Al and O elements account for a large proportion, indicating that the black debris is mainly composed of Al2O3, i.e., the surface material of the AA5052 sheet is oxidized, and the fretting oxidation wear occurs between sheets.

4. Conclusions

The forming tests of the B1500HS/AA5052 SPR joint are carried out and the tensile properties, as well as fatigue properties, are studied. The influence of sheet sequence and riveting direction on forming quality and properties of the SPR joint and fatigue failure mechanism of the SPR joint are also discussed, and the following conclusions are drawn:
(1) Compared with the AS joint, the residual bottom thickness and undercut value of the SA joint are higher. The tensile performance of the SA joint is superior to that of the AS joint. As for joints with two rivets, little difference exists between the bearing capacity of the joints, while the resistance to deformation and damage of the SAT joint and the SAF joint is better than the AST joint.
(2) The fatigue cycles of all the SPR joints decrease with the increase in load level. There is no intersection between the F-N curves of the SA joint and the AS joint, and the fatigue life of the SA joint is always higher than the AS joint. The SAF joint with the opposite riveting direction has the utmost fatigue cycle times compared with the other two-rivet SPR joints.
(3) The fatigue failure modes of the B1500HS/AA5052 SPR joints are the fractures of the AA5052 sheet, while obvious macroscopic fatigue cracks also occur on the surface of the rivet for the SA joint. The fatigue crack usually initiates in the contact area of the sheets and then extends along the AA5052 sheet thickness direction and width direction. The fatigue cracks of the SA and SAT joints extend unidirectionally to one edge of the AA5052 sheet, while a symmetric fatigue crack of aluminum occurs for the AS, AST, and SAF joints.
(4) Obvious fretting wear occurs on the contact interface between the rivet and sheets, and fretting debris, secondary cracks, and step-like cleavage can be observed. Then, the fatigue striation occurs along both the width direction and thickness direction, and the rapid ductile fracture occurs with the production of many dimples. The elements in the fretting wear area are mainly Al and O, and continuous and severe oxidation of Al elements occurs during fatigue loading.

Author Contributions

Methodology, Y.-C.Z.; software, Y.-C.Z. and Y.-Q.J.; validation, Y.-C.Z. and Y.-Q.J.; formal analysis, Y.-C.Z., Y.-Q.J. and Y.-L.J.; investigation, Y.-C.Z. and Z.-C.H.; resources, Z.-C.H.; data curation, Y.-L.J.; writing—original draft preparation, Y.-C.Z.; writing—review and editing, Y.-Q.J. and Y.-L.J.; supervision, Z.-C.H.; project administration, Z.-C.H.; funding acquisition, Z.-C.H. All authors have read and agreed to the published version of the manuscript.

Funding

This research was funded by the National Natural Science Foundation of China grant number 51875201.

Data Availability Statement

All the raw data supporting the conclusion of this paper were provided by the authors.

Conflicts of Interest

The authors declare no conflict of interest.

Nomenclature

SymbolMeaning of the SymbolSymbolMeaning of the Symbol
Hrivet head heightkload change rate
Δbresidual bottom thicknessFstensile load
ΔuundercutΔFsincrement of tensile load
Fppunch loadStensile displacement
ΔFpincrement of punch loadΔSincrement of tensile displacement
Lpunch displacementNnumber of fatigue cycles
ΔLincrement of punch displacementFfatigue load

References

  1. Sato, F.; Nakata, T. Analysis of the impact of vehicle light weighting on recycling benefits considering life cycle energy reductions. Resour. Conserv. Recycl. 2021, 164, 105118. [Google Scholar] [CrossRef]
  2. Frank, C. Current trends in automotive lightweighting strategies and materials. Materials 2021, 14, 6631. [Google Scholar] [CrossRef]
  3. Meschut, G.; Janzen, V.; Olfermann, T. Innovative and Highly Productive Joining Technologies for Multi-Material Lightweight Car Body Structures. J. Mater. Eng. Perform. 2014, 23, 1515–1523. [Google Scholar] [CrossRef]
  4. Buffa, G.; Fratini, L.; La Commare, U.; Römisch, D.; Wiesenmayer, S.; Wituschek, S.; Merklein, M. Joining by forming technologies: Current solutions and future trends. Int. J. Mater. Form. 2022, 15, 27. [Google Scholar] [CrossRef]
  5. Mori, K.-I.; Abe, Y. A review on mechanical joining of aluminium and high strength steel sheets by plastic deformation. Int. J. Light. Mater. Manuf. 2018, 1, 1–11. [Google Scholar] [CrossRef]
  6. Li, D.Z.; Chrysanthou, A.; Patel, I.; Williams, G. Self-piercing riveting-a review. Int. J. Adv. Manuf. Technol. 2017, 92, 1777–1824. [Google Scholar] [CrossRef]
  7. Wang, J.; Zhang, G.; Zheng, X.; Li, J.; Li, X.; Zhu, W.; Yanagimoto, J. A self-piercing riveting method for joining of continuous carbon fiber reinforced composite and aluminum alloy sheets. Compos. Struct. 2020, 259, 113219. [Google Scholar] [CrossRef]
  8. Falk, T.; Schwarz, C.; Drossel, W.G. Realtime prediction of self-pierce riveting joints-prognosis and visualization based on simulation and machine learning. Key Eng. Mat. 2022, 6392, 1479–1488. [Google Scholar] [CrossRef]
  9. Grimm, T.; Drossel, W.G. Process development for self-pierce riveting with solid formable rivet of boron steel in multi-material design. Procedia Manuf. 2019, 29, 271–279. [Google Scholar] [CrossRef]
  10. Karathanasopoulos, N.; Pandya, K.S.; Mohr, D. An experimental and numerical investigation of the role of rivet and die design on the self-piercing riveting joint characteristics of aluminum and steel sheets. J. Manuf. Process 2021, 69, 290–302. [Google Scholar] [CrossRef]
  11. Liu, Y.P.; Li, H.; Zhao, H.; Liu, X.P. Effects of the die parameters on the self-piercing riveting process. Int. J. Adv. Manuf. Technol. 2019, 105, 3353–3368. [Google Scholar] [CrossRef]
  12. Haque, R. Quality of self-piercing riveting (SPR) joints from cross-sectional perspective: A review. Arch. Civ. Mech. Eng. 2018, 18, 83–93. [Google Scholar] [CrossRef]
  13. Mori, K.; Abe, Y.; Kato, T. Self-pierce riveting of multiple steel and aluminum alloy sheets. J. Mater. Process Technol. 2014, 214, 2002–2008. [Google Scholar] [CrossRef]
  14. Ma, Y.W.; Lou, M.; Li, Y.B.; Lin, Z.Q. Effect of rivet and die on self-piercing rivetability of AA6061-T6 and mild steel CR4 of different gauges. J. Mater. Process Tech. 2017, 251, 282–294. [Google Scholar] [CrossRef]
  15. Mucha, J. The failure mechanics analysis of the solid self-piercing riveting joints. Eng. Fail. Anal 2015, 47, 77–88. [Google Scholar] [CrossRef]
  16. Haque, R. Residual stress in self-piercing riveting (SPR) joints-a review. Mater Perform. Charac. 2018, 7, 20170109. [Google Scholar] [CrossRef]
  17. Shen, K.L.; Zhang, Z.; Jiang, W.C.; Luo, Y.; Su, H.D.; Zhang, Y.F. Generation of compressive residual stress at the root of tube-to-tubesheet welded joints in a heat exchanger. Int. J. Pres. Ves. Pip. 2022, 200, 104848. [Google Scholar] [CrossRef]
  18. Zhang, X.L.; He, X.C.; Wei, W.J.; Lu, J.W.; Zeng, K. Fatigue characterization and crack propagation mechanism of self-piercing riveted joints in titanium plates. Int. J. Fatigue 2020, 134, 105465. [Google Scholar] [CrossRef]
  19. Lee, Y.I.; Kim, H.K. Effects of residual stresses on the fatigue lifetimes of self-piercing riveted joints of AZ31 Mg alloy and Al5052 Al alloy sheets. Metals 2021, 11, 2037. [Google Scholar] [CrossRef]
  20. Kang, S.H.; Han, D.W.; Kim, H.K. Fatigue strength evaluation of self-piercing riveted joints of AZ31 Mg alloy and cold-rolled steel sheets. J. Magnes Alloys 2020, 8, 241–251. [Google Scholar] [CrossRef]
  21. Bang, H.S.; Lee, W.R.; Hong, S.M.; Lee, S.Y. Mechanical properties of dissimilar A356/SAPH440 lap joints by the friction stir spot welding and self-piercing riveting. Strength Mater. 2018, 50, 63–71. [Google Scholar] [CrossRef]
  22. Lei, L.; He, X.C.; Zhao, D.S.; Zhang, Y.; Gu, F.S.; Ball, A. Clinch-bonded hybrid joining for similar and dissimilar copper alloy, aluminium alloy and galvanised steel sheets. Thin. Wall Struct. 2018, 131, 393–403. [Google Scholar] [CrossRef]
  23. Lou, M.; Li, Y.B.; Wang, Y.; Wang, B.; Lai, X.M. Influence of resistance heating on self-piercing riveted dissimilar joints of AA6060-T6 and galvanized DP590. J. Mater. Process Technol. 2014, 214, 2119–2126. [Google Scholar] [CrossRef]
  24. Jiang, H.; Gao, S.; Li, G.Y.; Cui, J.J. Structural design of half hollow rivet for electromagnetic self-piercing riveting process of dissimilar materials. Mater. Design. 2019, 183, 1–10. [Google Scholar] [CrossRef]
  25. Huang, Z.C.; Zhou, Z.J.; Jiang, Y.Q. Effect of shot peening on static and fatigue properties of self-piercing riveting joints. J. Mater. Res. Technol. 2022, 18, 1070–1080. [Google Scholar] [CrossRef]
  26. Moroni, F. Fatigue behaviour of hybrid clinch-bonded and self-piercing rivet bonded joints. J. Adhesion. 2019, 95, 577–594. [Google Scholar] [CrossRef]
  27. Heidrich, D.; Zhang, F.; Fang, X. Fatigue strength of rivet resistance spot welding technique in comparison with self-piercing riveting for multi-material body-in-white structure. J. Mater. Eng. Perform. 2021, 305, 3806–3821. [Google Scholar] [CrossRef]
  28. Deng, L.; Lou, M.; Li, Y.B.; Carlson, B.E. Thermally assisted self-piercing riveting of AA6061-T6 to ultrahigh strength steel. J. Manuf. Sci. Eng. 2019, 141, 101006. [Google Scholar] [CrossRef]
  29. Zhou, Z.J.; Huang, Z.C.; Jiang, Y.Q.; Tang, N.L. Joining properties of SPFC440/AA5052 multi-material self-piercing riveting joints. Materials 2022, 15, 2962. [Google Scholar] [CrossRef]
  30. Wan, S.M.; Hu, S.; Li, S.Y.; Zhang, L.H.; Liu, X.Q. Process parameters and joint evaluation of self-piercing riveting with half-hollow rivets. J. Tianjin Univ. 2007, 40, 495–498. [Google Scholar]
  31. Porcaro, R.; Hanssen, A.G.; Langseth, M.; Aalberg, A. Self-piercing riveting process: An experimental and numerical investigation. J. Mater. Process Technol. 2006, 171, 10–20. [Google Scholar] [CrossRef]
  32. Hua, Q.A. An overview of self-piercing riveting process with focus on joint failures, corrosion issues and optimisation techniques. Chin. J. Mech. Eng.-En. 2021, 34, 100–124. [Google Scholar]
  33. Du, Z.P.; Duan, L.B.; Jing, L.J.; Cheng, A.G.; He, Z.C. Numerical simulation and parametric study on self-piercing riveting process of aluminium-steel hybrid sheets. Thin. Wall Struct. 2021, 164, 107872. [Google Scholar] [CrossRef]
  34. Hirsch, F.; Müller, S.; Machens, M.; Staschko, R.; Fuchs, N.; Kästner, M. Simulation of self-piercing rivetting processes in fibre reinforced polymers: Material modelling and parameter identification. J. Mater. Process Technol. 2017, 241, 164–177. [Google Scholar] [CrossRef]
  35. Çavuşoğlu, O.; Bakırcı, A.; Dinkçi, H.; Yılmazoğlu, A.G. Triple joining of different sheets with self-pierce riveting method. Sci. Technol. Weld. Joi. 2022, 27, 579–585. [Google Scholar] [CrossRef]
  36. Tian, H.; Xing, B.Y.; Zhang, H.S.; Wang, K.W.; Zeng, K.; He, X.C. A study on non-destructive testing of geometrical parameters of self-piercing riveting joints using an acoustic microscope with a scanning focusing converter. Nondestruct. Test Eval. 2022. [Google Scholar] [CrossRef]
  37. Stanzl-Tschegg, S.E.; Mayer, H. Fatigue and fatigue crack growth of aluminium alloys at very high numbers of cycles. Int. J. Fatigue 2001, 23, 231–237. [Google Scholar] [CrossRef]
  38. Shi, Z.F.; Li, Y.L.; Suo, T.; Liu, Y.Y.; Zeng, N.; Liu, X.D. Influence of loading frequency on the high cycle fatigue properties of metallic and alloy. J. Mater. Sci. Eng. 2009, 27, 488–492. [Google Scholar]
  39. Huang, Z.C.; Jia, Y.L.; Jiang, Y.Q.; Zhang, Y.C. Mechanical properties and fatigue failure mechanisms of purely self-piercing riveted (SPR) and hybrid (SPR-bonded) joints under salt spray environment. J. Mater. Res. Technol. 2022, 20, 2501–2517. [Google Scholar] [CrossRef]
  40. Haque, R.; Durandet, Y. Investigation of self-pierce riveting (SPR) process data and specific joining events. J. Manuf. Process 2017, 30, 148–160. [Google Scholar] [CrossRef]
  41. Liu, Y.; Zhuang, W.M.; Luo, Y.F.; Xie, D.X.; Mu, W.L. Joining mechanism and damage of self-piercing riveted joints in carbon fibre reinforced polymer composites and aluminium alloy. Thin. Wall Struct. 2023, 182, 110233. [Google Scholar] [CrossRef]
  42. Jia, Y.L.; Huang, Z.C.; Zhang, Y.C.; Zhang, F. Forming quality and fatigue behavior of self-piercing riveted joints of DP590 and AA6061plates. Adv. Mater. Sci. Eng. 2021, 2022, 4381544. [Google Scholar]
  43. Xie, Z.Q.; Yan, W.M.; Cheng, Y.; Mu, T.T.; Song, L.L. Improved shear strength design of cold-formed steel connection with single self-piercing rivet. Thin. Wall Struct. 2018, 131, 708–717. [Google Scholar] [CrossRef]
  44. Kotadia, H.R.; Rahnama, A.; Sohn, I.R.; Kim, J.; Sridhar, S. Performance of dissimilar metal self-piercing riveting joint and coating behavior under corrosive environment. J. Manuf. Process 2019, 39, 259–270. [Google Scholar] [CrossRef]
  45. Wei, W.J.; He, X.C.; Zhang, X.L.; Lu, J.W. Characteristics of fretting damage in hybrid DP780/AA6061 self-piercing riveted joints. J. Mech. Eng. 2020, 56, 169–175. [Google Scholar]
  46. Gao, Z.T.; Fu, H.M.; Liang, M.X. A method for fitting S-N curve. J. Beijing Univ. Aeronaut. Astronaut. 1987, 1, 115–119. [Google Scholar]
  47. Rao, H.M.; Kang, J.D.; Huff, G.; Avery, K. Impact of specimen configuration on fatigue properties of self-piercing riveted aluminum to carbon fiber reinforced polymer composite. Int. J. Fatigue 2018, 113, 11–22. [Google Scholar] [CrossRef]
  48. Iyer, K.; Hu, S.J.; Brittman, F.L.; Wang, P.C.; Hayden, D.B.; Marin, S.P. Fatigue of single- and double-rivet self-piercing riveted lap joints. Fatigue Fract. Eng. M 2005, 28, 997–1007. [Google Scholar] [CrossRef]
  49. Presse, J.; Michler, T.; Künkler, B. Fatigue life performance of multi-material connections hybrid joined by self-piercing rivets and adhesive. Mater. Test 2020, 62, 973–978. [Google Scholar] [CrossRef]
  50. Du, G.; Xing, Y.; Li, X. Fatigue properties of self-piercing riveted multi-rivet joints in steel and aluminum sheets. Mater Sci. Eng. Technol. 2019, 50, 1495–1502. [Google Scholar] [CrossRef]
  51. Moraes, J.F.C.; Rao, H.M.; Jordon, J.B.; Barkey, M.E. High cycle fatigue mechanisms of aluminum self-piercing riveted joints. Fatigue Fract. Eng. M 2017, 41, 57–70. [Google Scholar] [CrossRef]
  52. Huang, L.; Bonnen, J.; Lasecki, J.; Guo, H.D.; Su, X.M. Fatigue and fretting of mixed metal self-piercing riveted joint. Int. J. Fatigue 2016, 83, 230–239. [Google Scholar] [CrossRef]
  53. Jin, Z.; Mallick, P.K. Enhancement of fatigue life of self-piercing riveted joints by coining. In Proceedings of the ASME International Mechanical Engineering Congress & Exposition, New Orleans, LA, USA, 17–22 November 2002. [Google Scholar]
Figure 1. Geometry and sizes of the rivet and die (Unit: mm).
Metals 13 00328 g001
Figure 2. Forming process and geometry sizes of the SPR specimen. (a) Clamping; (b) puncture; (c) expansion; (d) forming; (e) single-rivet joint; (f) two-rivet joint (unit: mm).
Metals 13 00328 g002
Figure 3. (a) Tensile failure mode of SA joint; (b) tensile failures of SA joint; (c) tensile failure mode of AS joint; (d) tensile failures of AS joint; (e) fatigue failure mode; (f) fatigue failures of joints.
Metals 13 00328 g003
Figure 4. The Fp-L curve and k-L curve of (a) the SA joint and (b) AS joint.
Metals 13 00328 g004
Figure 5. Section profile comparison. (a) Experiment section and simulation section of the SA joint; (b) experiment section and simulation section of the AS joint; (c) original profile and deformed profiles of rivets.
Metals 13 00328 g005
Figure 6. Forming parameters of the two joints.
Metals 13 00328 g006
Figure 7. The tensile test process of the SA joint.
Metals 13 00328 g007
Figure 8. Tensile property of single-rivet joints. (a) Fs-S curves and k-S curves; (b) test values.
Metals 13 00328 g008
Figure 9. Tensile property of two-rivet joints. (a) Fs-S curves and k-S curves; (b) test values.
Metals 13 00328 g009
Figure 10. F-N curves of the SA joint and the AS joint.
Metals 13 00328 g010
Figure 11. The fatigue life of two-rivet joints. (a) A comparison of two-rivet joints; (b) F-N curve of the SAF joint.
Metals 13 00328 g011
Figure 12. Fatigue failure modes of SPR joints. (a) SA; (b) AS-1; (c) AS-2; (d) SAT; (e) AST; (f) SAF.
Metals 13 00328 g012
Figure 13. Micro-morphologies of the SA rivet and AS rivet. (a) SA rivet; (b) cracks of area 1; (c) micro-cracks of area 2; (d) AS rivet; (e) fretting wear of area 3; (f) micro-cracks of area 4.
Metals 13 00328 g013aMetals 13 00328 g013b
Figure 14. Fatigue fracture micro-morphology of AA5052 sheet in the SA joint. (a) Macroscopic morphology of the fatigue fracture; (b) magnified morphology of area 1; (c) micro-morphology of area 2; (d) micro-morphology of area 3; (e) micro-morphology of area 4.
Metals 13 00328 g014
Figure 15. Fatigue fracture micro-morphology of AA5052 sheet in the AS joint. (a) Macroscopic morphology of fatigue fracture; (b) micro-morphology of area 1; (c) micro-morphology of area 2; (d) micro-morphology of areas 3 and 4; (e) magnified morphology of area 3.
Metals 13 00328 g015
Figure 16. Morphology of contact interface between sheets. (a) Morphology of contact interface; (b) element composition; (c) mass fraction of the elements.
Metals 13 00328 g016
Table 1. Chemical compositions of B1500HS and AA5052 sheets (wt.%).
B1500HSCMnSiPSBCrNiFe
0.211.350.280.00550.0040.00330.230.10Bal.
AA5052SiCuMgZnMnCrFeAl
0.250.102.20.100.100.150.4Bal.
Table 2. Mechanical properties of B1500HS and AA5052 sheets.
Tensile Strength (MPa)Yield Strength (MPa)Young Modulus (GPa)Elongation (%)
B1500HS42820621218.9
AA5052235907013.5
Table 3. Parameters in the finite element model.
Punch Velocity (mm/s)Blank Holder Force (kN)Stiffness of Die Spring (N·mm−1)Meshing Size (mm) Friction
202.5 5000.1 (rivet)/0.15 (sheets)0.22 (Lower sheet die)
0.12 (Others)
Table 4. Fatigue life comparison of single-rivet joints and two-rivet joints.
Fatigue Load
(kN)
Fatigue Life (×103)
SAASSAF
4.2283.1850.122187.76
4.8848.9824.55818.0
5.6930.9012.59224.69
6.5121.877.41111.94
Disclaimer/Publisher’s Note: The statements, opinions and data contained in all publications are solely those of the individual author(s) and contributor(s) and not of MDPI and/or the editor(s). MDPI and/or the editor(s) disclaim responsibility for any injury to people or property resulting from any ideas, methods, instructions or products referred to in the content.

