1. Introduction
Recently, as environmental regulations related to greenhouse gases are strengthened worldwide, research for developing high-performance materials is being conducted to reduce carbon dioxide emissions and improve the economic efficiency of thermal power plants. To meet these regulations and improve economic efficiency, it is important to increase steam temperature and pressure in power plants [
1,
2]. As a result of this demand, many researchers have conducted studies to develop new alloys with excellent high-temperature strength. Ni-based superalloys are widely used in many extreme engineering applications because of their excellent creep properties, fatigue resistance, and corrosion resistance [
2,
3,
4]. Many kinds of Ni-based superalloys with excellent mechanical properties have been developed [
5,
6,
7]. For example, alloys 230 and 282 have been developed by the Haynes International company and alloys 617, 263, 740, and 740 H have been developed by Special Metals Corporation in the USA. Alloy 740H is known to be one of the candidate boiler materials available for steam temperatures higher than 700 °C in thermal power plants. It was developed by increasing the Al content and limiting the contents of Nb, Ti, and B to inhibit the formation and growth of the G phase ((Nb,Ti)
6(Ni,Co)
16Si
7) based on alloy 740 [
8,
9,
10]. Alloy 740H has high creep strength due to precipitation strengthening by the gamma prime (γ′) phase, which is an intermetallic compound with an L12 ordered face-centered cubic structure with composition Ni
3(Al,Ti) [
11,
12,
13,
14].
Generally, it is recognized that the mechanical properties of Ni-based superalloys are closely related to the composition, diameter, fraction, morphology, and distribution of the γ′ phase. Moreover, the strength of Ni-based superalloys originates from the order strengthening of the γ′ phase, which can act as pinning particles to interfere with the movement of dislocation. Shearing by dislocation pairs with the same Burgers vector is the main deformation mechanism to minimize the total area energy formed by single dislocations in Ni-based superalloys. That is, the movement of trailing dislocation removes the antiphase boundary (APB) formed by the movement of the leading dislocation through the γ′ phase. This is called the order strengthening of precipitates cut by dislocations. The amount of order strengthening depends on the APB energy and diameter of the γ′ phase. As a result, the γ′ phase can inhibit the motion of dislocations as the passing of a perfect dislocation from the γ to the γ′ phase can lead to the formation of the APB [
15]. Furthermore, many studies have reported on the APB energy of the γ′ phase, which has a significant effect on shearing the γ′ phase in a larger number of Ni-based alloys. Enomoto and Harada [
16] have reported that Ti can interact more strongly with Ni than Al, which can increase the lattice parameter of the γ′ phase and lattice misfit as well as the APB energy [
16,
17,
18]. Also, Dodaran [
19], Gorbatov [
20], and Chen [
21] have calculated the change in the APB energy using an ab initio calculation method. They reported that the APB energy was increased with increasing percentages of Ti. Ti is known by other researchers to be advantageous for high-temperature strength.
However, there is a risk of eta (η) phase precipitation, known as D0
24 crystal structure (HCP), with composition Ni
3(Ti,Nb), when Ti content exceeds the critical value [
22,
23,
24]. It has been reported that the η phase is formed in Ni-based alloys with consumption of the γ′ phase, which can induce formation of the γ′ phase depletion zone [
23,
25,
26,
27]. Consequently, as Ti increases, the possibility of the η phase also increases.
As mentioned above, the strength increases as the amount of Ti is increased. However, it is necessary to appropriately control the amount of Ti and Al to retard the formation of the η phase for improving high-temperature strength. Also, the increase in the APB energy of the γ′ phase by adding Ti is expected to make it difficult to shear the γ′ phase by dislocations.
In this study, four alloys with different Ti/Al atomic ratios were designed in which the content of Ti + Al was increased to 5.0 at% without any composition change in other alloying elements except for Ti and Al in 740H (4.4 at%). Hardness and microstructural changes of alloys were investigated using scanning electron microscopy (SEM) and transmission electron microscopy (TEM) after exposure to 750 °C, 800 °C, and 850 °C for up to 10,000 h. Also, order strengthening mechanisms by the γ′ phase were investigated by comparing the theoretical and experimental results.
2. Experimental Procedure
The volume fraction of the γ′ phase was predicted with thermodynamic calculation software (Thermo-calc with TCNI6, Thermo Calc, Stockholm, Sweden). Representative precipitates in Ni-based superalloys included M
23C
6, MC, γ′, and η phases. In designed alloys, the MC phase has less than 0.5%, and the M
23C
6 phase has less than 0.7% equilibrium volume fraction. Therefore, it was considered that they would not significantly affect materials since these carbides have relatively low volume fractions compared to the γ′ phase [
28].
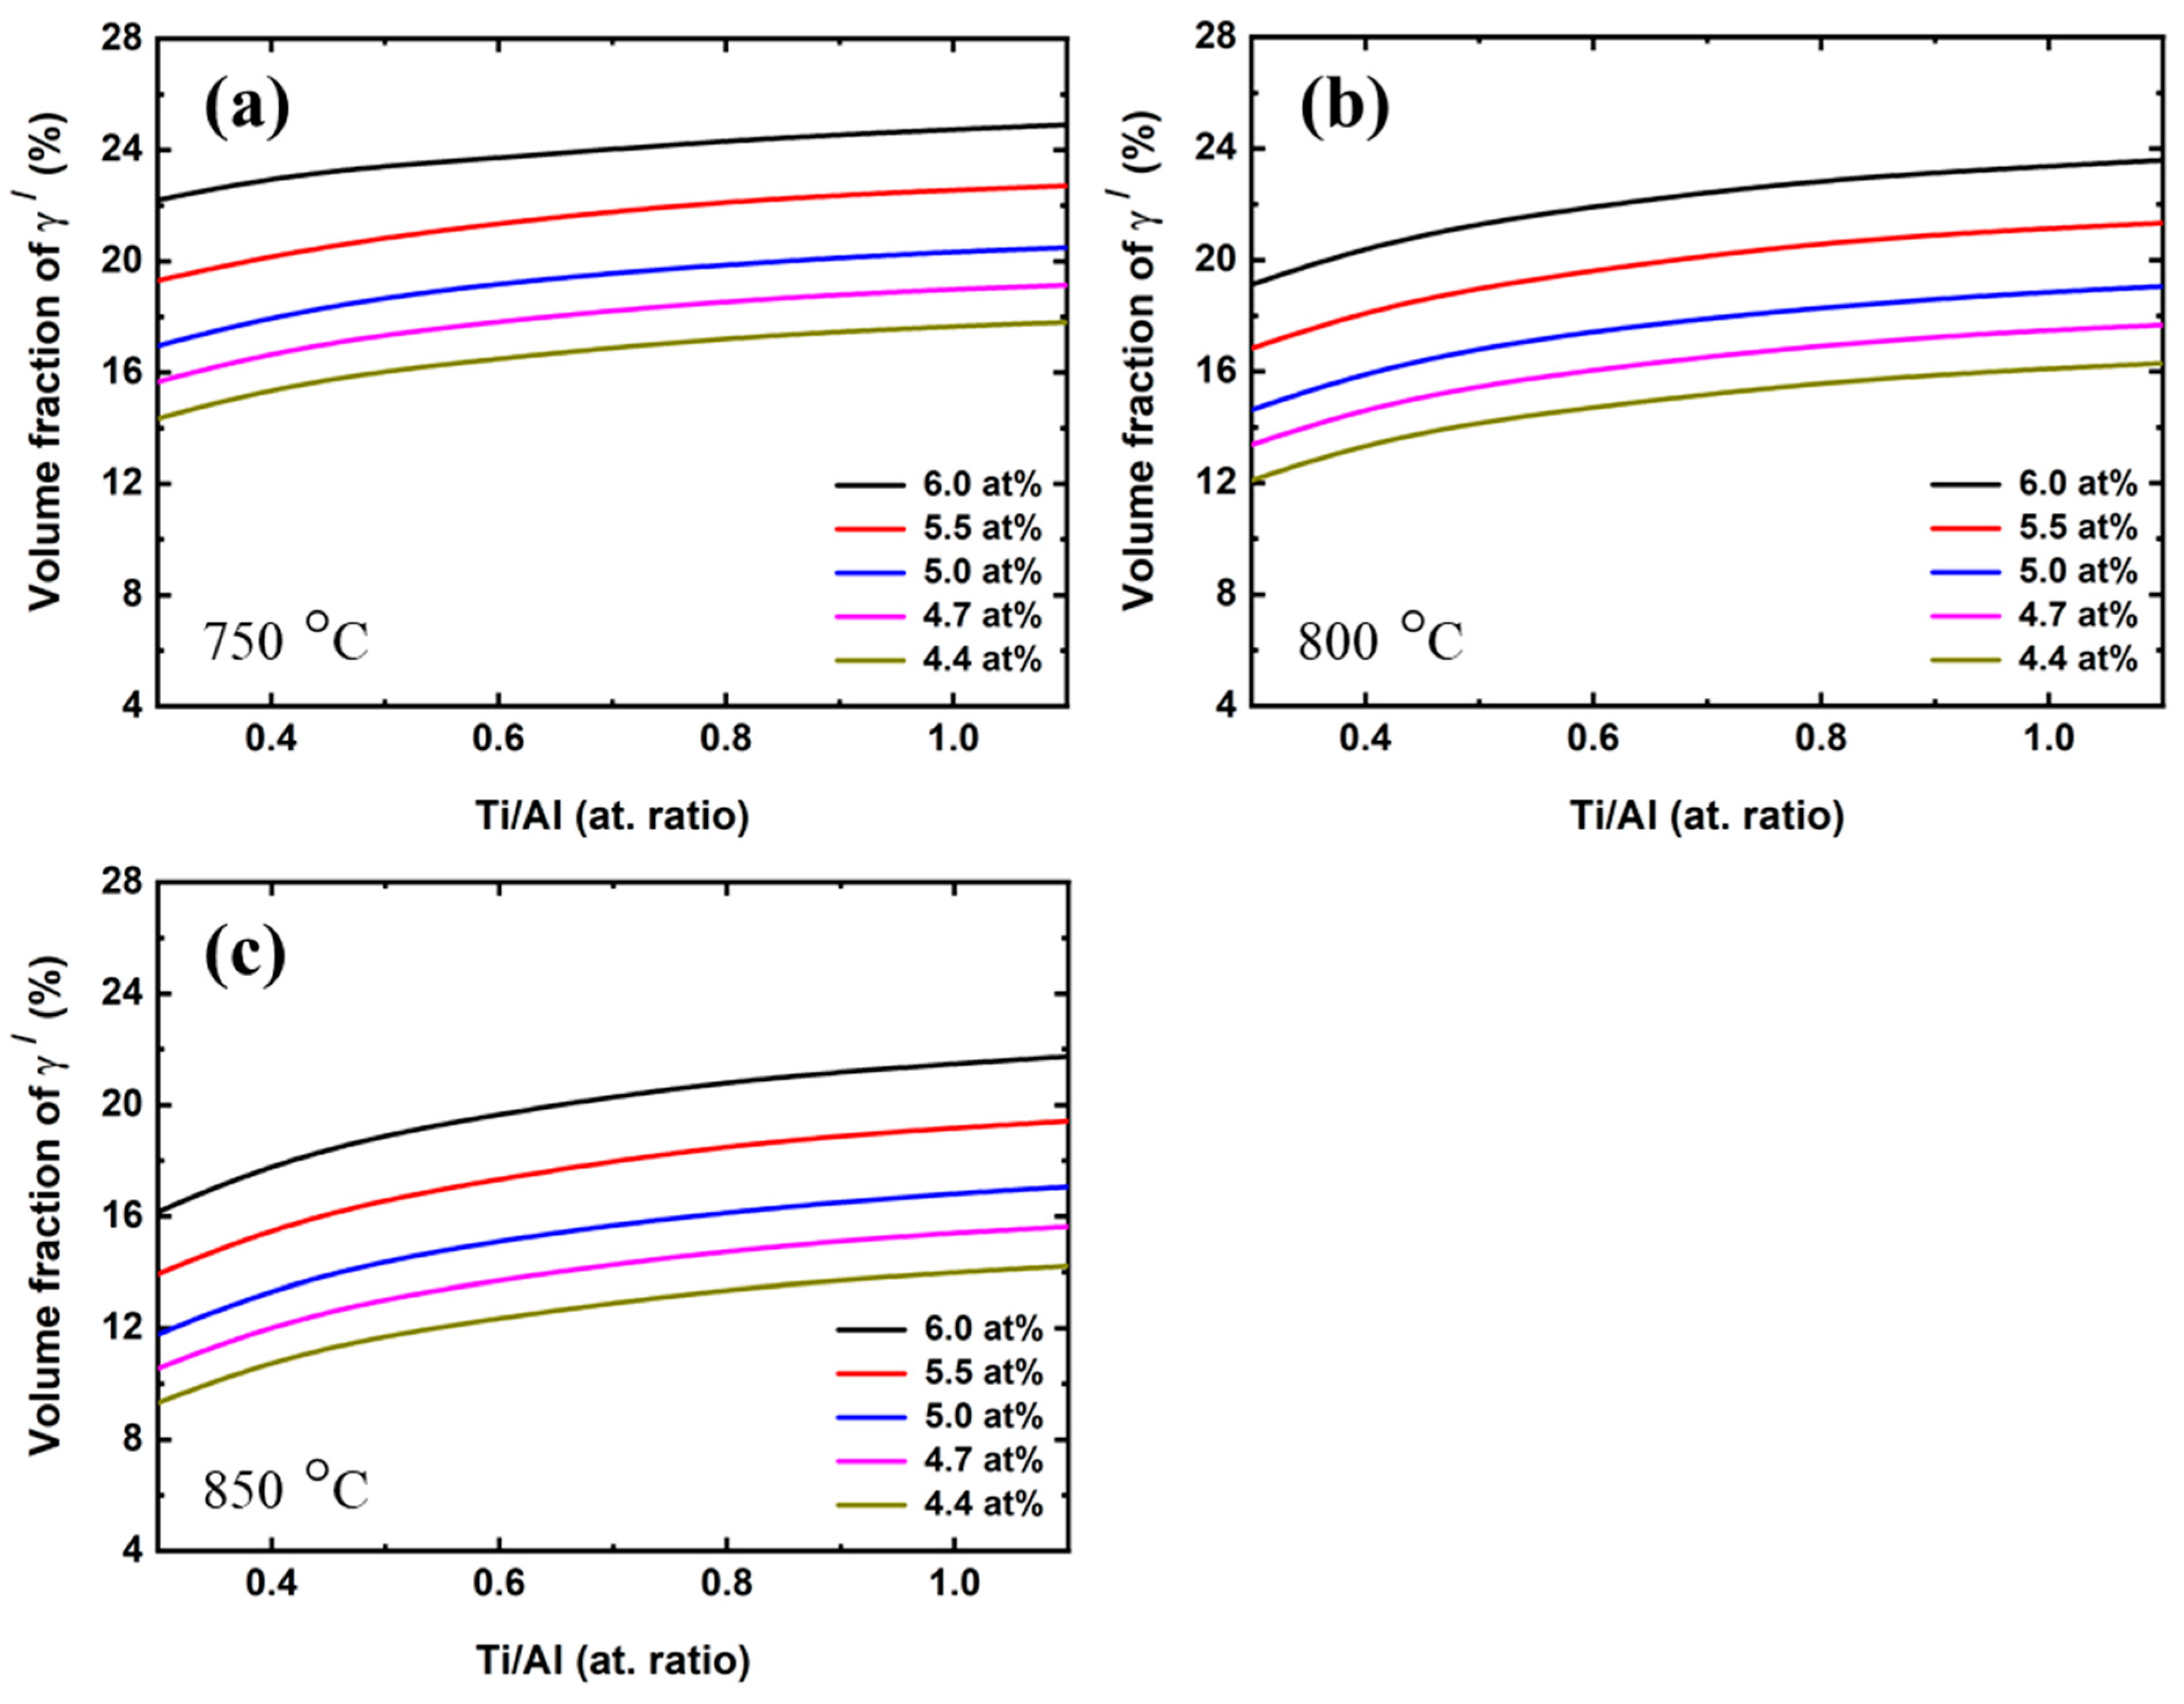
Figure 1 shows the equilibrium volume fraction of the γ′ phase for Ni-25Cr-20Co-0.5Mo-1.5Nb-0.03C-Ti-Al alloys with different Ti + Al (4.4~6.0 at%) and Ti/Al atomic ratios (0.3~1.1) calculated with thermo Calc software. In
Figure 1a, the volume fraction of the γ′ phase was increased by increasing the Ti/Al ratio at the same Ti + Al atomic %. The volume fraction of the γ′ phase was also increased by increasing the Ti + Al atomic % at the same Ti/Al ratio. As the temperature increased, effects of the Ti/Al ratio and the Ti + Al atomic % on the volume fraction were similar, as shown in
Figure 1b,c. Only the equilibrium volume fraction of the γ′ phase was decreased.
Figure 2 shows the phase fraction of the γ′ phase with change in temperature. The volume fraction of the γ′ phase was decreased with increasing temperature. The solvus temperature of the γ′ phase was increased with increasing Ti/Al ratio. This means that the thermodynamically stable region of the γ′ phase can extend to higher temperatures as the Ti/Al ratio increases. However, the η phase was not calculated with thermo Calc software.
Based on calculated results, four alloys (Ti/Al ratio = 0.4, 0.6, 0.8 and 1.0, Ti + Al = 5.0) were designed and prepared by vacuum induction melting (VIM). They were then hot-rolled into 12 mm thick plates at 1150 °C. These rolled plates were heat treated for 30 min at 1150 °C, followed by 16 h at 800 °C.
The chemical compositions of the alloys are shown in
Table 1. These alloys were named TA04 (Ti/Al ratio: 0.45), TA06 (Ti/Al ratio: 0.61), TA08 (Ti/Al ratio: 0.80), and TA10 (Ti/Al ratio: 1.09) according to their Ti/Al ratios.
These heat-treated alloys were subjected to long-term aging treatment at 750, 800, and 850 °C for 100, 1000, 3000, 5000, and 10,000 h. Vickers hardness (HV) (HM 122, MITUTOYO, Kawasaki, Japan) at room temperature was measured for each aged specimen under 9.81 N load and 10-s dwell-time conditions. The hardness increments by precipitate were obtained by subtracting the hardness of solution treatment specimens from the hardness of aged specimens. It was assumed that the effects of solid solution strengthening and the grain-size strengthening remained during aging. The microstructure of each aged specimen was observed and analyzed using SEM (INSPECT F50, FEI, Hillsboro, OR, USA). Aged specimens were mechanically polished and etched using 1:10:10-HNO3:HCl:H2O solution for 20 min at 50 °C. The fraction of the γ′ phase was measured from SEM images with an area of 5 μm × 5 μm using ImageJ software (ImageJ 1.51j8, National Institutes of Health, Bethesda, MD, USA). In addition, the length of the η phase was measured from SEM images.
For TEM (Talos F200X and Tecnai F20 G2, FEI, OR, USA) observations, aged specimens were mechanically thinned to 50 μm or less using an SiC paper followed by twin jet polishing (15% perchloric acid + 85% ethanol at −25 °C, 16 V) with a disk punched at a diameter of 3 mm. The precipitate size and their identification were obtained from bright-field (BF) images taken from the TEM and the γ′ phase BF images were observed at the [100] zone axis.
3. Results and Discussion
Figure 3 shows SEM images of the TA10 specimen after heat treatment. In
Figure 3a, precipitates were formed at grain boundaries. The grain size was about 50 μm. It was found that the γ′ phase was uniformly formed in the grain with an average diameter of 25 nm, as shown in
Figure 3b. The grain sizes and diameters of the γ′ phases of TA04, TA06, and TA08 after heat treatment were similar to those of the TA10 alloy (data not shown). In addition, the grain sizes of specimens aged up to 10,000 h under each temperature condition did not change significantly.
Figure 4 shows SEM images taken for aged specimens. The spherical γ′ phase was uniformly formed in TA10 specimens aged at 800 °C for 3000 h. The average diameter of the γ′ phase was about 100 nm, as shown in
Figure 4a. The diameter of the γ′ phase was significantly increased as aging time and aging temperature increased, as shown in
Figure 4b,c. The large-sized γ′ phase was also frequently observed in faceted shapes. On the other hand, variation in the Ti/Al ratio had little effect on the diameter or volume fraction of the γ′ phase, as shown in
Figure 4d.
Figure 5 shows TEM BF images in the [001] zone axis taken from specimens aged at 750 °C, showing cuboidal shape of the γ′ phase. It could be seen that the variation in Ti/Al ratio had little effect on the diameter of the γ′ phase. The average diameter of the γ′ phase was about 85 nm in specimens aged at 750 °C for 5000 h in TA06 and TA10 alloys and about 110 nm for those aged at 750 °C for 10,000 h in TA06 alloy.
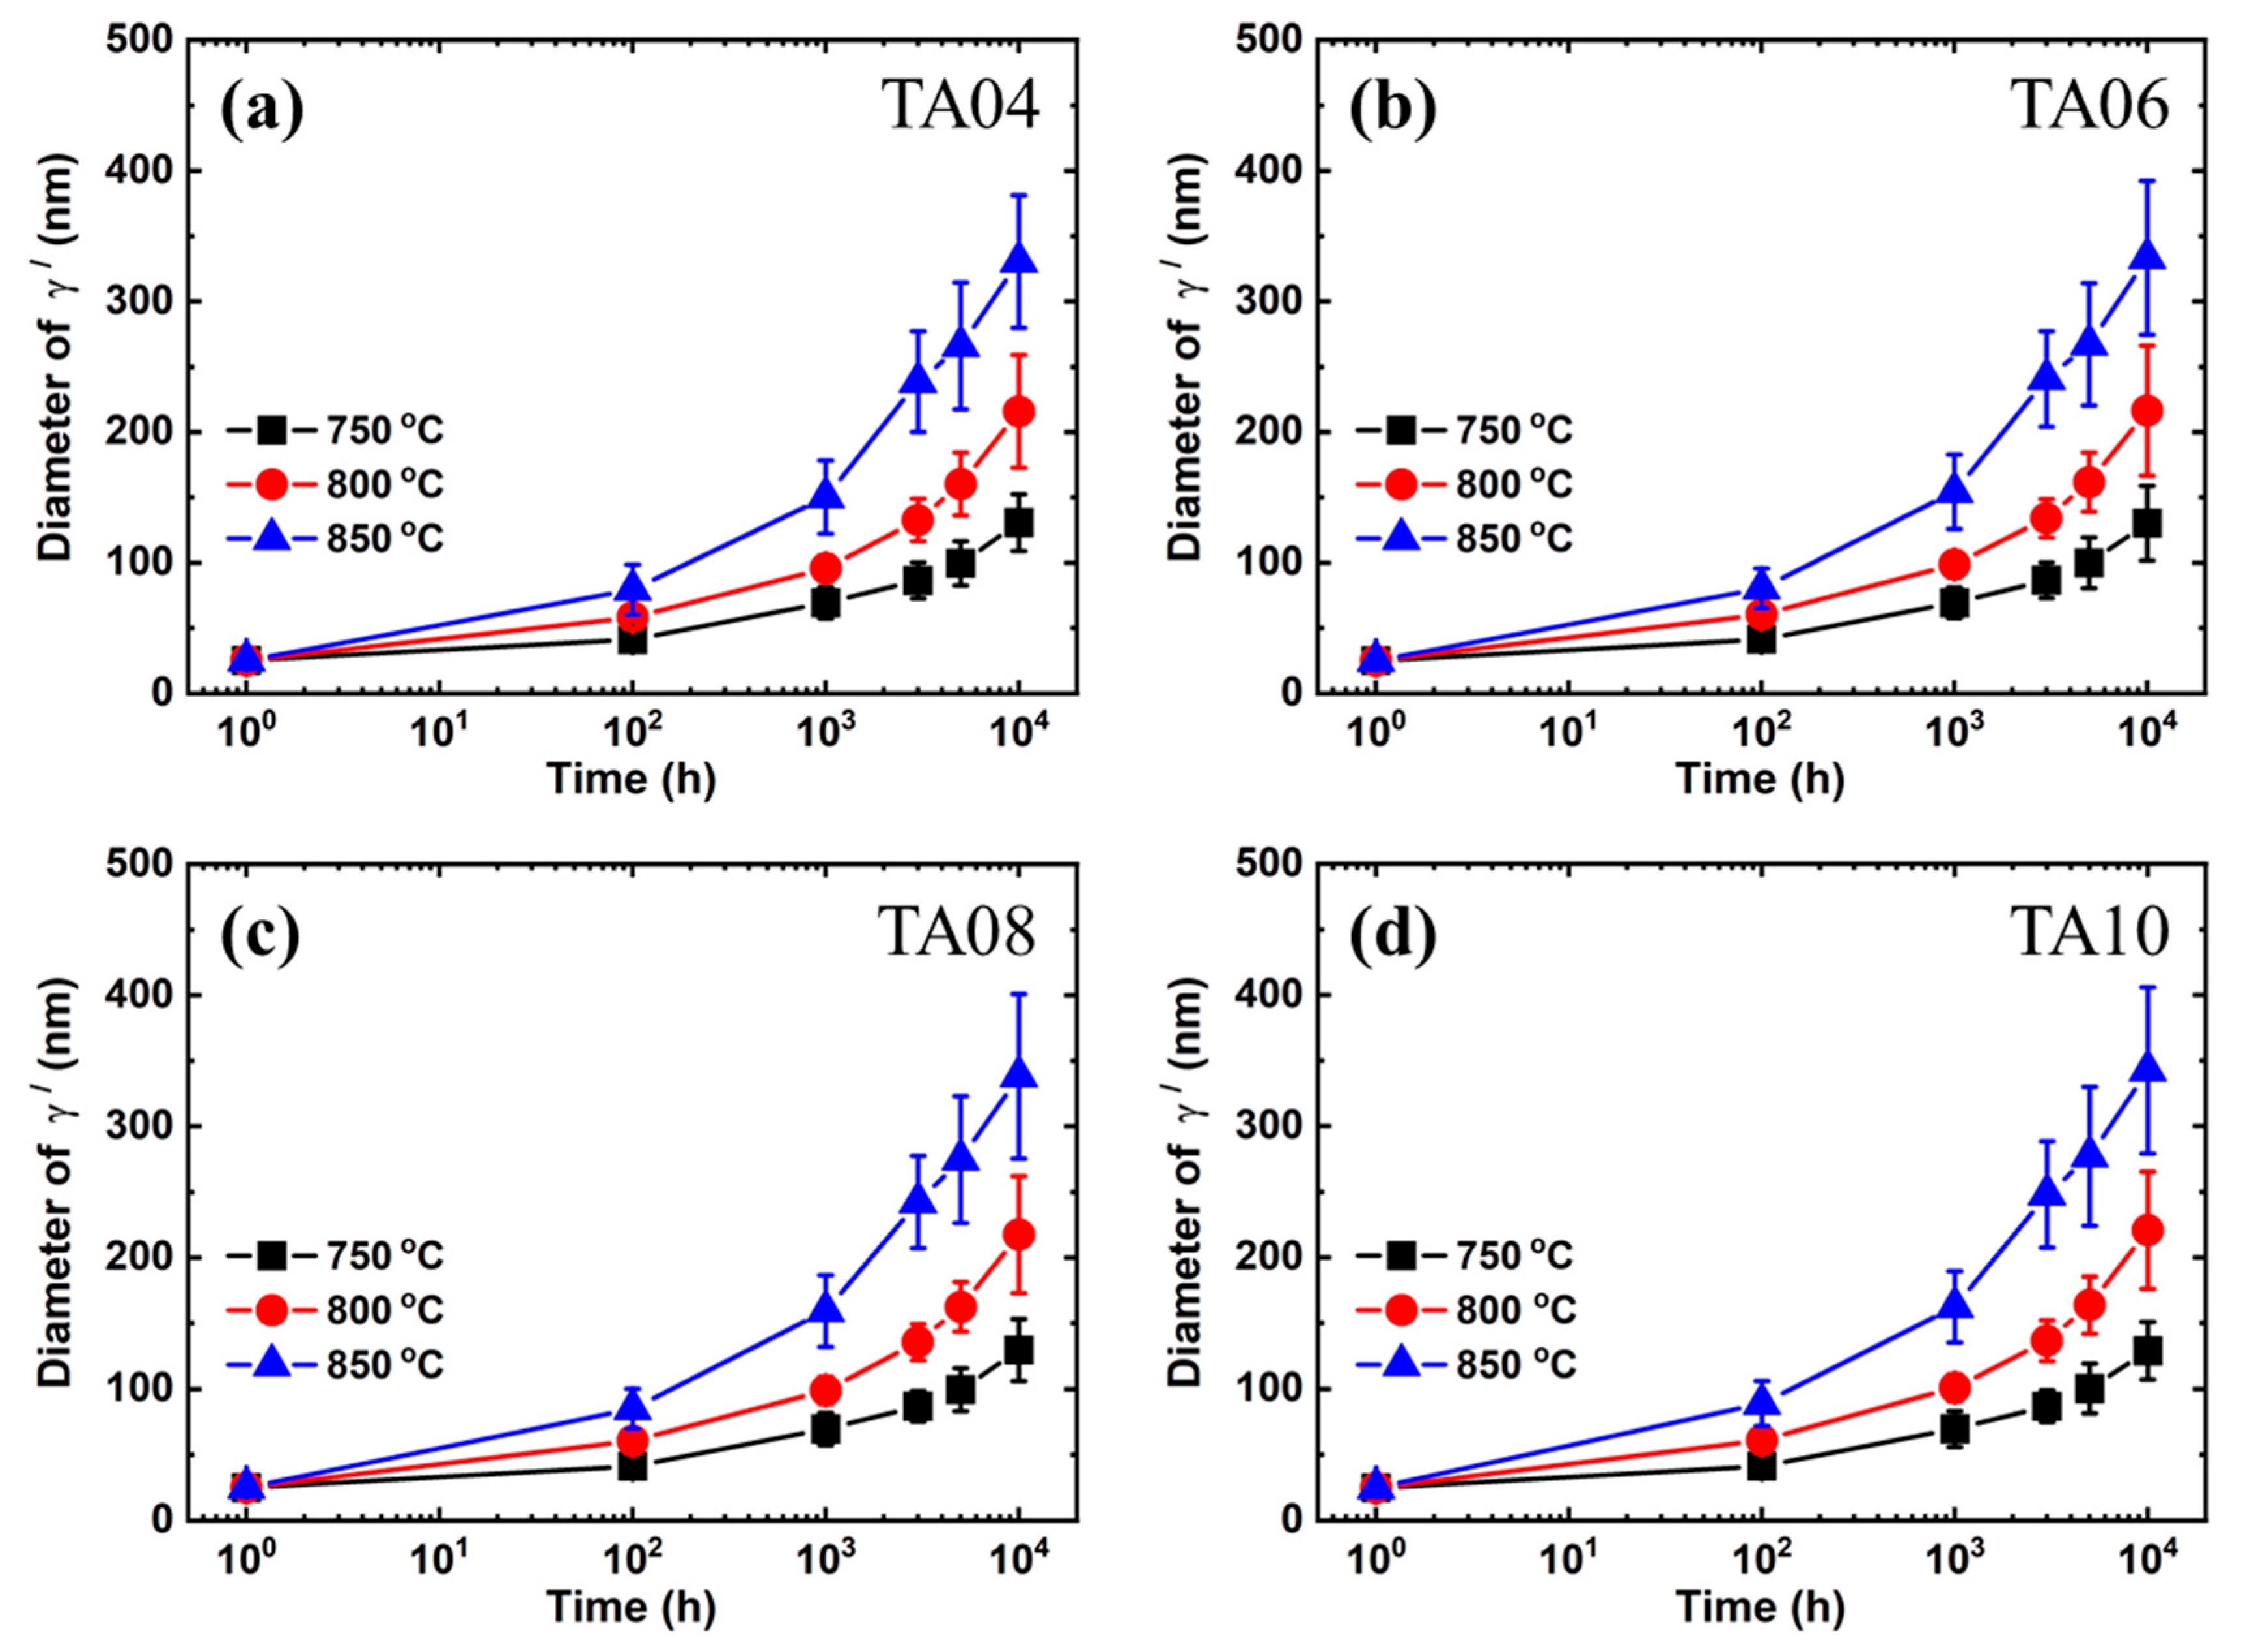
The diameter of the γ′ phase with aging time is shown in
Figure 6. It could be seen that the diameter of the γ′ phase increased with increases in aging time and temperature. However, there was little difference in the diameter of the γ′ phase among all temperatures even when the Ti/Al ratio was changed.
The volume fraction of the γ′ phase with aging time at each temperature is depicted in
Figure 7. The volume fraction of the γ′ phase except for that for 100 h at 750 °C continuously decreased with the increase in aging time at all temperatures. Since all samples were subjected to heat treatment at 800 °C for 16 h after solution heat treatment followed by aging treatment at each temperature, the reason for the increase in the volume fraction of the γ′ phase in the 100 h aged specimen at 750 °C was thought to be due to additional precipitation of the γ′ phase caused by a difference in solubility. It was also found that the volume fraction of the γ′ phase increased with an increase in Ti/Al ratio at all temperatures (
Figure 7a–d).
Figure 8 presents the Vickers hardness of alloys with aging time. The hardness of alloys slightly increased at the beginning of aging below 100 h at 750 °C. They then gradually decreased as aging time increased. This was closely related to the increase in the volume fraction of the γ′ phase, as shown in
Figure 7a. Moreover, as the temperature increased, the hardness gradually decreased during aging (
Figure 8b). Additionally, as the temperature further increased, the hardness decreased more rapidly (
Figure 8c). Furthermore, it could be seen that the Vickers hardness of the alloys increased with increasing Ti/Al ratio at all temperatures. It was thought that the increase in the γ′ phase volume fraction according to the Ti/Al ratio in
Figure 7 was the cause of this increase in hardness in
Figure 8.
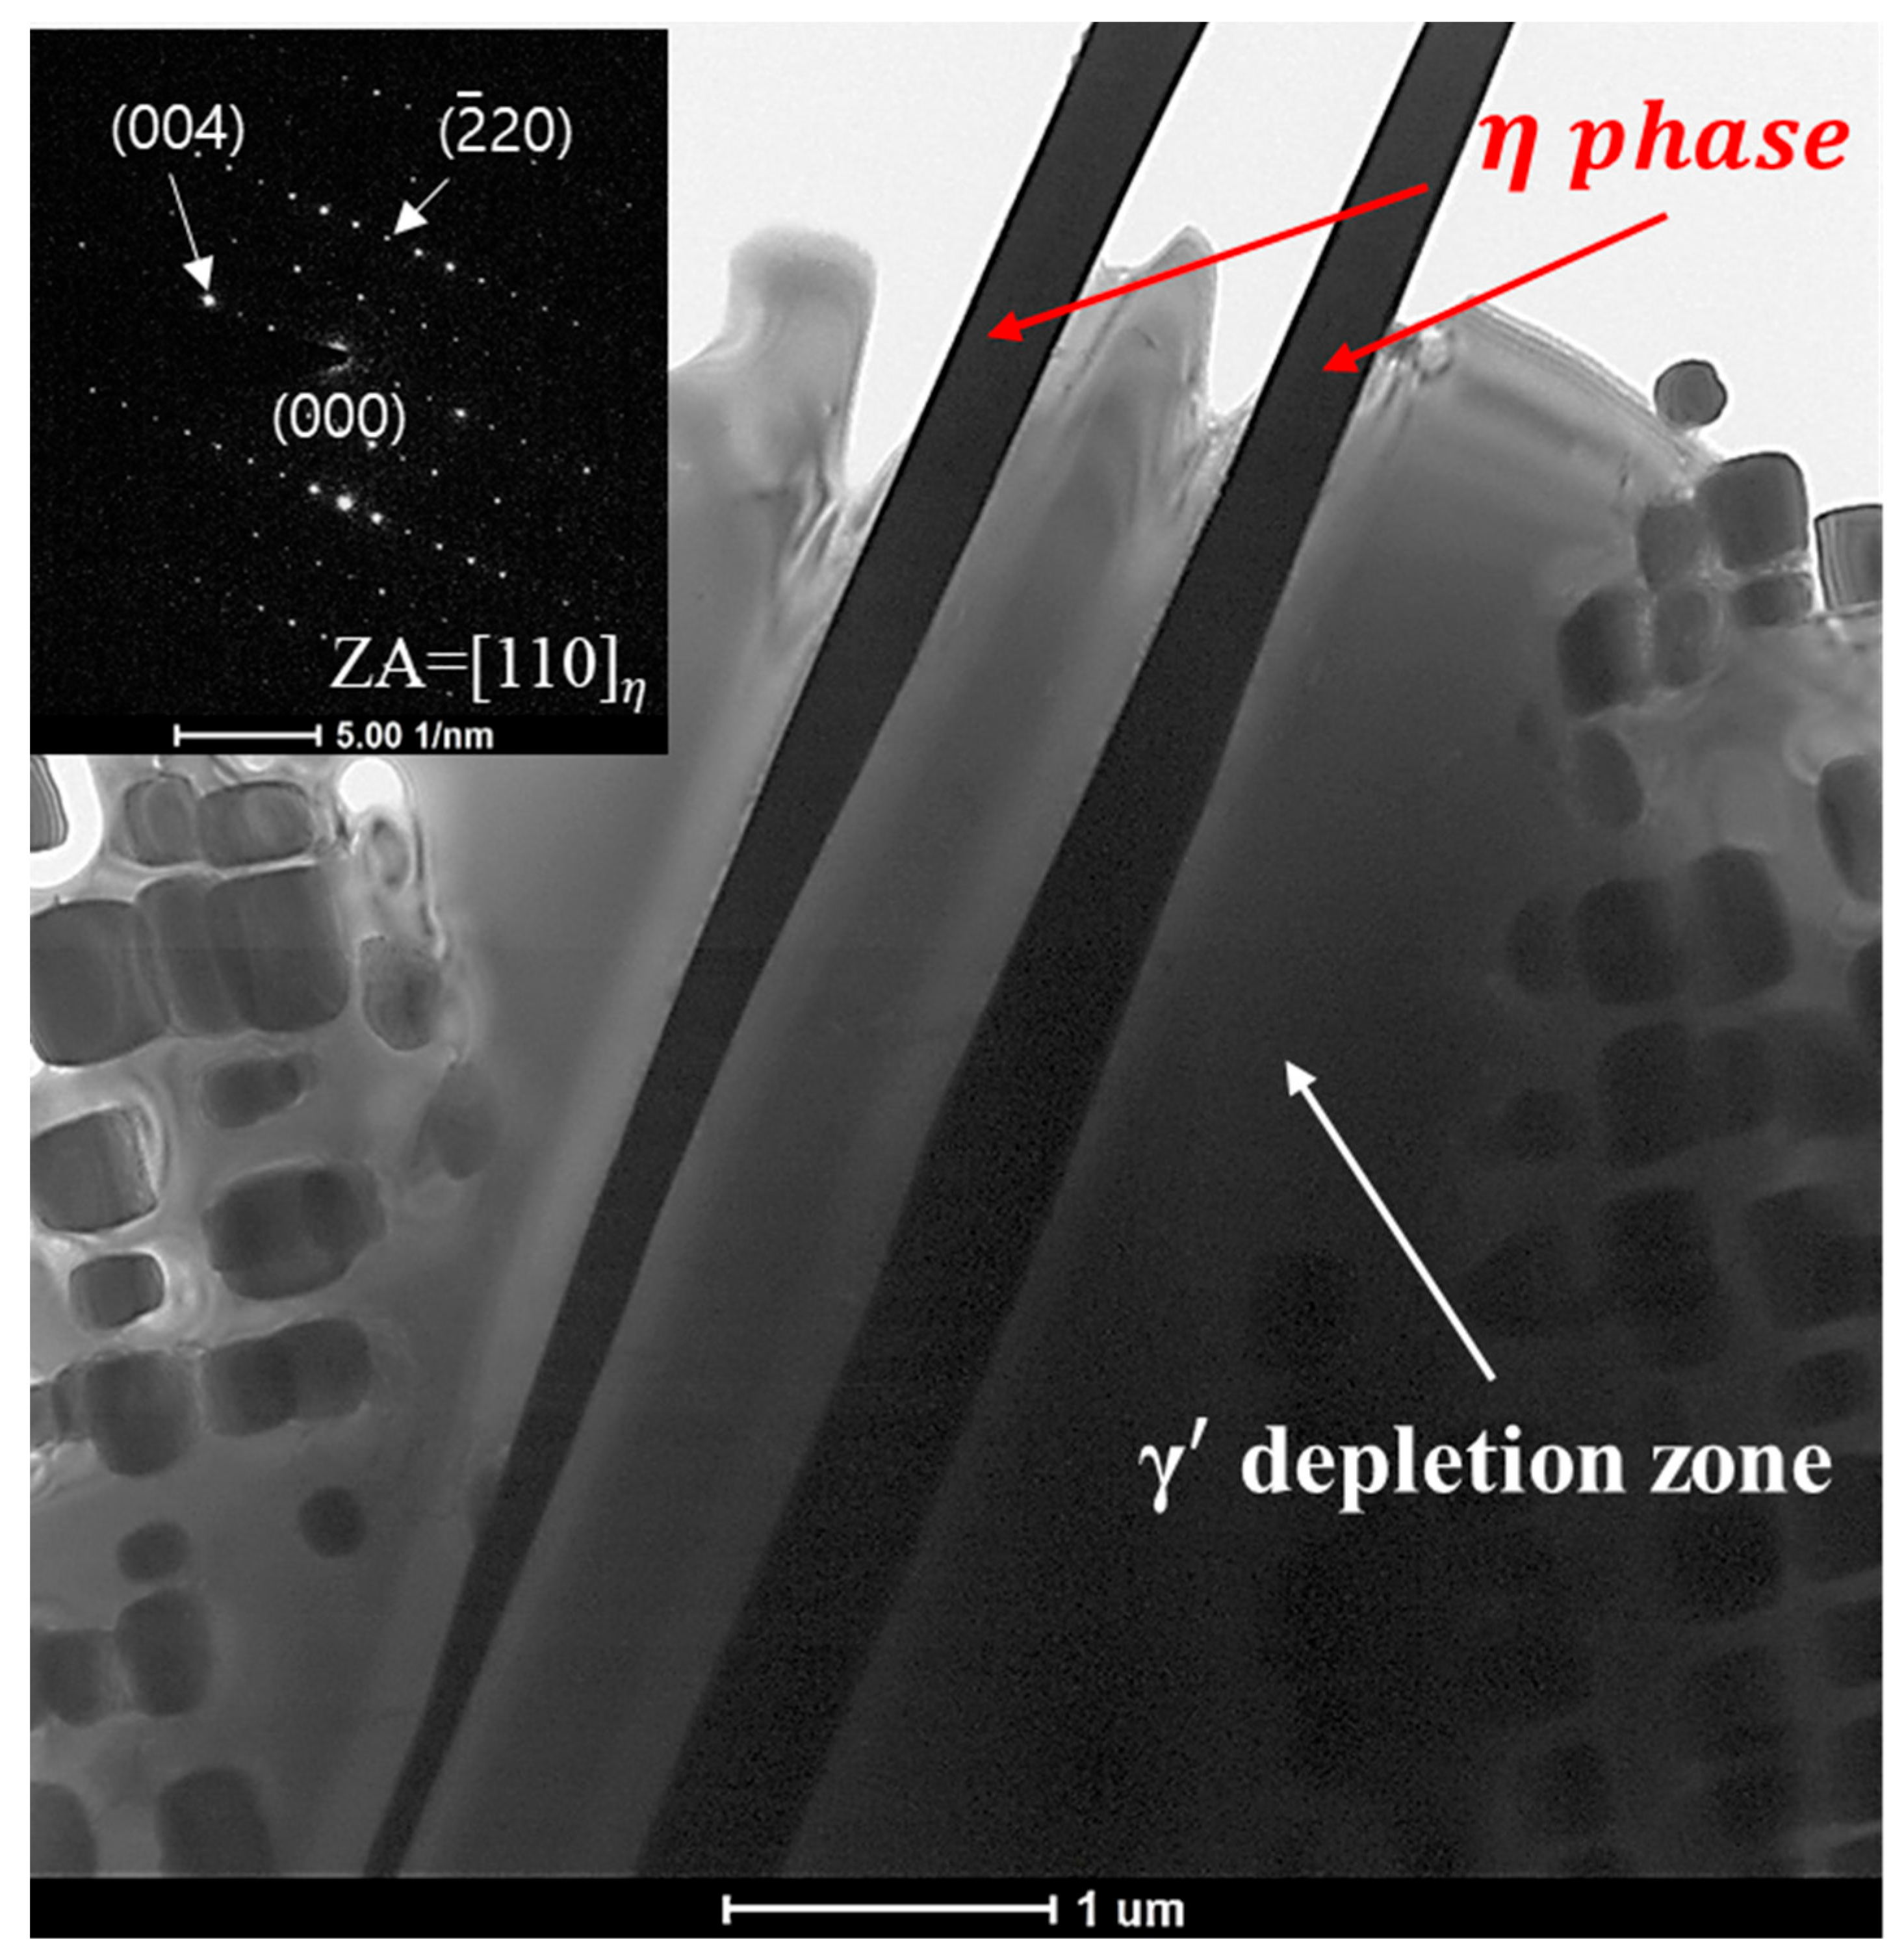
Figure 9 shows a TEM BF image of the TA10 sample aged for 5000 h at 850 °C. It revealed the existence of needle-like precipitates in addition to the cube-shaped γ′ phase. It was confirmed that this needle-like precipitate was the η phase with ZA = 110 based on careful analysis of the inserted diffraction pattern. One could see that the γ′ phase was absent around the η phase. The formation of the γ′ phase depletion zone was attributed to the formation and growth of the η phase because Ti was shared by both the γ′ and η phases.
SEM micrographs of alloys TA08 and TA10 aged for 10,000 h at 800 °C and 850 °C are presented in
Figure 10. One could see the formation of the η phase in samples aged at 800 °C and 850 °C for both TA08 and TA10 alloys. The length of the η phase was longer at higher aging temperatures. In addition, the γ′ phase depletion zones were observed around the η phases. The length and number of the η phase also increased with increasing Ti/Al ratio. In addition, as shown in
Figure 10a, the η phase was formed with a specific orientation relationship. According to a previous study [
29], it was formed in three different directions with angles of 70.5 and 54.7 degrees when observed in the [110] direction of the TEM. Although it was an SEM image, it was possible to infer the approximate orientation relationship. However, it was difficult to quantitatively evaluate the volume fraction of the η phase due to its inhomogeneous distribution at grain boundaries and grain interiors. On the other hand, no evidence of η phase formation was found under any aging conditions for TA04 or TA06 alloys. This means that the η phase is thermodynamically unstable when the Ti/Al ratio is less than 0.61. Furthermore, the existence of the η phase could not be confirmed at low aging temperatures or short aging times, even in the TA08 or TA10 alloys.
Zener and Frank [
30,
31] have reported that the length of the needle-like precipitate follows the following equation, assuming the growth of the precipitate is controlled by the lattice diffusion of solute atoms in the matrix:
where
L is the length of the precipitate,
k is a dimensionless growth coefficient,
D is diffusivity of solute atoms in matrix, and
t and
are isothermal exposure time and incubation time of precipitation, respectively.
Figure 11 shows the length of the η phase with aging time for the TA10 and TA08 alloys under conditions in which η phase formation is confirmed. Despite an inhomogeneous distribution of the η phase, η formation was confirmed in four aging conditions at 850 °C (
Figure 11a). It was also found in three conditions at 800 °C for the TA10 alloy (
Figure 11a) and 850 °C for the TA08 alloy (
Figure 11b). The existence of the η phase was confirmed only in one sample aged for 10,000 h in the TA10 (750 °C) and TA08 (750 °C and 800 °C) alloys. The length of the η phase showed very well linearity with the square root of the aging time at 850 °C for the TA08 and TA10 alloys and 800 °C for the TA10 alloy, respectively. The growth rate of the η phase in TA10 was higher than that in the TA08 alloy. It was thought that the time of the x-intercept of the fitted line in
Figure 11 could be considered as the incubation time for η phase formation. Therefore, the incubation time for nucleation of the η phase was thought to be 250 h at 850 °C, 1640 h at 800 °C in TA10, and 1400 h at 850 °C for the TA08 alloy. That is, TA10 had a shorter incubation time for nucleation of the η phase than the TA08 alloy. The shorter incubation time and faster growth rate of TA10 were thought to be due to higher Ti content in the TA10 alloy than in the TA08 alloy.
It is a well-known phenomenon that the APB formed inside the precipitates suppressed the movement of the dislocation when a precipitate with an ordered structure is sheared by mobile dislocations. This is called order strengthening. Shearing by two dislocations with the same Burgers vector is essential to shear the ordered precipitates. In other words, the shearing process was composed such that the leading dislocation creates an APB during the shearing of the ordered precipitates and the following trailing dislocation removes the formed APB. The order strengthening mechanisms proposed by Reppich [
32] are widely accepted in the literature. They proposed the order strengthening increments in two types, assuming that the interaction between leading and trailing dislocations change depending on the size of the precipitates. In the case of small precipitates, they assumed that the trailing dislocation shears the precipitate independently of the leading dislocations and has a straight shape. The trailing dislocations interact with the leading dislocations to minimize the APB area during shearing and have a more complex shape in the case of large precipitates. They called them weakly coupled dislocations (
WCD) and strongly coupled dislocations (
SCD), respectively.
The order strengthening increments sheared by the
WCD and
SCD proposed by Reppich [
32] are given as follows.
where
is the APB energy of the γ′ phase in the {111} plane,
is the Burgers vector of dislocation in the matrix,
is the diameter of the γ′ phase,
is the volume fraction of the γ′ phase,
is numerical factor determined by the the γ′ phase morphology,
is a constant that explains the elastic repulsion between
SCD, and
is the line tension of the dislocation. The line tension was estimated as
and
is the shear modulus.
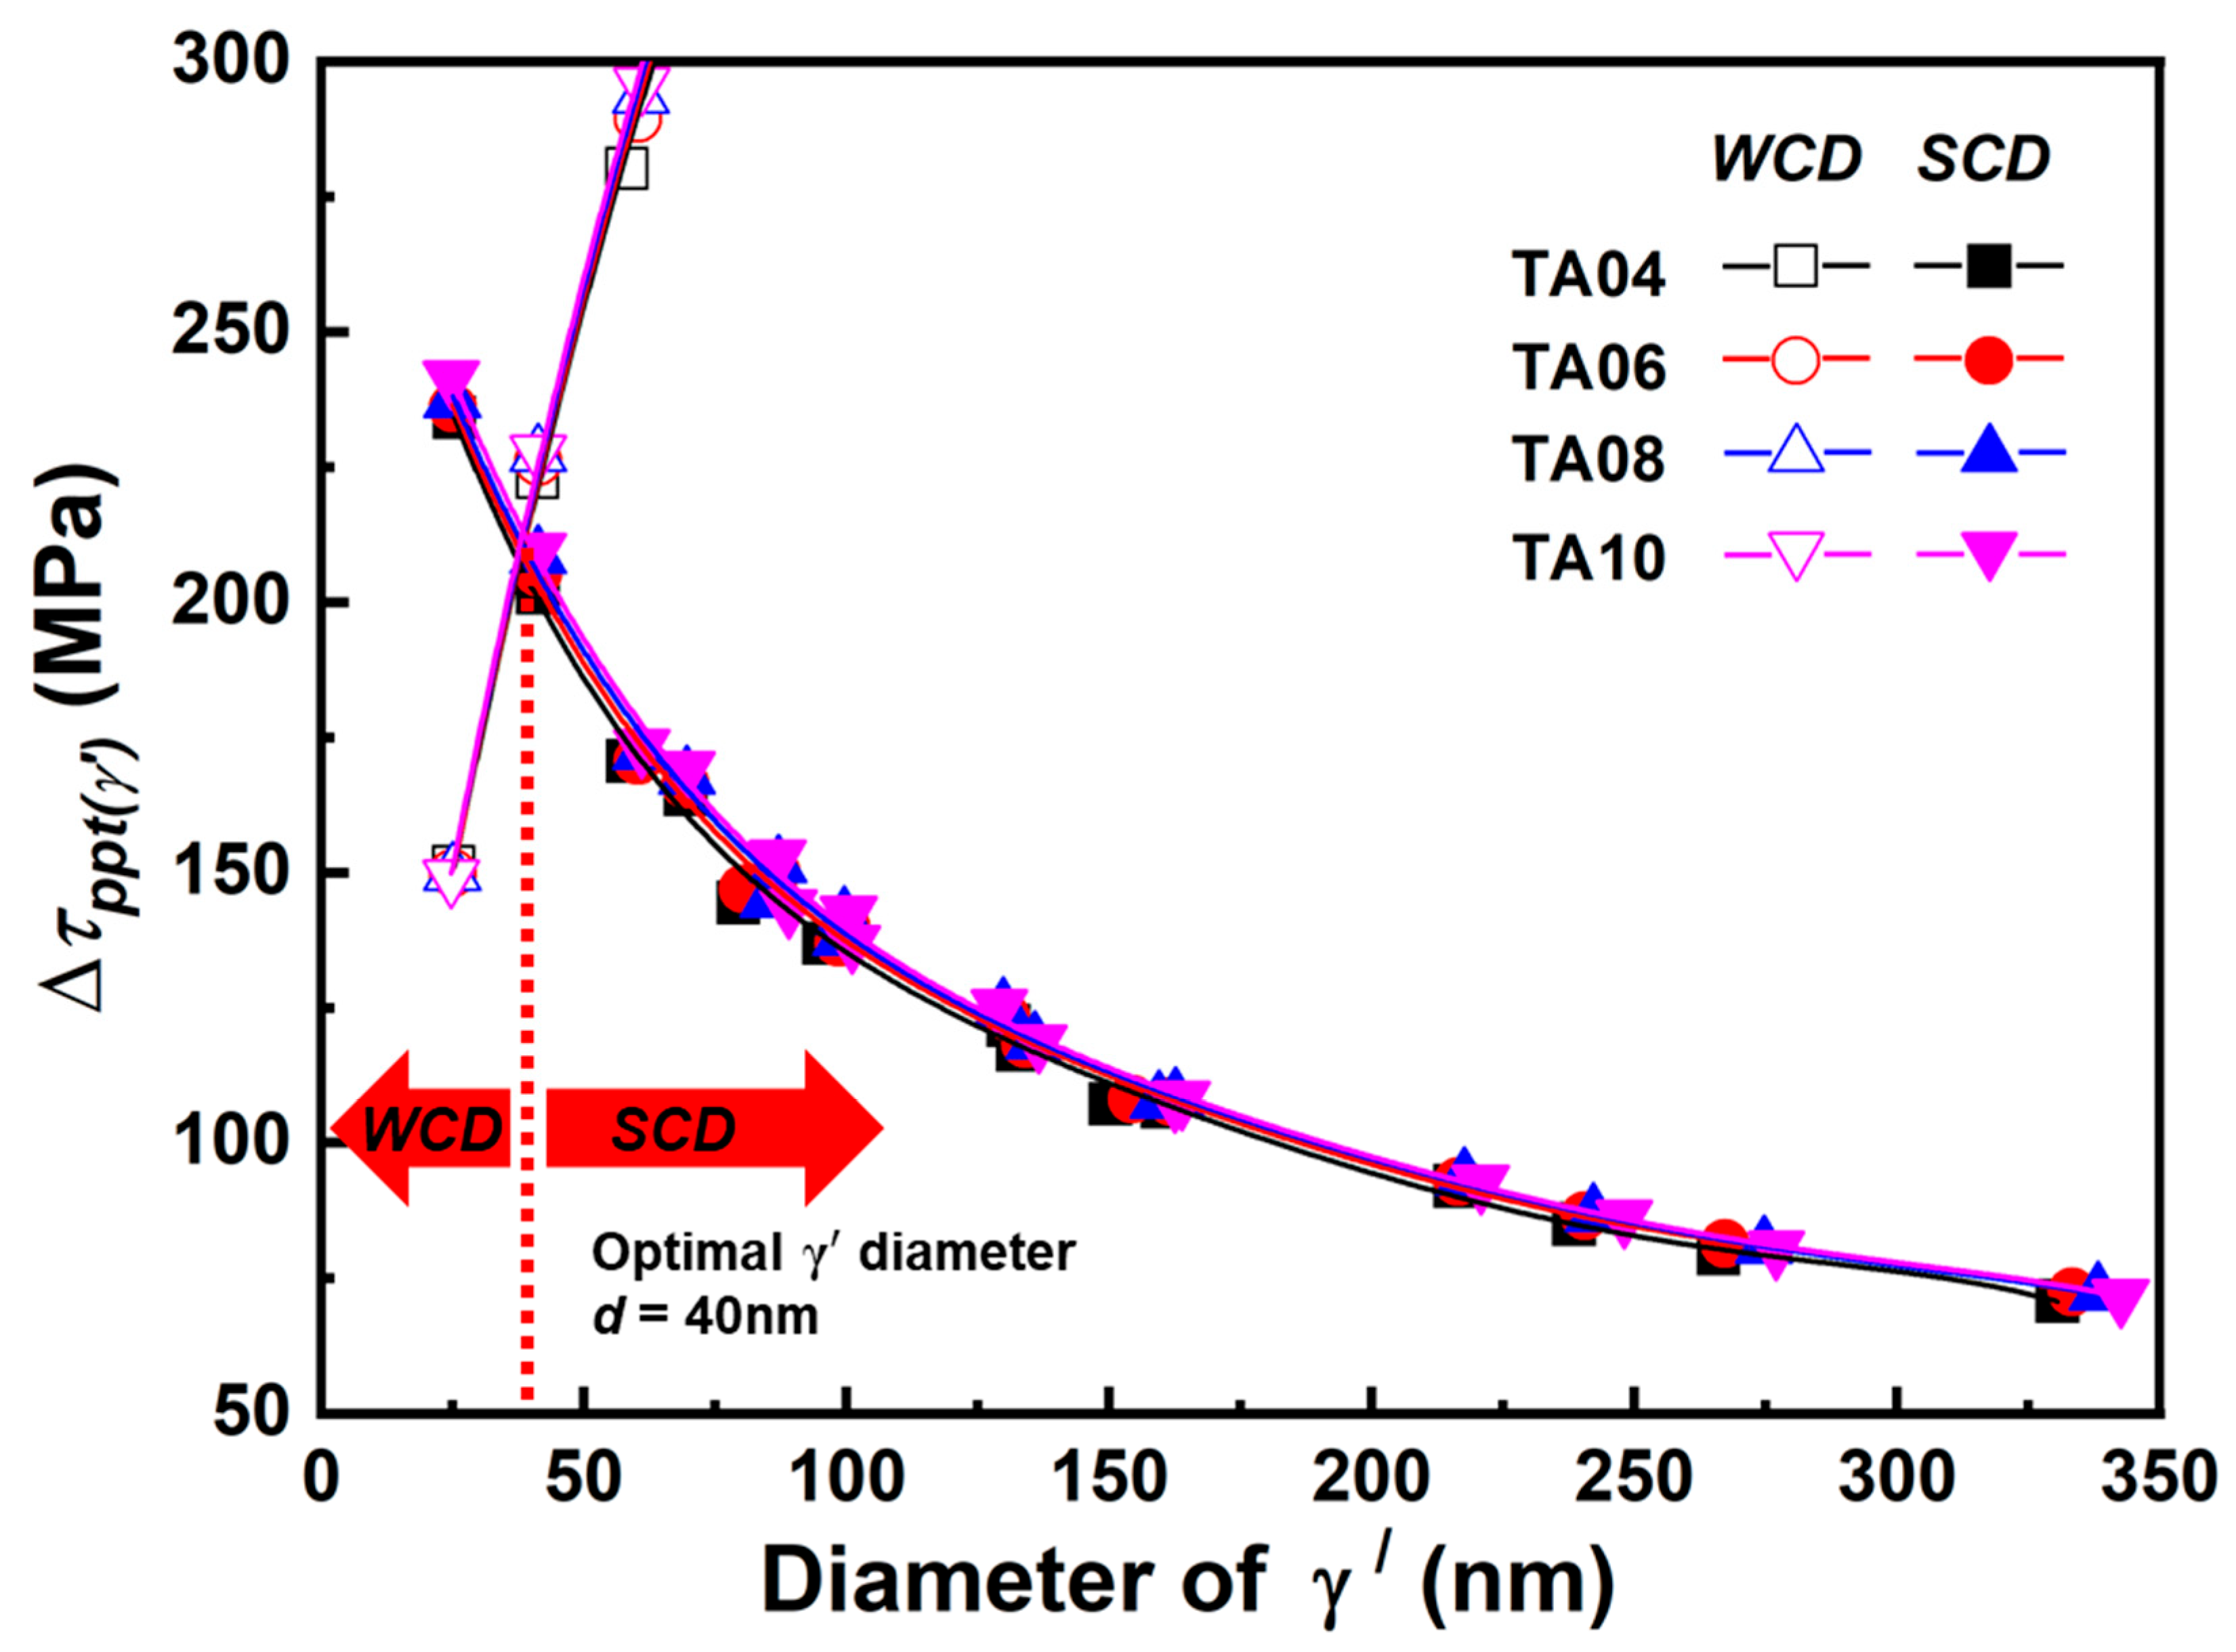
Figure 12 shows the shear stress increments (
) resulting from the order strengthening of the γ′ phase calculated using Equations (2) and (3), plotted according to the diameter of the γ′ phase for all conditions. The values used in the calculation for
,
,
,
, and
were 0.254 nm, 0.72, 1, 80 GPa [
32], and 0.25 Jm
−2 [
33], respectively. The volume fraction (
) and diameter (
) of the γ′ phase were the values used in
Figure 6 and
Figure 7.
The was increased with the diameter of the γ′ phase in the WCD model. On the contrary, the was decreased with the diameter of the γ′ phase in the SCD model. The shearing of the γ′ phase is controlled by lower values of the WCD and SCD at given diameters of the γ′ phase. One can see that the transition diameter from the WCD to SCD takes place at 40 nm. The transition diameter and the are shown to be nearly the same values despite the change in the Ti/Al ratio. The transition diameter between WCD and SCD changes greatly depending on the APB energy. It means that the transition diameter decreases as the APB energy increases. This is because of the balance between the total energy generated by the APB and the repulsive force of the leading–trailing dislocations with the same Burgers vector.
In order to compare the experimentally obtained precipitation strengthening increments with the theoretical order strengthening increments of the γ′ phase (
), the
were converted to
by multiplying the Taylor factor M, which is taken as 3 [
34,
35,
36].
Tensile tests were not conducted in all aged conditions, so
was obtained by converting from the hardness values in the calculation of strengthening. The conversion factor between yield strength and hardness was measured to 2.3 from the standard heat treatment specimens, as shown in
Table 2. It is thought that this relationship is reasonable compared to the values of 2.34 and 2.46 presented by Wu et al. [
37] and Osada et al. [
38], respectively. The increment in precipitation strengthening (
) was obtained by subtracting the hardness of the solution-treated specimens from the hardness of the aged specimens.
The relationship between
and
in all aged conditions is shown in
Figure 13. One can see that
is linearly proportional to
.
Also, it can be confirmed that the differences between and decrease as the Ti/Al ratio increases. It is a well-known fact that the order strengthening is controlled by the diameter, volume fraction, and APB energy of the γ′ phase.
Therefore, the difference in order strengthening increments with the Ti/Al ratio is mainly thought to originate from the difference in APB energy considering that there is no significant difference between the diameter and volume fraction of the γ′ phase, as shown in
Figure 6 and
Figure 7. It can be inferred that the APB energy increases with the Ti/Al ratio and it was found that the APB energy increased by approximately 27% per atomic % of Ti. This value is higher than the 9% and 10% values reported by Dodaran et al. [
19] and Gorbatov et al. [
20], respectively. However, it is consistent with the fact that Ti increases the APB energy of the γ′ phase.


