Article

Metal Embedded Phthalocyanine Monolayers as Promising Materials for Toxic Formaldehyde Gas Detection: Insights from DFT Calculations

1
Yunnan Key Laboratory of Metal-Organic Molecular Materials and Device, School of Chemistry and Chemical Engineering, Kunming University, Kunming 650214, China
2
School of Physical Science and Technology, Kunming University, Kunming 650214, China
*
Author to whom correspondence should be addressed.
Metals 2022, 12(9), 1442; https://doi.org/10.3390/met12091442
Submission received: 3 August 2022 / Revised: 27 August 2022 / Accepted: 28 August 2022 / Published: 29 August 2022

Abstract

:
The design of the good-performance materials for toxic formaldehyde (CH2O)-gas-detection is critical for environmental preservation and human health. In this work, density functional theory (DFT) calculations were employed to investigate the adsorption behavior and electronic properties of CH2O on transition metal (TM)-doped phthalocyanine monolayers. Our results prove that PdPc and RuPc monolayers are thermodynamically stable. Analysis of the adsorption energy showed that the CH2O gas molecule was chemisorbed on the RuPc monolayer, while it was physisorbed on the PdPc nanosheet. The microcosmic interaction mechanism within the gas-adsorbent system was revealed by analyzing the density of states, the charge-density difference, the electron-density distribution, and the Hirshfeld charge transfer. Additionally, the RuPc monolayer was highly sensitive to CH2O due to the obvious changes in electrical conductivity, and the recovery time of CH2O molecule was predicted to be 2427 s at room temperature. Therefore, the RuPc monolayer can be regarded as a promising gas-sensing material for CH2O detection.

Graphical Abstract

1. Introduction

Formaldehyde (CH2O), a common a chemical compound, is applied widely in the field of industrial applications, such as furniture, wood processing, textiles, and chemical production [1,2]. However, in the environment, CH2O is also an extremely poisonous, colorless, odorless highly volatile gas, which can cause health problems such as allergy, poisoning, pulmonary damage, and cancer [3,4,5]. Short-term exposure leads to respiratory-tract infections and skin allergies even at low concentration levels. Therefore, from environmental and health points of view [6,7,8,9], monitoring and controlling the emissions of CH2O is essential and can be achieved through developing an advanced gas sensor with good performance.
Over the past few decades, several metal oxide semiconductors (MOS), such as SnO2 [10,11], WO3 [12], In2O3 [13,14], ZnO [15,16], and TiO2 [17,18] have been proved effective in formaldehyde detection. However, some drawbacks such as poor sensitivity, weak adsorption ability, high cost, and long response speed, restrict their industrial application. Recently, two-dimensional phthalocyanine (Pc) materials have attracted widespread attention from researchers due to their unique properties [19,20,21]. Interestingly, phthalocyanine exhibits diverse morphologies and properties such as high specific surface area, fascinating charge transfer properties, and excellent optical performance. These novel behaviors have made it possible to use phthalocyanine for advanced technological applications such as photovoltaics [22], optoelectronics [23], electrocatalysis [24], and spintronics [25]. Resistive phthalocyanine-materials-based gas sensors have been successfully developed in the experiments [26,27,28], however, their poor stability/sensitivity/selectivity restricts their further industrial application. To overcome these limitations, the Pc is modified by introducing transition metal atoms on the surface which can significantly improve the sensing properties [29,30,31].
Recently, many valuable contributions have been made by studies conducted into the doping of metal atoms on phthalocyanine for sensing common gas molecules such as CO2, CO, NO, O3, and O2. Dopant atoms (e.g., Sc, Ti, Fe, and Zn) can significantly alter the electronic and magnetic properties of Pc and, correspondingly, could promote its adsorption performance. For instance, Lü et al. [32] employed DFT calculations and Monte Carlo simulations to investigate the CO2 adsorption on TMPc (TM = Sc, Ti, and Fe) frameworks, and showed that the ScPc sheet exhibits excellent selectivity towards CO2. Using the DFT method, zinc phthalocyanine (ZnPc) and its derivatives were also illustrated to be highly sensitive in the detection of CO2, CO, NO, O3, and O2 gas molecules [33]. However, the sensing performance of metal-embedded phthalocyanine monolayers on CH2O gas has rarely been reported.
In this work, we performed the DFT calculation to determine the gas-sensing performance of palladium phthalocyanine (PdPc) and ruthenium phthalocyanine (RuPc) monolayers towards the CH2O gas molecule. The stable adsorption configurations, adsorption behaviors, and electronic characteristics of the CH2O adsorbed on the Pc, PdPc, and RuPc nanosheets were systematically investigated. The density of states (DOSs), charge-density difference (CDD), electron-density distribution (EDD), and charge transfer of different gas-adsorbent systems were further analyzed. The adsorption ability, sensing performance, and recovery time were evaluated to explore the possibility of PdPc and RuPc monolayers as promising gas-sensing materials for CH2O gas detection.

2. Modeling and Computing

The adsorption characteristics of corresponding adsorption systems were calculated by the Dmol3 module of the Materials Studio 8.0 Package based on the density functional theory (DFT) [34]. The Perdew–Burke–Ernzerhof (PBE) function within the generalized gradient approximation was used to describe the exchange-correlation effect of electrons [35]. The weak long-range interactions were corrected using the dispersion-corrected DFT (DFT-D) approach proposed by Grimme [36]. During the simulation, we adopted the double numerical plus polarization basis set and employed the DFT semi-core pseudopotential (DSSP) method [37,38]. A Monkhorst–Pack k-point mesh of 6 × 6 × 1 (12 × 12 × 1) was chosen for structural optimization (electronic properties calculation) [39]. The corresponding energy tolerance accuracy, maximum force, and displacement were selected as 1.0 × 10⁻⁵ Ha, 0.002 Ha/Å, and 0.005 Å, respectively. Additionally, the related parameters of total energy including the global orbital cut-off radius and smearing were set as 5.2 Å and 0.005 Ha, respectively. To prevent interactions between adjacent units, we adopted a vacuum layer of 20 Å in this work [40].
The adsorption energy (Eads) of the gas molecules on the pristine Pc and TMPc monolayers was determined to assess the gas capture ability as in Equation (1), as follows [41,42]:
E ads = E gas + TMPc E TMPc E gas
where Egas+TMPc is the total energy of the TM-doped phthalocyanine with gas adsorption, and ETMPc and Egas are the total energies of the TMPc monolayer and gas molecule, respectively. Generally, a negative Eads value indicates that adsorption is an exothermic process and can occur spontaneously; a more negative value indicates better stability.
The CDD of different adsorption systems was calculated to visualize the charge transfer (Qt) between gas molecules and TMPc monolayers. Estimating Qt based on the Hirshfeld charge is defined by Equation (2), as follows [43]:
Q t = Q adsorbed molecule Q isolated molecule
where Qadsorbed molecule and Qisolated molecule indicate the charge numbers of the target molecules before and after adsorption, respectively. Qt > 0 indicates that the electrons are transferred from the gas molecule to the TMPc surface; otherwise, the electrons are transferred from the TMPc surface to the gas molecule.

3. Results and Discussion

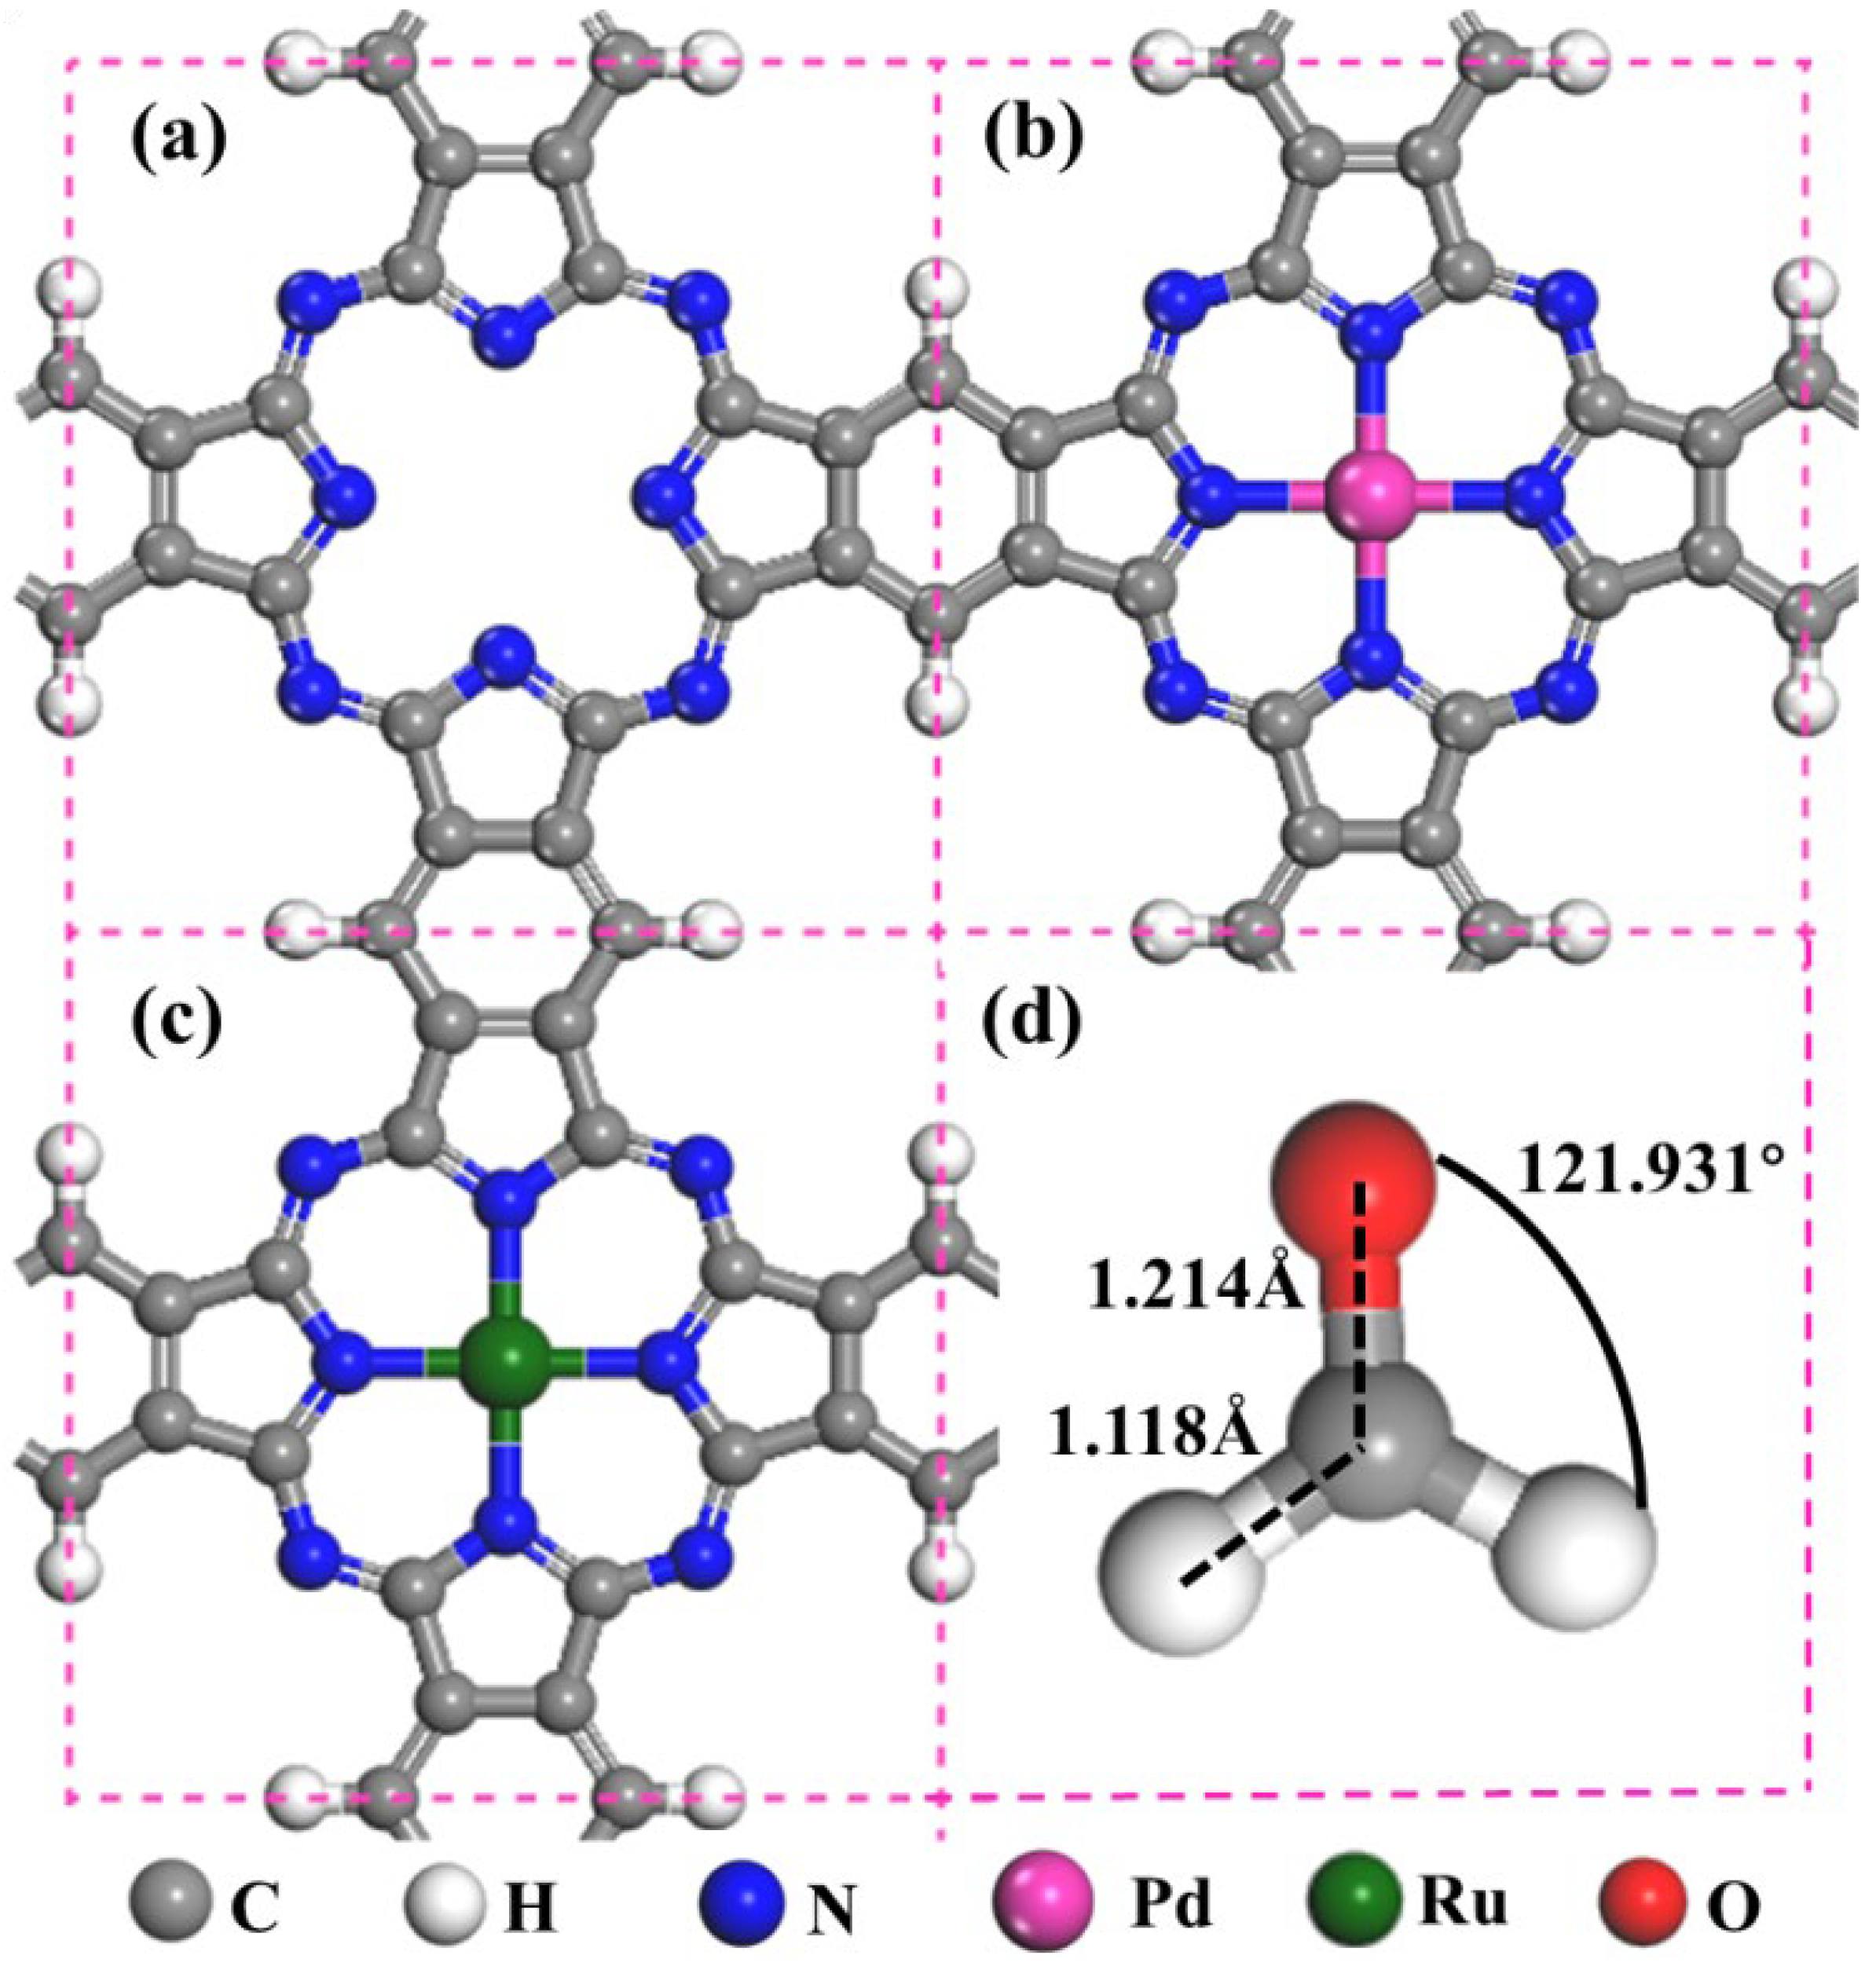
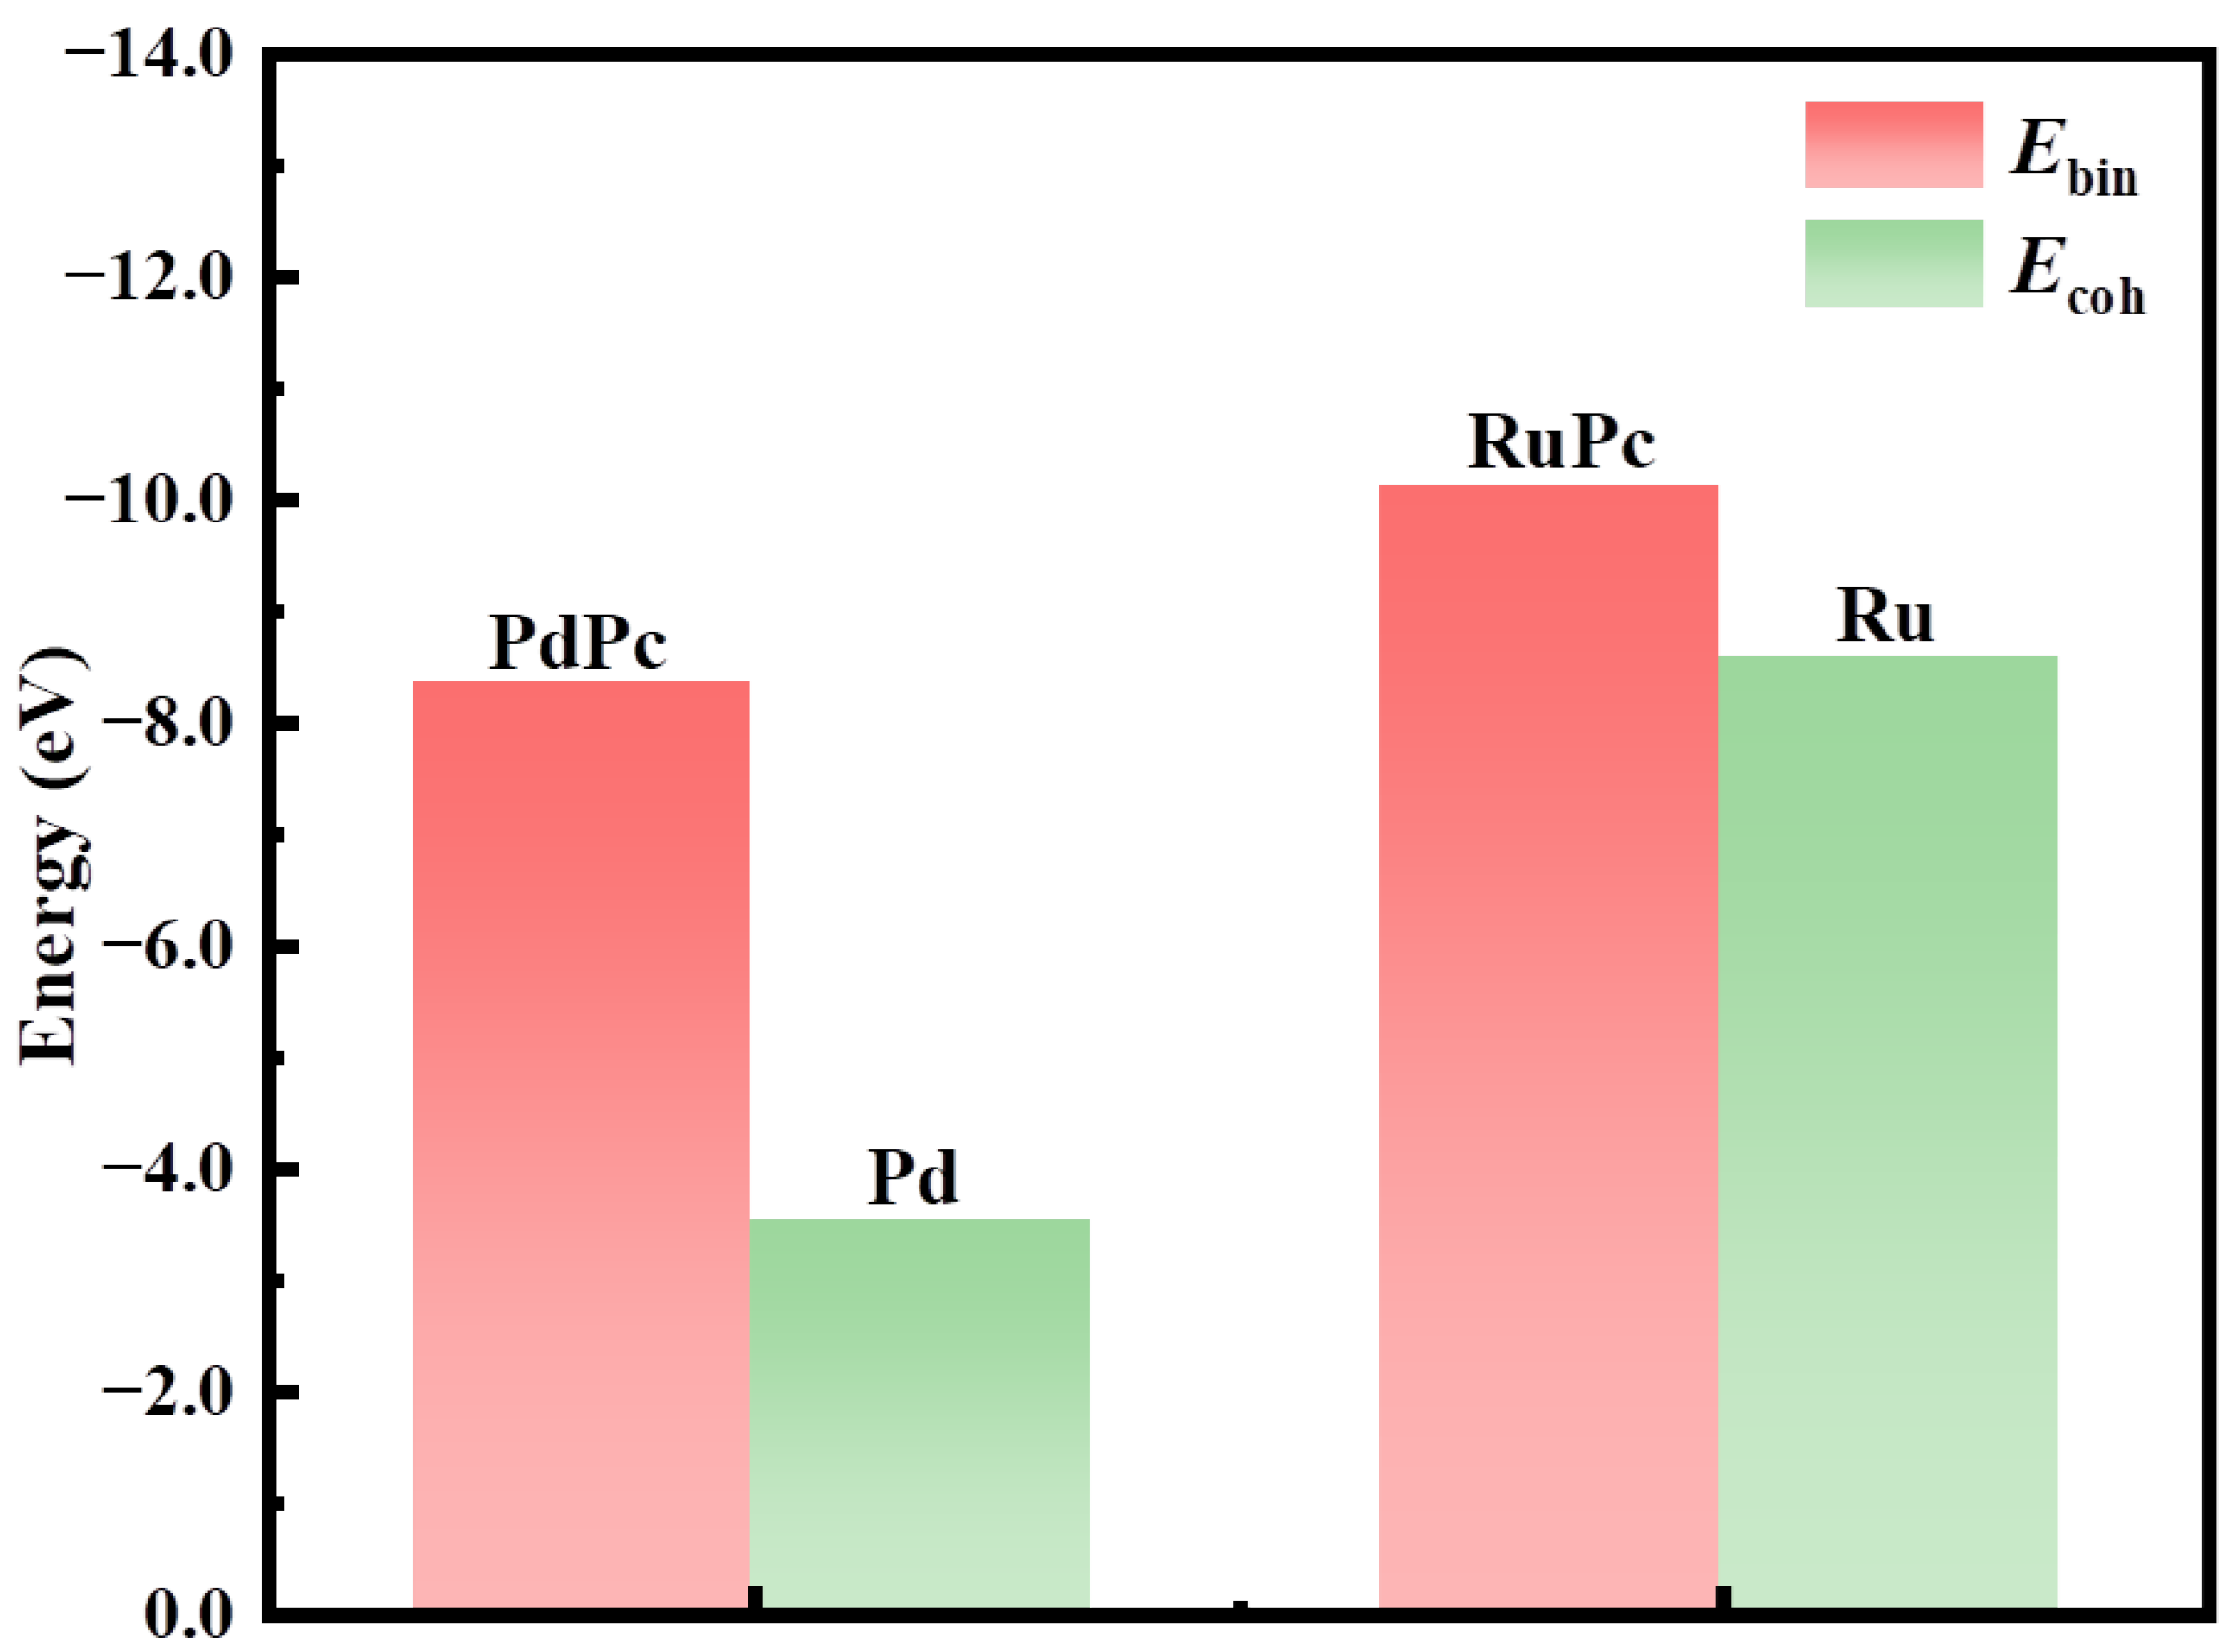
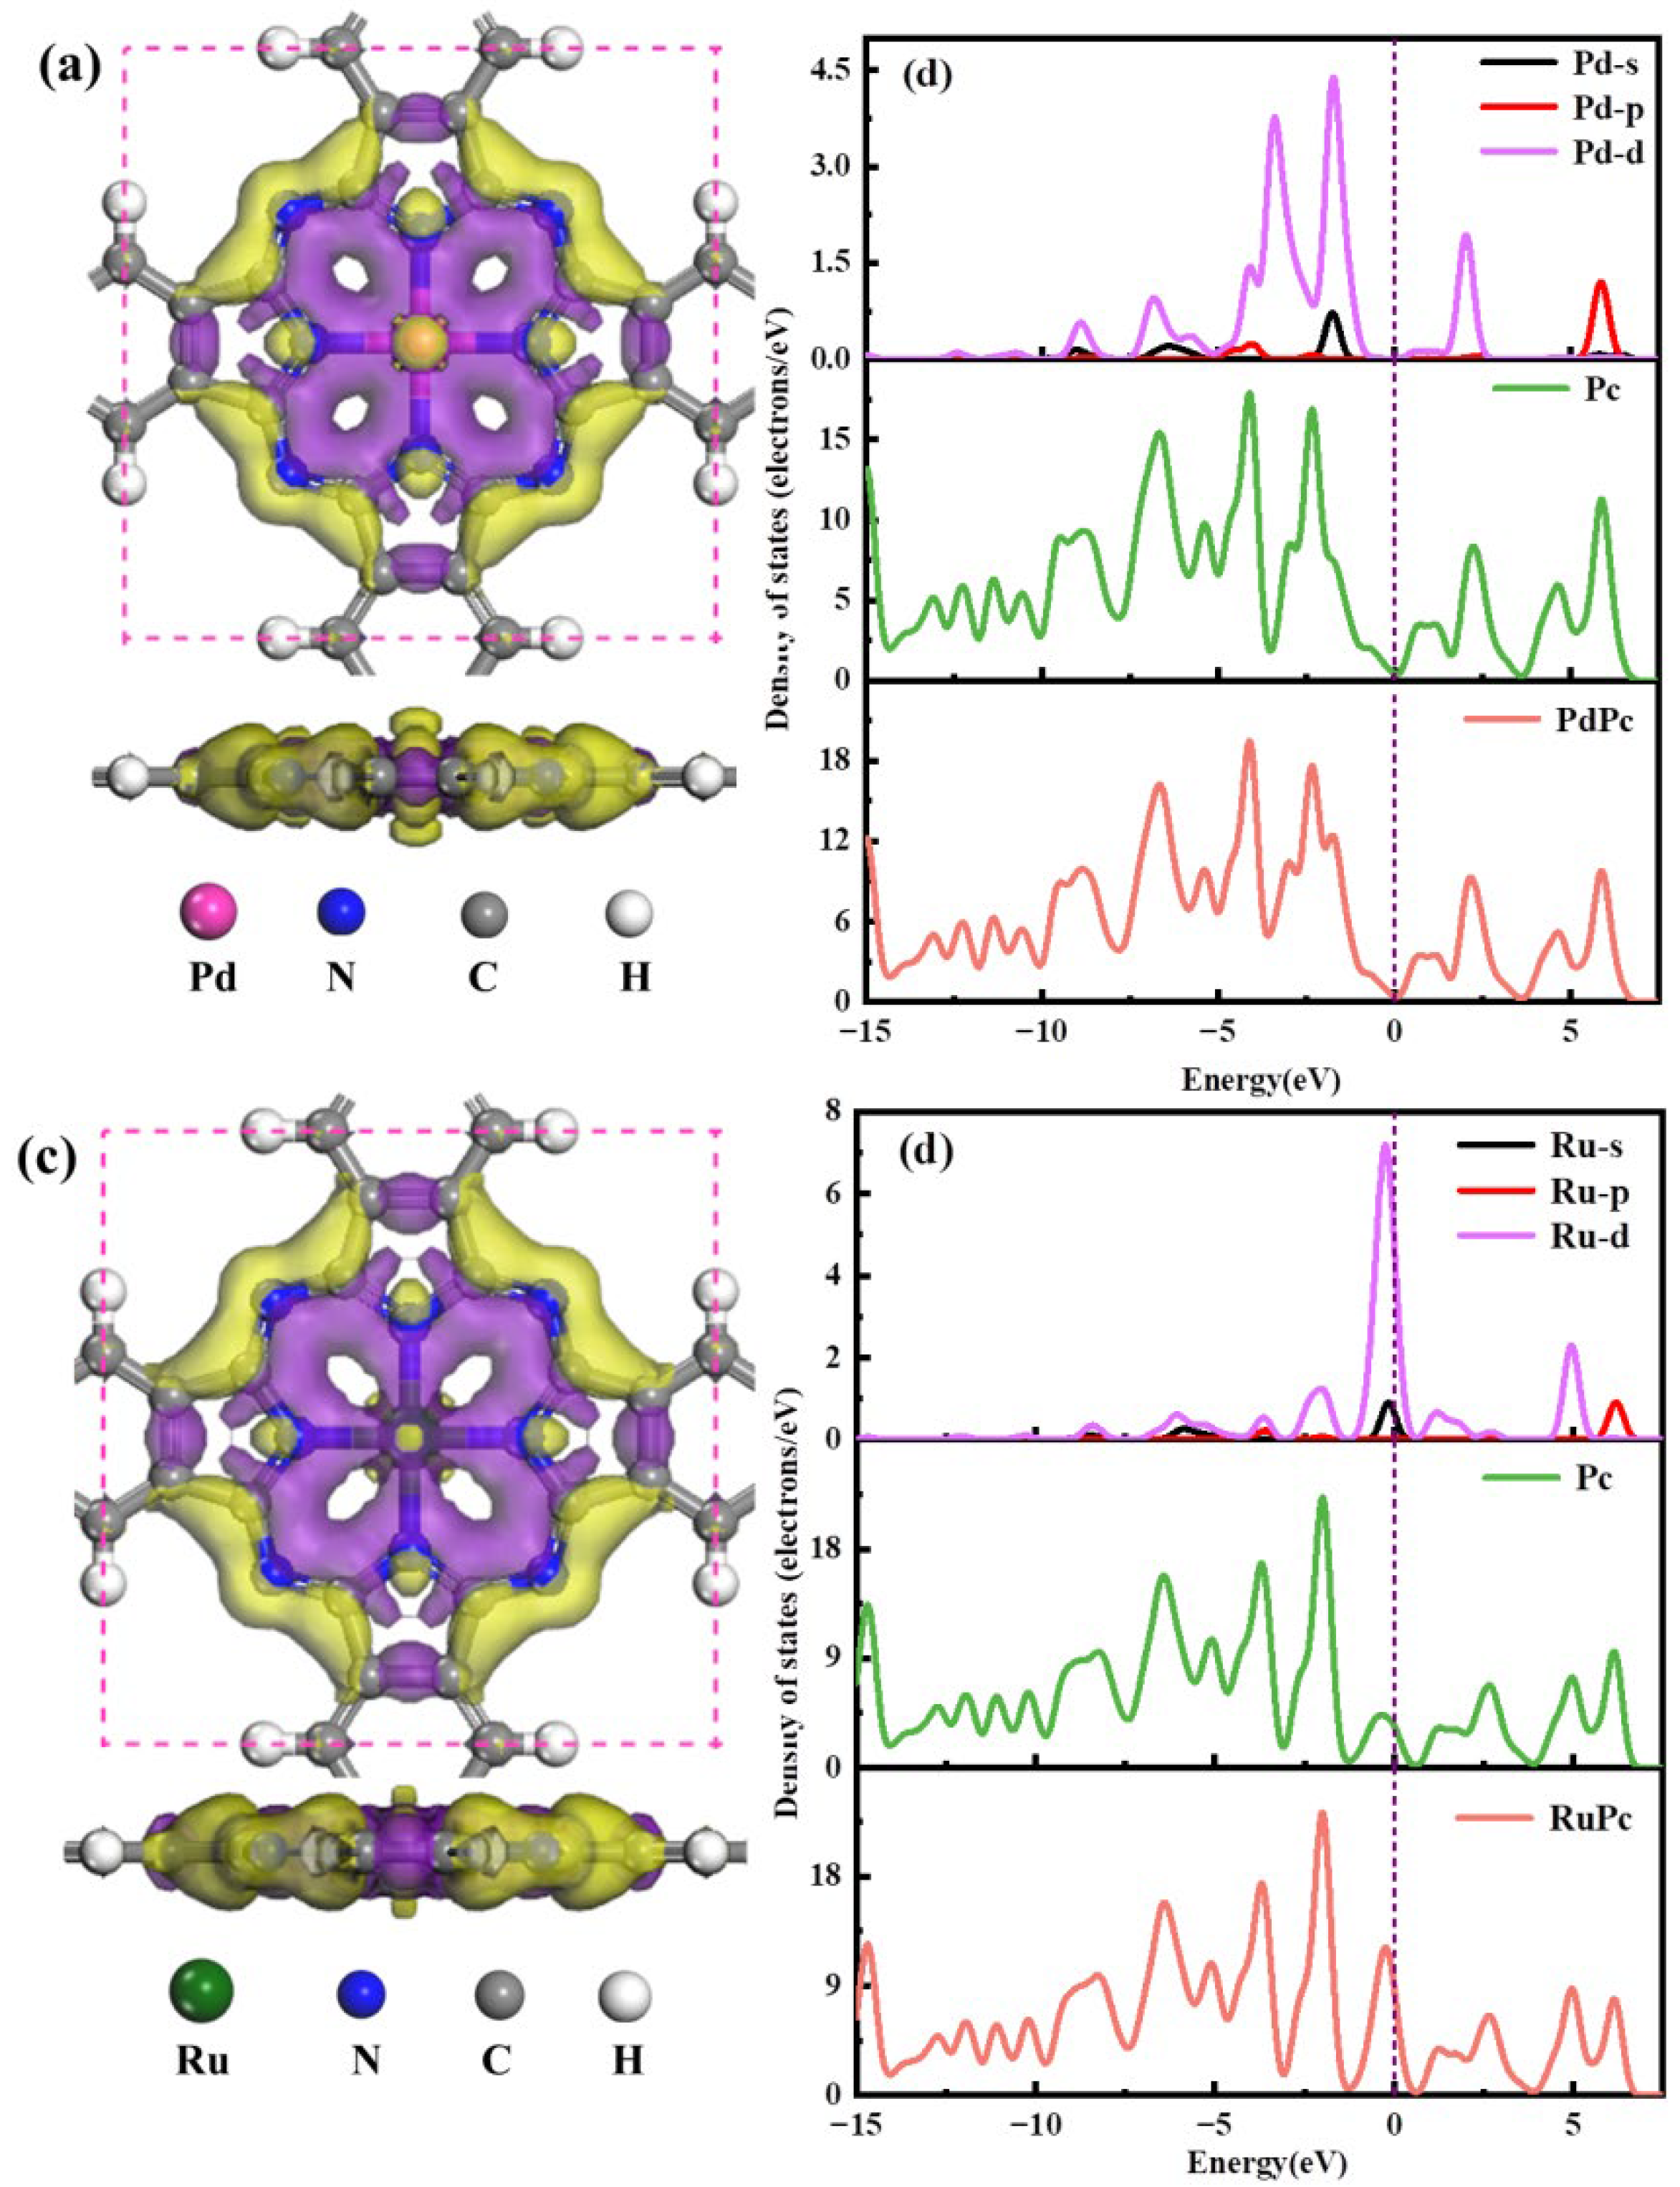
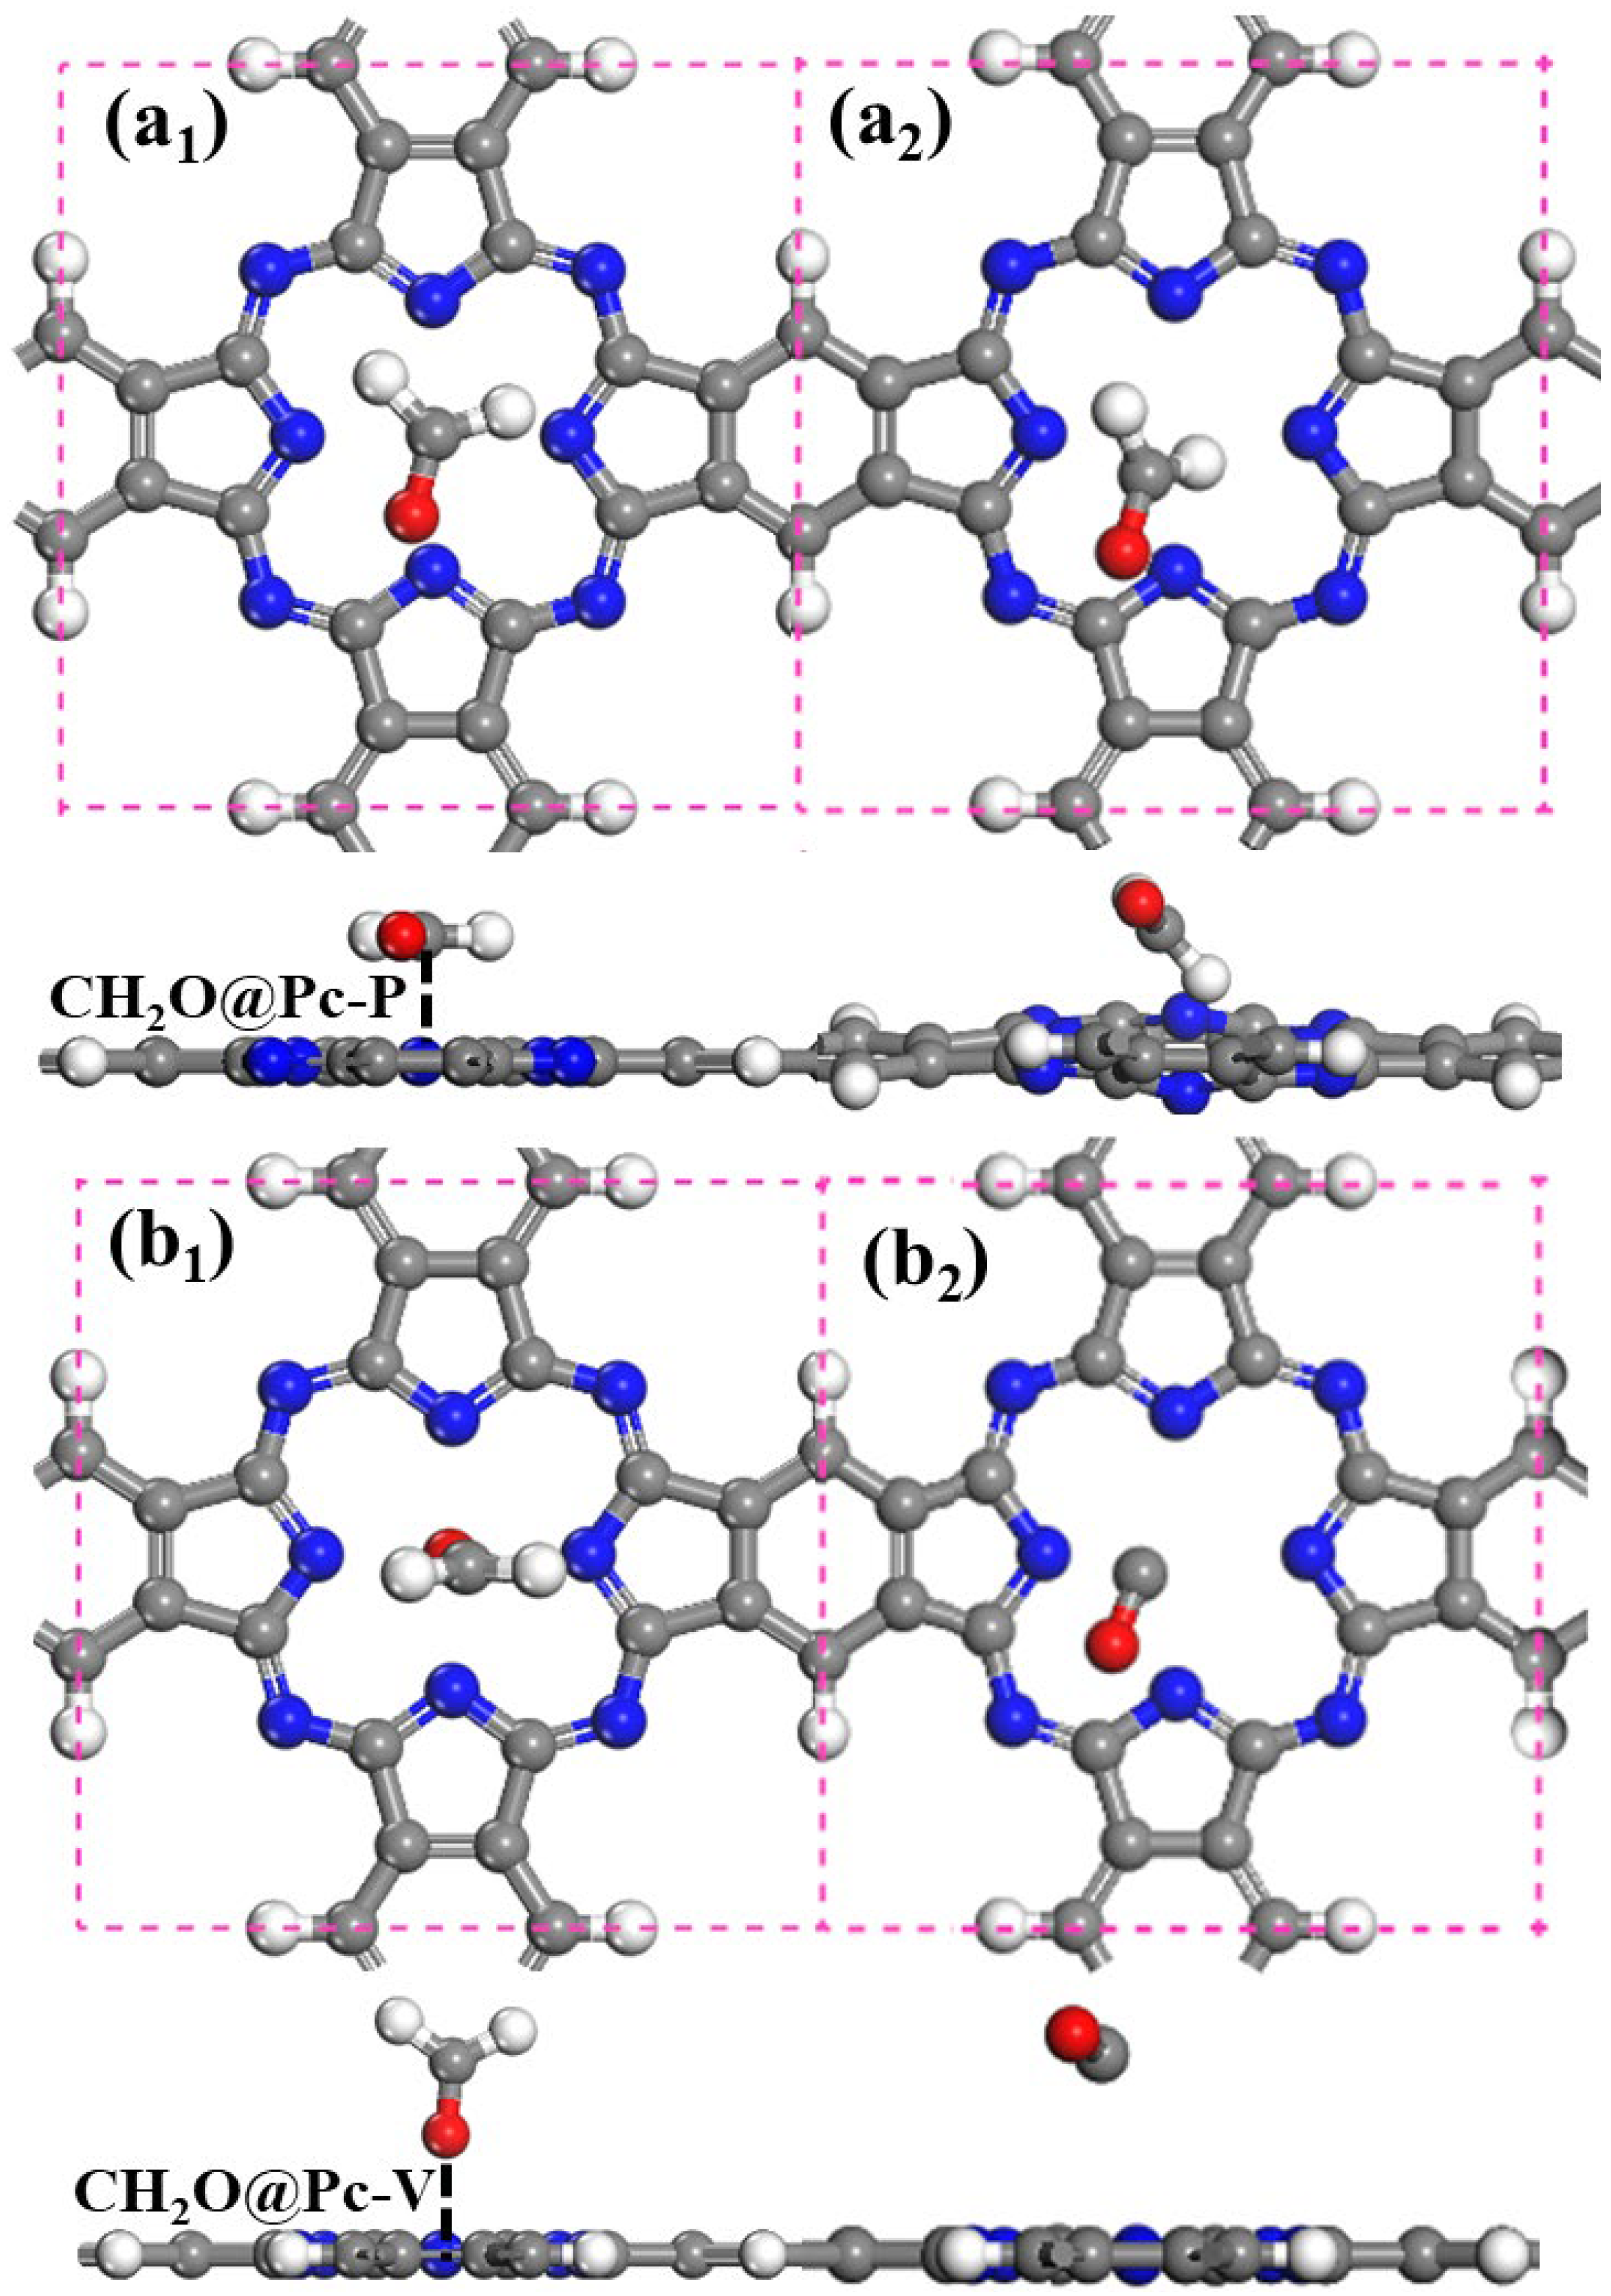
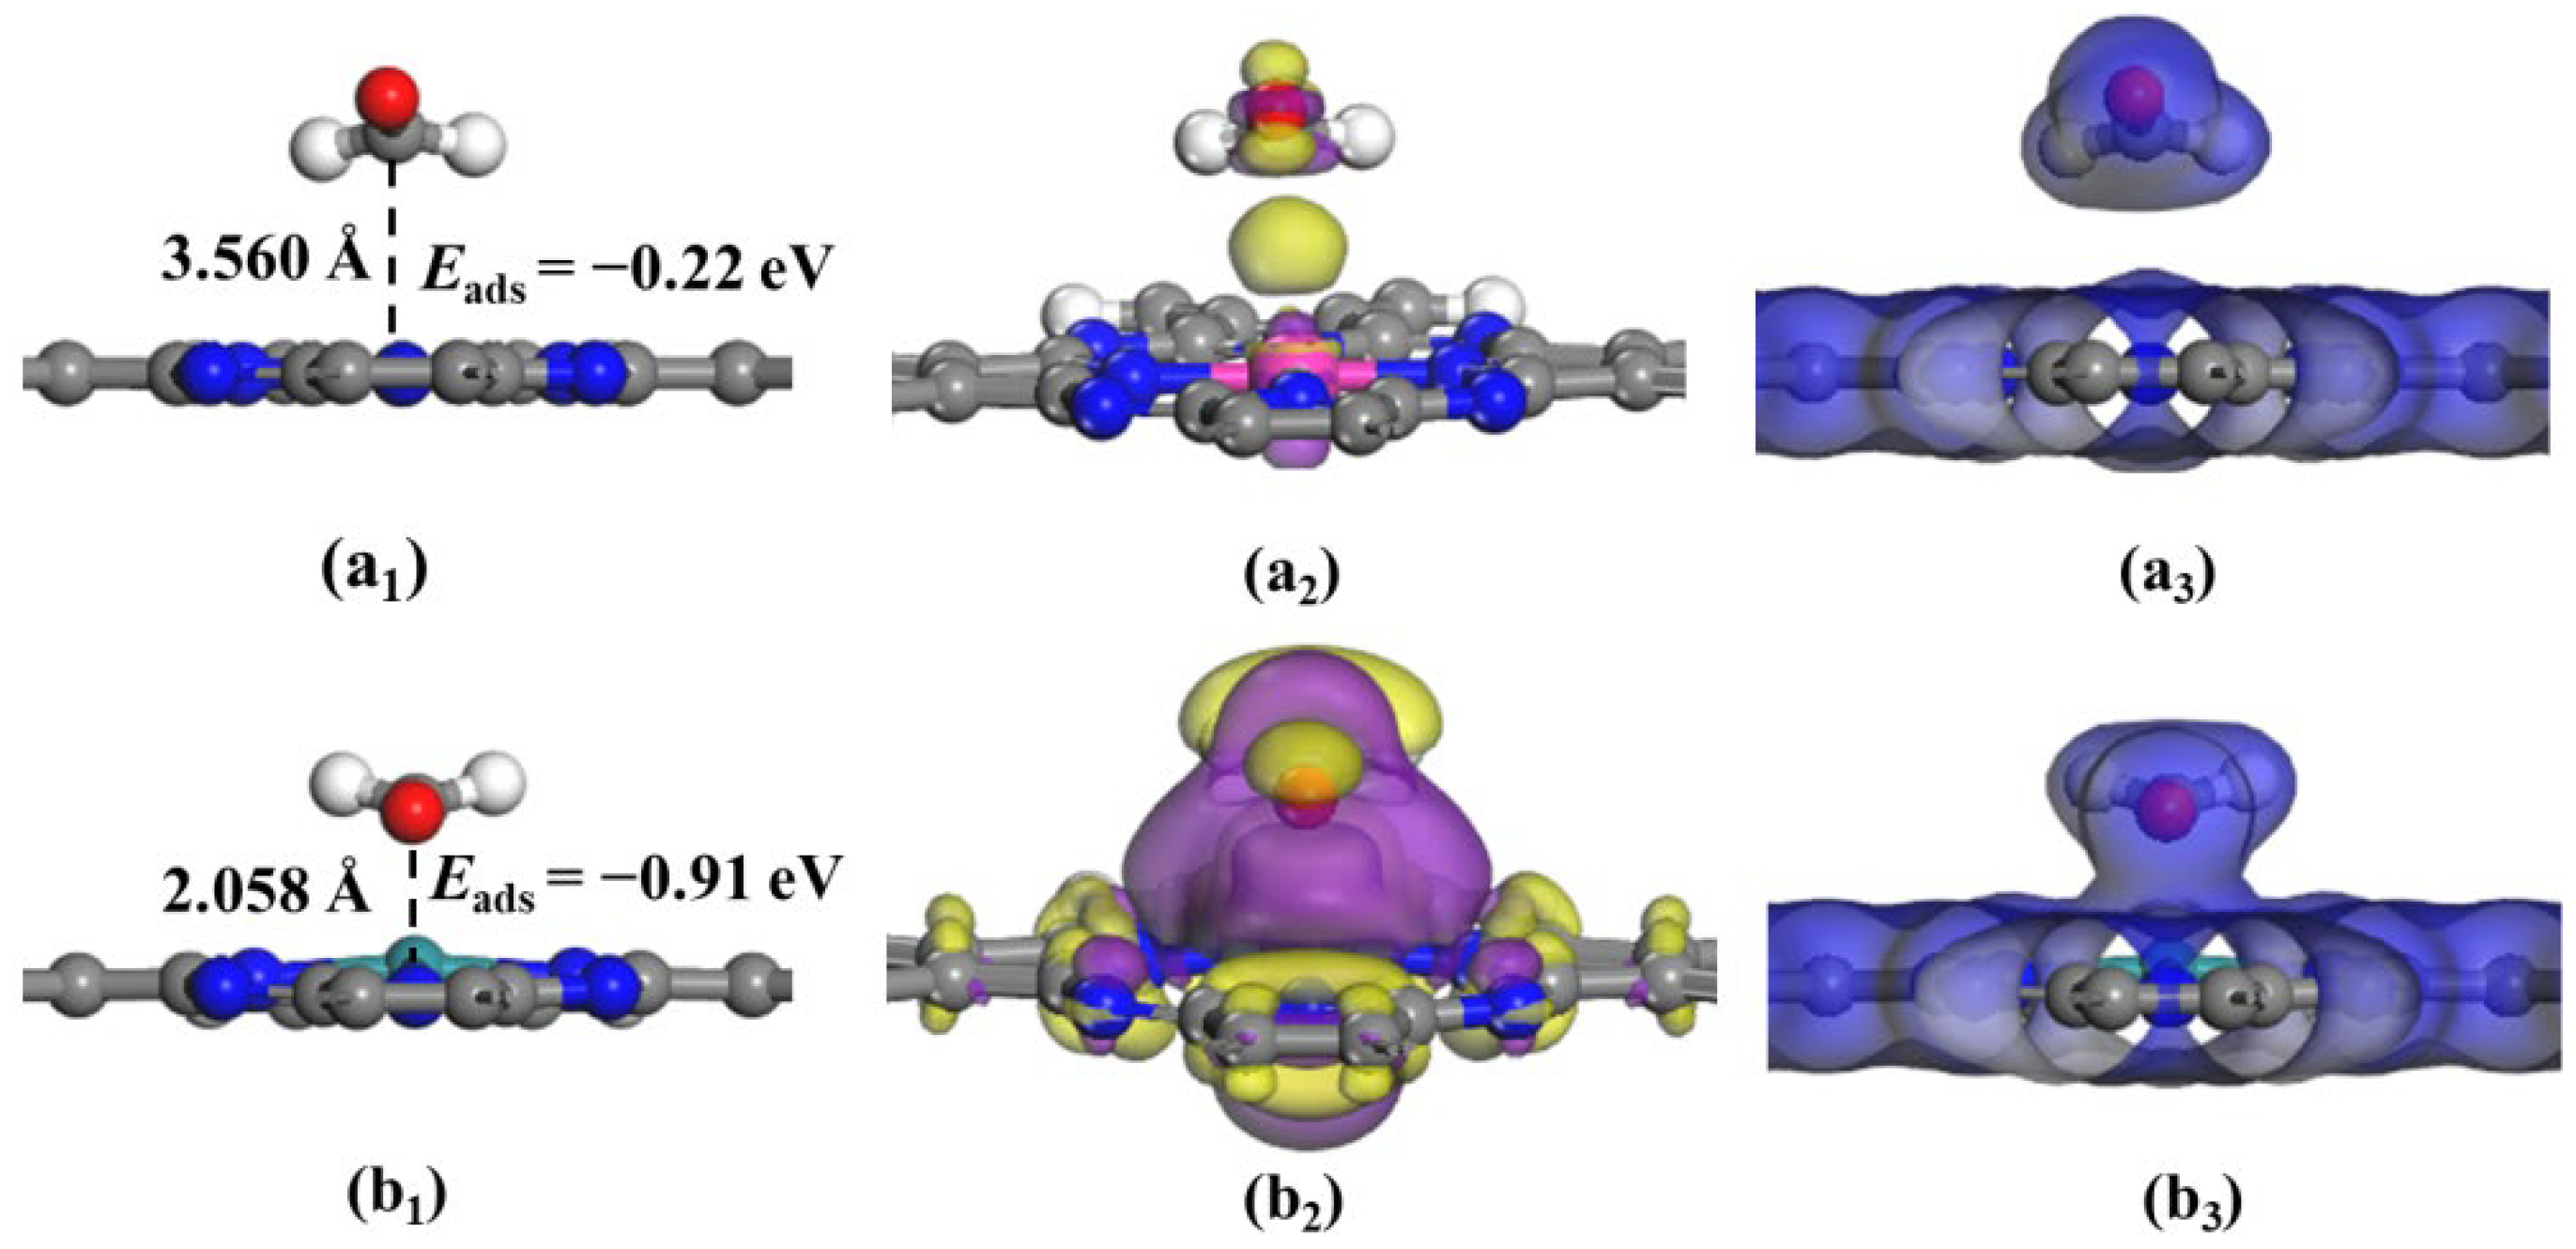
3.1. Optimum Structure and Stable Adsorption Configuration

Figure 1 depicts the fully-relaxed structures of Pc, PdPc, RuPc, and CH2O gas molecules. Figure 1a shows the molecular structure of an unsubstituted Pc nanosheet, which contains 20 C, 8 N, and 4 H atoms. All the atoms within the Pc molecule are coplanar and fully conjugated. Different metal phthalocyanine complexes have different structures [44], and according to the investigation conducted by Mellor and Maley [45], the bivalent Pd ion in the complex has the absolute stability. Moreover, ruthenium coordination complexes exhibit a wide range of formal metal oxidation states [46], and the majority of reported RuPc complexes have Ru(Ⅱ) metal centers. Therefore, in this work, the PdPc and RuPc nanosheet is a monolayer of metal phthalocyanine complex formed by decorating Pd2+ and Ru2+ ions into the central cavity of the phthalocyanine, as displayed in Figure 1b,c. These two metal-embedded phthalocyanine monolayers remain “graphene-like” plane configurations, and their lattice parameters have a negligible change. The calculated lattice constant of the TMPc monolayer is about 10.69 Å, which agrees well with the experimental value [47,48] and other theoretical calculations [49,50]. Figure 1d shows the optimized structure of the CH2O gas molecule. In the optimized CH2O geometric model, the bond lengths of C-O and C-H are calculated to be 1.214 Å and 1.118 Å, respectively, and the bond angle (H-C-O) is found to be 121.931°, which is consistent with experimental value and other theoretical studies [51].
Figure 2 shows the diagram of binding energy (Ebin) for the TM atoms embedded in the Pc sheet. It was found that the binding energy (Ebin) between doped TM atoms and Pc nanosheet was in the range of −8.23 eV to −10.11 eV, and all the values were lower than the corresponding metal bulk cohesive energy (Ecoh). This outcome demonstrates the high thermodynamic stability of the PdPc and RuPc monolayers.
Figure 3 depicts the charge-density difference (CDD) and density of states (DOSs) of the PdPc and RuPc monolayers. Figure 3a,c show electron-depletion regions around Pd and Ru atoms, whereas many electrons accumulate around N and C atoms of Pc molecules. This result indicates that there exists a strong covalent bond between the TM and Pc monolayers. As displayed in Figure 3b,d, the Pd-d and Ru-d orbital is greatly hybrid with Pc orbital at the range of −10.0 to 7.5 eV, which shows that the interaction between Pd and Ru atoms and Pc is strong. Consequently, the Pd and Ru atoms have a strong affinity with Pc monolayers. This outcome also further demonstrates the structural stability of the PdPc and RuPc nanosheets, which is consistent with the calculated results of binding energy (Ebin) displayed in Figure 2.

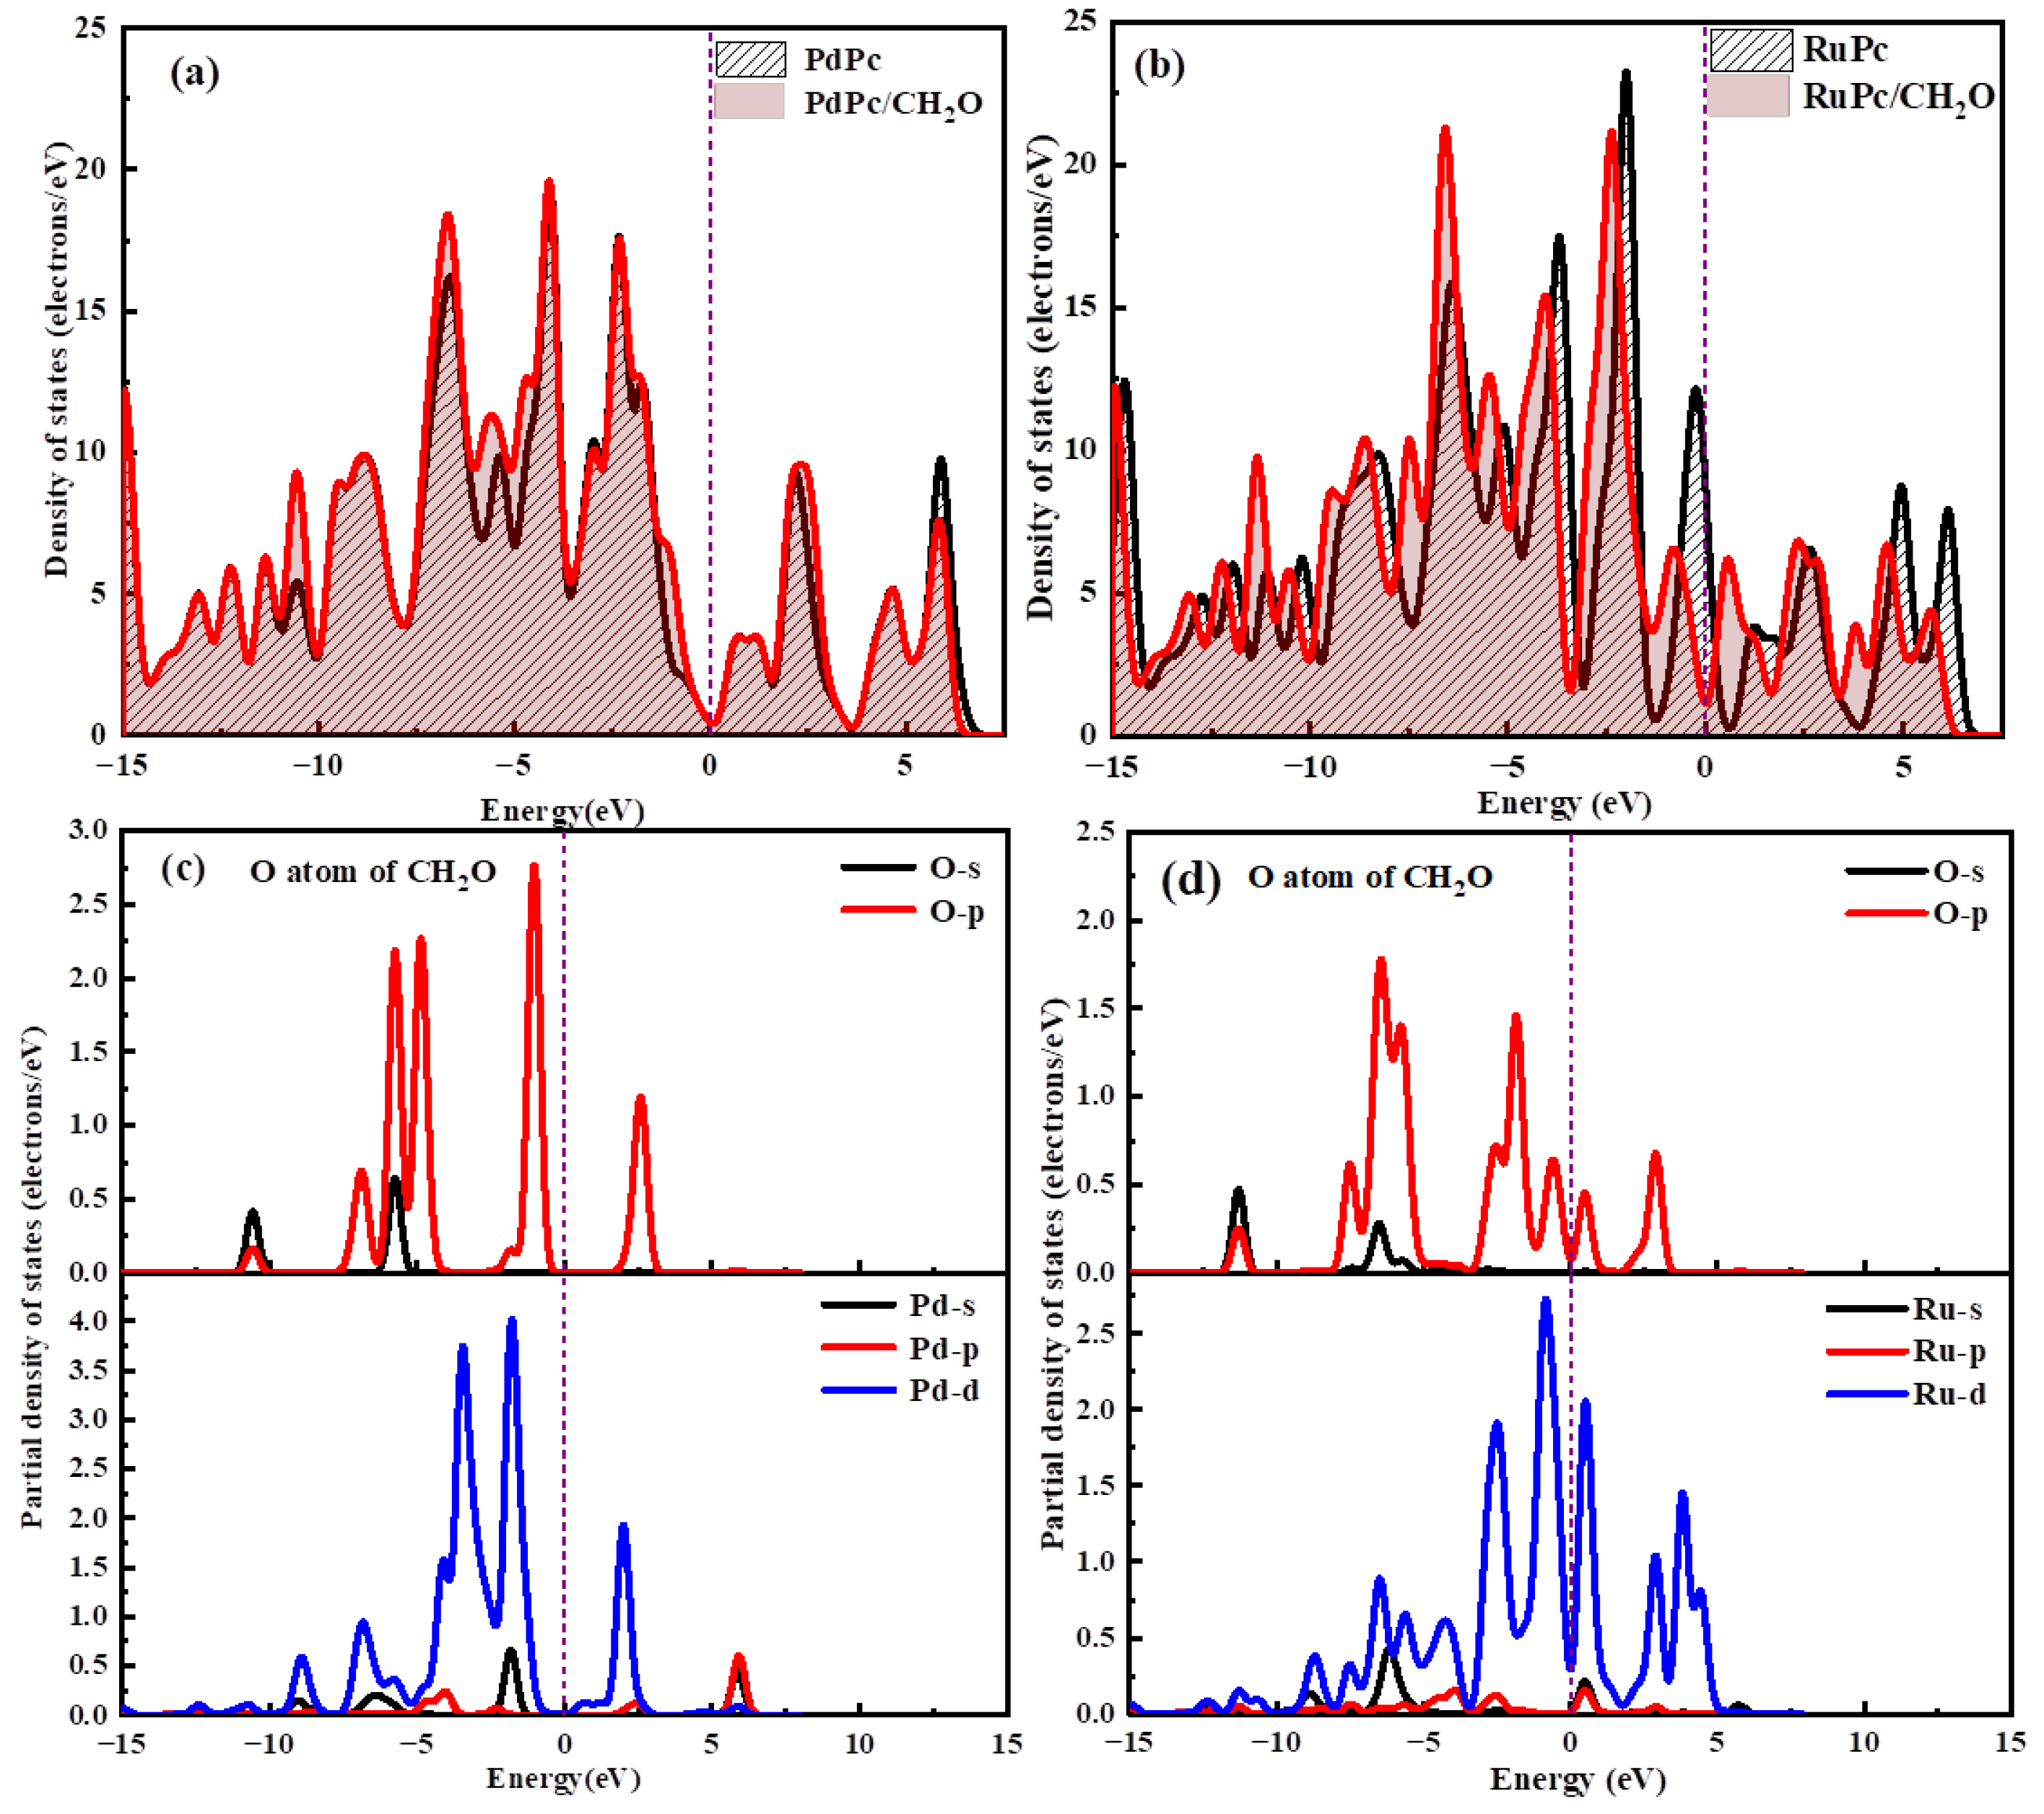
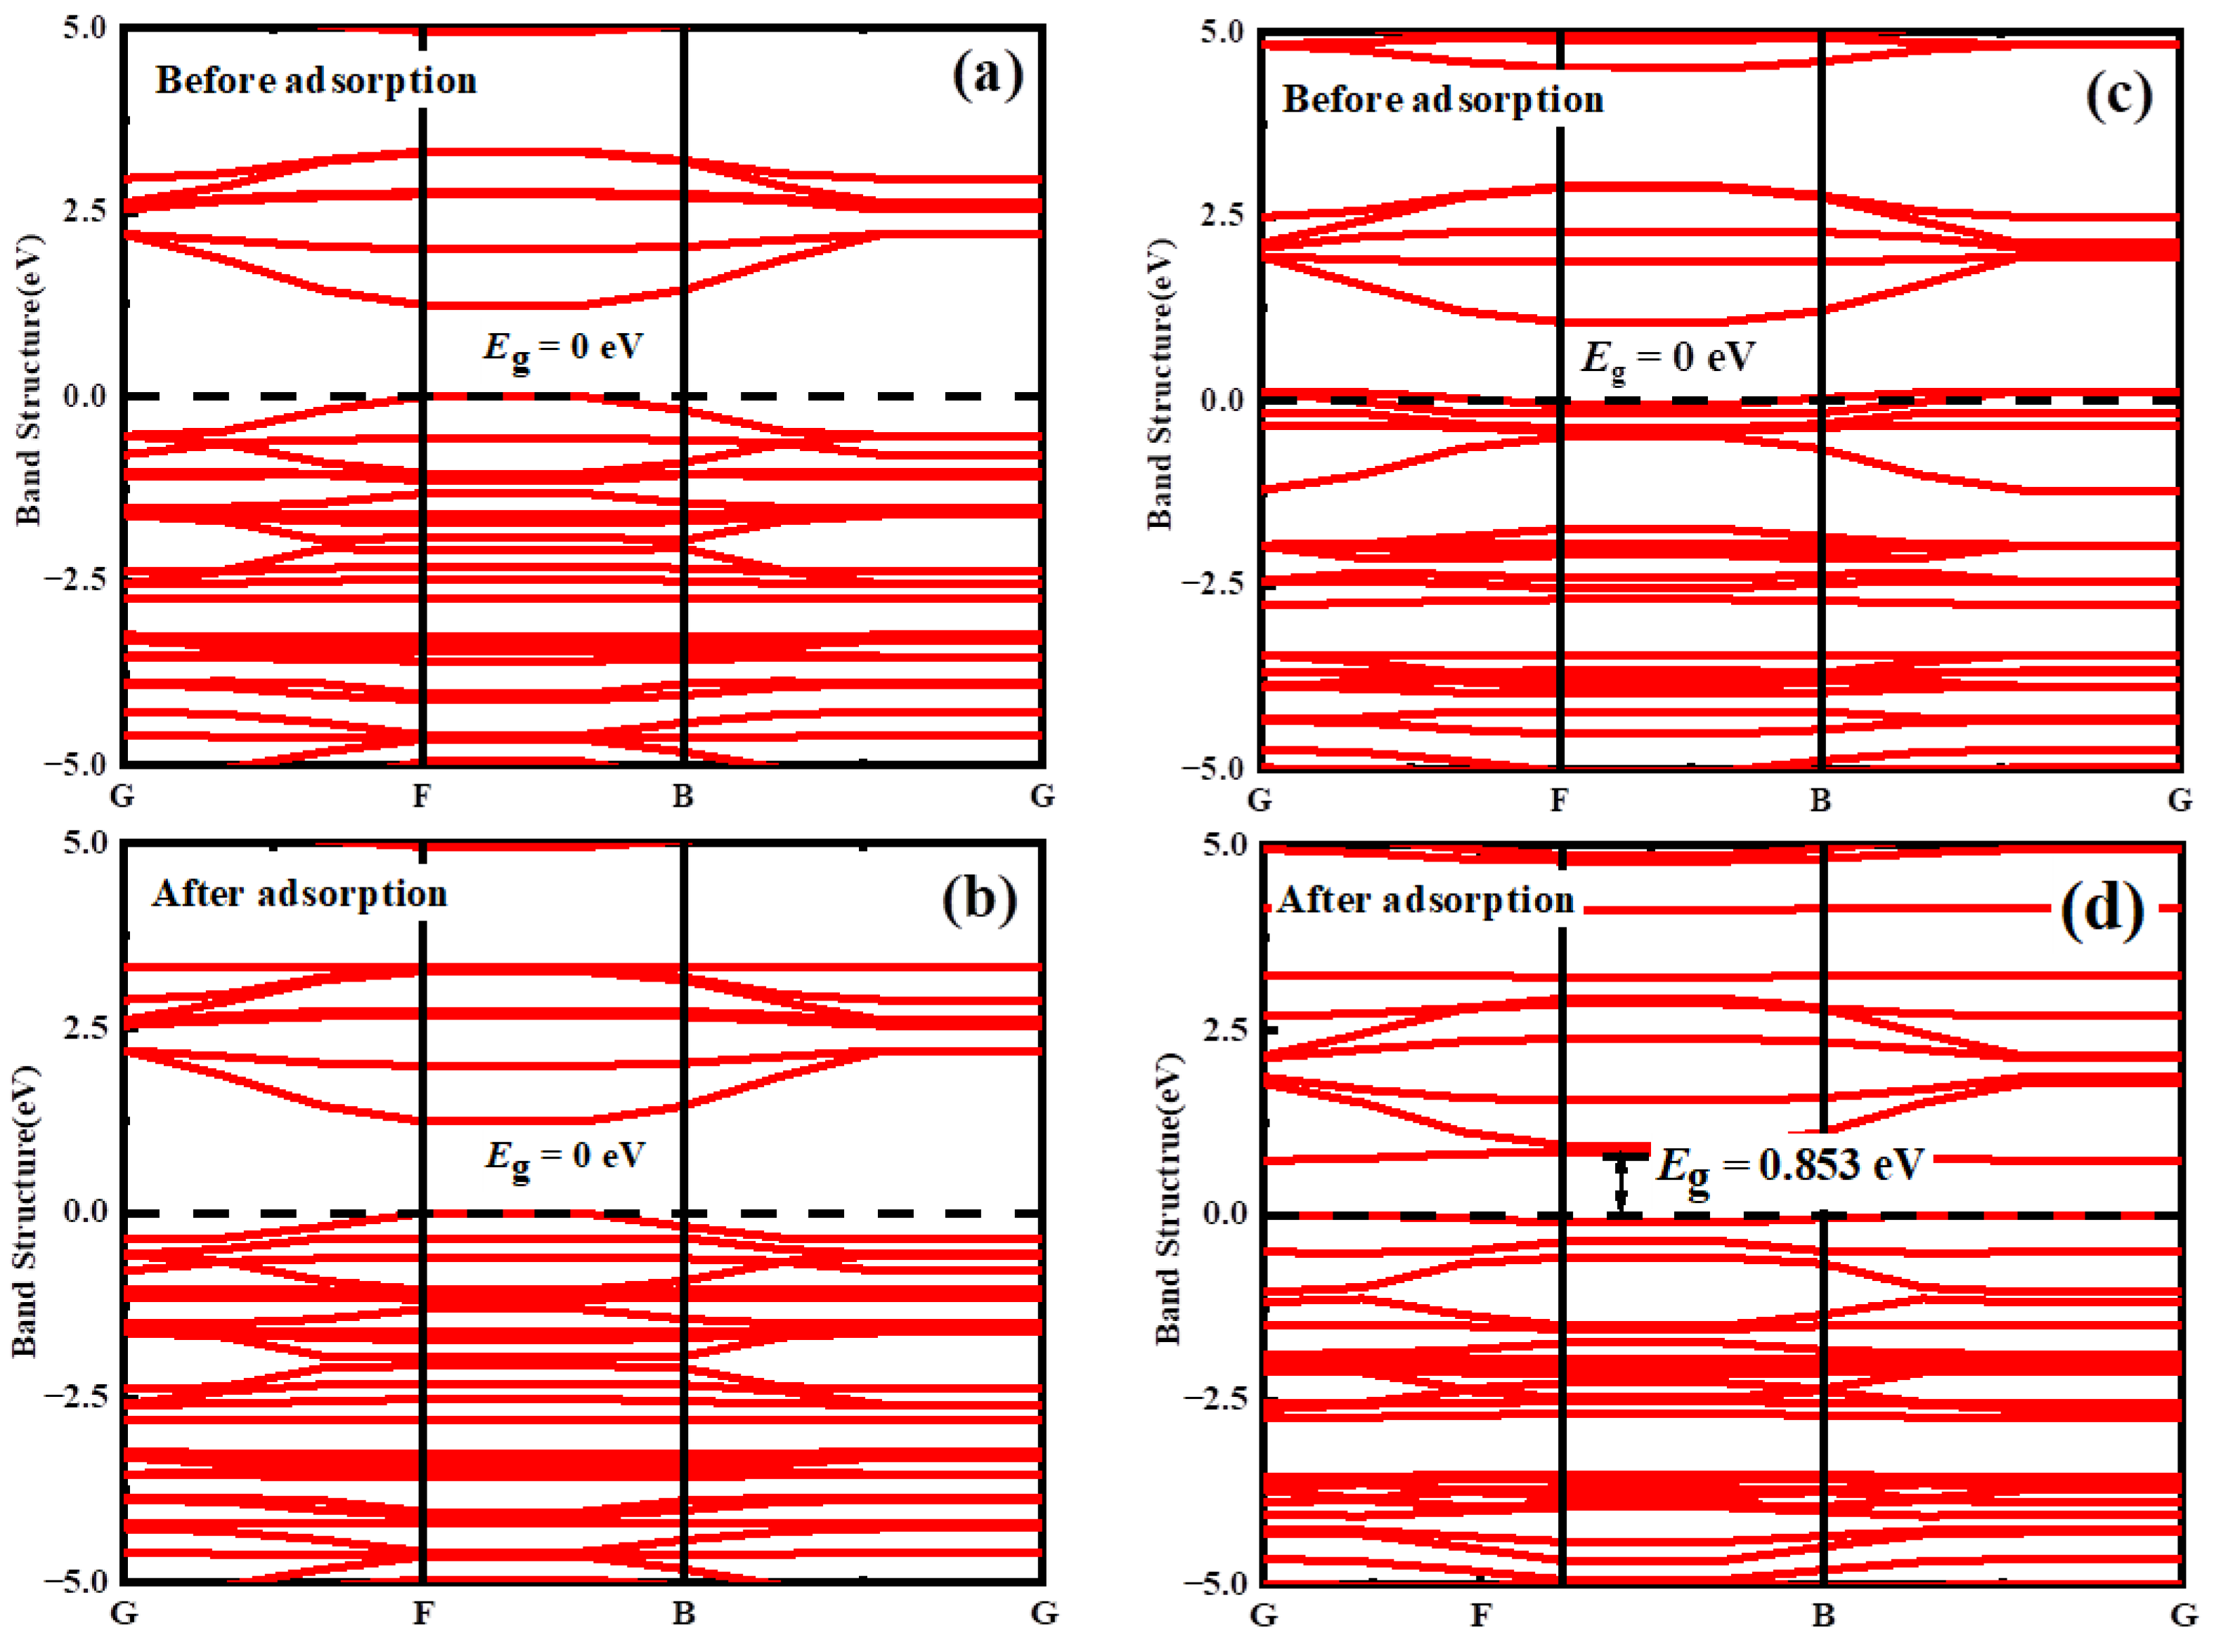
3.2. Adsorption Properties of CH2O on Pc, PdPc, and RuPc Monolayers

According to our previous investigation [52], the Pc nanosheet central vacancy or just above the central metal atom of the TMPc monolayer was regarded as the gas molecule preferential adsorption site. In this work, we also considered two different adsorption styles, namely, CH2O gas molecule adsorbed on the Pc nanosheet in parallel and vertical styles, which we defined as CH2O@Pc-P and CH2O@Pc-V, respectively, as shown in Figure 4(a1,b1). For the first adsorption style (CH2O@Pc-P), after CH2O adsorption on the Pc monolayer, one can see that the gas molecule prefers to adsorb on the Pc nanosheet with an oriented H atom and the planar Pc slightly bends at the adsorption site towards the CH2O gas, as shown in Figure 4(a2). The corresponding adsorption energy (Eads) was found to be −0.58 eV, and an amount of 0.0163 e was transferred from the Pc nanosheet to the CH2O gas molecule, as seen in Table 1. Nevertheless, after the CH2O gas molecule adsorption on the Pc nanosheet in vertical style, as shown in Figure 4(b2), it was found that the two H atoms of gas had been dissociated and only the O and C atoms remained in the gaseous phase. The related adsorption energy (Eads) of the CH2O@Pc-V adsorption system was −4.27 eV and the large amount of 0.1969 e was transferred from the gas molecule to the Pc nanosheet (Table 1). Although the pristine Pc had a noticeable change in the conducting behavior after the CH2O gas molecule adsorption in vertical style (seeing the change of band gap in Table 1), the ultra-strong adsorption strength restricted its further gas-sensing application [52].
To further explore a potential candidate as a gas-sensing material for CH2O gas detection, we selected the Pd and Ru dopant atoms to tune the adsorption performance of pristine Pc. Table 2 lists the detailed calculated information, including the adsorption energy, adsorption distance, charge transfer, and band gap for the CH2O@PdPc and CH2O@RuPc adsorption systems. It is found that the CH2O molecule preferred to adsorb on PdPc and RuPc sheets in parallel style, and the corresponding adsorption energies were −0.22 eV and −0.91 eV, respectively. This outcome shows that the adsorption of the CH2O molecule on the PdPc sheet is physisorption, which primarily depends on the van der Waals force. By contrast, the RuPc monolayer has a stronger affinity with the CH2O gas molecule. Additionally, there is a noticeable change in the conducting behavior of RuPc after the CH2O gas molecule adsorption, demonstrating that the RuPc sheet is highly sensitive to these gas molecules.
Figure 5 illustrates the lowest-energy configurations along with charge-density difference (CDD) and electron-density distribution (EDD) of CH2O adsorbed on PdPc and RuPc monolayers. In Figure 5(a1), one can see that the CH2O gas molecule adsorbs at a large distance of about 3.560 Å on the surface of the PdPc nanosheet with lower adsorption energy of −0.22 eV. This interaction reveals weak physisorption, primarily owing to the interaction of the van der Waals force. Figure 5(a2,a3) displays the CDD and EDD maps of the CH2O@PdPc adsorption system, it is seen that there is no distinct electron-density overlap between the CH2O gas molecule and the PdPc sheet, and a very small amount of charge is transferred from the CH2O gas molecule to the PdPc sheet due to its weak interaction. Compared with the case of the PdPc sheet, the CH2O gas molecule experienced a stronger interaction, the corresponding adsorption energy was found to be −0.91 eV with a smaller adsorption distance of 2.096 Å, as shown in Figure 5(b1). From the CDD maps, as shown in Figure 5(b2), one can see an evident electron-depletion region around the Ru atom, whereas many electrons were accumulated around the CH2O gas and Pc molecule. This outcome suggests that the doped Ru behaves as a bridge enhancing the interaction between the CH2O gas and Pc nanosheet. Moreover, the EDD diagram of the CH2O@RuPc adsorption system (shown in Figure 5(b3)) also shows the strong overlapping of charge density between the CH2O gas molecule and RuPc sheet. Consequently, the RuPc monolayer has stronger capture ability towards CH2O gas than the PdPc one.
To further study the electronic behaviors of CH2O@PdPc and CH2O@RuPc adsorption systems for understanding gas-sensing mechanisms, the corresponding DOSs and PDOSs spectra of these two adsorption systems are displayed in Figure 6. From Figure 6a, it can be seen that after the adsorption of CH2O gas on the PdPc sheet, the DOSs had no obvious shift, and remained almost the same; that is, the CH2O gas does not influence the electronic properties of the PdPc nanosheet. Moreover, no prominent resonance peaks were observed between O-p and Ru-d orbitals, as shown in Figure 6c. This result further implies that the adsorption interaction of CH2O on the PdPc monolayer is mainly due to the van der Waals force. In Figure 6b, the DOSs spectra of the CH2O@RuPc adsorption system and the pristine RuPc in the range of −15 eV to 7.5 eV has obvious deviation. The dominant peak of RuPc around the Fermi level disappears after the adsorption of CH2O gas. Hence, the CH2O gas molecule can significantly affect the electronic properties of the RuPc nanosheet. From the PDOSs displayed in Figure 6d, one can see that their strong adsorption strength is primarily attributed to the great orbital hybridization between O-p and Ru-d, and numerous dominant resonance peaks are found at the range of −7.5 to 2.5 eV. This outcome further shows the adsorption energy (Eads) absolute value and configuration of the CH2O@RuPc adsorption system is high and stable, respectively.

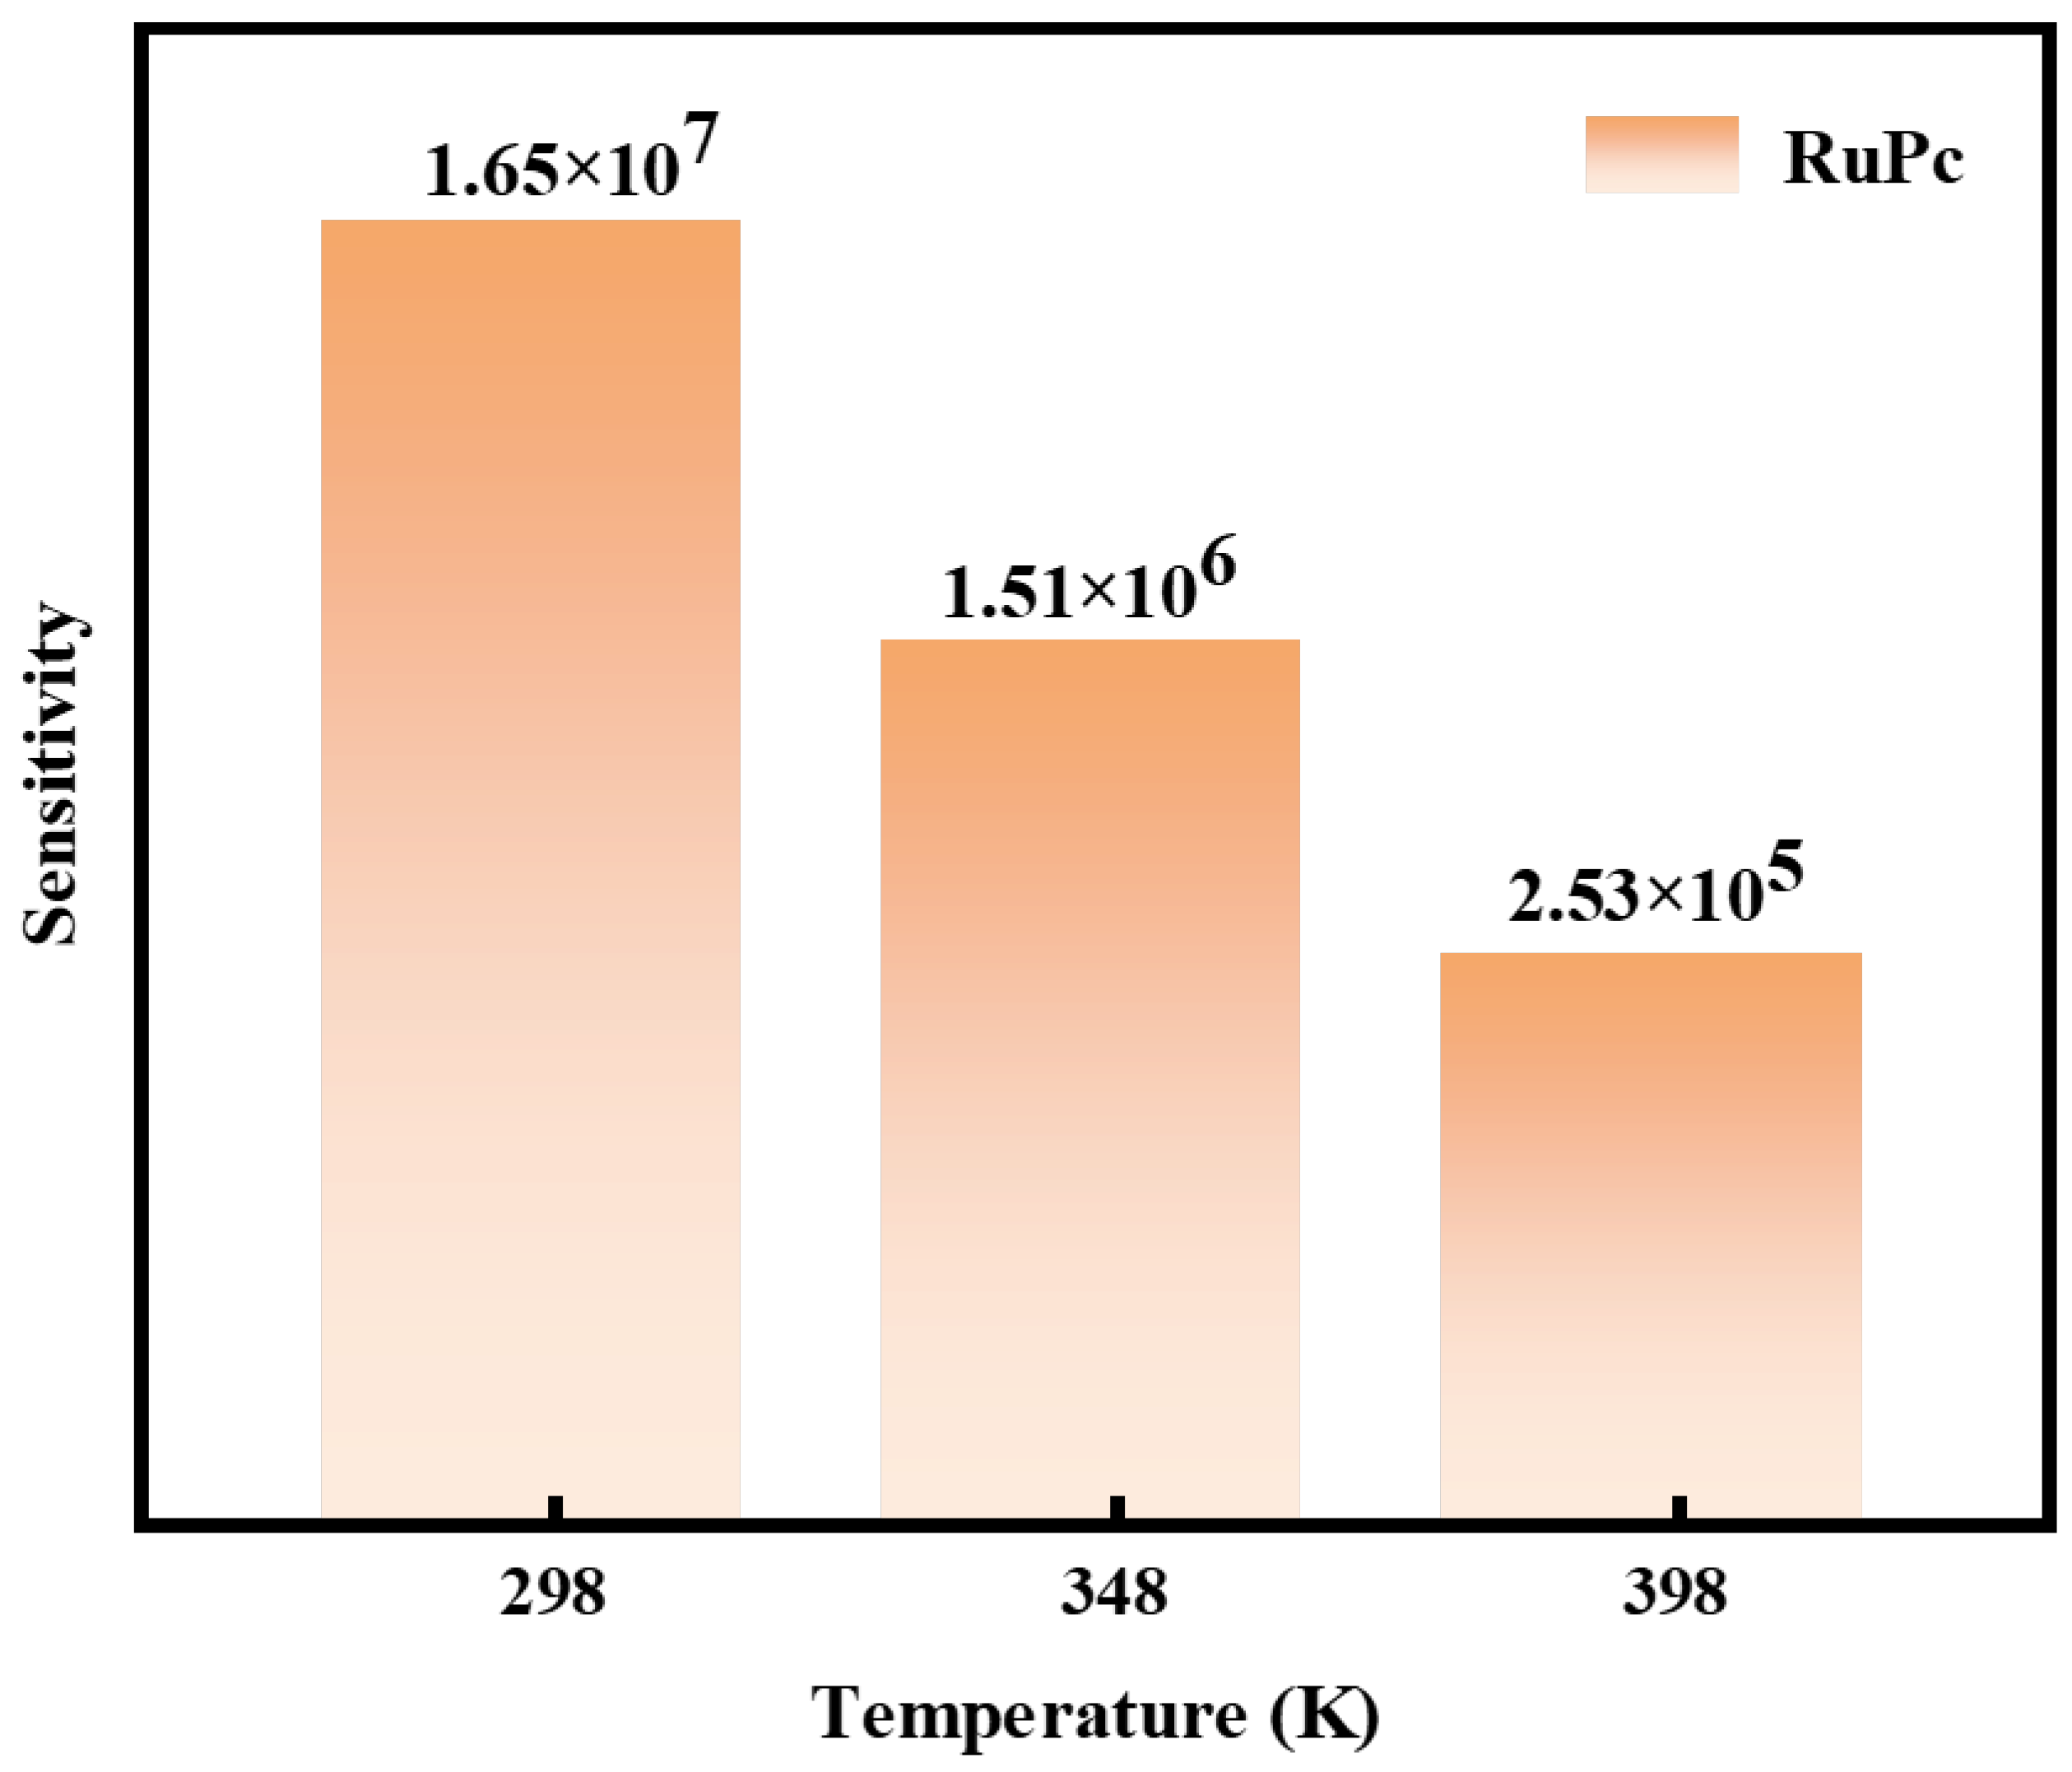
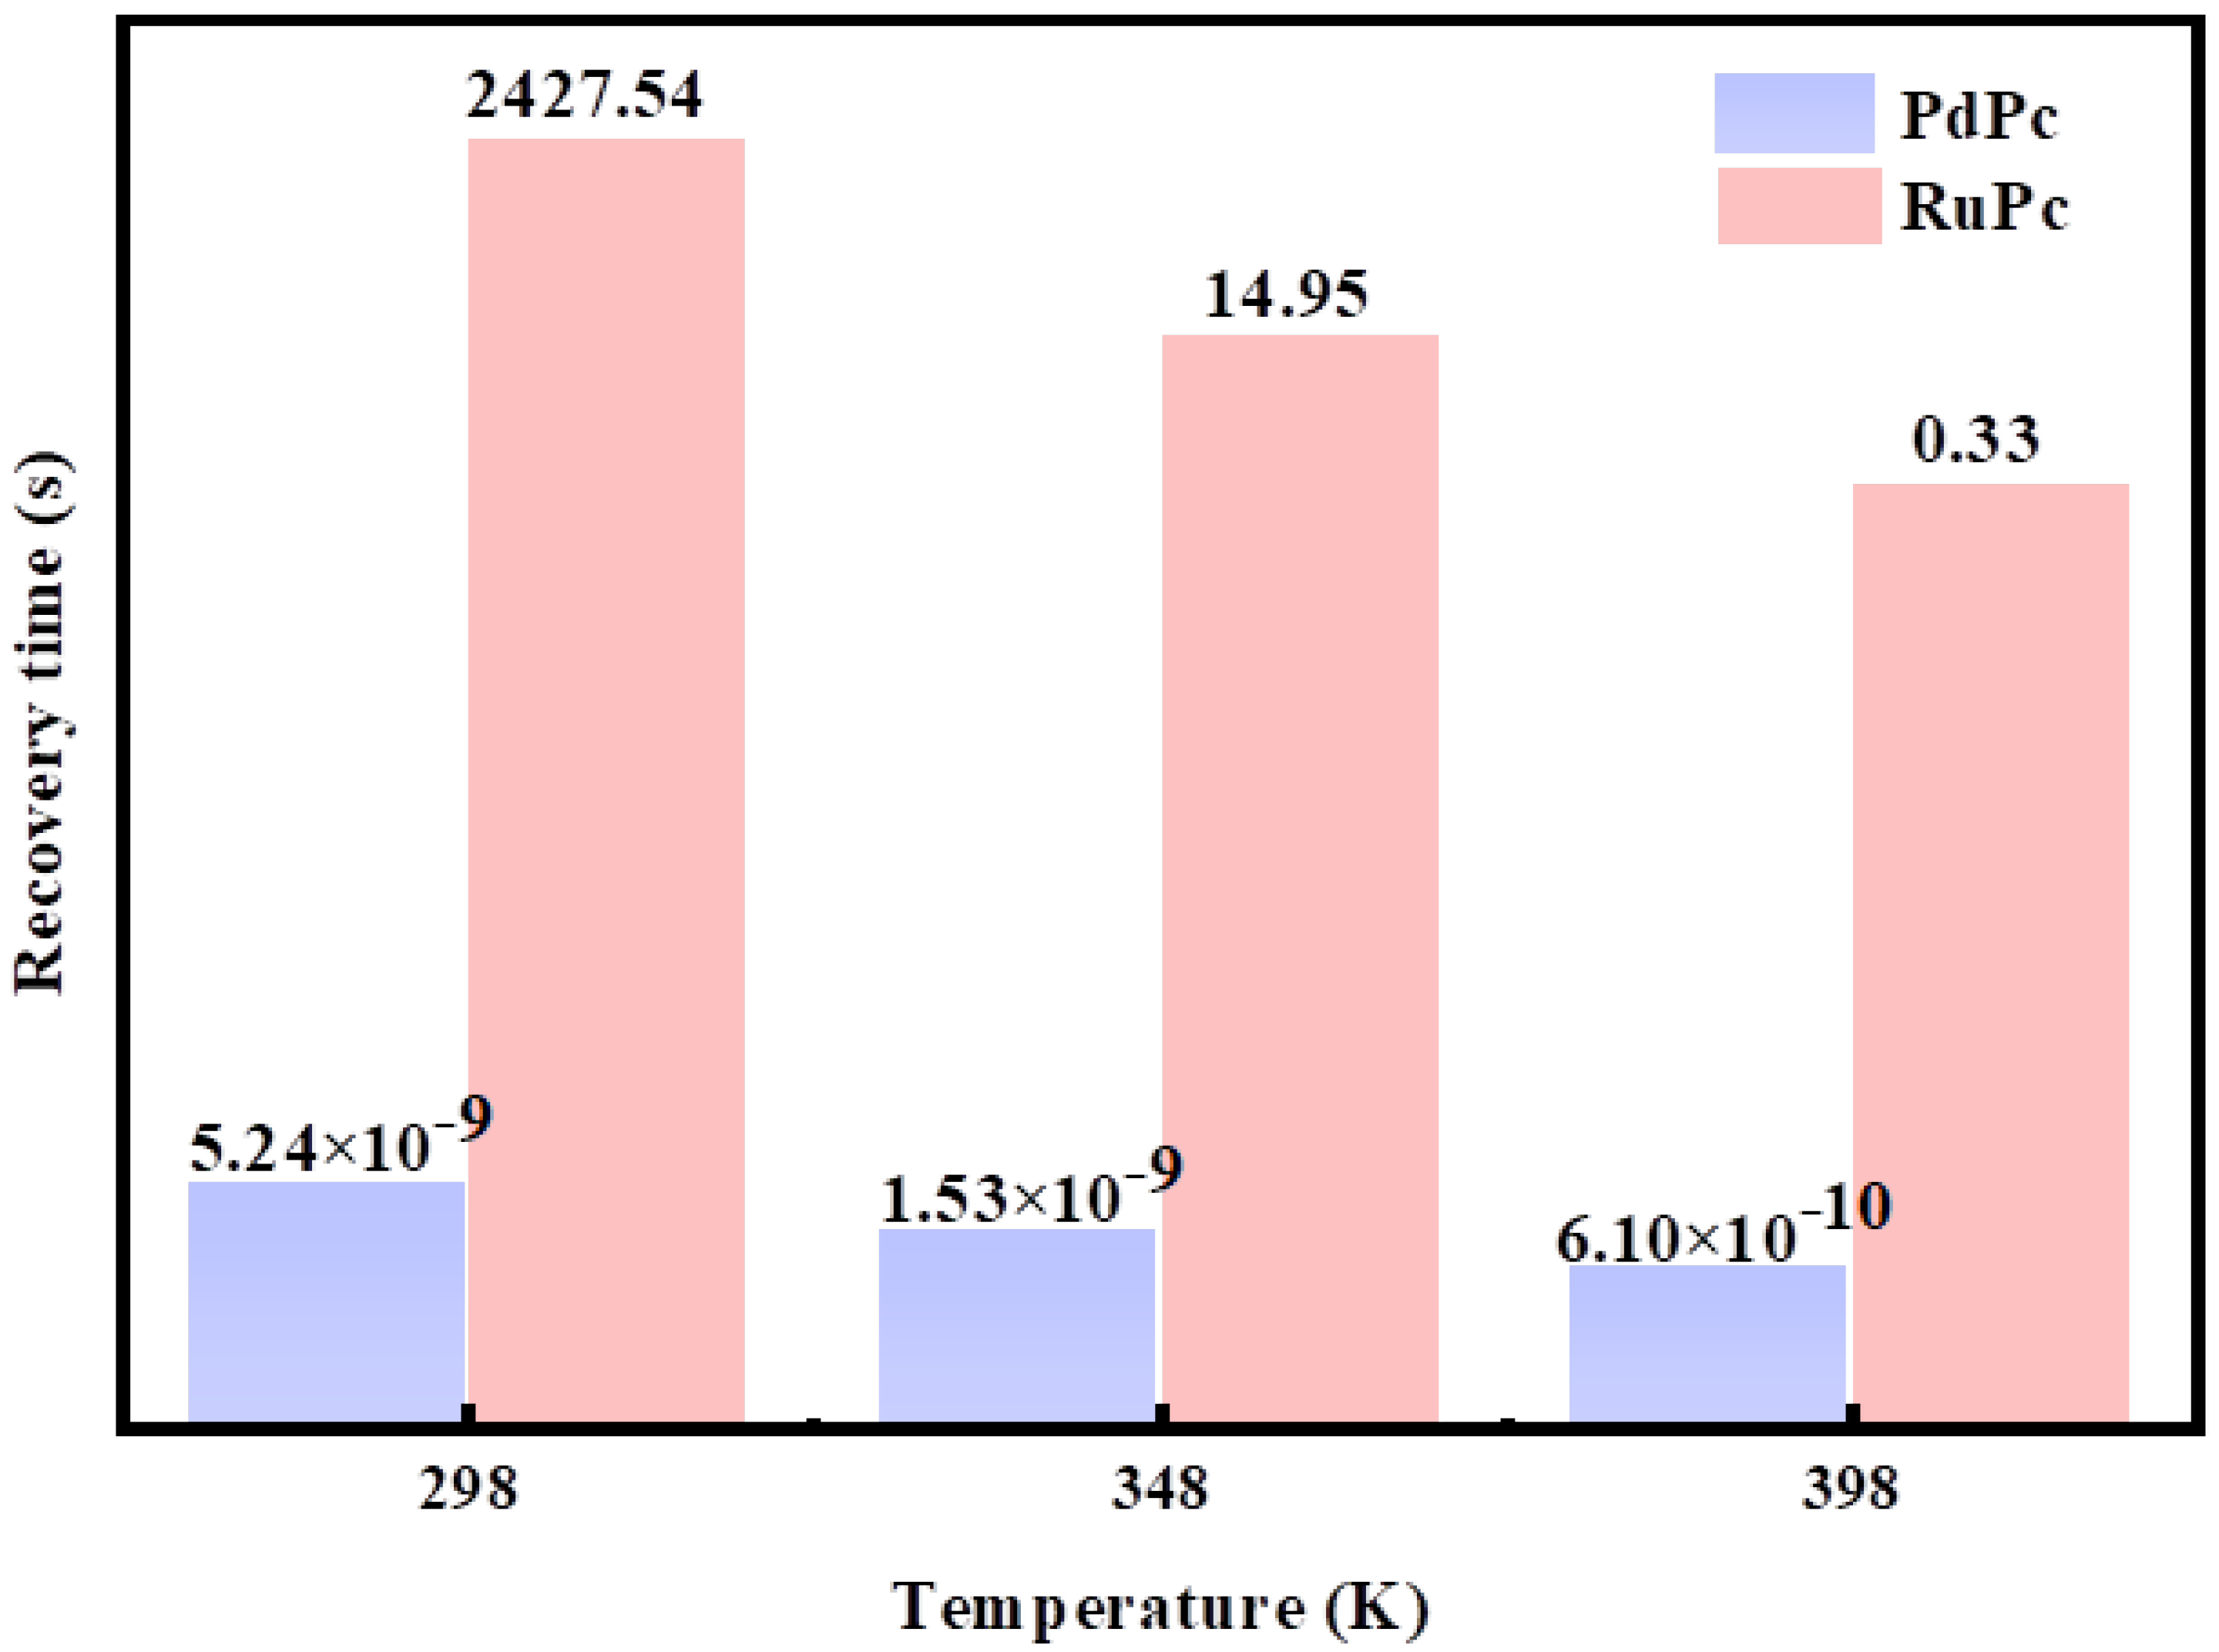
3.3. Sensing Performance Evaluation of PdPc and RuPc

Generally, the variation in the electrical conductivity (σ) is a critical factor for assessing gas-sensor sensitivity. Therefore, the sensing performance of PdPc and RuPc towards CH2O gas molecules was evaluated by evaluating the electrical conductivity’s variation. The σ of a system is defined as Equation (3) as follows [53]:
σ exp ( E g / 2 K B T )
where the σ is the adsorption system’s electric conductivity, Eg is the band gap, and KB and T are the Boltzmann constant (8.62 × 10⁻⁵ eV/K) and temperature, respectively.
Figure 7 shows the band structures of different adsorption systems. From Figure 7a,b, for the CH2O@PdPc adsorption system, one can see that the band gap of the PdPc nanosheet remained the same after the CH2O adsorption, which indicates that the CH2O gas molecule does not affect the electrical conductivity of the PdPc monolayer. This outcome suggests that the PdPc cannot be a candidate gas-sensing material for CH2O owing to its poor sensitivity. Interestingly, after CH2O gas adsorption, an obvious band gap variation (up from 0 to 0.853 eV) of the RuPc monolayer can be observed in Figure 7c,d, which shows that the conducting feature of the RuPc nanosheet is changed into a semiconducting feature. In other words, an Ru-decorated Pc monolayer can be used as gas-sensing material with high sensitivity to CH2O.
More specifically, the sensitivity (S) of the CH2O gas sensor was evaluated by the resistance variation of CH2O@RuPc adsorption systems. It is well-known that the resistance of a material is inversely proportional to its conductivity. When incorporating conductivity into Equation (3), the sensor sensitivity can be calculated by the following Equation [53]:
S = ( 1 σ CH 2 O @ RuPc 1 σ RuPc ) / 1 σ RuPc = exp [ ( E g  CH 2 O @ RuPc E g  RuPc ) / 2 K B T ] 1
where the σ CH 2 O @ RuPc and σ RuPc represent the conductivity of the RuPc monolayer after and before adsorption.
Figure 8 shows the sensitivity (S) for the CH2O gas on the RuPc monolayer. Obviously, within the normal working temperature range, the sensitivity at 298 K, 348 K, and 398 K was 1.65 × 10⁷, 1.51 × 10⁶, and 2.53 × 10⁵, respectively. Therefore, the sensitivity of the RuPc monolayer is sufficiently high for CH2O gas-sensing.
Finally, according to the transition state theory and the Van’t Hoff–Arrhenius formula [54], the recovery time (τ) can be expressed by the following equation [54]:
τ = υ 0 1 exp ( E ads K B T )
Here, the attempt frequency (υ0) is 10−12 s−1.
Figure 9 depicts the predicted recovery time of the CH2O gas molecule at different temperatures (298, 348, and 398 K). Although the PdPc monolayer has a fast desorption speed, it cannot be a CH2O gas-sensing material owing to its weak gas-capture ability. For the RuPc nanosheet, one can see that the recovery time of the CH2O gas molecule at room temperature (298 K) was 2427.54 s. With the temperature increased to 348 K and 398 K, the corresponding recovery time is reduced to 14.95 s and 0.33 s, respectively. The comparative information of different 2D materials towards CH2O-sensing with previously reported literature is summarized in Table 3. Firstly, one can see that the adsorption of CH2O on the graphene g-C3N4 sheet [55], Ti3C2O2 MXene [56], and SnS monolayers [57] is physical adsorption, and their interaction mainly depends on the van der Waals force. Hence, these 2D materials are not suitable to be a gas-sensing material for CH2O owing to the weak gas-capture ability. In contrast, the Li-doped ethylene [58], Al-doped C2N sheet [59], and Si-doped BC3 sheet [60] have ultra-strong adsorption strength for CH2O gas molecules, which makes desorption process challenging due to their ultra-long recovery time. Therefore, they are also not suitable for reusable CH2O gas-sensing materials. In conclusion, by considering the capture ability and recovery time, the RuPc monolayer can be regarded as a recyclable gas-sensing material for CH2O gas detection.

4. Conclusions

This study used first-principles calculations to investigate the adsorption behaviors of toxic CH2O gas molecules on TMPc (TM = Pd, Ru) monolayers. The adsorption configurations and electronic structures of different adsorption systems were systematically analyzed, and the corresponding sensing mechanism was revealed. The main conclusions are as follows:
(1)
Transition-metal Pd and Ru atoms can significantly alter the electronic properties of Pc and the calculation result proves that these two TMPc monolayers are thermodynamically stable;
(2)
The RuPc monolayer possesses a stronger affinity with the CH2O gas molecule because of the strong orbital hybridization between Ru-d and O-p of the gas molecule;
(3)
The RuPc monolayer is highly sensitive to CH2O and it can be regarded as a potential gas-sensing material for CH2O detection owing to its suitable adsorption ability and desorption time.
Overall, our DFT calculations can guide experimentalists in performing relevant research on TMPc monolayers for future gas-sensing applications of CH2O gas molecules.

Author Contributions

Conceptualization, Z.N. and R.X.; methodology, R.X. and C.W.; visualization, Z.N.; software, Z.N. and E.D.; validation, C.W.; investigation, R.X. and C.W.; data curation, Y.W. and Q.G.; writing—original draft, R.X. and Z.N.; writing—review and editing, Z.N. and E.D. All authors have read and agreed to the published version of the manuscript.

Funding

This work was supported by the National Natural Science Foundation of China (Grant No. 51904137), the Special Basic Cooperative Research Programs of Yunnan Provincial Undergraduate Universities’ Association (Grant No. 202101BA070001-032), the Basic Research Project of Yunnan Province (202201AT070017), the High-Level Talent Plans for Young Top-notch Talents of Yunnan Province (Grant No. YNWR-QNBJ-2020-017), and the High-Level Talent Special Support Plans for Young Talents of Kunming City (Grant No. C201905002).

Institutional Review Board Statement

Not applicable.

Informed Consent Statement

Not applicable.

Data Availability Statement

The data presented in this study are contained within the article.

Acknowledgments

We thank the associate editor and the reviewers for their useful help in improving this paper, along with the Scientific Innovation Team of Kunming University for helpful discussions on topics related to this work. The authors wish to acknowledge Lei Gao, Kunming University of Science and Technology, for his help in editing of English language and style.

Conflicts of Interest

The authors declare no conflict of interest.

References

  1. Salthammer, T. Formaldehyde sources, formaldehyde concentrations and air exchange rates in European housings. Build. Environ. 2019, 150, 219–232. [Google Scholar] [CrossRef]
  2. Tang, X.; Bai, Y.; Duong, A.; Smith, M.T.; Li, L.; Zhang, L. Formaldehyde in China: Production, consumption, exposure levels, and health effects. Environ. Int. 2009, 35, 1210–1224. [Google Scholar] [CrossRef] [PubMed]
  3. Zheng, J.Y.; Zhao, W.K.; Song, L.; Wang, H.; Yan, H.; Chen, G.; Han, C.B.; Zhang, J. Advances of manganese-oxides-based catalysts for indoor formaldehyde removal. Green Energy Environ. 2022; in press. [Google Scholar] [CrossRef]
  4. Reingruber, H.; Pontel, L.B. Formaldehyde metabolism and its impact on human health. Curr. Opin. Toxicol. 2018, 9, 28–34. [Google Scholar] [CrossRef]
  5. Kou, Y.; Zhao, H.; Cui, D.; Han, H.; Tong, Z. Formaldehyde toxicity in age-related neurological dementia. Ageing Res. Rev. 2022, 73, 101512. [Google Scholar] [CrossRef]
  6. Sahrin, N.T.; Nawaz, R.; Chong, F.K.; Lee, S.L.; Wirzal, M.D.H. Current perspectives of anodized TiO2 nanotubes towards photodegradation of formaldehyde: A short review. Environ. Technol. Innov. 2021, 22, 101418. [Google Scholar] [CrossRef]
  7. Suresh, S.; Bandosz, T.J. Removal of formaldehyde on carbon-based materials: A review of the recent approaches and findings. Carbon 2018, 137, 207–221. [Google Scholar] [CrossRef]
  8. Na, C.J.; Yoo, M.J.; Tsang, D.C.W.; Kim, H.W.; Kim, K.H. High-performance materials for effective sorptive removal of formaldehyde in air. J. Hazard. Mater. 2019, 366, 452–465. [Google Scholar] [CrossRef]
  9. Lou, C.; Lei, G.; Liu, X.; Xie, J.; Li, Z.; Zheng, W.; Goel, N.; Kumar, M.; Zhang, J. Design and optimization strategies of metal oxide semiconductor nanostructures for advanced formaldehyde sensors. Coord. Chem. Rev. 2022, 452, 214280. [Google Scholar] [CrossRef]
  10. Wang, D.; Zhang, M.; Chen, Z.; Li, H.; Chen, A.; Wang, X.; Yang, J. Enhanced formaldehyde sensing properties of hollow SnO2 nanofibers by graphene oxide. Sens. Actuators B Chem. 2017, 250, 533–542. [Google Scholar] [CrossRef]
  11. Zhang, G.; Zhang, S.; Yang, L.; Zou, Z.; Zeng, D.; Xie, C. La2O3-sensitized SnO2 nanocrystalline porous film gas sensors and sensing mechanism toward formaldehyde. Sens. Actuators B Chem. 2013, 188, 137–146. [Google Scholar] [CrossRef]
  12. Upadhyay, S.B.; Mishra, R.K.; Sahay, P.P. Cr-doped WO3 nanosheets: Structural, optical and formaldehyde sensing properties. Ceram. Int. 2016, 42, 15301–15310. [Google Scholar] [CrossRef]
  13. Gu, F.; Di, M.; Han, D.; Hong, S.; Wang, Z. Atomically Dispersed Au on In2O3 Nanosheets for Highly Sensitive and Selective Detection of Formaldehyde. ACS Sens. 2020, 5, 2611–2619. [Google Scholar] [CrossRef] [PubMed]
  14. Wang, Z.; Hou, C.; De, Q.; Gu, F.; Han, D. One-Step Synthesis of Co-Doped In2O3 Nanorods for High Response of Formaldehyde Sensor at Low Temperature. ACS Sens. 2018, 3, 468–475. [Google Scholar] [CrossRef] [PubMed]
  15. Wei, S.; Zhang, Y.; Zhou, M. Formaldehyde sensing properties of ZnO-based hollow nanofibers. Sens. Rev. 2014, 34, 327–334. [Google Scholar] [CrossRef]
  16. Xie, C.; Xiao, L.; Hu, M.; Bai, Z.; Xia, X.; Zeng, D. Fabrication and formaldehyde gas-sensing property of ZnO–MnO2 coplanar gas sensor arrays. Sens. Actuators B Chem. 2010, 145, 457–463. [Google Scholar] [CrossRef]
  17. Wang, X.; Cui, F.; Lin, J.; Ding, B.; Yu, J.; Al-Deyab, S.S. Functionalized nanoporous TiO2 fibers on quartz crystal microbalance platform for formaldehyde sensor. Sens. Actuators B Chem. 2012, 171–172, 658–665. [Google Scholar] [CrossRef]
  18. Tang, X.; Raskin, J.P.; Lahem, D.; Krumpmann, A.; Decroly, A.; Debliquy, M. A Formaldehyde Sensor Based on Molecularly-Imprinted Polymer on a TiO2 Nanotube Array. Sensors 2017, 17, 675. [Google Scholar] [CrossRef]
  19. Zhang, R.; Lu, L.; Chang, Y.; Liu, M. Gas sensing based on metal-organic frameworks: Concepts, functions, and developments. J. Hazard. Mater. 2022, 429, 128321. [Google Scholar] [CrossRef]
  20. Wang, M.; Ishii, K. Photochemical properties of phthalocyanines with transition metal ions. Coord. Chem. Rev. 2022, 468, 214626. [Google Scholar] [CrossRef]
  21. Gottfried, J.M. Surface chemistry of porphyrins and phthalocyanines. Surf. Sci. Rep. 2015, 70, 259–379. [Google Scholar] [CrossRef]
  22. Jin, L.; Chen, D. Enhancement in photovoltaic performance of phthalocyanine-sensitized solar cells by attapulgite nanoparticles. Electrochim. Acta 2012, 72, 40–45. [Google Scholar] [CrossRef]
  23. Darwish, A.A.A.; Ali, H.A.M.; El-Zaidia, E.F.M.; Alfadhli, S.; El-Bashir, B.O.; Alatawi, R.A.S.; Eisa, A.A.A.; Yahia, I.S. Linear and nonlinear optical characteristics of manganese phthalocyanine chloride/polyacetate sheet: Towards flexible optoelectronic devices. Opt. Mater. 2021, 114, 110988. [Google Scholar] [CrossRef]
  24. Huang, S.; Chen, K.; Li, T.T. Porphyrin and phthalocyanine based covalent organic frameworks for electrocatalysis. Coord. Chem. Rev. 2022, 464, 214563. [Google Scholar] [CrossRef]
  25. Zemła, M.R.; Czelej, K.; Majewski, J.A. Graphene–Iron(II) Phthalocyanine Hybrid Systems for Scalable Molecular Spintronics. J. Phys. Chem. C 2020, 124, 27645–27655. [Google Scholar] [CrossRef]
  26. Zhuge, W.; Liu, Y.; Huang, W.; Zhang, C.; Wei, L.; Peng, J. Conductive 2D phthalocyanine-based metal-organic framework as a photoelectrochemical sensor for N-acetyl-L-cysteine detection. Sens. Actuators B Chem. 2022, 367, 132028. [Google Scholar] [CrossRef]
  27. Kumar, A.; Alami Mejjati, N.; Meunier-Prest, R.; Krystianiak, A.; Heintz, O.; Lesniewska, E.; Devillers, C.H.; Bouvet, M. Tuning of interfacial charge transport in polyporphine/phthalocyanine heterojunctions by molecular geometry control for an efficient gas sensor. Chem. Eng. J. 2022, 429, 132453. [Google Scholar] [CrossRef]
  28. Alosabi, A.Q.; Al-Muntaser, A.A.; El-Nahass, M.M.; Oraby, A.H. Structural, optical and DFT studies of disodium phthalocyanine thin films for optoelectronic devices applications. Opt. Laser Technol. 2022, 155, 108372. [Google Scholar] [CrossRef]
  29. Zhou, Y.; Gao, G.; Chu, W.; Wang, L.W. Computational screening of transition metal-doped phthalocyanine monolayers for oxygen evolution and reduction. Nanoscale Adv. 2022, 2, 710–716. [Google Scholar] [CrossRef]
  30. Atxabal, A.; Ribeiro, M.; Parui, S.; Urreta, L.; Hueso, L.E. Spin doping using transition metal phthalocyanine molecules. Nat. Commun. 2017, 7, 13751. [Google Scholar] [CrossRef] [Green Version]
  31. Niu, L.; Wang, H.; Bai, L.; Rong, X.; Liu, X.; Li, H.; Yin, H. Spin filtering in transition-metal phthalocyanine molecules from first principles. Front. Phys. 2017, 12, 127207. [Google Scholar] [CrossRef]
  32. Lü, K.; Zhou, J.; Zhou, L.; Chen, X.S.; Chan, S.H.; Sun, Q. Pre-combustion CO2 capture by transition metal ions embedded in phthalocyanine sheets. J. Chem. Phys. 2012, 136, 234703. [Google Scholar] [CrossRef] [PubMed]
  33. Chaabene, M.; Gassoumi, B.; Soury, R.; Ghalla, H.; Jabli, M.; Ben Chaâbane, R.; Allouche, A.R. Insights into theoretical detection of CO2, NO, CO, O2, and O3 gases molecules using Zinc phthalocyanine with peripheral mono and tetra quinoleinoxy substituents: Molecular geometries, Electronic properties, and Vibrational analysis. Chem. Phys. 2021, 547, 111198. [Google Scholar] [CrossRef]
  34. Delley, B. From molecules to solids with the DMol3 approach. J. Chem. Phys. 2000, 113, 7756–7764. [Google Scholar] [CrossRef]
  35. Perdew, J.P.; Burke, K.; Ernzerhof, M. Generalized Gradient Approximation Made Simple. Phys. Rev. Lett. 1996, 77, 3865–3868. [Google Scholar] [CrossRef]
  36. Grimme, S. Semiempirical GGA-type density functional constructed with a long-range dispersion correction. J. Comput. Chem. 2006, 27, 1787–1799. [Google Scholar] [CrossRef]
  37. Vozzi, C.; Negro, M.; Calegari, F.; Sansone, G.; Nisoli, M.; De Silvestri, S.; Stagira, S. Generalized molecular orbital tomography. Nat. Phys. 2011, 7, 822–826. [Google Scholar] [CrossRef]
  38. Delley, B. Hardness conserving semilocal pseudopotentials. Phys. Rev. B 2022, 66, 155125. [Google Scholar] [CrossRef]
  39. Monkhorst, H.J.; Pack, J.D. Special points for Brillouin-zone integrations. Phys. Rev. B 1976, 13, 5188–5192. [Google Scholar] [CrossRef]
  40. Xiong, H.; Cao, C.; Chen, G.; Liu, B. Revealing the adhesion strength and electronic properties of Ti3SiC2/Cu interface in Ti3SiC2 reinforced Cu-based composite by a first-principles study. Surf. Interfaces 2021, 27, 101467. [Google Scholar] [CrossRef]
  41. Jabrane, M.; El Hafidi, M.; El Hafidi, M.Y.; Kara, A. Fe-Phthalocyanine on Cu(111) and Ag(111): A DFT+vdWs investigation. Surf. Sci. 2022, 716, 121961. [Google Scholar] [CrossRef]
  42. Basiuk, E.V.; Huerta, L.; Basiuk, V.A. Noncovalent bonding of 3d metal(II) phthalocyanines with single-walled carbon nanotubes: A combined DFT and XPS study. Appl. Surf. Sci. 2019, 470, 622–630. [Google Scholar] [CrossRef]
  43. Shamim, S.U.; Roy, D.; Alam, S.; Piya, A.A.; Rahman, M.S.; Hossain, M.K.; Ahmed, F. Doubly doped graphene as gas sensing materials for oxygen-containing gas molecules: A first-principles investigation. Appl. Surf. Sci. 2022, 596, 153603. [Google Scholar] [CrossRef]
  44. Rawling, T.; McDonagh, A. Ruthenium phthalocyanine and naphthalocyanine complexes: Synthesis, properties and applications. Coord. Chem. Rev. 2007, 251, 1128–1157. [Google Scholar] [CrossRef]
  45. Mellor, D.P.; Maley, L. Order of Stability of Metal Complexes. Nature 1948, 161, 436–437. [Google Scholar] [CrossRef]
  46. Gao, Y.; Zhang, R.; Xiang, Z.; Yuan, B.; Cui, T.; Gao, Y.; Cheng, Z.; Wu, J.; Qi, Y.; Zhang, Z. Theoretical insights into photocatalytic CO2 reduction on Palladium phthalocyanine. Chem. Phys. Lett. 2022, 803, 139812. [Google Scholar] [CrossRef]
  47. Sukhikh, A.S.; Klyamer, D.D.; Parkhomenko, R.G.; Krasnov, P.O.; Gromilov, S.A.; Hassan, A.K.; Basova, T.V. Effect of fluorosubstitution on the structure of single crystals, thin films and spectral properties of palladium phthalocyanines. Dyes Pigments 2018, 149, 348–355. [Google Scholar] [CrossRef]
  48. Negri, L.B.; Martins, T.J.; da Silva Gobo, N.R.; de Oliveira, K.T.; Hamblin, M.R.; da Silva, R.S. Design, synthesis and photobiological activity of novel ruthenium phthalocyanine complexes. Inorg. Chem. Commun. 2019, 99, 60–63. [Google Scholar] [CrossRef]
  49. Zasada, F.; Piskorz, W.; Grybo, J. Periodic DFT+D Molecular Modeling of the Zn-MOF-5(100)/(110)TiO2 Interface: Electronic Structure, Chemical Bonding, Adhesion, and Strain. J. Phys. Chem. C 2014, 118, 8971–8981. [Google Scholar] [CrossRef]
  50. Bai, Y.; Buchner, F.; Wendahl, M.T.; Kellner, I.; Bayer, A.; Steinrück, H.P.; Marbach, H.; Gottfried, J.M. Direct Metalation of a Phthalocyanine Monolayer on Ag(111) with Coadsorbed Iron Atoms. J. Phys. Chem. C 2008, 112, 6087–6092. [Google Scholar] [CrossRef]
  51. Liu, L.; Liu, J.; Zeng, Y.; Tan, S.J.; Do, D.D.; Nicholson, D. Formaldehyde adsorption in carbon nanopores—New insights from molecular simulation. Chem. Eng. J. 2019, 370, 866–874. [Google Scholar] [CrossRef]
  52. Wang, C.; Wang, Y.J.; Guo, Q.J.; Dai, E.R.; Nie, Z.F. Metal-Decorated Phthalocyanine Monolayer as a Potential Gas Sensing Material for Phosgene: A First-Principles Study. ACS Omega 2022, 7, 21994–22002. [Google Scholar] [CrossRef] [PubMed]
  53. Xia, S.Y.; Tao, L.Q.; Jiang, T.; Sun, H.; Li, J. Rh-doped h-BN monolayer as a high sensitivity SF6 decomposed gases sensor: A DFT study. Appl. Surf. Sci. 2021, 536, 147965. [Google Scholar] [CrossRef]
  54. Peng, S.; Cho, K.; Qi, P.; Dai, H. Ab initio study of CNT NO2 gas sensor. Chem. Phys. Lett. 2004, 387, 271–276. [Google Scholar] [CrossRef]
  55. Jing, B.; Ao, Z.; Zhao, W.; Xu, Y.; Chen, Z.; An, T. Evaluation procedure of photocatalysts for VOCs degradation from the view of density functional theory calculations: G-C3N4 dots/graphene as an example. J. Mater. Chem. A 2020, 8, 20363. [Google Scholar] [CrossRef]
  56. Zhang, Y.; Zhou, Z.; Lan, J.; Zhang, P. Prediction of Ti3C2O2 MXene as an effective capturer of formaldehyde. Appl. Surf. Sci. 2019, 469, 770–774. [Google Scholar] [CrossRef]
  57. Shukla, A.; Gaur, N.K. Adsorption of O3, SO3 and CH2O on two dimensional SnS monolayer: A first principles study. Physica B 2019, 572, 12–17. [Google Scholar] [CrossRef]
  58. Ingale, N.; Konda, R.; Chaudhari, A. Volatile organic compounds sensing by Li/Ti doped ethylene complex. Adsorption 2020, 26, 103–115. [Google Scholar] [CrossRef]
  59. Su, Y.; Ao, Z.; Ji, Y.; Li, G.; An, T. Adsorption mechanisms of different volatile organic compounds onto pristine C2N and Al-doped C2N monolayer: A DFT investigation. Appl. Surf. Sci. 2018, 450, 484–491. [Google Scholar] [CrossRef]
  60. Beheshtian, J.; Peyghan, A.A.; Noei, M. Sensing behavior of Al and Si doped BC3 graphenes to formaldehyde. Sens. Actuators B Chem. 2013, 181, 829–834. [Google Scholar] [CrossRef]
Figure 1. Optimized structure model: (a) Pc monolayer, (b) PdPc monolayer, (c) RuPc monolayer, and (d) CH2O gas molecule.
Metals 12 01442 g001
Figure 2. Binding energy (Ebin) between Pd, Ru, and Pc monolayers and cohesive energy (Ecoh) of Pd and Ru bulk.
Metals 12 01442 g002
Figure 3. Charge-density difference (CDD) and density of states (DOSs) of the (a,b) PdPc and (c,d) RuPc monolayers. The yellow (purple) region represents electron accumulation (depletion), and the isosurface value of CDD is ±0.02 e/Å3. The Fermi level is set to zero energy and indicated by the vertical purple dashed line.
Metals 12 01442 g003
Figure 4. Top and side views of original structure before adsorption on Pc monolayer: (a1) CH2O-P and (b1) CH2O-V, and the optimized structure of different adsorption systems (a2) CH2O@Pc-P and (b2) CH2O@Pc-V.
Metals 12 01442 g004
Figure 5. Lowest-energy structures, charge-density difference (CDD), and electron-density distribution (EDD) of CH2O adsorbed on PdPc and RuPc monolayers. (a1a3) represent the CH2O@PdPc adsorption system and (b1b3) represent the CH2O@RuPc adsorption system. The yellow (purple) region represents electron accumulation (depletion), and the isosurface of CDD and EDD is ±0.005 e/Å3 and 0.2 e/Å3, respectively.
Metals 12 01442 g005
Figure 6. The density of states (DOSs) and partial density of states (PDOSs) of CH2O@PdPc and CH2O@RuPc adsorption systems. (a,b) DOSs map before and after CH2O adsorption on PdPc and RuPc, and (c,d) PDOSs of O, Pd, and Ru atoms. The Fermi level is set to zero energy and indicated by the purple dashed line.
Metals 12 01442 g006
Figure 7. Band structures of different adsorption systems, (a,b) CH2O@PdPc and (c,d) CH2O@RuPc.
Metals 12 01442 g007
Figure 8. Sensitivity of RuPc monolayer towards the CH2O gas at different temperatures.
Metals 12 01442 g008
Figure 9. Recovery time of PdPc and RuPc towards the CH2O at different temperatures.
Metals 12 01442 g009
Table 1. The adsorption energy (Eads), charge transfer (Qt), and band gap of the system before adsorption (Eg) and after adsorption (Eg′) for the CH2O@Pc adsorption system.
Gas MoleculeMaterialAdsorption StyleEads/eVQt/eEg (Eg′)/eV
CH2OPcParallel−0.58−0.01630.00 (0.00)
Vertical−4.270.19690.00 (1.12)
Table 2. The adsorption energy (Eads), adsorption distances (D), charge transfer (Qt), and band gap of the system before adsorption (Eg) and after adsorption (Eg′) of CH2O@PdPc and CH2O@RuPc adsorption systems.
Gas MoleculeMaterialAdsorption StyleEads/eVdM-OdM-CQt/eEg (Eg′)/eV
CH2OPdPcParallel−0.223.5603.020−0.09290.00 (0.00)
Vertical−0.183.2223.781−0.01890.00 (0.00)
RuPcParallel−0.912.0582.096−0.13120.00 (0.853)
Vertical−0.891.9742.8740.13210.00 (0.792)
Table 3. Comparison of different properties for CH2O adsorbed on different 2D materials.
2D MaterialsEads (eV)Qt (e)ΔEg (%)τ (s, 298 K)Refs
Graphene g-C3N4 sheet−0.317 2.29 × 10⁻⁷[55]
Ti3C2O2 MXene−0.300 1.18 × 10⁻⁷[56]
SnS monolayers−0.300−0.110 1.18 × 10⁻⁷[57]
Li-doped ethylene−1.310 11.01.41 × 1010[58]
Al-doped C2N sheet−2.754−0.438 3.64 × 1034[59]
Si-doped BC3 sheet−1.149−0.13028.22.67 × 107[60]
RuPc monolayer−0.910−0.1311002427This work
Publisher’s Note: MDPI stays neutral with regard to jurisdictional claims in published maps and institutional affiliations.

