Article

A Comparative Study of the Corrosion Behavior of 30CrMnSiNi2A in Artificial Seawater and Salt Spray Environments

1
Structure Corrosion Protection and Control of Aviation Science and Technology Key Laboratory, China Special Vehicle Research Institute, Jingmen 448000, China
2
School of Materials Science and Engineering, Ocean University of China, Qingdao 266100, China
*
Author to whom correspondence should be addressed.
Metals 2022, 12(9), 1443; https://doi.org/10.3390/met12091443
Submission received: 11 July 2022 / Revised: 20 August 2022 / Accepted: 22 August 2022 / Published: 29 August 2022
(This article belongs to the Topic Corrosion and Protection of Metallic Materials)

Abstract

:
In this work, the corrosion behavior of 30CrMnSiNi2A in a simulated marine environment was studied. The electrochemical behavior was studied by changing the temperature and pH of the solution environment. Detailed information about the rust layer was obtained by scanning electron microscopy, energy-dispersive spectroscopy, and X-ray diffraction. The stress corrosion cracking (SCC) behavior of the steel in artificial seawater was studied through a slow strain rate tensile test (SSRT). The experimental results showed that the corrosion products were mainly composed of α-FeOOH, γ-FeOOH, and Fe3O4, while the content of Fe3O4 in the rust layer formed in the salt spray environment was much higher. The steel in the salt spray test showed a much higher corrosion rate than that observed when it underwent a full-immersion test. The decrease in the pH value mainly accelerated the cathodic reaction, and the temperature simultaneously promoted anodic dissolution and cathodic reductions. The decrease in the elongation during SCC test was minimal, while the index for the reduction-in-area showed a slight SCC susceptibility in the seawater environment, suggesting that anodic dissolution is the dominant mechanism of SCC degradation.

1. Introduction

As a kind of low-alloy, ultra-high-strength steel, 30CrMnSiNi2A has superior mechanical properties [1,2]. It is widely used in landing gear, engine cases, and other structural components of aircraft [3]. The amphibious aircraft is one of the new kinds of aircraft that could provide firefighting and water rescue services [4]. During service, the landing gear of this aircraft may suffer atmospheric corrosion and seawater corrosion because its takeoff and landing take place at sea. Therefore, the corrosion behavior of the steel used for the landing gear in atmospheric and immersion environments should be considered and understood.
In recent years, most of the studies on 30CrMnSiNi2A focused on the effects of chemical compositions [5] and heat treatment technologies [6] on its mechanical properties, including the spall properties, hydrogen embrittlement, and fatigue failure [2,7]. The consideration of the corrosion behavior of 30CrMnSiNi2A is important for the process of the service of steel. Liu et al. [8] studied the early corrosion process of 30CrMnSiNi2A in 3.5%NaCl and found that pitting corrosion occurred within the initial corrosion period, and the corrosion products consisted of γ-FeOOH in the outer layer and Fe2O3 and β-FeOOH in the inner layer. Guo et al. [9] studied the corrosion behavior of 300 M steel and demonstrated that the outer rust layer played the main protective role during the initial stage, while the inner rust layer provided protection throughout the whole corrosion period. The problem of stress corrosion with ultra-high-strength steel has also attracted attention. Sun et al. [10] studied the effects of cathodic polarization on the new ultra-high-strength martensitic steel Cr9Ni5MoCo14 and suggested that the dominant mechanism differed with the change of the applied potential from open circuit potential to cathodic potential.
During service in the environments, differences in the marine atmosphere and full-immersion environments cause the distinct corrosion behavior of the steel, which should be considered. In the atmospheric environment, corrosion is affected by environmental parameters including temperature, relative humidity, and ion deposition [11,12,13], leading to the corrosion under the adsorbed thin electrolyte layer [14]. In full-immersion tests, the limited dissolved oxygen is the most significant factor that differs from the atmospheric environment. Meanwhile, the attachment of the organisms also affects the dissolution process beneath the attached layer [15]. To distinguish the different corrosion behavior, some studies have been conducted. Yu et al. [16] revealed that γ-FeOOH and Fe3O4 were the primary constituents during the wet–dry cycling exposure, while additional α-FeOOH was observed in full-immersion tests. Liang et al. [17] identified the most severe pitting corrosion in the immersion tests as compared to other environments when studying Al-Mg-Si aluminum alloy in a marine environment, because of the lack of dissolved oxygen in the former case. In our previous work [18], the corrosion behaviors of E690 steel in different simulated marine zones were studied, and the results demonstrated that the oxygen diffusion, drying period, scour stress, and water holding ability determined the corrosion behavior.
From the above analysis, it can be observed that different service environments will definitely affect the corrosion behavior of the steel used for the landing gear of amphibious aircraft. However, the response of the 30CrMnSiNi2A steel to environmental variations is not clear. In this paper, the electrochemical corrosion and stress corrosion cracking (SCC) behavior of the as-received 30CrMnSiNi2A steel were studied by electrochemical tests, rust analysis, weight loss test, and slow strain rate tensile test (SSRT). The corrosion behavior in the salt spray and immersion environments were compared to enable an understanding of the differences between atmospheric and full-immersion environments. The influence of the form and presence of electrolytes on the corrosion behavior was analyzed.

2. Experimental Procedure

2.1. Materials and Solution

The samples utilized in this work were obtained from an as-received 30CrMnSiNi2A steel plate. The chemical composition (wt.%) of the steel was 0.30 C, 1.10 Cr, 1.20 Mn, 1.60 Ni, and 1.18 Si, and it was balanced by Fe. To observe the microstructure by optical microscopy and scanning electron spectroscopy (SEM), the samples were ground sequentially with 5000-grit SiC paper and then polished with a diamond abrasive. The 4 vol.% nital solution was used to etch the steel surface for 15 s followed by washing in distilled water and alcohol. The microstructure of the 30CrMnSiNi2A steel was composed of lath martensite, as shown in Figure 1.
The artificial seawater introduced in the ASTM D1411 was chosen as the base electrolyte for simulating the seawater immersion environment. Analytical chemicals were used to adjust the solution pH using acetic acid and sodium hydroxide. The temperature of the solution was controlled by a thermostatic water bath pot. The salt spray test described in GB/T 10125–2012 was chosen to evaluate the performance of the steel in the marine atmospheric environment.

2.2. Electrochemical Measurement

The 30CrMnSiNi2A steel specimens with dimensions of 10 × 10 × 5 mm were encapsulated by epoxy resin, leaving one surface (1 cm2) available for the electrochemical tests. The measurements were performed using an Autolab PGSTAT 302 N electrochemical workstation (Metrohm AG, Herisau, Switzerland) with three-electrode systems, with a saturated calomel electrode (SCE) as the reference electrode and a platinum plate as the counter electrode.
The samples were immersed in 350 mL artificial seawater at the setting temperature (20 °C, 30 °C, and 40 °C) and pH (3.0, 4.5, 6.0, and 8.2). Before the test, the cathodic potential of −1.2 VSCE was imposed for 1 min to ensure the same surface initial state was maintained. Electrochemical impedance spectroscopy (EIS) tests were conducted in the frequency range from 105 Hz to 10−2 Hz, with a 10 mV sinusoidal potential, after which the samples were kept at an open circuit potential (OCP) for 30 min. The potentiodynamic polarization curves were measured with the cathodic potential of −1.0 VSCE in the anodic direction, with a scan rate of 0.5 mV/s. It has been remarked that the potential scan rate has an important role in minimizing the effects of distortion in Tafel slopes and corrosion current density analysis, as previously reported [19,20,21]. However, based on these reports, the adopted 0.5 mV/s had no deleterious effects on the Tafel extrapolations used to determine the corrosion kinetics of the samples examined. In addition, triplicate tests were repeated to ensure the reproducibility.

2.3. Immersion Test and Salt Spray Test

Samples with dimensions of 30 × 20 × 3 mm (sample surface area to solution volume ratio: 50 mL/cm2) and 60 × 40 × 3 mm were used for the immersion test and salt spray test, respectively. All the samples were sequentially ground with 1500 grit SiC paper, degreased with alcohol, and dried in air. The test period was set to 3, 7, 14, and 28 days. Immersion tests were conducted in the artificial seawater at a temperature of 30 ± 1 °C and pH of 8.2. The salt spray test was performed in a salt spray corrosion test box. The experimental conditions were a 5 ± 0.5% NaCl solution with a continuous neutral salt spray corrosion at 35 ± 1 °C.
After testing, the surfaces and cross-sections of the corroded samples were observed by SEM (Quanta 250, Field Electron and Ion Company, Hillsboro, OR, USA), and the element distribution within the rust layer was detected by energy-dispersive X-ray spectroscopy (EDS). The phase constituents of the corrosion products were analyzed by X-Ray diffraction (XRD, Rigaku Dmax-rc, Rigaku, Tokyo, Japan). After removing the rust layer in the solution (100 mL HCl + 100 mL H2O + 0.3 g hexamethylene tetraamine), the corrosion morphologies were detected by SEM and the surface topographies were traced by confocal laser scanning microscopy (CLSM, KEYENCE VK-X250, KEYENCE, Osaka, Japan). Then, the corrosion rate (CR) (mm/year) was calculated based on the Equation (1):
C R   =   87 , 600   ×   Δ W ρ   ×   A   ×   t
where ΔW (g) is the weight loss, ρ (g/cm3) is the density of 30CrMnSiNi2A, A (cm2) is the sample surface area, and t (h) is the exposure time. At least five samples were used for each experiment and the average corrosion rates with standard deviations were provided.

2.4. Slow Strain Rate Tensile Test (SSRT)

The dog-bone shaped samples were used for the tensile test, of which the dimensions were designed based on GB/ T15970, as used in our previous work [14]. The samples were ground sequentially with 200 grit emery paper, ensuring that the final griding direction was parallel to the stretch direction. The surfaces of the samples were masked with silica gel, leaving the gauge length of 20 mm exposed to the electrolyte. Afterward, a pre-exposure test lasting for 24 h was performed to ensure the surface corrosion states, after which the SSRT test was carried out with a stain rate of 10−6 s−1.
To calculate the SCC sensitivity of the steel, the parameters deduced from the elongation (Iδ) and the reduction-in-area (IΨ) were used based on the following equations [22]:
I δ = δ 0 δ s δ 0 × 100 %
I Ψ = Ψ 0 Ψ s Ψ 0 × 100 %
where δs and Ψs are the elongation and reduction-in-area of the steel in the electrolyte, respectively, and δ0 and Ψ0 are the elongation and the reduction-in-area in the ambient air, respectively. Three samples were used to ensure the reproducibility and the average values were presented.
After the SSRT test, the fracture surface was cut from the samples and the corrosion products were removed with the rust-cleaning solution. Then, the fracture surface and side surface were detected by SEM to study the crack initiation and propagation behavior.

3. Results and Discussion

3.1. Electrochemical Analysis

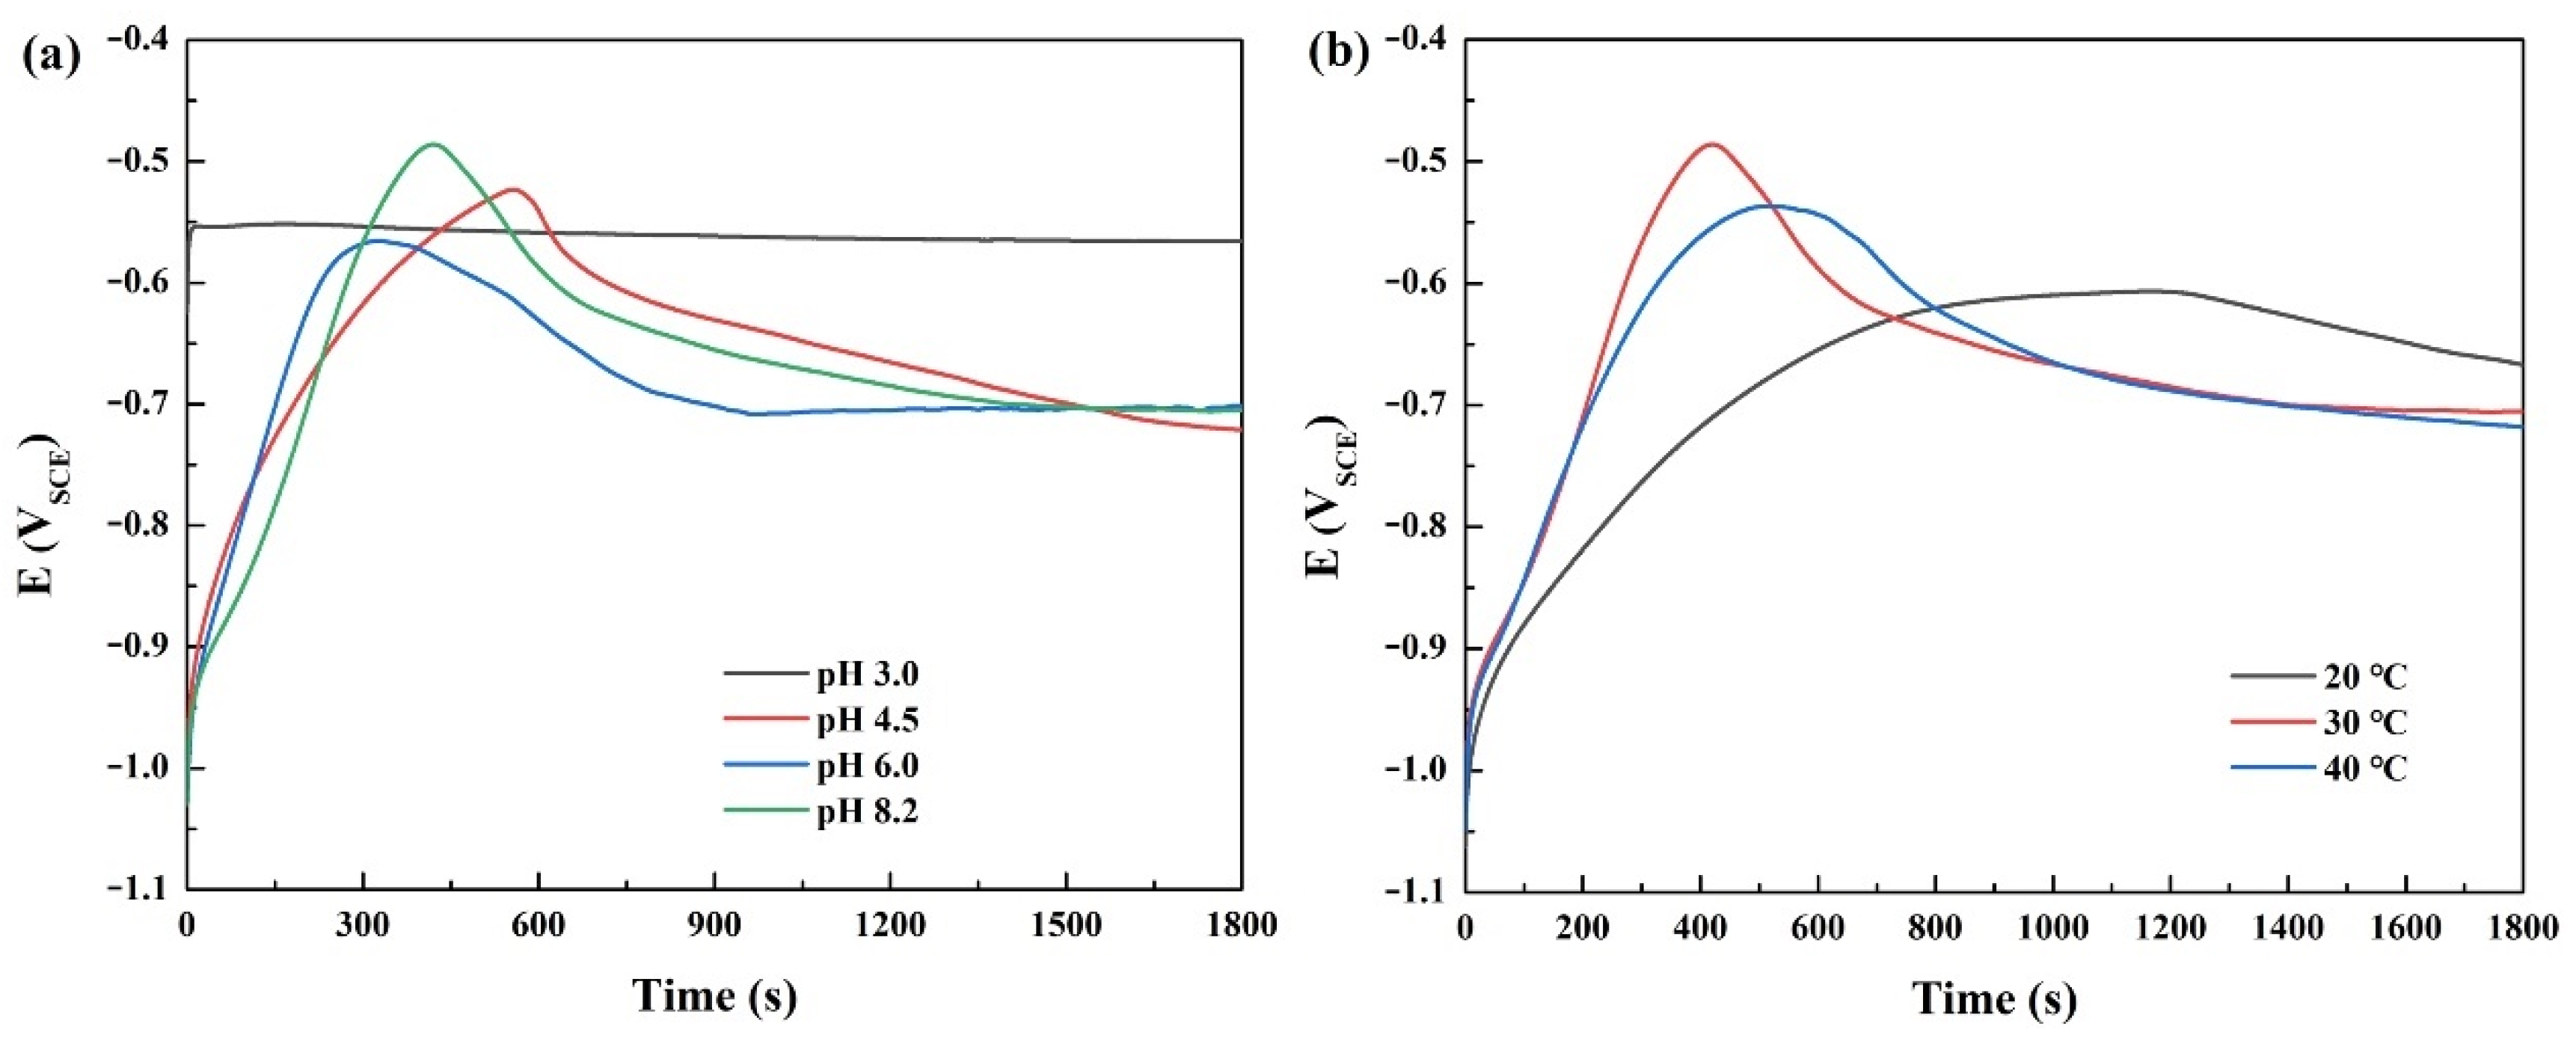
3.1.1. Open Circuit Potential Analysis

The OCP results of the 30CrMnSiNi2A steel in the seawater with different pH values at 30 °C are shown in Figure 2a. With the extension of the immersion time, except for the condition of the pH = 3.0, the OCP shifted positively and then decreased to more negative values, and finally stabilized near −0.72 VSCE. At pH 3.0, the OCP rapidly moved in the noble direction and reached a stable value at about −0.55 VSCE. Figure 2b shows the OCP results at different temperatures in the 8.2 pH solution. With the increasing immersion time, the OCP shifted positively, followed by varying degrees of negative shifts. At 20 °C, the steady-state potential was slightly higher.
In an alkaline environment and weak acidic environment, the dissolution of Fe on steel surface occurs first, forming a corrosion product film and resulting in the noble shift of the OCP. The primary film is not readily able to provide sufficient protection after being destroyed by Cl, and the continuous adsorption of Cl leads to the enhanced dissolution and the negative shift of OCP. However, the dissolution reaction of Fe is quick and easily reaches a steady state. Thus, a relatively stable OCP value finally appears. If the immersion time is prolonged, the OCP will fluctuate. In a strongly acidic environment, due to more hydrogen ions being present, the reduction in H+ gradually plays a dominant role in the cathodic reaction, and the electrode quickly reaches a stable state [23].

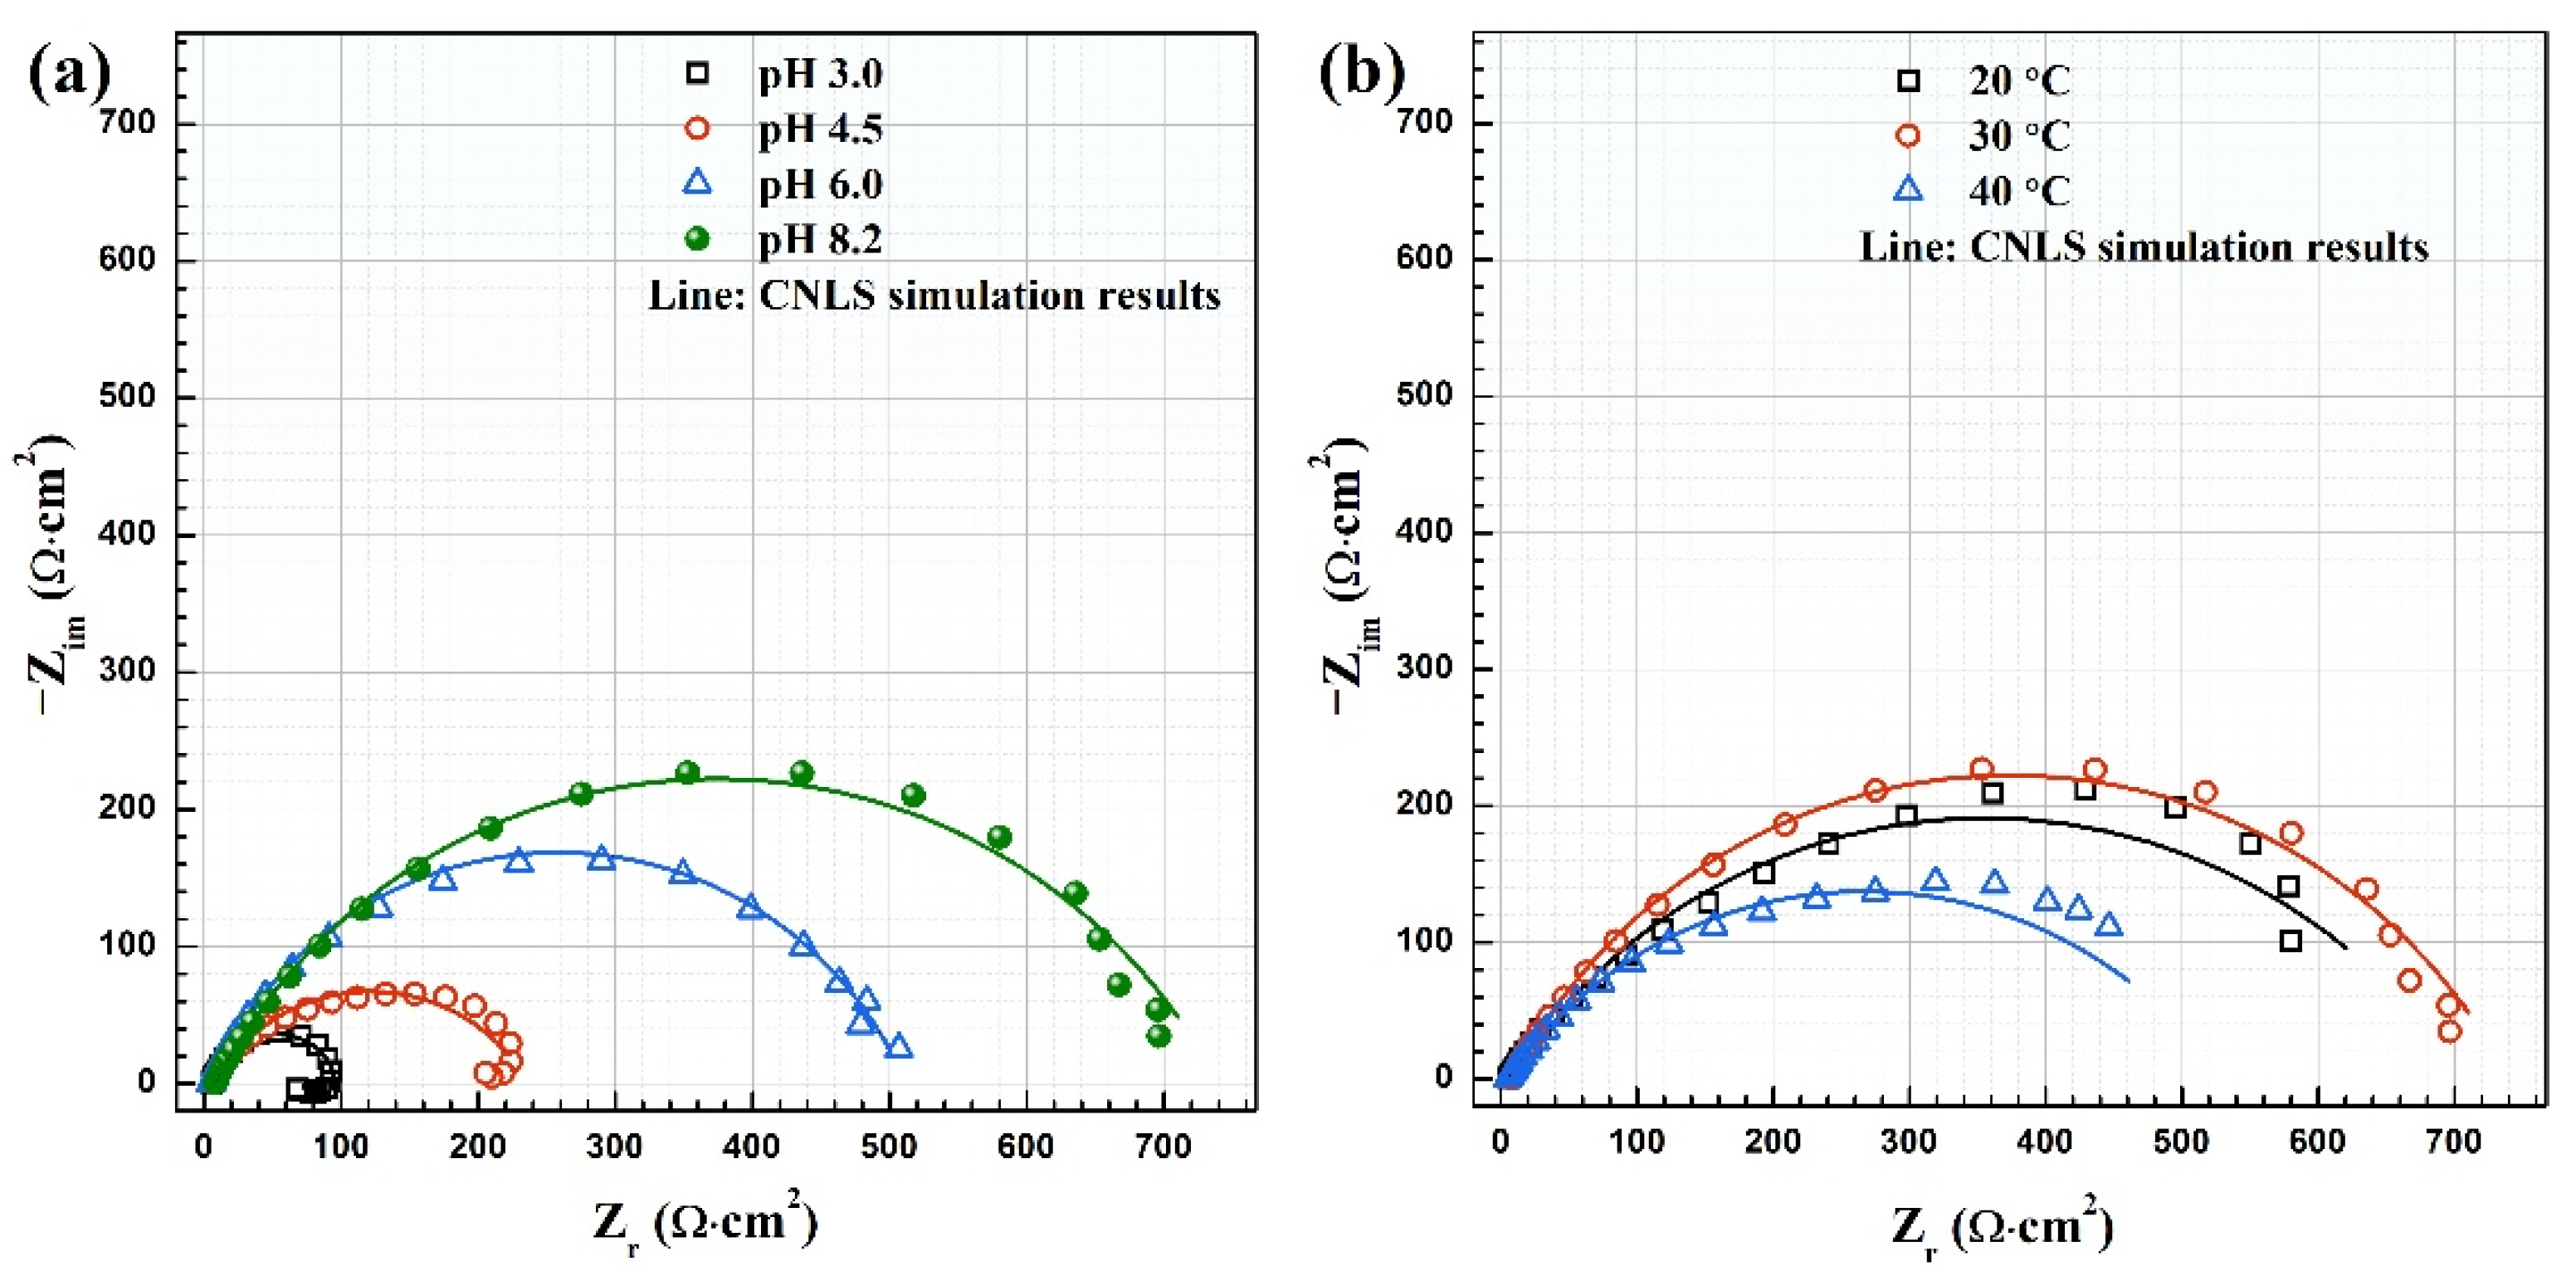
3.1.2. Electrochemical Impedance Spectroscopy Analysis

EIS was conducted after the OCP monitoring for 30 min. Figure 3a shows the Nyquist plots in the artificial seawater at 30 °C and at different pH values. When the pH was 6.0 and 8.2, the impedance spectrum showed a capacitive reactance arc, while when the pH was 4.5, a tail was observed within the low frequency range. However, the impedance values were all within the first quadrant, and thus this tail was not the inductive loop. It can be attributed to the unsteady state of the system, which induced the low frequency disturbance [24]. At pH 3.0, an inductive tail was perceived within the low frequency range, which can be ascribed to the adsorption/desorption processes occurring in the acidic environment [25]. Meanwhile, the diameters of the capacitive loops decreased with the decreasing solution pH.
Figure 3b shows the Nyquist diagrams in the artificial seawater at pH 8.2 and at different temperatures. All the spectra exhibited depressed semicircles without inductive or diffusion tails, suggesting the capacitive behavior of the material/electrolyte interface. The diameter of the capacitive loop at 30 °C was slightly higher than that at 20 °C, while it decreased dramatically as the temperature increased to 40 °C.
Figure 4 shows the equivalent circuits used for fitting the EIS data, and the fitting results are displayed in Figure 3 as solid lines. As the pre-immersion time of the EIS test was only 30 min, it was speculated that the sample surface had not been covered by the rust layer completely. Therefore, the capacitive loop with one time constant was used, denoting the charge transfer process occurring at the uncoated steel surface (Figure 4a). At pH 3.2, the additional inductive elements were supplemented to observe the adsorption/desorption behavior. In the circuits, Rs is the solution resistance, Rct represents the charge transfer resistance, CPEdl denotes the double layer capacitance, and RL and L represent the inductance. Due to the non-uniformity of the electrode surface, the capacitive arc deviates from the regular semicircle due to the dispersion effect; thus, the constant phase element (CPE) is used instead of the pure capacitance (C) [14]. Table 1 shows the CNLS (complex non-linear least squares) simulations [19,26,27,28,29] conducted in order to obtain the impedance parameters and to compare with the experimental results. The attained chi-squared results are also depicted in Table 1. They were obtained when the experimental and simulated results, using the equivalent circuits shown in Figure 4, were compared. With the decrease in the pH, Rct decreased gradually, indicating the acceleration of the charge transfer processes. With the increasing temperature, the Rct firstly increased and then decreased. The increase in the charge transfer resistance with increasing temperature from 20 to 30 °C may be attributed to two processes. On one hand, the increase in temperature decreased the oxygen concentration in the solution, especially at the electrode/solution interface, thus decelerating the corrosion process [30]. On the other hand, the increase in temperature facilitated the local deposition of protective corrosion products or aragonite, which impeded the attack of Cl. At 40 °C, the abovementioned two processes were overshadowed by the increased dissolution process, and thus the charge transfer resistance decreased.

3.1.3. Potentiodynamic Polarization Behavior Analysis

Figure 5a displays the polarization curves of 30CrMnSiNi2A in artificial seawater at different pH values. The solution pH significantly affected the curve shape and current densities. It is known that there exist three strict prerequisites for the Tafel fitting, i.e., there is only one electrochemical pathway for the anodic and cathodic reactions, respectively, no protective film on the metal surface, and no diffusion for the cathodic process [31,32]. However, the system in this work is complex and the i vs. E is not a simple exponential. Therefore, Tafel fitting was not conducted, and only the qualitative analysis was conducted. When the solution pH was 3.0, the corrosion potential was −0.559 VSCE, which was much more positive than that in the solutions with other pH values. The remarkable expedition of the cathodic reaction kinetics is responsible for the noble shift of the corrosion potential. At pH 4.5, the cathodic reaction kinetics were obviously retarded, and the current density decreased by about two orders, even though the pH only decreased by 1.5. This may be attributed to the variation of the dominant reaction pathways. As reported by Davydov et al. [33], the hydrogen evolution reaction (HER) occurs via two basic ways: the reduction of H+ at pH < 4 and the reduction of H2O at higher pH values. Therefore, it can be deduced that the cathodic reaction is dominated by H+ reduction at pH 3.0 and H2O reduction at pH 4.5. In addition, the oxygen reduction also participates in the cathodic reactions when the solution pH is 4.5, yielding the diffusion-controlled behavior within the cathodic potential range. When the solution pH was increased from 4.5 to 8.2, the cathodic current density decreased, and the cathodic reaction was controlled by oxygen reduction at pH 8.2. As for the anodic branch, decreasing pH from 8.2 to 4.5 accelerated the anodic dissolution, as indicated by the higher anodic current density at higher pH values. The co-promotion of anodic and cathodic processes yielded the unnoticeable variation in the corrosion potential within this potential range.
Figure 5b shows the polarization curves of 30CrMnSiNi2A in artificial seawater at different temperatures at the pH of 8.2. The anodic and cathodic reactions were facilitated simultaneously by the increase in temperature, resulting in the variation in the corrosion potential and corrosion current density. The anodic curve also shows active dissolution, with a low Tafel slope. In the cathodic region, the cathodic reaction is dominated by oxygen reduction and water reduction reactions. The influence of temperature on the corrosion kinetics of materials can be considered in relation to two effects. Firstly, the increase in temperature leads to the decrease in the dissolved oxygen concentration in the electrolyte, which inhibits the electrochemical corrosion. In contrast, the increase in temperature promotes the material surface activity and enhances the diffusion of oxygen and Cl in the test solution, thus accelerating the reaction and increasing the corrosion rate. In the present work, it was perceived that the curve at 30 °C showed the most obvious diffusion-controlled behavior, revealing the balance of the two abovementioned effects. Even so, corrosion occurred faster at high temperatures. In addition, it should be noted that the effect of the temperature on the corrosion behavior was similar at different temperatures, and the same finding was also observed with respect to the effect of the pH at different temperatures. Therefore, only one pH and one temperature were selected when studying the effects of the variables.

3.2. Comparison of the Corrosion Behavior in the Salt Spray and Immersion Tests

3.2.1. Corrosion Rate

Figure 6 displays the corrosion rate in the two environments. The results show that the values in the salt spray environment were much higher than those from the immersion test. In the latter case, the corrosion rate within the short-term duration was lower than that after 28 days immersion, while in the salt spray test, the results were opposite, indicating that the rust layers generated in the two environments were different in terms of their protective ability, thus changing the corrosion evolution behavior of the steel. However, the corrosion in the salt spray test was still more profound in the later stage.

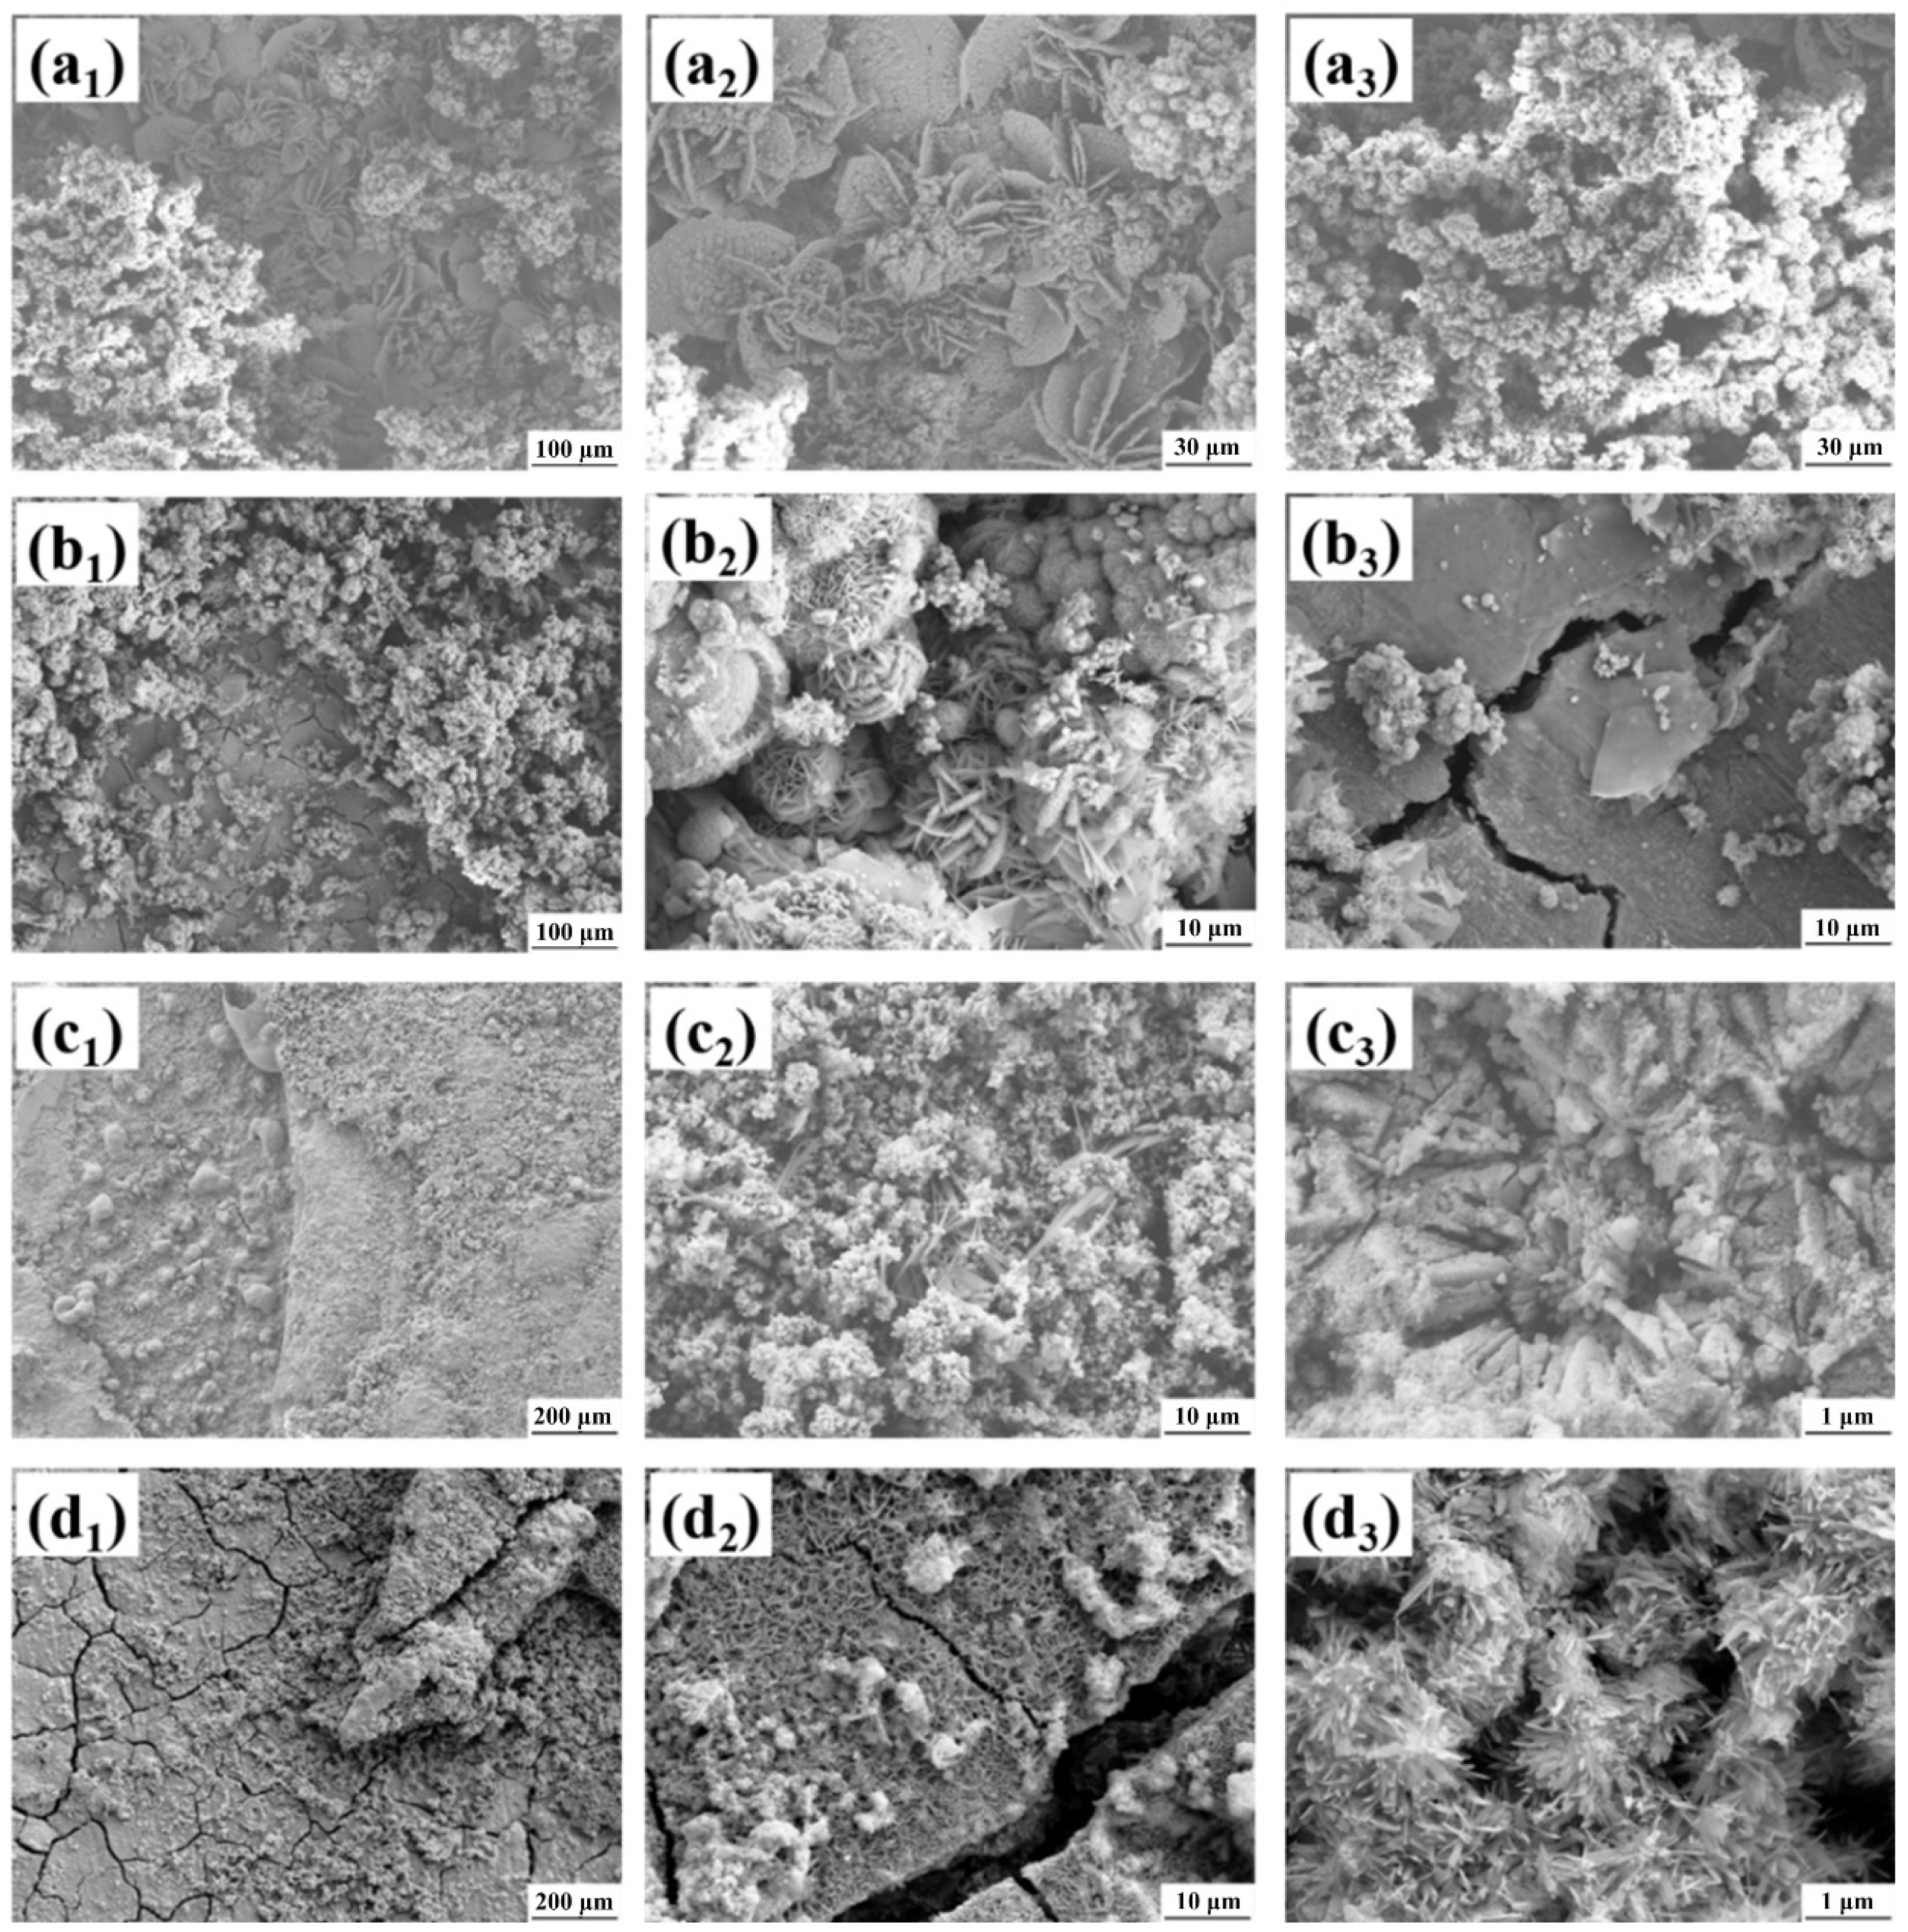
3.2.2. Corrosion Product Analysis

The macro-morphologies of the 30CrMnSiNi2A steel after exposure for different periods are given in Figure 7, in which a1–a4 and b1–b4 are the results from the immersion environment and salt spray environment for 3, 7, 14, and 28 days, respectively. The corrosion evolved and the rust layer gradually covered the whole surface in the immersion environment. Localized corrosion clearly occurred within the initial stage (3 days), and then the corrosion products propagated to completely cover the surface (7 and 14 days) and finally flaked off locally (28 days). The corrosion product layer formed in the immersion test was loose and porous, while that formed in the salt spray environment was dense and exhibited lumps, which may be the reason for the differences in the corrosion rate between them.
Figure 8 exhibits the XRD spectra of the corrosion scales from the surfaces of the specimens after corrosion for 14 and 28 days. The corrosion products in the immersion environment mainly consisted of α-FeOOH, γ-FeOOH, Fe3O4, Fe(OH)2, and α-Fe2O3, while those formed in the salt spray environment were composed of α-FeOOH, γ-FeOOH, Fe3O4, and FeO. After 14 and 28 days of corrosion, the types of corrosion products were consistent, but the peak intensity of the corresponding angles changed. The prolongation of the corrosion time only changes the proportion of different corrosion product phases or determines the appearance and disappearance of some mesophases but does not affect the types of corrosion products [24]. More Fe3O4 peaks were found in the rust formed in the salt spray environment.
The surface morphologies of the steel after corrosion for the different periods are shown in Figure 9. SEM images of 30CrMnSiNi2A immersed for 14 (Figure 9(a1–a3)) and 28 days (Figure 9(b1–b3)) show obvious stratification of the corrosion product layers. After 14 days immersion, the corrosion products showed obvious disk-like and cotton-like shapes. As the immersion duration extended to 28 days, the corrosion products peeled off significantly, the dense bulk corrosion products at the bottom were exposed, and the phases close to the matrix were rod-shaped and flaky. In the salt spray environment, after corrosion for 14 (Figure 9(c1–c3)) and 28 days (Figure 9(d1–d3)), the delamination of the corrosion products was more obvious. After 14 days, the rust layer peeled off and showed three layers. However, after 28 days, there were only two layers. After further increasing the exposure time, the rust layer thickened and exhibited different degrees of spalling. Previous studies [11,34] showed that γ-FeOOH is usually in the shape of a disk, nest, or ball, while α-FeOOH is in the shape of needle or prism. Researchers [13,35] generally believe that γ-FeOOH is preferentially formed on the surface of low-carbon steel. As the rust layer gradually thickens, the active γ-FeOOH is transformed into stable α-FeOOH, which is attached to cause the rust layer to become denser.
Figure 10 and Figure 11 show the cross-sectional morphologies of 30CrMnSiNi2A after corrosion in the artificial seawater and salt spray for 28 days, respectively. The thickness of the rust layer formed in the salt spray environment was measured to be about 55 μm, while that in the seawater was about 100 μm. There was no obvious segregation of alloy elements in the rust layers. The rust layer from the immersion environment was rich in Ca, which was caused by the aragonite precipitation. Because the rust layer in the salt spray environment was thinner and obviously stratified, it was difficult to effectively prevent the corrosion process, despite the rust layer being dense. However, in the immersion environment, the rust layer was thicker, which decelerated the corrosion process, resulting in the low corrosion rate.
Figure 12 shows the micro-morphologies and 3D topographies of the samples after the removal of the corrosion products. No pit was observed on 30CrMnSiNi2A after 14 and 28 days of corrosion in the immersion and salt spray environments, and uniform corrosion was observed. The 3D images of the sample surfaces after corrosion show that the salt spray corrosion was more profound than that of the immersion in artificial seawater, correlating with the corrosion rate results.

3.2.3. Corrosion Process and Mechanism

The corrosion behavior differences in the salt spray and immersion environments are mainly attributed to the different forms and presence of the surface electrolytes. In the salt spray environment, the sample surface was coved by an unsteady thin electrolyte layer with a humidity of 100% [36]. In the immersion test, however, the continuous electrolyte presented with near infinite thickness. The main difference between the two environments was the oxygen availability, which supported the cathodic reactions. In terms of the corrosion rates, samples in the salt spray environment exhibited higher values than those of the immersion test. Firstly, the standard temperature of the former (35 °C) was slightly higher than that of the immersion test (25 °C), which accelerated the corrosion process. Secondly, the more important factor is the sufficient oxygen in the salt spray environment, which expedited the cathodic reactions and increased the corrosion rate. This phenomenon is consistent with reports from the literature, in which the corrosion behaviors in these two environments were compared [37].
The corrosion products also varied with the change of corrosion environment. In the presence of Cl and O2, corrosion proceeds with the anodic dissolution of Fe (Equation (4)) and cathodic reduction of O2 (Equation (5)), yielding the formation of Fe(OH)2 (Equation (6)). Fe(OH)2 is not stable and can be transformed to meta-stable γ-FeOOH and stable α-FeOOH through Equations (7) and (8) [38,39]. They are also the main corrosion product phases that were formed in the marine environment and in the present work. Apart from this, the main difference between the corrosion products in the two environments was the higher content of Fe3O4 in the rust layer formed in the salt spray environment (Figure 8). Stratmann et al. [40] revealed that Fe3O4 can be formed by two pathways, including the direct reduction in the FeOOH phase (Equation (9)) and the reaction of FeOOH with Fe2+ (Equation (10)). The high content of Fe3O4 within the rust layer formed in the salt spray environment suggests that the transformation from FeOOH to Fe3O4 occurred, while that in the immersion environment had not yet occurred, attributed to the low corrosion rate [18]. In addition, the trace amount of Fe2O3 formed in the immersion environment is consistent with Yu et al. [16], who found the same phase in the full-immersion test.
Fe→Fe2+ + 2e
O2 + 2H2O + 4e→4OH
Fe2+ + 2OH→Fe(OH)2
4Fe(OH)2 + O2→4γ-FeOOH + 2H2O
γ-FeOOH→α-FeOOH
3α/γ-FeOOH + H+ + e→Fe3O4 + 2H+
2α/γ-FeOOH+Fe2+ + e→Fe3O4 + 2H+
The rust layer definitely affects the corrosion process. On the one hand, the diffusion of aggressive species such as O2 and Cl can be impeded by the dense rust layer, thus decelerating the corrosion development. On the other hand, the thick rust layer can adsorb the electrolyte and facilitates the corrosion at the rust/matrix interface. In the present work, the corrosion rate decreased in the salt spray environment, suggesting that the former activity dominates the corrosion process. In the immersion test, however, the corrosion rate still increased after exposure for 28 days, suggesting that the rust layer could not provide the protective effect, which may be attributed to the porous structure of this layer (Figure 7(a3,a4)).
The corrosion morphologies shown in Figure 12 suggest that the rougher surface with isolated corrosion pits formed in the immersion environment, while uniform corrosion was detected in the immersion test. In the former case, the full immersion provided more available sites for the initiation of the corrosion pits during the initial period, but the poorly attached corrosion products could not maintain the growth and propagation of the pits, and thus uniform corrosion occurred. In the salt spray environment, the concentration cells could be generated easily because of the presence of the thin electrolyte layer that was deposited in different positions, promoting the localized corrosion [41]. Meanwhile, the thick corrosion products could facilitate the formation of the localized area beneath it, further facilitating the pit growth. This resulted in the surface topographies shown in Figure 12(c2,d2).

3.3. SCC Behavior Analysis

3.3.1. Stress-Strain Curves

Figure 13 shows the stress–strain curves of the steel in air and in artificial seawater. The two curves almost overlap, and the tensile strength and elongation in the ASW are slightly lower than those in air. This indicates that the corrosive medium did not significantly promote cracking, which may be attributed to the low yield strength and ultimate tensile strength in the as-received state. Figure 14 shows the calculated SCC susceptibilities, in which the index determined by the elongation shows a low value of less than 5%, and that obtained by the reduction-in-area presents a higher value of about 25%.

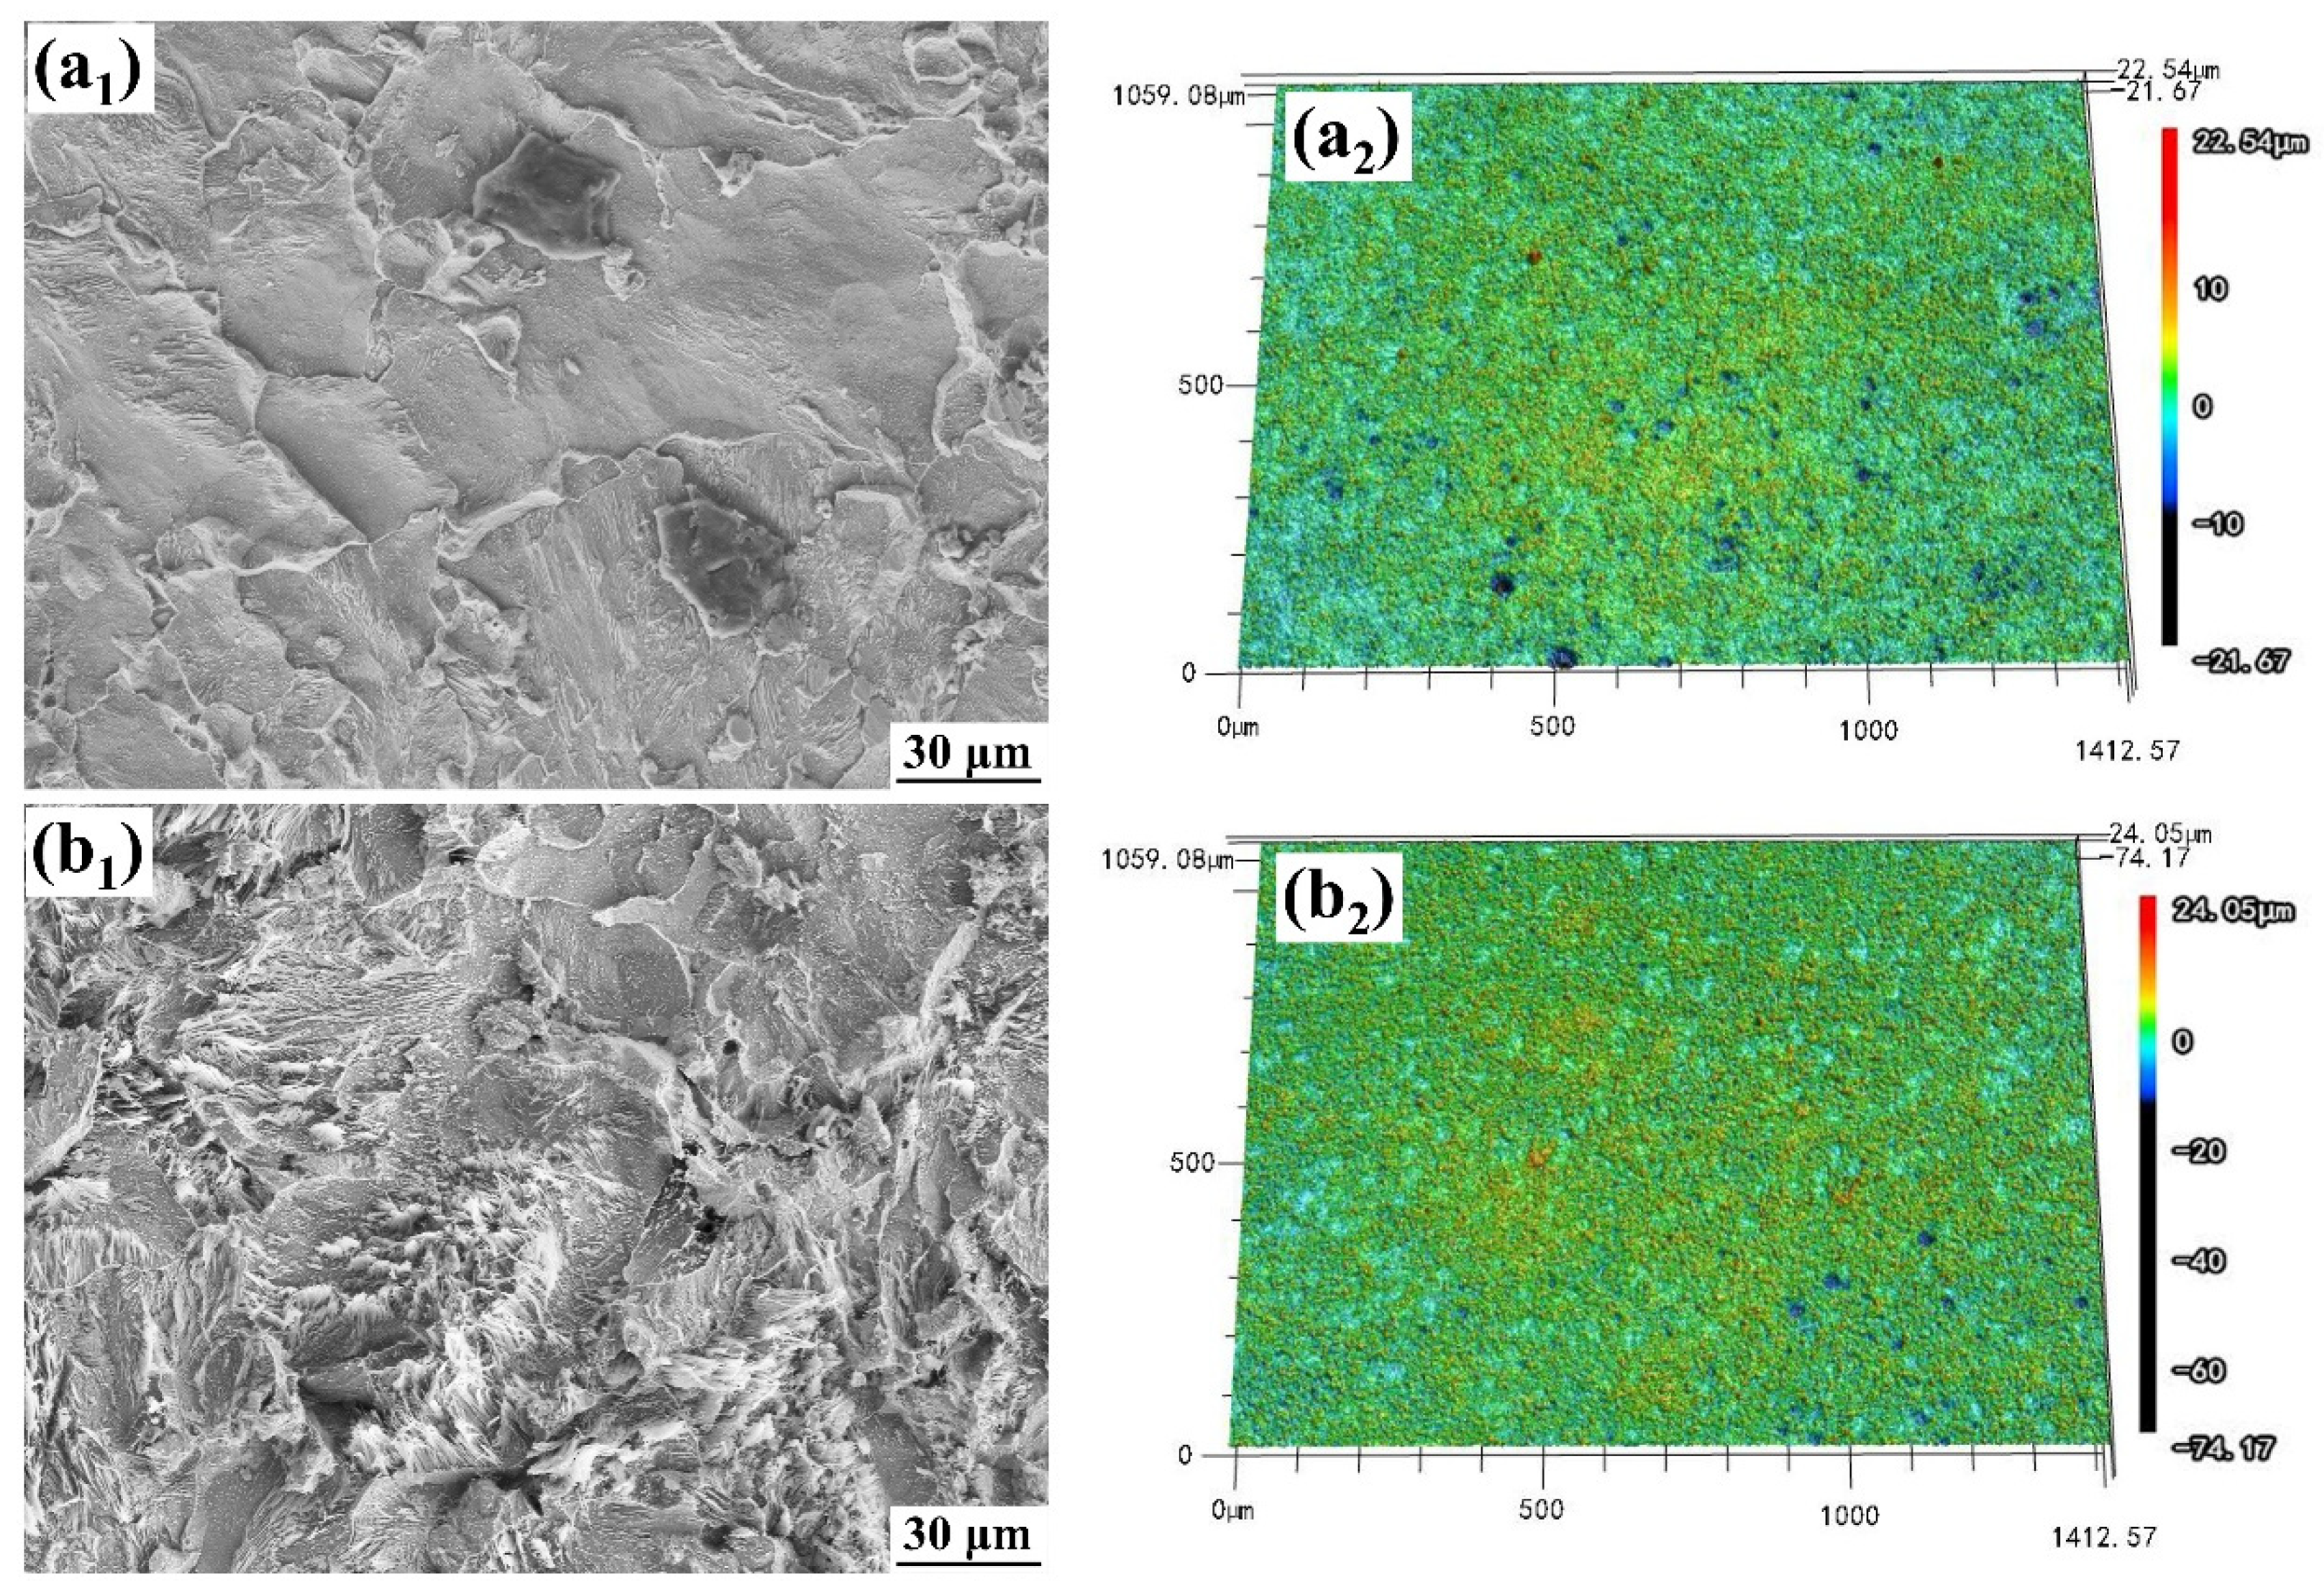
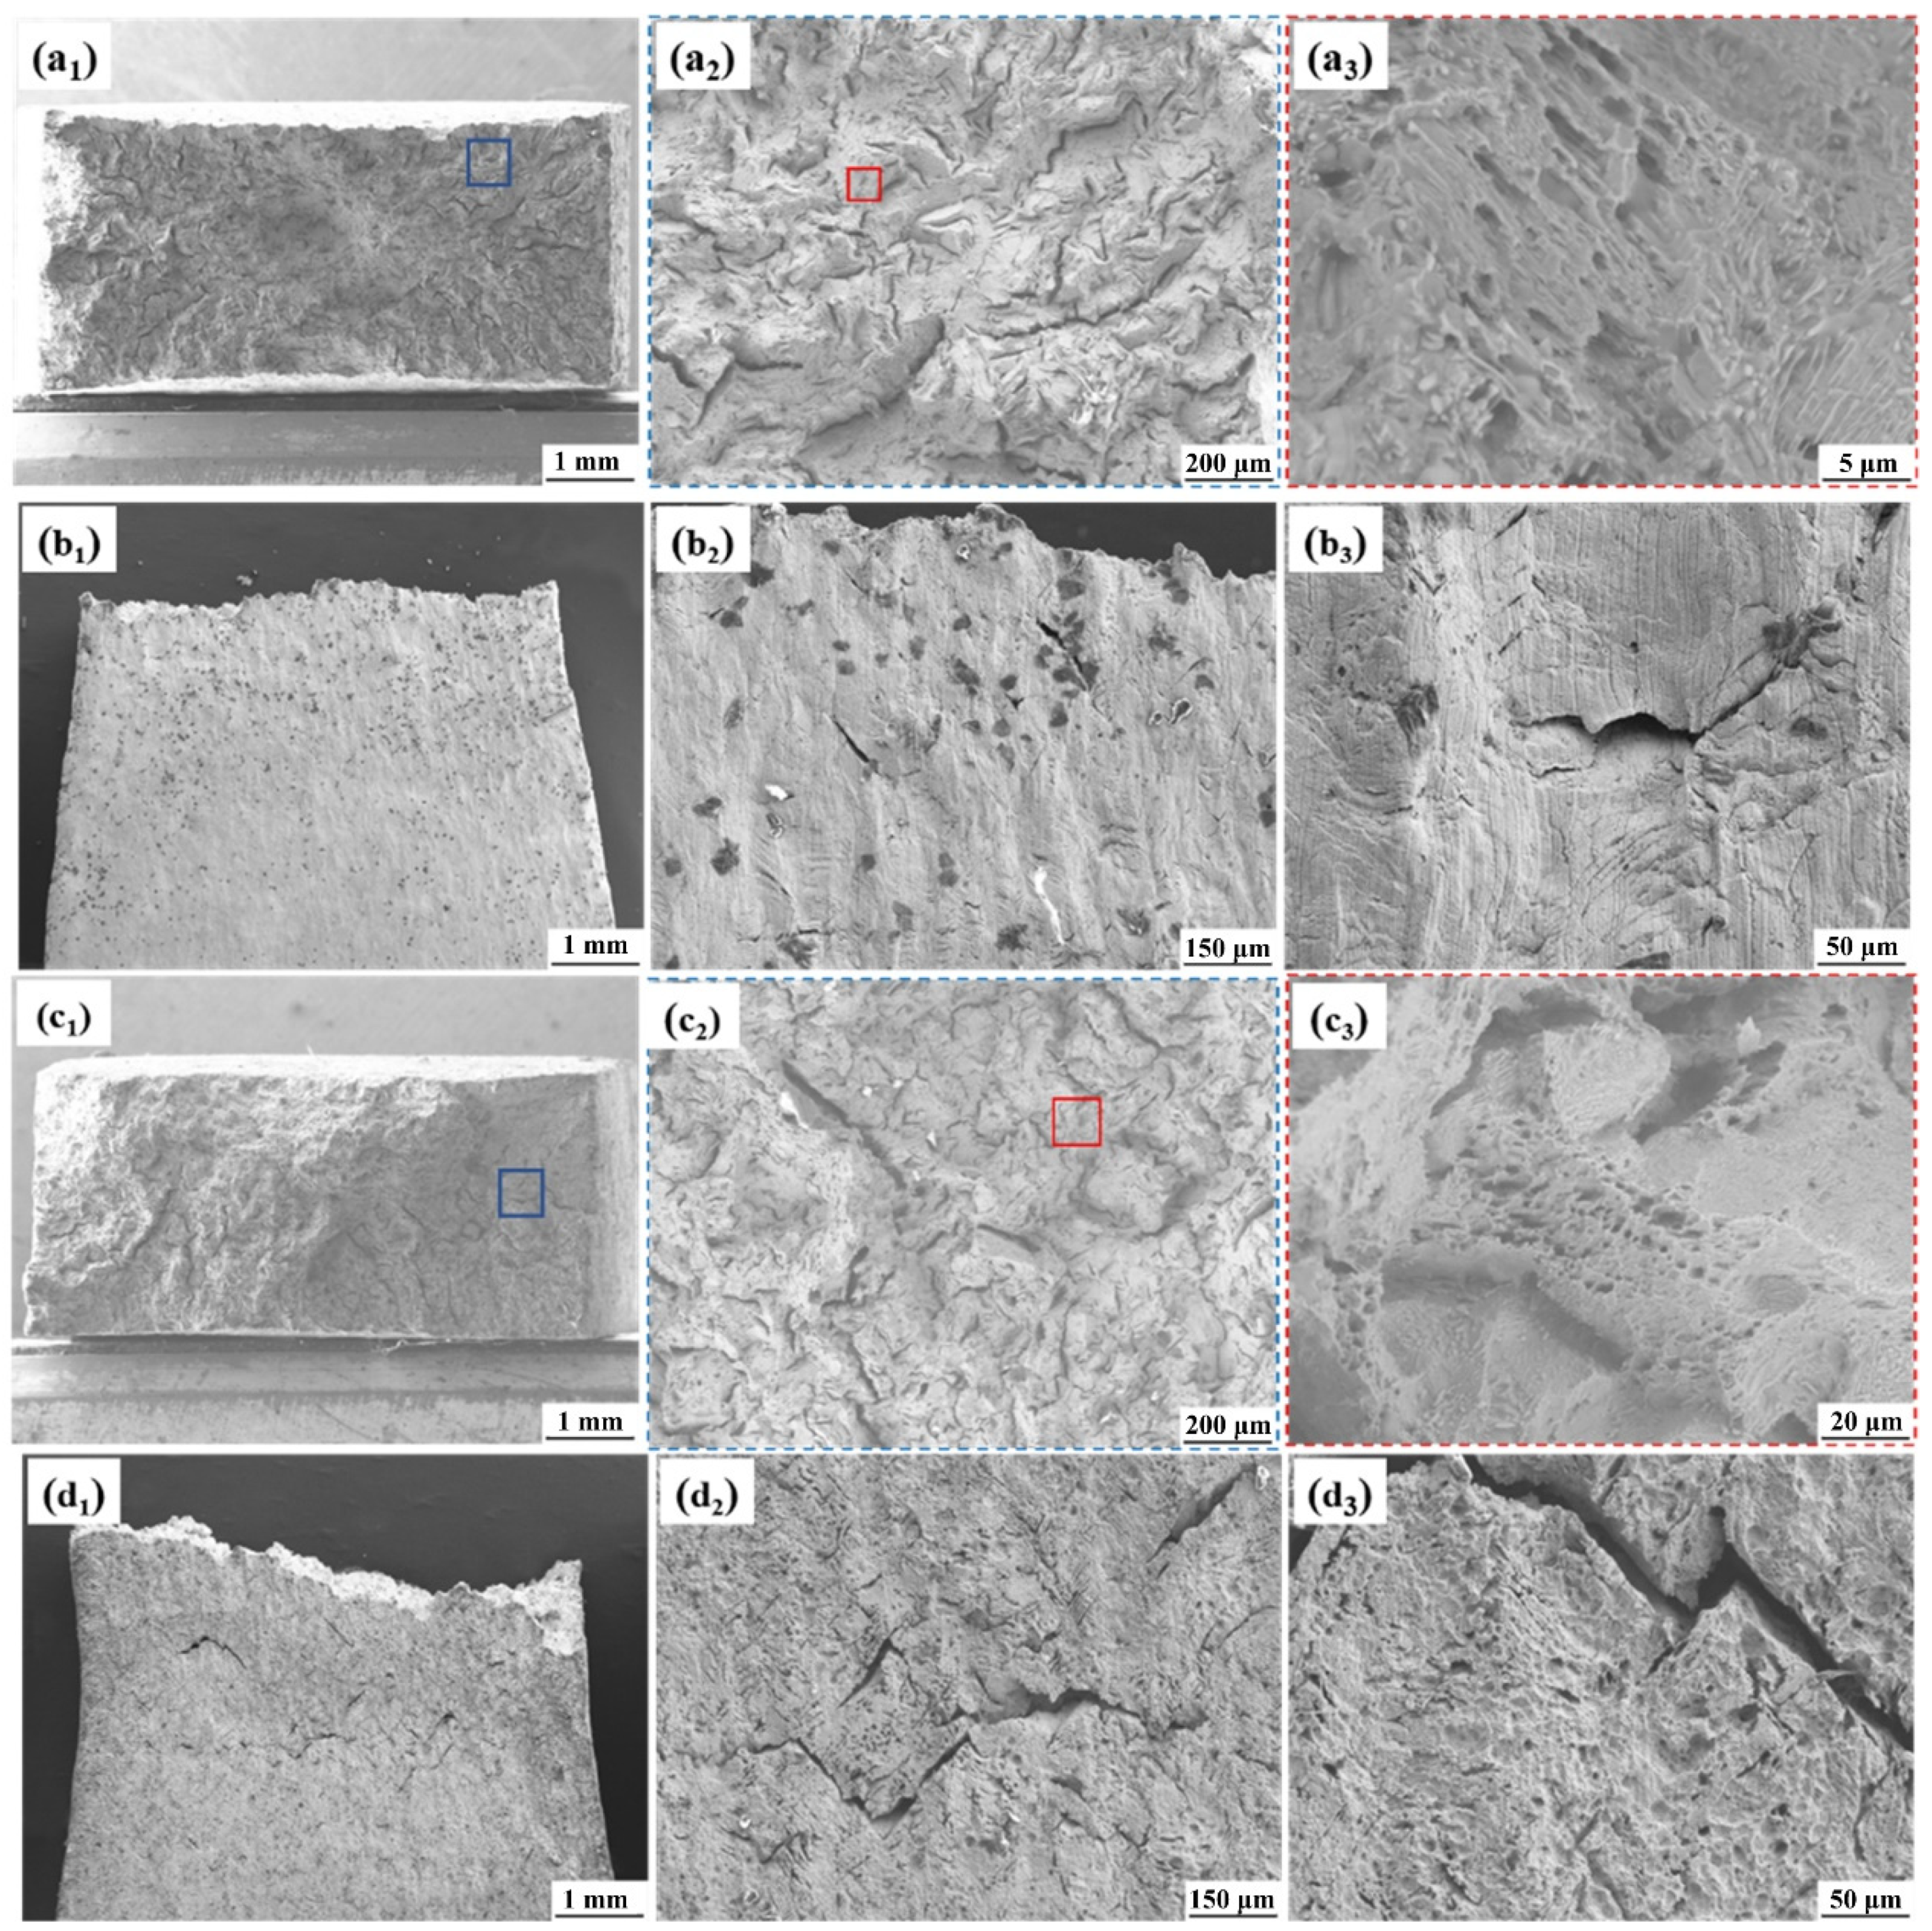
3.3.2. Fracture Morphology after SSRT

The fracture morphologies of the 30CrMnSiNi2A steel after the tensile tests were detected and are shown in Figure 14. Obvious necking behavior was observed in the sample fractured in air. The magnified image reveals that the fractur surface contained some dimples, attributed to the micro-void coalescence (MVC), as shown in Figure 14(a1–a3), indicating the typical ductile cracking behavior [42]. There were many small quasi-cleavage sections, with secondary cracks and tearing edges. This was due to the discontinuous propagation of the cracks in the fracture process, and the crack source was usually inside the small quasi-cleavage section. In addition, short and narrow cracks were detected on the side surface.
The fracture morphology after the SSRT tests in the ASW is shown in Figure 14(c1–c3). The morphology was similar to that in air, and obvious cleavage steps were observed on the secondary cracks, showing obvious brittle fracture characteristics. This indicates that the SCC sensitivity of 30CrMnSiNi2A in the ASW environment was slightly increased. The side surface morphology in the ASW is shown in Figure 14(d1–d3). There was no obvious plastic deformation on the fracture surface, and there were many deep and long secondary cracks on the surface.

3.3.3. SCC Mechanism

Anodic dissolution (AD) and hydrogen embrittlement (HE) are the two main mechanisms involved in the SCC of high-strength steels in Cl environments [43,44,45]. Tian et al. [18] summarized the results of their investigation of the dominating factor of SCC of low alloys in a marine environment and concluded that the dominant factor depended on the material type and testing environment. They reported that, in the seawater at OCP, the low SCC susceptibility of the low alloy steel could be attributed to the AD process, as illustrated in [15,44]. When there are some ions such as HSO3 or S2O32− present, hydrogen begins to participate in the SCC process [46,47]. In this work, the differences between the SCC susceptibilities obtained by the elongation loss and reduction-in-area loss can be used to determine the controlling process. The index calculated by the elongation (Iδ) mainly reflects the dislocation and deformation of the sample and was affected by the hydrogen content of the steel [48]. Meanwhile, the index calculated by the reduction-in-area (Iφ) was mainly influenced by cracks and defects in the steel, as it reflects the sensitivity of the SCC at the crack propagation stage [49]. As shown in Figure 13b, the low Iδ value suggests that hydrogen plays a negligible role in SCC degradation, while anodic dissolution, which provides the defects, controls the deterioration process.
It can be seen from the polarization curve in Figure 5 that the anodic curve is characterized by active dissolution, indicating that the steel had no passivation ability and could not generate a protective passive film. Even so, the results of the immersion experiments in the artificial seawater environment show that the accumulation of corrosion products (FeOOH, Fe3O4) on the surface of the sample formed a protective layer, but the coverage of this layer was not uniform and not dense enough to provide channels for the diffusion of the corrosion media to the interface between the corrosion product layer and matrix [11]. In this case, the occluded cell effect occurred, promoting the localized stress concentration and facilitating the crack initiation. From the side surface morphology of the fracture (Figure 14), local cracks formed at the corrosion pits and the crack propagation direction was perpendicular to the applied stress. Once the crack was formed, an occluded area was formed at the crack and became an anode for the electrochemical reaction. The dissolution of Fe at the crack tip accelerated the crack propagation. At the same time, Fe2+ hydrolyzed in the occluded region and the local pH decreased, which also promoted the crack tip dissolution and crack growth.

4. Conclusions

(1)
The changes in the solution temperature and pH significantly affect the electrochemical behavior. The anodic process is controlled by active dissolution, while the cathodic process is controlled by oxygen reduction in a neutral solution and by hydrogen evolution in an acidic solution. The decrease in the pH value mainly accelerates the cathodic reaction, and the temperature simultaneously promotes the anodic and cathodic reactions.
(2)
The corrosion products of 30CrMnSiNi2A steel were mainly composed of α-FeOOH, γ-FeOOH, and Fe3O4, as well as trace amount of Fe(OH)2, α-Fe2O3, and FeO. The corrosion rate in the salt spray environment was much higher than that in the immersion test, which is due to the differences in the available oxygen concentrations and the corrosion product properties.
(3)
The SCC sensitivity of the as-received 30CrMnSiNi2A steel was about 4.2% and 25% in terms of the elongation loss and reduction-in-area loss, respectively. The relatively higher index obtained by the reduction-in-area suggests that the SCC degradation is dominated by anodic dissolution.

Author Contributions

Conceptualization, L.Z. and Z.C.; investigation, L.Z., Y.W. and H.L.; writing—original draft preparation, L.Z. and W.H.; writing—review and editing, L.Z. and Z.C. All authors have read and agreed to the published version of the manuscript.

Funding

The authors wish to acknowledge the financial support of the National Natural Science Foundation of China (No. 51601182), and financial support of the Key Research and Development Program of Shandong Province (2020CXGC010305).

Data Availability Statement

The raw/processed data required to reproduce these findings cannot be shared at this time, as the data are related to an ongoing study.

Conflicts of Interest

The authors declare no conflict of interest.

References

  1. Malakondaiah, G.; Srinivas, M.; Rao, P. Ultrahigh-strength low-alloy steels with enhanced fracture toughness. Prog. Mater. Sci. 1997, 42, 209–242. [Google Scholar] [CrossRef]
  2. Wang, G.; Yan, Y.; Li, J.; Huang, J.; Su, Y.; Qiao, L. Hydrogen embrittlement assessment of ultra-high strength steel 30CrMnSiNi2. Corros. Sci. 2013, 77, 273–280. [Google Scholar] [CrossRef]
  3. Liu, J.; Guo, Q.; Yu, M.; Songmei, L. SCC investigation of low alloy ultra-high strength steel 30CrMnSiNi2A in 3.5 wt% NaCl solution by slow strain rate technique. Chin. J. Aeronaut. 2014, 27, 1327–1333. [Google Scholar] [CrossRef]
  4. Ge, F.; Fan, L.; Liang, J.; Pang, K.; Li, H.; Wang, X.; Cui, Z. Corrosion Evolution of High-Strength Aluminum Alloys in the Simu-lated Service Environment of Amphibious Aircraft in the Presence of Chloride and Bisulfite. Acta Metall. Sin. Engl. Lett. 2021, 34, 1679–1694. [Google Scholar]
  5. Duan, Y.; Liu, W.; Ma, Y.; Cai, Q.; Zhu, W.; Li, J. Effect of Ni addition upon microstructure and mechanical properties of hot isostatic pressed 30CrMnSiNi2A ultrahigh strength steel. Mater. Sci. Eng. A 2022, 850, 143599. [Google Scholar] [CrossRef]
  6. Hafeez, M.A.; Farooq, A. Microstructural, mechanical and tribological investigation of 30CrMnSiNi2A ultra-high strength steel under various tempering temperatures. Mater. Res. Express 2018, 5, 016505. [Google Scholar] [CrossRef]
  7. Niu, Q.-L.; Ming, W.-W.; Chen, M.; Tang, S.-W.; Li, P.-N. Dynamic mechanical behavior of ultra-high strength steel 30CrMnSiNi2A at high strain rates and elevated temperatures. J. Iron Steel Res. Int. 2017, 24, 724–729. [Google Scholar] [CrossRef]
  8. Liu, J.; Wen, C.; Yu, M.; Li, S.; Wang, R. Manifestations in corrosion prophase of ultra-high strength steel 30CrMnSiNi2A in sodium chloride solutions. J. Wuhan Univ. Technol. Sci. Ed. 2014, 29, 367–373. [Google Scholar] [CrossRef]
  9. Guo, Q.; Liu, J.-H.; Yu, M.; Li, S.-M. Influence of Rust Layers on the Corrosion Behavior of Ultra-High Strength Steel 300M Subjected to Wet–Dry cyclic Environment with Chloride and Low Humidity. Acta Met. Sin. Engl. Lett. 2015, 28, 139–146. [Google Scholar] [CrossRef]
  10. Sun, M.; Xiao, K.; Dong, C.; Li, X.; Zhong, P. Stress corrosion cracking of ultrahigh strength martensite steel Cr9Ni5MoCo14 in 3.5% NaCl solution. Aerosp. Sci. Technol. 2014, 36, 125–131. [Google Scholar] [CrossRef]
  11. de la Fuente, D.; Díaz, I.; Simancas, J.; Chico, B.; Morcillo, M. Long-term atmospheric corrosion of mild steel. Corros. Sci. 2011, 53, 604–617. [Google Scholar] [CrossRef] [Green Version]
  12. Popova, K.; Prošek, T. Corrosion Monitoring in Atmospheric Conditions: A Review. Metals 2022, 12, 171. [Google Scholar] [CrossRef]
  13. Jia, J.; Liu, Z.; Cheng, X.; Du, C.; Li, X. Development and optimization of Ni-advanced weathering steel: A review. Corros. Commun. 2021, 2, 82–90. [Google Scholar] [CrossRef]
  14. Wang, L.; Liang, J.; Li, H.; Cheng, L.; Cui, Z. Quantitative study of the corrosion evolution and stress corrosion cracking of high strength aluminum alloys in solution and thin electrolyte layer containing Cl. Corros. Sci. 2021, 178, 109076. [Google Scholar] [CrossRef]
  15. Tian, H.; Wang, X.; Cui, Z.; Lu, Q.; Wang, L.; Lei, L.; Li, Y.; Zhang, D. Electrochemical corrosion, hydrogen permeation and stress corrosion cracking behavior of E690 steel in thiosulfate-containing artificial seawater. Corros. Sci. 2018, 144, 145–162. [Google Scholar] [CrossRef]
  16. Yu, J.; Wang, H.; Yu, Y.; Luo, Z.; Liu, W.; Wang, C. Corrosion behavior of X65 pipeline steel: Comparison of wet–Dry cycle and full immersion. Corros. Sci. 2018, 133, 276–287. [Google Scholar] [CrossRef]
  17. Liang, M.; Melchers, R.; Chaves, I. Corrosion and pitting of 6060 series aluminium after 2 years exposure in seawater splash, tidal and immersion zones. Corros. Sci. 2018, 140, 286–296. [Google Scholar] [CrossRef]
  18. Tian, H.; Cui, Z.; Ma, H.; Zhao, P.; Yan, M.; Wang, X.; Cui, H. Corrosion evolution and stress corrosion cracking behavior of a low carbon bainite steel in the marine environments: Effect of the marine zones. Corros. Sci. 2022, 206, 110490. [Google Scholar] [CrossRef]
  19. Duarte, T.; Meyer, Y.A.; Osório, W.R. The Holes of Zn Phosphate and Hot Dip Galvanizing on Electrochemical Behaviors of Multi-Coatings on Steel Substrates. Metals 2022, 12, 863. [Google Scholar] [CrossRef]
  20. Zhang, X.; Jiang, Z.; Yao, Z.; Song, Y.; Wu, Z. Effects of scan rate on the potentiodynamic polarization curve obtained to determine the Tafel slopes and corrosion current density. Corros. Sci. 2009, 51, 581–587. [Google Scholar] [CrossRef]
  21. McCafferty, E. Validation of corrosion rates measured by the Tafel extrapolation method. Corros. Sci. 2005, 47, 3202–3215. [Google Scholar] [CrossRef]
  22. Yang, X.; Sun, F.; Li, Q.; Zhu, R.; Liu, Z.; Du, C.; Li, X. Effect of Hydrogen Charging on the Stress Corrosion Cracking Behavior of X70 Steel in Simulated Deep Seawater Environment. Metals 2022, 12, 334. [Google Scholar] [CrossRef]
  23. Hu, Y.; Dong, C.; Sun, M.; Xiao, K.; Zhong, P.; Li, X. Effects of solution pH and Cl− on electrochemical behaviour of an Aer-met100 ultra-high strength steel in acidic environments. Corros. Sci. 2011, 53, 4159–4165. [Google Scholar] [CrossRef]
  24. Ren, R.; Zhang, S.; Pang, X.; Gao, K. A novel observation of the interaction between the macroelastic stress and electrochemical corrosion of low carbon steel in 3.5 wt% NaCl solution. Electrochim. Acta 2012, 85, 283–294. [Google Scholar] [CrossRef]
  25. Cui, Z.; Liu, Z.; Wang, L.; Ma, H.; Du, C.; Li, X.; Wang, X. Effect of pH value on the electrochemical and stress corrosion crack-ing behavior of X70 pipeline steel in the dilute bicarbonate solutions. J. Mater. Eng. Perform. 2015, 24, 4400–4408. [Google Scholar] [CrossRef]
  26. Meyer, Y.A.; Bonatti, R.S.; Bortolozo, A.D.; Osorio, W.R. Electrochemical behavior and compressive strength of Al-Cu/xCu composites in NaCl solution. J. Solid State Electrochem. 2021, 25, 1303–1317. [Google Scholar] [CrossRef]
  27. Meyer, Y.A.; Menezes, I.; Bonatti, R.S.; Bortolozo, A.D.; Osório, W.R. EIS investigation of the corrosion behavior of steel bars embedded into modified concretes with eggshell contents. Metals 2022, 12, 417. [Google Scholar] [CrossRef]
  28. Lasia, A. Electrochemical Impedance spectroscopy and its applications. In Modern Aspects of Electrochemistry; Springer: Berlin/Heidelberg, Germany, 2002; pp. 143–248. [Google Scholar]
  29. Hirschorn, B.; Orazem, M.E.; Tribollet, B.; Vivier, V.; Frateur, I.; Musiani, M. Determination of effective capacitance and film thickness from constant-phase-element parameters. Electrochim. Acta 2010, 55, 6218–6227. [Google Scholar] [CrossRef]
  30. Pour-Ghaz, M.; Isgor, O.B.; Ghods, P. The effect of temperature on the corrosion of steel in concrete. Part 1: Simulated polari-zation resistance tests and model development. Corros. Sci. 2009, 51, 415–425. [Google Scholar] [CrossRef]
  31. Pan, H.; Pang, K.; Cui, F.; Ge, F.; Man, C.; Wang, X.; Cui, Z. Effect of alloyed Sr on the microstructure and corrosion behavior of biodegradable Mg-Zn-Mn alloy in Hanks’ solution. Corros. Sci. 2019, 157, 420–437. [Google Scholar] [CrossRef]
  32. Amin, M.A.; Khaled, K.; Fadl-Allah, S.A. Testing validity of the Tafel extrapolation method for monitoring corrosion of cold rolled steel in HCl solutions–Experimental and theoretical studies. Corros. Sci. 2010, 52, 140–151. [Google Scholar] [CrossRef]
  33. Davydov, A.; Rybalka, K.V.; Beketaeva, L.A.; Engelhardt, G.R.; Jayaweera, P.; Macdonald, D.D. The kinetics of hydrogen evolu-tion and oxygen reduction on Alloy 22. Corros. Sci. 2005, 47, 195–215. [Google Scholar] [CrossRef]
  34. de la Fuente, D.; Alcántara, J.; Chico, B.; Díaz, I.; Jiménez, J.; Morcillo, M. Characterisation of rust surfaces formed on mild steel exposed to marine atmospheres using XRD and SEM/Micro-Raman techniques. Corros. Sci. 2016, 110, 253–264. [Google Scholar] [CrossRef]
  35. Díaz, I.; Cano, H.; de la Fuente, D.; Chico, B.; Vega, J.; Morcillo, M. Atmospheric corrosion of Ni-advanced weathering steels in marine atmospheres of moderate salinity. Corros. Sci. 2013, 76, 348–360. [Google Scholar] [CrossRef]
  36. Liu, Z.; Hao, W.; Wu, W.; Luo, H.; Li, X. Fundamental investigation of stress corrosion cracking of E690 steel in simulated marine thin electrolyte layer. Corros. Sci. 2019, 148, 388–396. [Google Scholar] [CrossRef]
  37. Song, W.; Martin, H.J.; Hicks, A.; Seely, D.; Walton, C.A.; Lawrimore, W.B., II; Wang, P.T.; Horstemeyer, M.F. Corrosion behav-iour of extruded AM30 magnesium alloy under salt-spray and immersion environments. Corros. Sci. 2014, 78, 353–368. [Google Scholar]
  38. Li, K.; Li, X.; Zhao, Y.; Wang, K.; Song, S.; Jin, W.; Xia, D.; Xu, Y.; Huang, Y. Influence of Partial Rust Layer on the Passivation and Chloride-Induced Corrosion of Q235b Steel in the Carbonated Simulated Concrete Pore Solution. Metals 2022, 12, 1064. [Google Scholar] [CrossRef]
  39. Sun, M.; Du, C.; Liu, Z.; Liu, C.; Li, X.; Wu, Y. Fundamental understanding on the effect of Cr on corrosion resistance of weath-ering steel in simulated tropical marine atmosphere. Corros. Sci. 2021, 186, 109427. [Google Scholar]
  40. Stratmann, M.; Bohnenkamp, K.; Engell, H.-J. An electrochemical study of phase-transitions in rust layers. Corros. Sci. 1983, 23, 969–985. [Google Scholar] [CrossRef]
  41. Steen, N.V.D.; Gonzalez-Garcia, Y.; Mol, J.; Terryn, H.; Van Ingelgem, Y. Predicting the effect of droplet geometry and size distribution on atmospheric corrosion. Corros. Sci. 2022, 202, 110308. [Google Scholar] [CrossRef]
  42. Figueroa, D.; Robinson, M. Hydrogen transport and embrittlement in 300M and AerMet100 ultra high strength steels. Corros. Sci. 2010, 52, 1593–1602. [Google Scholar] [CrossRef]
  43. Cui, C.; Ma, R.; Martínez-Pañeda, E. A generalised, multi-phase-field theory for dissolution-driven stress corrosion cracking and hydrogen embrittlement. J. Mech. Phys. Solids 2022, 166, 104951. [Google Scholar]
  44. Du, X.; Su, Y.; Li, J.; Qiao, L.; Chu, W. Stress corrosion cracking of A537 steel in simulated marine environments. Corros. Sci. 2012, 65, 278–287. [Google Scholar] [CrossRef]
  45. Tian, H.; Xin, J.; Li, Y.; Wang, X.; Cui, Z. Combined effect of cathodic potential and sulfur species on calcareous deposition, hydrogen permeation, and hydrogen embrittlement of a low carbon bainite steel in artificial seawater. Corros. Sci. 2019, 158, 108089. [Google Scholar] [CrossRef]
  46. Ma, H.C.; Liu, Z.Y.; Du, C.W.; Wang, H.R.; Li, X.G.; Zhang, D.W.; Cui, Z.Y. Stress corrosion cracking of E690 steel as a welded joint in a simulated marine atmosphere containing sulphur dioxide. Corros. Sci. 2015, 100, 627–641. [Google Scholar] [CrossRef]
  47. Tian, H.; Chen, M.; Ge, F.; Song, K.; Wang, X.; Cui, Z. Hydrogen permeation and stress corrosion cracking of heat-affected zone of E690 steel under the combined effect of sulfur species and cathodic protection in artificial seawater. Constr. Build. Mater. 2021, 296, 123721. [Google Scholar] [CrossRef]
  48. Hardie, D.; Charles, E.A.; Lopez, A.H. Hydrogen embrittlement of high strength pipeline steels. Corros. Sci. 2006, 48, 4378–4385. [Google Scholar] [CrossRef]
  49. Liu, Z.; Wang, X.; Du, C.; Li, J.; Li, X. Effect of hydrogen-induced plasticity on the stress corrosion cracking of X70 pipeline steel in simulated soil environments. Mater. Sci. Eng. A 2016, 658, 348–354. [Google Scholar] [CrossRef] [Green Version]
Figure 1. Microstructure of 30CrMnSiNi2A, observed by an optical microscope (a) and SEM (b).
Metals 12 01443 g001
Figure 2. Open circuit potential curves of 30CrMnSiNi2A in artificial seawater with different pH levels (a) and temperatures (b).
Metals 12 01443 g002
Figure 3. Nyquist plot of 30CrMnSiNi2A in artificial seawater at 30 °C at different pH levels (a) and at pH 8.2 at different temperatures (b).
Metals 12 01443 g003
Figure 4. Equivalent circuit for the fitting of the EIS data: (a) Model A for the spectrum at pH 3.0, (b) Model B for the other spectra.
Metals 12 01443 g004
Figure 5. Potentiodynamic polarization curves of 30CrMnSiNi2A in artificial seawater with different pH levels at 30 °C (a) and different temperatures at pH 8.2 (b).
Metals 12 01443 g005
Figure 6. Corrosion rate of 30CrMnSiNi2A after corrosion in the immersion and salt spray environments for different periods.
Metals 12 01443 g006
Figure 7. Macro-morphologies of 30CrMnSiNi2A after corrosion in the immersion (a1a4) and salt spray environments (b1b4) for 3 (a1,b1), 7 (a2,b2), 14 (a3,b3), and 28 (a4,b4) days.
Metals 12 01443 g007
Figure 8. XRD spectra of 30CrMnSiNi2A after corrosion in the immersion (a) and salt spray (b) environments for different periods.
Metals 12 01443 g008
Figure 9. Micro-morphologies of 30CrMnSiNi2A after corrosion in the immersion (a1a3,b1b3) and salt spray environments (c1c3,d1d3) for 14 (a1a3,c1c3) and 28 (b1b3,d1d3) days.
Metals 12 01443 g009
Figure 10. Cross-sectional morphologies and EDS mapping results of the element distribution within the rust layers formed on 30CrMnSiNi2A steel after immersion for 28 days.
Metals 12 01443 g010
Figure 11. Cross-sectional morphologies and EDS mapping results of the element distribution within the rust layers formed on 30CrMnSiNi2A steel after the salt spray test for 28 days.
Metals 12 01443 g011
Figure 12. Micro-morphologies (a1d1) and 3D topographies (a2d2) of 30CrMnSiNi2A after corrosion in the immersion (a1,a2,b1,b2) and salt spray environments (c1,c2,d1,d2) for 14 (a1,a2,c1,c2) and 28 (b1,b2,d1,d2) days after the removal of the corrosion products.
Metals 12 01443 g012aMetals 12 01443 g012b
Figure 13. Stress–strain curves (a) and SCC sensitivity (b) of 30CrMnSiNi2A in air and in artificial seawater.
Metals 12 01443 g013
Figure 14. Morphologies of the fracture surface (a1a3,c1c3) and side surface (b1b3,d1d3) of 30CrMnSiNi2A tested in air (a1a3,b1b3) and in artificial seawater (c1c3,d1d3).
Metals 12 01443 g014
Table 1. The fitted parameters for the EIS of 30CrMnSiNi2A in artificial seawater with different temperatures and pH levels (the units of R, CPE, and L are Ω·cm2, Ω−1 cm−2 s−n, and H·cm−2, respectively).
T (°C)pHRsRctCPEdln1RLLχ2Model
303.06.294.34.69 × 10−40.8322.7202.48.5 × 10−4B
304.56.4230.61.30 × 10−30.67 2.5 × 10⁻³A
306.05.1506.77.97 × 10−40.75 1.1 × 10⁻³A
308.28.1731.67.60 × 10−40.70 5.4 × 10⁻⁴A
208.26.2699.01.72 × 10−30.62 2.1 × 10⁻³A
408.25.0524.12.25 × 10−30.64 1.6 × 10⁻³A
Publisher’s Note: MDPI stays neutral with regard to jurisdictional claims in published maps and institutional affiliations.

