
Low-Temperature Deformation Mechanism and Strain-Hardening Behaviour of Laser Welded Dual-Phase Steels


Abstract
:
1. Introduction

| Plasticity Model | Advantages/Practical Applications | Disadvantages |
|---|---|---|
| (1). Hollomon Power Law | (1). The Hollomon model is most accurate for metals that have a strain-hardening coefficient between 0.1 and 0.3 [47,48]. (2). It is a straightforward mathematical model that can precisely describe the hardening characteristics of a material [49,50]. | (1). The major limitation of the Hollomon equation is the assumption that the steel exhibited constant hardening exponent (n) throughout the entire tensile test. i.e., it is limited to describing only one deformation mode [51]. |
| (2). Crussard-Jaoul | (1). C-J model can be used to analyse multistage hardening behaviour [52]. (2). C-J analysis results are independent of the level of flow stress. (3). C-J is the most commonly applied model for DP steels [52,53]. | (1). A limitation of the C-J model is that the values of the constants in the equation depend on where the power law curve fits a range of experimental data and intercepts the strain axis [54]. (2). The model is not used in numerical simulations of sheet metal stamping processes. (3). C-J analysis results are significantly influenced by the pre-strain and manufacturing history of the material [54]. |
| (3). Afrin model | It provides a rough estimate of hardening capacity of a material. | It does not express the exact hardening capacity. |
2. Materials and Methods
3. Results and Discussion
3.1. Microstructural Evolution
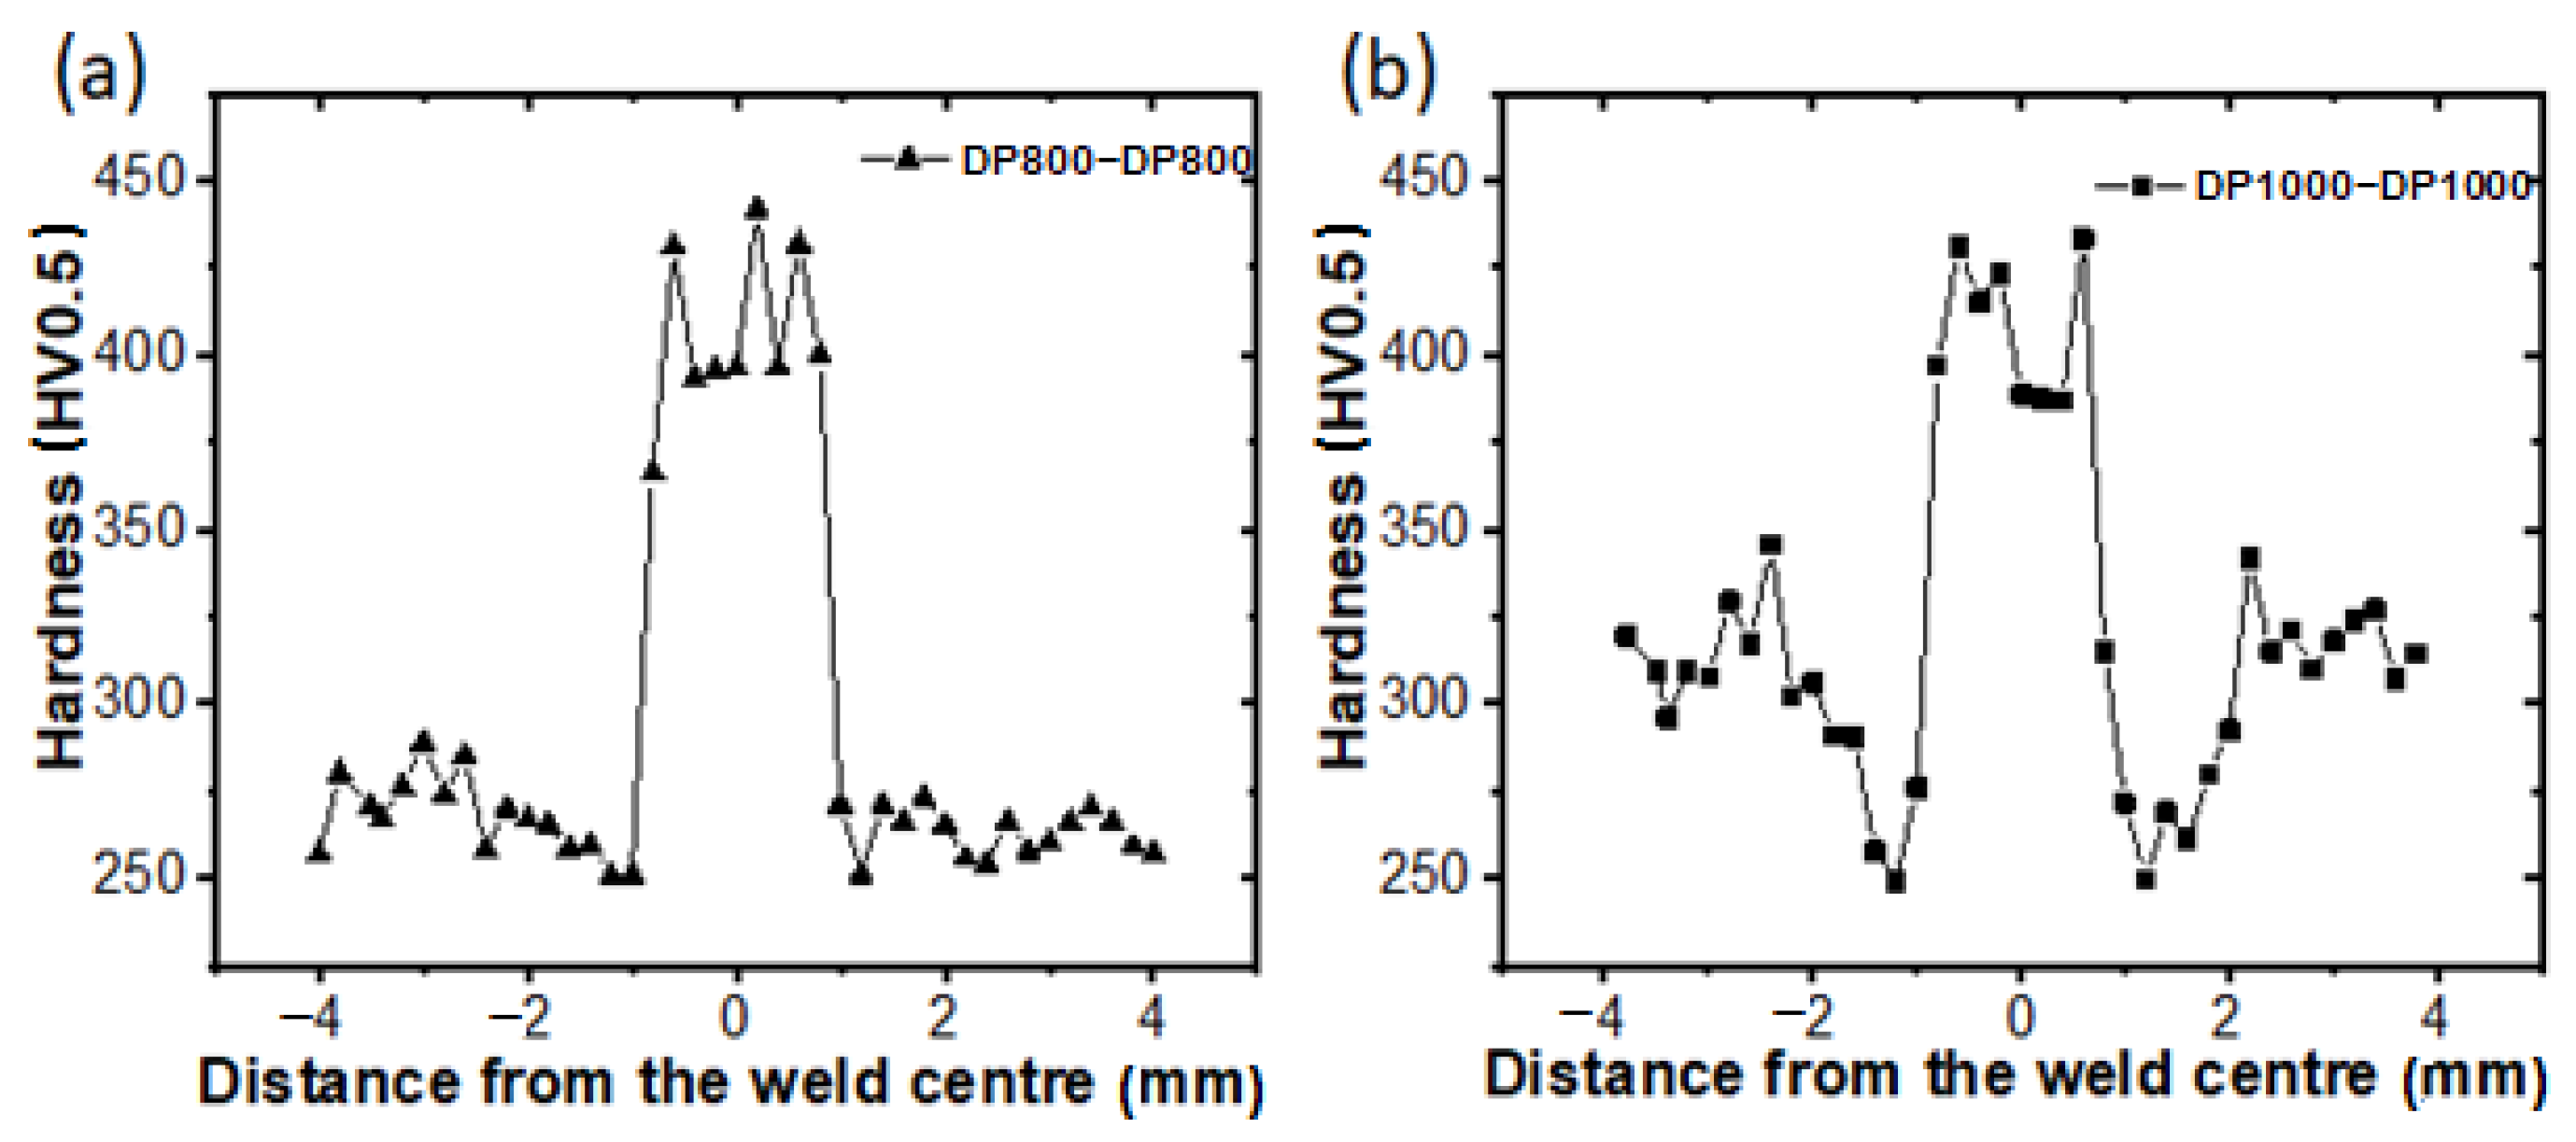
3.2. Microhardness
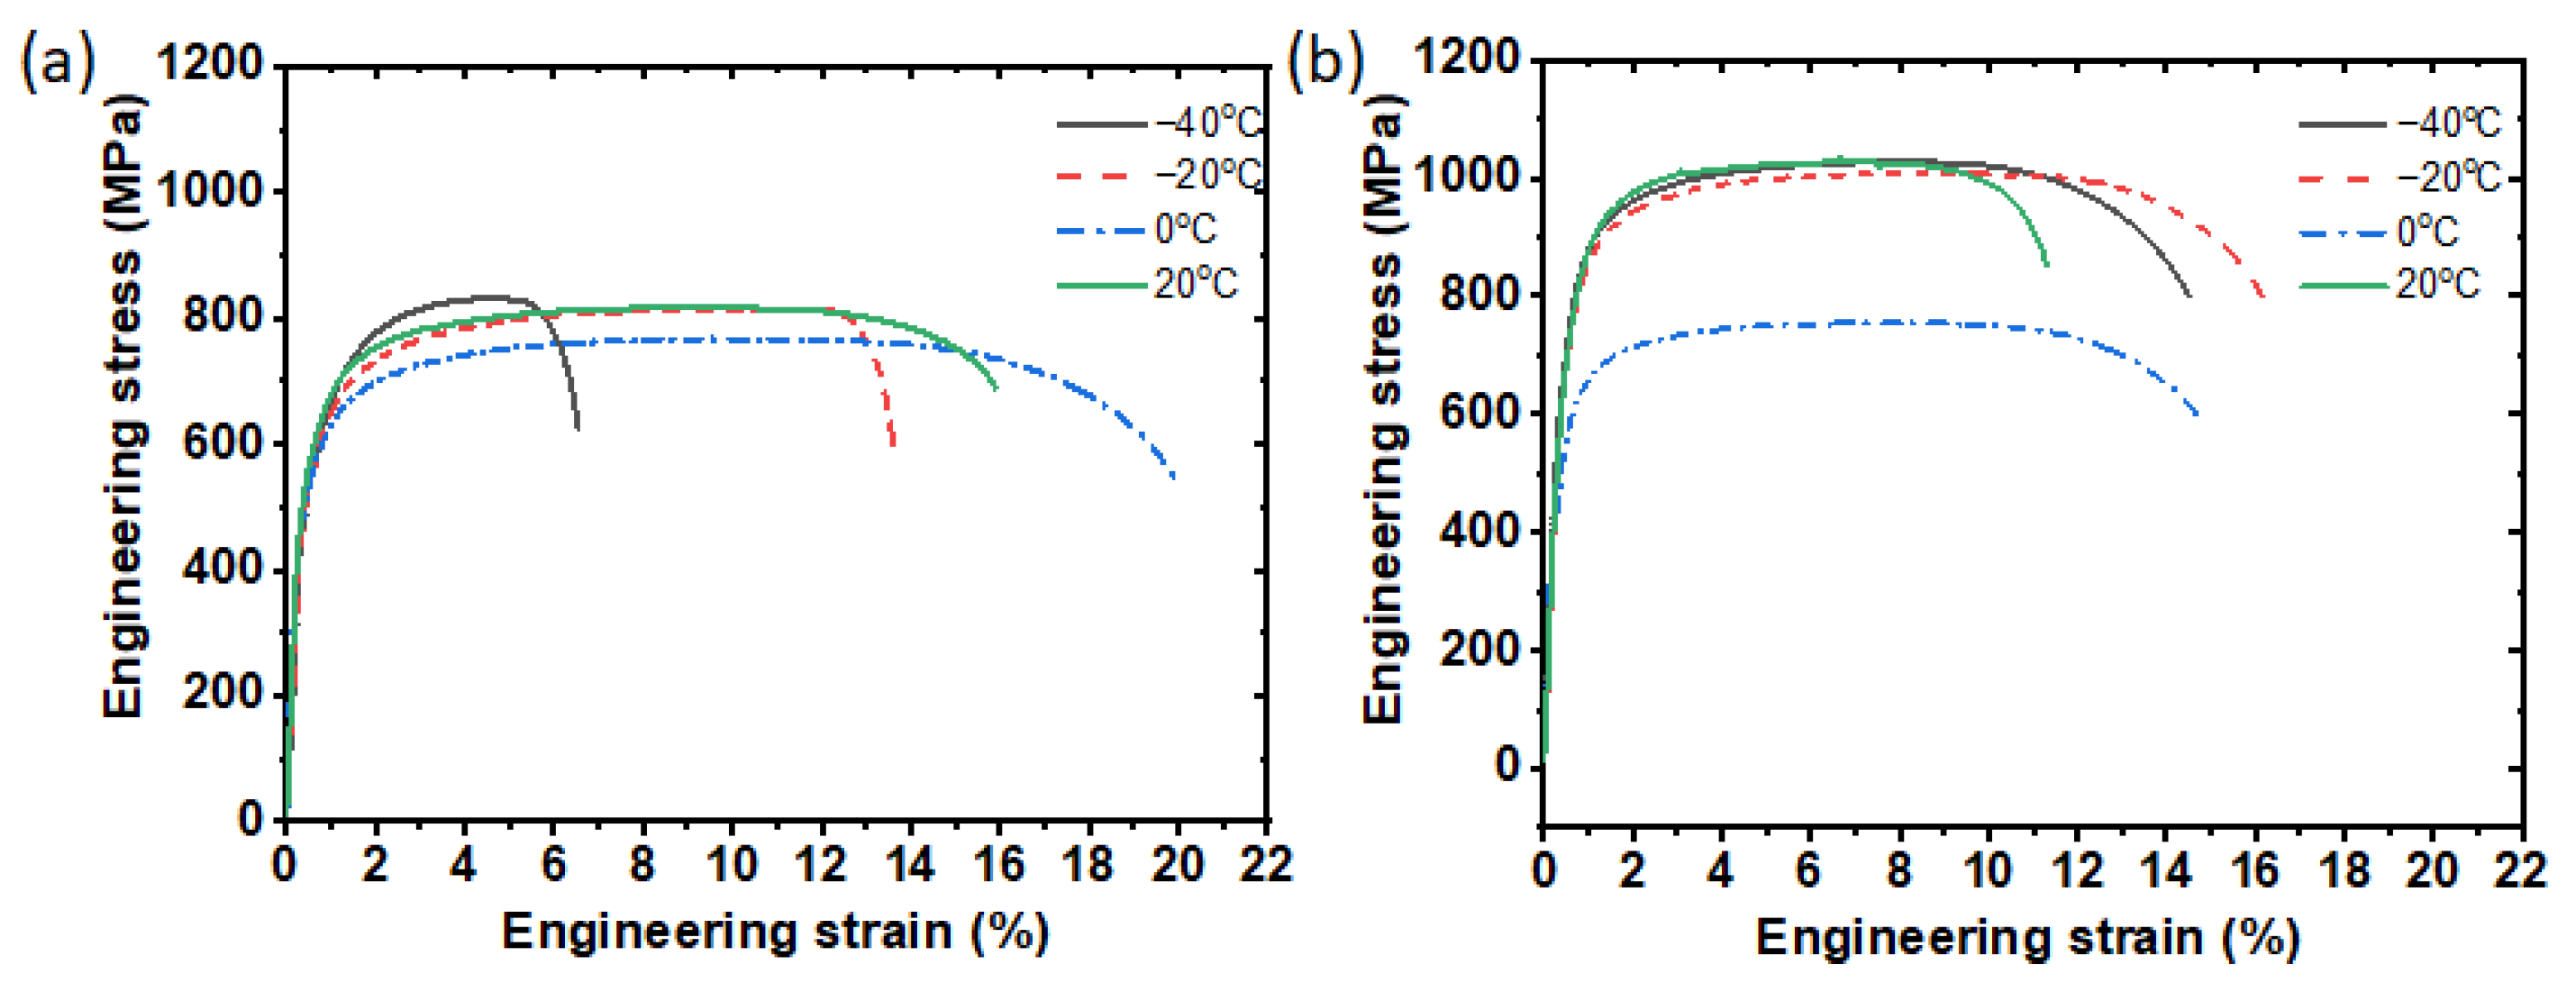
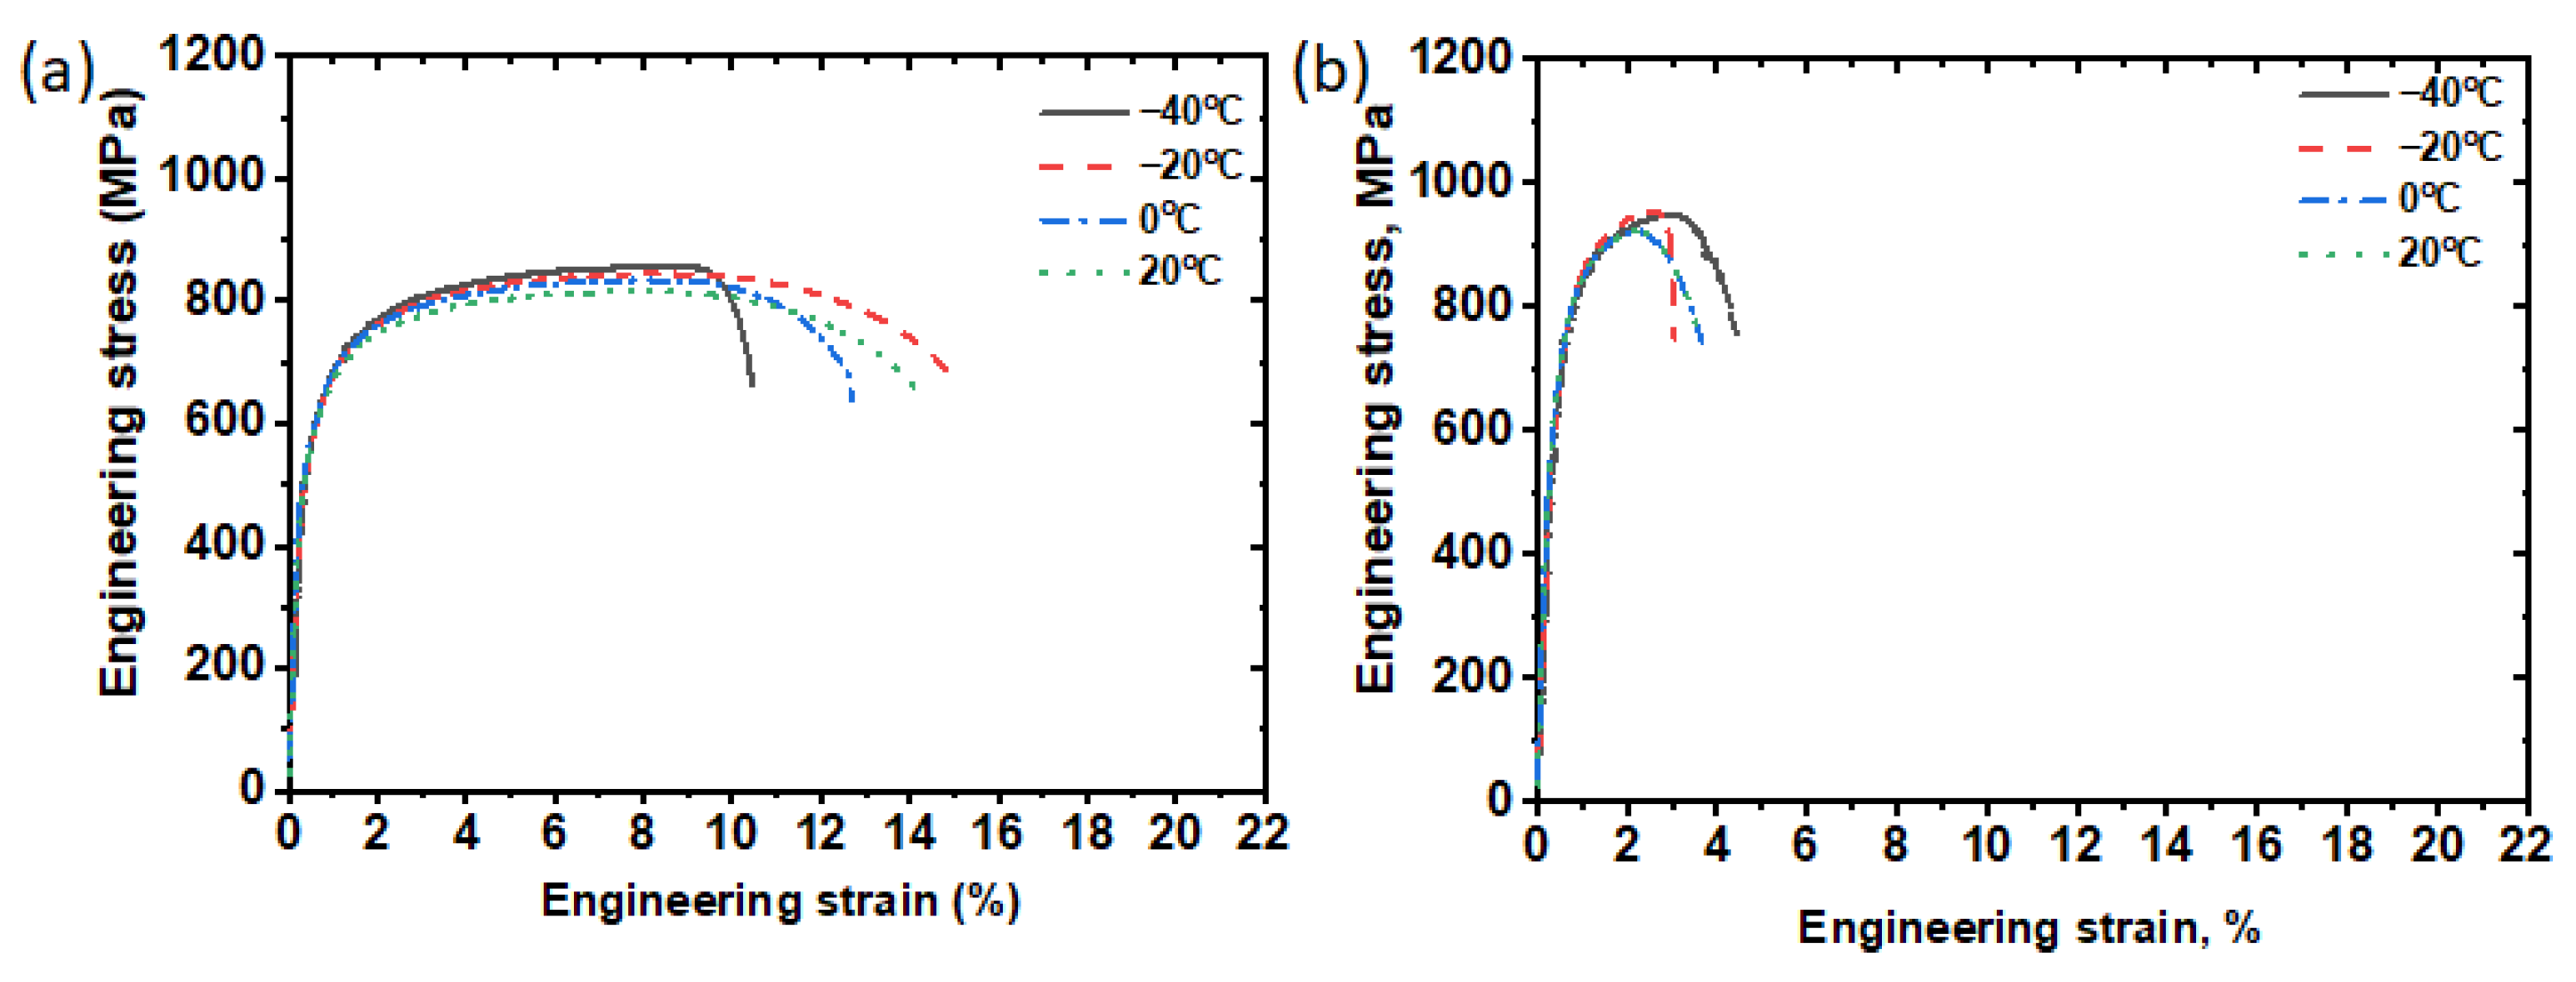
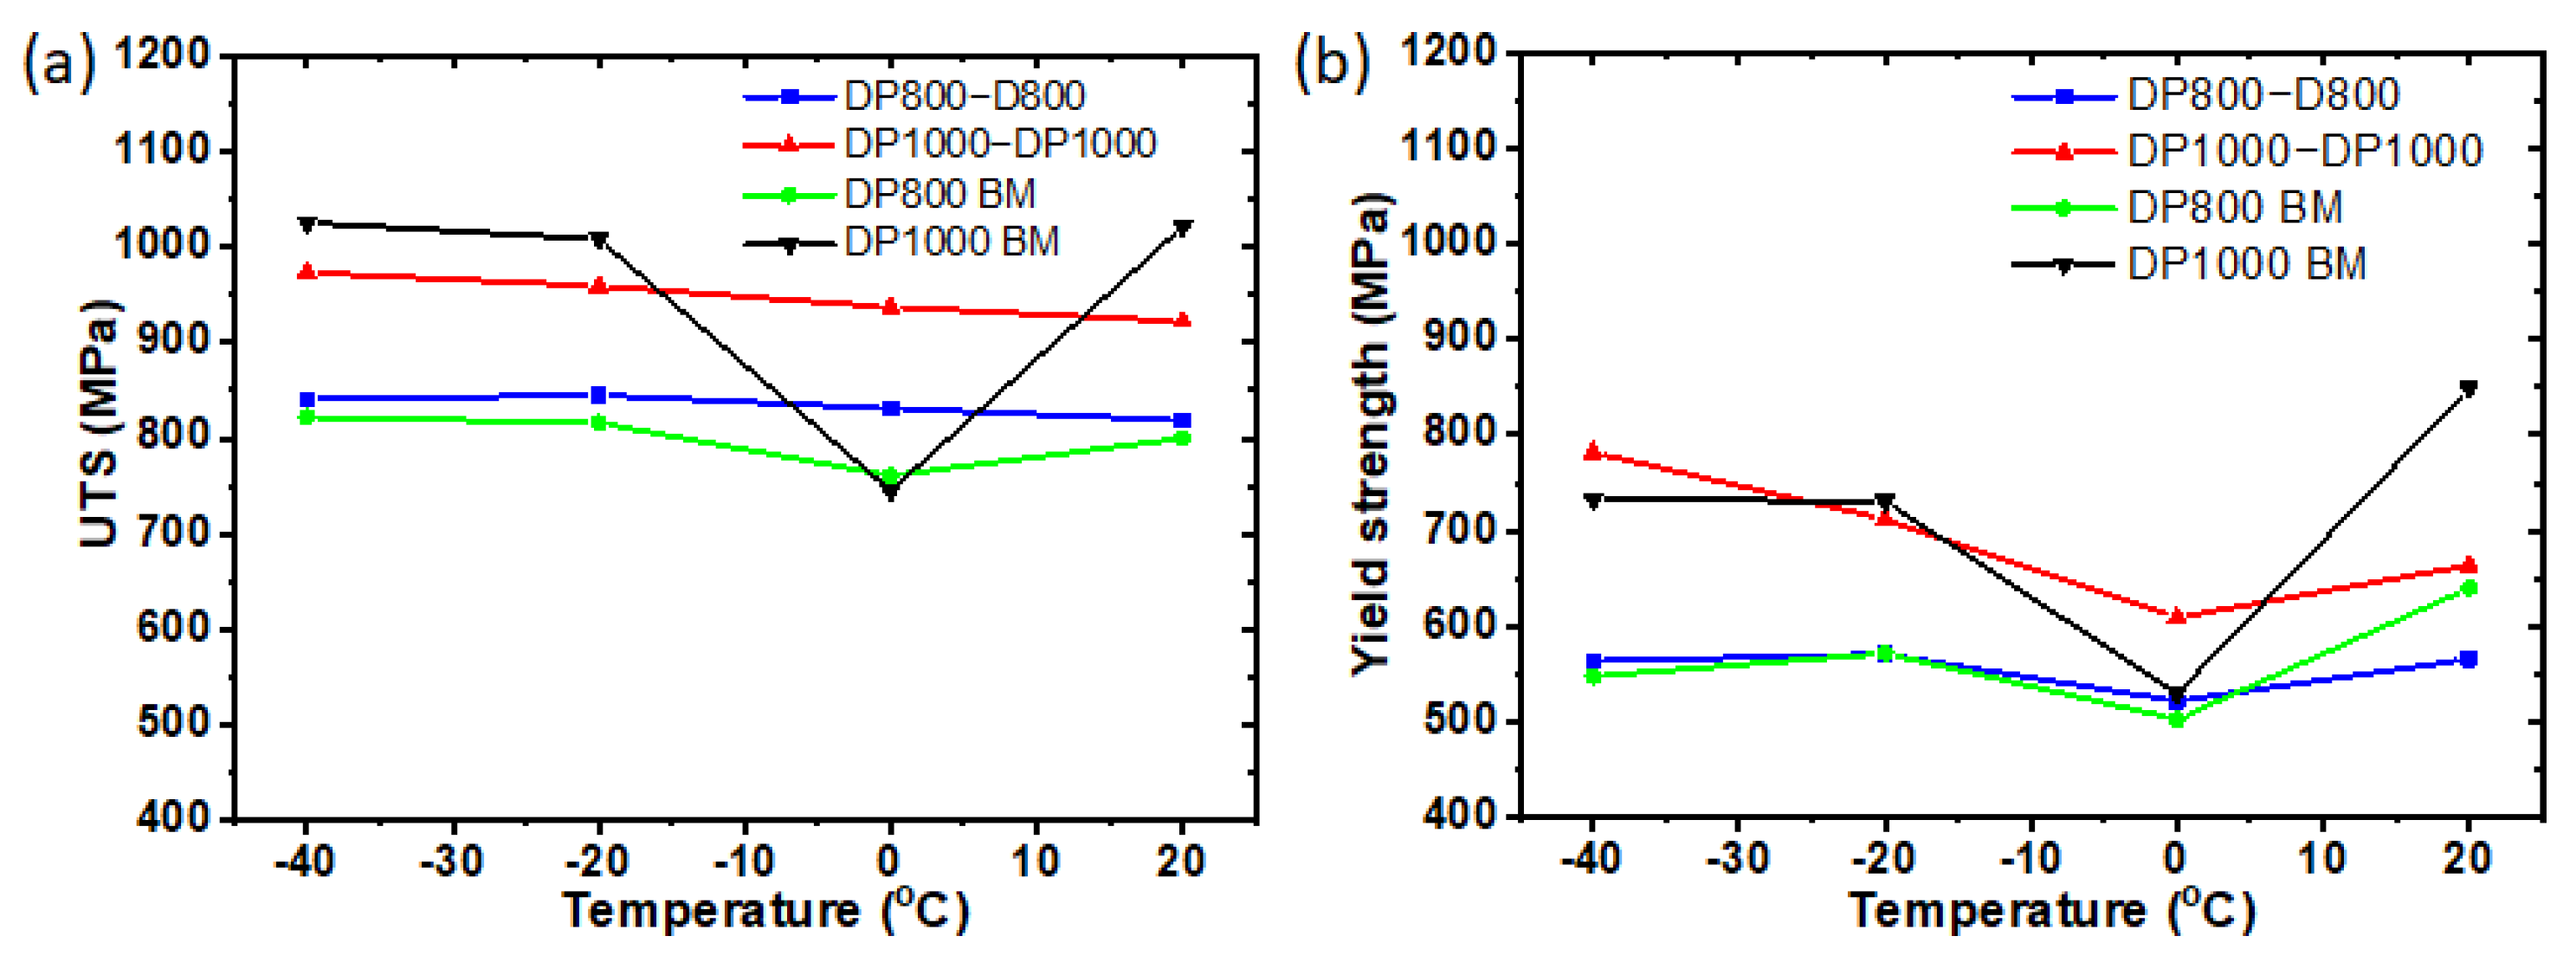
3.3. Tensile Properties
3.4. Work Hardening Behaviour
3.5. Fractography
4. Conclusions
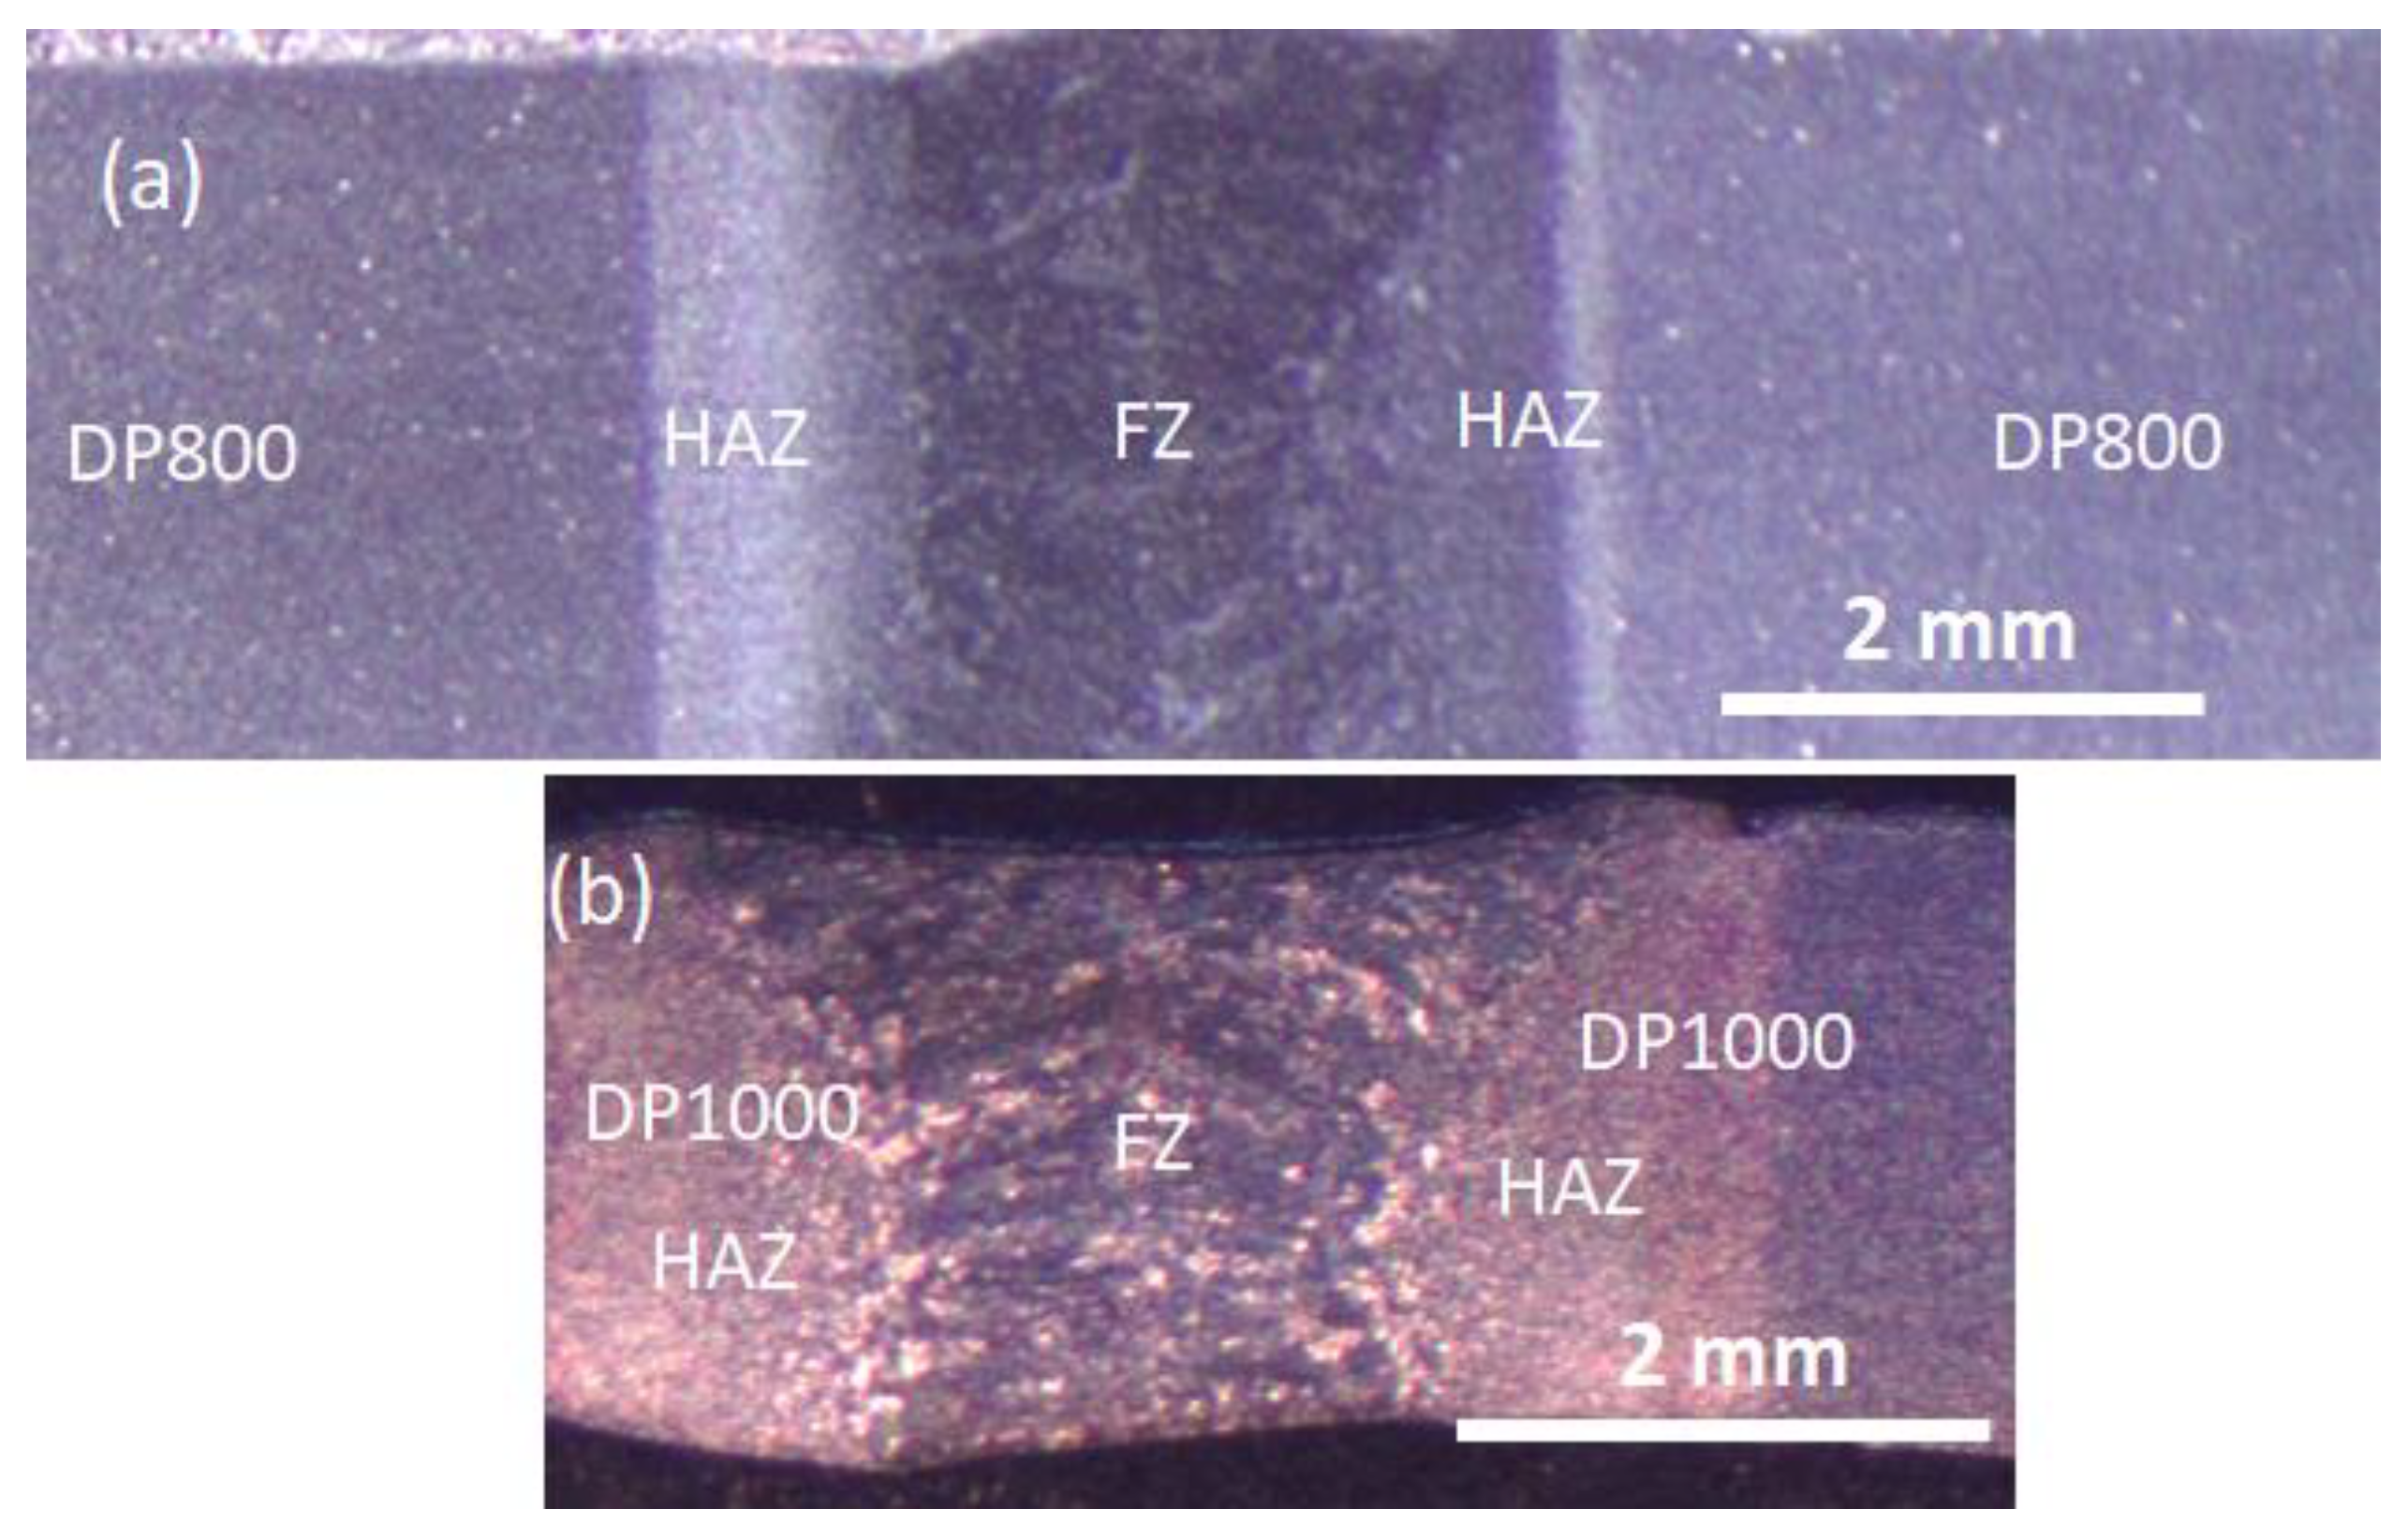
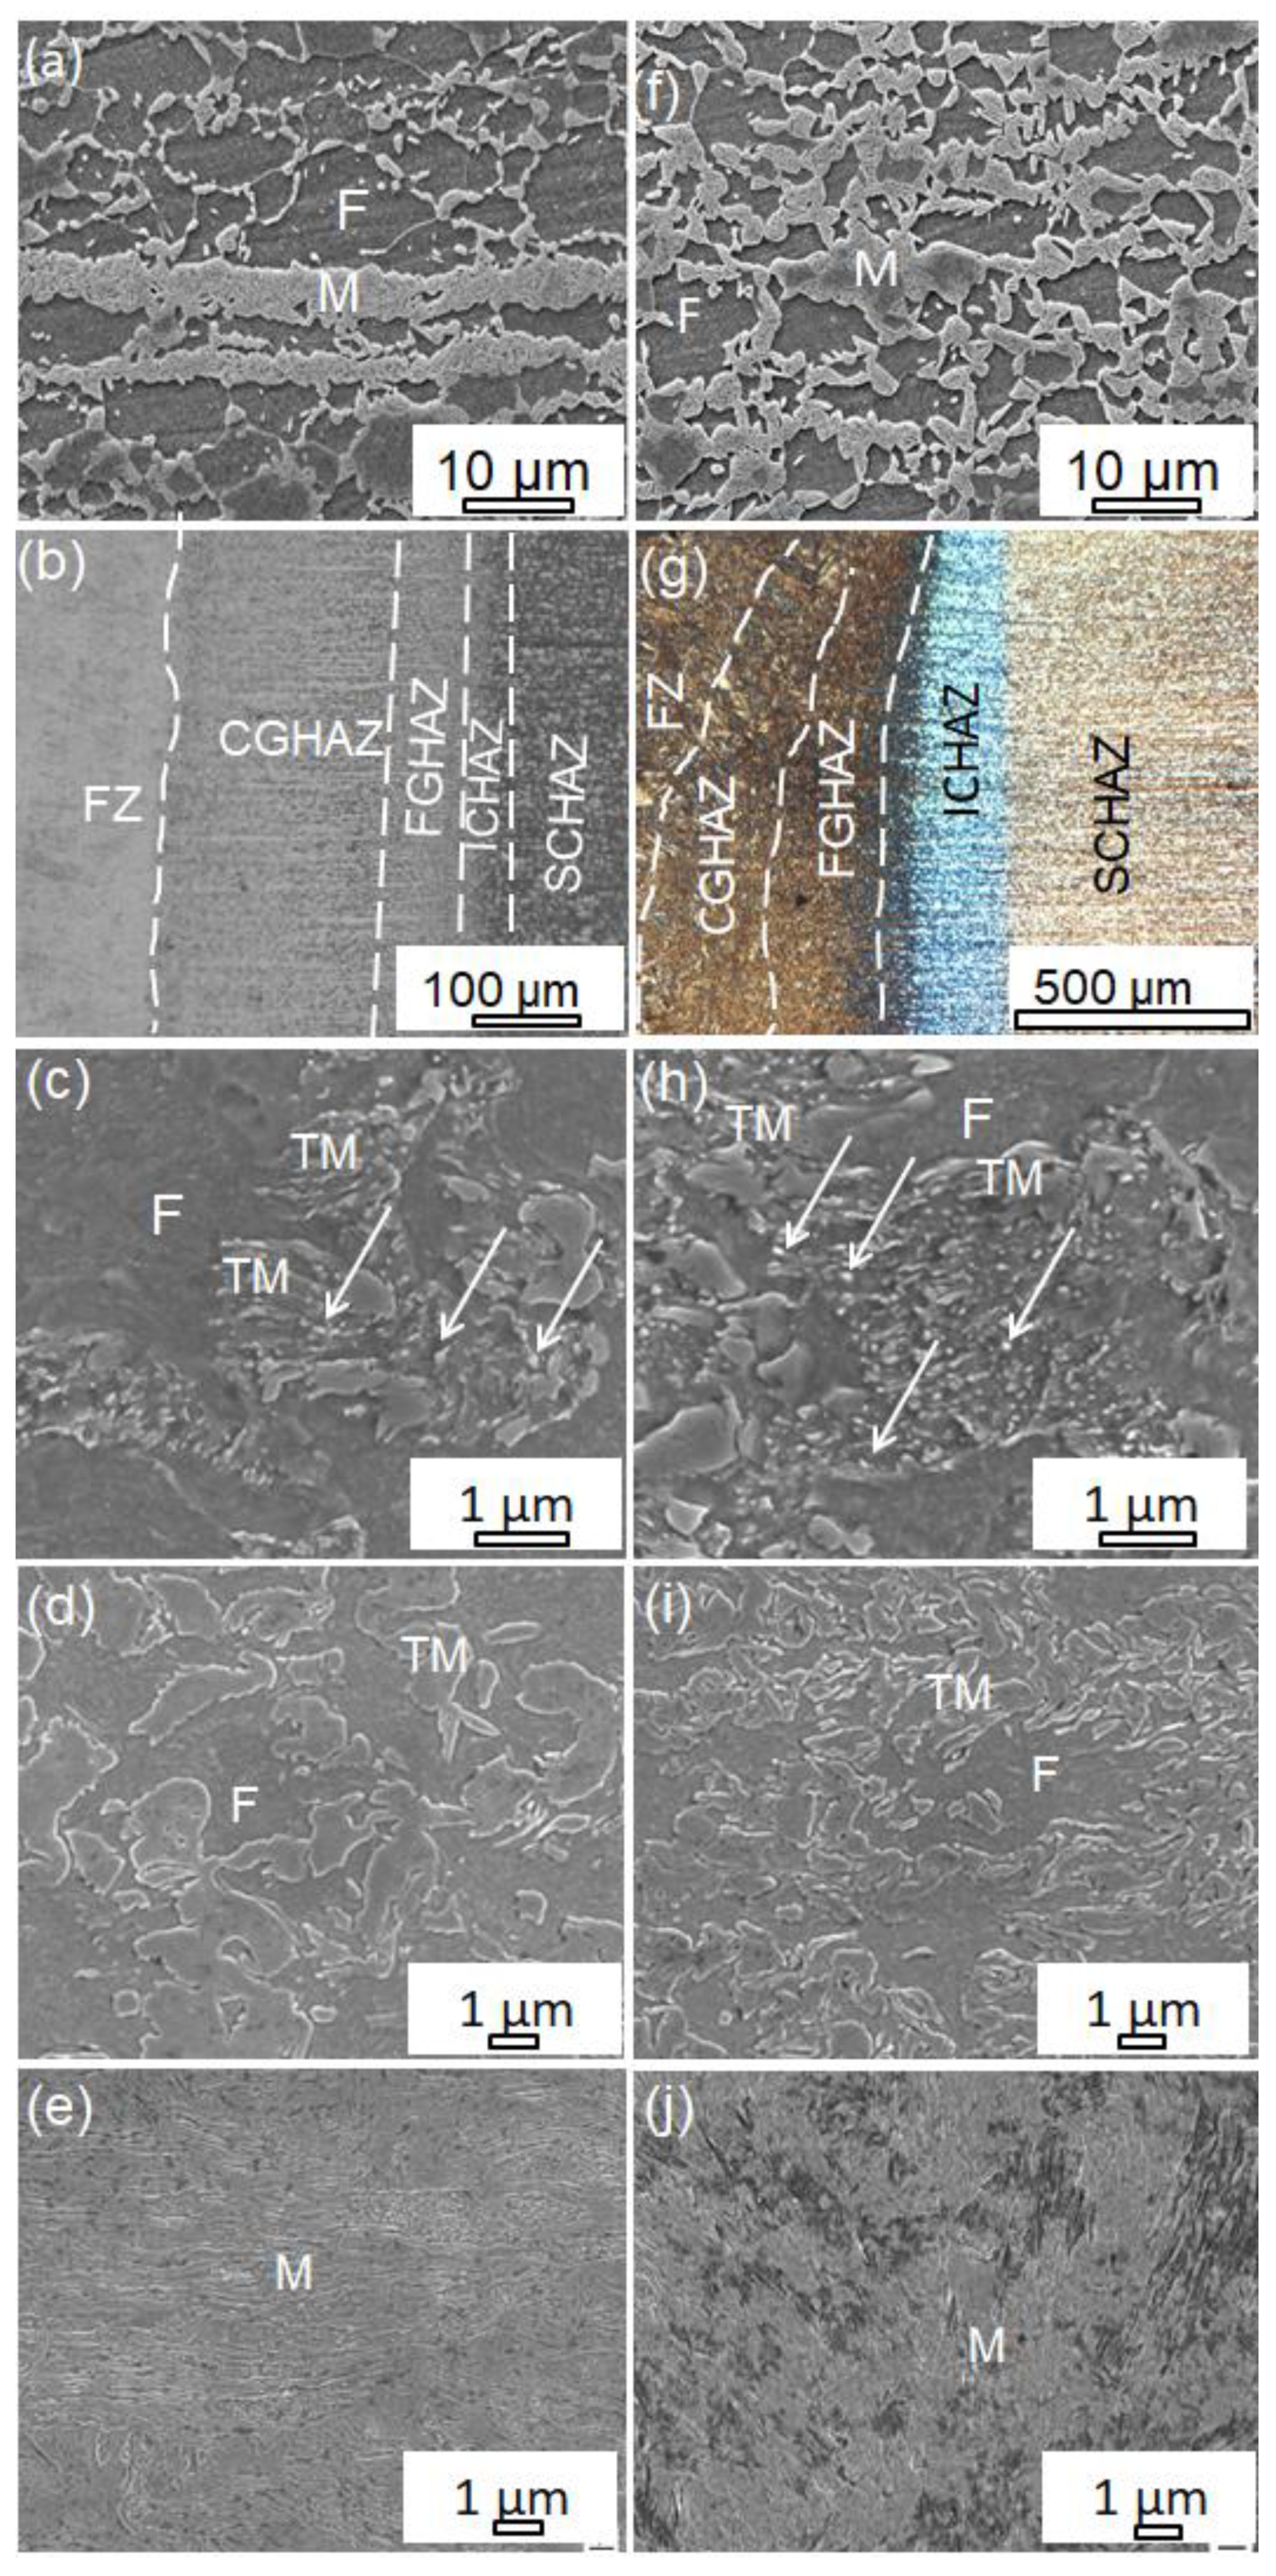
- DP800 and DP1000 were joined using Nd:YAG laser welding. The results showed that the fusion zone (FZ) consisted of a full martensitic structure compared to the base metals due to fast cooling associated with laser welding, resulting in a significant FZ hardness. However, softening was observed in the HAZ of the welded joints which was correlated to the partial disappearance and tempering of the pre-existing martensite in the base metal microstructures. The degree of softening and the width of the softened region were higher in the DP1000-welded joints than in the welded DP800 joints.
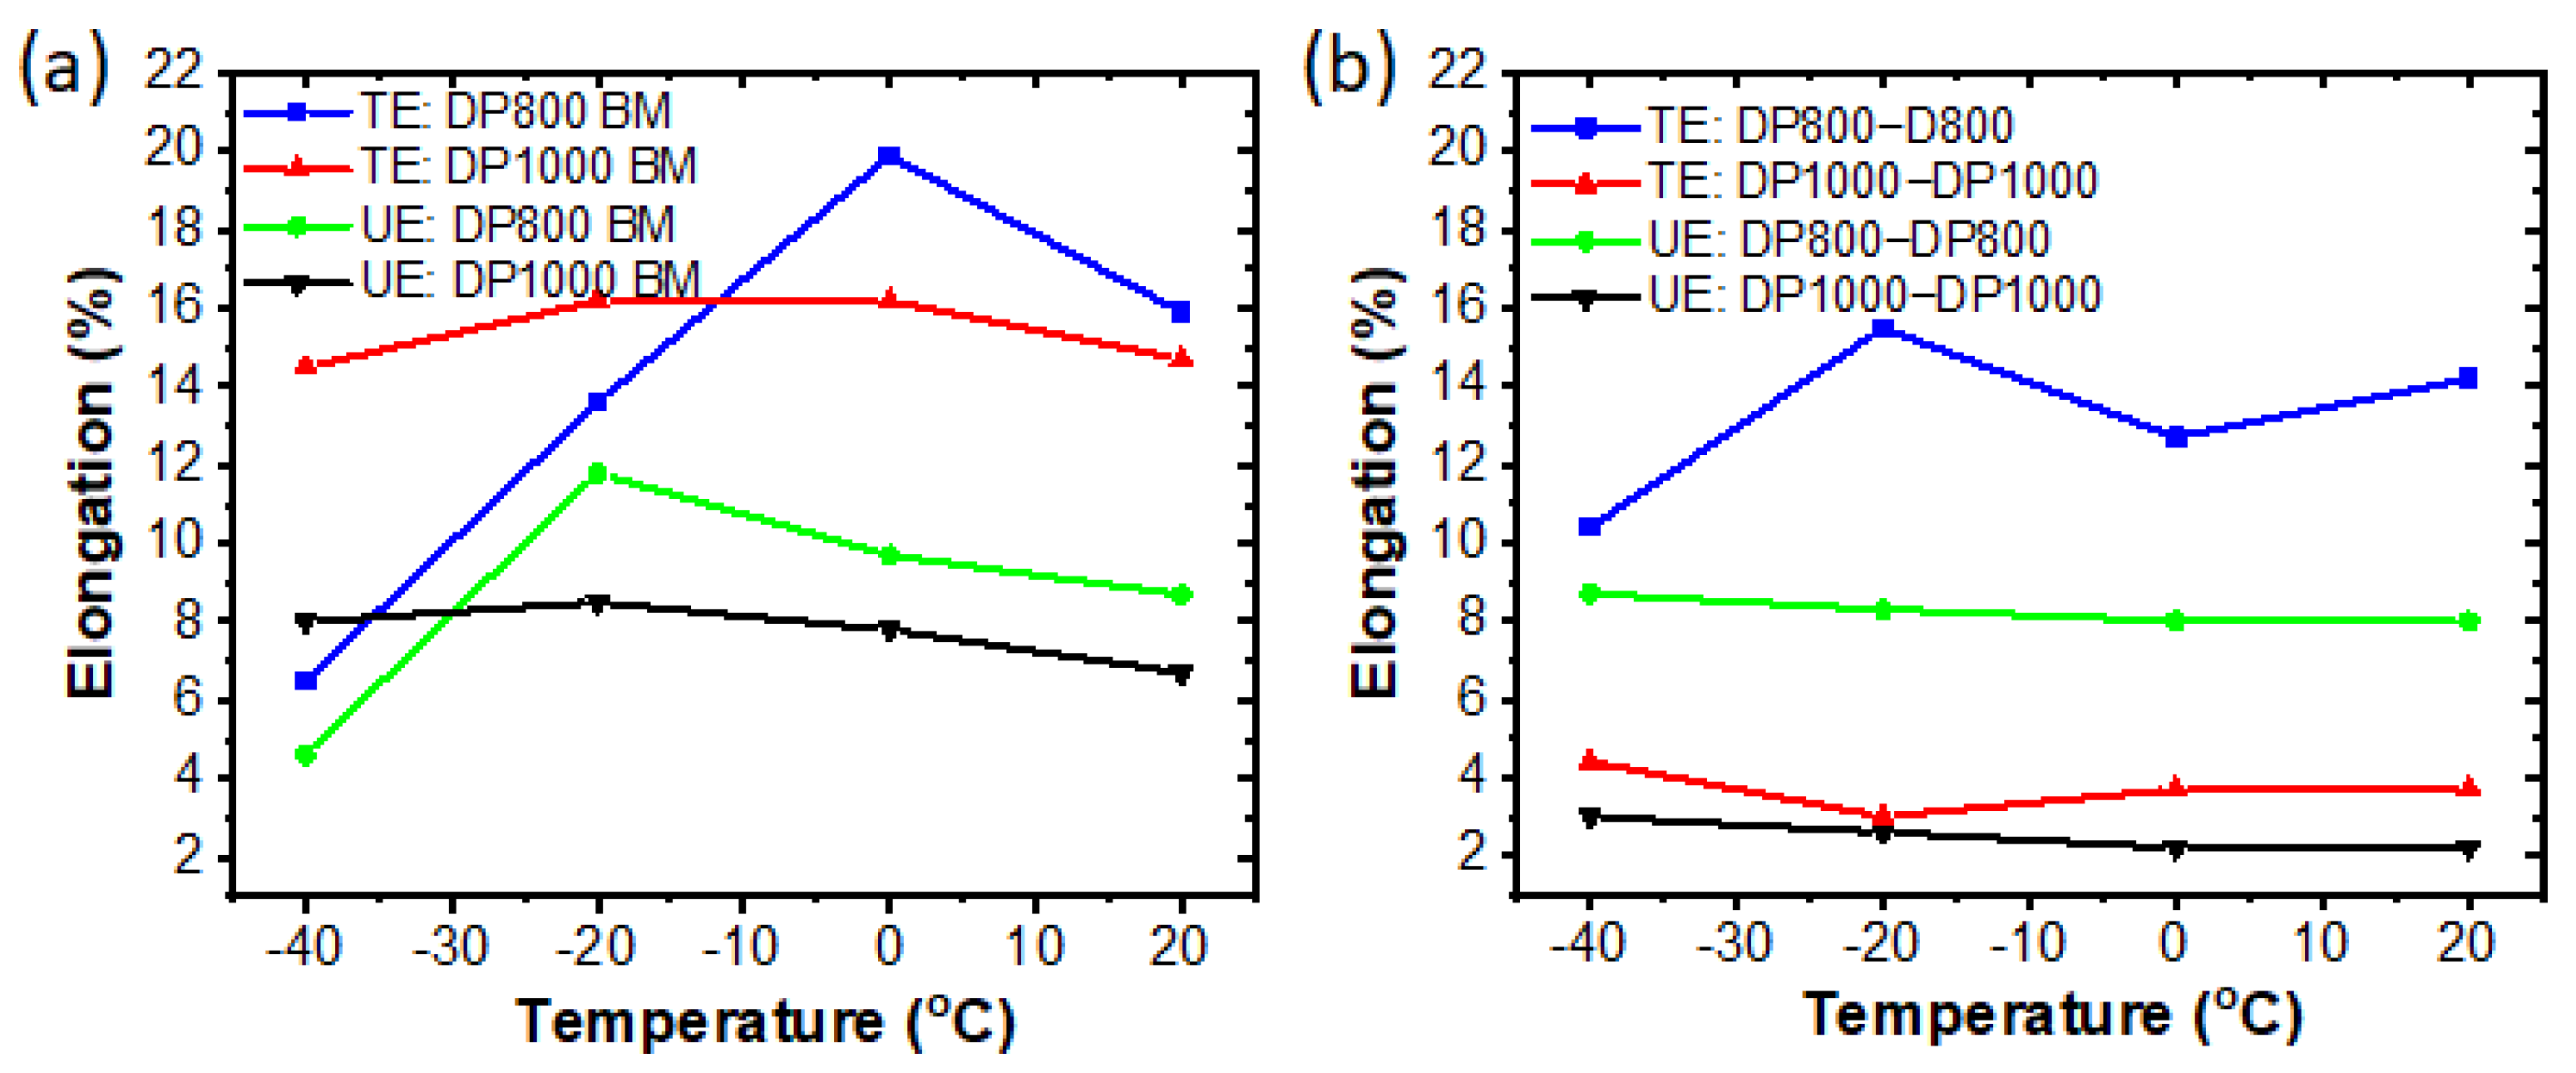
- The UTS of welded DP800 and DP1000 increased between 1.5–2.7% and 1.6–5.5%, respectively, and work-hardening exponent of the welded joints increased slightly while the strain-hardening capacity of the base metals was much higher than those of the welded joints with decreasing temperatures. The welded joints and the base metals demonstrated only stage III strain hardening, with DP800-welded joints exhibited excellent uniform and total elongation ranging between 8.0–8.7% and 10.4–14.2%.
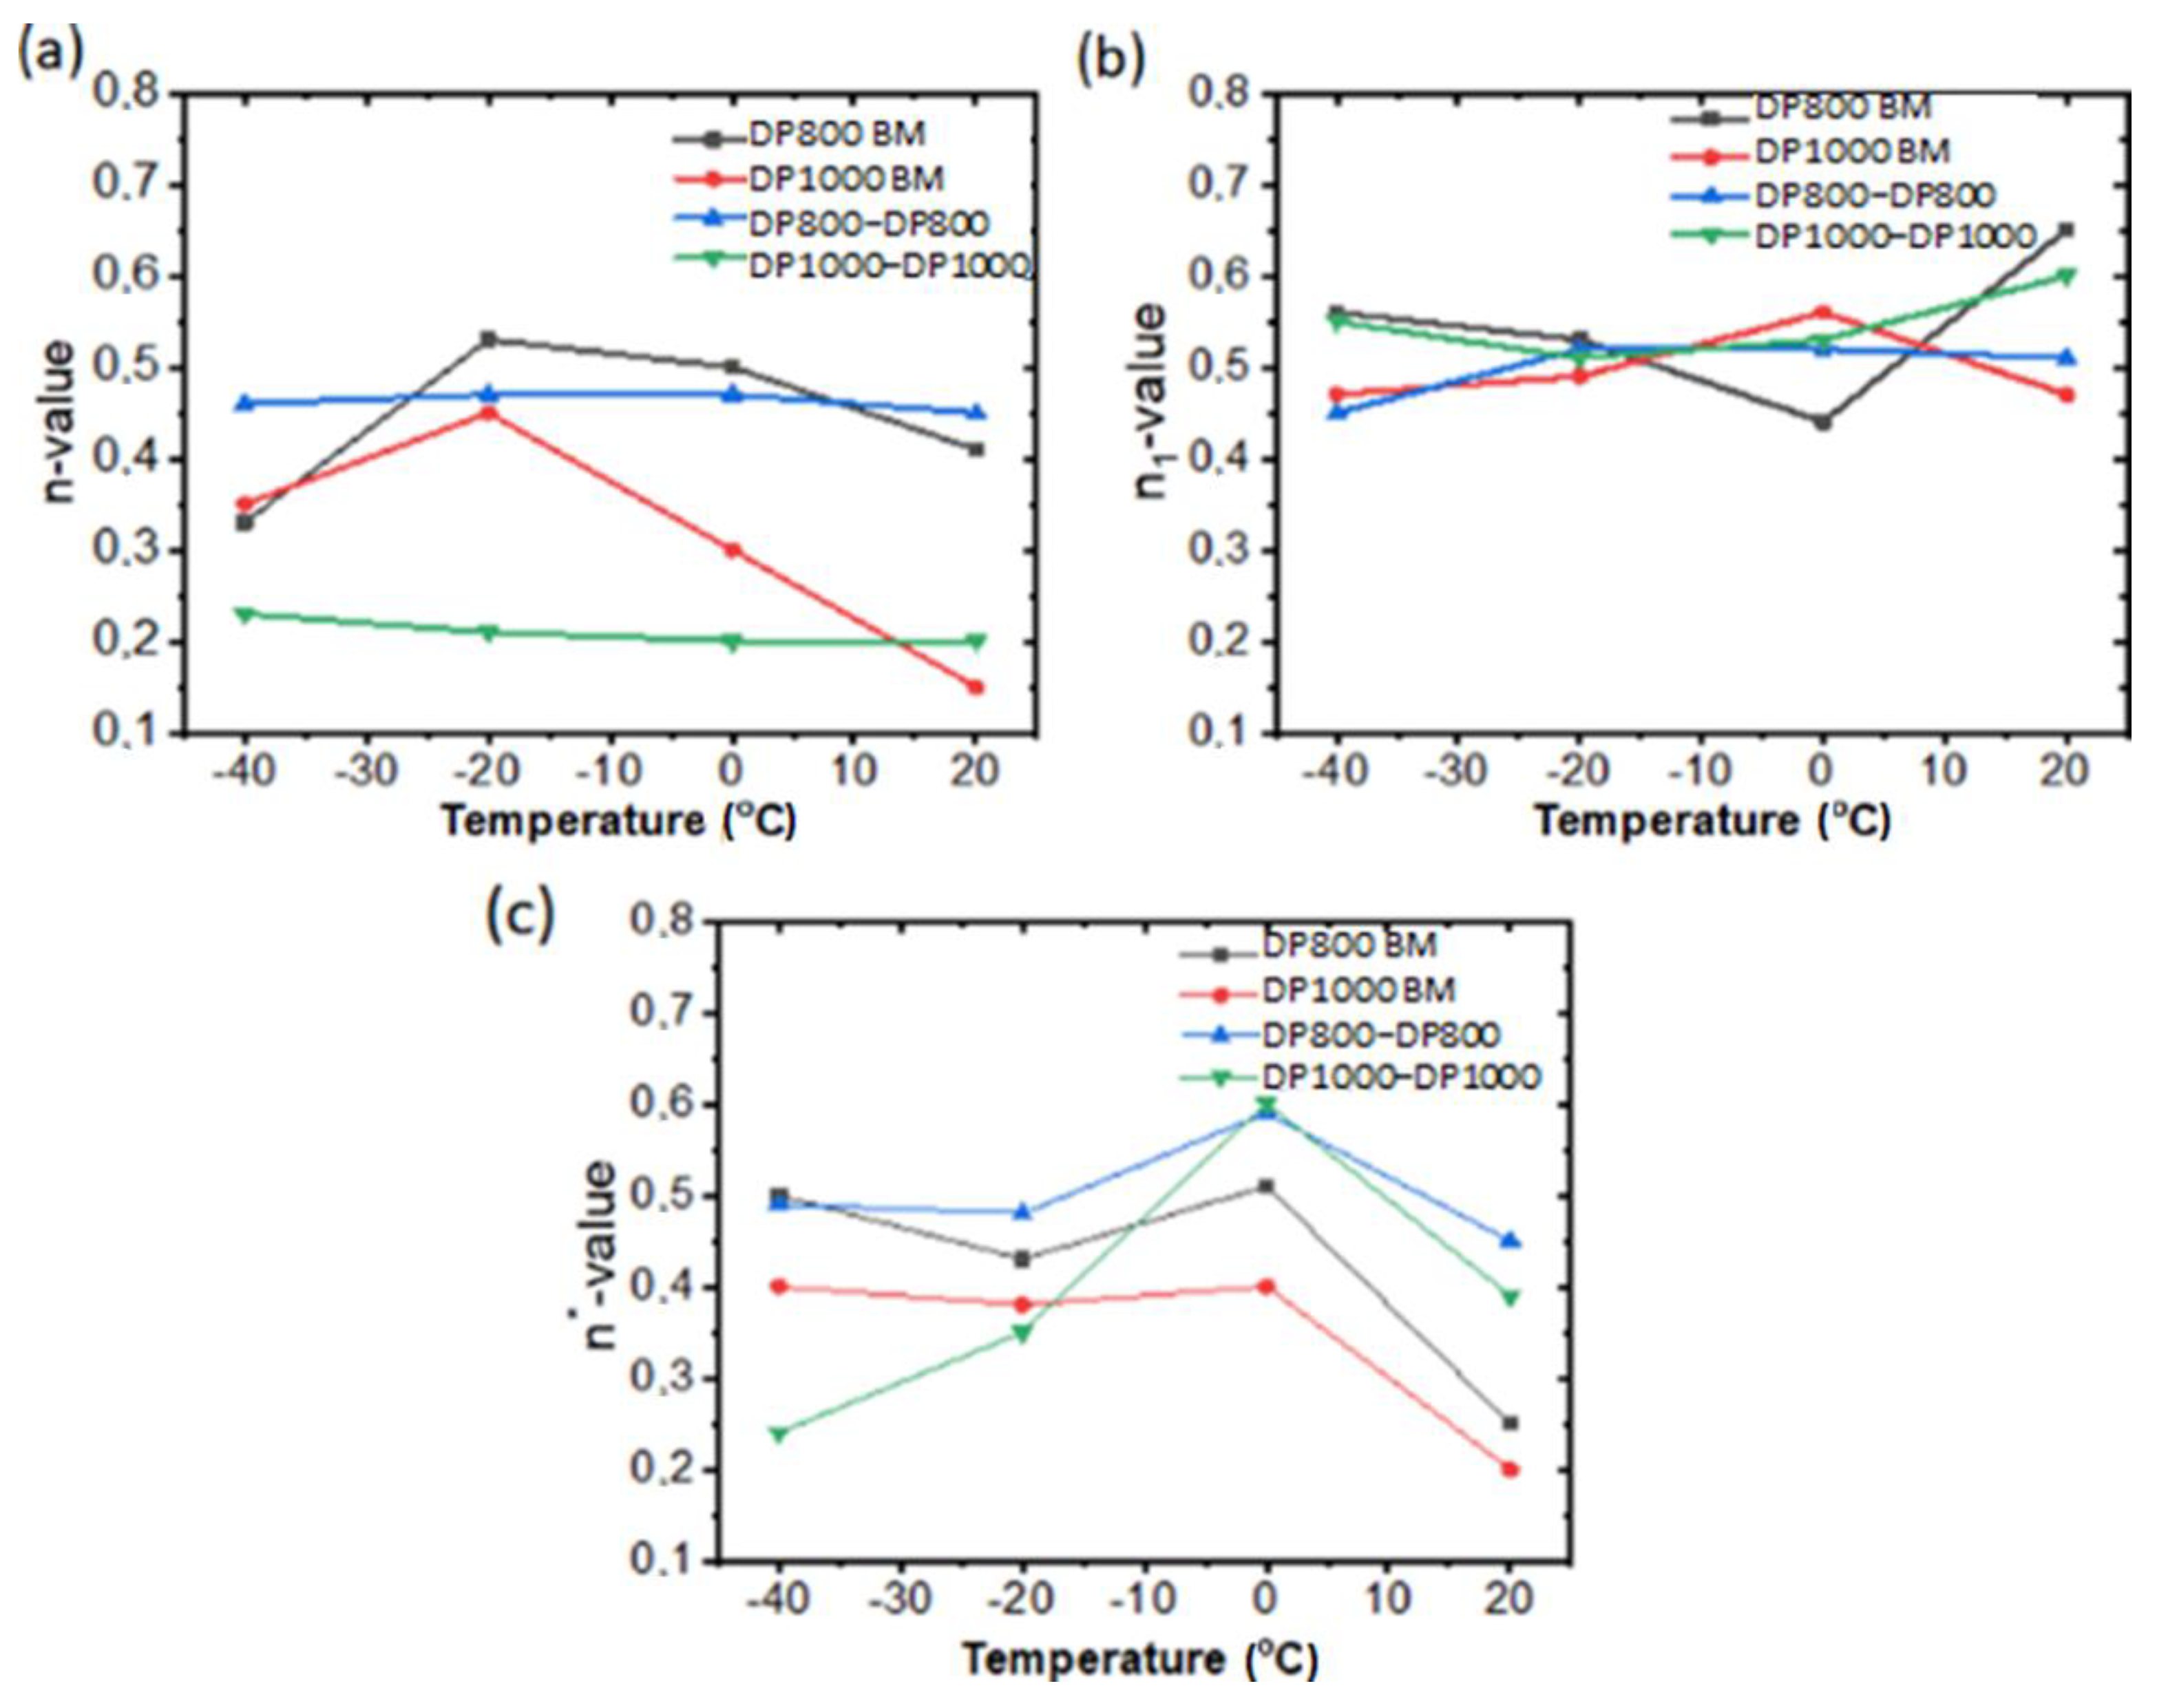
- The n-values of DP800-welded joints were remarkably higher compared to that of DP1000-welded joints. Further, the DP800-welded joints showed a slightly higher n-value at 20 °C compared to the DP800 base metal due to HAZ softening in the welded joint.
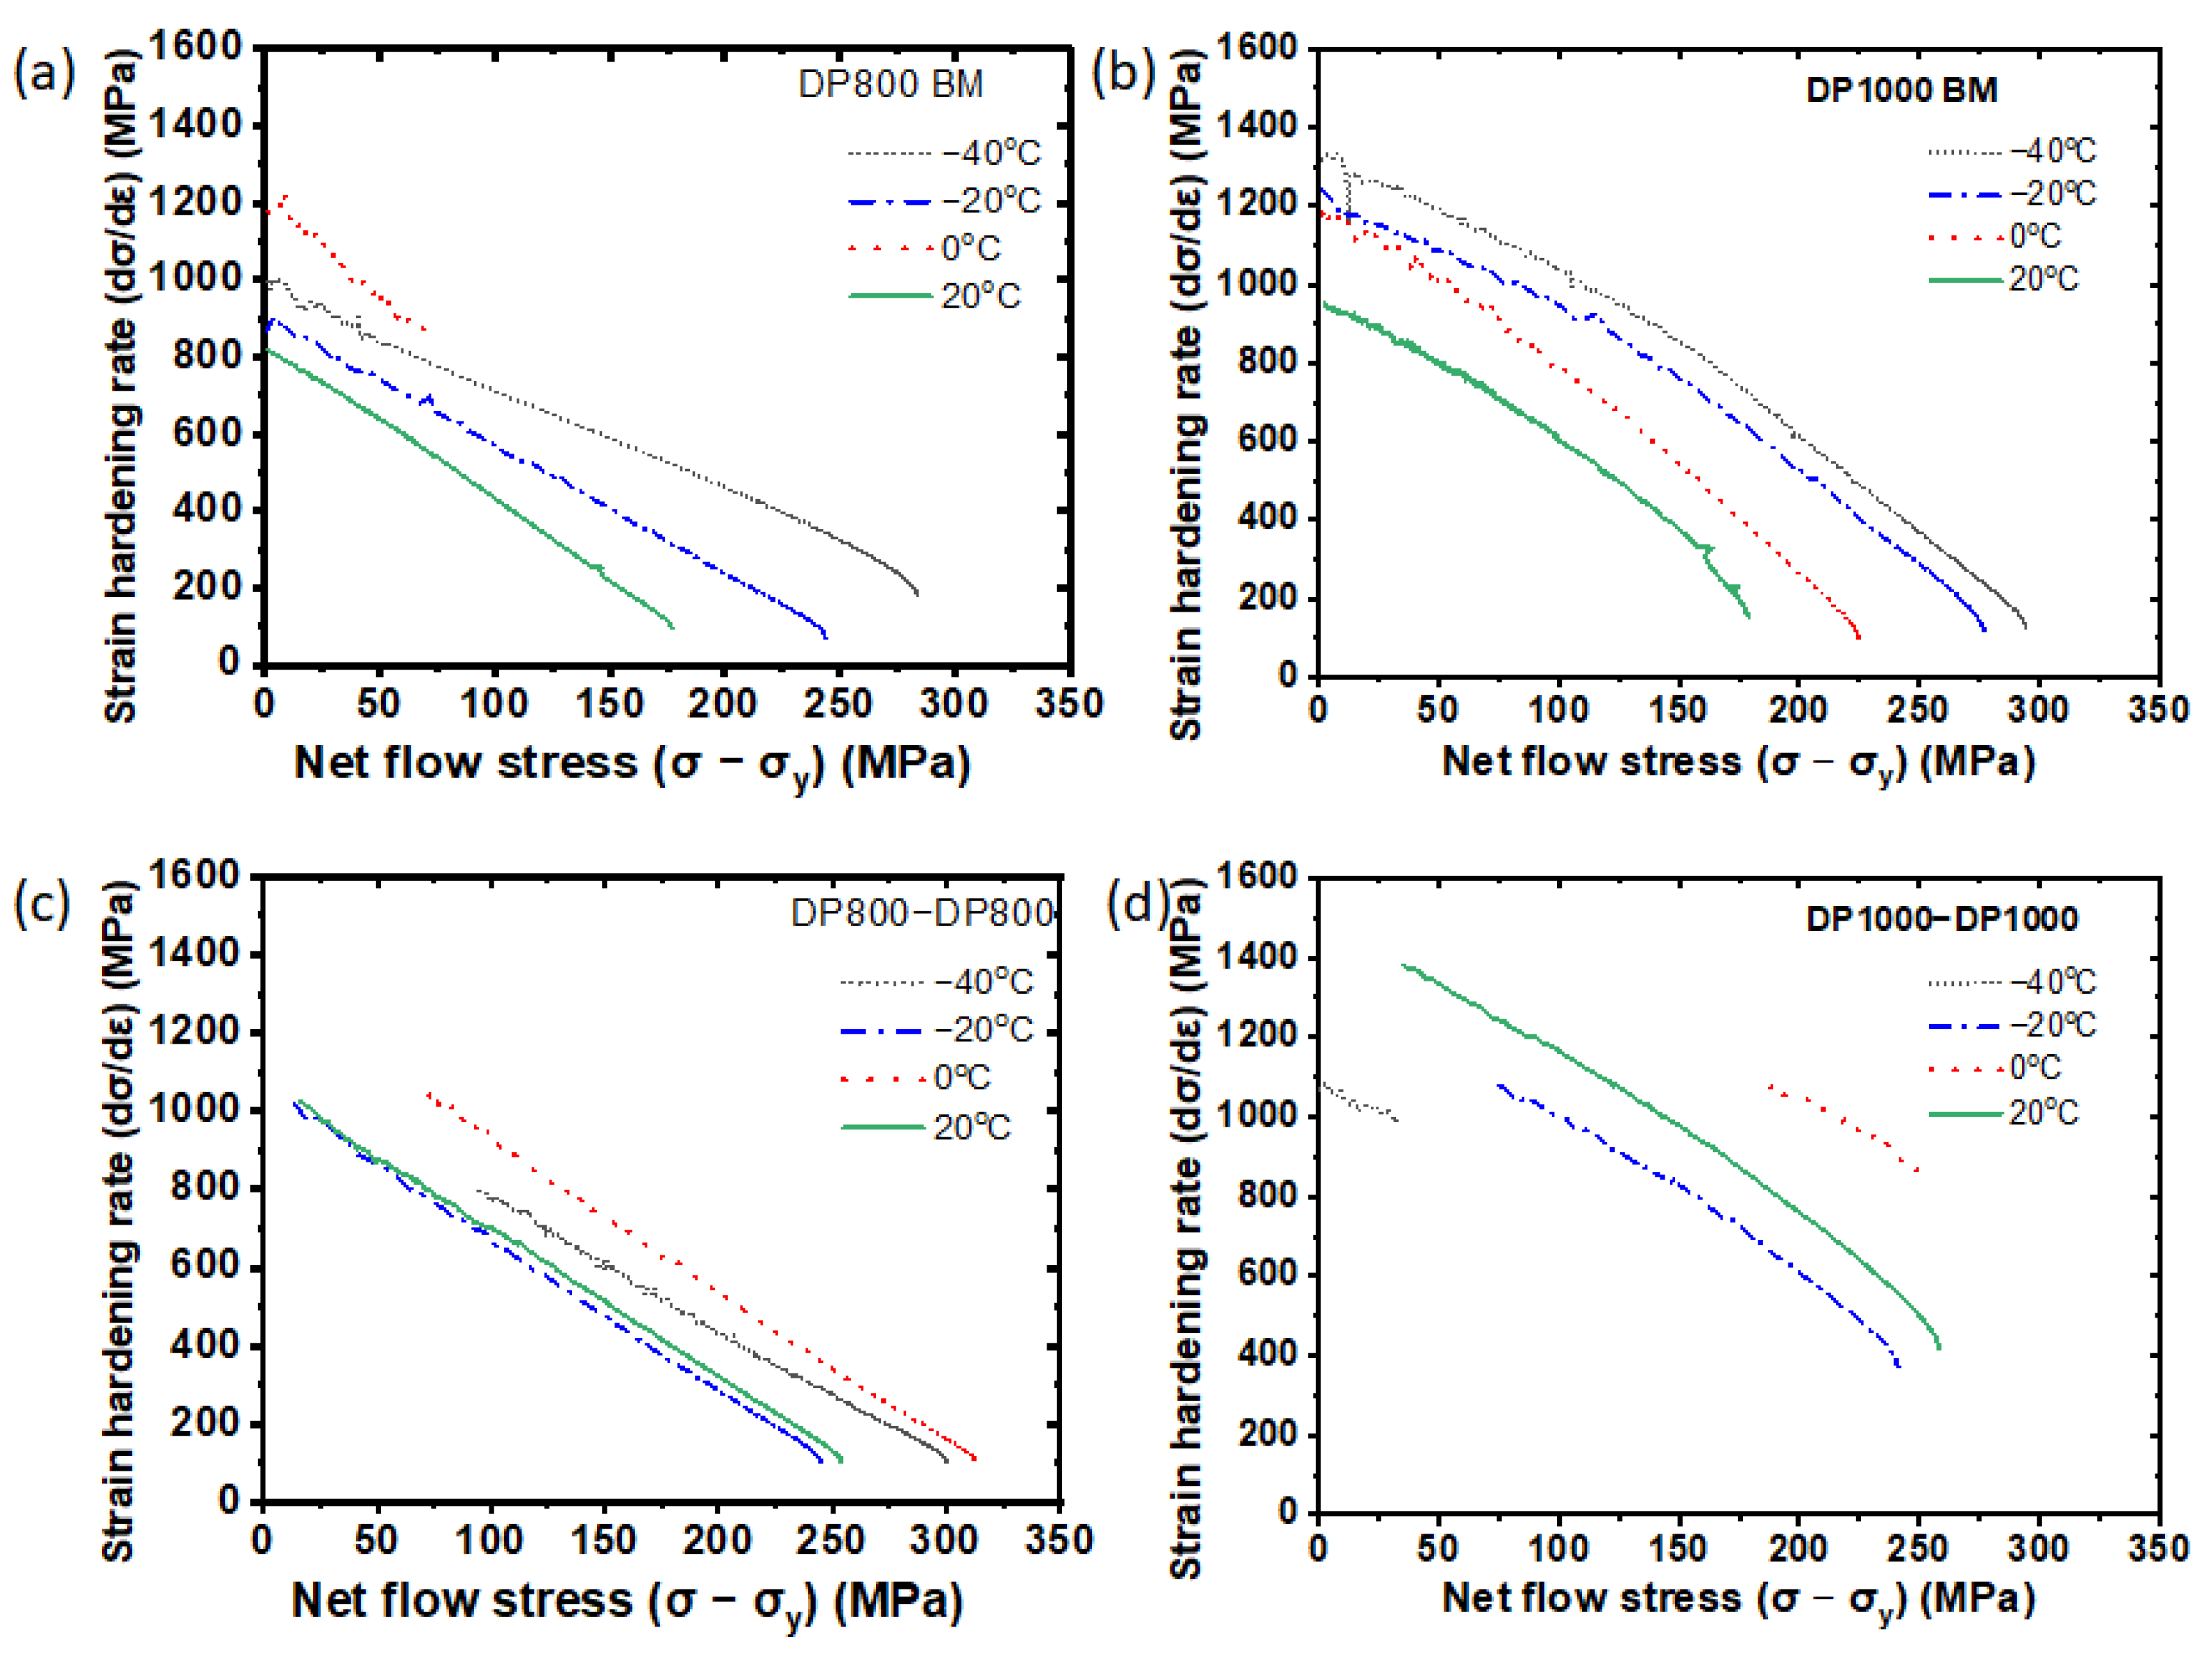
- The welded joints of DP1000-DP10000 steel exhibited a higher work hardening rate when compared to that of DP800-DP800-welded joints. The highest and lowest strain hardening rate for DP800-DP800 joints occurred at 0 °C and −20 °C, respectively. In contrast, DP1000-DP1000 showed the highest hardening rate at 0 °C and the minimum work hardening at −20 °C.
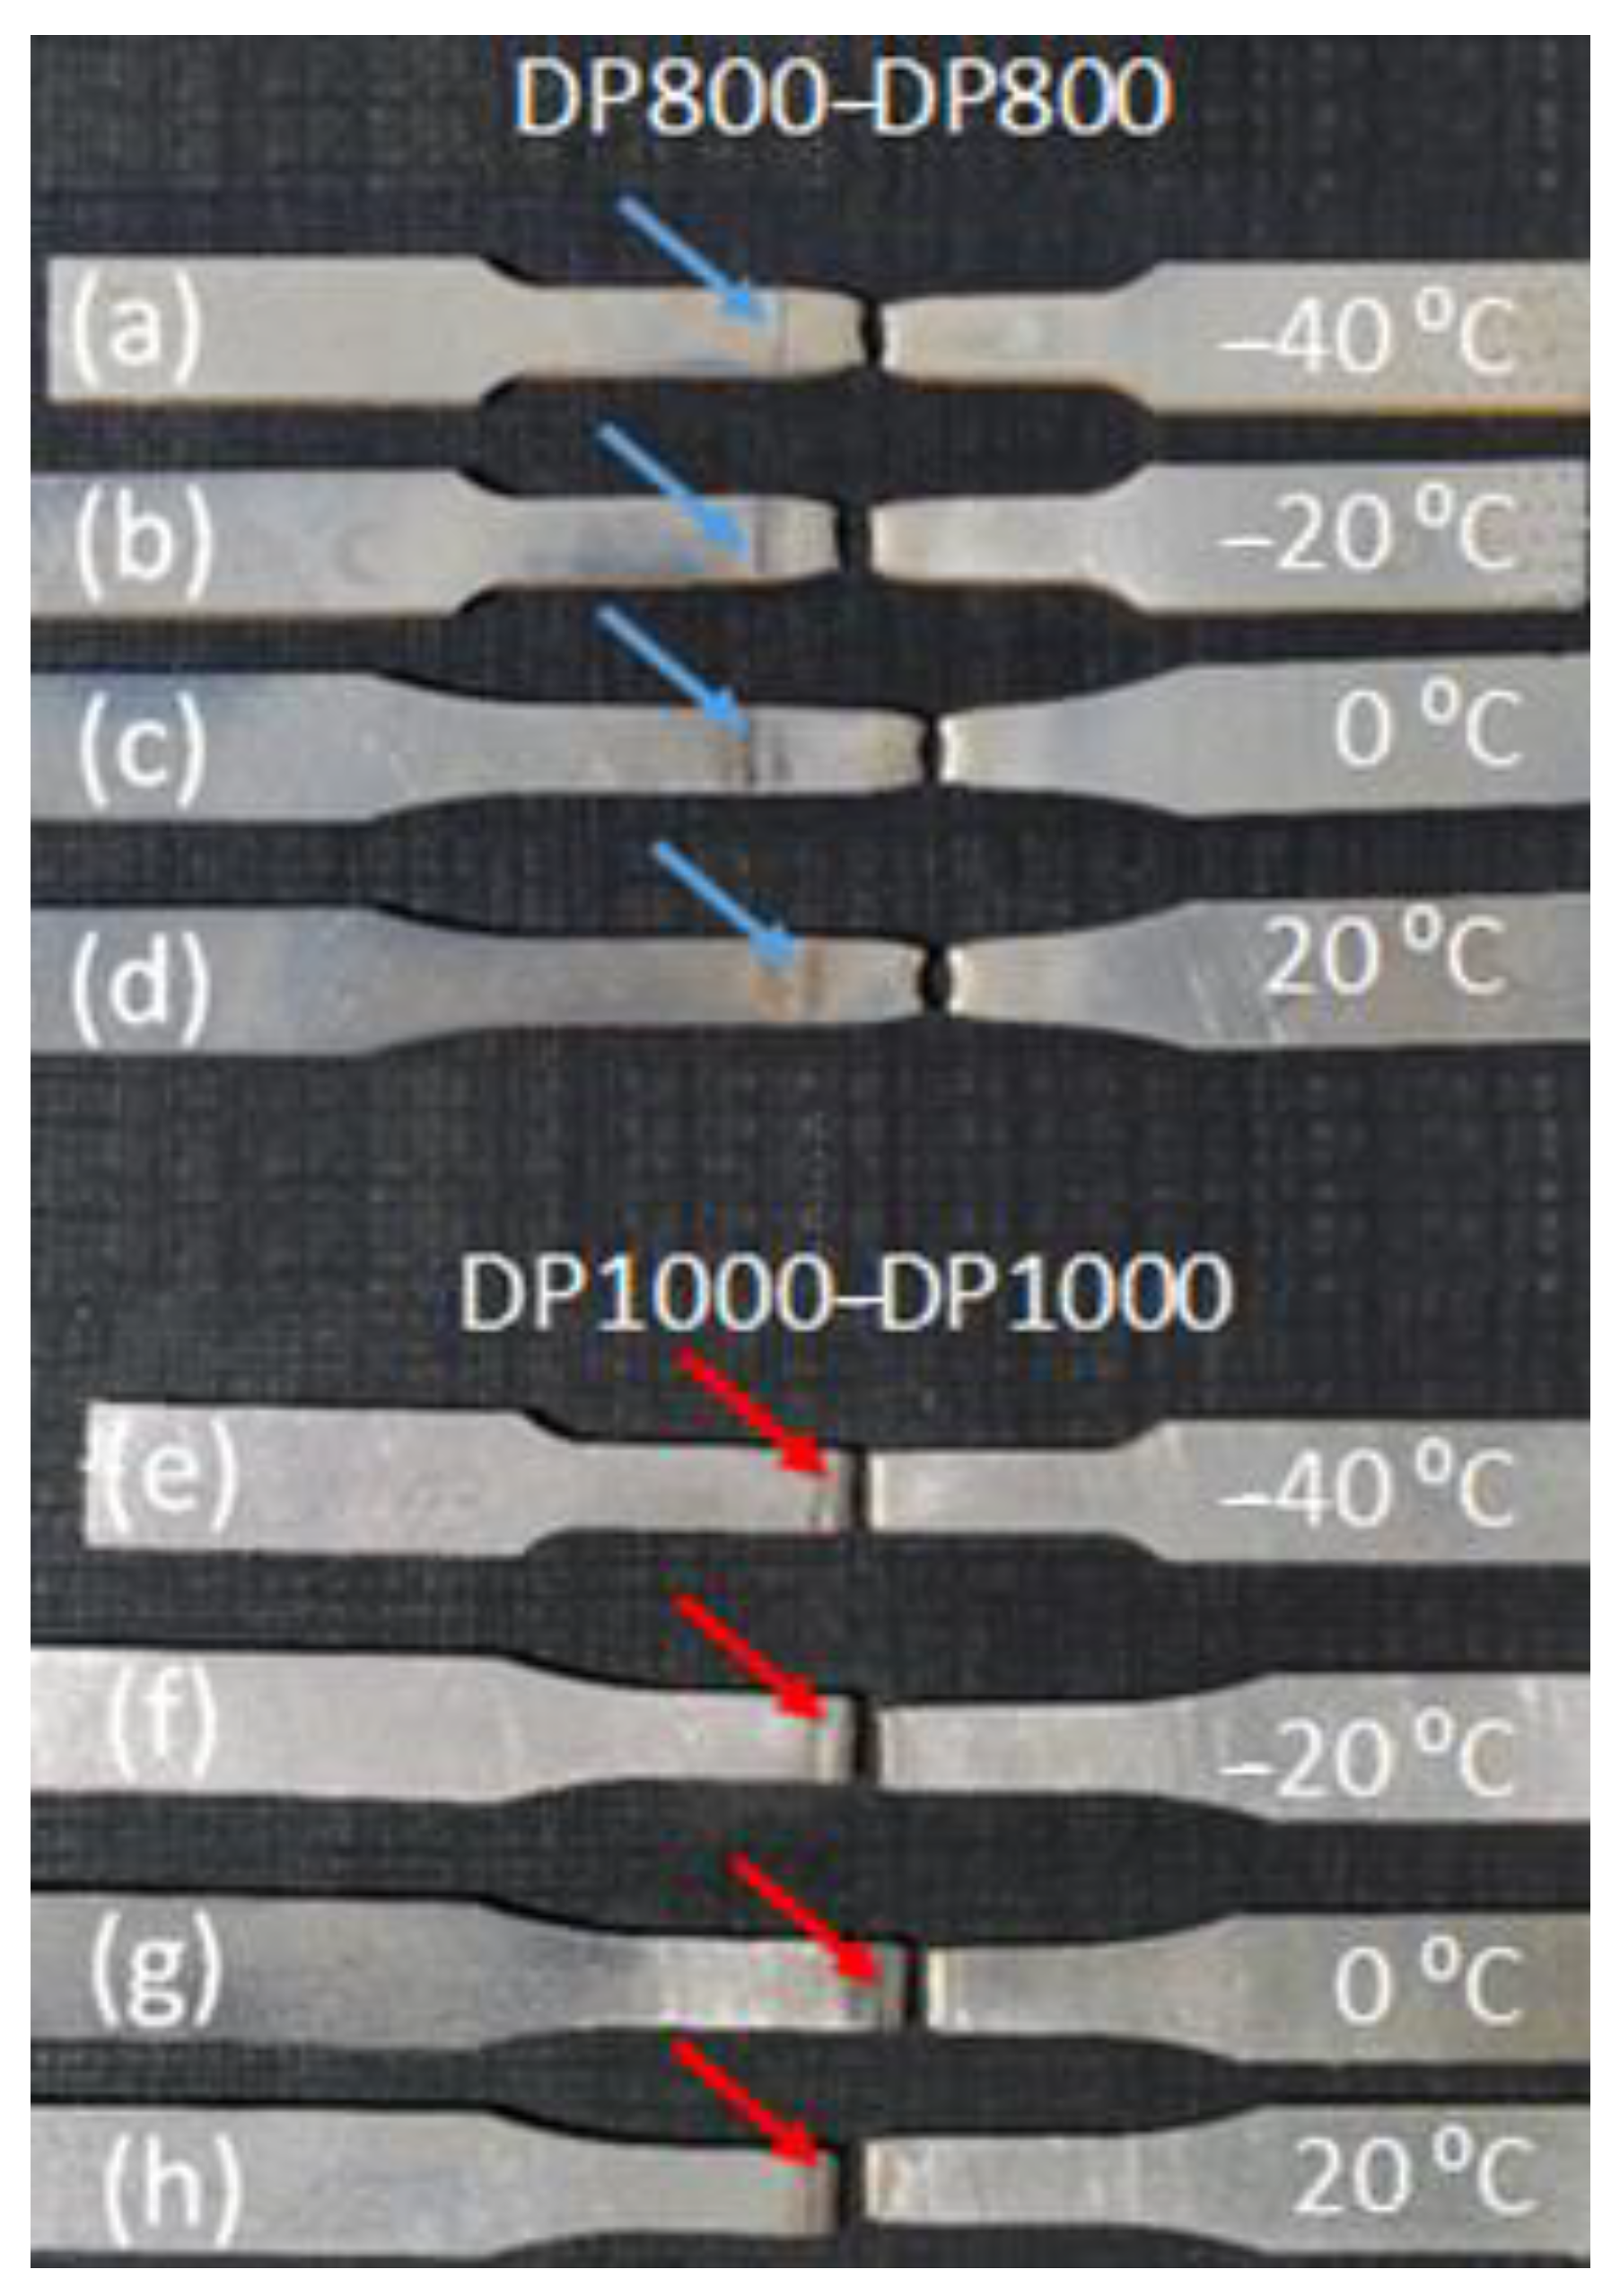
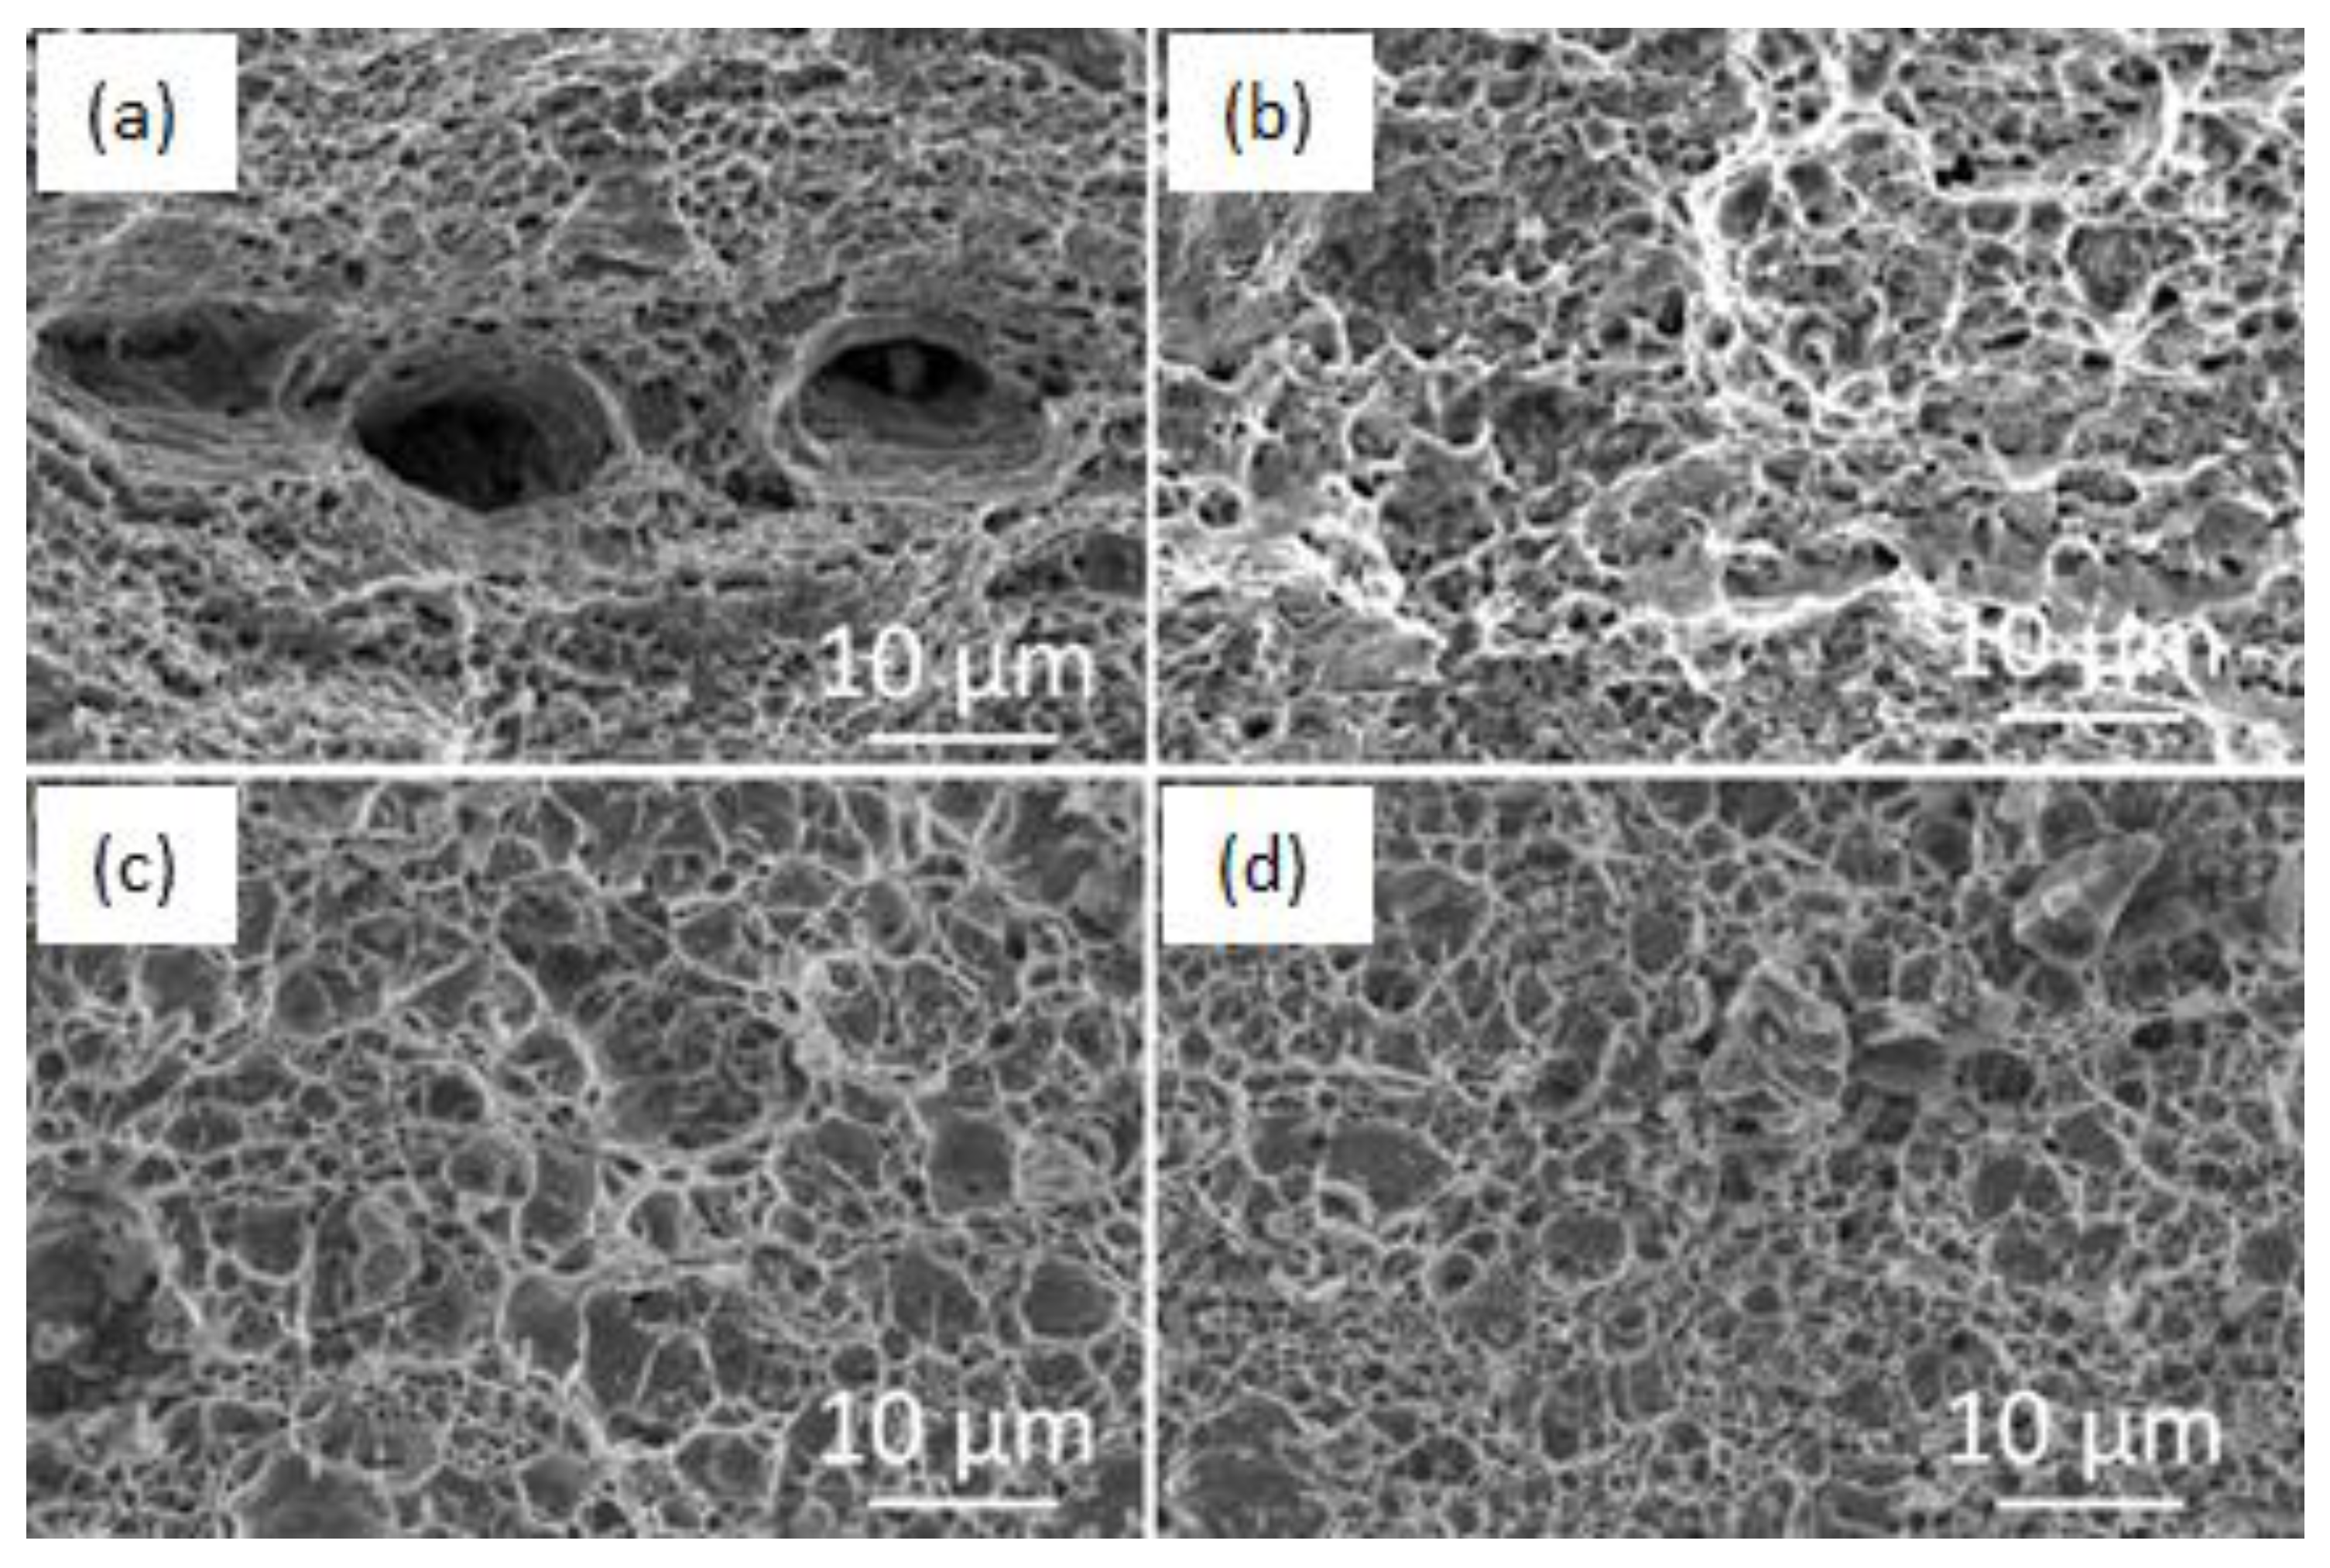
- The fracture was located in all the welded joints at all deformation temperatures in the softened heat affected zone (HAZ) near the weld, and the fracture surfaces demonstrated characteristic dimple fracture.
- The application of these findings in the automotive industry would help to provide needed data on tensile behaviour of welded DP steels at low temperatures and provide recommendations on how these properties can be optimized to ensure safe design of vehicles for low temperature applications.
Author Contributions
Funding
Institutional Review Board Statement
Informed Consent Statement
Data Availability Statement
Acknowledgments
Conflicts of Interest
References
- Chen, H.C.; Cheng, G.H. Effect of Martensite Strength on the Tensile Strength of dual phase Steel. J. Mater. Sci. 1989, 24, 1991–1994. [Google Scholar] [CrossRef]
- Bleck, W. Cold rolled high strength sheet steels for auto applications. J. Miner. Met. Mater. Soc. 1996, 48, 26–30. [Google Scholar] [CrossRef]
- Rashid, M.S. Relationhsip between Steel Microstructure and Formability. In Formable HSLA and Dual-Phase Steels: Proceedings of a Symposium; Davenport, A.T., Ed.; Metallurgical Society of AIME: New York, NY, USA, 1977; pp. 1–24. [Google Scholar]
- Choi, S.H.; Kim, E.Y.; Woo, W.; Han, S.H.; Kwak, J.H. The Effect of Crystallographic Orientation on the Micromechanical Deformation Tension and Failure Behaviors of DP980 Steel During Uniaxial Tension. Int. J. Plast. 2013, 45, 85–102. [Google Scholar] [CrossRef]
- Pierman, A.P.; Bouaziz, O.; Pardoen, T.; Jacques, P.J.; Brassart, L. The Influence of Microstructure and Composition on the Plastic Behaviour of Dual-Phase Steels. Acta Mater. 2014, 73, 298–311. [Google Scholar] [CrossRef]
- Coates, G. Advanced High-Strength Steels Application Guidelines; World Auto Steel: Brussels, Belgium, 2014. [Google Scholar]
- Sodjit, S.; Uthaisangsuk, V. Microstructure based prediction of strain hardening behavior of dual phase steels. Mater. Des. 2012, 41, 370–379. [Google Scholar] [CrossRef]
- Callister, D.W. Materials Science and Engineering an Introduction, 7th ed.; John Wiley & Sons, Inc.: New York, NY, USA, 2007. [Google Scholar]
- Krauss, G. Strengthening Mechanisms in Steels. Encycl. Mater. Sci. Technol. 2001, 8870–8881. [Google Scholar] [CrossRef]
- Ghassemi-Armaki, H.; Maaß, R.; Bhat, S.P.; Sriram, V.; Greer, J.R.; Kumar, K.S. Deformation Response of Ferrite and Martensite in a Dual-Phase Steel. Acta Mater. 2014, 62, 197–211. [Google Scholar] [CrossRef]
- Wangn, W.; Wei, X. The Effect of Martensite Volume and Distribution on Shear Fracture Propagation of 600–1000 MPa Dual Phase Sheet Steels in the Process of Deep Drawing. Int. J. Mech. Sci. 2013, 67, 100–107. [Google Scholar] [CrossRef]
- Khorasani, M.; Ghasemi, A.H.; Rolfe, B.; Gibson, I. Additive manufacturing a powerful tool for the aerospace industry. Rapid Prototyp. J. 2022, 28, 87–100. [Google Scholar] [CrossRef]
- Ma, C.; Chen, D.L.; Bhole, S.D.; Boudreau, G.; Lee, A.; Biro, E. Microstructure and fracture characteristics of spot-welded DP600 steel. Mater. Sci. Eng. A 2008, 485, 334–346. [Google Scholar] [CrossRef]
- Lee, J.H.; Park, S.H.; Kwon, H.S.; Kim, G.S.; Lee, C.S. Tungsten Inert Gas, and Metal Active Gas Welding of DP780 Steel: Comparison of Hardness, Tensile Properties and Fatigue Resistance. Mater. Des. 2014, 64, 559–565. [Google Scholar] [CrossRef]
- Huang, T.; Sato, Y.S.; Kokawa, H.; Miles, M.P.; Kohkonen, K.; Siemssen, B.; Steel, R.J.; Packer, S. Microstructural Evolution of DP980 Steel During Friction Bit Joining. Metall. Mater. Trans. A 2009, 30, 2994–3000. [Google Scholar] [CrossRef]
- Němeček, S.; Mužík, T.; Míšek, M. Differences between laser and arc welding of HSS steels. Phys. Procedia 2012, 39, 67–74. [Google Scholar] [CrossRef] [Green Version]
- Uemori, R.; Fujioka, M.; Inoue, T.; Minagawa, M.; Ichikawa, K.; Shirahata, H.; Nose, T. Steels for marine transportation and construction. Tech. Rev. 2012, 391, 37–47. [Google Scholar]
- Bag, A.; Ray, K.K.; Dwarakadasa, E.S. Influence of martensite content and morphology on tensile and impact properties of high-martensite dual-phase steels. Metall. Mater. Trans. A 1999, 30, 1193–1202. [Google Scholar] [CrossRef]
- Ahmad, E.; Manzoor, T.; Ali, K.L.; Akhter, J.I. Effect of Microvoid Formation on the Tensile Properties of Dual-Phase Steel. J. Mater. Eng. Perform. 2000, 9, 306–310. [Google Scholar] [CrossRef]
- Huh, J.; Huh, H.; Lee, C.S. Effect of Strain Rate on Plastic Anisotropy of Advanced High Strength Steel. Int. J. Plast. 2013, 44, 23–46. [Google Scholar] [CrossRef]
- Kim, J.H.; Kim, D.; Han, H.N.; Barlat, F.; Lee, M.G. Strain Rate Dependent Tensile Behavior of Advanced High Strength Steels: Experiment and Constitutive Modeling. Mater. Sci. Eng. A 2013, 559, 222–231. [Google Scholar] [CrossRef]
- Erdogan, M. The Effect of New Ferrite Content on the Tensile Fracture Behaviour of Dual Phase Steels. J. Mater. Sci. 2002, 37, 3623–3630. [Google Scholar] [CrossRef]
- Das, D.; Chattopadhyay, P.P. Influence of Martensite Morphology on the Work-Hardening Behavior of High Strength Ferrite-Martensite Dual-Phase Steel. J. Mater. Sci. 2009, 44, 2957–2965. [Google Scholar] [CrossRef]
- Byun, T.S.; Kim, I.S. Tensile Properties and Inhomogeneous Deformation of Ferrite-Martensite Dual-Phase Steels. J. Mater. Sci. 1993, 28, 2923–2932. [Google Scholar] [CrossRef]
- Akbarpour, M.R.; Ekrami, A. Effect of Temperature on Flow and Work Hardening Behavior of High Bainite Dual Phase (HBDP) Steels. Mater. Sci. Eng. A 2008, 475, 293–298. [Google Scholar] [CrossRef]
- Jia, Q.; Guo, W.; Peng, P.; Li, M.; Zhu, Y.; Zou, G. Microstructure- and Strain Rate-Dependent Tensile Behavior of Fiber Laser-Welded DP980 Steel Joint. J. Mater. Eng. Perform. 2016, 252, 668–676. [Google Scholar] [CrossRef]
- Kocks, U.F.; Mecking, H. Physics and phenomenology of strain hardening: The FCC case. Prog. Mater. Sci. 2003, 48, 171–273. [Google Scholar] [CrossRef]
- Hollomon, J.H. Tensile Deformation. Am. Inst. Min. Metall. Eng. Trans. Iron Steel Div. 1945, 162, 268–289. [Google Scholar]
- Jaoul, B. Etude de Plasticite et Application oux Meatux. J. Mech. Phys. Solid. 1957, 5, 95–114. [Google Scholar] [CrossRef]
- Crussard, C. Relationship Between Exact Form of Tensile Curves of Metals and Accompanying Changes in Their Structure. Rev. Met. 1953, 50, 697–710. [Google Scholar] [CrossRef]
- Ludwik, P. Elements of Technical Mechanics; Springer: Berlin/Heidelberg, Germany, 1909. [Google Scholar]
- Swift, H.W. Plastic Instability Under Plane Stress. J. Mech. Phys. Solid. 1952, 1, 1–18. [Google Scholar] [CrossRef]
- Monteiro, S.N.; Reed-Hill, R. On the double-n behaviour of iron. Metall. Mater. Trans. B 1971, 2, 2947–2948. [Google Scholar] [CrossRef]
- Ramos, L.F.; Matlock, D.K.; Krauss, G. On the Deformation Behavior of Dual-Phase Steels. Metall. Trans. A 1979, 10, 259–261. [Google Scholar] [CrossRef]
- Samuel, F.H. Tensile Stress-Strain Analysis of Dual-Phase Structures in a Mn-Cr-Si Steel. Mater. Sci. Eng. 1987, 92, l1–l4. [Google Scholar] [CrossRef]
- Jha, B.K.; Avtar, R.; Dwivedi, V.S.; Ramaswamy, V. Applicability of Modified Crussard-Jaoul Analysis on the Deformation Behaviour of Dual-Phase Steels. J. Mater. Sci. Lett. 1987, 6, 891–893. [Google Scholar] [CrossRef]
- Shin, H.; Ju, Y.; Choi, M.K.; Ha, D.H. Flow Stress Description Characteristics of Some Constitutive Models at Wide Strain Rates and Temperatures. Technologies 2022, 10, 52. [Google Scholar] [CrossRef]
- Xu, J.; Cao, D.; Cui, J.; Zhang, X.; Li, G. Experimental Research on Tensile Behavior of Advanced High-Strength Steel DP600 at High Strain Rate. J. Mater. Eng. Perform. 2019, 28, 2411–2420. [Google Scholar] [CrossRef]
- Cao, Y.; Karlsson, B.; Ahlström, J. Temperature and strain rate effects on the mechanical behavior of dual phase steel. Mater. Sci. Eng. A 2015, 636, 124–132. [Google Scholar] [CrossRef]
- Cao, Y.; Ahlström, J.; Karlsson, B. Mechanical Behavior of a Rephosphorized Steel for Car Body Applications: E ects of Temperature, Strain Rate, and Pretreatment. J. Eng. Mater. Technol. 2011, 133, 021019. [Google Scholar] [CrossRef]
- Waterschoot, T.; De Cooman, B.C.; De, A.K.; Vandeputte, S. Static strain aging phenomena in cold-rolled dual-phase steels. Metall. Mater. Trans. A 2003, 34, 781–791. [Google Scholar] [CrossRef]
- Bleck, W.; Schael, I. Determination of crash-relevant material parameters by dynamic tensile tests. Steel Res. 2000, 71, 173–178. [Google Scholar] [CrossRef]
- Morgans, S. Advanced high-Strength Steel Technologies in the 2013 Ford Fusion. In Proceedings of the Presented in Great Designs in Steel Seminar, Livonia, MI, USA, 16 May 2012. [Google Scholar]
- He, H.; Forouzan, F.; Volpp, J.; Robertson, S.M.; Vuorinen, E. Microstructure and mechanical properties of laser-welded DP steels used in the automotive industry. Materials 2021, 14, 456. [Google Scholar] [CrossRef]
- Li, Y.; Zhu, Z.; Tang, X.; Han, S.; Zhang, R.; Cui, H. Improvement of welding stability and mechanical properties of galvanized DP800 steel lap joint by high-speed tandem beam laser. Opt. Laser Technol. 2022, 150, 107958. [Google Scholar] [CrossRef]
- Rocha, I.; Machado, I.; Mazzaferro, C. Mechanical and metallurgical properties of DP1000 steel square butt welded joints with GMAW. Int. J. Eng. Technol. 2014, 4, 26. [Google Scholar] [CrossRef] [Green Version]
- Hertzberg, R.W.; Vinci, R.P.; Hertzberg, J.L. Deformation and Fracture Mechanics of Engineering Materials, 5th ed.; John Wiley and Sons, Inc.: Hoboken, NJ, USA, 2013. [Google Scholar]
- Partridge, P.; Bowen, A. Limitations of the Hollomon strain-hardening equationt. J. Appl. Phys. 1974, 7, 969–978. [Google Scholar]
- LeMaitre, J. Handbook of Materials Behavior Models, 1st ed.; Academic Press: Paris, France, 2001. [Google Scholar]
- Kohnke, P. ANSYS Theory Reference—Release 5.6; SAS IP Inc.: Canonsburg, PA, USA, 1999. [Google Scholar]
- Bassini, E.; Sivo, A.; Ugues, D. Assessment of the Hardening Behavior and Tensile Properties of a Cold-Rolled Bainitic–Ferritic Steel. Materials 2021, 14, 6662. [Google Scholar] [CrossRef]
- Colla, V.; De Sanctis, M.; Dimatteo, A.; Lovicu, G.; Solina, A.; Valentini, R. Strain Hardening Behavior of Dual-Phase Steels. Metall. Mater. Trans. A 2009, 40, 2557–2567. [Google Scholar] [CrossRef]
- Soares, G.C.; Gonzalez, B.M.; Santos, L.D.A. Strain hardening behavior and microstructural evolution during plastic deformation of dual phase, non-grain oriented electrical and AISI 304 steels. Mater. Sci. Eng. A 2017, 684, 577–585. [Google Scholar] [CrossRef]
- Garde, A.M. An Analysis of the Stress-Strain Behavior of Several Grades of Polycrystalline Titanium and Zirconium with Reference to Dynamic Strain Aging and Deformation Twinning between 77 and 1000 °K; University of Florida: Gainesville, FL, USA, 1973. [Google Scholar]
- Yurioka, N.; Kasuya, T. A chart method to determine necessary preheat in steel welding. Weld. World 1995, 35, 327–334. [Google Scholar] [CrossRef] [Green Version]
- Krüger, L.; Wolf, S.; Martin, U.; Martin, S.; Scheller, P.R.; Jahn, A.; Weiß, A. The influence of martensitic transformation on mechanical properties of cast high alloyed CrMnNi-steel under various strain rates and temperatures. J. Phy. Conf. Ser. 2010, 240, 012098. [Google Scholar] [CrossRef]
- ASTM E92-17; Standard Test Methods for Vickers Hardness and Knoop Hardness of Metallic Materials. ASTM International: West Conshohocken, PA, USA, 2017.
- Biro, E.; McDermid, J.R.; Embury, J.D.; Zhou, Y. Softening kinetics in the subcritical heat-affected zone of dual-phase steel welds. Metall. Mater. Trans. A Phys. Metall. Mater. Sci. 2010, 41, 2348–2356. [Google Scholar] [CrossRef]
- Xia, M.; Biro, E.; Tian, Z.; Zhou, Y.N. Effects of heat input and martensite on HAZ softening in laser welding of dual phase steels. ISIJ Int. 2008, 48, 809–814. [Google Scholar] [CrossRef] [Green Version]
- Farabi, N.; Chen, D.L.; Li, J.; Zhou, Y.; Dong, S.J. Microstructure and Mechanical Properties of Laser Welded DP600 Steel Joints. Mater. Sci. Eng. A 2010, 527, 1215–1222. [Google Scholar] [CrossRef]
- Xia, M.S.; Kuntz, M.L.; Tian, Z.L.; Zhou, Y. Failure study on laser welds of dual phase steel in formability testing. Sci. Technol. Weld. Join. 2008, 13, 378–387. [Google Scholar] [CrossRef]
- Saha, D.C.; Westerbaan, D.; Nayak, S.S.; Biro, E.; Gerlich, A.P.; Zhou, Y. Materials Science & Engineering A Microstructure-properties correlation in fi ber laser welding of dual-phase and HSLA steels. Mater. Sci. Eng. A 2014, 607, 445–453. [Google Scholar] [CrossRef]
- Parkes, D.; Xu, W.; Westerbaan, D.; Nayak, S.S.; Zhou, Y.; Goodwin, F.; Bhole, S.; Chen, D.L. Microstructure and fatigue properties of fiber laser welded dissimilar joints between high strength low alloy and dual-phase steels. Mater. Des. 2013, 51, 665–675. [Google Scholar] [CrossRef]
- Panda, S.K.; Sreenivasan, N.; Kuntz, M.L.; Zhou, Y. Numerical Simulations and Experimental Results of Tensile Test Behavior of Laser Butt Welded DP980 Steels. J. Eng. Mater. Technol. 2008, 13, 041003. [Google Scholar] [CrossRef]
- Farabi, N.; Chen, D.L.; Zhou, Y. Tensile properties and work hardening behavior of laser-welded dual-phase steel joints. J. Mater. Eng. Perform. 2012, 21, 222–230. [Google Scholar] [CrossRef]
- Dowling, N. Mechanical Behavior of Materials: Engineering Methods for Deformation, 4th ed.; Prentice-Hall International: Englewood Cliffs, NJ, USA, 2012. [Google Scholar]
- Parkes, D.; Westerbaan, D.; Nayak, S.S.; Zhou, Y.; Goodwin, F.; Bhole, S.; Chen, D. Tensile properties of fiber laser welded joints of high strength low alloy and dual-phase steels at warm and low temperatures. Mater. Des. 2014, 56, 193–199. [Google Scholar] [CrossRef]
- Dieter, G.E.E. Mechanical Metallurgy, 3rd ed.; Metric, S.I., Ed.; McGraw-Hill: London, UK, 1988. [Google Scholar]
- Gurrutxaga-Lerma, B.; Shehadeh, M.A.; Balint, D.S.; Dini, D.; Chen, L.; Eakins, D.E. The effect of temperature on the elastic precursor decay in shock loaded FCC aluminium and BCC iron. Int. J. Plast. 2017, 96, 135–155. [Google Scholar] [CrossRef]
- Sakamoto, H. Distinction between thermal and stress-induced martensitic transformations and inhomogeneity in internal stress. Mater. Trans. 2002, 43, 2249–2255. [Google Scholar] [CrossRef] [Green Version]
- Aderibigbe, I.; Popoola, P.; Sadiku, R.; Biro, E. Influence of low temperatures on mechanical behavior of laser welded dual phase steels Influence of low temperatures on mechanical behavior of laser welded dual phase steels. J. Laser Appl. 2022, 34, 022011. [Google Scholar] [CrossRef]
- Konings, R.; Allen, T.R.; Stoller, R.E. Basic Aspects of Radiation Effects in Solids/Basic Aspects of Multi-Scale Modeling. In Comprehensive Nuclear Materials; Elsevier: Madrid, Spain, 2012; p. 486. [Google Scholar]
- Davis, J.R. Introduction to tensile testing. In Tensile Testing; ASM International: Materials Park, OH, USA, 2004; pp. 1–12. [Google Scholar]
- Kumar, A.; Singh, S.B.; Ray, K.K. Influence of bainite/martensite-content on the tensile properties of low carbon dual-phase steels. Mater. Sci. Eng. A 2008, 474, 270. [Google Scholar] [CrossRef]
- Movahed, P.; Kolahgar, S.; Marashi, S.P.H.; Pouranvari, M.; Parvin, N. The Effect of Intercritical Heat Treatment Temperature on the Tensile Properties and Work Hardening Behavior of Ferrite-Martensite Dual Phase Steel Sheets. Mater. Sci. Eng. A 2009, 518, 1–6. [Google Scholar] [CrossRef]
- Afrin, N.; Chen, D.L.; Cao, X.; Jahazi, M. Strain hardening behavior of a friction stir welded magnesium alloy. Scr Mater 2007, 57, 1004–1007. [Google Scholar] [CrossRef]
- Luo, J.; Mei, Z.; Tian, W.; Wang, Z. Diminishing of work hardening in electroformed polycrystalline copper with nano-sized and uf-sized twins. Mater. Sci. Eng. A 2006, 441, 282–290. [Google Scholar] [CrossRef]
- Ligda, J.P. Effects of Grain Size on the Quasi-Static Mechanical Properties of Ultrafine-Grained and Nanocrystalline Tantalum. PhD Thesis, The University of North Carolina at Charlotte, Charlotte, NC, USA, 2013. [Google Scholar]
- Dieter, G.E. Mechanical Metallurgy, 3rd ed.; McGraw-Hill: New York, NY, USA, 1986. [Google Scholar]
- Hosford, W.F. Mechanical Behavior of Materials; Cambridge University Press: New York, NY, USA, 2005. [Google Scholar]
- Christopher, J.; Choudhary, K.; Isaac Samuel, E.; Srinivasan, V.S.; Mathew, M.D. Tensile flow and work hardening behaviour of9Cr-1Mo ferritic steel in the frame work of Voce relationship. Mater. Sci. Eng. A 2011, 528, 6589–6595. [Google Scholar] [CrossRef]
- Mecking, H.; Kocks, U.F. Kinetics of flow and strain-hardening. Acta Metall. 1981, 29, 1865–1875. [Google Scholar] [CrossRef]
- Chowdhury, S.M.; Chen, D.L.; Bhole, S.D.; Cao, X.; Powidajko, E.; Weckman, D.C.; Zhou, Y. Tensile properties and strain-hardeningbehavior of double-sided arc welded and friction stir welded AZ31B magnesium alloy. Mater. Sci. Eng. A 2010, 527, 2951–2961. [Google Scholar] [CrossRef]
- Humphreys, F.J.; Roher, G.S.; Rollett, A. The Deformed State. In Recrystallization and Related Annealing Phenomena, 3rd ed.; Elsevier: Oxford, UK, 2017; pp. 21–23. [Google Scholar]
- Rana, A.K.; Paul, S.K.; Dey, P.P. Effect of martensite volume fraction on cyclic plastic deformation behavior of dual phase steel: Micromechanics simulation study. J. Mater. Res. Technol. 2019, 8, 3705–3712. [Google Scholar] [CrossRef]
- Birgani, E.N.; Pouranvari, M. Effect of martensite volume fraction on the work hardening behavior of dual phase steels. Proc. Metal 2009, 2009, 19–21. [Google Scholar]
- Zhang, J.; Di, H.; Deng, Y.; Misra, R.D.K. Effect of martensite morphology and volume fraction on strain hardening and fracture behavior of martensite–ferrite dual phase steel. Mater. Sci. Eng. A 2015, 627, 230–240. [Google Scholar] [CrossRef]


| Steel Grade | C | Mn | Si | Al | Cr + Mo | Nb + Ti | Cu | Coating (g/m2) | fmart (%) | CE | Grain Size |
|---|---|---|---|---|---|---|---|---|---|---|---|
| DP800 | 0.15 | 1.8 | 0.01 | 0.015 | - | 0.1 | - | 70 | 41 | 0.26 | 6.7 |
| DP1000 | 0.23 | 2.7 | 0.01 | 0.015 | 1.0 | 0.15 | 0.2 | 75 | 47 | 0.29 | 4.1 |
| Steel Grade | DP800 BM | DP1000 BM |
|---|---|---|
| Yield strength (MPa) | 560 | 780 |
| UTS (MPa) | 827 | 1040 |
| Total Elongation (%) | 16.6 | 11.5 |
| Laser System | Laser Source | Power (kW) | Wavelength (μm) | Beam Size (mm) | Focal Length (mm) | Welding Speed (m/min) |
|---|---|---|---|---|---|---|
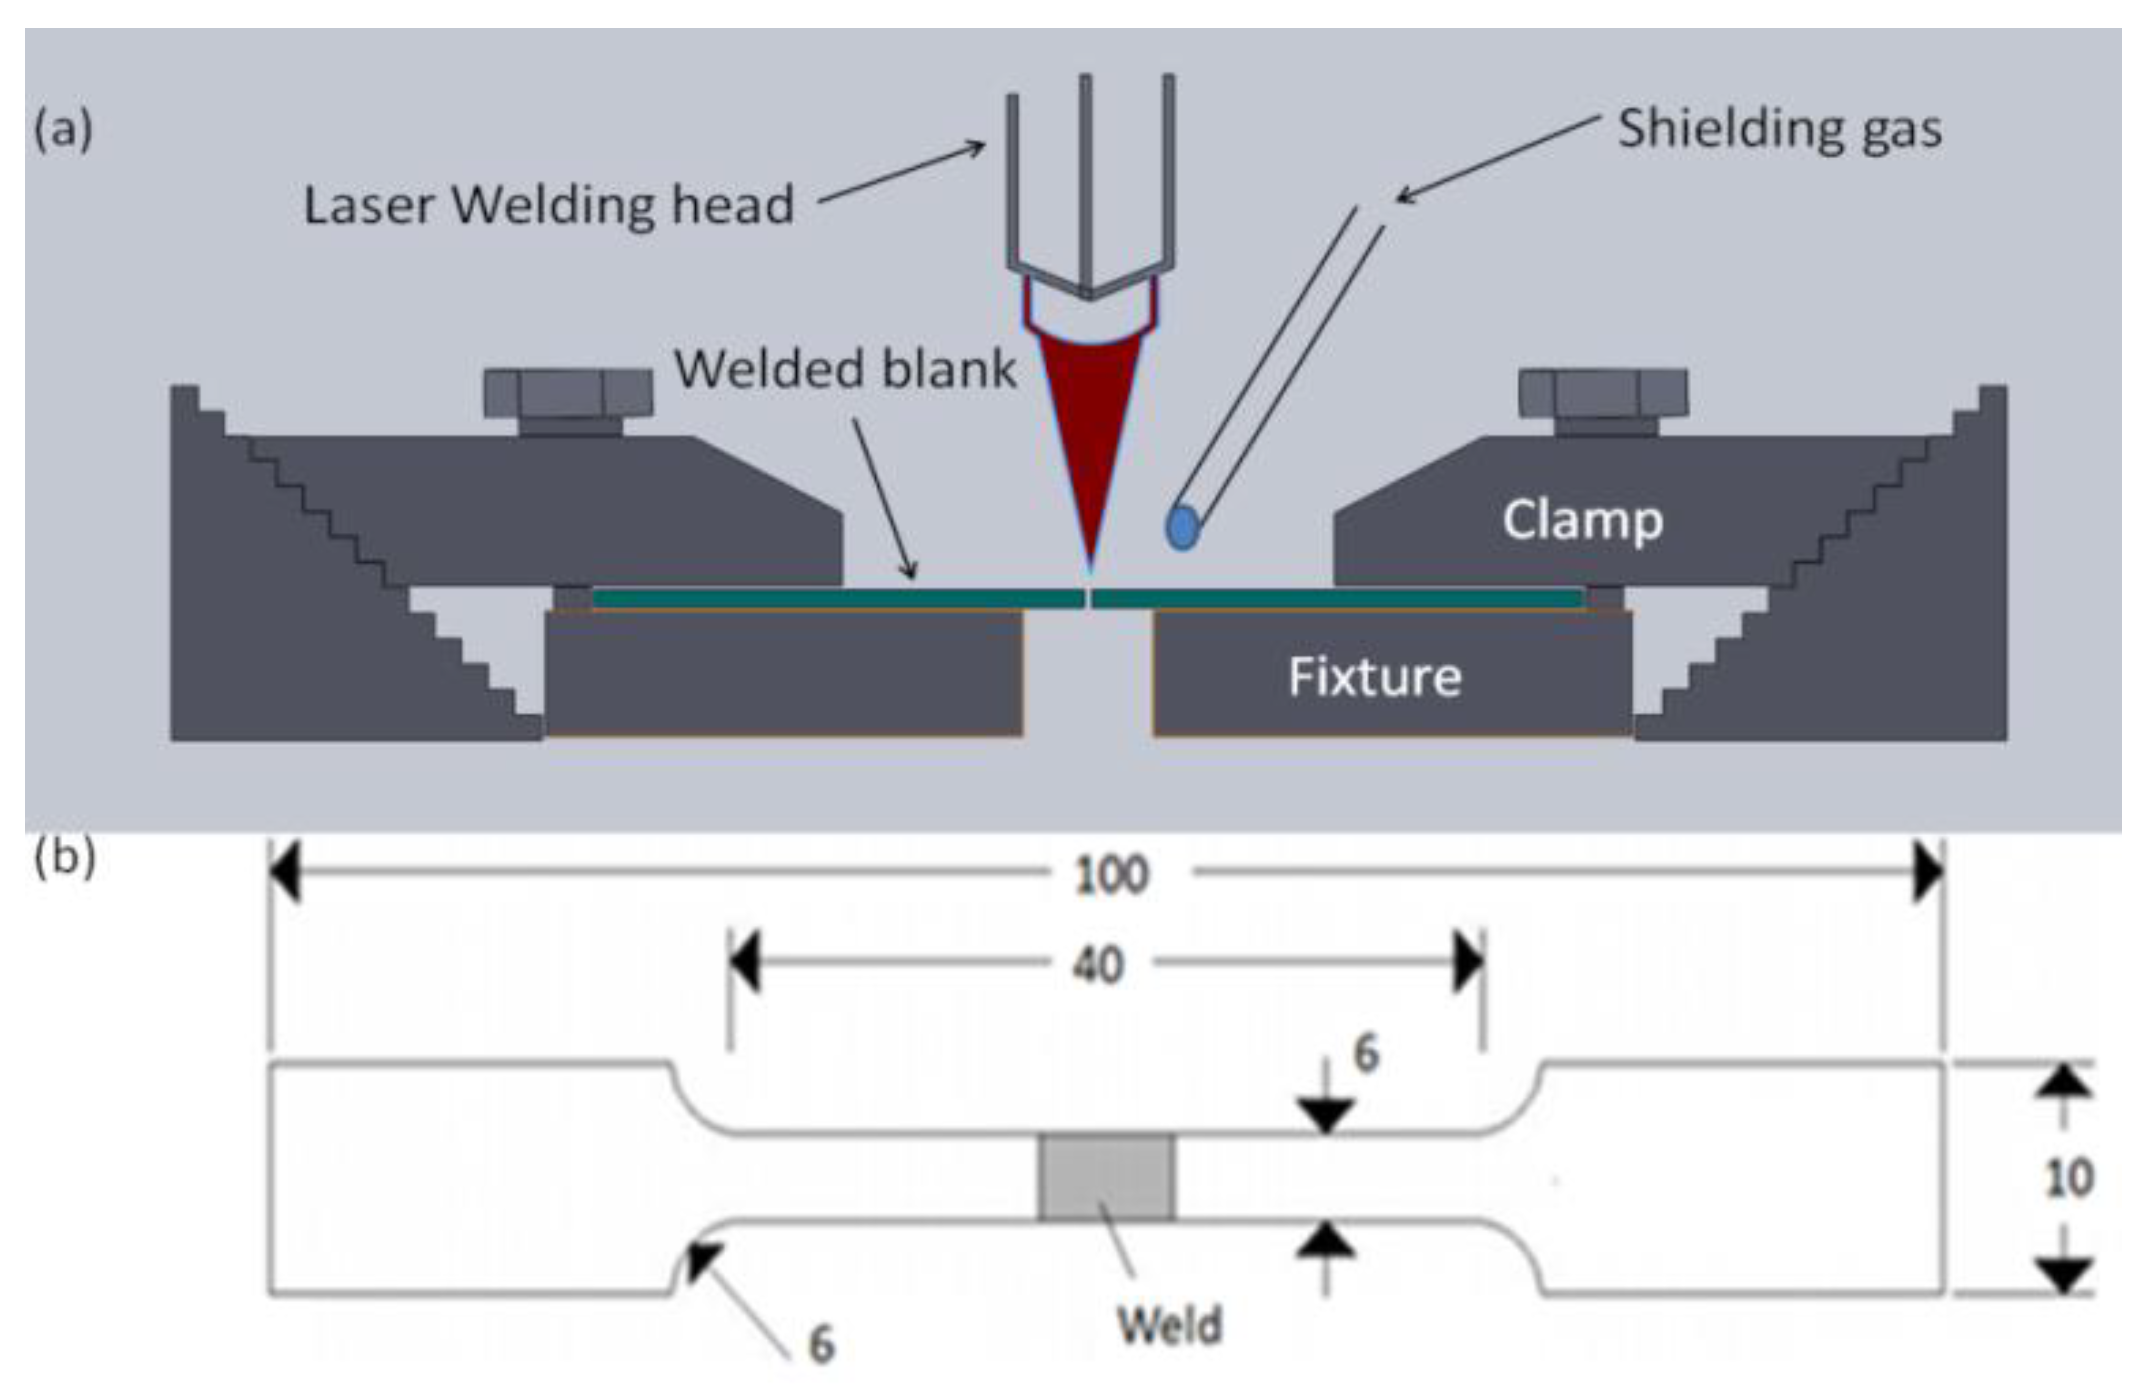
| YW 50 | Nd:YAG | 4.4 | 1.06 | 0.4 | 200 | 4.5 |
Publisher’s Note: MDPI stays neutral with regard to jurisdictional claims in published maps and institutional affiliations. |
© 2022 by the authors. Licensee MDPI, Basel, Switzerland. This article is an open access article distributed under the terms and conditions of the Creative Commons Attribution (CC BY) license (https://creativecommons.org/licenses/by/4.0/).
Share and Cite
Aderibigbe, I.; Popoola, P.; Sadiku, E.; Biro, E. Low-Temperature Deformation Mechanism and Strain-Hardening Behaviour of Laser Welded Dual-Phase Steels. Metals 2022, 12, 1317. https://doi.org/10.3390/met12081317
Aderibigbe I, Popoola P, Sadiku E, Biro E. Low-Temperature Deformation Mechanism and Strain-Hardening Behaviour of Laser Welded Dual-Phase Steels. Metals. 2022; 12(8):1317. https://doi.org/10.3390/met12081317
Chicago/Turabian StyleAderibigbe, Isiaka, Patricia Popoola, Emmanuel Sadiku, and Elliot Biro. 2022. "Low-Temperature Deformation Mechanism and Strain-Hardening Behaviour of Laser Welded Dual-Phase Steels" Metals 12, no. 8: 1317. https://doi.org/10.3390/met12081317