Article

Development of a New AuCuZnGe Alloy and Determination of Its Corrosion Properties

1
Faculty of Mechanical Engineering, University of Maribor, Smetanova ulica 17, 2000 Maribor, Slovenia
2
Zlatarna Celje d. o. o., Kersnikova 19, 3000 Celje, Slovenia
3
School of Dental Medicine, University of Belgrade, Dr. Subotića 1, 11000 Belgrade, Serbia
4
Faculty of Technology and Metallurgy, University of Belgrade, Karnegijeva 4, 11120 Belgrade, Serbia
*
Author to whom correspondence should be addressed.
Metals 2022, 12(8), 1284; https://doi.org/10.3390/met12081284
Submission received: 28 June 2022 / Revised: 22 July 2022 / Accepted: 27 July 2022 / Published: 30 July 2022
(This article belongs to the Special Issue Applications of Electrochemistry in Corrosion Science and in Practice)

Abstract

:
In this paper, we present the idea and development of a new gold-copper-zinc-germanium (AuCuZnGe) alloy, which is related to the method of production and research of its key properties, so that the new Au alloy could be used for jewelry production and in dental technology. The research design was associated with the determination of appropriate chemical composition, manufacturing technology, and performing the characterization. Melting and casting technologies were used to cast the AuCuZnGe alloy while rolling was used to prepare the cylinders and cutting to make square plates with a = 10 mm and thickness of 1 mm. Such plates were provided for corrosion testing. Observation of the plate′s microstructure was performed with Scanning Electron Microscopy (SEM) equipped by Energy-Dispersive X-ray spectrometry (EDS) and X-ray diffraction (XRD). Corrosion testing involved performing the following measurements: Polarization, the open circuit potentials, and linear polarization resistance. Based on the SEM, EDS, XRD, and results of corrosion testing it can be concluded that the new AuCuZnGe alloy possesses high corrosion stability and can be classified as a high noble alloy.

1. Introduction

The popularity of white gold (Au) jewelry has been increasing in the last few decades. The white or silvery color of these jewelry alloys is usually achieved with the addition of copper and/or silver, and a smaller amount of palladium, zinc, nickel, or manganese metals to the gold base increases corrosion stability and mechanical properties [1,2]. Nickel is well known for its effectiveness as a whitening element that allows the formation of Au alloys with good technical properties, applicable for jewelry production processes and use. The extensive use of nickel in the commercial goods and industry has increased skin contact exposure to this element, mainly through the use of jewelry, zippers, metallic buttons, dental braces, prosthetics, electronics, household utensils, and in workplaces with prolonged contact with nickel [3,4,5]. This exposure may induce a nickel allergy at the site of contact with the nickel-releasing item, causing allergic contact dermatitis in the form of rashes, blisters, oedemas, or dry, scaly, and cracked skin [4,5]. As nickel allergies have been well documented, the REACH Directive for registration, evaluation, authorization, and restriction of chemicals used in European Union countries specifies the requirements of nickel release in products [6]. Metal alternatives for the whitening purposes of Au alloys, such as palladium, platinum, or titanium, increase the price of the alloy (noble metals) or increase the technological difficulty of production (as is the case with titanium). Some of these elements can also induce allergic reactions in the general population, such as palladium, which may cause allergies, usually in people who are already susceptible to nickel, while the incidence of palladium allergy by itself is relatively rare [7].
To avoid allergies from metal ion release and the increase of costs from using alloy constituents such as palladium in white Au alloys, other metallic elements need to be considered. Several elements were considered for whitening noble alloys, such as iron, cobalt, manganese, and gallium, but were found to be unsatisfactory during the different alloy and final product production processes. Another alternative is germanium, which allows for an accessible implementation in the established gold alloy production process [8].
Germanium is a hard and brittle metalloid of a grey-white color, with a melting point of 958 °C. It has a face-centered cubic crystal structure. Germanium decreases hardness and increases the flowability of the alloy. It is known for its use in microelectronics, as it has electric properties between conductor and dielectric materials, classifying it as a semiconductor [9]. As an alloy component, it is also used occasionally in dental prosthetics, as an additive in palladium or Au-based alloys, and in jewelry in smaller amounts, as a deoxidizer, or for increasing flowability. Additionally, it has a relatively low density of 5.3 g cm−3. As a result, it decreases shrinkage during alloy casting [8], which may be an added benefit in jewelry casting with precious gems, reducing the stress exerted on the gems, preventing their breakage, or for precision casting, where the casting dimensions are particularly important, such as in the casting of dental prosthetic crowns and bridges. There are no known allergic reactions to germanium, and the usual percentage content of germanium in these alloys is relatively small for causing toxic reactions [10,11,12]. For its use in dental alloys, no negative effects are indicative for germanium.
Due to its low density as compared with other noble metals, germanium has a strong alloy whitening power. Only a few percentage points of germanium of about 4–8 wt.% in the alloy whiten its color considerably, whereas for nickel, the usual percentage for white gold alloys ranges from 10 wt.% to 15 wt.%, or even 30 wt.% for a premium white noble alloy [8]. Due to its whitening power, the germanium content is preferred to be of a lower content in the alloy, up to around 4 wt.%, as a higher content of this metal increases brittleness and reduces the hardness of the alloy.
Another aspect of the whitening element selection is the final alloy cost. In comparison with more common base metals, such as nickel, germanium is several times more expensive. As the required alloy wt.% for germanium is considerably lower, the final alloy costs are still comparable to alloys containing nickel. As such, at the time of carrying out this investigation, replacing nickel with germanium represented less than 1% of the total alloy materials’ cost increase. In addition, using germanium still represents only a fraction of the costs as compared with using noble metal whitening elements, such as palladium or platinum.
This study presents a step toward establishing germanium as a substitute for nickel in white Au alloys for general use in jewelry production and potential use in dentistry. The use of germanium presents some favorable features and benefits, which can be considered for investigation in AuCuZnGe alloy production.
The presented research shows the production of a germanium-based white Au alloy. The AuCuZnGe alloy’s composition is chosen based on the following requirements:
  • The white Au alloy has a 14 karat (58.5 wt.%) gold content, a widely-used white Au alloy for general jewelry production.
  • The Au alloy should be made as white as possible, reducing the need for additional whitening steps for the final jewelry products with galvanic coatings.
  • Germanium content should be kept as low as possible, due to its effects on the alloy’s brittleness and hardness.
  • The germanium alloy (as a prealloy) should be implemented easily in noble metal alloy production processes (casting, mechanical treatment, rolling, soldering for jewelry).
The second and third requirements are in contrast to each other, as the whitening effect comes from a high content of germanium, while a lower content is needed for reducing the negative effects of this metal on the Au alloy’s mechanical properties. As such, a compromise was needed for the final AuCuZnGe alloy composition. In this context as a first step, the corrosion resistance of the produced AuCuZnGe alloy has been investigated to determine its corrosion stability properties, which are important as a major factor that may cause potential allergic reactions in the previously mentioned uses. To the best of our knowledge, this is the first paper concerning the corrosion behavior of AuCuZnGe alloy.

2. Materials and Methods

Very pure components (Au 99.99%, Cu 99.99%, Zn 99.99%, Ge 99.99%, Ir 99.99%, delivered by the Legor Group S.p.A., Bressanvido, Italy) were used for the preparation of the AuCuZnGe alloy. The exact chemical compositions of Ge-prealloy and AuCuZnGe 585 alloy are the subject of a national patent. Remelting and casting took place in an electric resistance furnace in a protective atmosphere of Ar 5.0, and a clay graphite crucible was used for remelting and melt preparation. A Ge-prealloy with the following chemical composition, Cu, Zn, Ge, and Ir, was cast at T = 900 °C in the form of a steel ingot with a diameter of 30 mm. The ingot was cooled slowly to room temperature. The ingot surface was then cleaned to remove all impurities and rinsed in an ultrasonic cleaner (Elma Nr. 001564043, Singen, Germany). In the second stage, an AuCuZnGe 585 alloy was cast using a Ge-prealloy and pure Au at T = 1100 °C in a steel ingot with Φ = 20 mm. Slow cooling to room temperature was used for AuCuZnGe casting. The AuCuZnGe ingot was rolled into a cylinder with Φ = 15 mm (Figure 1a) using the rolling process by degrees of deformation to 1.1 × 1.1 (+/−0.2) mm (machine ZC 0439, Zlatarna Celje, Celje, Slovenia). This was followed by rolling into a strip with a square profile a = 10 mm (+0.05/0) mm (machine AURO 0315, Zlatarna Celje, Celje, Slovenia). After obtaining the strip, it was cut by electrical discharge machining into square plates with a = 10 mm and thickness of 1 mm. Such plates were provided for corrosion testing (Figure 1b).
The surface of the plates before corrosion testing was prepared for metallographic observation by grinding and polishing. The metallographically polished surfaces were examined and analyzed micro-chemically by Scanning Electron Microscopy (SEM), equipped with an Energy-Dispersive X-ray spectrometer (EDS) INCA 350 (Oxford Instruments, Oxfordshire, UK), (FEI Sirion 400 NC, FEI Technologies Inc., Hillsboro, OR, USA). After corrosion testing, the surface of the plate samples was observed directly without preparation to give an impression of the corrosion impact on surface changes. EDS analyses were performed on each selected sample before and after corrosion testing, although only average results are shown.
XRD analysis was performed for the detection of crystallographic phases on the AuCuNiZn casting. X-Ray Powder Diffraction, a Panalytical X’pert Pro PW 3040/60 goniometer (Malvern Products, Malvern, United Kingdom), was used for measuring 2Ɵ between 0°–110° with a step size of 0.002° and a scan step time of 50 s on each recorded step with Bragg-Brentano optics. The Cu anode with (Kα = 0.154 nm) was used with a current of 40 mA and a potential of 45 kV. The sample size was approximately a 1 cm2 exposed area without previous preparation. The position of the peaks of certain phases was established by the program HighScorePlus (Malvern Panalytical, Version 2, Malvern, United Kingdom) [13].
The corrosion stability of the AuCuZnGe alloy was investigated using samples with the dimensions 10 mm × 10 mm and an exposed surface area of 2 cm2. A three-compartment glass cell with a volume of 100 cm3, equipped with a saturated calomel reference electrode and platinum counter electrode compartments, were used for the measurements. During testing, 0.9 wt.% NaCl with a pH of 7.2, adjusted with 0.1 M NaOH, was used as the electrolyte. Before the polarization measurements (v = 1 mV s−1), the open circuit potentials were determined for 55 min, simultaneously with linear polarization resistance measurements (±10 mV vs. Eocp, v = 0.1 mV s−1). A Gamry Interface 1010E (Gamry Instruments, Warminster, PA, USA) potentiostat was used for the electrochemical tests.
As a comparison alloy, the high-resistance stainless steel 316Ti was also investigated under identical conditions. The chemical composition in wt.% of 316Ti was: Cr 16.7, Ni 10.6, Mo 2.12, Mn 1.3, Ti 0.42, C 0.04, Si 0.42, P 0.025, S 0.002, Fe balance.

3. Results and Discussions

3.1. SEM/EDX Observations

Figure 2 shows the SEM micrographs: (a) Before and (b) After corrosion testing. The AuCuZnGe alloy before testing, Figure 1a, was homogeneous without visible intermetallic phases or unalloyed elements. Based on the EDS analysis, Table 1, the mean surface composition of the alloy before electrochemical treatments was: 33.44 wt.% of Cu, 2.64 wt.% of Zn, 1.79 wt.% of Ge, and 62.13 wt.% of Au.
After electrochemical treatment up to the potentials of 0.7 V (SCE) and 72 h of immersions in 0.9 wt.% NaCl, see belows, some small, localized pitting-like shapes appeared on the surface, Figure 2b. The mean surface composition of the alloy after electrochemical treatments, Table 2, was: 28.47 wt.% of Cu, 4.23 wt.% of Zn, 4.09 wt.% of Ge, and 63.21 wt.% of Au. In addition, on the surface before polarization 1.29 wt.% of oxygen and 0.19 wt.% of chloride were detected, and after polarization 4.76 wt.% of oxygen and 0.77 wt.% of chloride. Those increases could indicate the formation of copper, zinc, or germanium surface species. A comparison of the chemical composition identified that, after testing on the surface, a significantly lower concentration of Cu was detected, while the concentration increased of Zn, Ge, and Au. This is an obvious consequence of the exposure to the medium (deionized water with 0.9 g/L NaCl) and the conditions of corrosion testing, which suggests that Cu is oxidized primarily from the surface of the AuCuZnGe alloy.

3.2. XRD Analysis

XRD analysis of the as-cast AuCuZnGe sample shows the presence of two crystallographic phases rich in Au and Ge, as AuGe2 in AuGe2S in the spectral range between 30 and 90 2Θ (degree). The characteristic dots in Figure 3 have been compared with literature data on structural factors [11]. The AuGe2 phase corresponds to a hexagonal crystal system P63/mmc, space group number 194, and could correspond to the empirical formula Au0.72Ge0.28. Phase AuGe2S has similar characteristic points as AuGe2, with their higher intensity in the measurement range between 40 and 50, or around 70 2Θ (degree). This suggests that it is an almost identical phase rich in Au which has a slight change in chemical composition, and this partly indicates that it is in a metastable state and will pass into a more stable state during further processing or use, recorded as the AuGe2 phase. The peaks for Cu are overlapped with gold and for Zn are very weak. The proportion of each phase could not be determined.

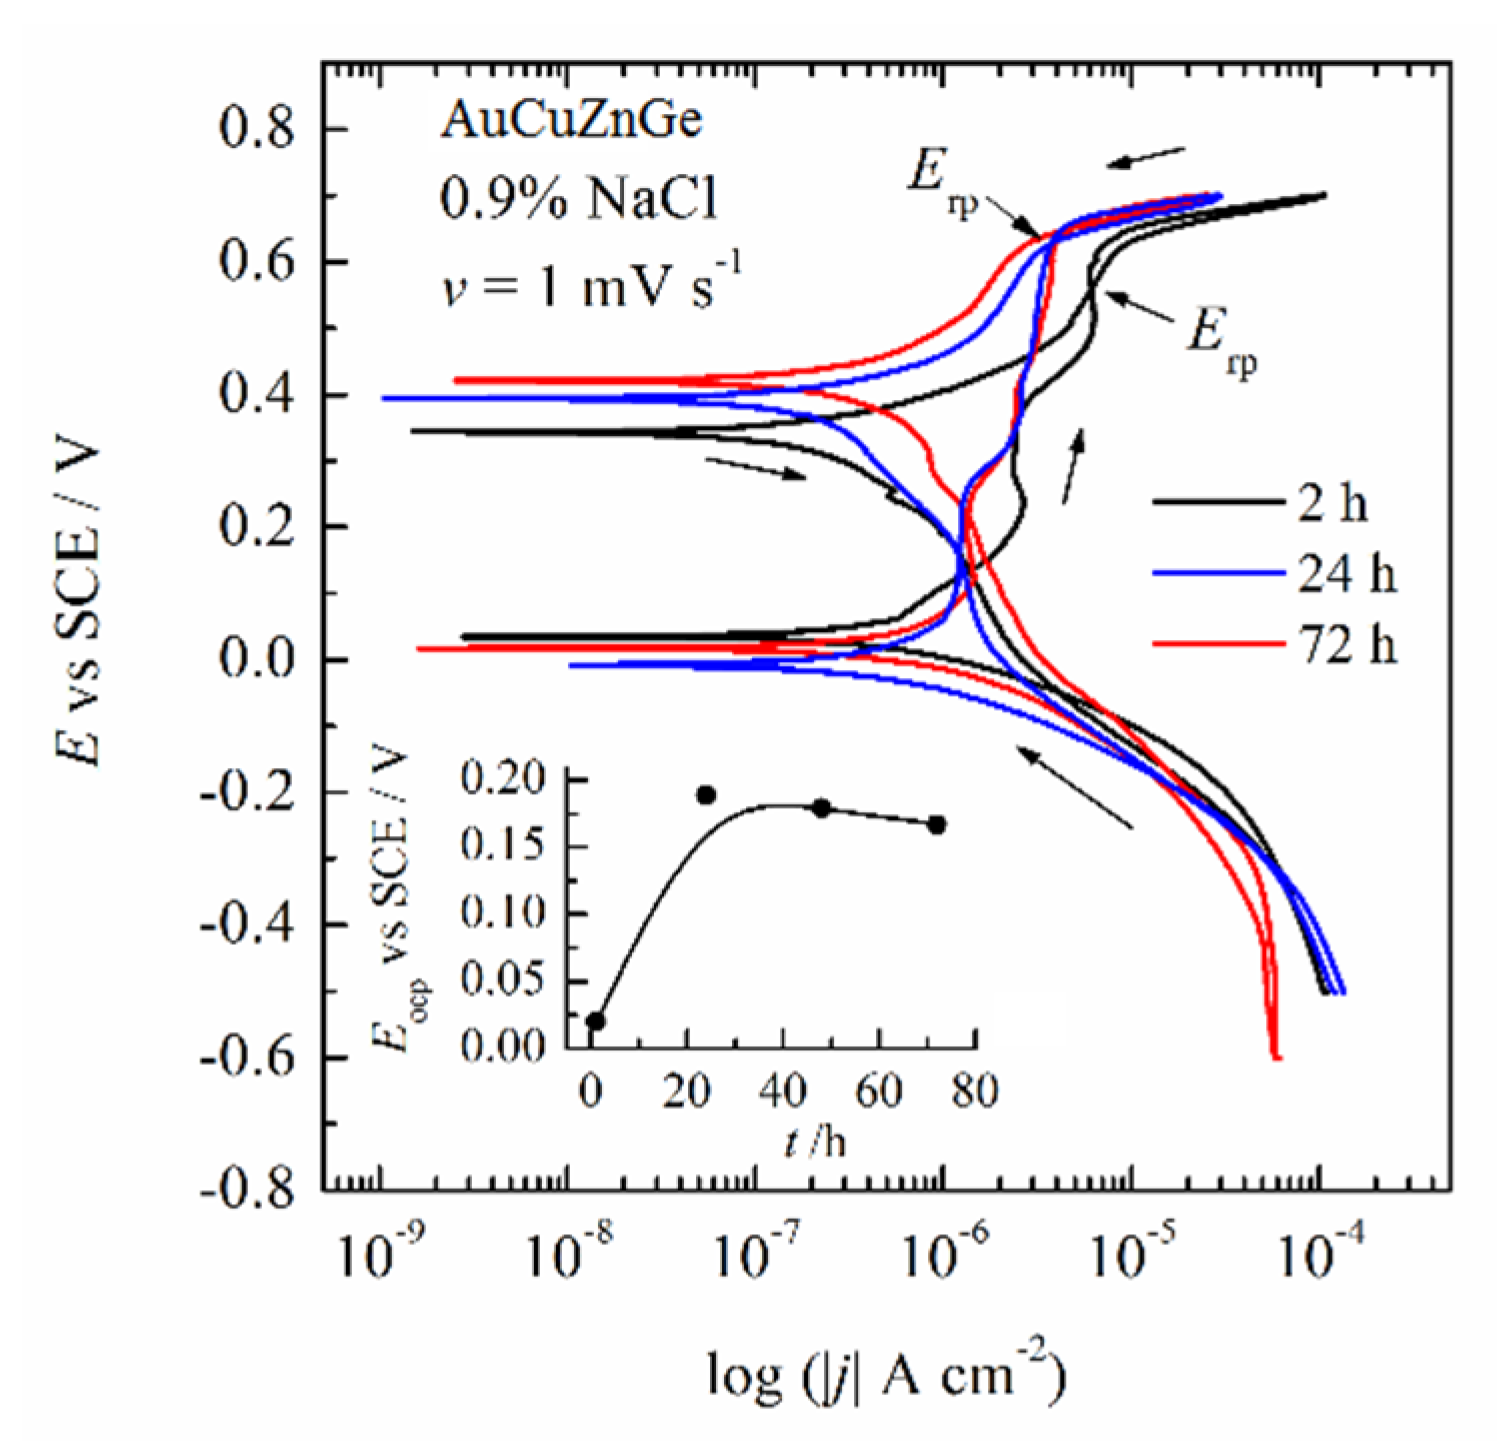
3.3. Corrosion Behavior

Figure 4 shows the dependence of the open-circuit potentials and polarization resistance, with a sweep rate of 0.1 mV s−1, after initial immersion and after 24 h of immersion in 0.9 wt.% NaCl. It could be seen that after the initial immersion during 55 min as recommended by [15], the open circuit potential increased slightly from –20 mV to 20 mV (SCE), while polarization resistance increased from 70 kΩ cm2 over the first 1000 s of immersion, and then stabilized to ~110 kΩ cm2. After 24 h of immersion the open circuit increased to ~0.197 V (SCE), indicating spontaneous passivation, while the polarization resistance was stabilized at ~27 kΩ cm2.
After stabilization of the open circuit potentials, the polarization curve (v = 1 mV s−1) was recorded, Figure 5. In the forward scan, starting from −0.5 V, oxygen reduction reaction under mixed activation–diffusion control occurred up to the corrosion potential of +20 mV, followed by the active alloy oxidation. Because the Tafel slopes for cathodic and anodic reactions were not well defined, the corrosion current density could be only estimated to be in the order of ~1−2 × 10⁻⁷ A cm−2. In the potential range of 0.15 V to 0.3 V a broad peak, (a), was observed, followed by a second, not well-defined peak, (b), in the potential range from ~0.3 V to ~0.5 V (SCE). Above potentials of ~0.5 V (SCE), initiation of metastable pitting was observed, followed by an increase of the current density at transition or breakdown potential, Ep of ~0.61 V (SCE), potentials. In the backward scan, repassivation of the alloy occurred at very high potentials, Erp, of ~0.45 V (SCE), indicating that, below that, potential pitting corrosion cannot occur [16]. A few reduction peaks of oxidized metals were observed after the repassivation potentials. After potentials E2 of ~0.15 V (SCE), an oxygen reduction reaction occurred, probably first via a two-electron, peroxide path, and then below ~0 V (SCE) via a four-electron path.
The following corrosion reaction could be proposed based on the observed behavior of the alloy. The gold–copper system was characterized by three main intermetallic compounds, including AuCu3, AuCu, and Au3Cu [17]. Because the zinc and germanium had a very low corrosion potential, for example, Ge at pH = 7 had Ecorr of –0.6 V (SCE) and jcorr~3 × 10⁻⁷ A cm−2 [18], it could be proposed that those two elements are stabilized in the alloy, because their surface content increases after polarization, Table 2. According to the Pourbaix diagram presented in [18], even in the presence of chloride and highly oxidized hypochlorite, Ge is very stable in the pH range between 2 and 9, and in the potential range at pH ~7 from –0.7 V (SCE) up to 1.8 V (SCE), due to the formation of the surface oxide, GeO2. Even so, the further work is needed to determine the state and the role of the Ge in the alloy. Therefore, the mentioned two peaks in the passive region during the anodic scan could be associated with the copper behavior in the chloride-containing solution, which was observed by many authors [19,20,21]. Considering the research of Azzaroni et al. [22] who investigated the anodic dissolution of copper in a borax solution containing 0.1M KCl, they assumed that, at the first peak, denoted (a) in Figure 5, Cu forms low soluble Cu2O film via the reaction:
2 Cu   + 2 OH   Cu 2 O   +   H 2 O   + 2 e
with the theoretically reversible potentials:
E r ( Cu 2 O | Cu ) = E r θ ( Cu 2 O | Cu )     ( 2.3 R T / F ) log   a ( OH )
that at pH = 7.2 had a value of –0.164 V (SCE) [23]. Increasing the potentials in the region of observed peak (b), a complex reaction combined with electroformation of nonstoichiometric copper oxy-hydroxides, like Cu2O/CuO/Cu(OH)2, takes place on the Cu2O film, contributing to the anodic current involved in the peaks. The reversible potential for the reaction:
Cu 2 O   + 2 OH +   H 2 O   2 Cu ( OH ) 2 + 2 e
is 0.096 V (SCE) at pH = 7.2.
Because all these species were low soluble, a decrease in the copper content from the alloy surface, taking into account that chlorides were detected on the oxidized surface, Table 2, could be explained by the formation of low soluble CuCl chloride via the reaction:
Cu   +   Cl   CuCl   +   e
For the condition c(Cl) = 0.154 M (0.9 wt.% NaCl), the theoretical reversible potential of the reaction was calculated according to the equation:
E r ( CuCl | Cu ) = E r θ (   CuCl | Cu )     ( 2.3 R T / F ) log   a ( Cl )
with the value of –0.058 V (SCE) [20]. In the excess of chloride, CuCl could form a soluble complex [24,25]:
CuCl   +   Cl   CuCl 2
that can explain the decrease in the copper concentrations from the alloy’s surface.
Above the Ep, two reactions are thermodynamically plausible. The first reaction could be the oxidation of the gold via reaction:
2 Au   + 3 H 2 0 Au 2 O 3 + 6 H + + 6 e
with the reversible potentials given by:
E r ( Au 2 O 3 | Au ) = E r θ ( Au 2 O 3 | Au )     ( 2.3 R T / F ) × pH
and the value of 0.696 V (SCE) at pH = 7.2. It should be noted that all the given potentials are valid for pure metal, but those values could differ in alloys. The second reaction can be related to the oxygen evolution reaction, whose thermodynamic potential of 0.561 V vs. SCE, for Ecorr = 0.241 V, was given by the equation:
E r ( O 2 | H 2 O ) = E r θ ( O 2 | H 2 O )     E R     ( 2.3 R T / F ) × pH
Most of the plausible reactions connected with the anodic oxidation of the alloy are given in Figure 6.
Figure 6 shows the polarization curves of the alloy after 2, 24, and 72 h immersion. It can be seen that after 2 h in the forward scan, peaks (a) and b) were still present, indicating electrochemical activity of the copper onto the surface. The polarization curves after 24 and 72 h were practically identical, suggesting the high stability of the investigated alloy. The passivation region was almost 0.6 V wide, with two current densities plateaus of 1 and 2 μA cm−2. The open circuit dependence over time is shown in the inset in Figure 7. As can be seen, after 1 h of immersion the open circuit potential corresponds to the active corrosion of metals, while after 24 h and longer, the open circuit potential was stabilized in the passive region of the alloy.
According to our previous investigations of nine noble metal alloys [26], comparisons with the American Dental Association (ADA) classification system [27] and given the criteria considering that the current density at Ecorr,1 + 0.3 V should be smaller than 2 μA cm−2, and Ep should be 0.6 V and higher, the investigated new Au-Ge alloy belongs to the first group of stability and represents a high noble alloy. Comparing the results with our previous investigations of Zlatara Celje, Slovenia commercial alloy [26], oxidation stability is similar to the alloy Midor S with compositions: Au 46.0; Pd 6.0; Ag 39.5; Cu 7.5; Zn, Ir < 1, and much better than alloy Midor SE: Au 40.0; Pd 4.0; Ag 47.0; Cu 7.5; Zn, Ir < 1.
Even the investigated AuCuZnGe alloy shows acceptable corrosion stability, for commercialization a lot of work has to be done, for example, ion release measurements performed by Inductively Coupled Plasma-Mass Spectrometry (ICP-MS), corrosion investigations in artificial saliva and sweat biocompatibility. Also, the role of the germanium up to now cannot be clearly explained.
As an example, the addition of only a small amount of Ti, ~0.5 wt.% in stainless steel 316 increases corrosion stability. Figure 8 shows the polarization curve of SS 316Ti after 55 min of exposure to 0.9 wt.% NaCl. The corrosion potential of 23 mV is recorded, indicating that the material is in a passive state. The cathodic branch of the polarization curve is under mixed activation–diffusion oxygen reduction reaction control. The anodic branch shows a typical passive region with passivation current density between 1 to 4 μA cm−2. Metastable pitting corrosion is not observed as in the case of SS 316 [28] indicating improved pitting stability of SS 316Ti. Critical pitting potential, Epit, is observed at the potential of 0.33 V followed by the increase of the current corresponding to the pits’ propagation. In the reverse scan, repassivation potential, Erp, is reached at 0.29 V. Similar results are obtained by Zakeri et al. [29] for SS 316 in 0.1 M NaCl, but with lower repassivation potentials for ~0.1 V. From this example could be seen that even minor content of alloying elements could provoke significant change in the corrosion behavior.

4. Conclusions

A study of the corrosion properties of the new AuCuZnGe alloy revealed the following findings:
  • It was concluded that during the initial immersion period of 1 h, the alloy established corrosion potential of ~20 mV (SCE), with an estimated corrosion current density lower than 2 × 10⁻⁷ A cm−2.
  • During the prolonged immersion, complex copper reactions on the alloy surfaces occurred, which led to a decrease in the initial copper contents on the surface. The alloy’s behavior was stabilized after 24 h.
  • Using the EDS before and after alloy oxidation, it was concluded that only copper dissolved slightly from the alloy’s surface.
  • According to the ADA classification system and our previous works, it was concluded that the investigated new AuCuZnGe alloy belongs to the first group of stability and represents a high noble alloy.
  • Even the investigated AuCuZnGe alloy shows acceptable corrosion stability, for the commercialization a lot of work has to be done, mainly in understanding the role of the Ge in the alloy.

5. Patents

The detailed chemical composition of the AuCuZnGe alloy is the subject of a national patent.

Author Contributions

Conceptualization, R.R. and B.G.; methodology, R.R. and B.G.; software, P.M.; validation, R.R., V.L. and B.G.; formal analysis, P.M.; investigation, R.R. and B.G.; resources, R.R. and V.L.; data curation, P.M.; writing—original draft preparation, R.R., P.M. and B.G.; writing—review and editing, R.R. and B.G.; supervision, R.R. and B.G.; project administration, R.R. and V.L.; funding acquisition, R.R. and V.L.; All authors have read and agreed to the published version of the manuscript.

Funding

This research was funded by the International Eureka project GOLD-GER E!17091.

Institutional Review Board Statement

Not applicable.

Informed Consent Statement

Not applicable.

Data Availability Statement

Not applicable.

Conflicts of Interest

The authors declare no conflict of interest.

References

  1. Cretu, C.; Van Der Lingen, E. Coloured Gold Alloys. Gold Bull. 1999, 32, 115–126. [Google Scholar] [CrossRef]
  2. Normandeau, G. White Golds: A Review of Commercial Material Characteristics & Alloy Design Alternatives. Gold Bull. 1992, 25, 94–103. [Google Scholar] [CrossRef] [Green Version]
  3. Moon, J.; Reeder, M.; Atwater, A.R. Contact Allergy to Nickel: Still #1 after All These Years. Cutis 2021, 107, 12–15. [Google Scholar] [CrossRef]
  4. Ahlström, M.G.; Thyssen, J.P.; Wennervaldt, M.; Menné, T.; Johansen, J.D. Nickel Allergy and Allergic Contact Dermatitis: A Clinical Review of Immunology, Epidemiology, Exposure, and Treatment. Contact Dermat. 2019, 81, 227–241. [Google Scholar] [CrossRef] [PubMed] [Green Version]
  5. Garner, L.A. Contact Dermatitis to Metals. Dermatol. Ther. 2004, 17, 321–327. [Google Scholar] [CrossRef]
  6. Thyssen, J.P.; Uter, W.; McFadden, J.; Menné, T.; Spiewak, R.; Vigan, M.; Gimenez-Arnau, A.; Lidén, C. The EU Nickel Directive Revisited—Future Steps towards Better Protection against Nickel Allergy. Contact Dermat. 2011, 64, 121–125. [Google Scholar] [CrossRef]
  7. Ahlström, M.G.; Thyssen, J.P.; Menné, T.; Johansen, J.D. Prevalence of Nickel Allergy in Europe Following the EU Nickel Directive—A Review. Contact Dermat. 2017, 77, 193–200. [Google Scholar] [CrossRef] [Green Version]
  8. Wataha, J.C.; Shor, K. Palladium Alloys for Biomedical Devices. Expert Rev. Med. Devices 2014, 7, 489–501. [Google Scholar] [CrossRef]
  9. Erfani, B.; Lidén, C.; Midander, K. Short and Frequent Skin Contact with Nickel. Contact Dermat. 2015, 73, 222–230. [Google Scholar] [CrossRef]
  10. Peretti, D.; Di Siro, M.; Di Siro, S. Nickel- and Palladium-Free Master Alloys for All Karats of White Gold. In Proceedings of the Santa Fe Symposium on Jewellery Manufacturing Technology, Albuquerque, NM, USA, 21–24 May 2017; pp. 343–362. [Google Scholar]
  11. Rosenberg, E. Germanium: Environmental Occurrence, Importance and Speciation. Rev. Environ. Sci. Biotechnol. 2009, 8, 29–57. [Google Scholar] [CrossRef]
  12. Zheng, J.; Yang, L.; Deng, Y.; Zhang, C.; Zhang, Y.; Xiong, S.; Ding, C.; Zhao, J.; Liao, C.; Gong, D. A Review of Public and Environmental Consequences of Organic Germanium. Crit. Rev. Environ. Sci. Technol. 2019, 50, 1384–1409. [Google Scholar] [CrossRef]
  13. CrystalMaker Software V 10.7; CrystalMaker Software Ltd.: Kidlington, UK, 2021.
  14. Schluckebier, G.; Predel, B. Investigation on the Structure of Metastable Phases in the Gold-Germanium System. Z. Metallkd. 1980, 71, 535–541. [Google Scholar]
  15. ASTM Designation: G 59–97 (Reapproved 2003); Standard Test Method for Conducting Potentiodynamic Polarization Resistance Measurements. ASTM International: West Conshohocken, PA, USA, 2003.
  16. Esmailzadeh, S.; Aliofkhazraei, M.; Sarlak, H. Interpretation of Cyclic Potentiodynamic Polarization Test Results for Study of Corrosion Behavior of Metals: A Review. Prot. Met. Phys. Chem. Surf. 2018, 54, 976–989. [Google Scholar] [CrossRef]
  17. Wang, J.; Qin, H.; Chen, J.; Yang, D.; Zhang, G. First-Principles Study on the Elastic Mechanical Properties and Anisotropies of Gold–Copper Intermetallic Compounds. Metals 2022, 12, 959. [Google Scholar] [CrossRef]
  18. Zhang, L.; Zhang, B.; Pan, B.; Wang, C. Germanium electrochemical study and its CMP application. App. Surf. Sci. 2017, 422, 247–256. [Google Scholar] [CrossRef]
  19. Lgaz, H.; Saha, S.K.; Lee, H.-S.; Kang, N.; Thari, F.Z.; Karrouchi, K.; Salghi, R.; Bougrin, K.; Ali, I.H. Corrosion Inhibition Properties of Thiazolidinedione Derivatives for Copper in 3.5 wt.% NaCl Medium. Metals 2021, 11, 1861. [Google Scholar] [CrossRef]
  20. Cai, Y.; Xu, Y.; Zhao, Y.; Zhang, W.; Yao, J.; Wei, M.; Zhou, K.; Ma, X. Quantitative Understanding of the Environmental Effect on B10 Copper Alloy Corrosion in Seawater. Metals 2021, 11, 1080. [Google Scholar] [CrossRef]
  21. Antonijevic, M.M.; Alagic, S.C.; Petrovic, M.B.; Radovanovic, M.B.; Stamenkovic, A.T. The Influence of pH on Electrochemical Behavior of Copper in Presence of Chloride Ions. Int. J. Electrochem. Sci. 2009, 4, 516–524. [Google Scholar]
  22. Azzaroni, O.; Cipollone, M.; Vela, M.E.; Salvarezza, R.C. Protective Properties of Dodecanethiol Layers on Copper Surfaces:  The Effect of Chloride Anions in Aqueous Environments. Langmuir 2001, 17, 1483–1487. [Google Scholar] [CrossRef]
  23. Milazzo, G.; Caroli, S. Tables of Standard Electrode Potentials; John Wiley & Sons: Chichester, NY, USA, 1978. [Google Scholar]
  24. Tasić, Ž.Z.; Mihajlović, M.B.P.; Radovanović, M.B.; Simonović, A.T.; Antonijević, M.M. Cephradine as corrosion inhibitor for copper in 0.9% NaCl solution. J. Mol. Struct. 2018, 1159, 46–54. [Google Scholar] [CrossRef]
  25. Wang, D.; Xiang, B.; Liang, Y.; Song, S.; Liu, C. Corrosion control of copper in 3.5wt.% NaCl Solution by Domperidone: Experimental and Theoretical Study. Corr. Sci. 2014, 85, 77–86. [Google Scholar] [CrossRef]
  26. Grgur, B.N.; Lazić, V.; Stojić, D.; Rudolf, R. Electrochemical testing of noble metal dental alloys: The influence of their chemical composition on the corrosion resistance. Corr. Sci. 2021, 184, 109412. [Google Scholar] [CrossRef]
  27. Brantley, W.A.; Laub, L.W.; Drago, C.J. Framework Design and Metal Selection. In Contemporary Fixed Prosthodontics, 5th ed.; Rosenstiel, S., Land, M., Fujimoto, J., Eds.; Elsevier Inc.: Amsterdam, The Netherlands, 2016; Chapter 19; pp. 529–541. [Google Scholar]
  28. Yi, Y.; Cho, P.; Al Zaabi, A.; Addad, Y.; Jang, C. Potentiodynamic polarization behaviour of AISI type 316 stainless steel in NaCl solution. Corr. Sci. 2013, 74, 92–97. [Google Scholar] [CrossRef]
  29. Zakeri, M.; Naghizadeh, M.; Nakhaie, D.; Moayed, M.H. Pit transition potential and repassivation potential of stainless steel in thiosulfate solution. J. Electrochem. Soc. 2016, 163, C275–C281. [Google Scholar] [CrossRef] [Green Version]
Figure 1. AuCuZnGe sample: (a) Cylinders and (b) Plate.
Metals 12 01284 g001
Figure 2. SEM micrographs of the AuCuZnGe alloy: (a) Before, (b) After corrosion testing, and (c) SEM/EDX mapping after corrosion testing with the constituent elements shown in different colors: Cu—red, Zn—green, Ge—blue, Au—purple.
Metals 12 01284 g002aMetals 12 01284 g002b
Figure 3. XRD analysis of the AuCuZnGe alloy. Green lines represents the reference line for XRD pattern of Au0.72Ge0.28 (Reference code 00-047-1022) [14].
Metals 12 01284 g003
Figure 4. The dependence of the open-circuit potentials (right axis) and polarization resistance (left axis) after initial immersion (●) and after 24 h (ο) of immersion in 0.9 wt.% NaCl.
Metals 12 01284 g004
Figure 5. Initial polarization curve (v = 1 mV s−1) of the AuCuZnGe alloy after 1 h of immersion in 0.9 wt.% NaCl.
Metals 12 01284 g005
Figure 6. Cyclic voltammogram (v = 10 mV s−1) of the AuCuZnGe alloy with indicated plausible anodic reactions.
Metals 12 01284 g006
Figure 7. Polarization curves (v = 1 mV s−1) of the alloy after 2, 24, and 72 h immersion. Inset: The dependence of open circuit potentials over the time of immersion.
Metals 12 01284 g007
Figure 8. Initial polarization curve (v = 1 mV s−1) of the stainless still 316Ti alloy after 1 h of immersion in 0.9 wt.% NaCl.
Metals 12 01284 g008
Table 1. Results of the micro-chemical EDS analysis: surface AuCuZnGe before corrosion testing (in wt.%).
SpectrumCuZnGeAuTotal
Mean33.442.641.7962.13100.00
Std. Deviation0.480.140.370.32
Max.33.852.882.3562.59
Min.32.512.501.3361.78
Table 2. Results of the micro-chemical EDS analysis: surface AuCuZnGe after corrosion testing (in wt.%).
SpectrumCuZnGeAuTotal
Mean28.474.234.0963.21100.00
Std. Deviation0.400.240.540.73
Max.29.064.554.7564.51
Min.27.993.953.4862.37
Publisher’s Note: MDPI stays neutral with regard to jurisdictional claims in published maps and institutional affiliations.

