Article

Electrochemical Corrosion Behavior of 310S Stainless Steel in Hot Concentrated Tap Water

Institute of Materials, School of Materials Science and Engineering, Shanghai University, Shanghai 200072, China
*
Author to whom correspondence should be addressed.
Metals 2023, 13(4), 713; https://doi.org/10.3390/met13040713
Submission received: 13 March 2023 / Revised: 2 April 2023 / Accepted: 3 April 2023 / Published: 5 April 2023
(This article belongs to the Special Issue Applications of Electrochemistry in Corrosion Science and in Practice)

Abstract

:
The corrosion behavior of 310S stainless steel was investigated in synthetic tap water and Ca2+ and Mg2+-free solutions with different concentration ratios at 80 °C using electrochemical measurement techniques and surface analysis methods. The main purpose was to obtain the electrochemical corrosion characteristics under carbonate scale conditions. The specimens displayed a spontaneous passivation state in the solutions with or without Ca2+ and Mg2+ ions. With the enlargement of the concentration ratio of synthetic tap water from 1 to 10 times, the polarization resistance under free corrosion conditions and the pitting potential decreased by about 48% and 327 mV, respectively. The pitting tendency increased with increasing concentration ratio of tap water. The carbonate scales deposited from the synthetic tap water solutions were mainly composed of CaCO3, which led to a slight increase in the polarization resistance and the pitting potential and decrease in the passive current density.

1. Introduction

At present, 310S austenitic stainless steel is widely adopted to manufacture heating tubes due to its good mechanical properties, corrosion resistance in hot tap water, and oxidation resistance under dry-burning conditions [1,2]. However, corrosion problems still frequently occur in practice [3,4]. The heating tube is the core component of the electric water heater [5]. Once the corrosion results in the perforation of the stainless steel heating tube, the water heater cannot operate properly and even gives rise to electrical leaks and other safety risks. Therefore, the corrosion failure of heating tubes has attracted great attention with the continuous popularization and application of water heaters in daily life.
The working temperature of stainless steel heating tubes may reach approximately 80 °C. A temperature gradient must appear near the tube surface under these heating conditions [6]. This easily promotes the deposition of calcium and magnesium carbonates onto the tube surface from the nearby solution because their solubility limits are inversely proportional to temperature. It is common to see thick carbonate scale on the heating tube surfaces [7], which creates electrochemical non-uniformity on the stainless steel surface for pitting corrosion. Wu [8] employed a scanning Kelvin probe (SKP) micro-area electrochemical method to study the corrosion of super 13Cr steel. The results showed that the failure surface of the super 13Cr steel oil pipe had scale and clear pits, and CaCO3 and FeCO3 were the main components of the scale. The outer scale was loose and the inner scale was dense. The micro-corrosion cell was the main cause of pitting corrosion. Under the self-catalytic effect of a closed corrosion unit and external load, the corrosion pits and cracks of the super 13Cr oil pipe were expanded, which eventually led to the fracture and failure of the oil pipe.
Tap water contains anions (e.g., Cl, HCO3, SO42−) and cations (e.g., Ca2+, Mg2+), which play important roles in the corrosion of heating tubes [9,10,11,12]. Cl ions must adsorb on the metal surface and subsequently cause the breakdown of passive films and the occurrence of pitting corrosion. The pitting resistance becomes lower under higher Cl- concentrations in the solution [3,13,14,15]. The oxyanions such as HCO3 and SO42− may compete with Cl for adsorption and reduce the Cl concentration on the metal surface. This inhibits the aggressive effect of Cl ions to some extent. The pitting resistance becomes higher under higher HCO3 and SO42− concentrations in the solution [16,17]. Zhang [18] and Niu [19] studied the effect of Cl and SO42− ions on the pitting corrosion behavior of stainless steel in synthetic tap water. They found that there was a critical Cl concentration for the occurrence of pitting corrosion and the pitting potential decreased significantly with the increase of Cl concentration. Moayed [20] studied the effects of sulfates on the critical pitting temperature (CPT) and pitting kinetics of austenitic stainless steel, and found that sulfates not only increased the pitting potential above the CPT, but also increased the critical concentration of metal salts in the pit. If this proportion did not exceed 100%, the passivation was enhanced inside the pit edge.
It is apparent that the formation of scale not only affects the heat transfer of the heating tube, but also causes local concentration of ions such as Cl, HCO3, and SO42− under heating conditions [21,22]. However, the effect of carbonate scale on the corrosion of stainless steel heating tube is still unclear in the presence of concentrated tap water. In this work, the electrochemical corrosion of 310S stainless steel was characterized in synthetic tap water under different concentrated conditions. It is anticipated that this work will provide fundamental and scientific information for the practical application of 310S stainless steel heating tubes and the design of electric water heaters.

2. Materials and Methods

2.1. Material and Test Solutions

The experimental material is a commercial 310S austenitic stainless steel strip with a thickness of about 0.4 mm, whose chemical composition measured by an atomic absorption spectrometer (TALOS F200X) is (wt.%): C 0.04, Mn 1.21, P 0.02, Si 0.74, Cr 23.9, Ni 19.0, Mo 0.01, N 0.18, Ti 0.01, Al 0.02, and Fe balance [23]. The specimens were cut into a size of 10 mm × 10 mm, ground with 1000 grit SiC sandpaper, and pretreated in a nitric acid solution at 55 °C for 30 min. After rinsing with deionized water and ethanol, the specimens were back-welded with copper wires and sealed with epoxy resin, leaving only one working surface with an area of 1 cm2.
According to the literature [20], the composition of synthetic tap water solution is (mg L−1): Cl−1 80, SO42− 90, HCO3 190, Ca2+ 70, and Mg2+ 22. The test solutions with concentration ratios of 1, 2, 4, 6, 8, and 10 times were prepared using CaCl2, MgSO4, Na2SO4, NaCl, and NaHCO3. The pH was controlled at 7.6 with a 0.5 mol L−1 dilute H2SO4 solution. For a simple comparison, the parallel tests were also performed in the solutions without calcium and magnesium salts by using the corresponding sodium salts.

2.2. Electrochemical Measurements

Electrochemical tests were conducted in a three-electrode cell with a platinum electrode as the auxiliary electrode and a saturated calomel electrode (SCE) as the reference electrode. The solution temperature in the electrolytic cell was controlled at 80 °C in a water bath. The electrochemical measurements were carried out using a PMC1000 potentiostat. The open circuit potential (OCP) was measured for 1 h after the specimen was immersed in the solution, and then the electrochemical impedance spectrum was determined at OCP with an AC disturbance signal of 10 mV (rms) in the frequency range from 99,000 to 0.01 Hz [24]. Subsequently, the potentiodynamic polarization curve was measured with a scan rate of 20 mV min−1 from the OCP to the anodic potential of 100 μA cm−2, which were repeated at least five times with different specimens according to the International Standard ISO 15158-2014. The impedance spectra were analyzed with ZSimpWin 3.21 software.

2.3. Surface Characterization

After the polarization tests in the synthetic tap water with different concentration ratios, the specimen surfaces were slowly rinsed with deionized water, dried and analyzed using a Gemini300 scanning electron microscope (SEM) equipped with an energy dispersive x-ray spectroscopy (EDS) function, where the secondary electrons were used for surface observation and the backscattered electrons for energy spectrum analyses. The deposited salt layer on the specimen was analyzed with X-ray diffraction (XRD) using a Rigaku diffractometer (D/MAX 2550 V) with Cu Ka irradiation (λ = 0.15405 nm) and a scanning rate of 4° per minute for 2θ from 10° to 90°.

3. Results

3.1. Concentrated Solutions of Synthetic Tap Water

Figure 1 shows the variation of the open circuit potential over time for the specimens in the synthetic tap water solutions with different concentration ratios. After the immersion in each solution, the OCP rapidly increased over time due to the formation of a passive film on the fresh specimen surface. After immersion for 60 min, the OCP almost became stable, indicating that the specimen reached a relatively steady corrosion state [25,26]. With the increase of concentration ratio from 1 to 10 times, the stable potential value shifted from about −0.201 to −0.146 VSCE, but the change was small, only about 55 mV.
Figure 2 shows the impedance spectra for the specimens in the synthetic tap water solutions with different concentration ratios under free corrosion conditions. The Nyquist plots in Figure 2a display similar features, which are composed of incomplete capacitive semicircles over the whole frequency range. The semicircle size gradually decreased with the increase in concentration ratio. It can be seen from the Bode plot in Figure 2b that each phase angle curve showed a flat peak in the middle frequency region. It is hard to clearly distinguish the time constants from the charge transfer process in the low frequency part and the passive film in the high frequency part. As the concentration ratio increased from 1 to 10 times, the phase angle θ values slightly decreased in the low frequency part (<0.1 Hz), but gradually increased in the middle frequency region (0.6~2000 Hz). These can be related to the increase of solution conductivity and the accelerated growth of a passive film under higher salt concentration conditions.
Figure 3 shows the potentiodynamic polarization curves of the specimens in the synthetic tap water solutions with different concentration ratios. The specimen spontaneously passivated in each concentrated solution of synthetic tap water and displayed a wide passive potential region. As the potential increased to the pitting potential (Ep), the passive film was broken and the current density increased rapidly, resulting in stable pitting corrosion. With increasing concentration ratio of synthetic tap water from 1 to 10 times, the pitting potential of 310S stainless steel markedly decreased from about 0.753 to 0.387 VSCE. When the concentration ratio was more than 4 times, the pitting potential changes were relatively small. In addition, the transpassive dissolution of chromium oxides appeared in the potential range from about 0.2 to 0.4 VSCE in some solutions.

3.2. Electrochemical Corrosion Characteristics in the Concentrated Solutions without Ca2+ and Mg2+ Ions

Figure 4 shows the open circuit potential of the specimens immersed in the different concentrated solutions without Ca2+ and Mg2+ ions for 60 min. As the concentration ratio increased from 1 to 10 times, the OCP gradually shifted to the negative potential direction, whose stable value at 60 min decreased from approximately −0.206 to −0.255 VSCE. This was also a small change of about 49 mV. Figure 5 shows the impedance spectra of the specimens in the test solutions without Ca2+ and Mg2+ ions under free corrosion conditions. The impedance spectra displayed similar features to those with the Ca2+ and Mg2+ ion-containing solutions in Figure 2, but the capacitive semicircle in the Nyquist plot was smaller and the flat phase angle peak in the Bode plot became slightly narrower. These indicate that the passive film and passive state of the specimen surface degraded to some extent with the removal of Ca2+ and Mg2+ ions from the test solution in every concentration condition.
Figure 6 shows the potentiodynamic polarization curves to display the pitting corrosion tendency of the specimens in the concentrated solutions without Ca2+ and Mg2+ ions. The specimens exhibited similar spontaneous passivation as observed in the concentrated solutions of synthetic tap water in Figure 3. As the concentration ratio increased from 1 to 10 times, the pitting potential decreased from about 0.555 to 0.310 VSCE.

3.3. Deposits and Pits on the Surfaces

After the polarization measurements in Figure 3 and Figure 6, the specimen surfaces were observed using a scanning electron microscope. Figure 7 shows the typical pits and deposits on the surface in the synthetic tap water solutions with the concentration ratios of 1, 6, and 8 times. Due to the occurrence of pitting corrosion, small pits appeared on the specimen surfaces. It was difficult to clearly observe salt deposits on the specimens after polarized in the solutions with the concentration ratios of 1, 2, and 4 times, as shown in Figure 7a,b for the non-concentrated synthetic tap water. This is because the ion concentrations were still too low to quickly form an insoluble salt layer during the test. As the concentration ratio increased to 6 times, many needle-shaped salt crystals and a very thin scale can be seen on the surface in Figure 6c,d. Small salt particles deposited around the pits. When the concentration ratio increased to 8 times, more needle-like salt crystals and a thicker scale covered the surface in Figure 6e,f. Almost no grinding trace could be observed on the specimen surface. In addition, there were no salt deposits on the specimen surfaces after the polarization curve measurements in the solutions without Ca2+ and Mg2+ ions.
Figure 8 shows the EDS element distribution for the A area in Figure 7f, and Table 1 gives the elemental mass percentages. The needle-shaped crystals and fine powdery substances were composed of C, O, and Ca, and these elements were distributed on the entire specimen surface. Furthermore, Figure 9 gives the XRD spectra for the specimen surfaces after the polarization measurement in the synthetic tap water solutions with the concentration ratios of 1, 6, and 8 times. It can be seen that the deposits were mainly composed of calcium carbonate (ICDD-PDF No. 05-0586) [24,27,28]. In the literature [29,30,31,32], calcium carbonate has three crystal forms, i.e., calcite (diamond), vaterite (needle-shaped) and aragonite (globular polycrystalline aggregates). Under the action of Mg2+ ions, amorphous calcium carbonate precipitates firstly, and then transforms into other crystal forms. Mg2+ can replace Ca2+ in calcite, but it cannot replace the interstitial point lattice in vaterite. The high concentration of Mg2+ inhibits the nucleation of calcite, but promotes the nucleation of vaterite [33,34]. Therefore, it can be deduced that the needle-shaped crystals are vaterite-type calcium carbonate, and the fine powdery substances are amorphous calcium carbonate.

4. Discussion

Figure 10 gives the stable values of OCP for the specimens obtained from Figure 1 and Figure 4 in the two solutions with different concentration ratios. With increasing concentration ratio, the OCP displayed opposite trends, in which it shifted positively in the synthetic tap water solution but negatively in the Ca2+ and Mg2+-free solution. The OCP was higher in the synthetic tap water solutions than in the Ca2+ and Mg2+-free solutions. The difference in OCP between the two solutions gradually increased from about 6 to 104 mV as the concentration ratio was increased from 1 to 10 times.
For the interpretation of impedance spectra in Figure 2 and Figure 5, Figure 11 proposes the equivalent circuit model for the corrosion system of 310S stainless steel in different concentrated solutions [11]. Rs is the solution resistance; Rf and Cf are the resistance and capacitance of the passive film and deposited layer on the specimen surface; and Cdl and Rt are the double layer capacitance and electron transfer resistance [35,36]. Due to the non-ideal capacitive response of the corrosion system, the capacitive elements Cf and Cdl are replaced by constant phase elements (CPE) in the fitting process, whose impedance value is ZCPE = [Y0()α]−1, where Y0 is the conductance of the constant phase element, ω is the angular frequency of AC signal, and α is the exponent coefficient. Figure 2 and Figure 5 show that there was good consistency between the simulated data and the experimental results. The chi-square (χ2) goodness of fit for each impedance spectrum was less than 10−3.
Table 2 shows the fitted results for the impedance spectra of 310S stainless steel in the two solutions with different concentrations under free corrosion conditions. The polarization resistance Rp (i.e., corrosion resistance) is the sum of Rt and Rf [37,38]. In the synthetic tap water solutions, as the concentration ratio increased from 1 to 10 times, Rs decreased significantly due to the enhancement of solution conductivity. Y0-f slightly decreased from 2.05 × 10⁻⁵ to 1.57 × 10⁻⁵ sα Ω cm−2, Y0-dl slightly increased from 1.07 × 10⁻⁵ to 1.59 × 10⁻⁵ sα Ω cm−2, and Rp was noticeably reduced about 48.1% from 2.68 × 10⁵ to 1.39 × 10⁵ Ω cm2. These results indicate that the higher Ca2+ and Mg2+ contents enhanced the growth of salt scale and passive film, but increased anion concentrations (especially Cl ions) increased the double layer capacitance on the specimen surface and degraded the corrosion resistance of the metal matrix. With the increase in concentration ratio in the Ca2+ and Mg2+-free solution, both Y0-f and Y0-dl increased very slightly, whereas Rp clearly decreased from 2.39 × 10⁵ to 1.25 × 10⁵ Ω cm2. It is apparent that the protection performance of a passive film and the corrosion resistance of the metal matrix became worse under the higher anion concentration conditions. A simple comparison indicates that the polarization resistance increased about 10% to 19% with the addition of Ca2+ and Mg2+ ions into the solutions. The carbonate deposits on the specimen surface inhibited, to some extent, the corrosion process of the specimen in the synthetic tap water solution in each concentration condition.
Table 3 shows the values of the electrochemical parameters obtained from the polarization curves in Figure 3 and Figure 6 for the two different solutions. The passive current densities at 0 mVSCE tended to increase very slightly despite the significant fluctuations with the increase in concentration ratio. The corrosion potentials showed the same trend as the OCP in Figure 10. A comparison between the two solutions indicates that the passive current density was reduced from about 8% to 31% with addition of Ca2+ and Mg2+ ions into the solutions. Figure 12 shows the pitting potentials of 310S stainless steel in the two solutions with different concentration ratios. As the concentration ratio increased from 1 to 10 times, the pitting potentials gradually decreased in the two solutions; however, the pitting potentials were about 35 to 200 mV higher in the synthetic tap water solution than in the Ca2+ and Mg2+-free solution. These results are consistent with the Rp results in Table 2. The presence of carbonate deposits clearly reduced the pitting tendency of 310S stainless steel in the synthetic tap water solutions. In addition, the pitting potential greatly dropped from about 756 to 494 mVSCE (i.e., 262 mV) as the concentration ratio changed from 1 to 2 times for the synthetic tap water solution, but slightly decreased from 494 to 429 mVSCE (i.e., 65 mV) with the further increase in concentration ratio from 2 to 10 times. It is clear that the pitting resistance was reduced to a certain degree with the increase in concentration ratio.
It is well known that halide ions are a key factor leading to pitting corrosion for the passive metals. There are more Cl ions in the solutions with the increase in the concentration ratio from 1 to 10 times. This may result in more Cl ions adsorbed on the specimen surface and the formation of a passive film with more defects [39], which are responsible for the ensuing decrease in Rp and Ep values in Table 2 and Figure 12 under higher concentration ratio conditions. Therefore, the specimen will display relatively lower passive state stability and pitting resistance as the concentration of tap water increases. However, the presence of Ca2+ and HCO3 ions in the solution inevitably gives rise to precipitation reactions:
HCO3 → CO32− + H+
Ca2+ + CO32− → CaCO3
The carbonate deposits will prevent the adsorption of Cl ions on the specimen surface. This may restrain the destructive action of Cl ions on the passive film and lead to the formation of a passive film with less defects [40,41]. As a result, the values of OCP, Rp, and Ep were higher in the synthetic tap water solutions than in the Ca2+ and Mg2+-free solutions. It is clear that the Cl ions and carbonate deposits had opposite effects on the growth of passive films and the pitting initiation in the corrosion process, and the former was stronger than the latter to some extent. Their comprehensive effect was mainly responsible for the slight decrease in the Ep value when the concentration ratio was higher than 2 times. In addition, it should be noted that MgCO3 has a solubility of about 1.0 × 10⁻⁵ mol L−1, which is much larger than that of CaCO3 (i.e., about 5.5 × 10⁻⁶ mol L−1) [42,43]. At the same time, the concentration of Ca2+ ions is three times that of Mg2+ ions in solution (Table 2). Therefore, the deposition of MgCO3 must be very small, which may not be detected by the EDS and XRD analyses in Figure 8 and Figure 9.
Pitting corrosion occurred after the polarization measurements in Figure 7. The anodic dissolution of metal produces metallic cations in the pits, which must attract anions such as Cl, HCO3, and CO32− ions to migrate to the pits. The Cl ions have strong penetration and adsorption properties and can easily enter the pits to maintain the electrical neutrality of solution [44]. The HCO3 and CO32− ions combine with Ca2+ ions to form carbonate deposits around the pits. At the same time, metallic cations will migrate out from the pits and promote the nucleation of carbonate deposits [45]. As a result, there were many carbonate deposits formed around the pits, as observed in Figure 7.

5. Conclusions

Through the electrochemical measurements and surface analyses, the influence of different concentrations and carbonate deposits on the corrosion performance of 310S stainless steel was investigated in a synthetic tap water solution at 80 °C. The main conclusions are as follows:
(1)
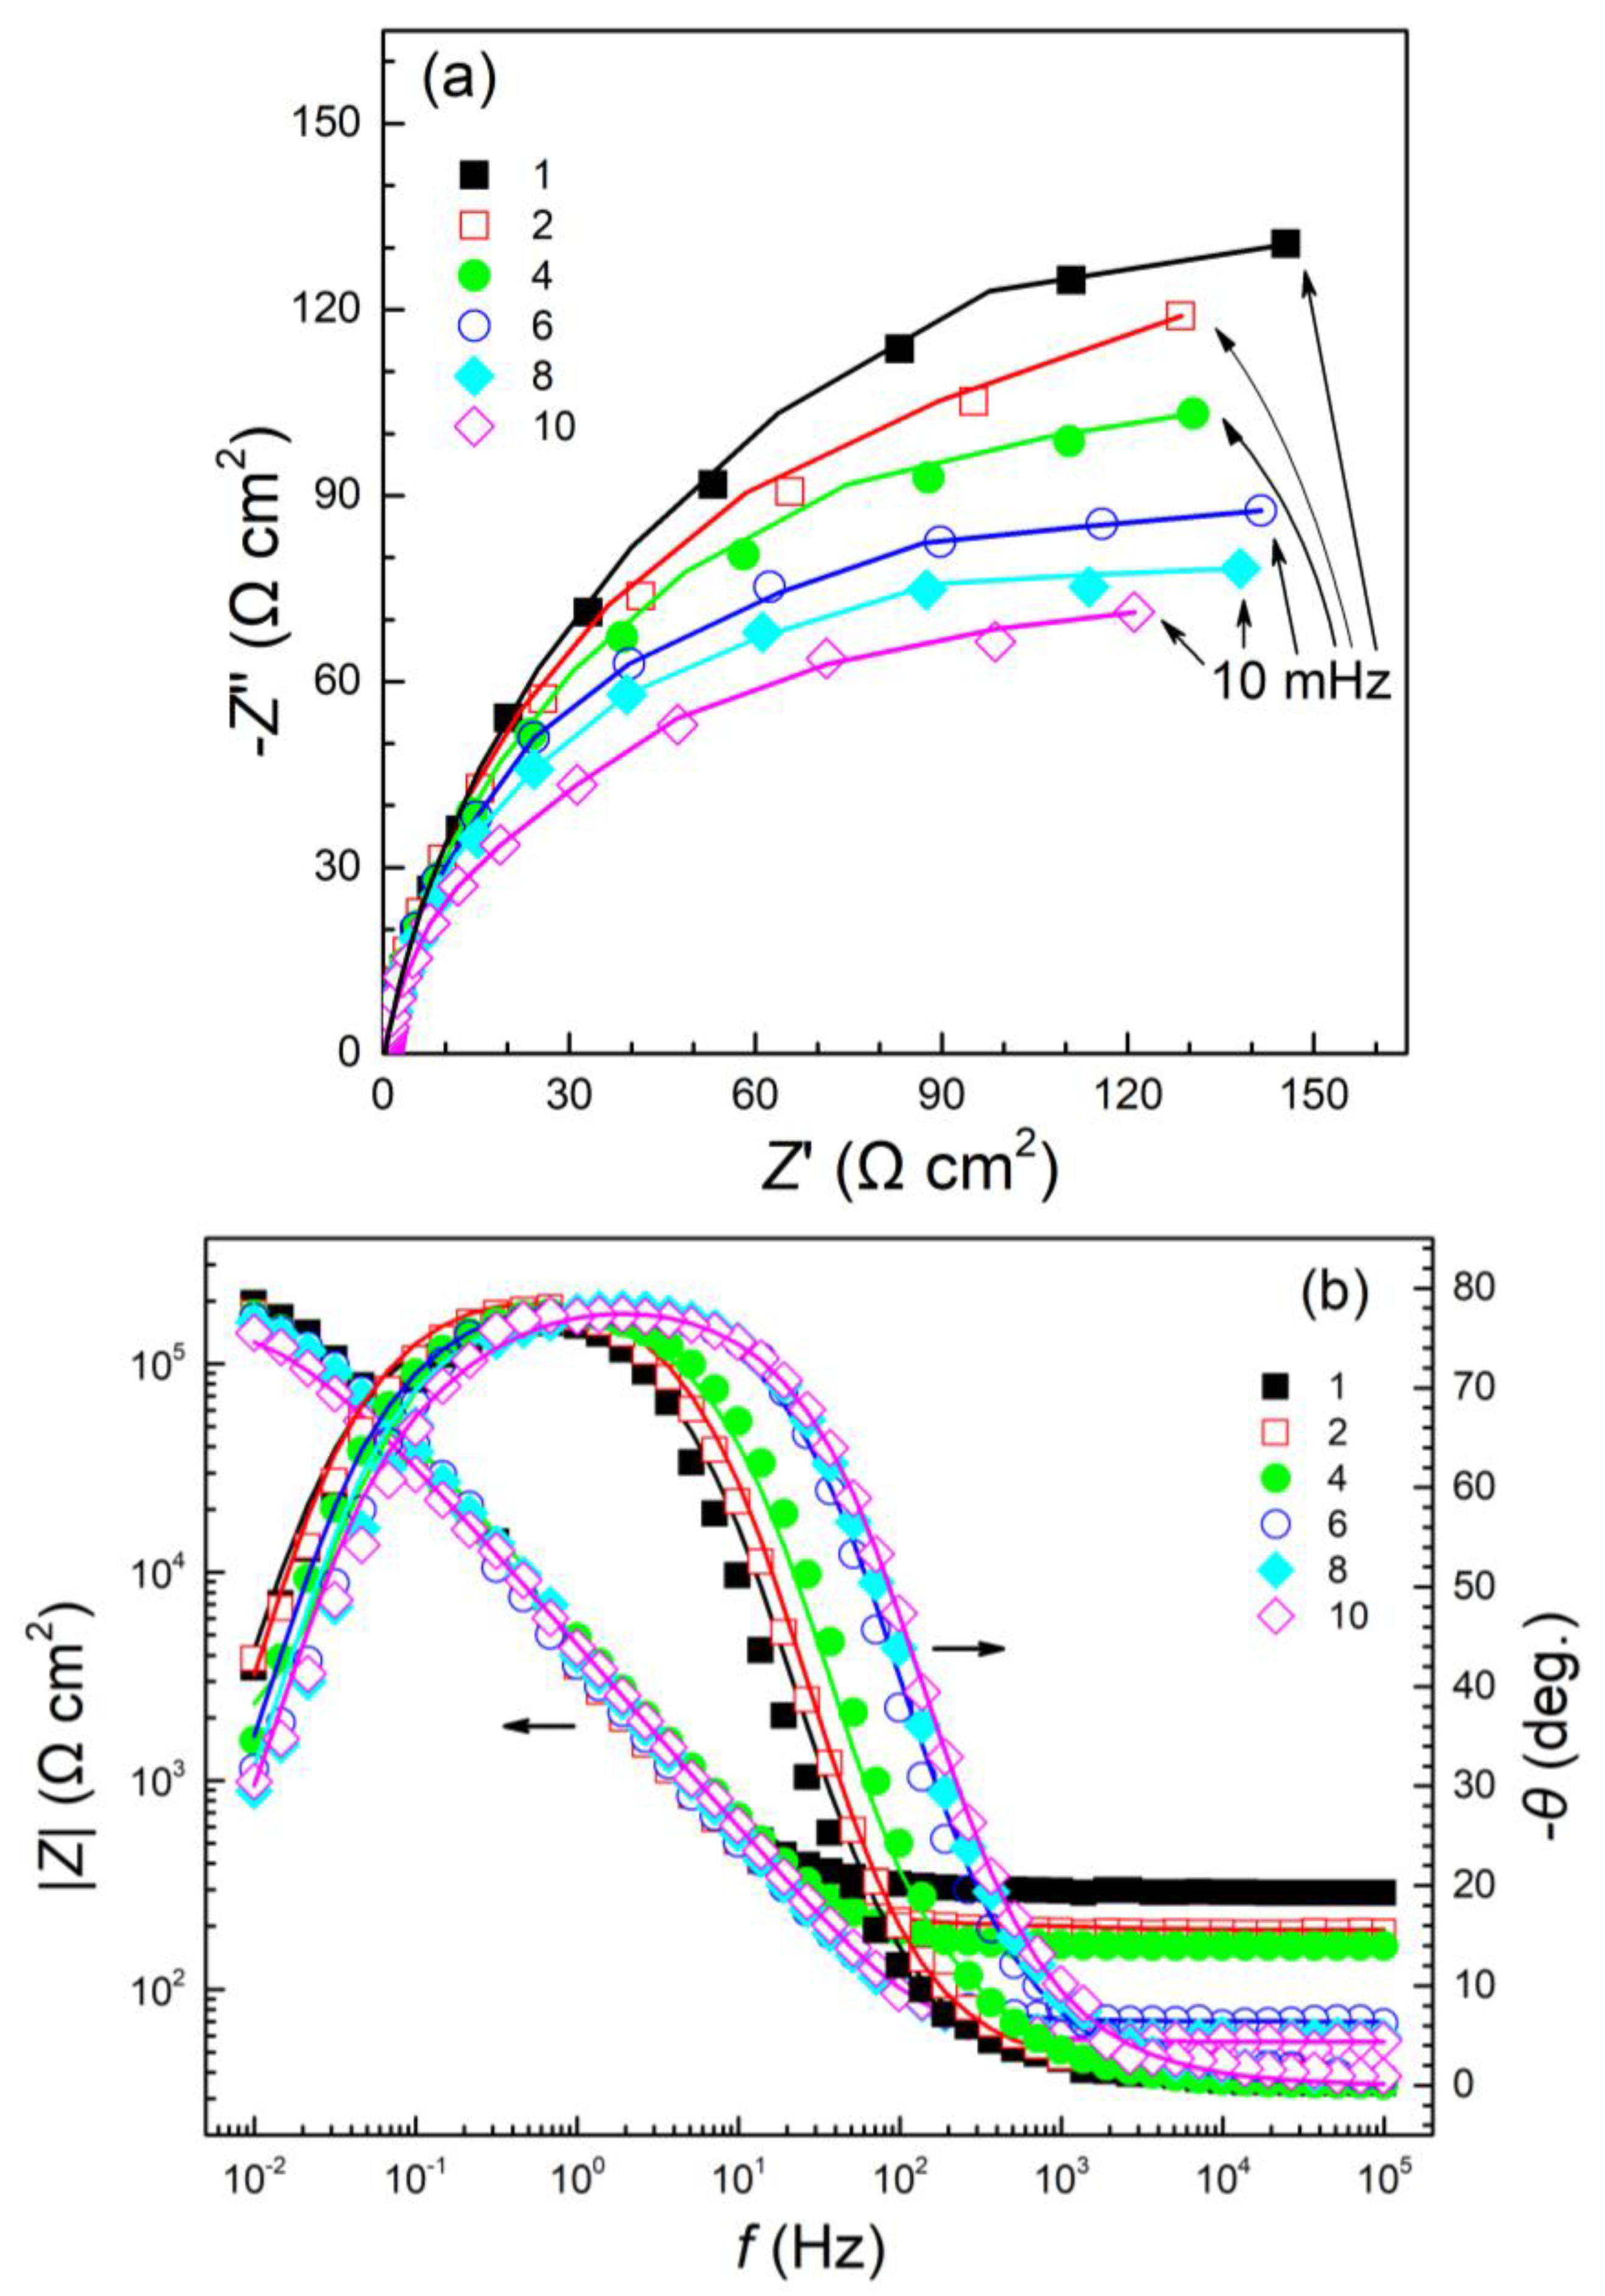
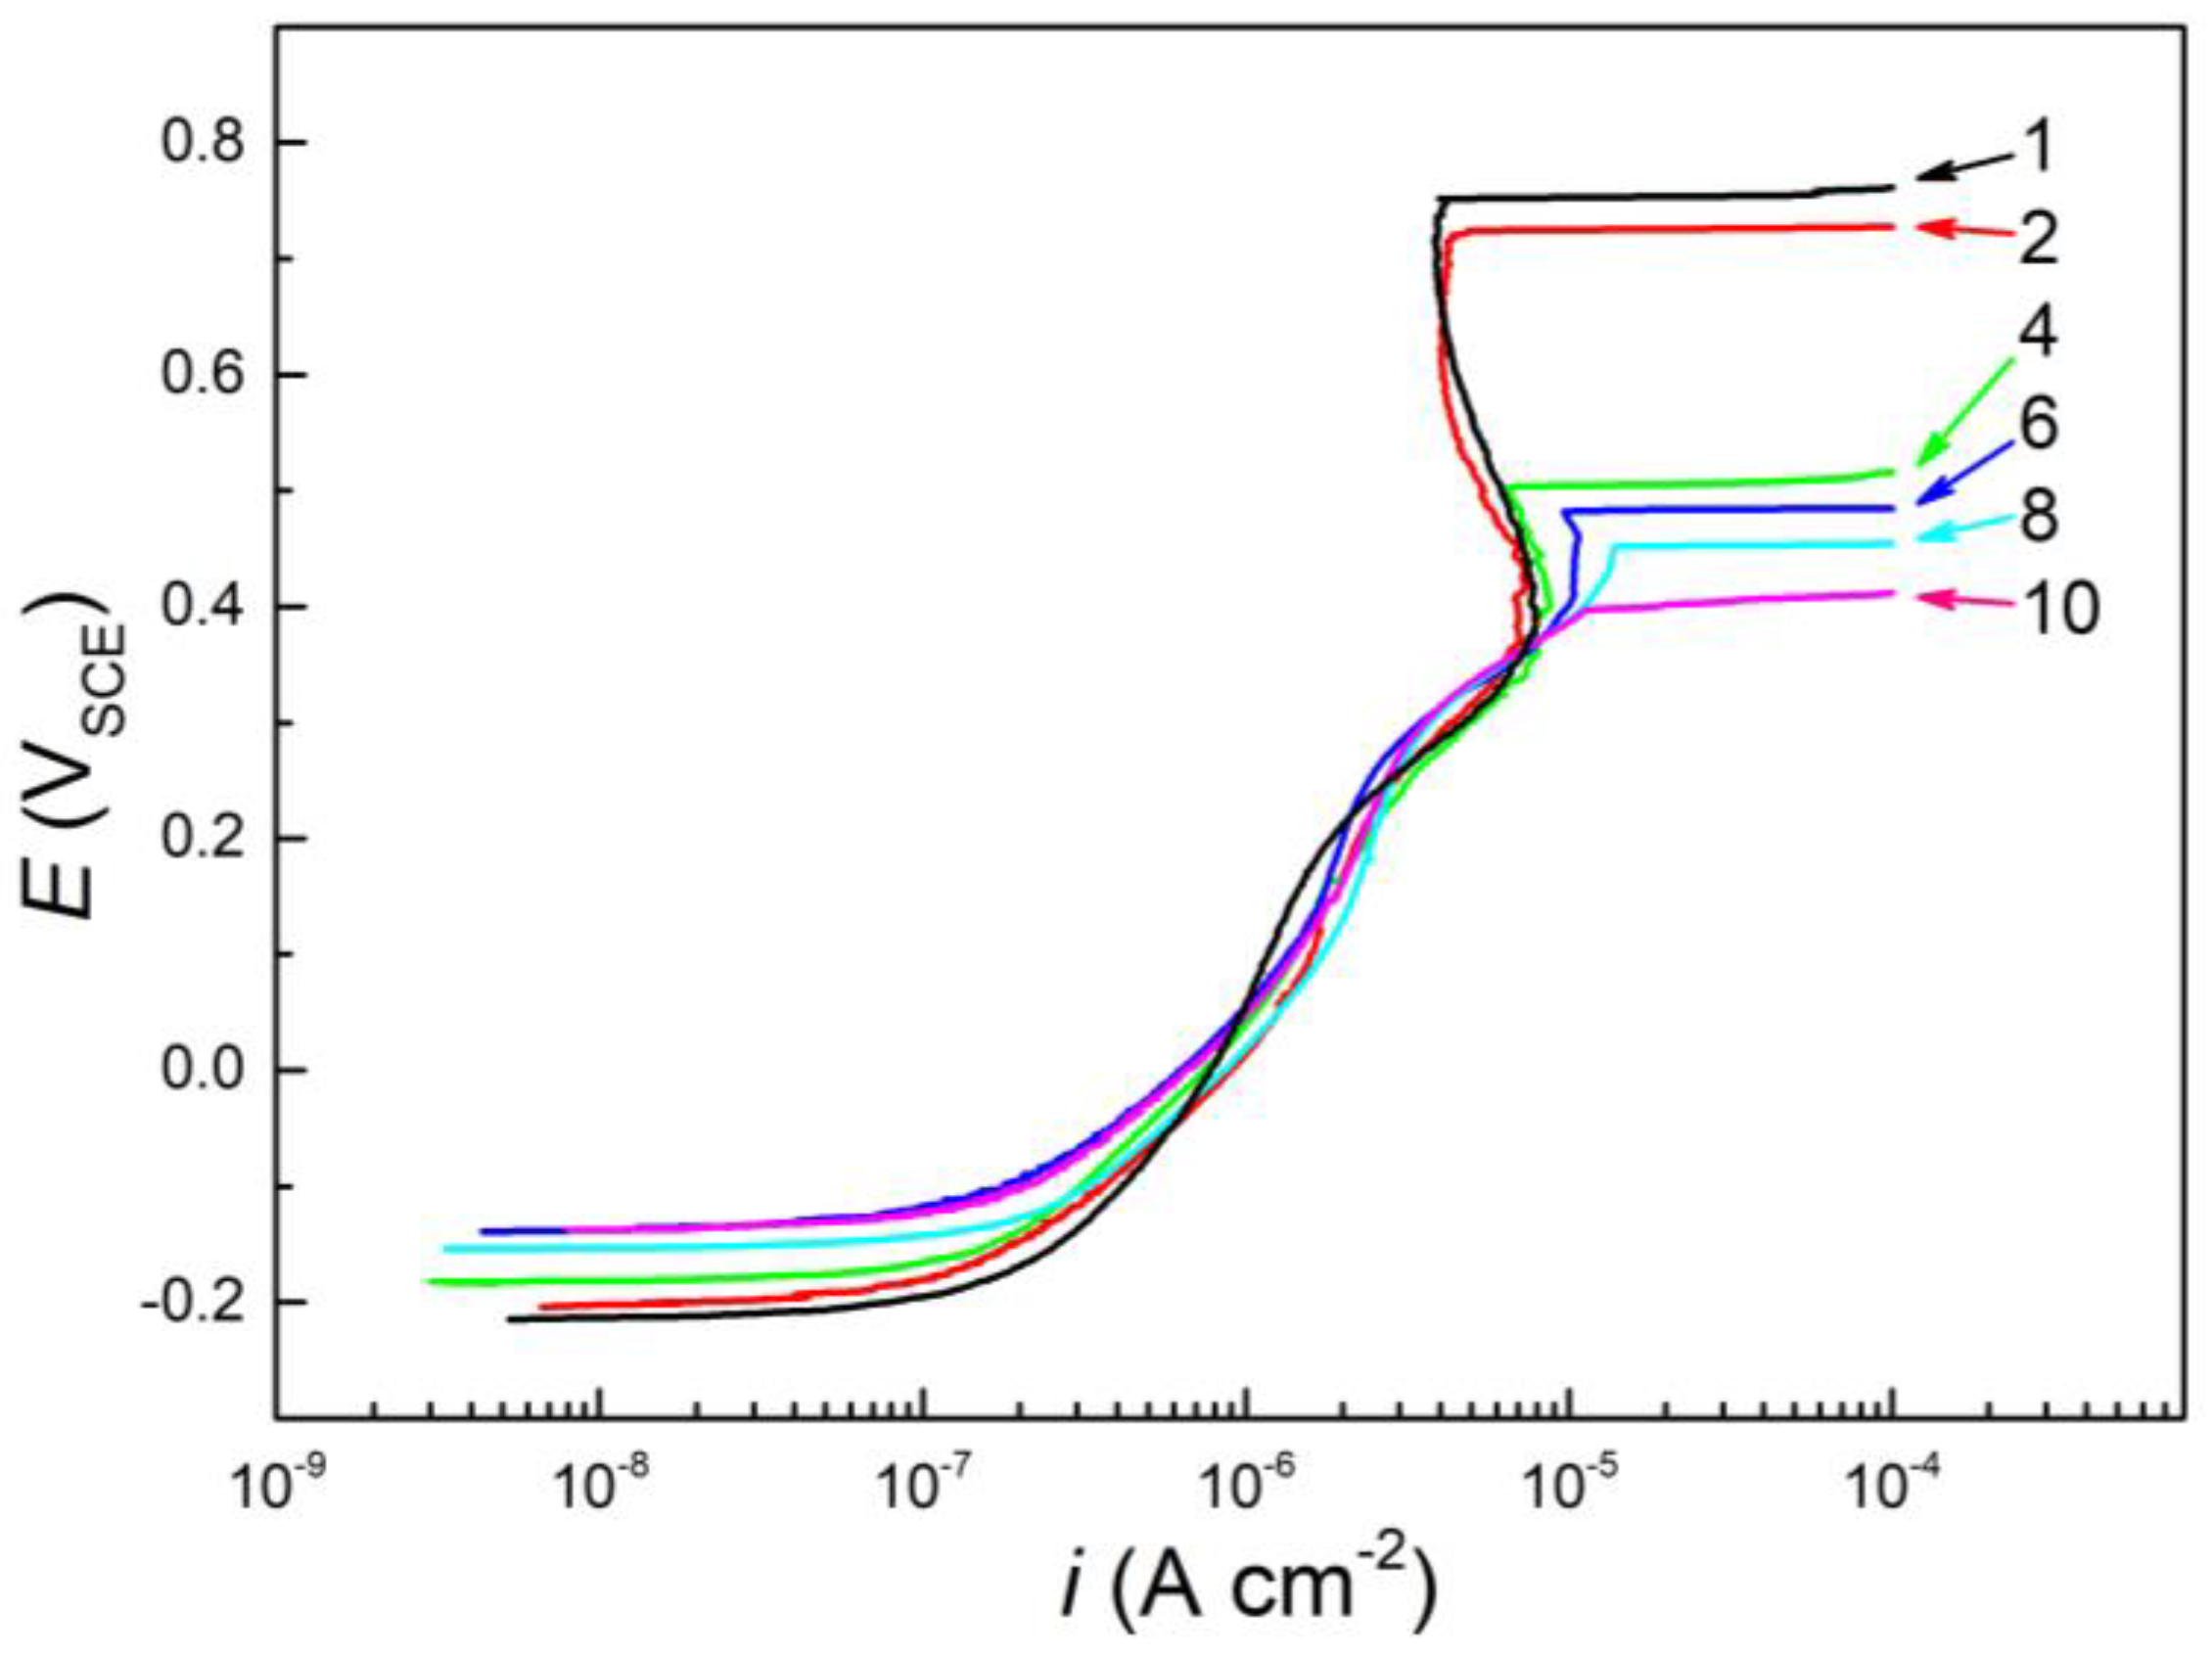
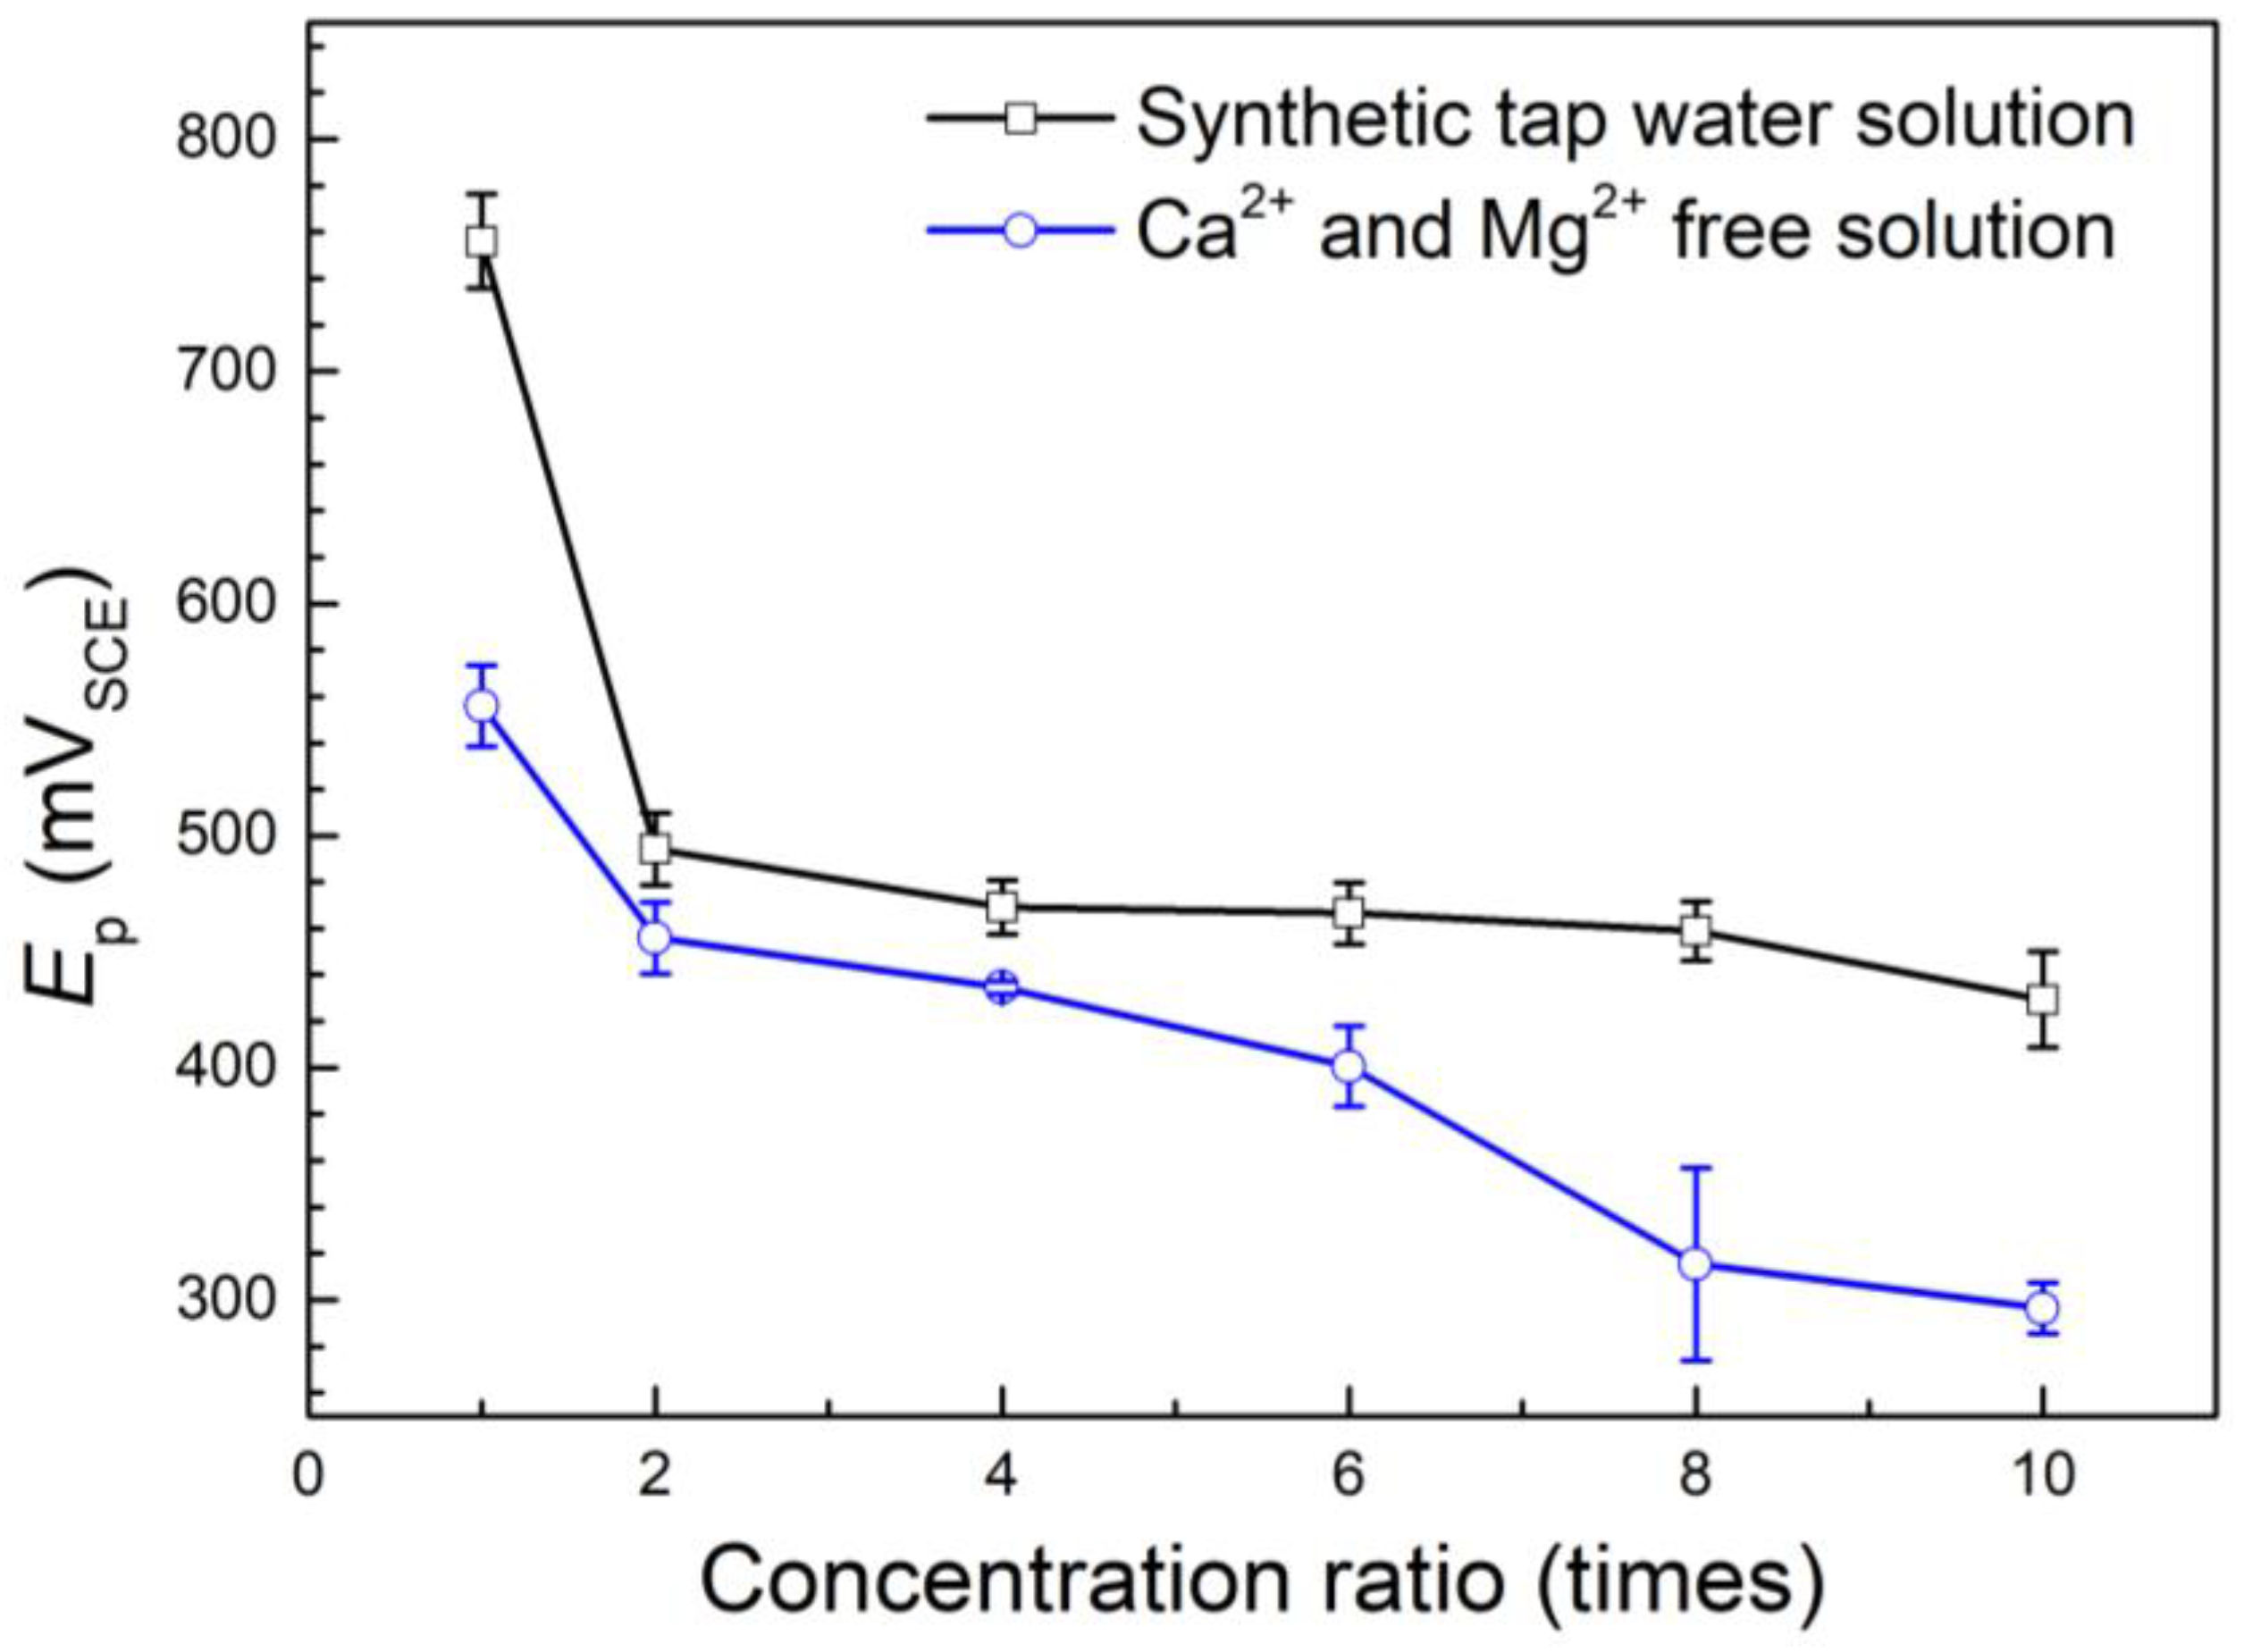
As the concentration ratio of the synthetic tap water solution increased from 1 to 10 times, 310S stainless steel passivated spontaneously, but its polarization resistance was noticeably reduced by about 48% under free corrosion conditions. The pitting potential dropped by about 262 mV with the change in concentration ratio from 1 to 2 times, but decreased slightly (about 65 mV) with the further increase in concentration ratio. The concentration of tap water increased the pitting tendency of 310S stainless steel mainly due to the presence of more Cl- ions.
(2)
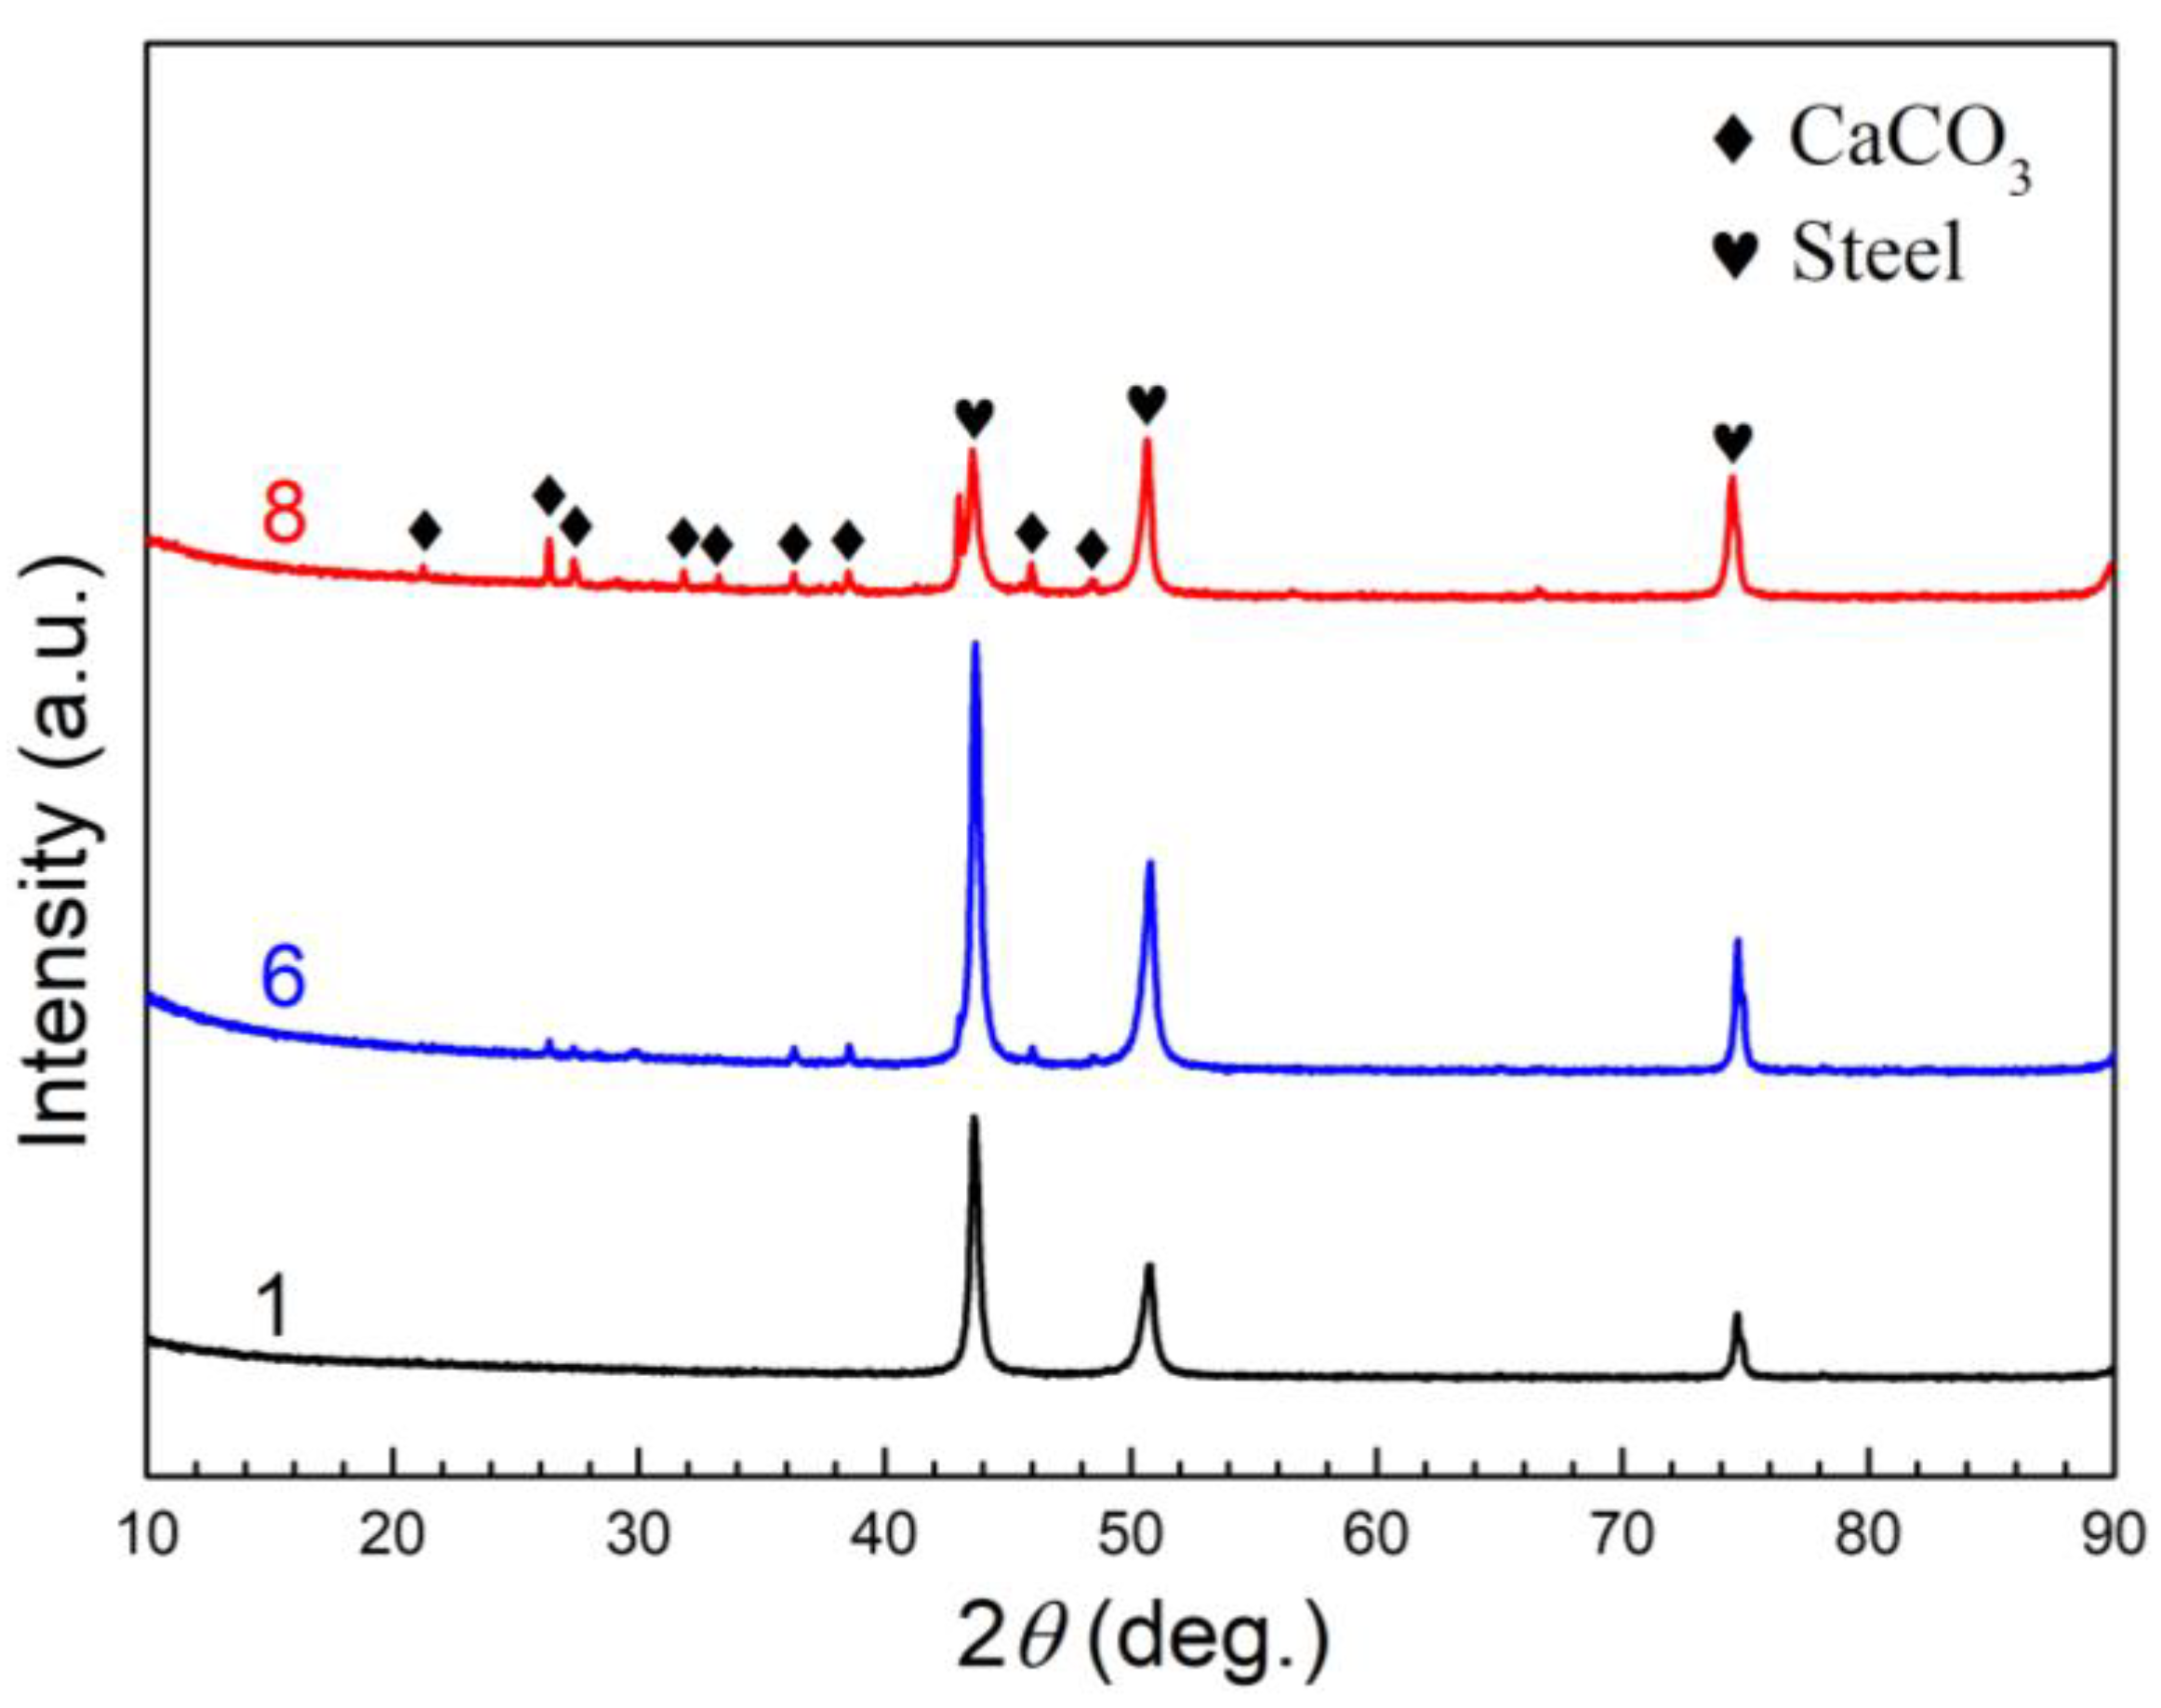
The concentration of synthetic tap water facilitates the deposition of CaCO3 on 310S stainless steel surface. In the synthetic tap water solutions with 1 to 10 times concentration ratios, the polarization resistance under free corrosion conditions increased about 10% to 19% and the pitting potential became about 35 to 200 mV higher due to the formation of carbonate scale in comparison with the solutions without Ca2+ and Mg2+ ions.

Author Contributions

Conceptualization, validation, formal analysis, W.X. and M.L.; Investigation and writing—original draft preparation, W.X.; Resources, Z.Y.; Validation, L.L.; Supervision and writing—review and editing, M.L. All authors have read and agreed to the published version of the manuscript.

Funding

This research received no external funding.

Data Availability Statement

No new data were created or analyzed in this study. Data sharing is not applicable to this article.

Acknowledgments

W.X. thanks Sensen Xin and Yong Yang (Midea Group) for useful discussions.

Conflicts of Interest

The authors declare no conflict of interest.

References

  1. Behnamian, Y.; Mostafaei, A.; Kohandehghan, A.; Amirkhiz, B.S.; Li, J.; Zahiri, R.; Aghaie, E.; Zheng, W.; Guzonas, D.; Chmielus, M.; et al. Internal oxidation and crack susceptibility of alloy 310S stainless steel after long term exposure to supercritical water at 500 °C. J. Supercrit. Fluids 2017, 120, 161–172. [Google Scholar] [CrossRef]
  2. Amirkhiz, B.S.; Scott, S.X. Microstructural assessment of 310S stainless steel during creep at 800 °C. Materialia 2019, 6, 100330. [Google Scholar] [CrossRef]
  3. Yin, Z. Effect of chloride ion concentration on the corrosion behavior of 304 stainless steel used in the electric water heater. Int. J. Electrochem. Sci. 2022, 17, 220415. [Google Scholar] [CrossRef]
  4. Yin, Z. Electrochemical corrosion behavior of TiN-coated 310S stainless steel in an electric water heater in a simulated environment. Int. J. Electrochem. Sci. 2022, 17, 220235. [Google Scholar] [CrossRef]
  5. Raduta, L.; Nicoara, M.; Cucuruz, L.R.; Locovei, C. Optimal design of heating elements sheathed with INCOLOY superalloy 800. WSEAS Trans. Appl. Theor. Mech. 2010, 5, 208–220. [Google Scholar]
  6. Sezai, I.; Aldabbagh, L.B.Y.; Atikol, U.; Hacisevki, H. Performance improvement by using dual heaters in a storage-type domestic electric water-heater. Appl. Energ. 2005, 81, 291–305. [Google Scholar] [CrossRef]
  7. Abdo, H.S.; Seikh, A.H. Role of NaCl, CO2, and H2S on electrochemical behavior of 304 austenitic stainless steel in simulated oil industry environment. Metals 2021, 11, 1347. [Google Scholar] [CrossRef]
  8. Wu, Y.; Ding, J.; Zhang, Z.; Zhao, Y.; Cai, N. Study on fracture failure behavior of super 13Cr tubing caused by deposited corrosion. Metals 2023, 13, 498. [Google Scholar] [CrossRef]
  9. Martin, U.; Bastidas, D.M. Stress corrosion cracking mechanisms of UNS S32205 duplex stainless steel in carbonated solution induced by chlorides. Metals 2023, 13, 157. [Google Scholar] [CrossRef]
  10. Torres, C.; Iannuzzi, M.; Johnsen, R. Use of the critical acidification model to estimate the influence of W in the localized corrosion resistance of 25Cr super duplex stainless steels. Metals 2020, 10, 1364. [Google Scholar] [CrossRef]
  11. Veleva, L.; Bonfil, D.; Bacelis, Á.; Feliu, S., Jr.; Cabrini, M.; Lorenzi, S. Corrosion activity of carbon steel B450C and low chromium ferritic stainless steel 430 in chloride-containing cement extract solution. Metals 2022, 12, 150. [Google Scholar] [CrossRef]
  12. Radwan, A.B.; Moussa, A.M.; Alqahtani, N.H.; Raymundo, C.; Homero, C.; Aboubakr, M.A.; Muhsen, A.M.E.; Jolly, B.; Noora, J.A. Evaluation of the pitting corrosion of modified martensitic stainless steel in CO2 environment using point defect model. Metals 2022, 12, 233. [Google Scholar] [CrossRef]
  13. Dasterdi, A.A.; Brenna, A.; Ormellese, M.; Pedeferri, M.; Bolzoni, F. Experimental design to study the influence of temperature, pH, and chloride concentration on the pitting and crevice corrosion of UNS S30403 stainless steel. Corros. Sci. 2019, 159, 108160. [Google Scholar] [CrossRef] [Green Version]
  14. Jun, J.; Frankel, G.S.; Sridhar, N. Effect of chloride concentration and temperature on growth of 1D Pit. J. Solid State Electrochem. 2015, 19, 3439–3447. [Google Scholar] [CrossRef]
  15. Liu, W.; Yang, H.; Li, X.; Deng, K.; Zhang, Z.; Lin, Y. Effect of chloride and iodide on the corrosion behavior of 13Cr stainless steel. Metals 2022, 12, 1833. [Google Scholar] [CrossRef]
  16. Schmuki, P. From Bacon to barriers: A review on the passivity of metals and alloys. J. Solid State Electrochem. 2014, 6, 145–164. [Google Scholar] [CrossRef]
  17. Frankel, G.S. Pitting corrosion of metals: A review of the critical factors. J. Electrochem. Soc. 1998, 145, 2186. [Google Scholar] [CrossRef]
  18. Zhang, M.J.; Xu, R.H.; Liu, L.L.; Xin, S.S.; Li, M.C. Electrochemical corrosion behavior of type 444 stainless steel in synthetic tap water at different temperatures. Anti-Corros. Meth. Mater. 2020, 67, 407–414. [Google Scholar] [CrossRef]
  19. Niu, L.B.; Nakada, K. Effect of chloride and sulfate ions in simulated boiler water on pitting corrosion behavior of 13Cr steel. Corros. Sci. 2015, 96, 171–177. [Google Scholar] [CrossRef] [Green Version]
  20. Moayed, M.H.; Newman, R.C. Deterioration in critical pitting temperature of 904L stainless steel by addition of sulfate ions. Corros. Sci. 2006, 48, 3513–3530. [Google Scholar] [CrossRef]
  21. Kolics, A.; Polkinghorne, J.C.; Wieckowski, A. Adsorption of sulfate and chloride ions on aluminum. Electrochim. Acta 1998, 43, 2605–2618. [Google Scholar] [CrossRef]
  22. Macdougall, B. Effect of chloride ion on the localized breakdown of nickel oxide films. J. Electrochem. Soc. 1979, 126, 919. [Google Scholar] [CrossRef]
  23. Ma, G.Q.; Xian, W.; Bi, H.Y.; Li, M.C. Effect of short-time aging on the sensitization characteristics of 310S stainless steel. Int. J. Electrochem. Sci. 2022, 17, 22097. [Google Scholar] [CrossRef]
  24. Yang, Y.; Liu, L.L.; Bi, H.Y.; Zeng, H.T.; Hou, X.L.; Li, M.C. Corrosion evolution of 2205 duplex stainless steel in hot concentrated seawater under intermittent vacuum and boiling conditions. Corros. Sci. 2021, 193, 109881. [Google Scholar] [CrossRef]
  25. Escrivà-Cerdán, C.; Blasco-Tamarit, E.; García-García, D.M.; García-Antón, J.; Akid, J.; Walton, J. Effect of temperature on passive film formation of UNS N08031 Cr–Ni alloy in phosphoric acid contaminated with different aggressive anions. Electrochim. Acta 2013, 111, 552–561. [Google Scholar] [CrossRef]
  26. Blasco-tamarit, E.; Igual-muñoz, A.; Antón, J.G.; García-García, D. Effect of temperature on the corrosion resistance and pitting behaviour of Alloy 31 in LiBr solutions. Corros. Sci. 2008, 50, 1848–1857. [Google Scholar] [CrossRef]
  27. Barchiche, C.; Deslouis, C.; Festy, D.; Refait, D.; Touzain, S.; Tribollet, B. Characterization of calcareous deposits in artificial seawater by impedance techniques. Electrochim. Acta 2003, 48, 1645–1654. [Google Scholar] [CrossRef]
  28. Wu, K.H.; Zhu, L.Q.; Li, W.P.; Liu, H.C. Effect of Ca2+ and Mg2+ on corrosion and scaling of galvanized steel pipe in simulated geothermal water. Corros. Sci. 2010, 52, 2244–2249. [Google Scholar] [CrossRef]
  29. Loste, E.; Wilson, R.M.; Seshadri, R.; Meldrum, F.C. The role of magnesium in stabilising amorphous calcium carbonate and controlling calcite morphologies. J. Cryst. Growth 2003, 254, 206–218. [Google Scholar] [CrossRef]
  30. Clarkson, J.R.; Price, T.J.; Adams, C.J. Role of metastable phases in the spontaneous precipitation of calcium carbonate. J. Chem. Soc. 1992, 88, 243–249. [Google Scholar] [CrossRef]
  31. Breevi, L.; Nielsen, A.E. Solubility of amorphous calcium carbonate. Connect. Tissue Res. 1989, 98, 504–510. [Google Scholar] [CrossRef]
  32. Elfil, H.; Roques, H. Role of hydrate phases of calcium carbonate on the scaling phenomenon. Desalination 2001, 137, 177–186. [Google Scholar] [CrossRef]
  33. Nancollas, G.H.; Sawada, K.J. Formation of scales of calcium carbonate polymorphs: The influence of magnesium Ion and inhibitors. J. Pet. Technol. 1982, 34, 645–652. [Google Scholar] [CrossRef]
  34. Reddy, M.M.; Wang, K.K. Crystallization of calcium carbonate in the presence of metal ions: I. Inhibition by magnesium ion at pH 8.8 and 25 °C. J. Cryst. Growth 1980, 50, 470–480. [Google Scholar] [CrossRef]
  35. Slemnik, M. Effect of testing temperature on corrosion behaviour of different heat treated stainless steels in the active-passive region. Anti-Corros. Meth. Mater. 2008, 55, 20–26. [Google Scholar] [CrossRef]
  36. Luo, X.; Lou, J.; He, H.; Wu, C.; Huang, Y.; Su, N.; Li, S. Effects of carbon content on the properties of novel nitrogen-free austenitic stainless steel with high hardness prepared via metal injection molding. Metals 2023, 13, 403. [Google Scholar] [CrossRef]
  37. Wu, X.; Sun, Y.; Liu, Y.; Yang, Y.; Li, J. The critical pitting chloride concentration of various stainless steels measured by an electrochemical method. J. Electrochem. Soc. 2018, 165, C939–C949. [Google Scholar] [CrossRef]
  38. Kar, S.; Yilmaz, A.; Traka, K.; Sietsma, J.; Gonzalez-Garcia, Y. Role of grain size and recrystallization texture in the corrosion behavior of pure iron in acidic medium. Metals 2023, 13, 388. [Google Scholar] [CrossRef]
  39. Xin, S.S.; Li, M.C. Electrochemical corrosion characteristics of type 316L stainless steel in hot concentrated seawater. Corros. Sci. 2014, 81, 96–101. [Google Scholar] [CrossRef]
  40. Touir, R.; Dkhireche, N.; Touhami, M.E.; Lakhrissi, M.; Kakhrissi, B.; Sfaira, M. Corrosion and scale processes and their inhibition in simulated cooling water systems by monosaccharides derivatives. Desalination 2009, 249, 922–928. [Google Scholar] [CrossRef]
  41. Touir, R.; Cenoui, M.; Elbakri, M.E.; Touhami, M.E. Sodium gluconate as corrosion and scale inhibitor of ordinary steel in simulated cooling water. Corros. Sci. 2008, 50, 1530–1537. [Google Scholar] [CrossRef]
  42. Kline, W.D. The solubility of magnesium carbonate (Nesquehonite) in water at 25° and pressures of carbon dioxide up to one atmosphere1. J. Am. Chem. Soc. 1929, 51, 2093–2097. [Google Scholar] [CrossRef]
  43. Plummer, L.M.; Busenberg, E.J. The solubilities of calcite, aragonite and vaterite in CO2-H2O solutions between 0 and 90 °C, and an evaluation of the aqueous model for the system CaCO3-CO2-H2O. Geochim. Cosmochim. Acta 1982, 46, 1011–1040. [Google Scholar] [CrossRef]
  44. Yang, Y.; Hou, X.L.; Li, M.C. Effect of vacuum pressure on the initiation and propagation of pitting corrosion of 2205 duplex stainless steel in concentrated seawater. Acta Metall. Sin. Engl. Lett. 2022, 35, 1023–1033. [Google Scholar] [CrossRef]
  45. Bansal, B.; Chen, X.D.; Müller-steinhagen, H. Analysis of classical deposition rate law for crystallisation fouling. Chem. Eng. Process. 2008, 47, 1201–1210. [Google Scholar] [CrossRef]
Figure 1. Open circuit potential curves of specimens immersed in the synthetic tap water solutions with different concentration ratios from 1 to 10 times for 60 min.
Metals 13 00713 g001
Figure 2. Impedance spectra (a) Nyquist and (b) Bode for specimens in the synthetic tap water solutions with different concentration ratios from 1 to 10 times. Symbols: experimental data; lines: fitted values.
Metals 13 00713 g002
Figure 3. Polarization curves for specimens in the synthetic tap water solutions with different concentration ratios from 1 to 10 times.
Metals 13 00713 g003
Figure 4. Open circuit potential curves of specimens in the Ca2+ and Mg2+-free solutions with different concentration ratios from 1 to 10 times for 60 min.
Metals 13 00713 g004
Figure 5. Impedance spectra (a) Nyquist and (b) Bode for specimens in the Ca2+ and Mg2+-free solutions with different concentration ratios from 1 to 10 times. Symbols: experimental data; lines: fitted values.
Metals 13 00713 g005
Figure 6. Polarization curves for specimens in the Ca2+ and Mg2+-free solutions with different concentration ratios from 1 to 10 times.
Metals 13 00713 g006
Figure 7. Typical SEM-SE morphologies (×500) of specimen surfaces after the polarization measurement in the synthetic tap water solutions with different concentration ratios: (a,b) 1, (c,d) 6, and (e,f) 8 times.
Metals 13 00713 g007
Figure 8. SEM-EDS mapping of elements for the area marked by the blue rectangle at point A in Figure 7f.
Metals 13 00713 g008
Figure 9. XRD patterns for the specimen surfaces after the polarization measurement in the solutions with the concentration ratio 1, 6 and 8 times.
Metals 13 00713 g009
Figure 10. Variation of corrosion potential with the concentration ratio for specimens in the two solutions.
Metals 13 00713 g010
Figure 11. Equivalent circuit models for the corrosion system of 310S stainless steel in different concentrated solutions [11].
Metals 13 00713 g011
Figure 12. Pitting potentials of specimens in the two solutions with different concentration ratios.
Metals 13 00713 g012
Table 1. EDS results for element content (wt.%) for the area marked in Figure 8.
COCaCrMnFeNi
5.0514.63.1323.311.0140.4612.41
Table 2. Impedance spectrum fitting results of 310S stainless steel in two solutions.
Concentration Ratio
(Times)
Rs
(Ω cm2)
Y0-f
(sα Ω−1 cm−2)
αfY0-dl
(sα Ω−1 cm−2)
αdlRp
(Ω cm2)
The synthetic tap water solutions
12972.05 × 10−50.961.07 × 10−50.902.68 × 105
21901.96 × 10−50.961.16 × 10−50.902.28 × 105
41581.75 × 10−50.961.29 × 10−50.902.15 × 105
6711.69 × 10−50.951.36 × 10−50.921.77 × 105
8581.61 × 10−50.951.39 × 10−50.901.73 × 105
10551.57 × 10−50.951.59 × 10−50.921.39 × 105
The Ca2+ and Mg2+-free solutions
12892.11 × 10−50.962.55 × 10−50.902.39 × 105
21612.26 × 10−50.962.59 × 10−50.901.98 × 105
4712.38 × 10−50.952.62 × 10−50.921.80 × 105
6542.51 × 10−50.962.73 × 10−50.901.61 × 105
8392.54 × 10−50.962.75 × 10−50.881.52 × 105
10342.66 × 10−50.962.77 × 10−50.901.25 × 105
Table 3. Electrochemical parameters for 310S stainless steel in the two solutions.
Concentration Ratio
(Times)
Corrosion Potential
(mVSCE)
Passive Current Density
(μA cm−2)
Pitting Potential
(mVSCE)
The synthetic tap water solutions
1−216.7 ± 2.41.13 ± 0.04755.9 ± 20.2
2−201.1 ± 3.61.54 ± 0.08494.3 ± 15.7
4−185.8 ± 4.31.27 ± 0.06469.0 ± 11.6
6−183.8 ± 1.91.38 ± 0.04466.5 ± 13.1
8−153.1 ± 5.41.64 ± 0.06458.8 ± 12.7
10−136.5 ± 3.61.33 ± 0.04429.4 ± 20.7
The Ca2+ and Mg2+-free solutions
1−184.9 ± 1.31.65 ± 0.02555.8 ± 17.4
2−221.2 ± 3.61.67 ± 0.02456.0 ± 15.3
4−231.2 ± 2.51.58 ± 0.03434.6 ± 2.9
6−233.5 ± 5.31.74 ± 0.06400.6 ± 17.3
8−236.7 ± 2.21.64 ± 0.05315.4 ± 41.5
10−241.7 ± 3.21.93 ± 0.02296.4 ± 10.9
Disclaimer/Publisher’s Note: The statements, opinions and data contained in all publications are solely those of the individual author(s) and contributor(s) and not of MDPI and/or the editor(s). MDPI and/or the editor(s) disclaim responsibility for any injury to people or property resulting from any ideas, methods, instructions or products referred to in the content.

