Article

Preparation of Microstructure Laser Ablation and Multiple Acid-Etching Composites on the Surfaces of Medical Titanium Alloy TC4 by Laser Ablation and Multiple Acid-Etching, and Study of Frictional Properties of the Processed Surfaces

1
School of Mechanical Engineering, Jiangsu University of Science and Technology, Zhenjiang 212003, China
2
Marine Equipment Research Institute, Jiangsu University of Science and Technology, Zhenjiang 212003, China
*
Author to whom correspondence should be addressed.
Metals 2022, 12(7), 1148; https://doi.org/10.3390/met12071148
Submission received: 4 June 2022 / Revised: 26 June 2022 / Accepted: 27 June 2022 / Published: 6 July 2022
(This article belongs to the Section Structural Integrity of Metals)

Abstract

:
In this paper, four array patterns were first designed by observing the structural features of the surface microstructures of pig bones and tree frog paws on the titanium alloy surface bionically. Then, the optimal parameters for laser processing were determined experimentally, and the optimized processing parameters were used to prepare micron-scale bumps on the titanium alloy surface and to investigate the relationship between the weaving height and the processing times. Finally, multiple acid etching was used to prepare nanoscale holes on the surface of the titanium alloy. It was found that the multiple acid etching could not only prepare nanoscale holes on the surface of the titanium alloy, but could also well eliminate the slag left on the surface of titanium alloy by laser ablation. Based on the above study, this paper also analyzed the effect of micro-nano structure on the friction properties of the titanium alloy surface from three aspects—theory, hardness test and friction coefficient test—and experimentally analyzed the effect of single-factor and multi-factor coupling of structural features on the friction properties of the titanium alloy surface. It was found that the optimal mean friction coefficient was 0.0902, corresponding to the characteristic values of 0.66 for the shape, 200 μm for the edge length and 60 μm for the height.

1. Introduction

Since the 21st century, the number of bone tissue injuries worldwide has increased due to a series of uncontrollable factors, such as accidents at work, natural disasters, and traffic accidents. According to social statistics, the number of people injured by bone tissue due to various reasons is more than several million worldwide every year [1], and the trend is increasing; however, the number of patients who can actually obtain natural bone grafts is very low, and in the absence of a large number of natural bones, artificial bone (Artificial Bone) has become a new method of choice for patients. Currently, calcium phosphate bioceramics, medical stainless steel, cobalt-based alloys and titanium alloys are commonly used in the market to manufacture artificial bone, due to the excellent corrosion resistance, low elastic modulus, easy processing and other excellent properties of titanium and its alloys, used in large quantities in the medical field [2,3]. According to sociological statistics, 90% of artificial bone prostheses worldwide are currently made of titanium and its alloys [4]; due to the huge market demand, research on artificial bone is becoming more and more urgent.
Before the research on micro-weaving, titanium-alloy artificial bone needed to be refined to obtain a smooth surface, but in recent years, a lot of research has found that the surface modification of rough titanium-alloy artificial bone has better friction reduction and biocompatibility properties and is more suitable for the human internal environment [5,6,7,8,9]. The design and fabrication of reasonable micron-level and nano-level composite structures on the surface of a titanium alloy can improve the friction-reducing properties of titanium-alloy artificial bone and enhance the bond between titanium-alloy artificial bone and natural bone tissue, in addition to ensuring the original excellent matrix properties. Therefore, the treatment of micro-nano structure on the surface of titanium alloy is of great importance for titanium-alloy artificial bone.
At present, there are few and expensive options to take a method to prepare the micro-nano composite structure directly, and nowadays, the main method is to process the micron-level structure on the material surface first and then to process the nano-level structure to obtain the micro-nano composite structure, and the contemporary methods to cooperate are: microfabrication and alkali thermal processing/anodizing, laser processing and acid etching, sandblasting and multiple acid etching/alkali thermal processing, processing techniques which are elaborated in the subsequent paragraphs.
Microfabrication is capable of machining micron-scale structures of different sizes on the material surface, based on which micro-nano composite structures are obtained in combination with alkali heat treatment or anodic oxidation methods. Wan et al. [10] sprayed a low-melting-point support material on the surface of a titanium alloy after microfabrication, and then used anodic oxidation to prepare TiO2 nanotubes on the surface of the titanium alloy to obtain micro-nano composite structures.
The sandblasting method mainly involves obtaining power through compressed air and spraying the spray material (quartz sand, iron sand and diamond sand) at high speed from the hole to the surface of the surrogate material, which makes the surface of the surrogate material change. Various sharp edges exist on the surface processed by the sandblasting method, which can be removed by alkali heat treatment or acid etching to prepare nanostructures at the same time. Wang et al. [11] used a combination of sandblasting and alkali heat treatment to process micro-craters with nanorod structures on the surface of titanium alloys.
The most popular method for processing micron-scale structures is laser processing, which uses the energy emitted by a laser beam to melt and vaporize the material surface to prepare micron structures, which is efficient, controllable and fast, and the surface hardness of the laser-treated material increases, wear resistance increases and corrosion resistance increases. Brnemark [12] found, through animal experiments, that surface modification by laser ablation increased the pull-out torque of artificial bone by 150% compared to other mechanical processing methods, resulting in a tighter bond with natural bone. Bo Men [13] first processed circular micron-sized pit arrays on the surface of titanium alloy by laser processing, and then prepared irregular nanopores by multiple acid etching. The surface morphology of the micro-nano composite structures obtained by the combination of laser processing and acid-etching treatment was clear and regular, and the slag and debris generated by laser processing were also removed.
Research on the micro-nano structure of the titanium alloy surface is relatively mature, but there is a relative lack of research on the effect of different structural parameters (such as shape, edge length, height, etc.) on the friction reduction effect of the micro-nano structure. In this paper, we firstly designed four array patterns on the surface of a titanium alloy by observing the structural features of pig bone and tree frog foot surface bionically, then analyzed the optimal parameters of laser processing and the processing method of acid-etching treatment through experiments, and finally, analyzed the mechanism of friction reduction of micro-nano structure on the surface of titanium alloy, and analyzed the effect of single-factor and multi-factor coupling of micro-weave geometric features on the friction performance of the multi-titanium alloy surface. The flow of the research in this paper is shown in the following Figure 1:

2. Materials and Methods

2.1. Medical Titanium Alloy Material and Preparation Process

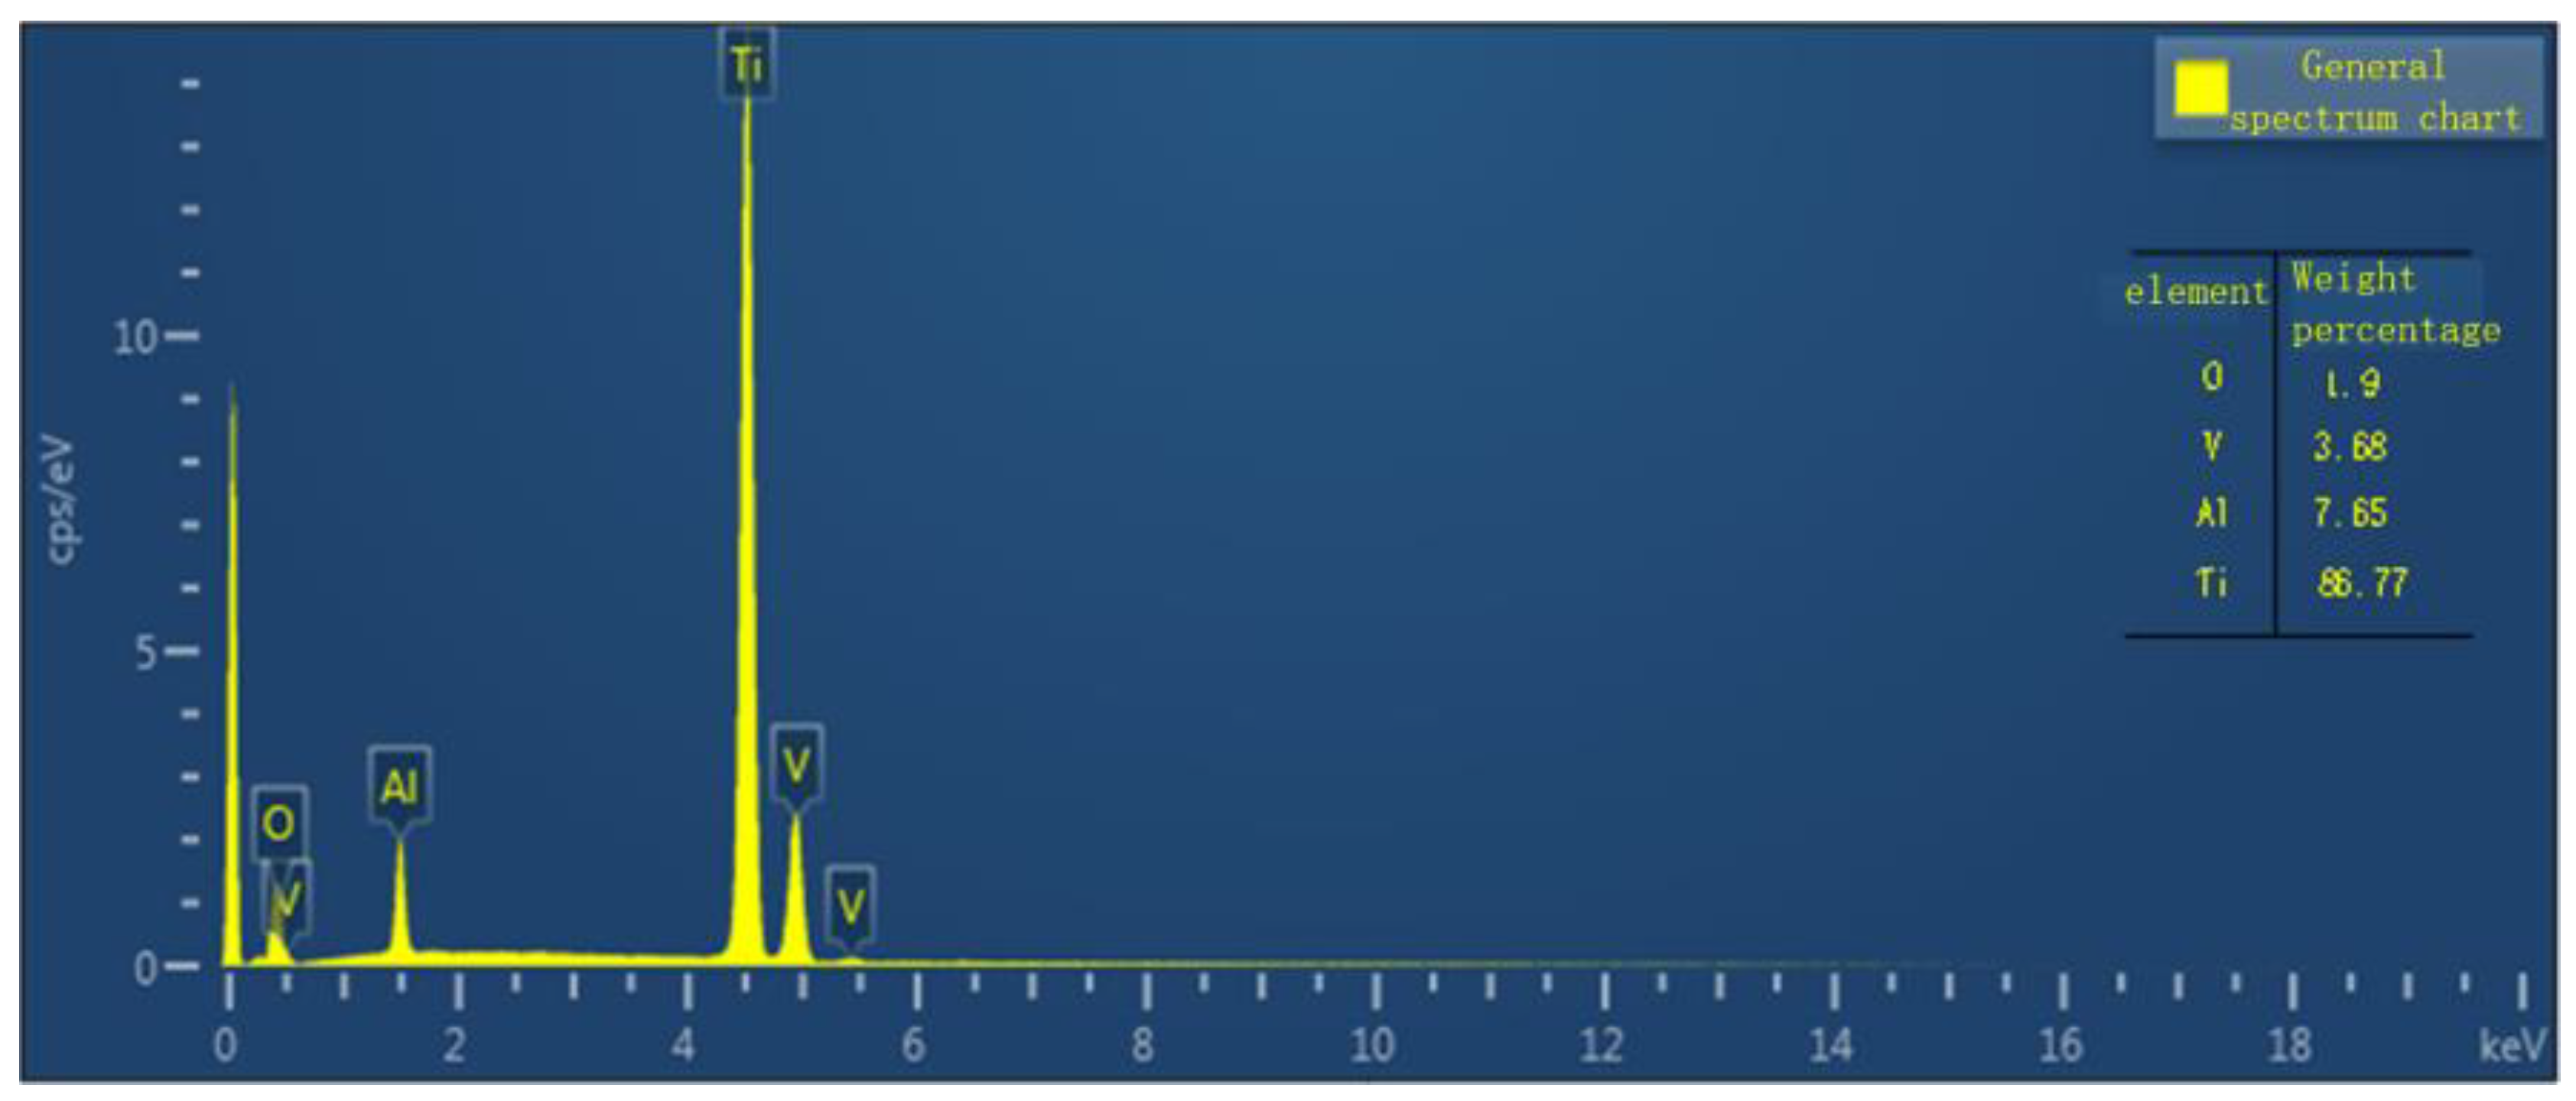
2.1.1. Experimental Materials

In this study, TC4 titanium alloy, whose chemical formula is Ti6Al4V, was selected as the artificial bone material. The alloy is an α + β-type titanium alloy with excellent corrosion resistance, high specific strength, low density and low modulus of elasticity, which is used in a large number of artificial bone implant fields. The chemical composition and material properties of TC4 are shown in Table 1 and Table 2 [13].

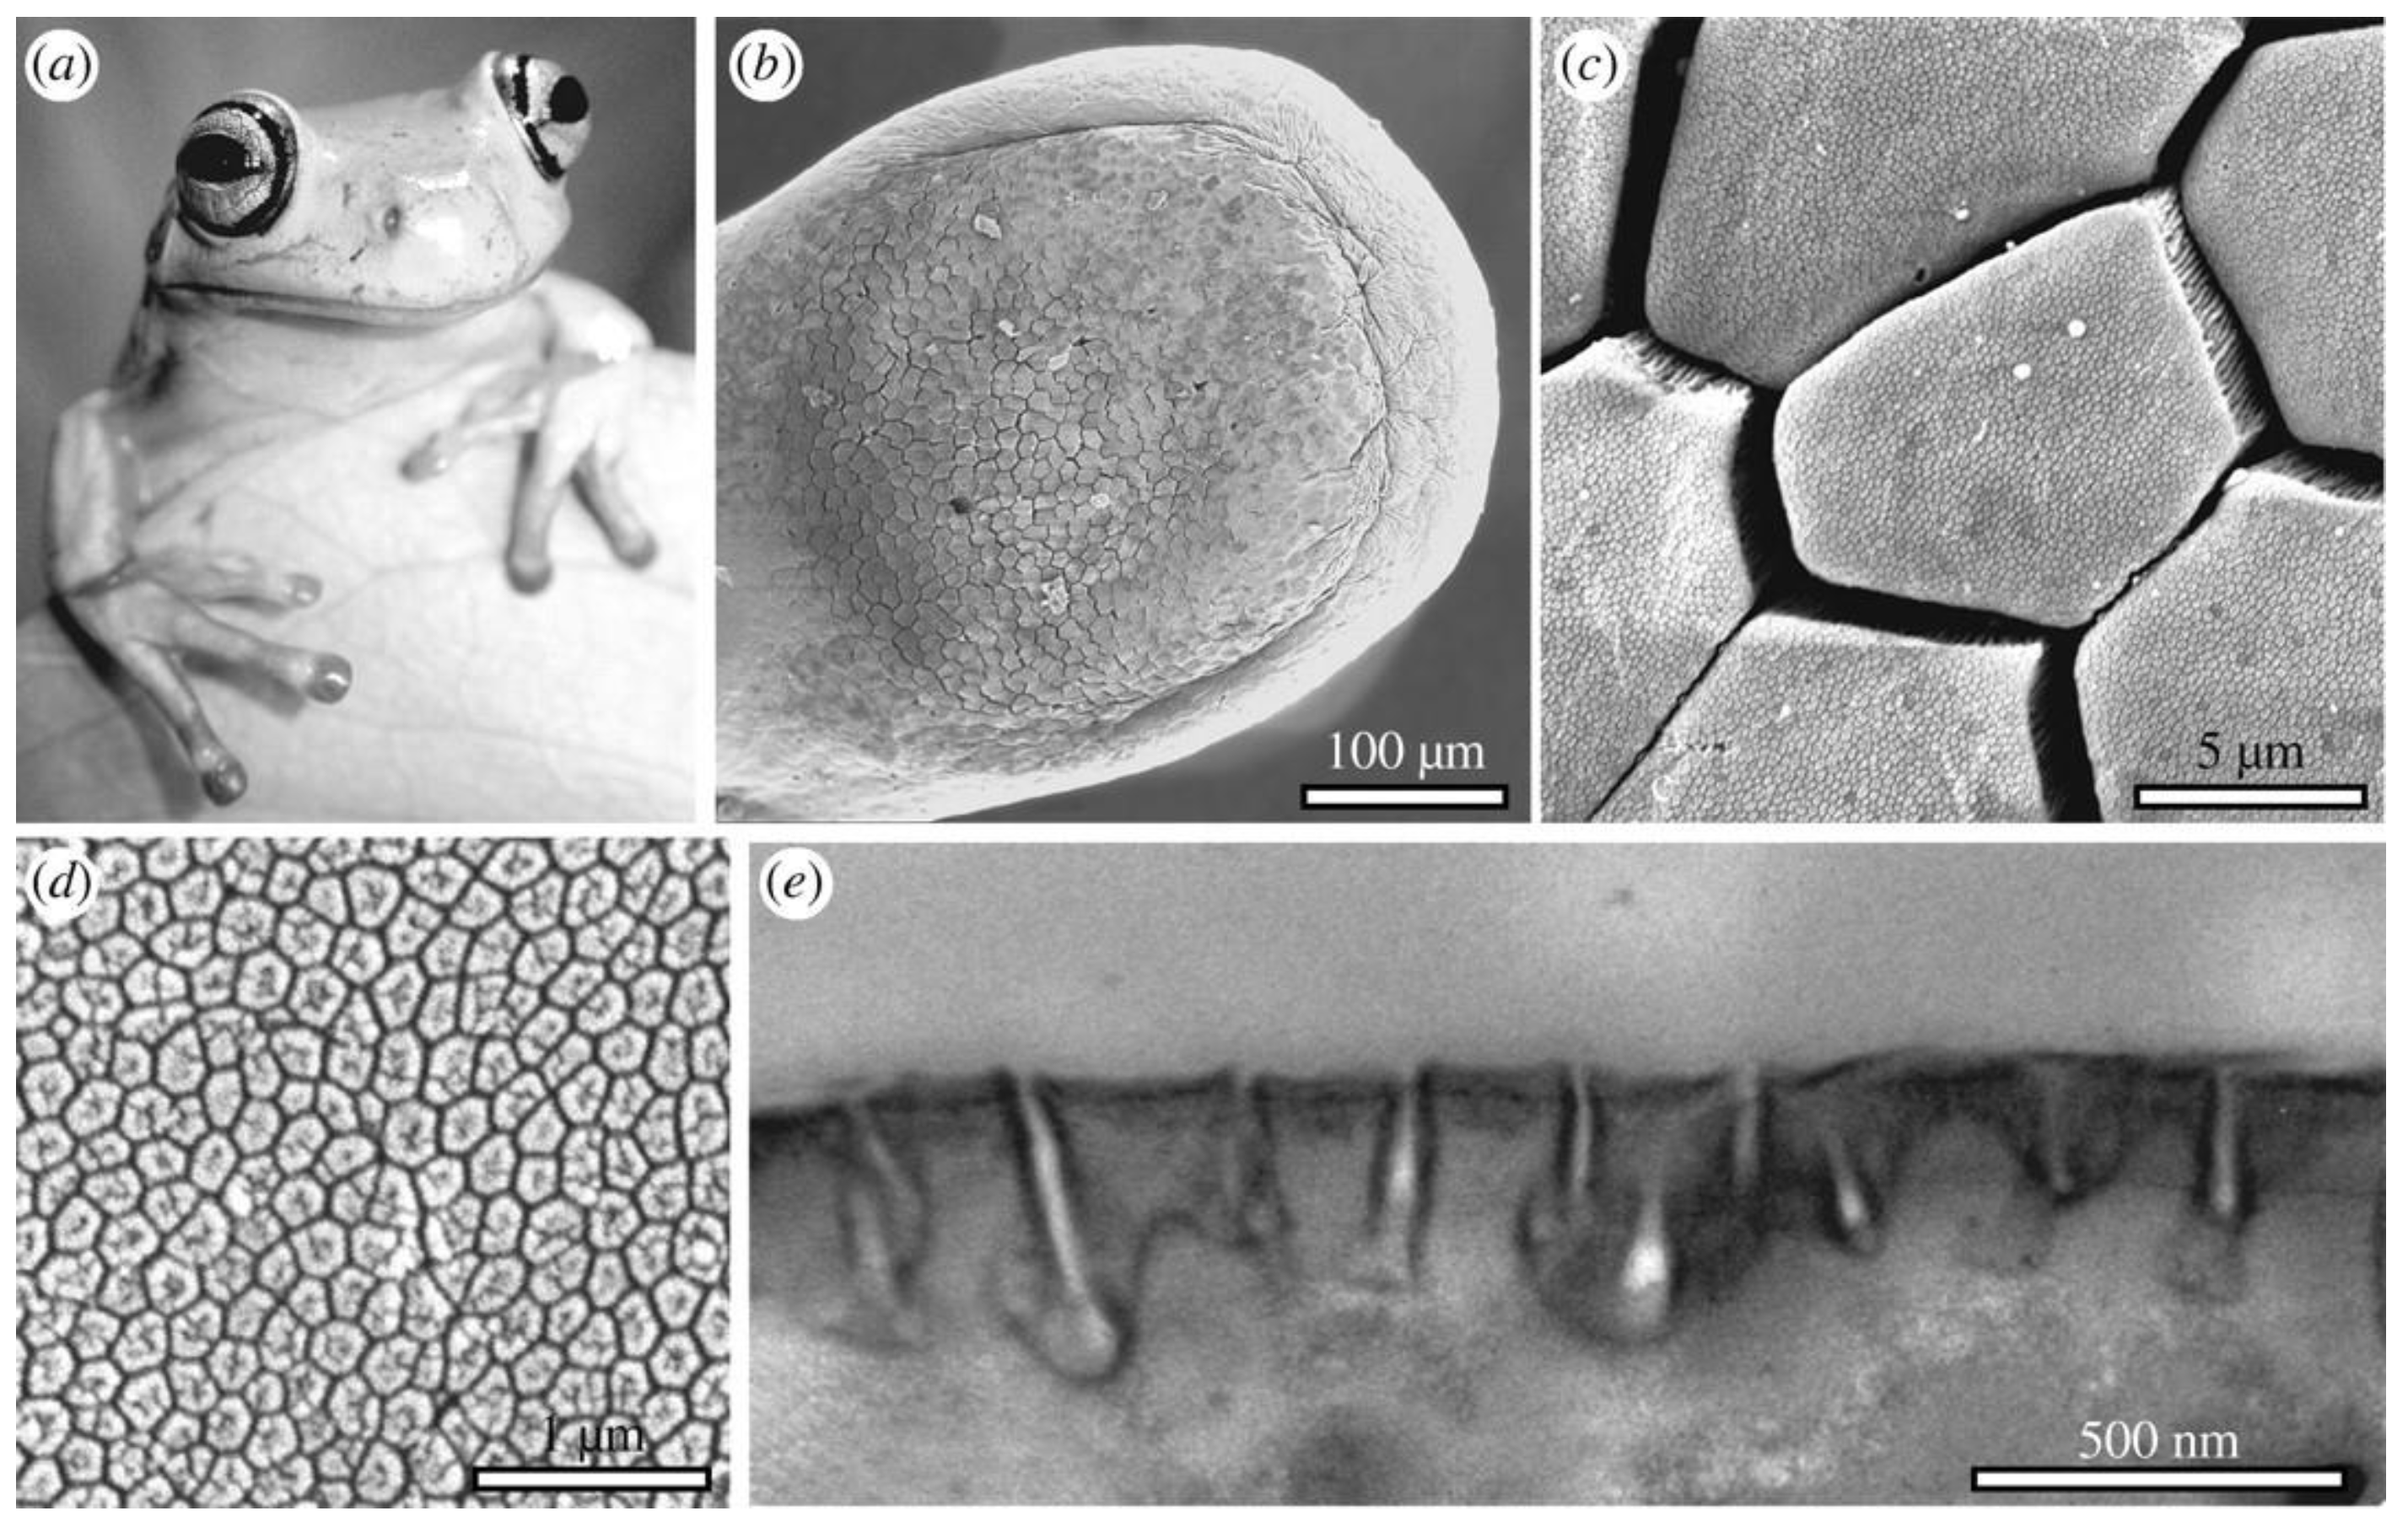
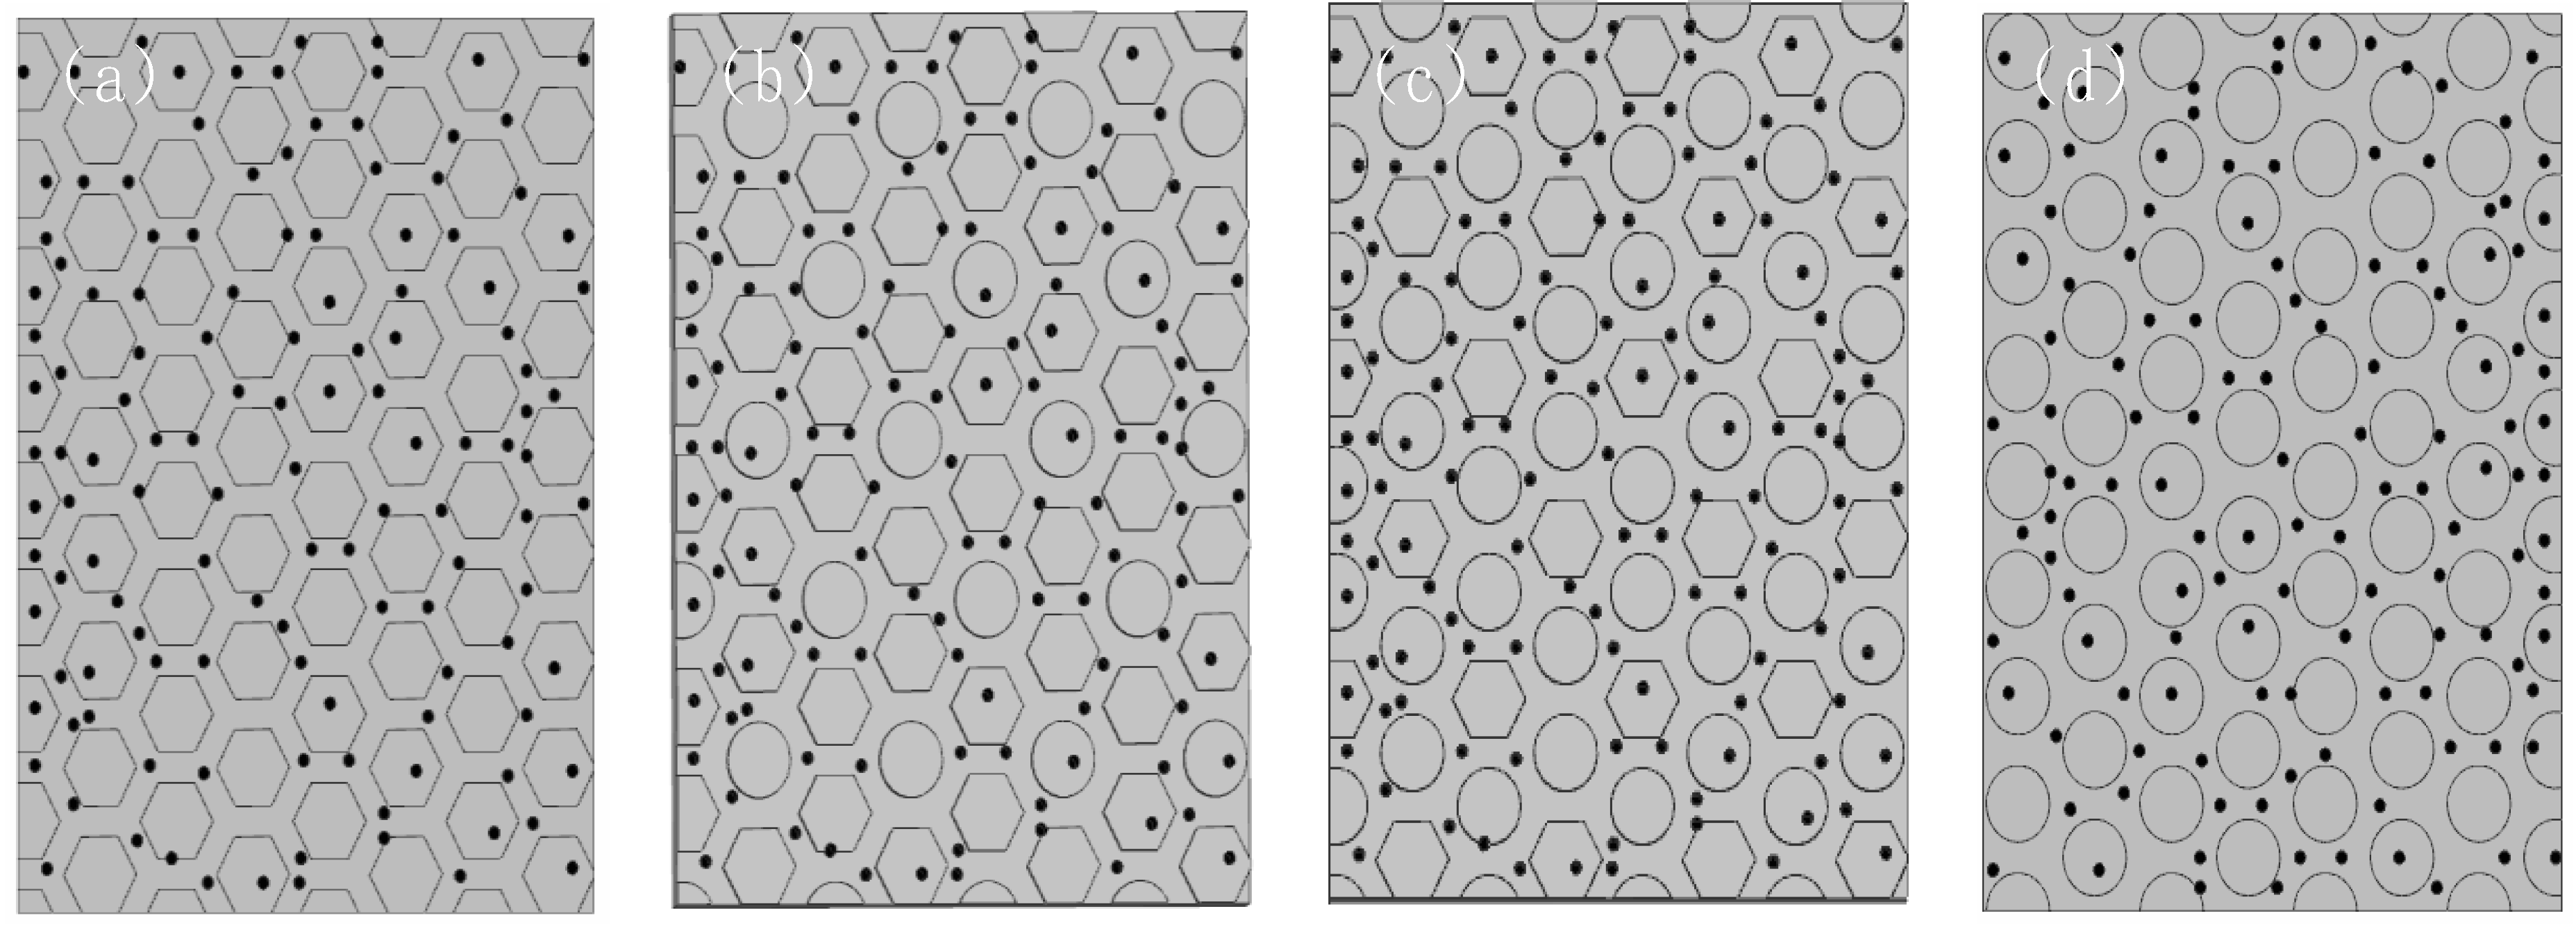
2.1.2. Bionic Design and Processing Method for Microstructure on the Surface of Titanium Alloy

In the study of xenogeneic bone as human bone graft material, Chen [14] found that the structural characteristics and mechanical properties of porcine bone are very similar to human bone, plus human bone is more difficult to obtain, so in this paper, porcine bone was chosen as the experimental observation object and the surface of porcine bone was observed by laser confocal microscopy and field emission scanning electron microscopy. From Figure 2a, it can be seen that the surface of bone is uneven and contains a large number of irregular structures such as pits and grooves. From Figure 2b, it can be seen that the diameter of surface pits varies, with sizes ranging from 50 to 250 μm and depths ranging from 30 to 150 μm. Around the micro-pits, grooves are distributed with widths ranging from a few microns to tens of microns, submicron irregular wavy stripes and nanoscale pores, as shown in Figure 2c,e. The observation of the surface structure of porcine bone shows that the surface of the bone is a non-smooth surface, and there exist microstructures of different shapes at different scale levels, which are inextricably related to the mechanical and biological properties of the bone and are important representations of natural bone, providing a basis for the bionic design of artificial bone.
The adhesion ability of treefrog pedipalps belongs to epidermal pad adhesion [15], and the microstructure of its pedipalps surface is shown in Figure 3. Figure 3b is a diagram of the finger-end sucker structure of the treefrog pedipalps, and Figure 3c is a cellular prism on the interphalangeal epidermis of the treefrog pedipalps; Figure 3d is the micro-nanostructure under the cellular prism on the interphalangeal epidermis; and Figure 3e is a microscopic view of the longitudinal section of the cellular prism on the epidermis. From the interphalangeal microstructure of the treefrog pedipalp (Figure 3b,c), it is observed and analyzed that the cell prisms on the treefrog epidermis have several patterns of quadrilateral, pentaprism, hexaprism and heptaprism, of which hexaprism accounts for about 55% of the total, pentaprism accounts for about 26% of the total, heptaprism accounts for about 18% of the total, and quadrism occupies very little, about 1%. The side length of the prisms is about 6 μm, and the two adjacent prisms are separated by narrow grooves of 1–5 μm in width and 5–10 μm in depth, and the body fluid flows between the grooves. From the epidermal cell prisms in Figure 3d,e, it was found that the surface of the cell prisms consisted of nanoscale arrays of bumps, with the diameter of the bump units being around 200 nm, the width of the inter-bump grooves being around 40 nm and the depth being within 200 nm.
Based on the aforementioned study, this paper combines the structural characteristics of the surface of porcine bone and the adhesion characteristics of the interphalangeal skin of the treefrog foot to bionically design the artificial bone surface microstructure patterns of ortho-hexagonal, circular and interlaced-between-them patterns. The side lengths of the patterns range from 150 μm to 300 μm, and the heights range from 30 μm to 120 μm; the shapes of the patterns are shown in Figure 4 below. Figure 4a shows the ortho-hexagonal array pattern, Figure 4b shows the ortho-hexagonal surrounding circular array pattern, Figure 4c shows the circular surrounding ortho-hexagonal array pattern, and Figure 4d shows the circular array pattern.
The nanoscale surface weaving is prepared by randomly distributing some nanoscale pores with sizes ranging from 10 to 150 nm in the above-designed surface microstructure patterns. In this paper, the micron-scale structure of the artificial bone surface was prepared by laser processing with the advantages of good controllability and high efficiency, and then the nanoscale morphology of the artificial bone surface was prepared by the common multiple acid-etching method.

2.2. Laser Ablation Method

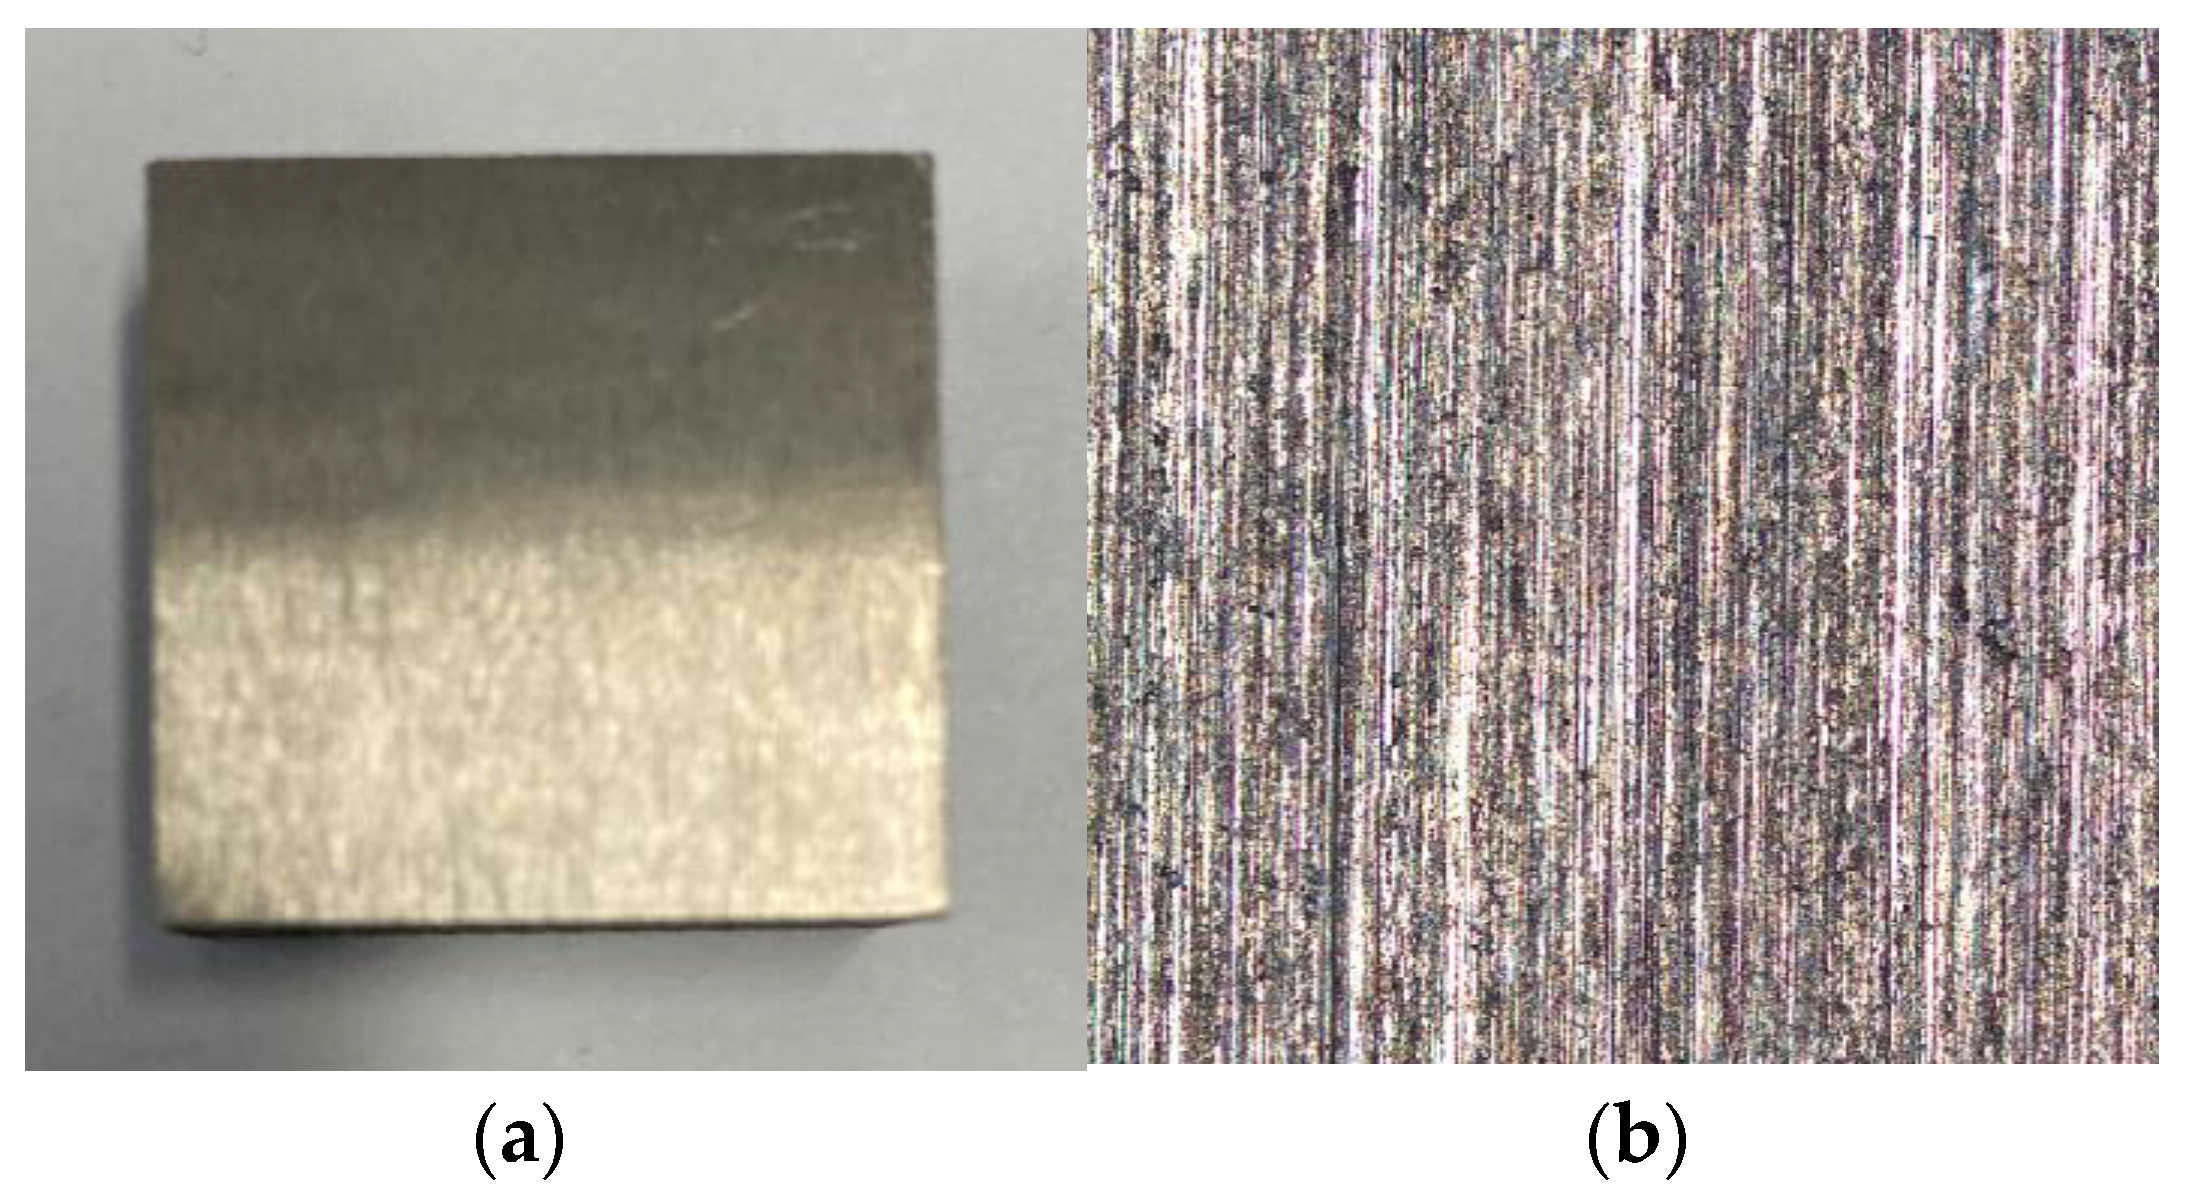
2.2.1. Pretreatment of Experimental Materials

The quality of the bumps formed by laser ablation has a great relationship with the degree of surface treatment of the material. Before the ablation experiment, it is necessary to ensure that the surface of the sample is smooth and free of oxidation layer, and the specific treatment is: wire cutting, grinding, polishing, cleaning and drying. Firstly, the titanium alloy plate is cut into small pieces of 20 mm × 20 mm × 10 mm using wire cutting, then the sample is polished on M-2 metallographic specimen pre-grinder using 800#, 1200# and 1500# sandpaper in turn, and then the specimens are then polished until the roughness of the surface is less than 0.055 (Ra ≤ 0.055) on P-2 metallographic specimen polishing machine using W2.5 diamond grinding paste, as shown in Figure 5. Then the samples were put into acetone, deionized water and anhydrous ethanol in turn for ultrasonic cleaning for 5 min, and finally the samples were dried in a drying oven at a temperature of 105–110 °C for 10 min. Figure 6 shows the surface of the titanium alloy after treatment.

2.2.2. Equipment for Laser Processing

The FB20-1 laser marking machine (Changchun New Industries Optoelectronics Technology Ltd., Changchun, China) used in the experiment is a rod-shaped solid laser with a maximum output power of 50 W, a maximum marking line speed of 7000 mm/s and a maximum output frequency of 100 kHZ. The laser marking machine consists of an oscillating mirror scanning system, a laser system, a focusing system, etc. The FB20-1 laser marking machine is used in combination with an automatic control system, which can quickly process a large groove depth. With the advantages of good reliability, high efficiency, high precision and no pollution, it is suitable for the processing of surface weaving structures.
The instrument used for the experiments to view the topography of the surface and measure the depth of the ablation was the VK-X1000 shape measuring laser confocal microscope from Keyence, Osaka, Japan, whose measurement method includes laser confocal and focus variation, displaying a resolution of 0.001 μm, an output wavelength of 404 nm and an output energy of 1.0 mW.

2.2.3. The Setting of the Parameters for Laser Processing

Changes in laser-processing parameters have a direct relationship to the morphology and mechanical properties of the surface of the titanium alloy, so the speed, power and frequency of laser ablation need to be studied to determine the optimal laser marking parameters, and the design parameters for the experiments are shown in Table 3, Table 4 and Table 5 below.

2.3. Multiple Acid-Etching Method

2.3.1. Experimental Method

The titanium alloy samples previously processed by laser marking were cleaned using an ultrasonic cleaner and then subjected to acid-etching experiments. Qiao jie Luo [16] prepared nanoscale particles on micron-scale woven surfaces by multiple acid etching and conducted compositional analysis and bioactivity studies on the acid-etched surfaces, finding that the acid-etched titanium alloy surfaces possess better biocompatibility. In this paper, the proportioning scheme for acid-etching experiments on a titanium alloy surface weave slag removal under laser ablation processing method was obtained by drawing on the proportioning scheme of the above-mentioned researchers’ acid-etching experiments and making several fine adjustments according to the actual experimental results, as shown below:
  • Add 0.09 mol/L of HNO3 and 0.11 mol/L of HF to the beaker in a volume ratio of 2:1 and stir thoroughly.
  • Slowly add 250 mL of 2.5 mol/L HCl solution to 500 mL of deionized water, and then continue to slowly add 250 mL of 4 mol/L H2SO4 solution to the solution.
  • Mix 98% H2SO4 solution and 30% H2O2 solution in a volume ratio of 1:1 and stir well. The flow of the acid-etching treatment experiment is shown in Figure 7 below:

2.3.2. Equipment for Experiments

For the characterization of the surface microstructure of laser ablation and the micro-nano composite structure formed after multiple acid-etching treatments, a field emission scanning electron microscope model Quanta FEG 250 from FEI, Portland, OR, USA, was used in addition to the VK-X1000 shape measurement laser confocal microscope from Keyence, Osaka, Japan, which can also perform energy spectrum composition analysis of the workpiece surface before and after acid etching.

2.4. Analysis of Friction Reduction Mechanism of Microstructure

2.4.1. Equipment for Experiments

This paper is about the friction performance of micro-nano weave on the surface of titanium alloy after laser ablation and multiple acid-etching treatment, and the friction coefficient and surface hardness of the weave are mainly used as a measure to determine the friction and wear reduction effect of the weave, so the equipment needed for this paper is FTM M30 multi-module-controlled lubrication friction tester (Nanjing Shenyuan Sheng Intelligent Technology, Nanjing, China) and HVS-1000AT/EOS100B automatic micro-Vickers hardness measurement system (Behrmin Industrial Technology, Yantai, China).
The FTM M30 multi-module-controlled lubrication friction tester is divided into two parts; the upper part contains the loading system and the friction parts, and the lower part contains the lubrication system, sample parts and the moving platform. The loading system can achieve a maximum applied load of 500 N. The reciprocating stroke of the mobile stage can reach a maximum of 15 mm, and the reciprocating frequency is in a range of 0–50 Hz, with a maximum adoption rate of 1 kHZ. The data on friction coefficient are measured by mechanical sensors and output in the display.
The HVS-1000AT/EOS100B automatic micro-Vickers hardness measurement system computer and automatic carrier table used for the experiment can achieve hardness values in a range of 5–5000 HV. The machine carrier table used for experiment can be manually controlled, electrically controlled and computationally controlled. When measuring the hardness of the woven part of the surface, the objective lens is selected as 40× , and the pressure load is selected as 1000 g. The steps for measuring the hardness of the instrument are “pressure adjustment–camera–freeze image–measurement”, by which the hardness image of the fabric can be obtained in the display.

2.4.2. Experimental Methods for Hardness Analysis

The hardness of the laser-ablated hexagonal bumps was measured along the depth direction and horizontal direction to determine whether the hardness of the bumps was improved. Laser-processing parameters (v = 300 mm/s, P = 20 W, f = 30 kHZ) were selected to ablate the hexagonal bumps. Six points d1, d2, d3, d4, d5 and d6 were selected along the depth direction, and six points l1, l2, l3, l4, l5 and l6 were selected along the horizontal direction with an interval of 20 μm between each point, as shown in Figure 8 below.

2.4.3. Experimental Method for Analysis of Average Friction Coefficient

In this paper, a positive hexagonal tab array weave machined with optimized laser parameters was used to perform friction wear tests. To conduct the friction and wear test, the FTM M30 multi-module-controlled lubrication friction tester was used for friction experiments with the following experimental parameters: normal load of 50 N, friction speed of 10 mm/s, reciprocating stroke of 10 mm, time of 60 min and acquisition frequency of 100; the counter-friction material used for the test was ultra-high-molecular-weight polyethylene (UHMWPE) [17]; the lubricant used for the test was deionized water [18].

2.5. Influence of Characteristic Parameters of Micro and Nano Structures on the Average Friction Coefficient of Titanium Alloy Surfaces

2.5.1. Experiment on the Effect of Single Factor on the Average Friction Coefficient

In this paper, for the design of the micro-nano composite structure on the surface of titanium alloy, three factors of shape, edge length and height were considered, and the effect of these three factors on the average friction coefficient of the titanium alloy surface was investigated by means of experimental analysis. The experimental design parameters are shown in Table 6, Table 7 and Table 8 below.

2.5.2. Experiment on the Effect of Multiple Factors on the Average Friction Coefficient

The effect of multi-factor interaction on the mean friction coefficient was investigated on the basis of the effect of a single factor on the mean friction coefficient. The levels of different factors were firstly screened, and then a three-factor, three-level experiment was designed. According to the factor levels in Table 9, the experimental scheme in Table 10 was designed. A represents the ortho-hexagonal array pattern, B represents the ortho-hexagonal surrounding circular array pattern, and C represents the circular surrounding ortho-hexagonal array pattern. Then the Box–Behnken module in Design Expert was used to design the orthogonal rotation combination experimental scheme.
The friction wear experiments were carried out according to the experimental scheme in Table 10, and the friction wear experimental data were analyzed to remove the friction data from the preliminary break-in stage, and the average value of the data from the stable wear stage was selected as the response data for the average friction coefficient and recorded.

3. Results and Discussion

3.1. Exploration of the Process of Laser Sintering

3.1.1. Analysis of the Impact of Machining Speed

The speed of the laser marking machine refers to the scanning oscillator speed of the laser. With other parameters constant, the faster the speed, the faster the marking speed and the fewer times the same place will be struck. Figure 9a–d show the surface morphology at different processing speeds. The darker color indicates a higher height at that place, and Figure 9e shows the contour curve of the square hexagonal tab at different speeds. From Figure 9a, it can be seen that the machined hexagonal tab has a high similarity in shape, but the surface of the tab appears sintered and burned black. Combined with the 200 mm/s profile curve in Figure 9e, it is obvious that the middle of the hexagonal tab is suddenly much higher, which is caused by the accumulation of slag from laser ablation. From Figure 9b, it can be seen that the shape of the machined hexagonal tabs is more similar and there is no sintering or blackening phenomenon. From Figure 9c,d, it can be seen that the processed hexagonal pattern is lighter and not uniform in color, and then combined with the contour curve in Figure 9e, it can be seen that the positive hexagonal surface is low and uneven in height. By observing the five figures, it is found that when the speed is lower than 300 mm/s, due to the excessive number of laser markings at the same place, the absorbed energy is excessive and the thermal conductivity of the TC4 material is small, resulting in a large amount of heat absorbed in the groove which is difficult to dissipate, and the temperature in the groove rises sharply to the boiling point of the material, decomposes into a gaseous powder and begins to undergo a chemical bond-breaking reaction to generate plasma [19]. The material is then vaporized and boils and splashes, forming regular grooves and severe ablation inside. The sputtered material condenses in the periphery, forming sintering and blackening phenomena. When the speed is higher than 300 mm/s, because the number of markings at the same place is less, the energy absorbed by the material surface is less, and the processed shape is not obvious, and even the local area of the laser is only coloring and a thermal shock to the material. The analysis shows that a processing speed of 300 mm/s can produce a better surface shape and a more regular shape in terms of the bump.

3.1.2. Analysis of the Impact of Machining Power

The power of the laser marking machine is the amount of energy emitted by the laser. Figure 10a–d show the surface morphology at different processing powers, and Figure 10e shows the contour profile of a positive hexagonal tab at different powers. From Figure 10c,d, it can be found that the middle height of the hexagon is higher and the edge height is lower. This is because the energy distribution is more uniform at the center of the laser beam and the energy distribution at the edge is lower. Then, observing the profile curves of 25 W and 30 W in Figure 10e, it can be found that the height for the middle of the positive hexagonal tab suddenly increases, which is due to the excessive power, resulting in a splash of the trench slag to the surface. Through the analysis of the above experimental phenomena, it can be concluded that the power selected for processing micron-level shape patterns should not be too high. Combined with the contour curves of 20 W in Figure 10b,e, it can be seen that the depth difference between the middle and the edge becomes smaller and the side curves of the hexagon are smooth due to the smaller processing power, and the overall shape of the hexagon is good. From the 15 W profile in Figure 10a,e, it can be found that the beam energy is too low due to the low power, and the absorbed energy on the surface is not able to melt the material completely, so the surface of the hexagon is not completely processed in some areas, which leads to the irregularity of the surface bump. The above analysis shows that at a processing speed of 300 mm/s, a better-shaped tab structure can be produced with a processing power of 20 W.

3.1.3. Analysis of the Impact of Machining Frequency

The processing frequency of laser marking refers to the number of laser pulses per unit of time, and the higher the pulse frequency, the lower the individual pulse energy, but the higher the accuracy, all other conditions being equal [19]. Figure 11a–d show the surface topography at different processing frequencies, and Figure 11e shows the contour profile of the hexagonal tab at different frequencies. From Figure 11a,e, it can be seen that the surface morphology of the hexagonal shape machined in this frequency range is good overall, but due to the small frequency, the machining accuracy is low, and the periphery of the hexagonal shape is uneven and the shape accuracy is not high. From Figure 11b–d, it is found that the surface morphology of the ortho-hexagonal tabs becomes more and more blurred when the processing frequency increases, and the processed surface morphology can still be seen vaguely as micro-stripes in polishing; combined with the contour curve in Figure 11e, the surface of the weaving structure with a frequency of 50 kHZ is uneven and collapses in local places, which is due to the fact that the frequency is getting faster and faster, the individual pulse energy value becomes smaller and smaller, coupled with less marking time, resulting in the limited energy absorbed by the material surface to reach the material vaporization temperature, which, in turn, cannot leave obvious grooves. Therefore, when processing positive hexagonal tabs, the frequency is chosen to be 30 kHZ.
Using the optimized speed (300 mm/s), power (20 W) and frequency (30 kHZ), laser processing experiments were conducted on the already-polished surface of the titanium alloy, and Figure 12 below shows the physical picture of the laser processing and the surface morphology under the microscope. From the pictures, it can be seen that the processed hexagonal array is clear and well defined and the surface morphology is good. When measuring the edge length of a single hexagon to verify the accuracy of laser processing, it was found that the edge length of the hexagon was greater than 150 μm at the time of drawing, about 180 μm. The analysis concluded that the reason why the actual value is larger than the design value is: Firstly, there is a certain error value in manual focusing when laser marking machine focusing is carried out; then, the marking machine itself has a spot with a diameter of 30 μm, which increases when processing the edges of the hexagon. Finally, it is due to the processing, in the positive hexagonal edge of the accumulation of more slag, so that when measuring the edge length, the measured value is large.
This paper is about the effect of different shapes, edge lengths and heights of surface weaves on the friction wear properties of titanium alloy surfaces. Among different shapes and edge lengths, the weave can be formed once by laser processing, but different heights of the weave need different numbers of laser-processing procedures to obtain, so after determining the optimal laser-processing parameters (v = 300 mm/s, P = 20 W, f = 30 kHZ), the relationship between the number of laser-processing procedures and processing heights needs to be studied. Figure 13 shows the three-dimensional morphological picture of the ablated material with the optimal processing parameters to produce a micro-bump, and Figure 14 shows its two-dimensional picture along the A-A cross section. The maximum height of the positive hexagonal tab is 18.366 μm, as can be seen from the three-dimensional morphology in Figure 13, but a singular point appears at the top of the tab, as can be seen from the two-dimensional cross-sectional view of the tab, which is due to the fact that the laser-ablated slag spattered on the surface of the hexagon during processing formed a recast layer by cooling and solidification, which increased the height value of the hexagonal Table Therefore, when measuring the height of the laser-ablated hexagon, the difference in height between the more gentle points B and C is measured as the height value of the hexagon, which can effectively reduce the error in the height of the hexagon.
Figure 15 shows the relationship between the number of laser ablations and the height of the ortho-hexagon. It can be seen from the figure that the height of the hexagon increases almost linearly with the number of ablations in the first stage of ablation for the titanium alloy material, but when the number of ablations reaches nine and the height of the hexagon reaches 130 μm, the value of the hexagonal height change becomes much flatter when the ablation is performed again. This is because when the height of the hexagon is too high, that is, when the depth of the groove is deep, the melt from the laser ablation cannot be sputtered out of the groove, but only on the side of the hexagon, which makes a lot of solidified slag accumulate in the groove and causes the height of the hexagon to grow less significantly than in the previous period.

3.2. Observation of Surface Micromorphology after Multiple Acid-Etching Treatment

3.2.1. Characterization of Ortho-Hexagonal Microstructures

The microstructure of the laser-processed titanium surface is shown in Figure 16. The array of ortho-hexagonal tabs is neatly arranged and each ortho-hexagonal tab exhibits good shape and size, as can be seen in Figure 16a. The individual hexagonal tabs have a regular shape, as seen in Figure 16b,c, but due to the laser ablation of the titanium alloy, the molten material splashes on the sides and top surfaces of the tabs, leaving a large amount of slag on these surfaces (black dots in Figure 16b), making the height of the hexagonal tabs larger and wider.

3.2.2. Analysis of the Results of Slag Treatment

As can be seen in Figure 16, the laser ablation produced a large amount of slag on the processed surface, with a size of about 1–20 μm. As an implant material for artificial bone, the biocompatibility of the material is crucial for the success of the procedure. Biocompatibility encompasses both bio-functional compatibility and bio-safety compatibility [20]. The presence of slag disrupts the biocompatibility properties of titanium alloy materials. The content of element C in the TC4 material matrix is less than 0.08%; however, it is found in Figure 17 that the content of element C on the surface of the laser-ablated ortho-hexagonal tabs reaches 10.39%, which far exceeds the C content of the material. This is because during laser processing, the high-temperature molten titanium alloy reacts with CO2 in the air to form carbides, which remain on the top and sides of the ortho-hexagon during the sputtering process, forming carbide slag. This is because the beam energy absorbed by the material surface during laser ablation increases the internal energy of the titanium alloy, which makes the titanium atoms become active and very easy to react with the strong oxidizing oxygen atoms to produce TiO2, Ti2O3 and Ti3O5. Since the slag is attached to the surface of the titanium alloy, it can very easily fall off. If left untreated, it can very easily fall off into the human body in the future during friction with natural bone and flow into tissue fluids and blood, thus, causing serious toxic side effects, such as carcinogenicity, cytotoxicity and irritation [21].
The analysis of the EDS spectrum in Figure 18 shows that the carbon atoms completely disappeared after acid etching and the oxygen elements were greatly reduced, and the small amount of surviving oxygen elements were analyzed as the strong oxidizer H2O2 reacting with titanium to produce a small amount of a TiO2 gel layer. The TiO2 gel layer does not destroy the biocompatibility of the material but improves it [22].

3.2.3. Morphological Analysis of Micro and Nano Structures

The acid-etching experiments designed in this paper are intended to eliminate the metal slag generated by laser processing, on the one hand, and to machine nanoscale holes on the basis of microstructures to form a micro-nano composite structure on the surface of titanium alloy, on the other hand. Figure 19 shows the surface morphology images of the ortho-hexagonal tabs after acid etching. From Figure 19a,b, it can be seen that the outer wall of the hexagonal tabs after acid etching has become much smoother, more distinct and regular in shape. From Figure 19c, it can be seen that the surface of the workpiece is covered with many irregular holes with diameters ranging from a few tens of nanometers to more than a hundred nanometers, with different depths, and the holes of different sizes are nested together.

3.3. Analysis of the Mechanism of Friction Reduction in Microstructure

3.3.1. Theoretical Analysis

When using a laser marking machine to weave the surface of a titanium alloy, the laser marking machine is used to ablate and shape the material surface through a high-energy pulsed beam. During the process, the focused high-energy pulsed beam is like a sharp knife, using thermal energy to remove the material point by point on the surface of the titanium alloy, and the TC4 material undergoes three processes of impact under the irradiation of the beam: strengthening—thermal absorption—surface melting and vaporization [23]. In this process of laser impact strengthening, the shock wave increases the density of dislocations at the grain boundaries of the surface layer of the titanium alloy material and the grains are refined [24,25,26]. We used the Hall–Petch equation, as follows [27]:
H V = H V 0 + K H V d 1 2
where HV is the microhardness value of the material, HV0 is the microhardness value of the substrate, KHV is the Hall–Petch constant and d is the diameter of the crystal. From a large number of studies, it was found that the fatigue life of metals is correlated with the size of the grains inside the metal, and within a certain range, the smaller the structural size of the grains, the higher the hardness and the better the fatigue resistance [28]. Further, the dislocation density of the laser-treated titanium alloy material increases, assuming that σ is the yield strength of the titanium alloy material and ρ is the dislocation density, because σρ1/2, so the increase in dislocations improves the yield strength of the titanium alloy surface [29,30], and the fatigue resistance is also improved.

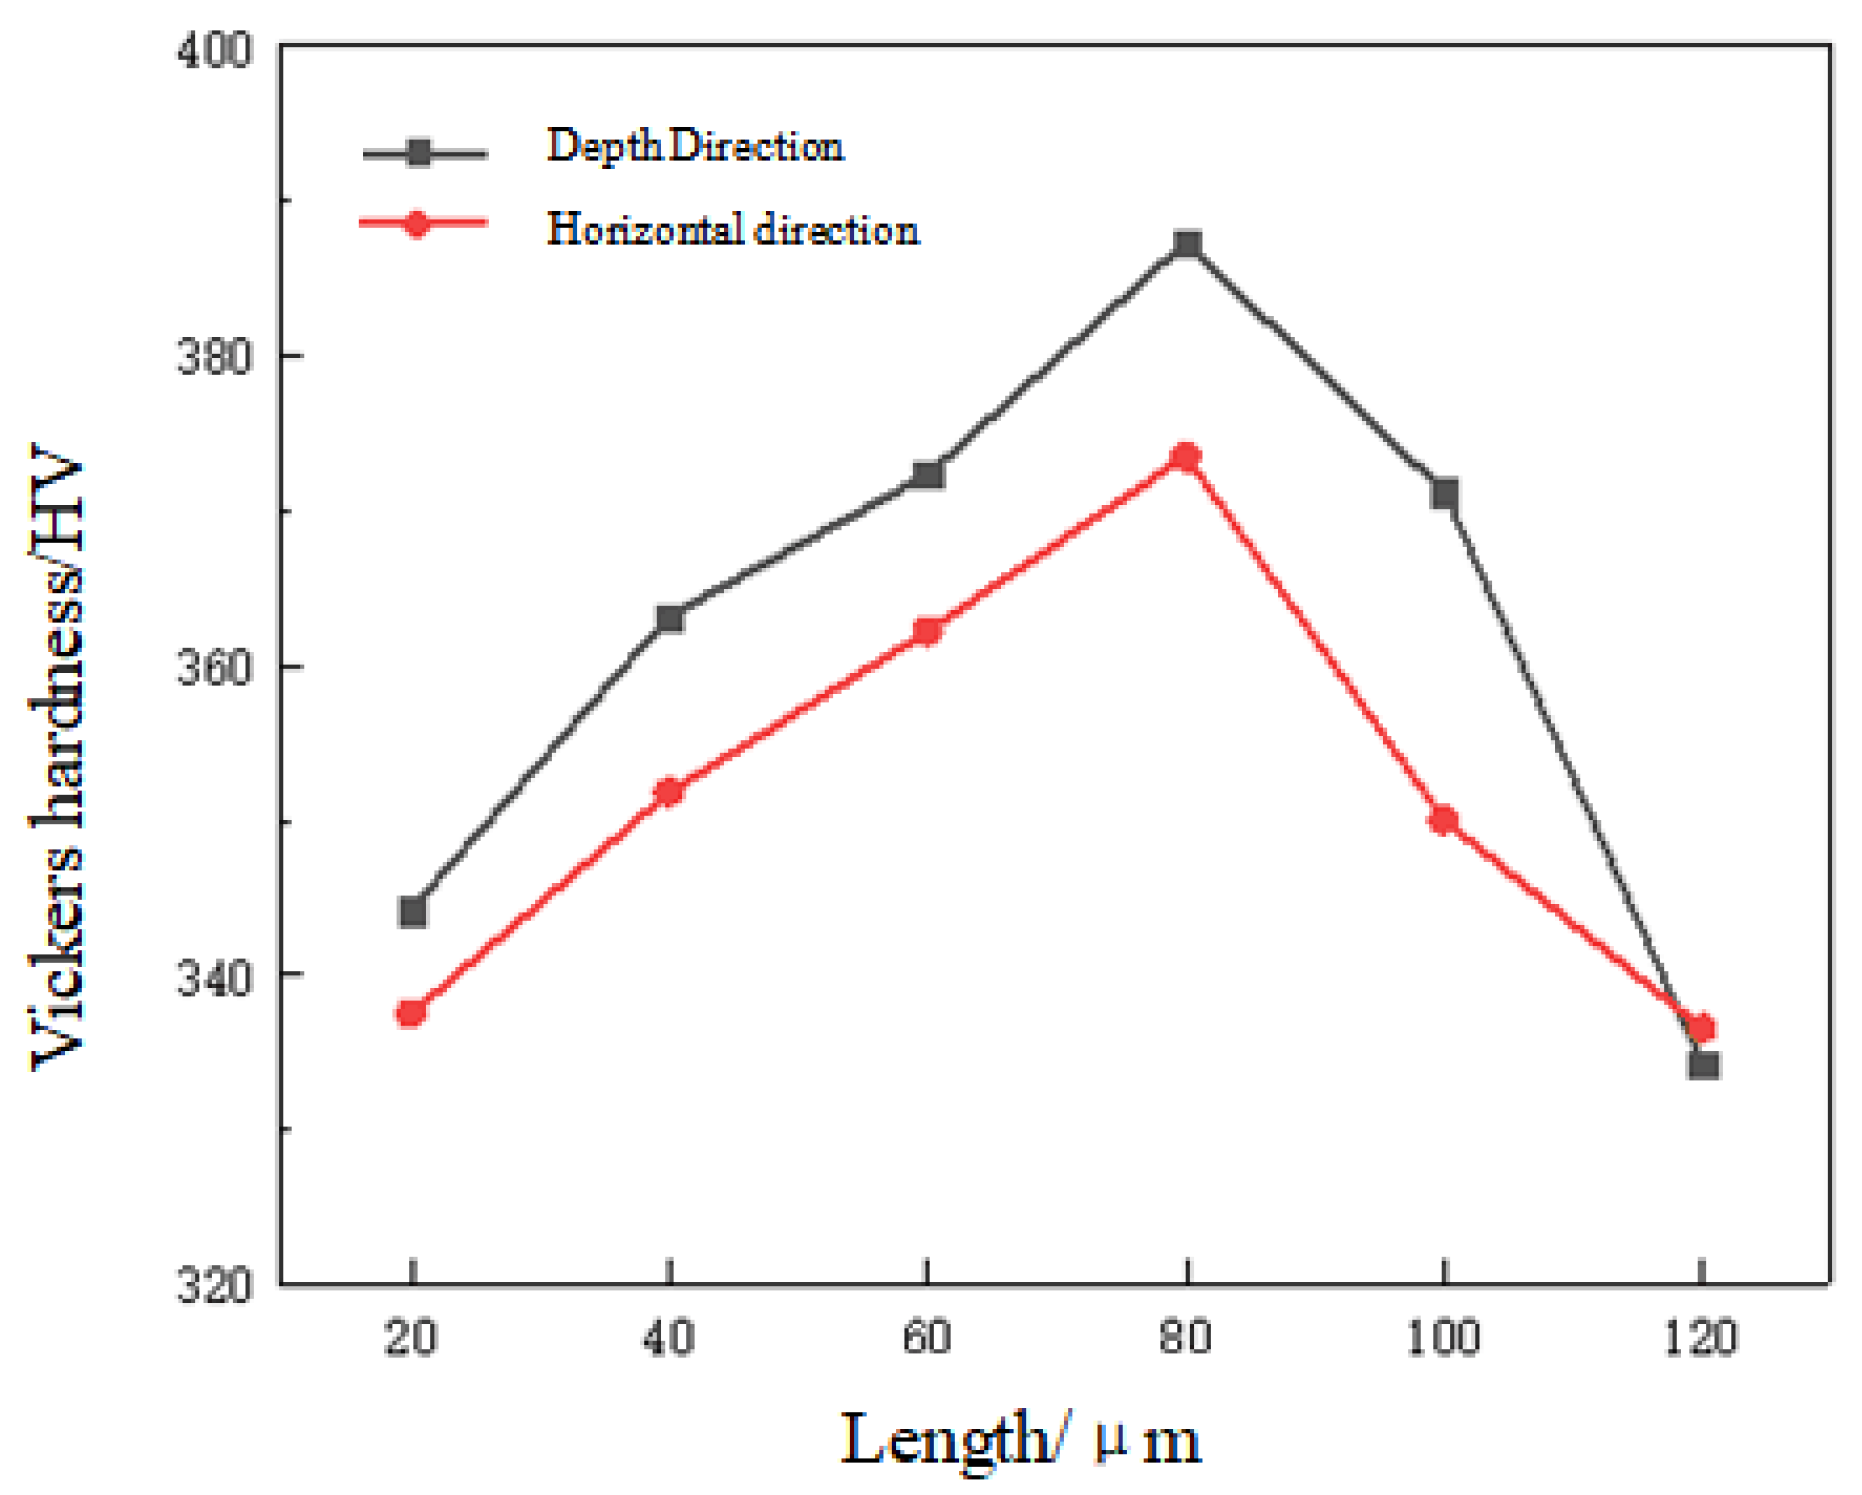
3.3.2. Analysis of the Results of the Hardness Test

Figure 20 shows the Vickers hardness of the machined tabs tested along the depth direction and horizontal direction when the laser marking machine speed was 300 mm/s, power was 20 W and frequency was 30 kHZ. From the graph, it can be found that: The hardness value along the depth direction first increases smoothly and then decreases rapidly. When the depth reaches 80 μm, the hardness reaches a maximum value of 387.51 HV, which is 17.42% higher compared to the hardness of the untreated titanium alloy surface, and when the depth reaches 120 μm, the hardness at this point is basically about the same as the material hardness value, which is 334.3 HV. The reason for the analysis is that the laser beam is focused on the titanium alloy surface and the light energy of the beam is converted into the heat energy of the workpiece, and through the internal grains, receive thermal influence and refine. As the depth increases, the effect on the grains decreases. The Vickers hardness in the horizontal direction also increases and then decreases, with the hardness gradually increasing to 373.5 HV and then rapidly decreasing to 336.58 HV. The hardness reaches its maximum at 80 μm in the horizontal direction, increasing by 13.18% compared to the hardness of the material, and the surface hardness of the weave is basically the same as the material hardness when it reaches 120 μm. The analysis concluded that during laser ablation of the titanium alloy material, when the laser beam stops impacting the surface material after the processing task is completed, a rebound effect is produced due to the inherent equilibrium of the titanium alloy material, resulting in residual tensile stresses perpendicular to the ortho-hexagonal ablation surface, leading to a smaller hardness. However, as the distance increases, the hardness of the material increases, because the thermal effect of the high temperature during the ablation process transforms the tissue in this area into harder ferrite and martensite, so that the hardness along the horizontal direction first increases and then decreases to the hardness of the material itself.
The above confirms that the hardness in the surface of the titanium alloy metal material after laser processing is increased to a certain extent, in conjunction with the Holm–Archard wear formula [31]:
Δ V = K L S H
where ΔV is the amount of wear, K is the experimental constant, L is the applied load, S is the friction distance and H is the hardness of the material. According to the formula, it is known that as the hardness of the titanium alloy surface material increases, the amount of wear decreases during the wear process and the friction reduction effect is better.

3.3.3. Analysis of the Average Friction Coefficient Test

Figure 21 below shows the friction curves and average friction coefficients of the laser-processed micro-molded specimens (square hexagon, side length of 200 μm, height of 60 μm) with parameters: v = 300 mm/s, P = 20 W, f = 30 kHZ and smooth surface specimenskHZ, where the average friction coefficient is the average value of the friction coefficient in the stable phase.
From Figure 21a, it can be found that both the micro-shaped and smooth-surface specimens went through a running and stable wear phase when they were ground against UHMWPE. The smooth-surface specimen had a sudden increase in the friction coefficient in the early stage of friction, and then slowly decreased until it entered the stable wear phase, while the specimen with micro-shaping had a slow increase in the friction coefficient and then entered the stable wear phase. Combining Figure 21a,b, it can be seen that: the average friction coefficient of the smooth surface is at 0.125, while the average friction coefficient of the micro-shape is 0.095, which is 24% lower between the two. In response to the above-observed phenomena, it is found that: the hard particles on the surface of the titanium sample are easily dislodged during the friction process. On the smooth surface, as in Figure 22b, in the grinding stage, the hard particles slip and rub under the action of the load of the titanium alloy sample, forming micro-cutting, scraping and forming furrows on the surface of the workpiece, causing abrasive wear and destroying the morphology of the titanium alloy surface, while the heat generated by friction makes the molecular adsorption on the contact surface enhanced, and the material surface forms a gluing phenomenon, which greatly increases the friction coefficient; when entering the stable wear stage, the gluing phenomenon generated by frictional heat still exists on the surface, forming adhesion, but the friction coefficient decreases compared to the grinding stage. On the surface of the titanium alloy weave, as in Figure 22a, the hard particles shed are captured by the grooves on the surface, reducing the scraping of the hard particles on the surface and reducing the heat generated by friction, and the heat generated by friction is taken away from the friction surface with the flow of deionized water, reducing the gluing phenomenon formed by friction heat and reducing the friction coefficient; on the other hand, according to equation [32]:
μ = μ a + μ d + μ p = F a + F d + F p W = A r τ a + A d τ d + A p τ p W
(where μa is the adhesion friction, μd is the friction caused by the deformation of the rough peak, μp is the friction between the abrasive particles, W is the applied load, F is the surface friction, Ar is the true contact area, Ad is the deformation area of the two pairs of abrasive parts and Ap is the area of the three-body deformation in the presence of abrasive particles). The true contact area ultimately determines the size of the friction coefficient, the surface with the weave compared to the smooth surface, reducing the true contact between the friction subsets, and further reducing the true contact area between the friction subsets, thereby reducing the friction. Therefore, the surface weave obtained by laser ablation can effectively improve the frictional wear performance of the material.

3.4. Influence of a Single Factor of Micro-Weave Geometrical Characteristics on Friction Properties (Average Friction Coefficient)

3.4.1. Effect of the Shape of the Fabric on the Average Friction Coefficient

Figure 23 below shows the friction profile plots with the average friction coefficient histogram for different shapes of weaves with side lengths of 200 μm and heights of 60 μm, where A represents the ortho-hexagonal array, B represents the circular array, C represents the circular surrounding ortho-hexagonal array and D represents the ortho-hexagonal surrounding circular. During the friction wear experiment, the pre-friction time of the material has a certain influence on the friction wear performance of the material; when the shorter the time of the abrasion period of the material, the better the friction performance of the material, as can be seen in Figure 23a, the hexagonal array (A) is the earliest to reach the friction stability stage compared to the other patterns, the circular array (B) and the circular encircling hexagonal array (C) experience a shorter time to enter the friction stabilization stage, and the hexagonal surrounding circular (D) experiences the longest grinding period before reaching the stabilization stage. From Figure 23b, it can be clearly seen that in the friction stabilization stage, the average friction coefficient of the hexagonal array is the smallest and the circular array is the largest, meaning that: with the same area, the circumference of the circular is the smallest and the circumference of the hexagonal is the largest, which means that the circular gully length is the smallest, and the gully length of the ortho-hexagon is the largest. In the friction process, the larger the perimeter of the gullet, the better the performance of capturing the dislodged abrasive particles, and, thus, the better the friction reduction effect. The average friction coefficient difference between hexagonal and circular shape is 15.5%, which shows that the pattern design of micro-weave has a greater influence on the average friction coefficient, and the excellent micro-weave pattern can achieve better friction reduction.

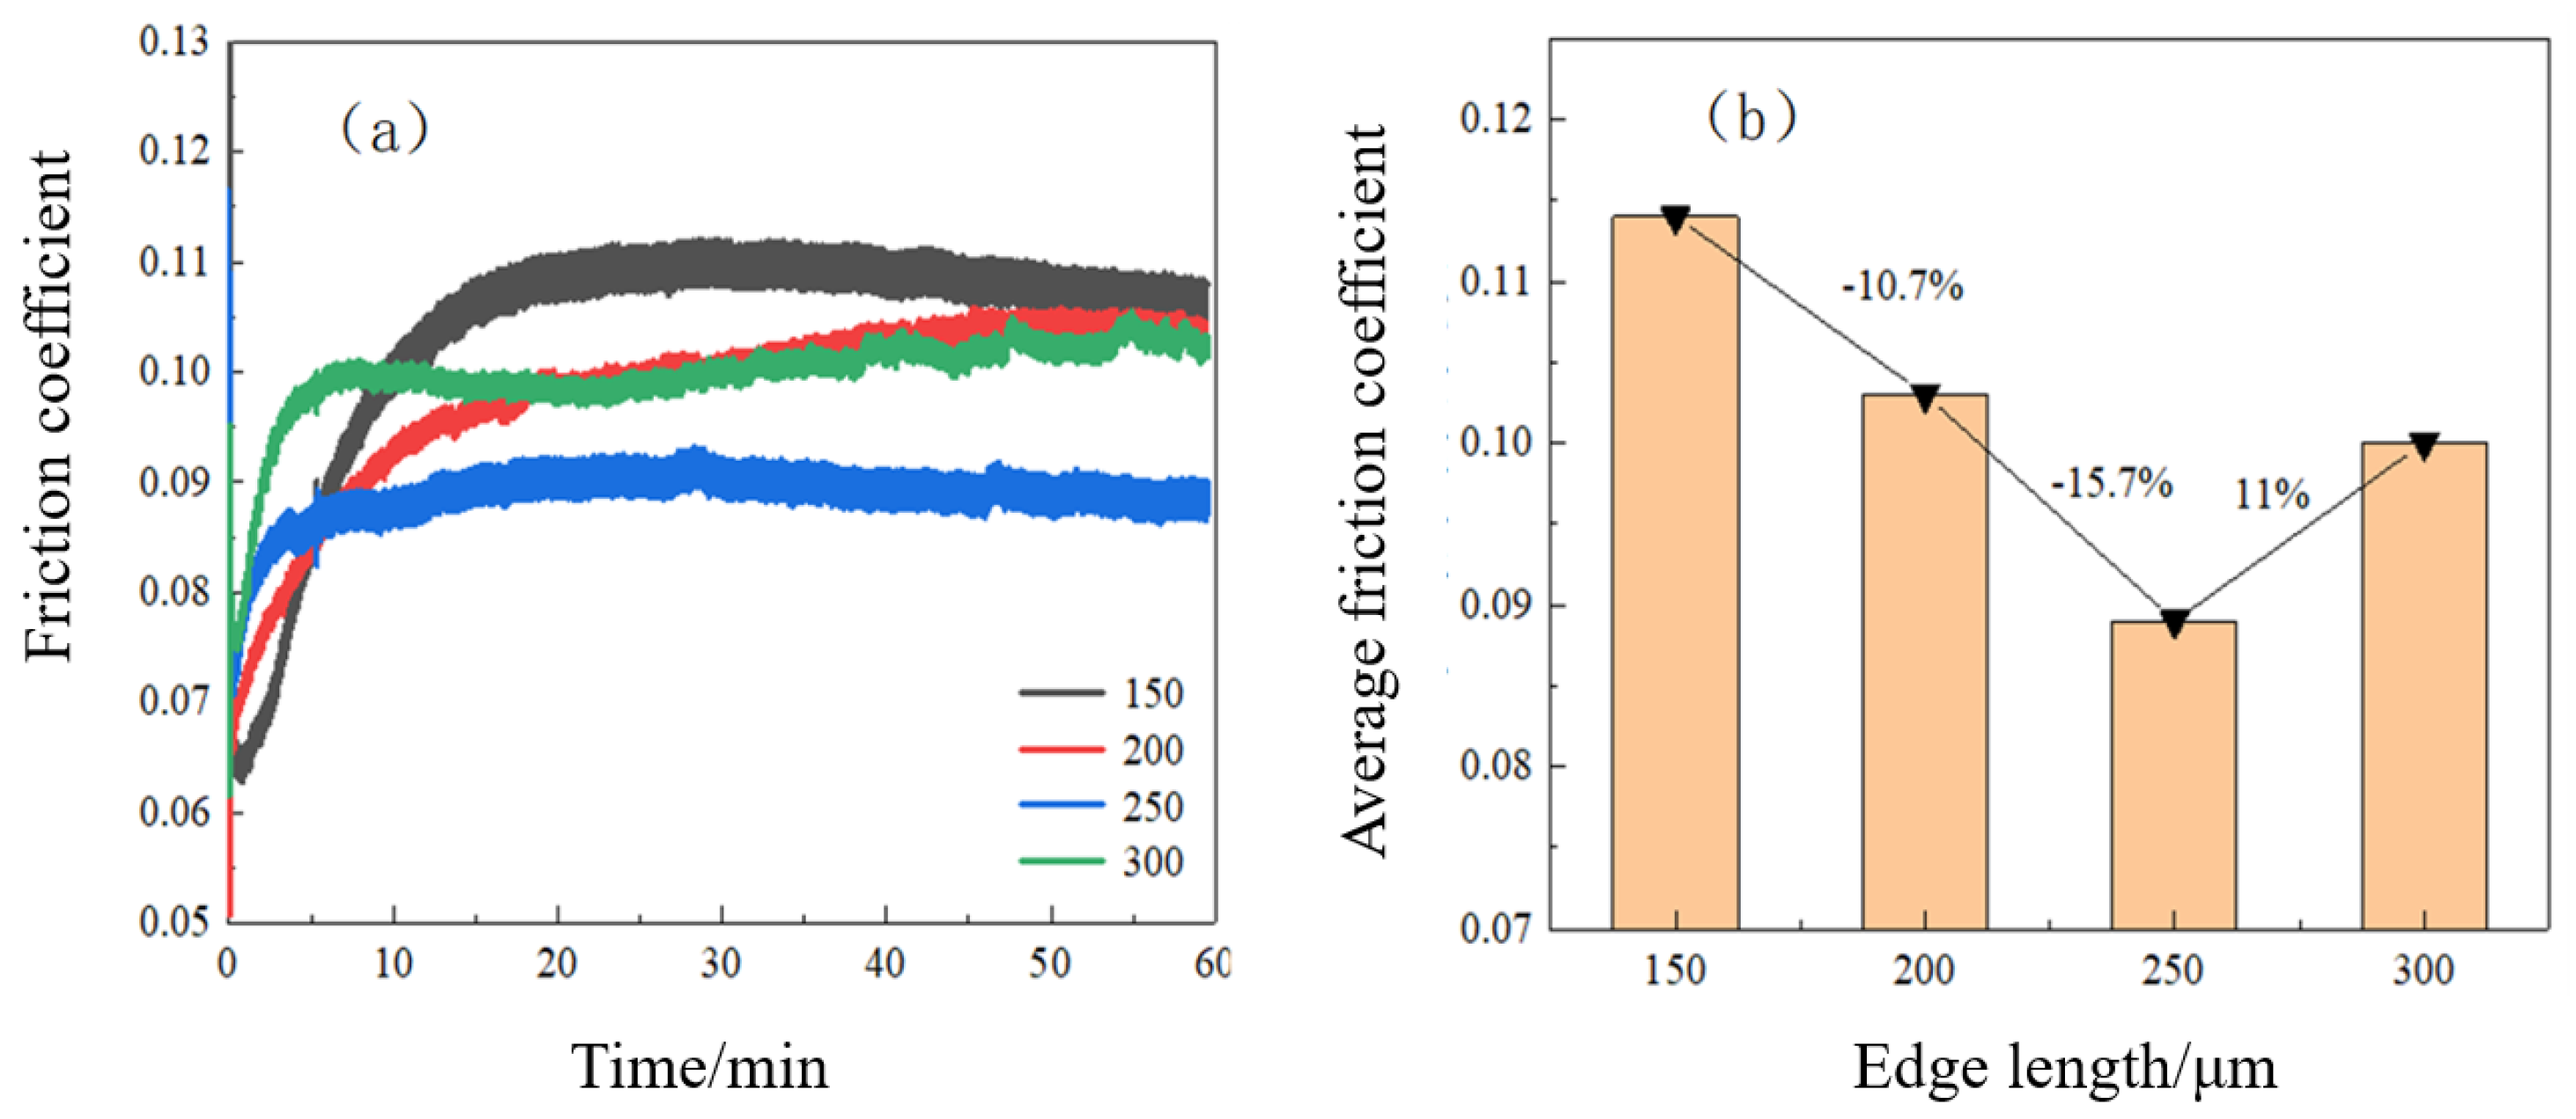
3.4.2. Effect of Edge Length of the Fabric on the Average Friction Coefficient

Figure 24 below shows the friction profile plots and the average friction coefficient histograms for different edge lengths with the pattern being a positive hexagonal array with a height of 60 μm. From Figure 24a, it can be seen that the wear times of the four different edge lengths of the array patterns are relatively short and can enter the stabilization stage quickly, and it can also be seen that the friction coefficient curves are more consistent at the stabilization stage when the edge lengths are 200 μm and 300 μm. Combined with Figure 24b, it can be found that in the stable stage, the average friction coefficient is the smallest when the edge length is 250 μm, and when the edge length is less than 250 μm, the average friction coefficient decreases with the increase in the edge length, and when the edge size is larger than 250 μm, the average friction coefficient increases with the increase in the edge length. Analysis of the reasons for this believes that: within a certain range, the area rate of the weave increases, and the bearing capacity of the specimen increases and the friction coefficient decreases, so when the edge length increases from 150 μm to 250 μm, the area rate of the weave increases and the friction coefficient decreases. However, when the edge length increases to 300 μm, the area density of the surface grooves decreases to the point that it is no longer possible to completely carry the surface abrasive particles away from the friction surface, and at the same time, due to the excessive edge length, the deionized water in the grooves is unable to cool the frictional heat generated at the center of the pattern, which makes the adhesion at the center increase, increasing the friction force and reducing the friction reduction effect.

3.4.3. Effect of the Height of the Fabric on the Average Friction Coefficient

Figure 25 below shows the graphs of friction curves and histograms of average friction coefficients for different heights with the pattern of positive hexagonal array and side length of 200 μm. From Figure 25a, it can be seen that the pre-friction curve with a height of 30 μm and 120 μm has a longer wear time, and heights of 60 μm and 90 μm have a shorter wear time. According to the tribological theory, the pre-friction time of the material has a certain influence on the frictional wear performance of the material, and the shorter the wear period time of the material, the better the frictional performance of the material, so it can be considered that in the case of the ortho-hexagonal array pattern, the side length of 200 μm, the height friction performance of 60 μm and 90 μm is better. From Figure 25b, it can be seen that the average friction coefficient is the smallest when the height is 90 μm, and the average friction coefficient decreases with the increase in height when the height is below 90 μm, and increases with the increase in height when the height is greater than 90 μm, which shows that the height of the weave is not better when the height–diameter ratio reaches a certain size, but the friction coefficient becomes larger when the height is greater. This finding is consistent with the findings of Kaneta [22], because when the height is too high, micro-vortices appear inside the grooves, and the appearance of micro-vortices makes the lubrication between the frictional subsets chaotic, and the cooling effect of deionized water is discounted, while based on the fracture mechanics explanation of Greinere [23], when the height of the weave increases, the effective shear stiffness decreases and the stress concentrates, which leads to an increase in frictional forces.
From the above analysis, it can be seen that the circular array pattern (D) has the largest average friction coefficient and longer wear time, so it can be considered that this factor is less effective in improving the friction performance of the surface weave; the surface weave with a side length of 150 μm is not very effective in reducing friction; the surface weave with a height of 30 μm is slightly less effective in reducing friction compared with the other heights, and the preliminary wear time is also longer.

3.5. Effect of Multifactorial Coupling of Geometrical Features of Micro-Weave on Friction Properties (Average Friction Coefficient)

The friction wear experiments were conducted according to the experimental scheme in Section 2.5.2. The friction data from the preliminary break-in stage were removed, and the average value of the data from the stable wear stage was selected as the response data of the average friction coefficient. The experimental results are shown in Table 11 below.
Since the factor of weave shape cannot be brought into the equation for calculation when solving the regression equation for the mean friction coefficient below, the weave shape factor is tested as a variable according to the ratio of circular tab area to the total weave area, then A, B and C correspond to 0, 0.33 and 0.66, respectively. In the response results of the mean friction coefficient, the experimental values for the same group of parameters may differ, which is because of the treatment effect brought by the treatment factors and the error effect caused by the interference of chance factors and measurement errors, i.e., within-group variation and component variation.
Design-Expert software was used to fit the mean friction coefficient to the analysis, and Table 12 below shows the ANOVA table for the cubic regression equation of the mean friction coefficient. The correlation between the characteristic variables was tested by the P-value test, which obeys the F distribution, and the larger the F-value, the smaller the P-value, so the easier it is to enter the region of rejection of the hypothesis, and the greater the help of the characteristic value to the predicted response, often with P = 0.05 as the cut-off, i.e., the probability of the existence of correlation between the characteristic value and the predicted variable is 95%, and when P > 0.05, the probability of the existence of correlation between the characteristic value and the predicted response variable is weak.
From the table, we know that F = 56.3, P < 0.0001, which indicates that the correlation between the mean friction coefficient and the eigenvalue is greater than 99.99%, and the regression model is highly significant and can be used as a model for the mean friction coefficient. In the regression equation, the factors with P-value less than 0.05: S-Shape, H-Height, LH, H2, indicate that these factors have a significant effect on the mean friction coefficient, and the factors with P-value greater than 0.05: L-Side length, SL, SH, S2, L2, indicate that the effect of these factors on the mean friction coefficient is not significant. The larger the F-value, the smaller the P-value, indicating that the factor has higher the significance for the effect of the factor on the mean friction coefficient. From the table, we can see that the influence of univariate factors on the mean friction coefficient is ranked as S (shape) > H (height) > L (side length), and the influence of interaction factors on the mean friction coefficient is ranked as LH > SH > SL. From the model reliability analysis table, we can find that the fit is 0.9606 and the correlation coefficient is 0.985, which are close to 1, indicating that the error of the model is small; the coefficient of variation is 1.58% and the precision is 4.539 × 10⁻⁴, which indicates that the accuracy and credibility of the model are high.
The results of the credibility analysis of the model are shown in Table 13 below:
Based on Box–Benhken’s response surface fitting, the cubic regression Equation (4) with weave shape S, edge length size L, height H and average friction coefficient as response values is:
μ = 0.0749 4.0455 × 10 2 × S + 2.475 × 10 1 × L + 1.525 × 10 1 × H + 1.515 × 10 2 × S L + 1.262 × 10 1 × S H 2.666 × L H + 4.591 × 10 4 × S 2 8 × 10 2 × L 2 + 3.111 × H 2
Figure 26 below shows the 3D response surfaces and contour plots of the factors based on the interaction in the cubic regression equation for the mean friction coefficient. The response surface of the weave edge length and height for the mean friction coefficient is shown in Figure 26a, and also combined with the ANOVA in Table 12, the F-value and P-value are 45.46 and less than 0.0001, respectively, which shows that when the shape of the weave is 0.33 (positive hexagon enclosing circular array pattern), the interaction edge length and height have the most significant effect on the mean friction coefficient at the edge length of (0.20, 0.30) mm and the height in the region of (0.06, 0.09) mm, the average friction coefficient of the surface of the weave is the smallest; the side length of (0.20, 0.25) mm and the height in the region of (0.115, 0.12) mm, the average friction coefficient of the surface of the weave is the largest, so the analysis concluded that: in the case of a certain shape, the height of the tab and the side length of the weave is not the larger the better. The appropriate high-diameter ratio is conducive to the cooling and lubrication effect of lubricating fluid in order to achieve the optimal friction reduction effect. The response surface of the weave edge length and shape for the average friction coefficient is shown in Figure 26b; combined with the ANOVA in Table 12, the F-value and P-value are 0.059 and 0.8144, respectively, and it can be found that the shape and edge length of the interaction have less effect on the average friction coefficient when the height of the weave is 90 μm, in the shape of (0.55, 0.66) and the edge length of (0.20, 0.30). The surface friction coefficient of the weave is the smallest for the shape of (0.00, 0.10) and the side length of (0.20, 0.25), and the surface friction coefficient of the weave is the largest for the shape of (0.00, 0.10) and the side length of (0.20, 0.25). The analysis suggests that when the circular and hexagonal shapes are staggered, the circular tabs are surrounded by a circular curve with fewer angles, which is beneficial to reduce the friction coefficient during the friction process. The response surfaces of the weave shape and height on the average friction coefficient are shown in Figure 26c, and the F-value and P-value are 1.49 and 0.2624, respectively, combined with the ANOVA in Table 12, which shows that the influence of the shape and height of the interaction on the average friction coefficient is more significant when the edge length of the weave is 250 μm, the average friction coefficient is the smallest, and at the shape of (0.00, 0.17) and height of (0.06, 0.12), the average friction coefficient is the largest. The analysis concluded that when the edge length of the weave is 250 μm, the corresponding height at the optimal height-to-diameter ratio is 90 μm, and the best friction reduction effect is achieved at this time.
Based on the above fitting of the cubic regression equation for the mean friction coefficient and using the Numerical button under the Optimization module of the software to optimize the experimental results, the optimal mean friction coefficient is 0.0902, corresponding to the characteristic values of 0.66 for the shape, 200 μm for the edge length and 60 μm for the height.

4. Conclusions

Based on the laser ablation of titanium alloy, this paper investigates the mapping relationship between laser-processing parameters and the weave of hexagonal shapes. By observing the surface shape of the hexagonal weave after laser ablation, laser processing parameter optimization experiments were conducted to select an optimal set of processing parameters to process the ideal hexagonal weave array on the surface of the titanium alloy. Then, the optimized laser-processing parameters were used to process the hexagonal weave on the sample surface, and the relationship between the number of laser-processing procedures and the height of the processed weave was investigated; finally, the processed hexagonal weave array was subjected to multiple acid-etching experiments. In addition, this paper also analyzed the friction reduction in the micro-nano structure on the surface of the titanium alloy in various aspects. The experimental conclusions of this paper are as follows:
(1)
The optimal parameters of laser processing were obtained through the experiment: processing speed of 300 mm/s, power of 20 W and frequency of 30 kHZ.
(2)
In the study on the relationship between the number of laser processes and the height of the processed tabs, it was found that the height of the tabs was proportional to the number of processes when the number of laser ablations was nine or less and the height of the tabs was 130 μm or less, and the increase in the height of the tabs became flat after the number of ablations exceeded nine.
(3)
In the multiple acid-etching treatment experiments, it was found that the slag on the micro-weave of the titanium alloy surface after the acid-etching treatment had been basically disposed of, and a better micro-nano composite structure was also obtained on the basis of the original microstructure.
(4)
In the analysis of the friction reduction in the surface micro-weave, it was found that machining the micro-nano structure on the surface of the titanium alloy can improve the friction reduction performance of titanium-alloy artificial bone.
(5)
In the experiments to study the friction reduction in different titanium alloy surface micro-weaves, it was found that: different shapes of micro-weaves have different effects on surface friction reduction, among which the hexagonal array pattern has the best friction reduction effect; different heights and side lengths of the weave also have different friction reduction performances on the surface, and the surface friction reduction performance increases and then decreases with the increase in the height of the tab, and the average friction coefficient is the smallest when the height is 90 μm; the surface friction reduction performance also increases and then decreases with the increase in the side length, and the average friction coefficient is the smallest when the side length is 250 μm.
(6)
In experiments investigating the friction reduction in the interacting factors on the surface weave, it was found that the smallest average friction coefficient was 0.0902, corresponding to characteristic values of 0.66 for the shape (circular enclosing ortho-hexagonal array pattern), 200 μm for the side length and 60 μm for the height.

Author Contributions

Conceptualization, R.C. and J.X.; methodology, F.Z.; validation, R.C., F.Z. and Y.W.; formal analysis, R.C., Y.W. and F.Z.; investigation, R.C., F.Z. and J.Z.; resources, J.X. and; data curation, J.X.; writing—original draft preparation, R.C.; writing—review and editing, R.C., Y.W. and J.Z.; project administration, J.X.; funding acquisition, J.X. All authors have read and agreed to the published version of the manuscript.

Funding

The work was funded by the National Natural Science Foundation of China (No.51305174).

Institutional Review Board Statement

Not applicable.

Informed Consent Statement

Not applicable.

Data Availability Statement

All data generated or analyzed during this study are included in this article.

Acknowledgments

Thanks to J.Y, Y.H. and J.S. for their help during the experiment.

Conflicts of Interest

The authors declare no conflict of interest.

References

  1. Wang, G.Y.; Chai, L.; Liu, L.B.; Zhao, X.; Xu, Y.; Zhou, X.; Zhang, W.; Wang, X. Recent advances in 3D printing of human organs. J. Mech. Eng. 2014, 50, 119–127. [Google Scholar] [CrossRef]
  2. Rack, H.J.; Qazi, J.I. Titanium alloys for biomedical applications. Mater. Sci. Eng. C Biomim. Supramol. Syst. 2006, 26, 1269–1277. [Google Scholar] [CrossRef]
  3. Wang, K. The use of titanium for medical applications in the USA. Mater. Sci. Eng. A 1996, 213, 134–137. [Google Scholar] [CrossRef]
  4. Lai, M. Surface Nano-Structuring of Titanium and Its Effect on Bone Marrow Mesenchymal Stem Cells. Ph.D. Thesis, Chongqing University, Chongqing, China, 2013. [Google Scholar] [CrossRef]
  5. Xiong, L.; Yang, L.; Zhang, X.; Xu, J.; Qin, L.; Chan, C.W. Comparative study of osteoconduction on micromachined and alkali-treated titanium alloy surfaces in vitro and in vivo. Biomaterials 2005, 26, 1793–1801. [Google Scholar]
  6. Zhi, L.; Qiu, J.; Ling, Q.D.; Jia, L.; Liu, H.; Ge, S. TiO2 nanorod arrays modified Ti substrates promote the adhesion, proliferation and osteogenic differentiation of human periodontal ligament stem cells. Mater. Sci. Eng. C 2017, 76, 684–691. [Google Scholar] [CrossRef]
  7. Ge, Z.; Zinger, O.; Schwartz, Z.; Wieland, M.; Landolt, D.; Boyan, B.D. Osteoblast-like cells are sensitive to submicron-scale surface structure. Clin. Oral Implant. Res. 2006, 17, 258–264. [Google Scholar] [CrossRef]
  8. Aparicio, C.; Padrós, A.; Gil, F.J. In vivo evaluation of micro-rough and bioactive titanium dental implants using histometry and pull-out tests. J. Mech. Behav. Biomed. Mater. 2011, 4, 1672–1682. [Google Scholar] [CrossRef] [PubMed]
  9. Elsheikh, A.H.; Yu, J.; Sathyamurthy, R.; Tawfik, M.; Shanmugan, S.; Essa, F. Improving the tribological properties of AISI M50 steel using Sns/Zno solid lubricants. J. Alloys Compd. 2020, 821, 153494, ISSN 0925-8388. [Google Scholar] [CrossRef]
  10. Wan, Y.; Wang, T.; Wang, Z.; Jin, Y.; Liu, Z. Construction and characterization of micro/nano-topography on titanium alloy formed by micro-milling and anodic oxidation. Int. J. Adv. Manuf. Technol. 2018, 98, 29–35. [Google Scholar] [CrossRef]
  11. Wang, T.; Wan, Y.; Liu, Z. Fabrication of hierarchical micro/nano-topography on bio-titanium alloy surface for cytocompatibility improvement. J. Mater. Sci. 2016, 51, 9551–9561. [Google Scholar] [CrossRef]
  12. Brnemark, R.; Emanuelsson, L.; Palmquist, A.; Thomsen, P. Bone response to laser-induced micro- and nano-size titanium surface features. Nanomed. Nanotechnol. Biol. Med. 2010, 7, 220–227. [Google Scholar] [CrossRef]
  13. Menbo. Design and Fabrication of Micro-Nano Structures on Titanium Alloy Surfaces and Their Bioactivity. Master’s Thesis, Shandong University, Jinan, China, 2015. [Google Scholar]
  14. Xueying, C. Preparation and Experimental Study of Allogeneic Bone Graft Materials. Ph.D. Thesis, Southern Medical University, Guangzhou, China, 2008. [Google Scholar]
  15. Federle, W.; Barnes, W.J.; Baumgartner, W.; Drechsler, P.; Smith, J.M. Wet but not Slippery: Boundary Friction in Tree Frog. J. R. Soc. Interface 2006, 10, 689–697. [Google Scholar] [CrossRef] [Green Version]
  16. Luo, Q.J.; Li, X.D.; Huang, Y.; Zhao, S.F. Construction of a micro-nano composite structure of implant surface and its biological evaluation. J. Zhejiang Univ. 2012, 41, 239–244. [Google Scholar] [CrossRef]
  17. Li, K.; Wang, Y.; Yu, Z.; Hu, J. Process mechanism in laser peen texturing artificial joint material. Opt. Lasers Eng. 2019, 115, 149–160. [Google Scholar] [CrossRef]
  18. Dong, H.; Bell, T.; Shi, W. Potential of improving tribological performance of UHMWPE by engineering the Ti6Al4V counter-faces. Wear Int. J. Sci. Technol. Frict. Lubr. Wear 1999, 225, 146–153. [Google Scholar]
  19. Liu, Z.Y.; Luo, B.W.; Xia, Y.M.; Wang, K.; Wang, T.; Xun, H. Study on multi-parameter coupling of fiber laser processing for titanium alloy surface texturing. J. Hunan Univ. Sci. Technol. 2011, 26, 36–38. [Google Scholar] [CrossRef]
  20. Feng, Q.L. Introduction to Biomaterials. Beijing Tsinghua Univ. Press 2009, 3, 377–378. [Google Scholar]
  21. Williams, D.F. On the mechanisms of biocompatibility. Biomaterials 2008, 29, 2941–2953. [Google Scholar] [CrossRef] [PubMed]
  22. Zhang, W.; Wang, G.; Liu, Y.; Zhao, X.; Zou, D.; Zhu, C.; Jin, Y.; Huang, Q.; Sun, J.; Liu, X.; et al. The synergistic effect of hierarchical micro/nano-topography and bioactive ions for enhanced osseointegration. Biomaterials 2013, 34, 3184–3195. [Google Scholar] [CrossRef] [PubMed]
  23. Cui, Z.D.; Ma, Y.; Zhu, S.L.; Yang, X. Laser Surface Modification of Titanium and Its Alloys for Biomedical Application. Mech. Eng. Mater. 2004, 28, 43. [Google Scholar] [CrossRef]
  24. Zhang, X.C.; Zhang, Y.K.; Lu, J.Z.; Xuan, F.Z.; Wang, Z.D.; Tu, S.T. Improvement of fatigue life of Ti–6Al–4V alloy by laser shock peening. Mater. Sci. Eng. A Struct. Mater. Prop. Micro-Struct. Process. 2010, 527, 3411–3415. [Google Scholar] [CrossRef]
  25. Zhang, Y.; You, J.; Lu, J.; Cui, C.; Jiang, Y.; Ren, X. Effects of laser shock processing on stress corrosion cracking susceptibility of AZ31B magnesium alloy. Surf. Coat. Technol. 2010, 204, 3947–3953. [Google Scholar] [CrossRef]
  26. Lu, J.Z.; Luo, K.Y.; Yuan, P.; Yin, S.M.; Zhang, Y.K. Study on the Distribution of Residual Stresses for Nondestructive Marking by Laser Shock Wave. Key Eng. Mater. 2010, 873, 454–457. [Google Scholar] [CrossRef]
  27. Luong, H.; HILL, M.R. The effects of laser peening on high-cycle fatigue in 7085-T7651 aluminum alloy. Mater. Sci. Eng. A 2008, 477, 208–216. [Google Scholar] [CrossRef]
  28. Hakamada, M.; Nakamoto, Y.; Matsumoto, H.; Iwasaki, H.; Chen, Y.; Kusuda, H.; Mabuchi, M. Relationship between hardness and grain size in electrodeposited copper films. Mater. Sci. Eng. A 2007, 457, 120–126. [Google Scholar] [CrossRef]
  29. King, A.; Steuwer, A.; Woodward, C.; Withers, P.J. Effects of fatigue and fretting on residual stresses introduced by laser shock peening. Mater. Sci. Eng. A 2006, 435, 12–18. [Google Scholar] [CrossRef]
  30. Montross, C.S.; Wei, T.; Ye, L.; Clark, G.; Mai, Y.W. Laser shock processing and its effects on microstructure and properties of metal alloys: A review. Int. J. Fatigue 2002, 24, 1021–1036. [Google Scholar] [CrossRef]
  31. Yamamoto, S. Tribological Mechanisms of Steels with Respect to Diamond-Like Carbon in Terms of Energy Input. Tribol. Trans. 2014, 57, 1001–1006. [Google Scholar] [CrossRef]
  32. Bhushan, B.; Nosonovsky, M. Scale effects in dry and wet friction, wear, and interface temperature. Nanotechnology 2004, 15, 749–761. [Google Scholar] [CrossRef]
Figure 1. Flow chart of the experiment.
Metals 12 01148 g001
Figure 2. Pork bone surface morphology. (a) Surface morphology of pork bones(500 μm) (b) Surface morphology of pork bones(200 μm) (c) Surface morphology of pork bones (100 nm) (d) Pork bone sample (e) Surface morphology of pork bones (200 μm).
Metals 12 01148 g002
Figure 3. Microstructure of tree frog paw and finger tip. (a) Tree Frog (b) diagram of the finger-end sucker structure of the treefrog pedipalps (c) cellular prism on the interphalangeal epidermis of the treefrog pedipalps (d) micro-nanostructure under the cellular prism on the interphalangeal epidermis (e) microscopic view of the longitudinal section of the cellular prism on the epidermis.
Metals 12 01148 g003
Figure 4. Micro-nano structure surface structure design drawing. (a) Regular hexagon, (b) hexagonal enclosing circle and (c) circle enclosing hexagonal (d) circle.
Metals 12 01148 g004
Figure 5. Surface roughness of TC4.
Metals 12 01148 g005
Figure 6. Polished surface of titanium alloy. (a) Titanium alloy experimental block (b) Surface morphology of the sample after pre-treatment (500 μm).
Metals 12 01148 g006
Figure 7. Process of acid-etching treatment.
Metals 12 01148 g007
Figure 8. Diagram of point selection. (a) Depth Direction; (b) Horizontal direction.
Metals 12 01148 g008
Figure 9. The relationship between machining speed and the appearance of the surface. (a) v = 200 mm/s, (b) v = 300 mm/s, (c) v = 400 mm/s, (d) v = 500 mm/s, (e) Contour graph for different speeds.
Metals 12 01148 g009aMetals 12 01148 g009b
Figure 10. The relationship between machining power and the appearance of the surface. (a) P = 15 W, (b) P = 20 W, (c) P = 25 W, (d) P = 30 W, (e) Contour graph for different power.
Metals 12 01148 g010
Figure 11. The relationship between machining frequency and the appearance of the surface. (a) f = 20 kHZ, (b) f = 30 kHZ, (c) f = 40 kHZ, (d) f = 50 kHZ, (e) Contour graph for different frequency.
Metals 12 01148 g011
Figure 12. Array of regular hexagonal tabs. (a) Physical picture, (b) Surface morphology diagram.
Metals 12 01148 g012
Figure 13. Three-dimensional morphological view of laser-ablated tab (number of processes n = 1).
Metals 12 01148 g013
Figure 14. Two-dimensional tabular morphology along the A-A section.
Metals 12 01148 g014
Figure 15. Relationship between the number of ablations and the height of the ortho-hexagonal boss.
Metals 12 01148 g015
Figure 16. Diagrams of laser processing ortho-hexagonal bosses at different scales. (a) 1000 μm, (b) 500 μm, (c) 100 μm.
Metals 12 01148 g016
Figure 17. Surface composition of the workpiece after laser processing.
Metals 12 01148 g017
Figure 18. Surface composition of the workpiece after acid etching.
Metals 12 01148 g018
Figure 19. Optical microscope images (a,b) and SEM images (c) of the boss after laser and acid etching.
Metals 12 01148 g019
Figure 20. Hardness along the depth and horizontal direction.
Metals 12 01148 g020
Figure 21. Friction coefficient of the surface of different specimens. (a) Friction Curve, (b) Average friction coefficient.
Metals 12 01148 g021
Figure 22. Schematic diagram of surface friction wear of different specimens. (a) Micro-shaped surface, (b) Smooth surface.
Metals 12 01148 g022
Figure 23. Influence of shape on surface friction coefficient. (a) Friction coefficient curve, (b) Average friction coefficient.
Metals 12 01148 g023
Figure 24. Influence of side length on surface friction coefficient. (a) Friction coefficient curve, (b) Average friction coefficient.
Metals 12 01148 g024
Figure 25. Influence of height on the surface friction coefficient. (a) Friction coefficient curve, (b) Average friction coefficient.
Metals 12 01148 g025
Figure 26. Effect of interaction of different variables on the friction coefficient of the woven surface. (a) Side length-height (weave shape = 0.33), (b) Side length-height (weave shape = 0.33), (c) Shape-height (weave edge length = 250 μm).
Metals 12 01148 g026aMetals 12 01148 g026b
Table 1. Chemical composition of TC4.
TiAlVFeONCH
88.1~91.15.5~6.83.5~4.5<0.3<0.20<0.05<0.08<0.015
Table 2. Material properties of TC4.
Strength
/GPa
Modulus of
Elasticity
/GPa
Density
/(g/cm3)
Melting Point/°CBoiling Point/°CThermal Conductivity
/(W/m*k)
1.0121104.453200165020
Table 3. Process parameters of laser processing—Speed.
NumbersMachining
Speed (mm/s)
Machining
Power (W)
Machining Frequency (kHZ)
120020200
230020200
340020200
450020200
Table 4. Process parameters of laser processing—Power.
NumbersMachining
Speed (mm/s)
Machining
Power (W)
Machining Frequency (kHZ)
130015200
230020200
330025200
430030200
Table 5. Process parameters of laser processing—Frequency.
NumbersMachining
Speed (mm/s)
Machining
Power (W)
Machining Frequency (kHZ)
130020200
230020300
330020400
430020500
Table 6. Parameter design for experiments on the effect of weave shape.
No.Weave ShapeWeave Edge
Length (μm)
Weave
Height (μm)
1A20060
2B20060
3C20060
4D20060
Table 7. Parameter design for experiments on the effect of weave edge length.
No.Weave ShapeWeave Edge
Length (μm)
Weave
Height (μm)
1A15060
2A20060
3A25060
4A30060
Table 8. Parameter design for experiments on the effect of weave height.
No.Weave ShapeWeave Edge
Length (μm)
Weave
Height (μm)
1A20030
2A20060
3A20090
4A200120
Table 9. Factor and level of the experiment.
FactorLevel
Shape of the weaveHexagon(A)Hexagon surrounded
by circle(B)
Circle surrounded
by hexagon(C)
Side length
size L/μm
200250300
Height H/μm6090120
Table 10. Experimental design scheme for surface micro-nano structures.
No.Shape of the
Weave
Side Length
Size L/μm
Height H/μm
1B25090
2A250120
3B25090
4C20090
5A30090
3A20090
7B200120
8B25090
9B300120
10B20060
11A25060
12C30090
13C25060
14B25090
15C250120
16B30060
17B25090
Table 11. Response of the average friction coefficient.
No.Weave
Shape
Edge Length Size L/μmTab
Height
H/μm
Average
Friction
Coefficient
10.33250900.102
202501200.113
30.33250900.103
40.66200900.095
50300900.109
60200900.112
70.332001200.115
80.33250900.102
90.333001200.104
100.33200600.098
110250600.114
120.66300900.093
130.66250600.095
140.33250900.102
150.662501200.099
160.33300600.103
170.33250900.105
Table 12. Analysis of variance of cubic regression equation of average friction coefficient.
Analytical ValueSum of SquaresDegrees of FreedomMean Square ErrorF ValueP Value
Parameters7.184 × 10−00497.983 × 10−00556.3<0.0001
S-Shape5.445 × 10−00415.445 × 10−004129.42<0.0001
L-Side length1.512 × 10−00511.512 × 10−00510.50.0099
H-Height5.513 × 10−00515.513 × 10−00513.100.0085
SL2.500 × 10−00712.500 × 10−0070.0590.8144
SH6.250 × 10−00616.250 × 10−0061.490.2624
LH6.400 × 10−00516.400 × 10−00545.46<0.0001
S21.053 × 10−00811.053 × 10−0082.502 × 10−0030.9615
L21.684 × 10−00711.684 × 10−0070.0400.8471
H23.301 × 10−00513.301 × 10−0057.850.0265
Residuals2.945 × 10−00574.207 × 10−006
Misfit term2.825 × 10−00539.417 × 10−006
Pure error1.200 × 10−00643.000 × 10−007
Total7.479 × 10−00416
Table 13. Credibility analysis of the model.
Standard Deviation2.051 × 10−003Goodness of Fit0.9606
Mean Value0.10Correlation coefficient0.98500
Coefficient of variation %1.58Prediction coefficientN/A
Precision4.539 × 10−004
Publisher’s Note: MDPI stays neutral with regard to jurisdictional claims in published maps and institutional affiliations.

