
Mechanical Properties of the Ti49.8Ni50.2 Alloy after Multi-Axial Forging at 573 K

 , ,
, , 
Abstract
:1. Introduction
2. Materials and Methods
3. Results
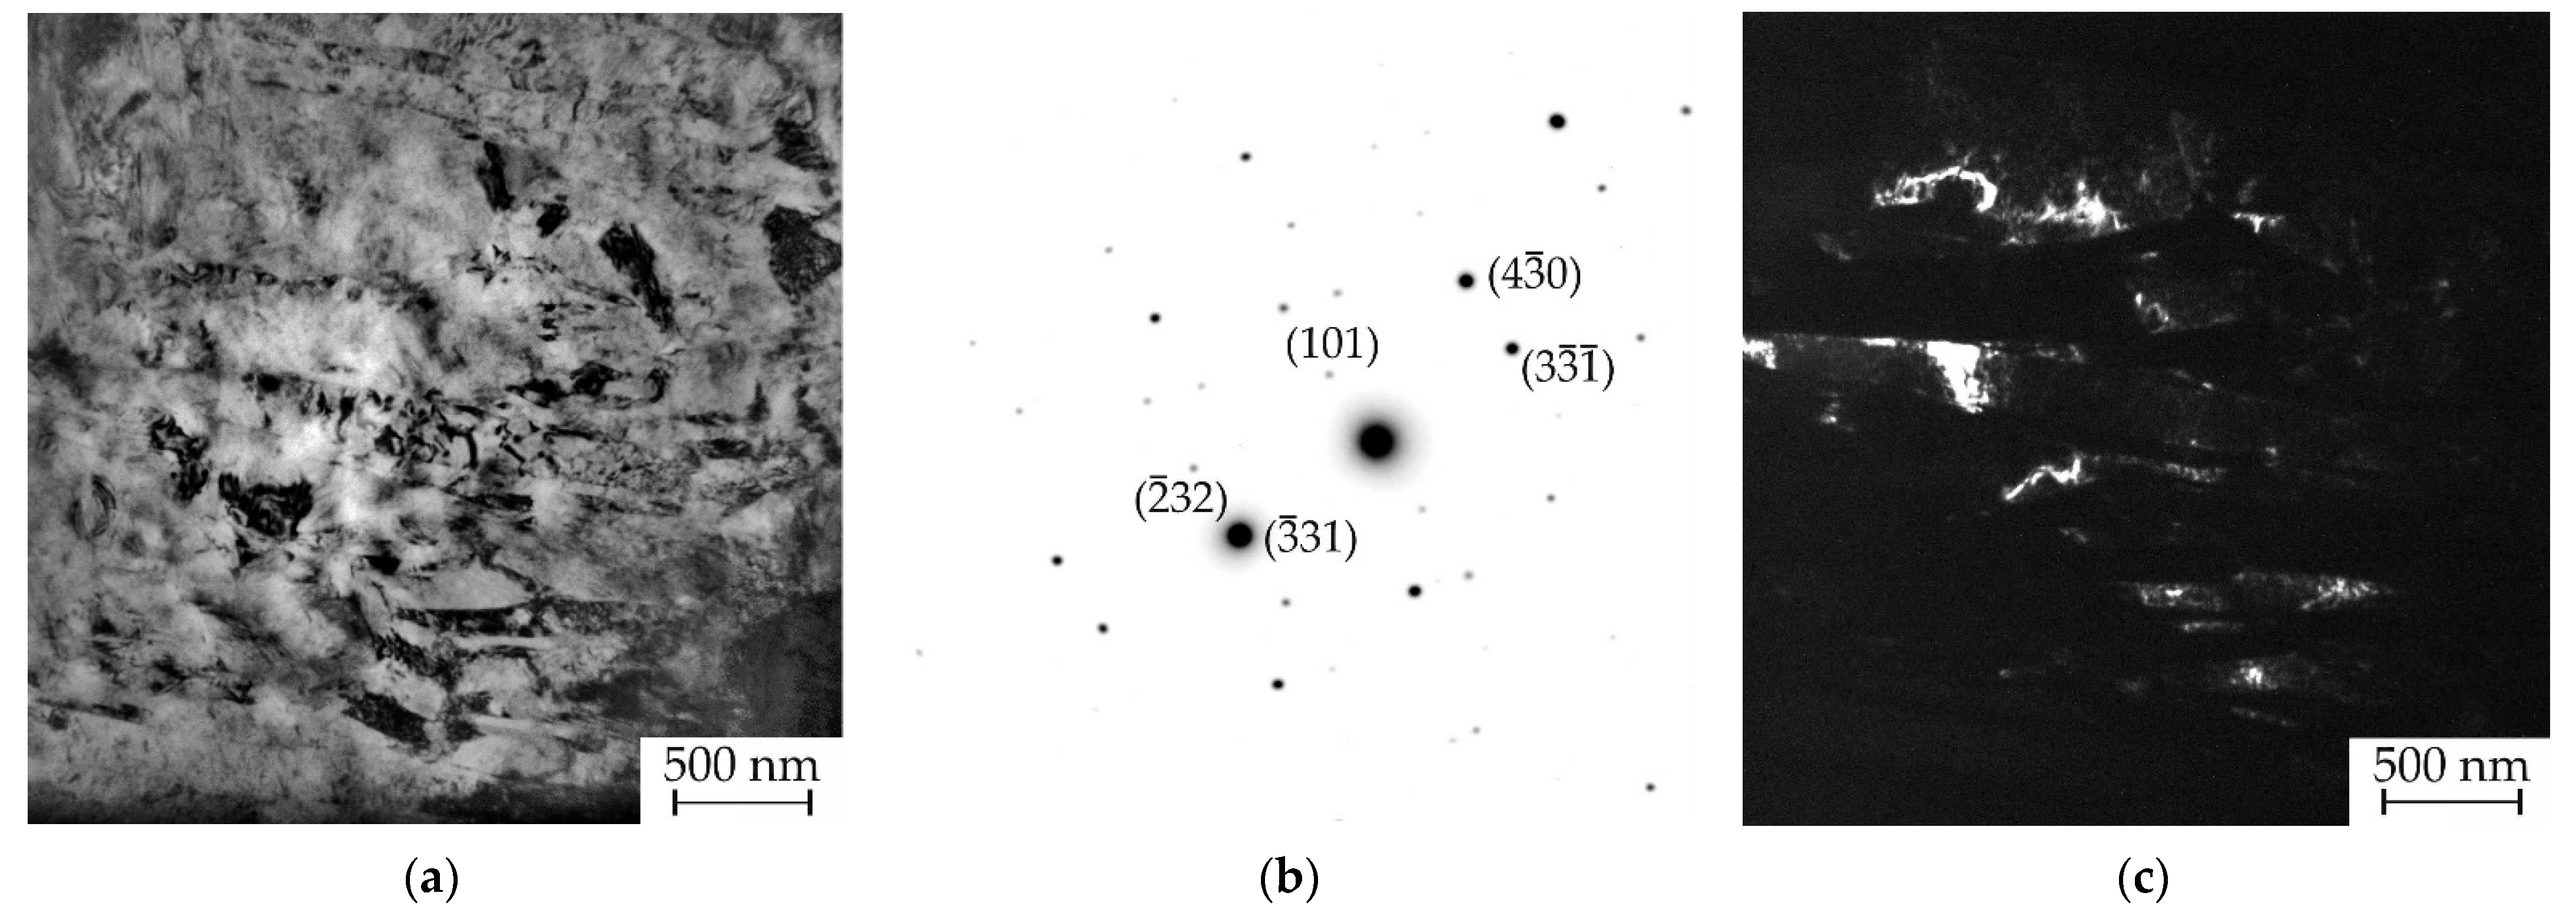
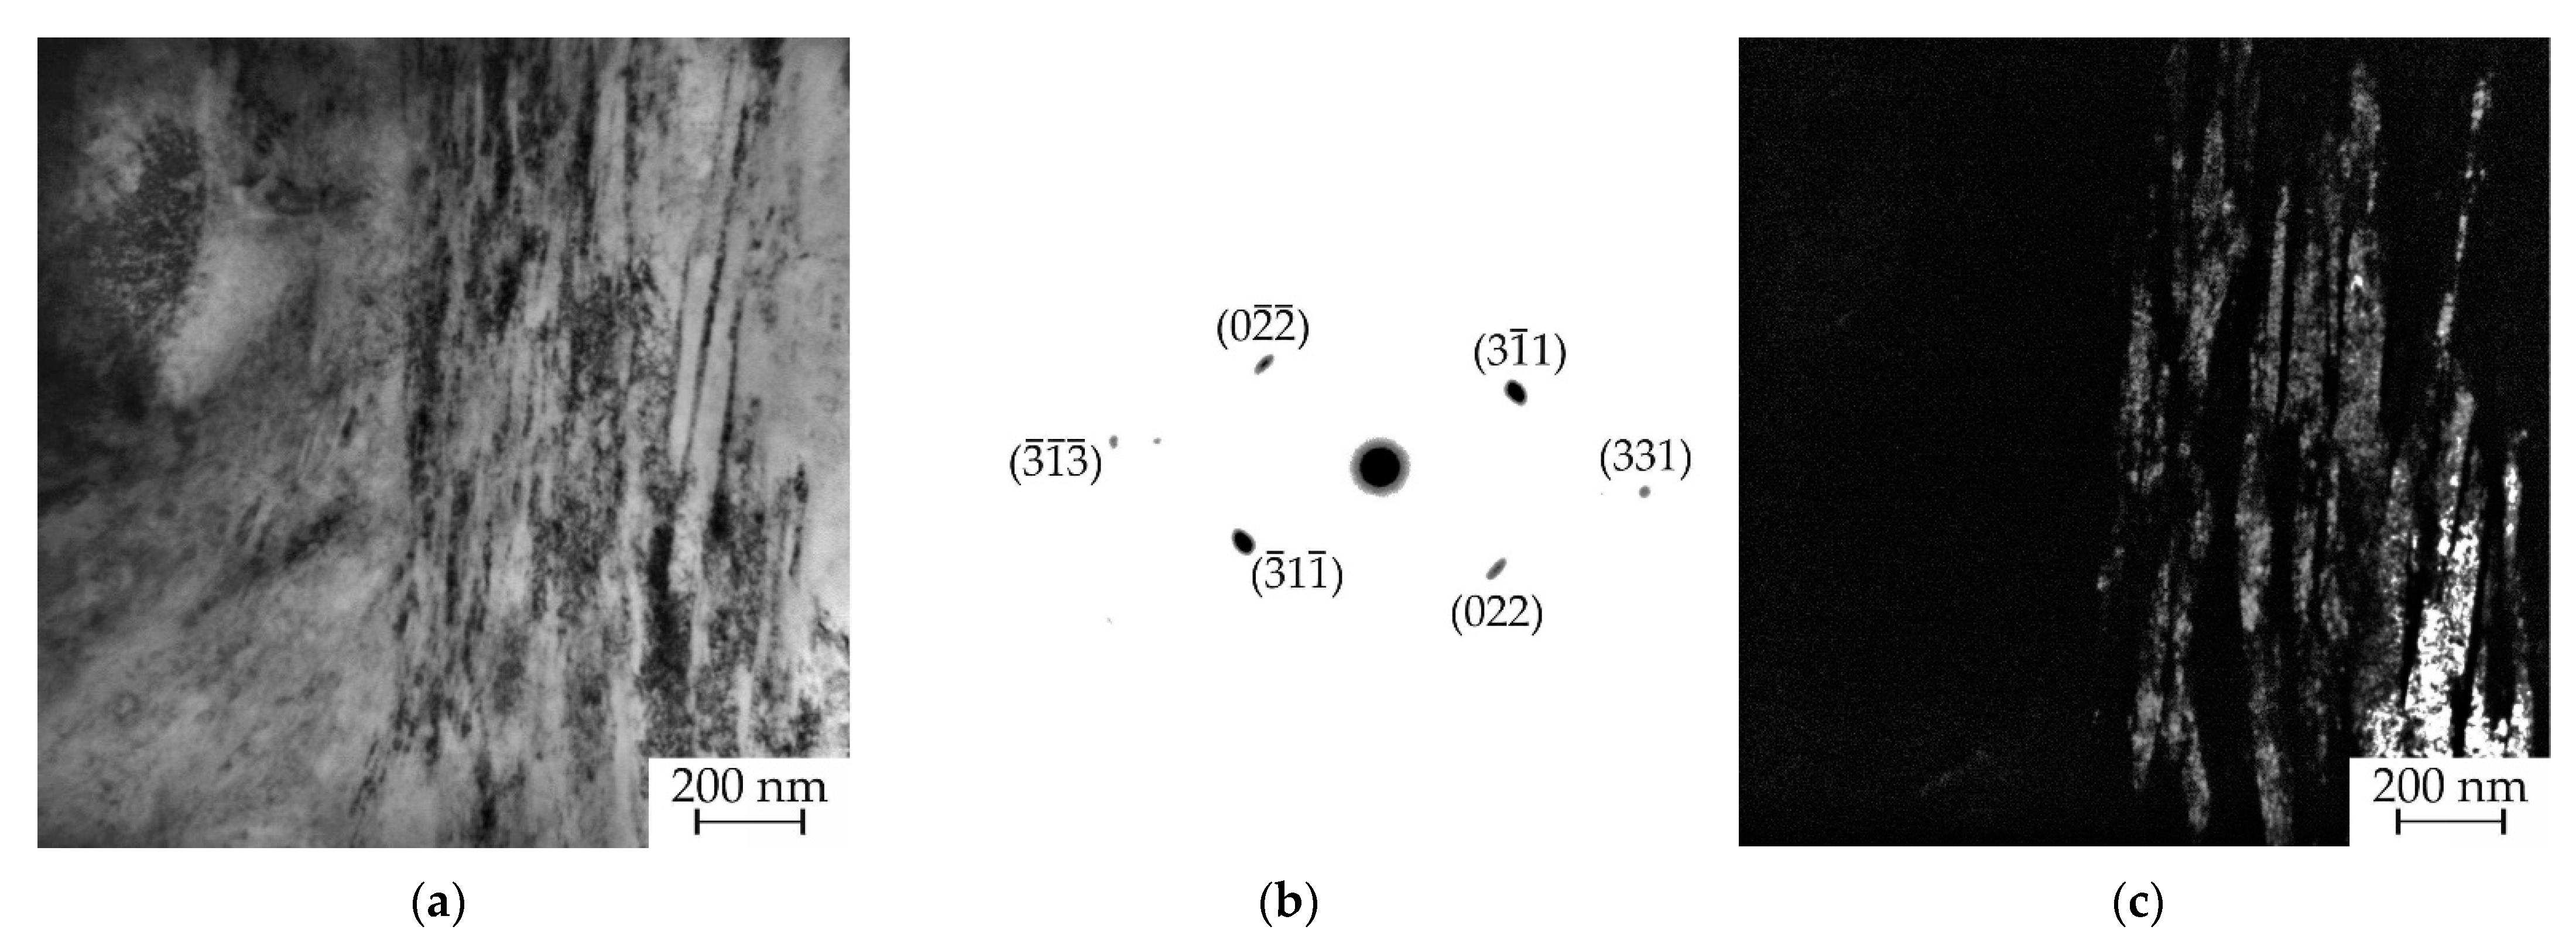
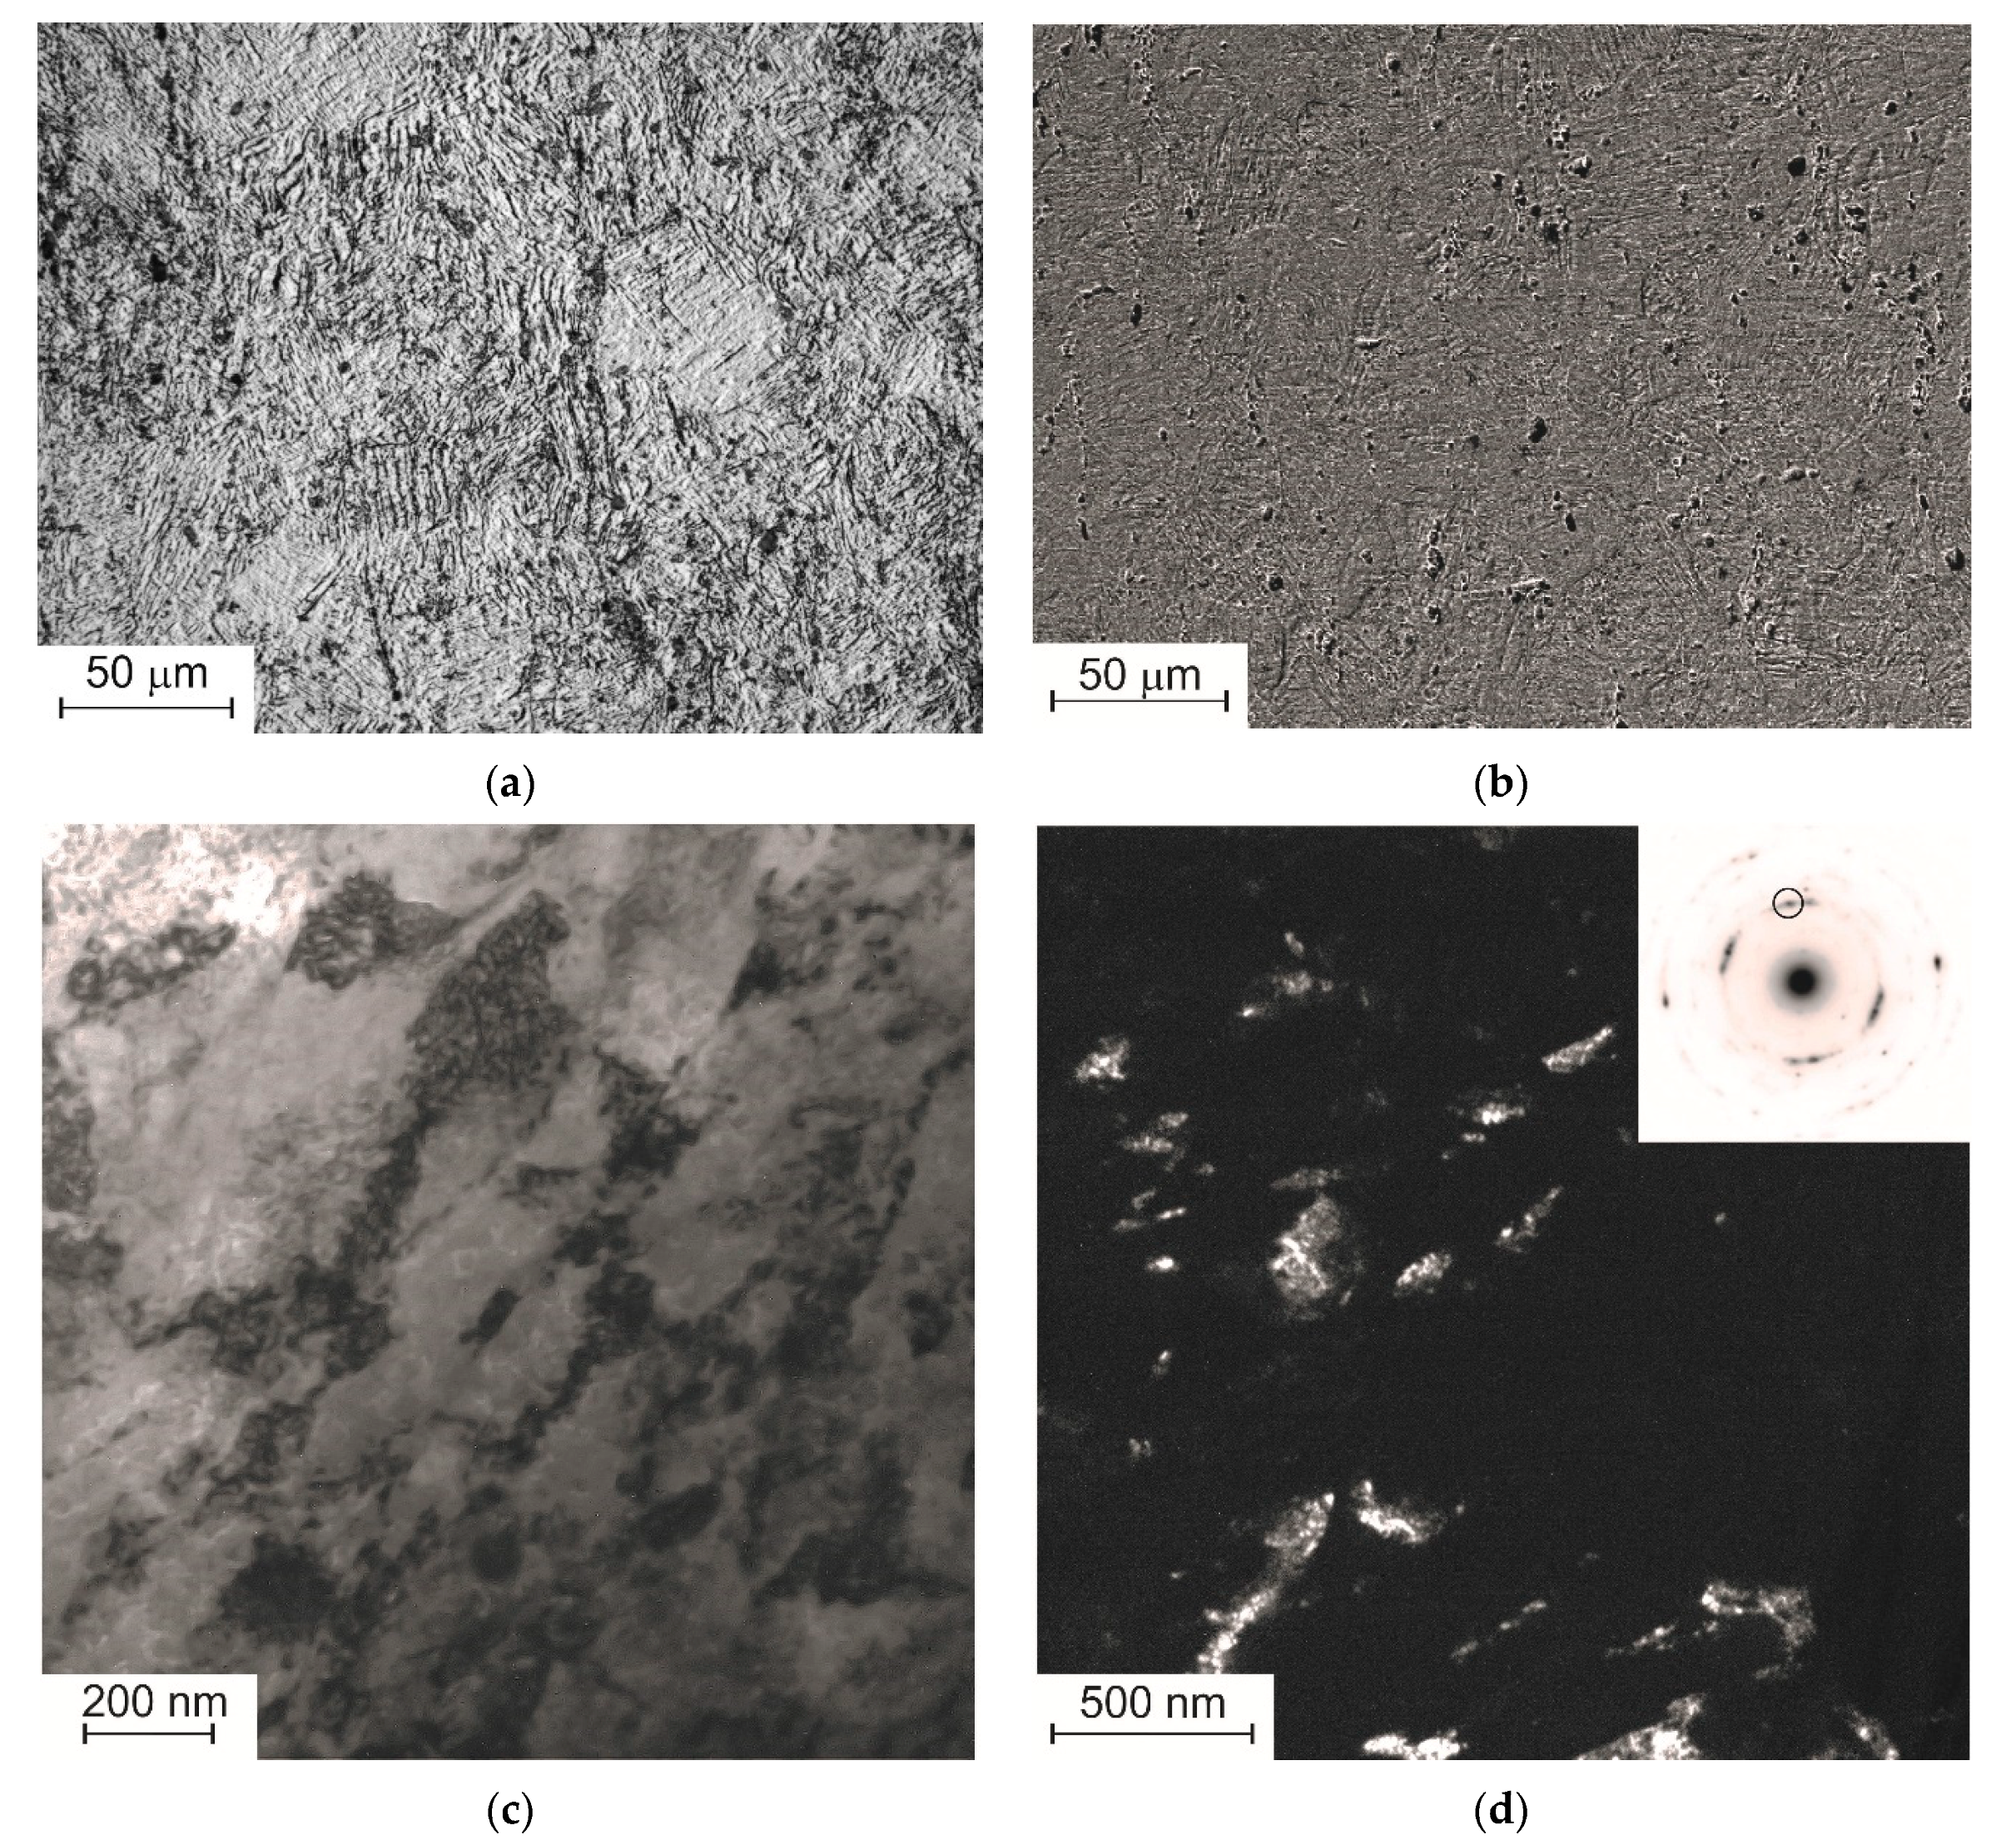
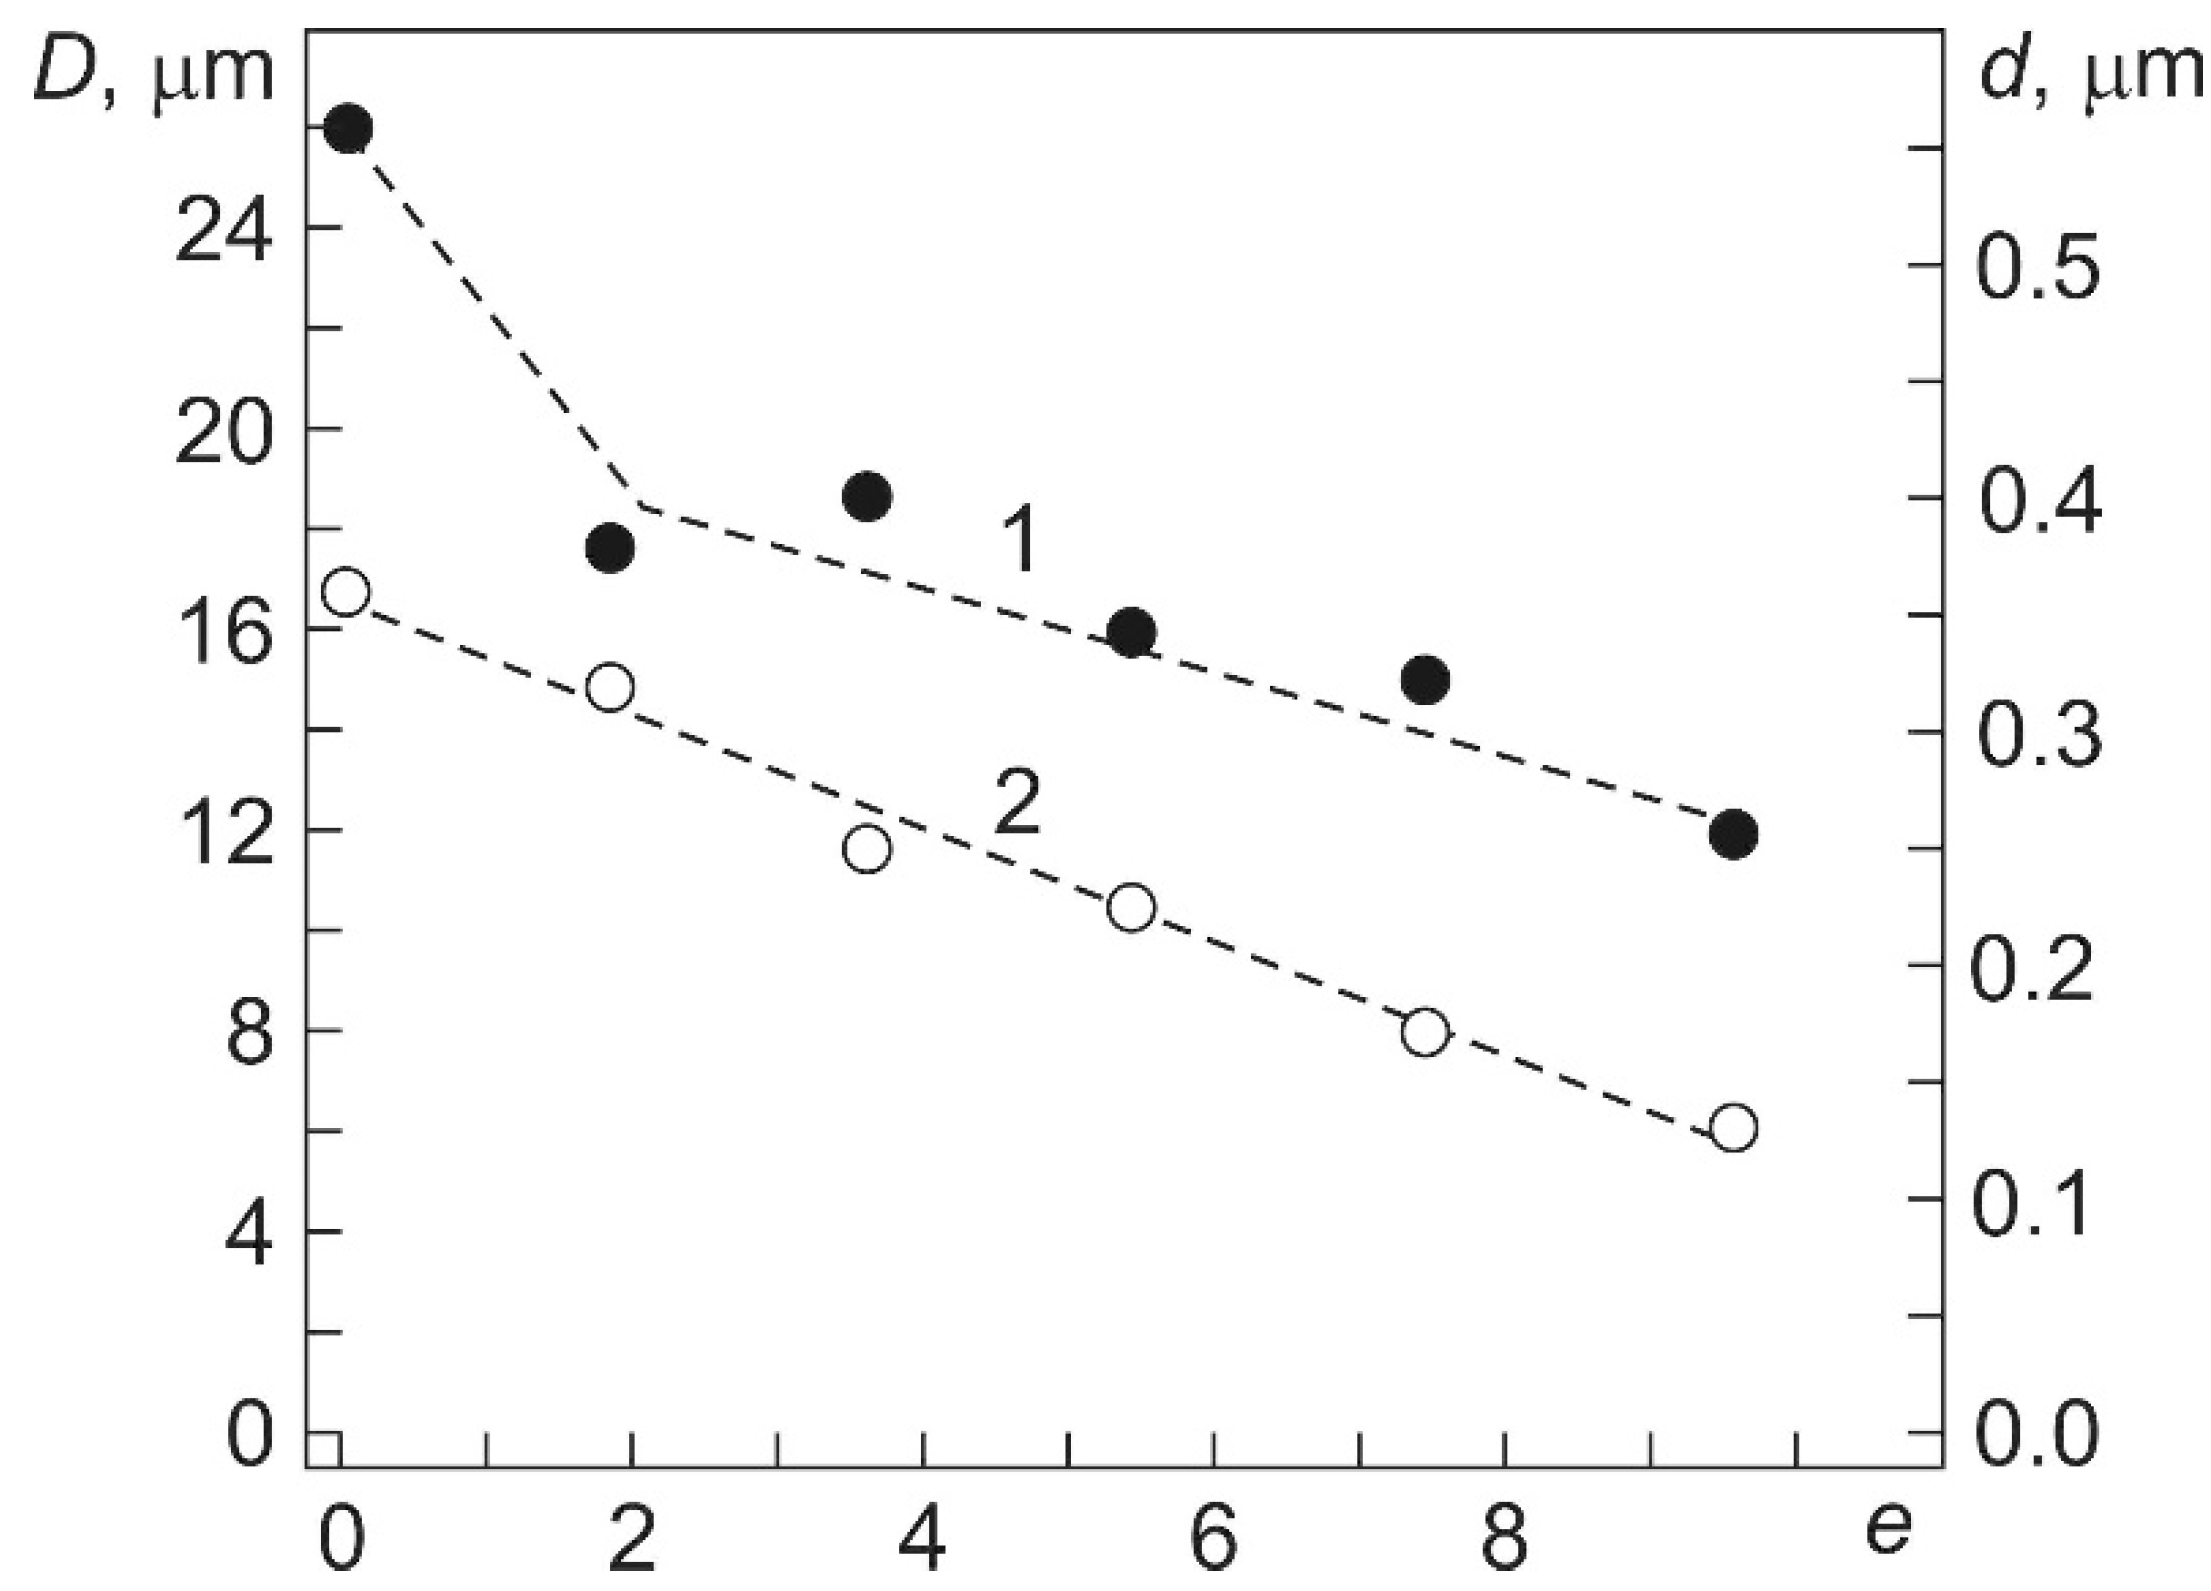
3.1. Microstructure
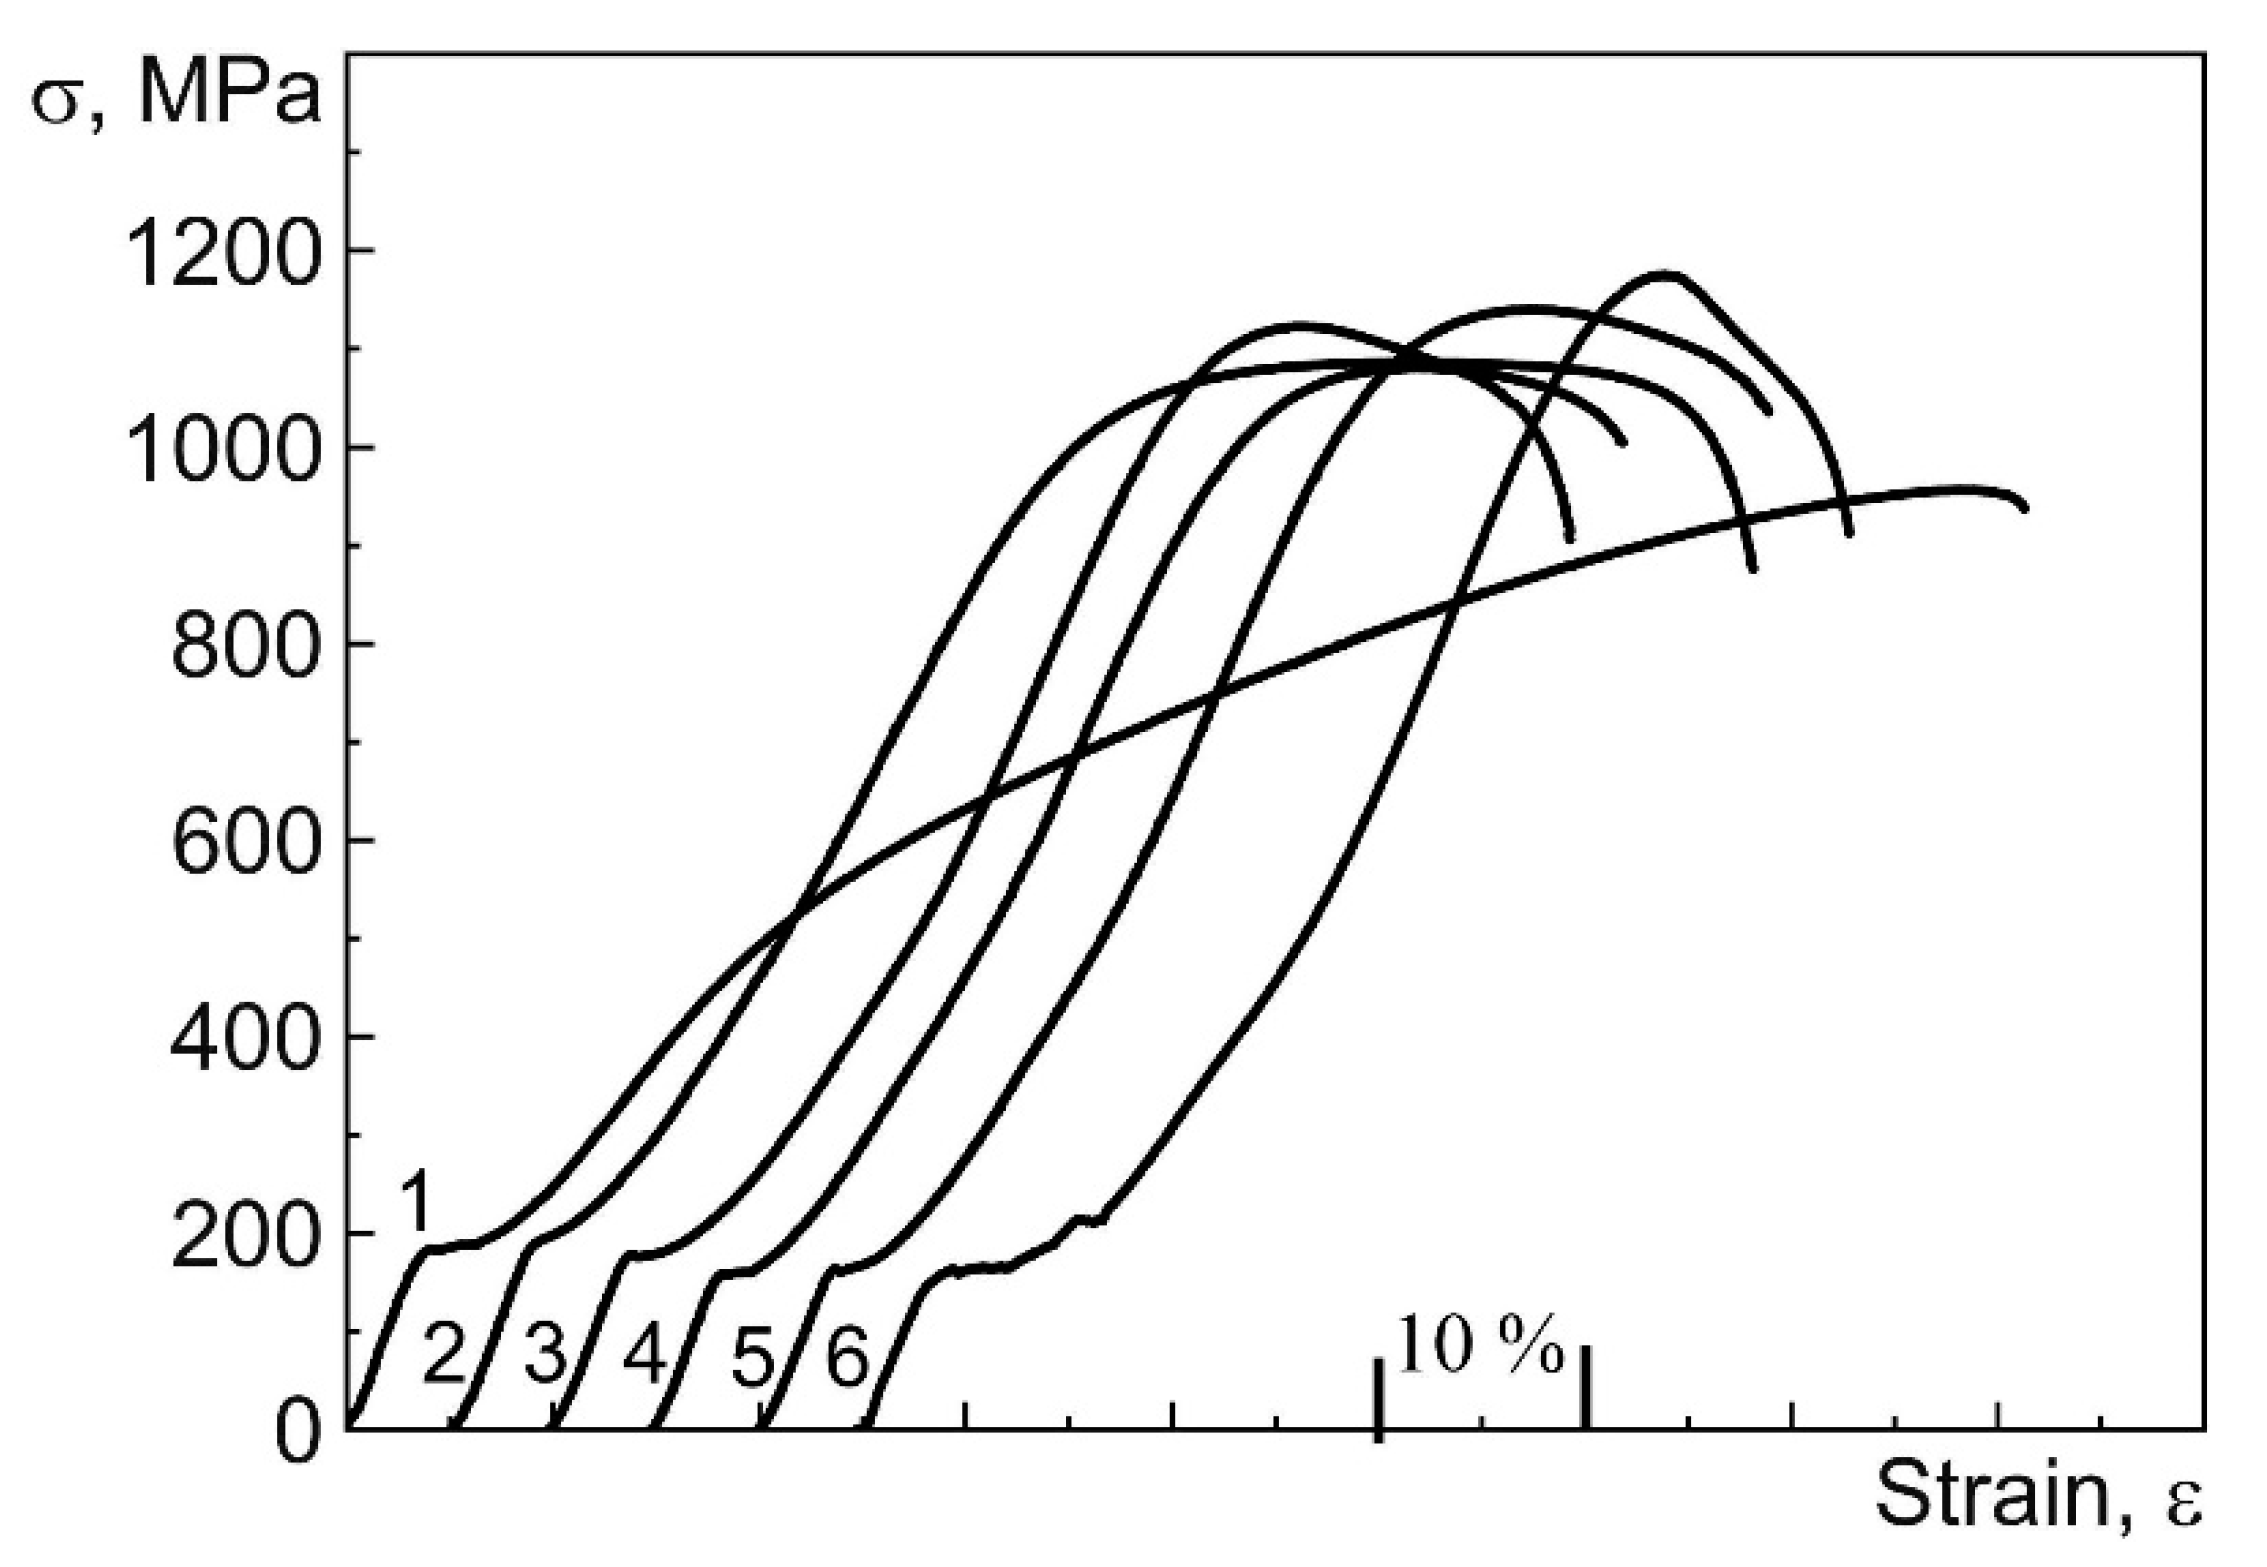
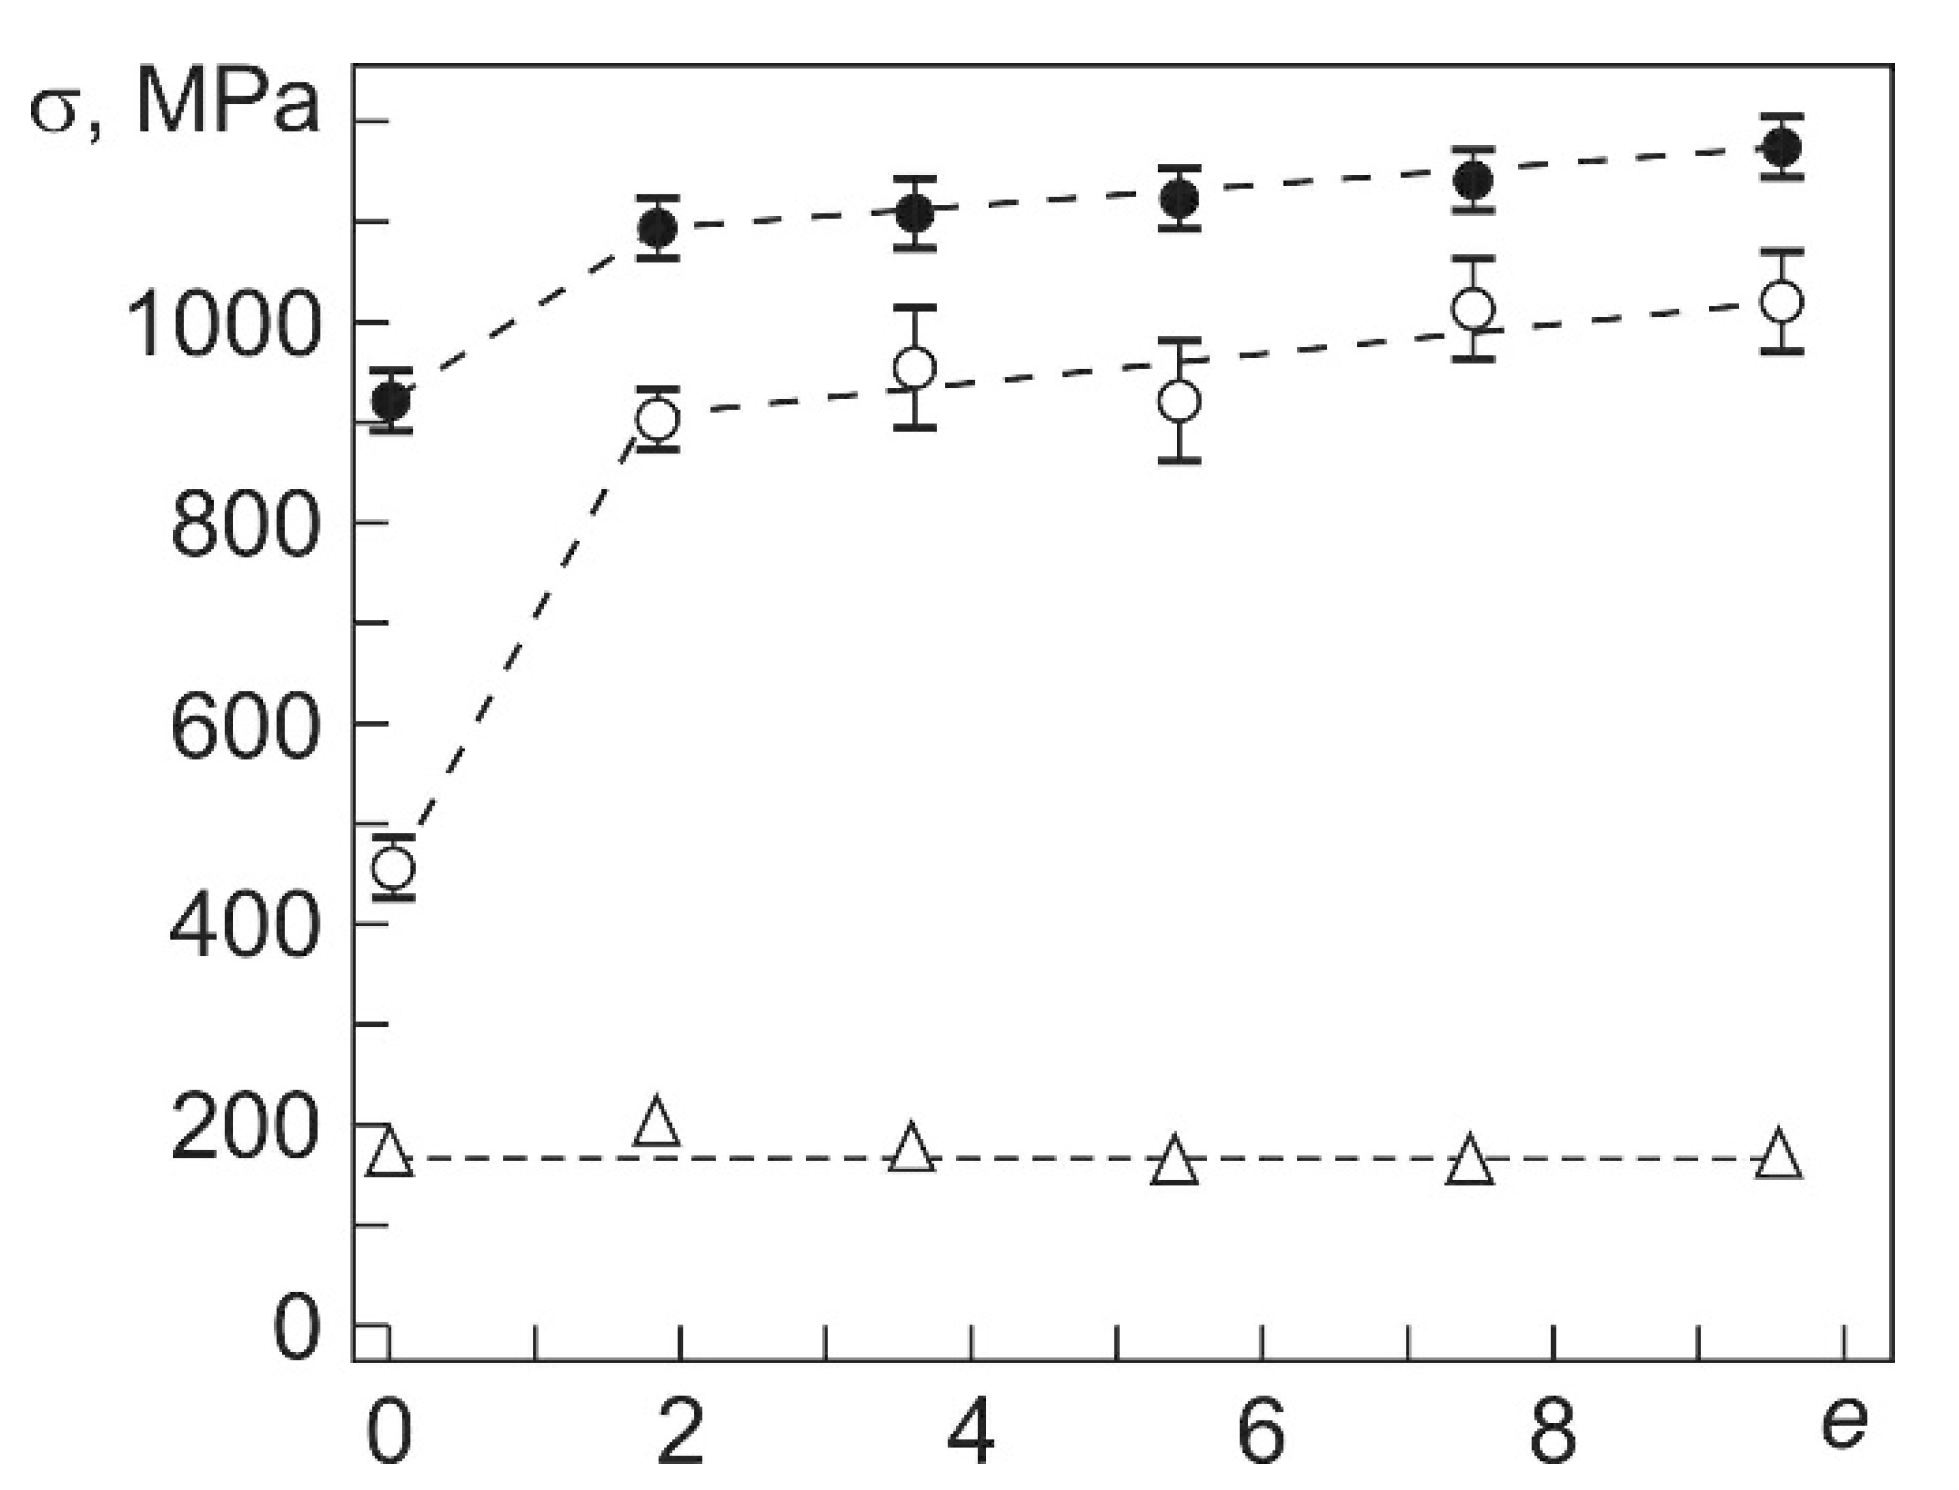
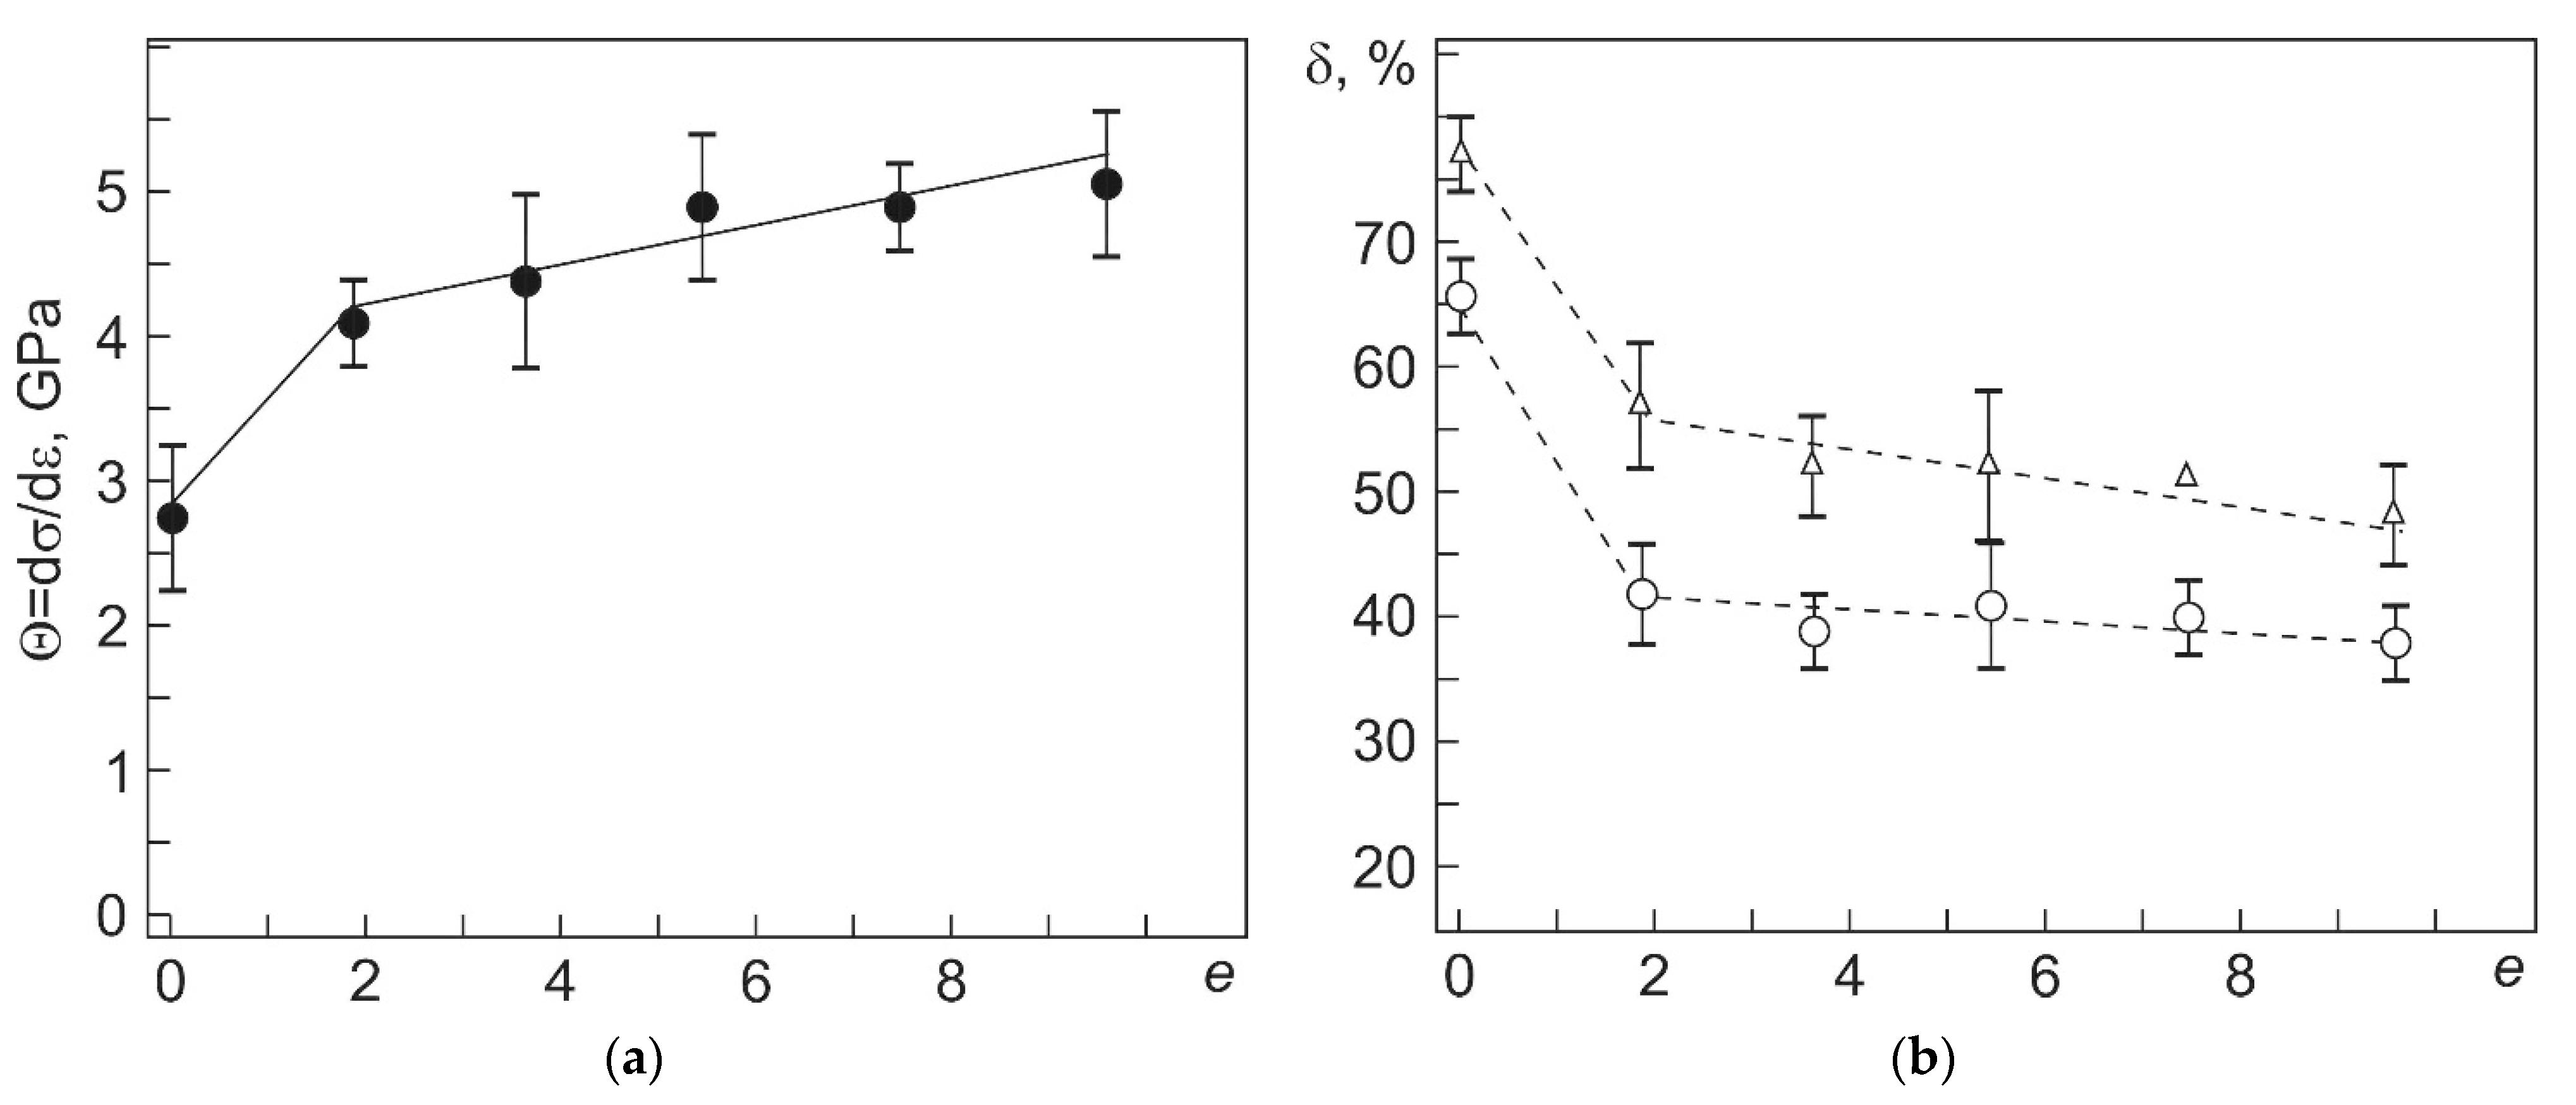
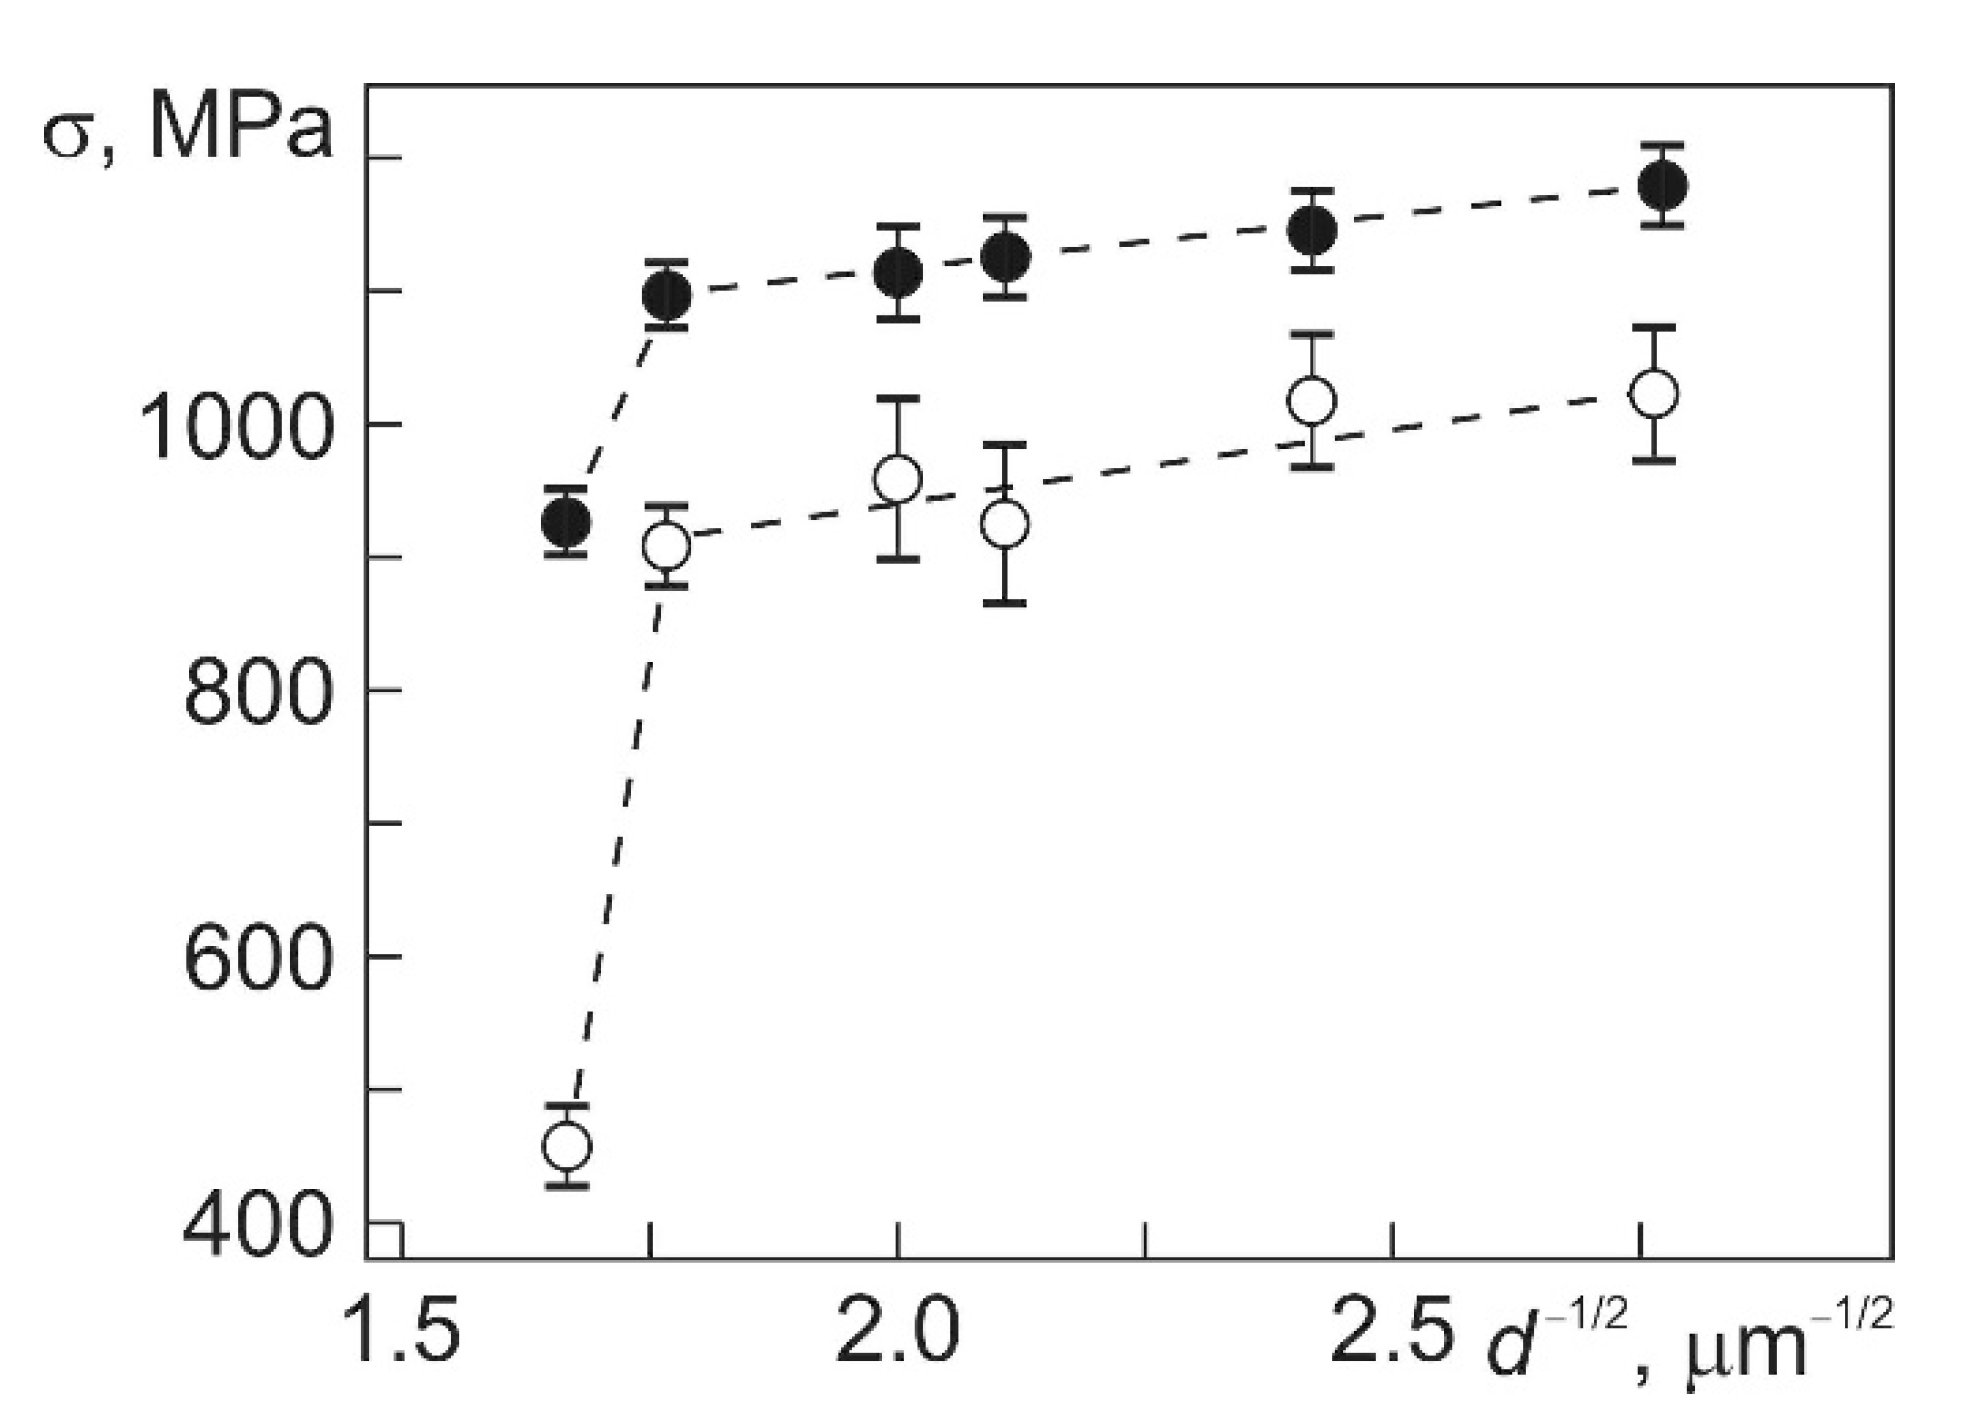
3.2. Mechanical Properties
4. Discussion
5. Conclusions
Author Contributions
Funding
Institutional Review Board Statement
Informed Consent Statement
Data Availability Statement
Conflicts of Interest
References
- Valiev, R.Z.; Zhilyaev, A.P.; Langdon, T. Bulk Nanostructured Materials: Fundamentals and Applications; John Wiley & Sons, Inc.: Hoboken, NJ, USA, 2013; p. 440. [Google Scholar] [CrossRef] [Green Version]
- Meyers, M.A.; Mishra, A.; Benson, D.J. Mechanical properties of nanocrystalline materials. Prog. Mater. Sci. 2006, 51, 427–556. [Google Scholar] [CrossRef]
- Estrin, Y.; Vinogradov, A. Extreme grain refinement by severe plastic deformation: A wealth of challenging science. Acta Mater. 2013, 61, 782–817. [Google Scholar] [CrossRef]
- Ovid’ko, I.A.; Valiev, R.Z.; Zhu, Y.T. Review on superior strength and enhanced ductility of metallic nanomaterials. Prog. Mater. Sci. 2018, 94, 462–540. [Google Scholar] [CrossRef]
- Bagherpour, E.; Pardis, N.; Reihanian, M.; Ebrahimi, R. An overview on severe plastic deformation: Research status, techniques classification, microstructure evolution, and applications. Int. J. Adv. Manuf. Technol. 2019, 100, 1647–1694. [Google Scholar] [CrossRef] [Green Version]
- Kockar, B.; Karaman, I.; Kim, J.I.; Chumlyakov, Y.I.; Sharp, J.; Yu, C.-J.M. Thermomechanical cyclic response of an ultrafine-grained NiTi shape memory alloy. Acta Mater. 2008, 56, 3630–3646. [Google Scholar] [CrossRef]
- Stolyarov, V.V.; Prokof’ev, E.A.; Valiev, R.Z.; Prokoshkin, S.D.; Dobatkon, S.B.; Trubitsyna, I.B.; Khmelevskaya, I.Y.; Pushin, V.G. Structural Features, Mechanical properties, and the shape-memory effect in TiNi alloys subjected to equal-channel angular pressing. Phys. Met. Metallogr. 2005, 100, 608–618. [Google Scholar]
- Khmelevskaya, I.Y.; Prokoshkin, S.D.; Trubitsyna, I.B.; Belousov, M.N.; Dobatkin, S.V.; Tatyanin, E.V.; Korotitsky, A.V.; Brailovski, V.; Stolayrov, V.V.; Prokofiev, E.A. Structure and properties of Ti-Ni-based alloys after equal-channel angular pressing and high-pressure torsion. Mater. Sci. Eng. A 2008, 481–482, 119–122. [Google Scholar] [CrossRef]
- Mironov, S.Y.; Salishchev, G.A.; Myshlyaev, M.M.; Pippan, R. Evolution of misorientation distribution during warm ‘abc’ forging of commercial-purity titanium. Mater. Sci. Eng. A 2006, 418, 257–267. [Google Scholar] [CrossRef]
- Lotkov, A.I.; Grishkov, V.N.; Dudarev, E.F.; Koval, Y.N.; Girsova, N.V.; Kashin, O.A.; Tabachenko, A.N.; Firstov, G.S.; Timkin, V.N.; Zhapova, D.Y. Ultrafine Structure and Martensitic Transformation in Titanium Nickelide after Warm abc Pressing. Inorg. Mater. Appl. Res. 2011, 2, 548–555. [Google Scholar] [CrossRef]
- Lotkov, A.I.; Grishkov, V.N.; Kashin, O.A.; Baturin, A.A.; Zhapova, D.Y.; Timkin, V.N. Mechanisms of microstructure evolution in TiNi-based alloys under warm deformation and its effect on martensite transformations. In Shape Memory Alloys: Properties, Technologies, Opportunities; Materials Science Foundations; Resnina, N., Rubanic, V., Eds.; Trans Tech Publications Ltd.: Bäch, Switzerland, 2015; Volume 81–82, pp. 245–259. [Google Scholar] [CrossRef]
- Shamsolhodaei, A.; Zarei-Hanzaki, A.; Moghaddam, M. Structural and functional properties of a semi equiatomic NiTi shape memory alloy processed by multi-axial forging. Mater. Sci. Eng. A 2017, 700, 1–9. [Google Scholar] [CrossRef]
- Kashin, O.; Krukovskii, K.; Lotkov, A.; Grishkov, V. Effect of True Strains in Isothermal abc Pressing on Mechanical Properties of Ti49.8Ni50.2 Alloy. Metals 2020, 10, 1313. [Google Scholar] [CrossRef]
- Kashin, O.; Lotkov, A.I.; Grishkov, V.; Krukovskii, K.; Zhapova, D.; Mironov, Y.; Girsova, N.; Kashina, O.; Barmina, E. Effect of abc Pressing at 573 K on the Microstructure and Martensite Transformation Temperatures in Ti49.8Ni50.2 (at%). Metals 2021, 11, 1145. [Google Scholar] [CrossRef]
- Warren, B.E.; Averbach, B.L. The separation of cold-work distortion and particle size broadening in X-ray patterns. J. Appl. Phys. 1952, 23, 497. [Google Scholar] [CrossRef]
- Krill, C.E.; Birringer, R. Estimating grain-size distributions in nanocrystalline materials from X-ray diffraction profile analysis. Philos. Mag. A 1998, 77, 621–640. [Google Scholar] [CrossRef]
- Williamson, G.K.; Smallman, R.E., III. Dislocation densities in some annealed and cold–worked metals from measurements on the X–ray Debye–Scherrer spectrum. Phil. Mag. 1956, 1, 34–46. [Google Scholar] [CrossRef]
- Smallman, R.E.; Westmacott, K.H. Stacking faults in face-centred cubic metals and alloys. Phil. Mag. 1957, 2, 669–683. [Google Scholar] [CrossRef]
- Hall, E.O. The deformation and ageing of mild steel: Ⅲ. Discussion of results. Proc. Phys. Soc. 1951, 64, 747–753. [Google Scholar] [CrossRef]
- Petch, N.J. The cleavage strength of polycrystals. J. Iron Steel Inst. 1953, 174, 25–28. [Google Scholar]
- Hirth, J.P.; Lothe, J. Theory of Dislocations, 2nd ed.; N-Y. J. Wiley & Sons, Inc.: Hoboken, NJ, USA, 1982; p. 857. [Google Scholar]
- Gleiter, H. Nanostructured materials: Basic consepts and microstructure. Acta Mater. 2000, 48, 1–29. [Google Scholar] [CrossRef] [Green Version]
- Kozlov, E.V.; Zhdanov, A.N.; Koneva, N.A. Barrier Retardation of Dislocations. Hall-Petch Problem. Phys. Mesomech. 2006, 9, 75–86. [Google Scholar]
- Armstrong, R.W. Dislocation and grain size roles in physical mesomechanics. Phys. Mesomech. 2021, 24, 418–425. [Google Scholar] [CrossRef]


Publisher’s Note: MDPI stays neutral with regard to jurisdictional claims in published maps and institutional affiliations. |
© 2022 by the authors. Licensee MDPI, Basel, Switzerland. This article is an open access article distributed under the terms and conditions of the Creative Commons Attribution (CC BY) license (https://creativecommons.org/licenses/by/4.0/).
Share and Cite
Lotkov, A.; Kashin, O.; Grishkov, V.; Zhapova, D.; Krukovskii, K.; Gusarenko, A.; Girsova, N.; Bobrov, D.; Kashina, O. Mechanical Properties of the Ti49.8Ni50.2 Alloy after Multi-Axial Forging at 573 K. Metals 2022, 12, 1043. https://doi.org/10.3390/met12061043
Lotkov A, Kashin O, Grishkov V, Zhapova D, Krukovskii K, Gusarenko A, Girsova N, Bobrov D, Kashina O. Mechanical Properties of the Ti49.8Ni50.2 Alloy after Multi-Axial Forging at 573 K. Metals. 2022; 12(6):1043. https://doi.org/10.3390/met12061043
Chicago/Turabian StyleLotkov, Aleksandr, Oleg Kashin, Victor Grishkov, Dorzhima Zhapova, Konstantin Krukovskii, Angelina Gusarenko, Natalia Girsova, Dmitrii Bobrov, and Olga Kashina. 2022. "Mechanical Properties of the Ti49.8Ni50.2 Alloy after Multi-Axial Forging at 573 K" Metals 12, no. 6: 1043. https://doi.org/10.3390/met12061043