
Fatigue Assessment of Wire and Arc Additively Manufactured Ti-6Al-4V

 , , , and
Abstract
:1. Introduction
2. Materials and Methods
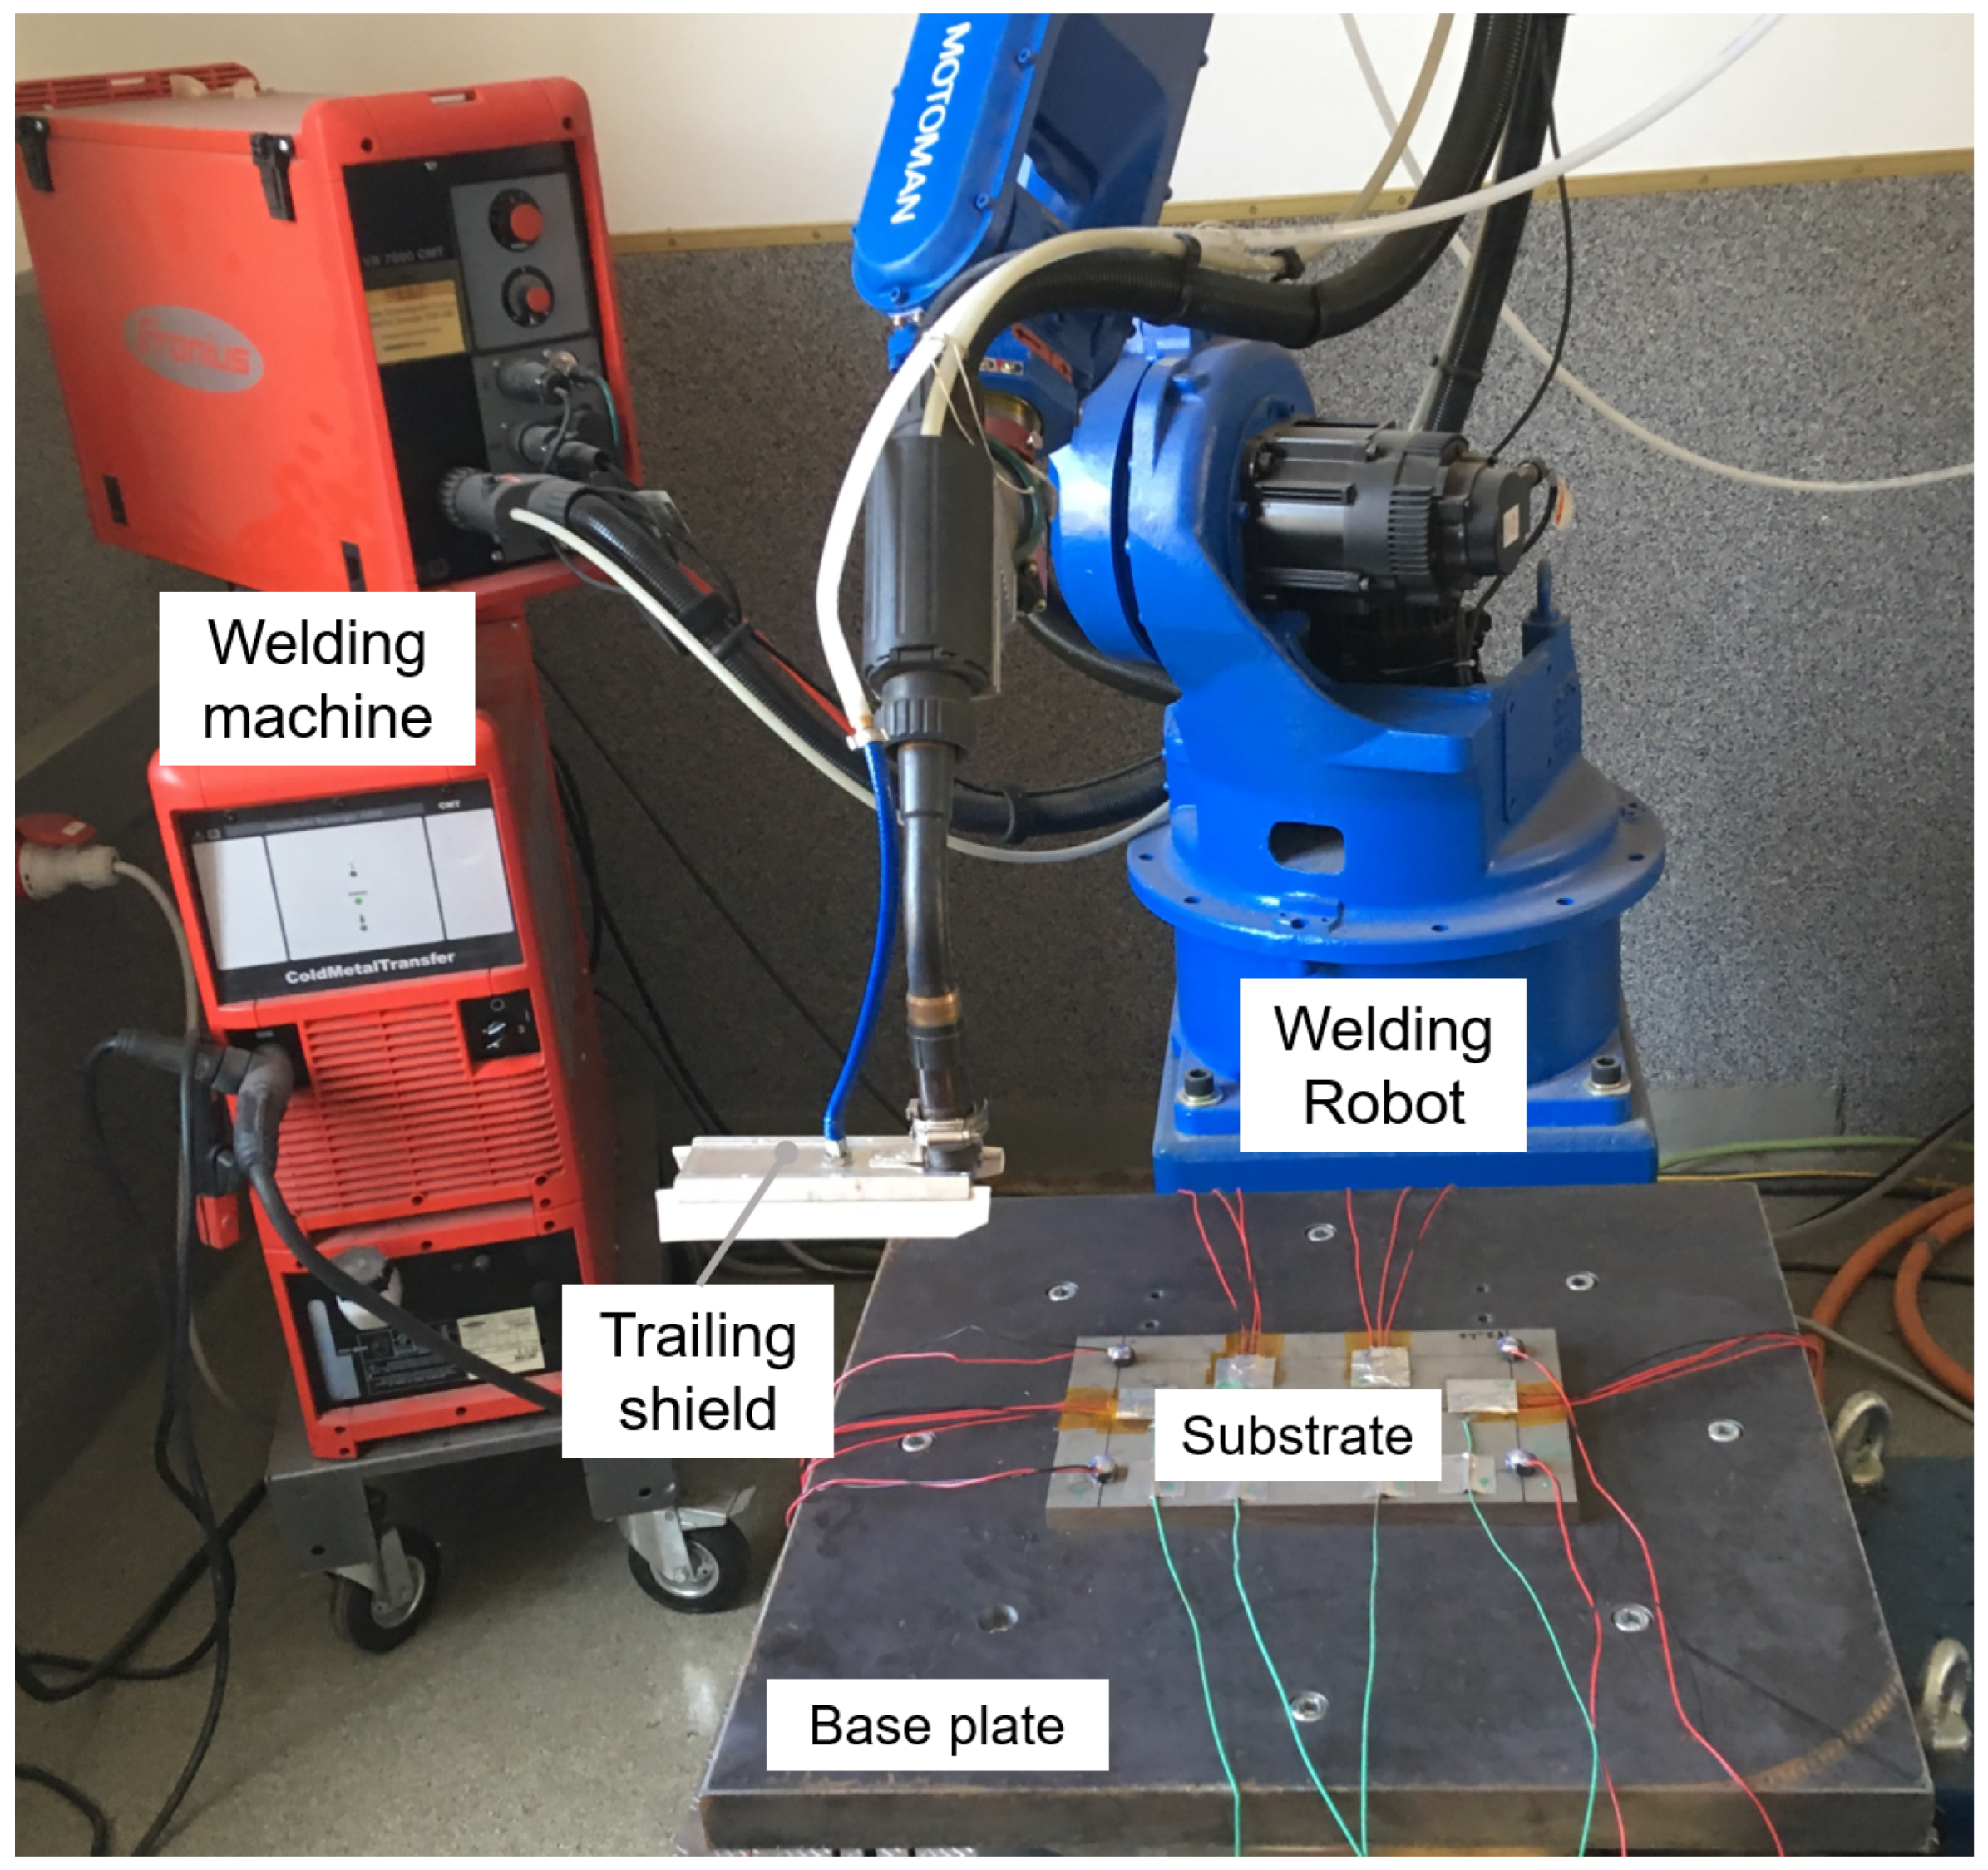
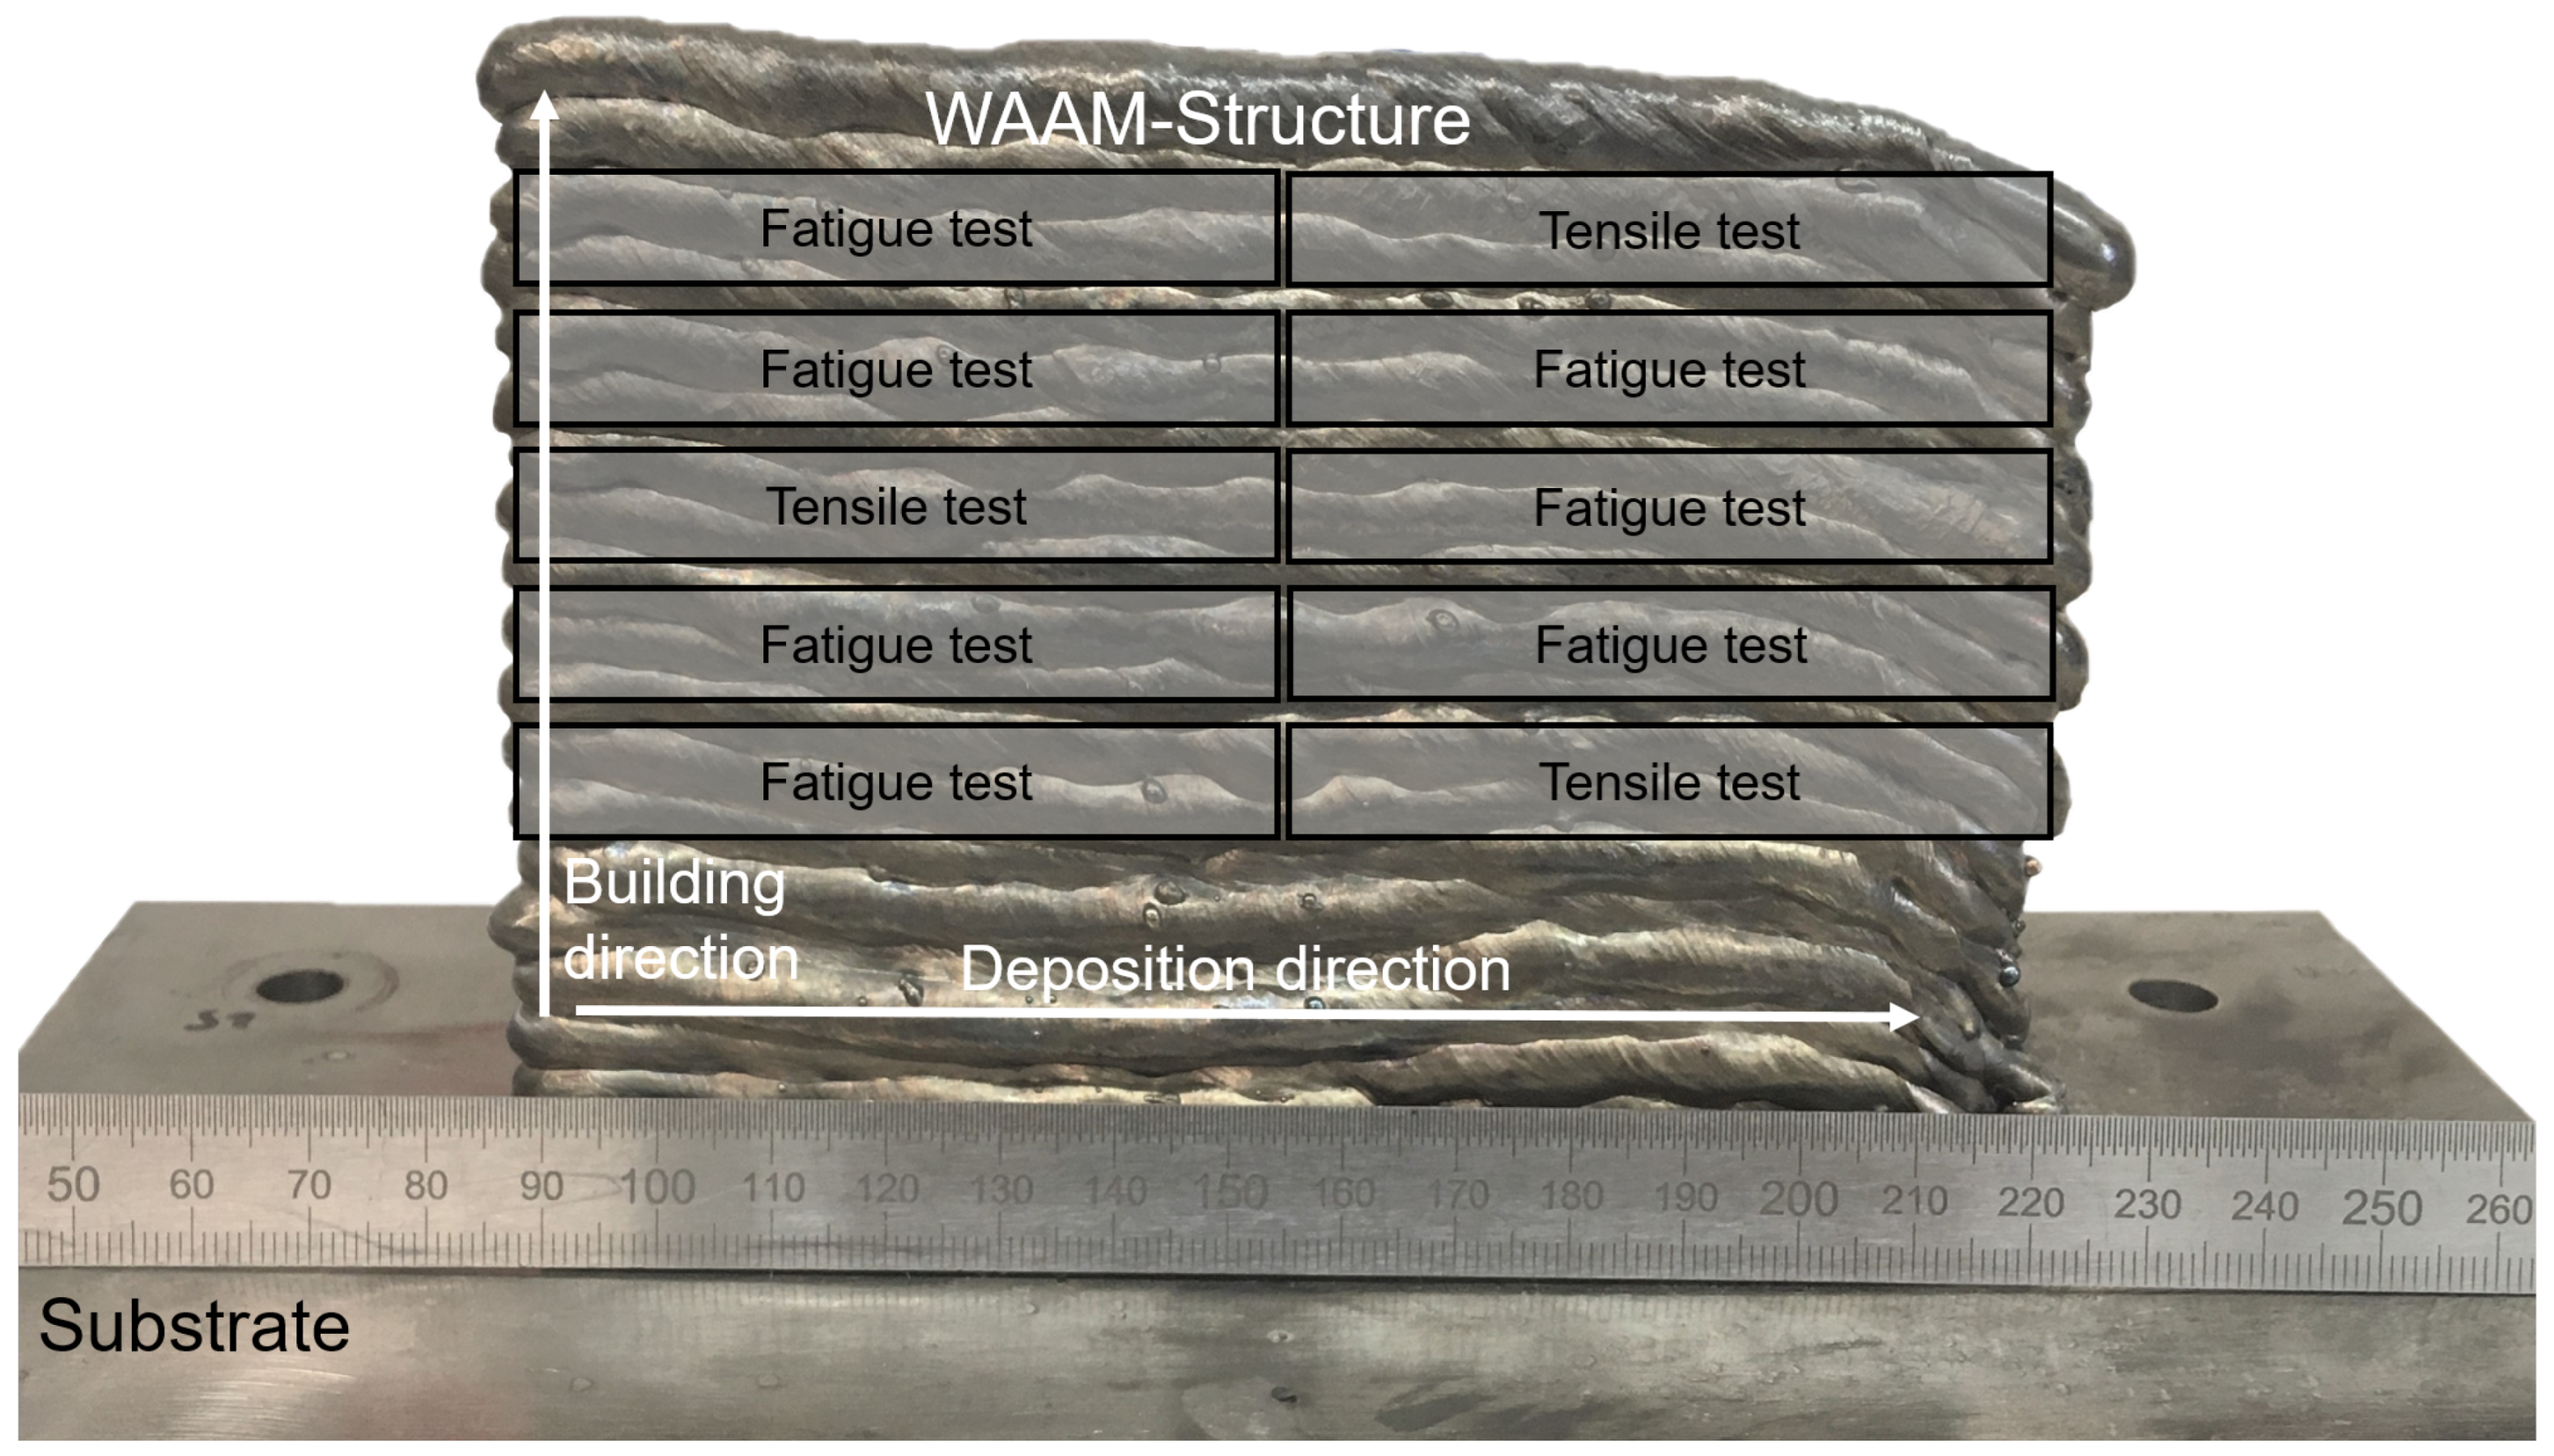
2.1. Material and Manufacturing
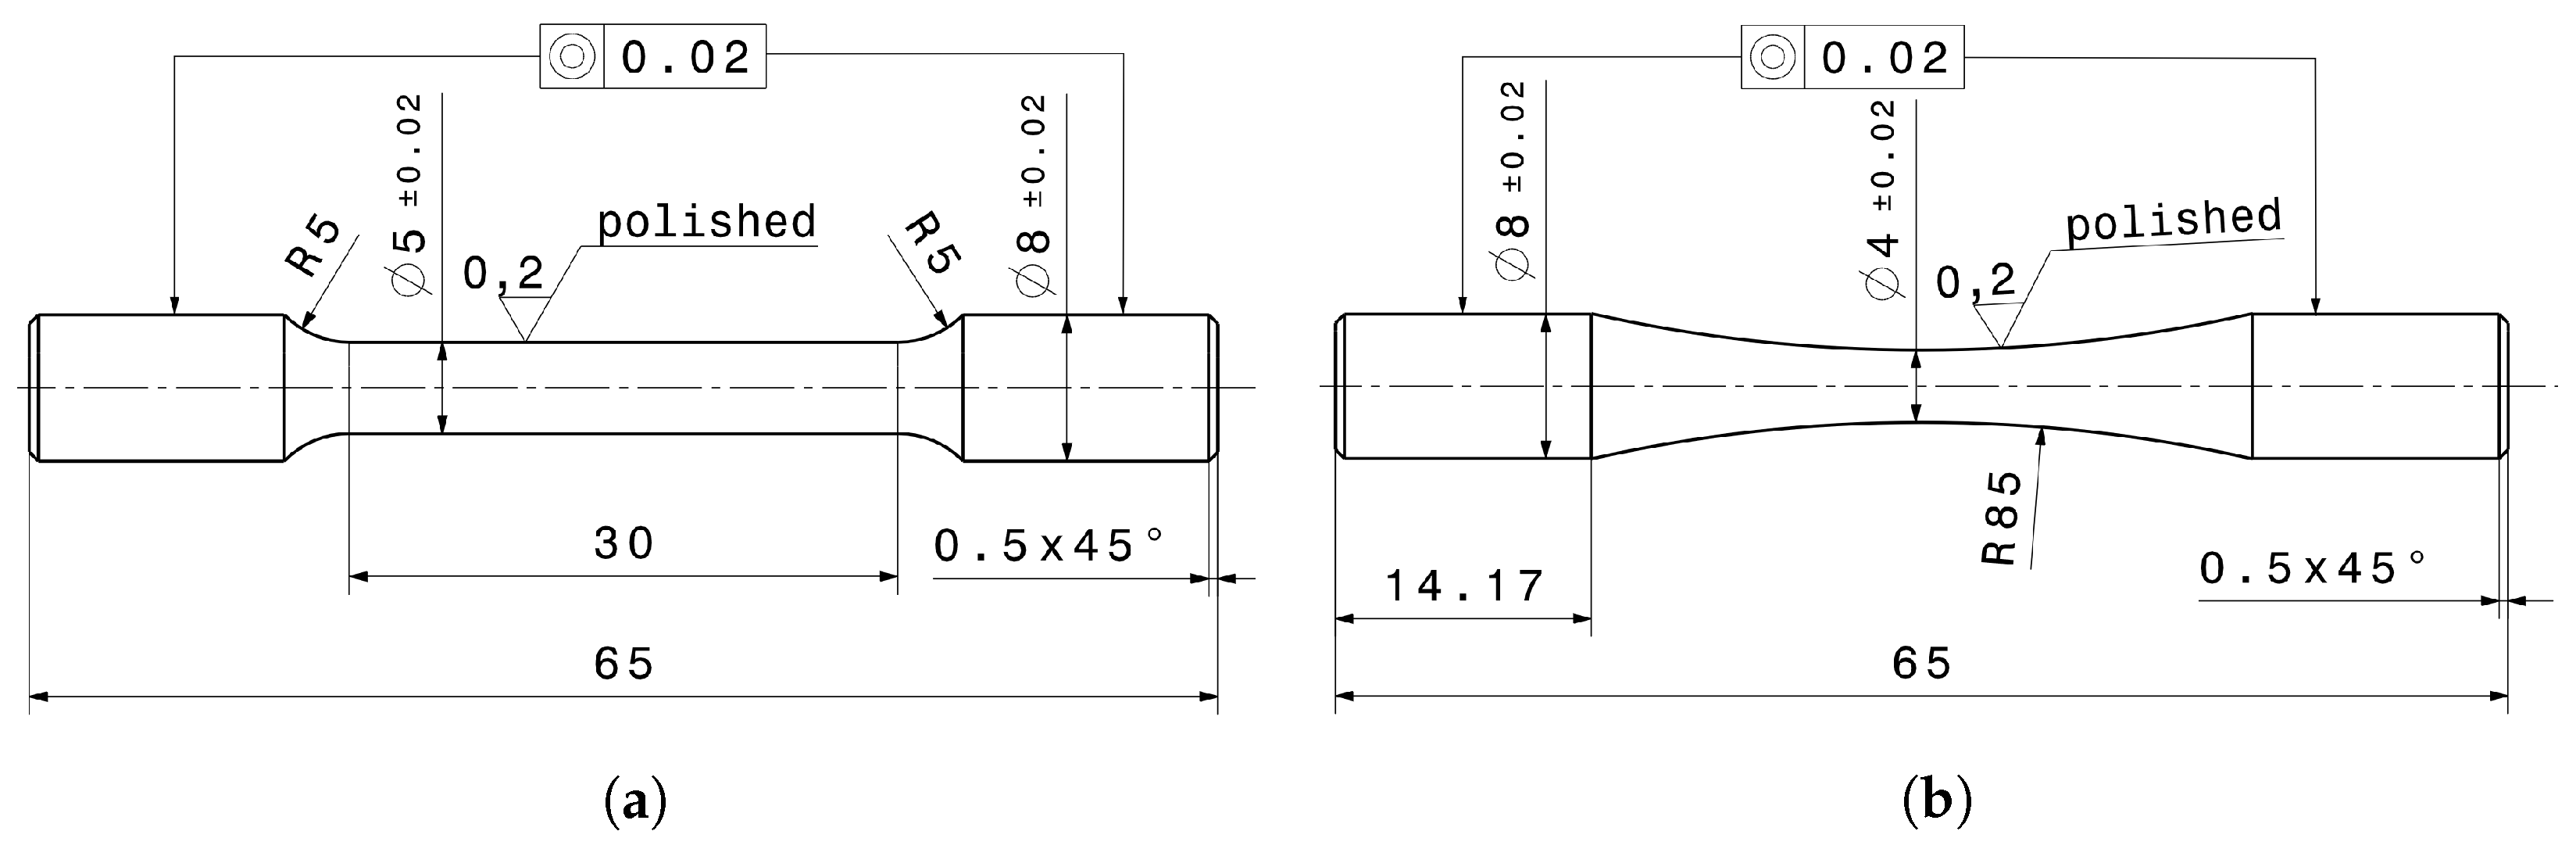
2.2. Assessment Methodology
3. Results
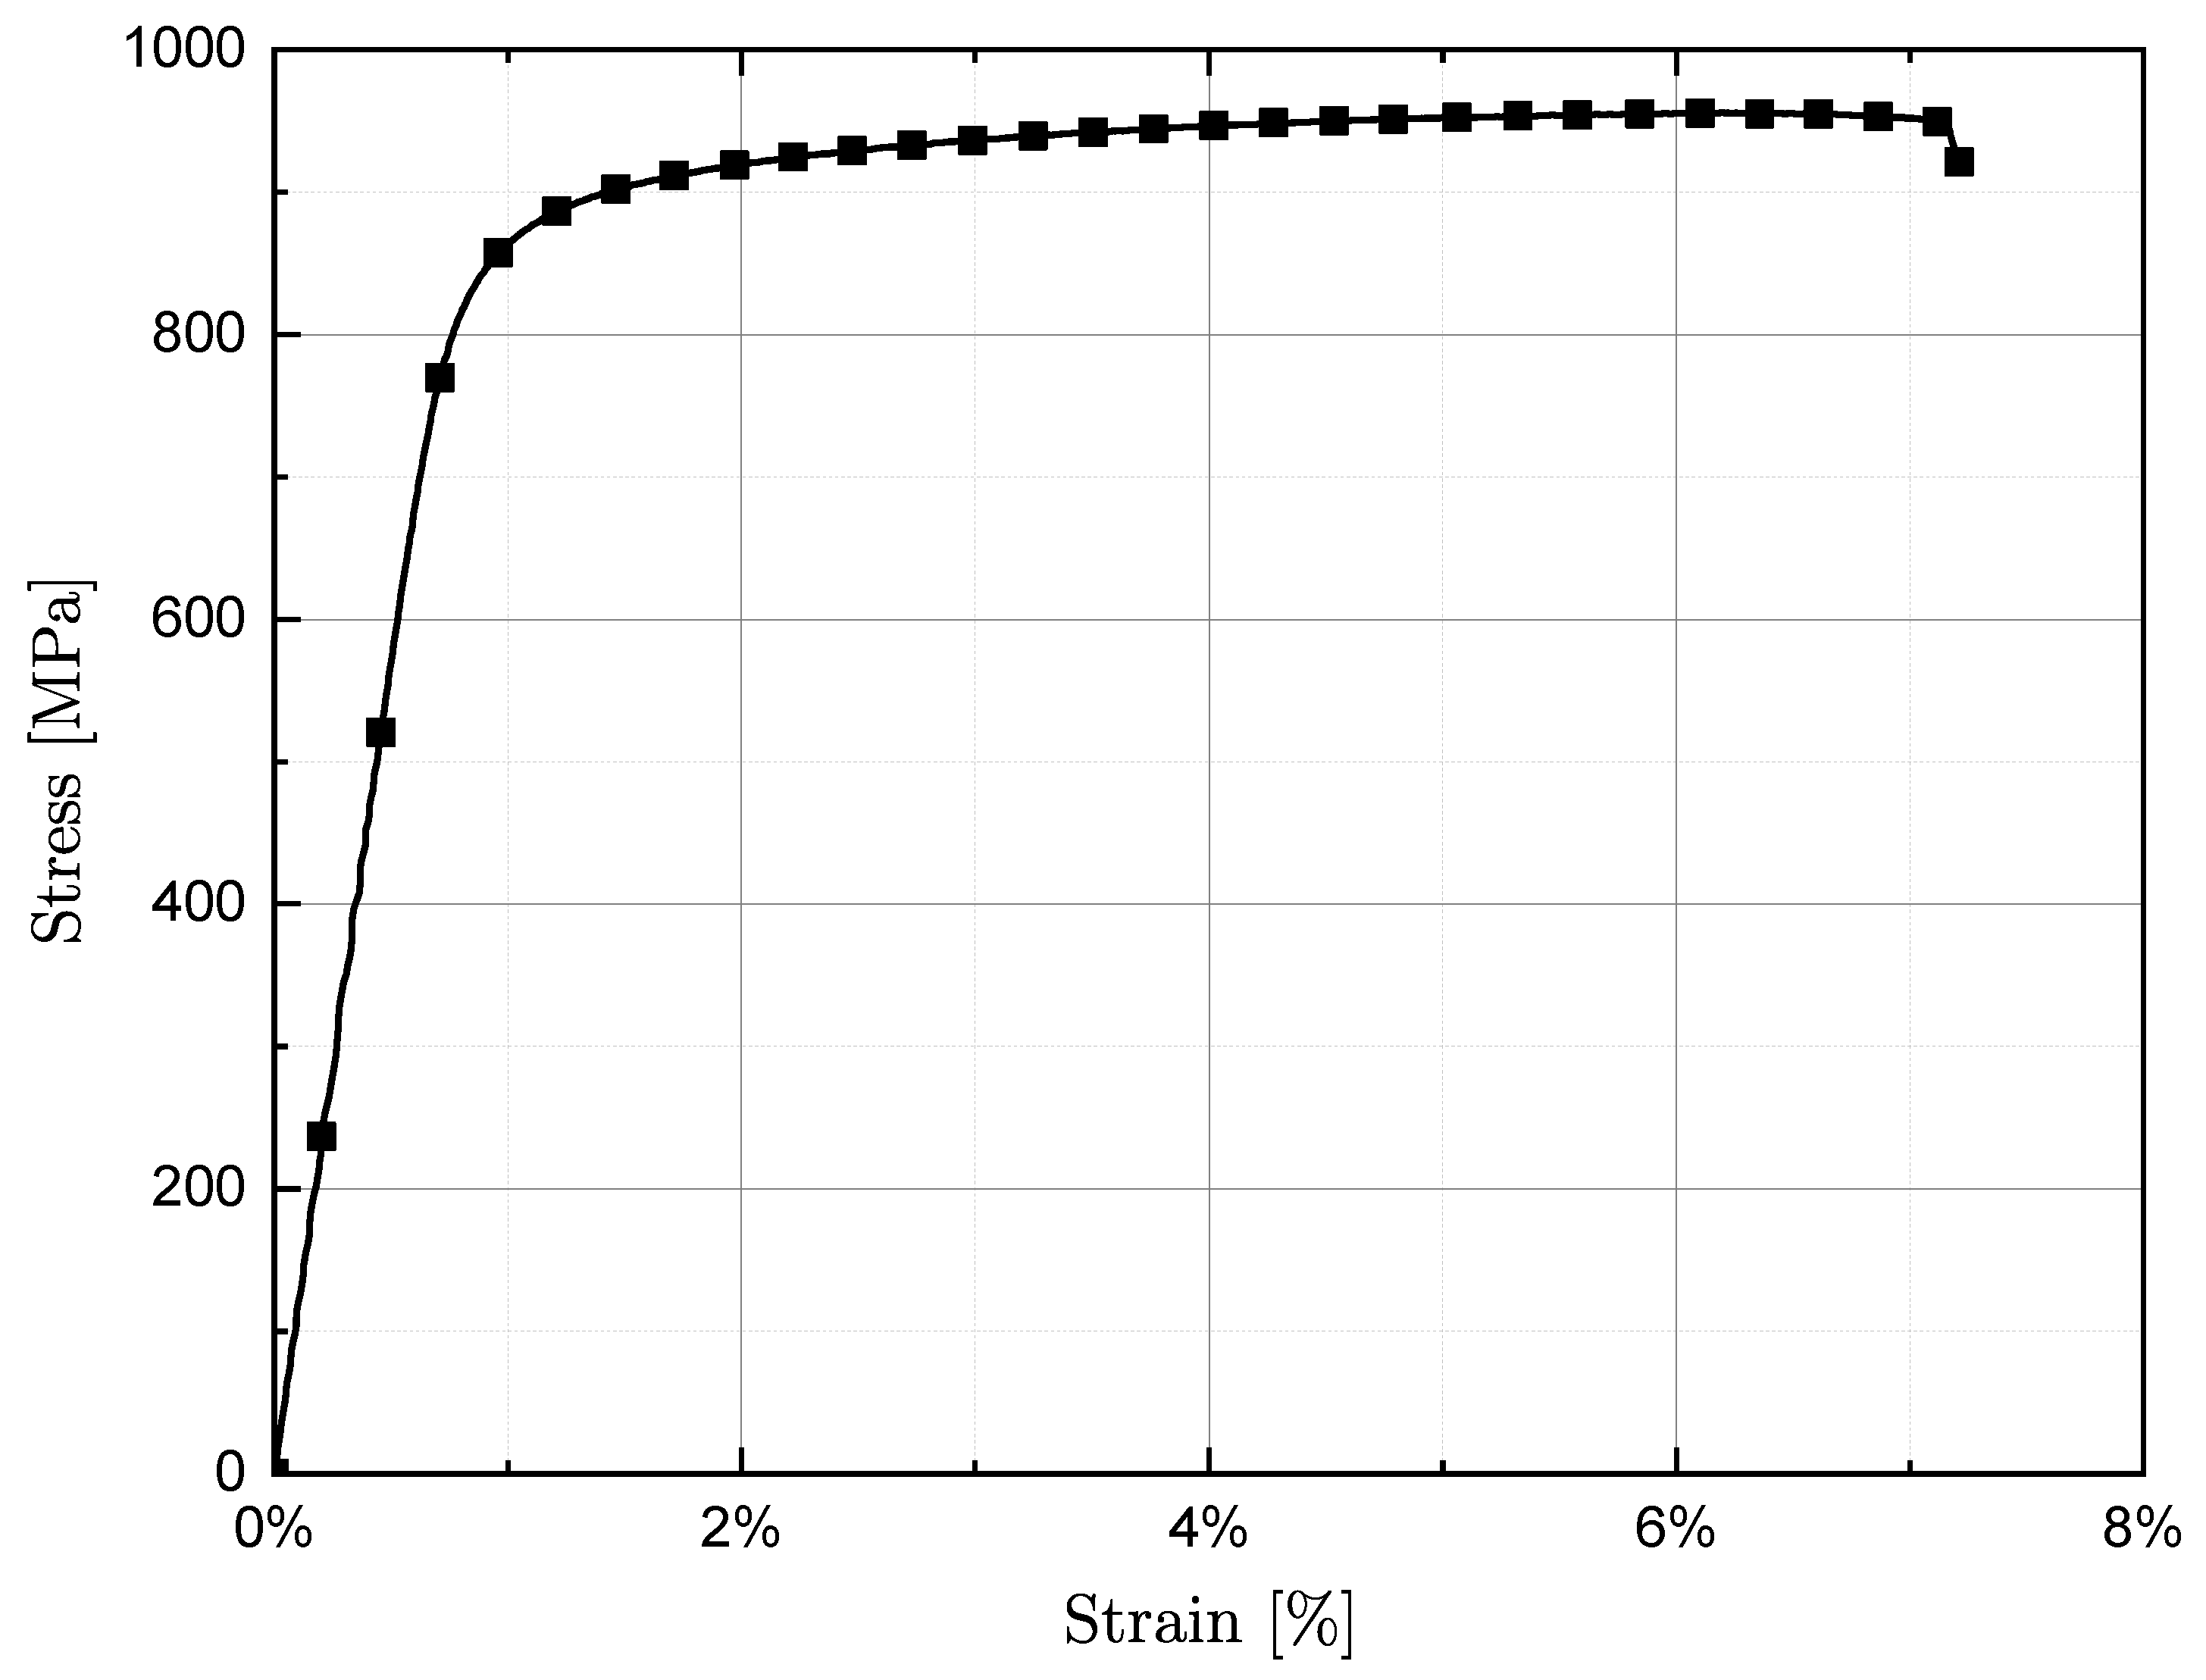
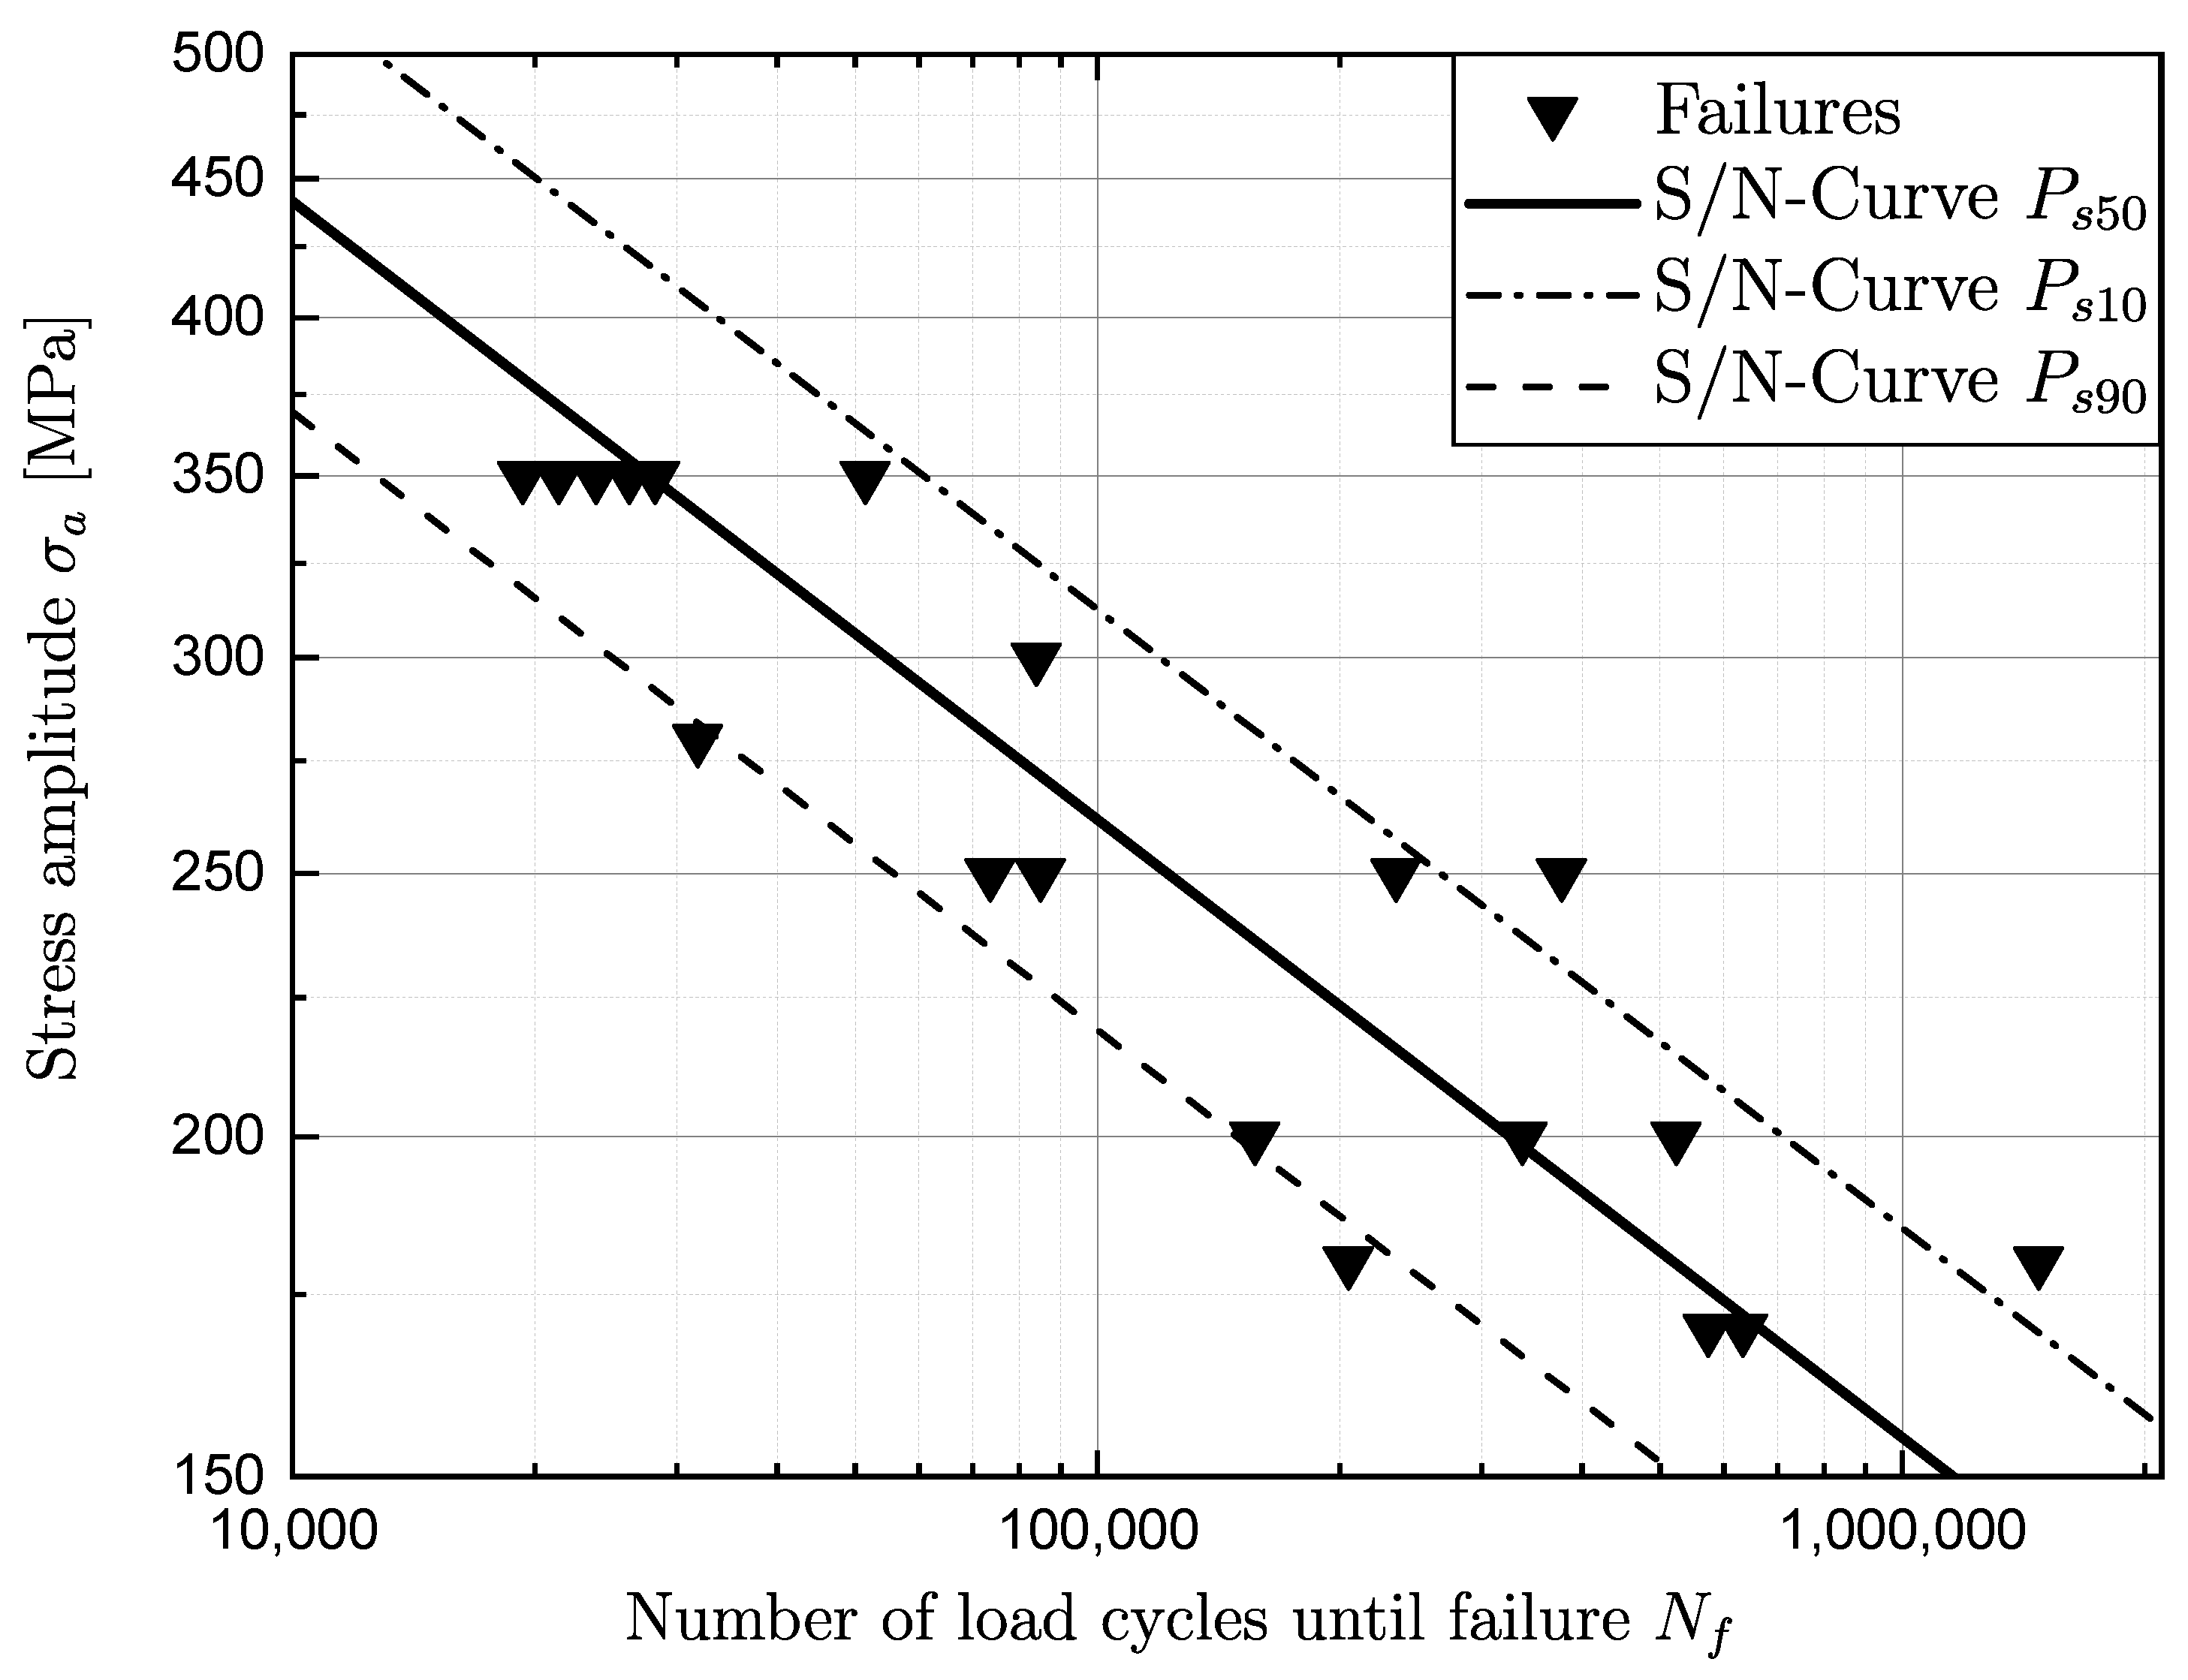
3.1. Quasi-Static and Fatigue Test Results
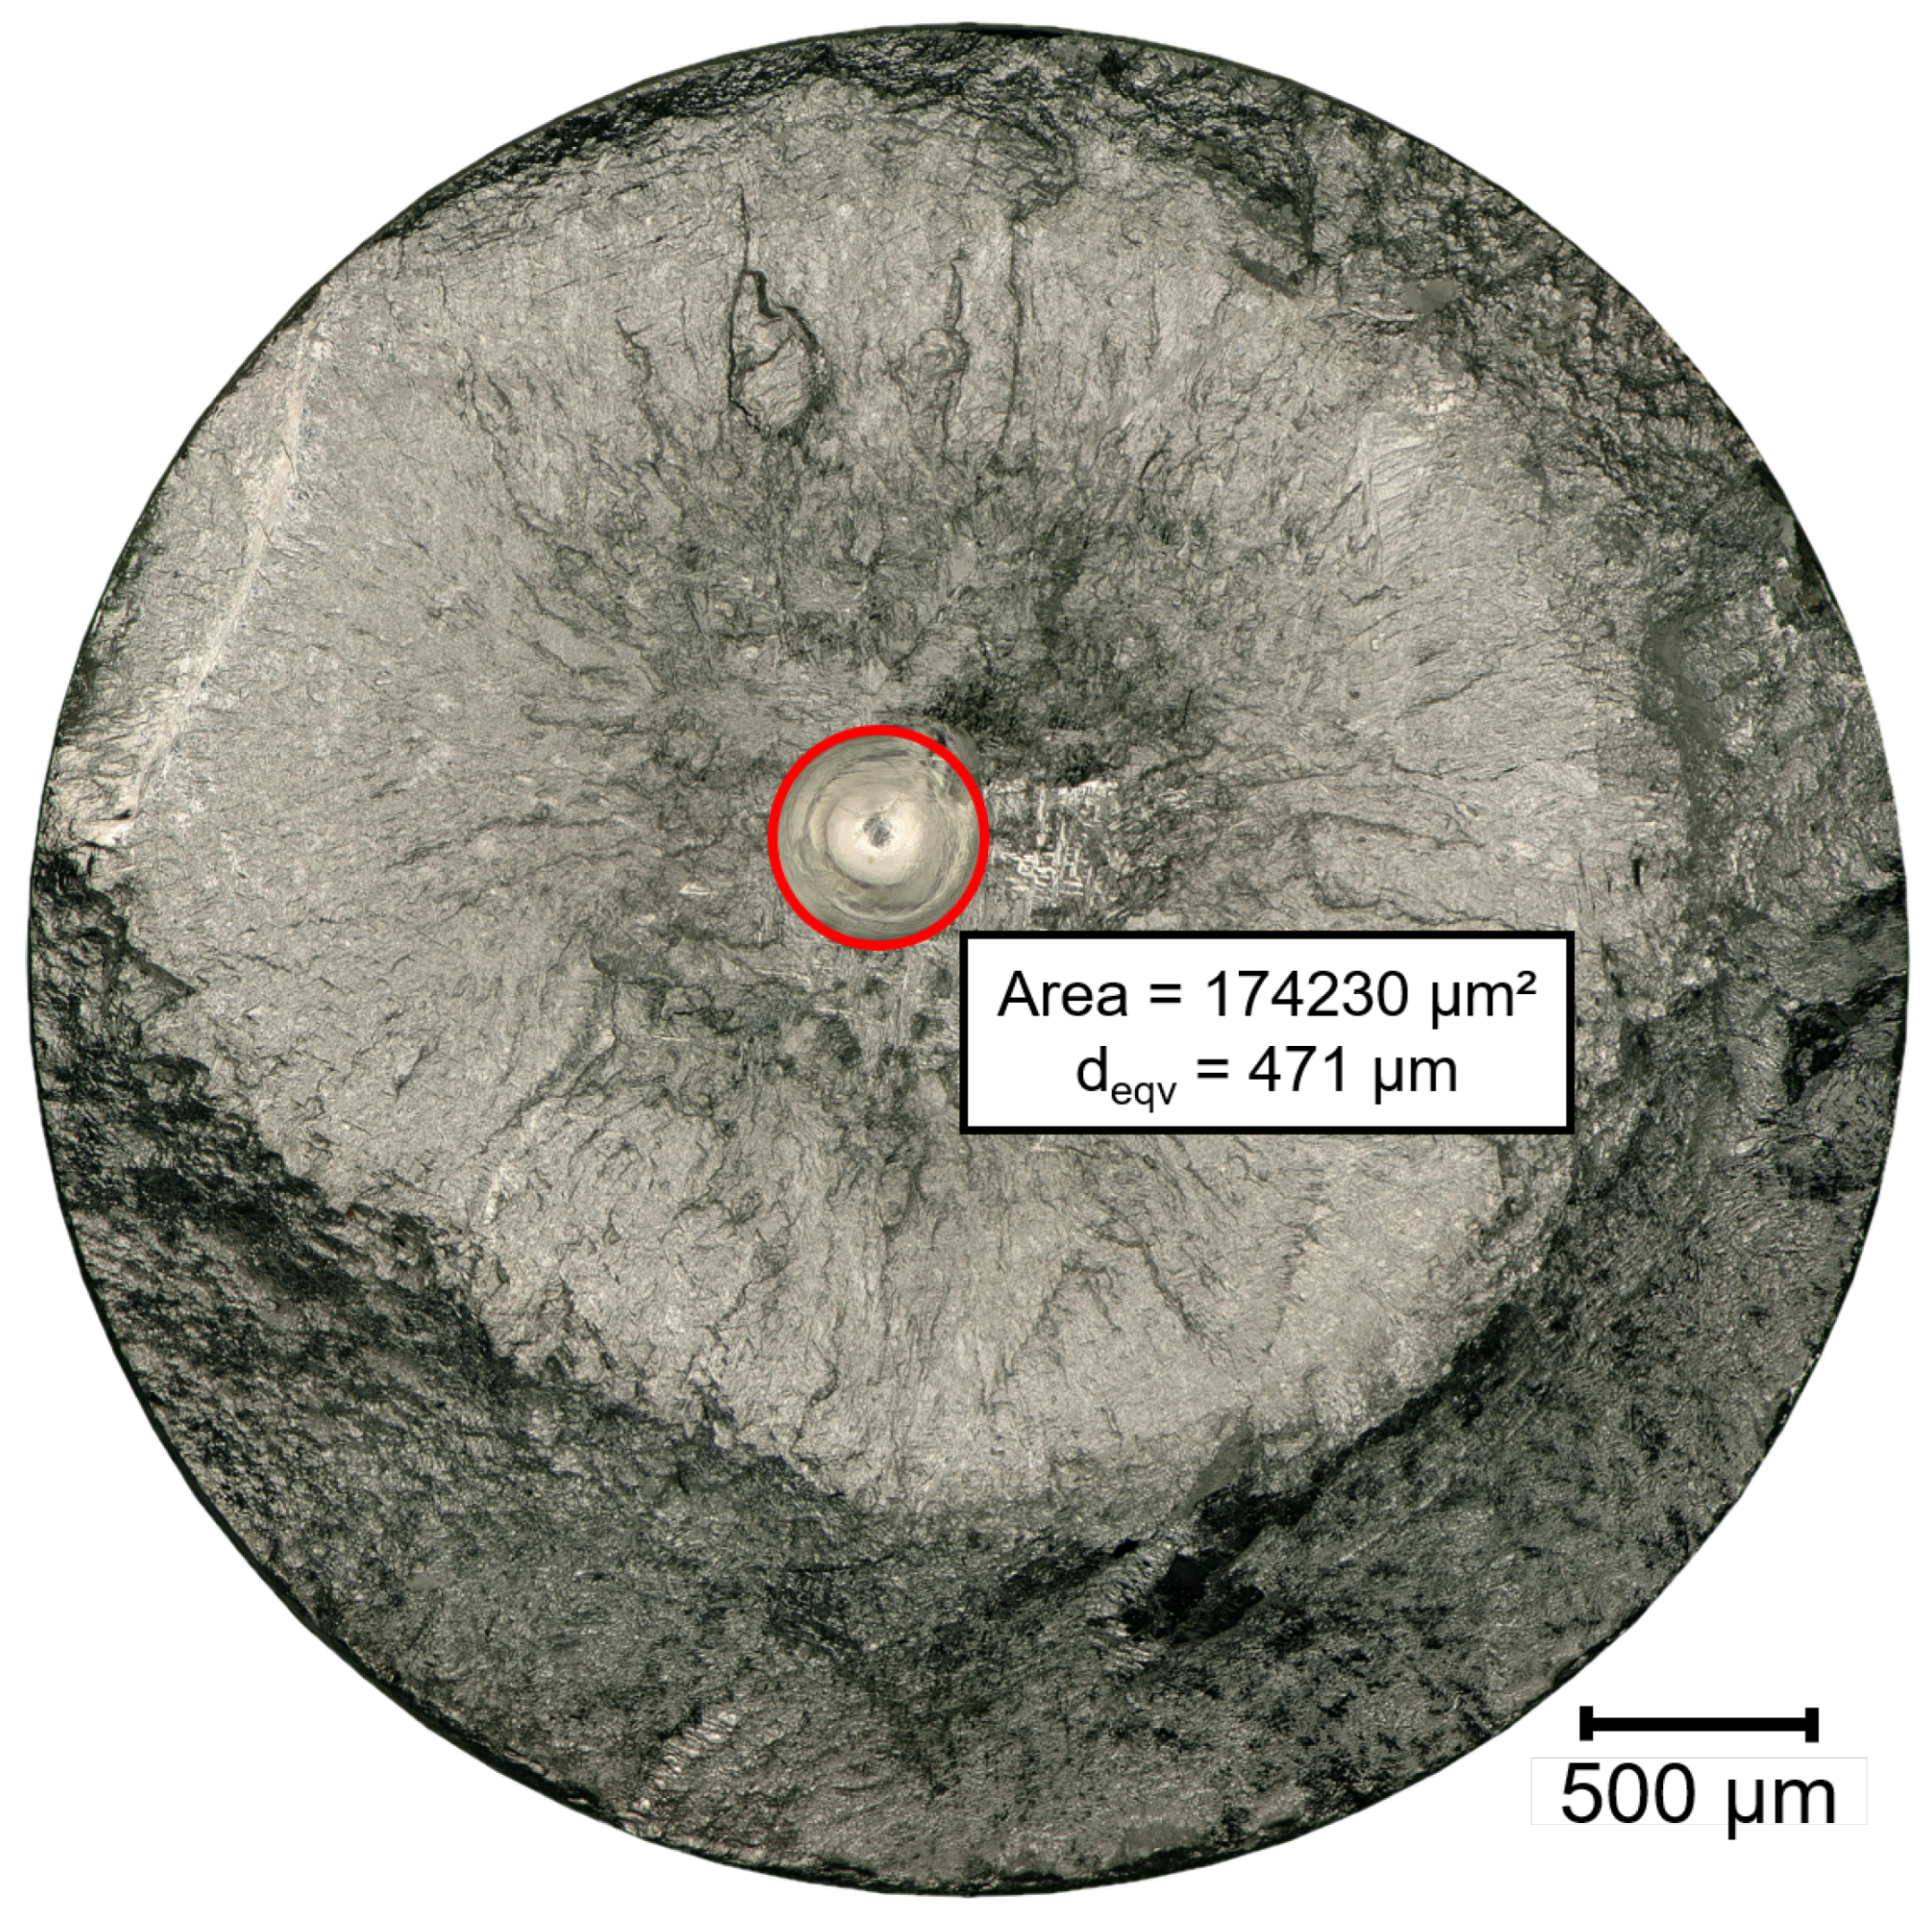
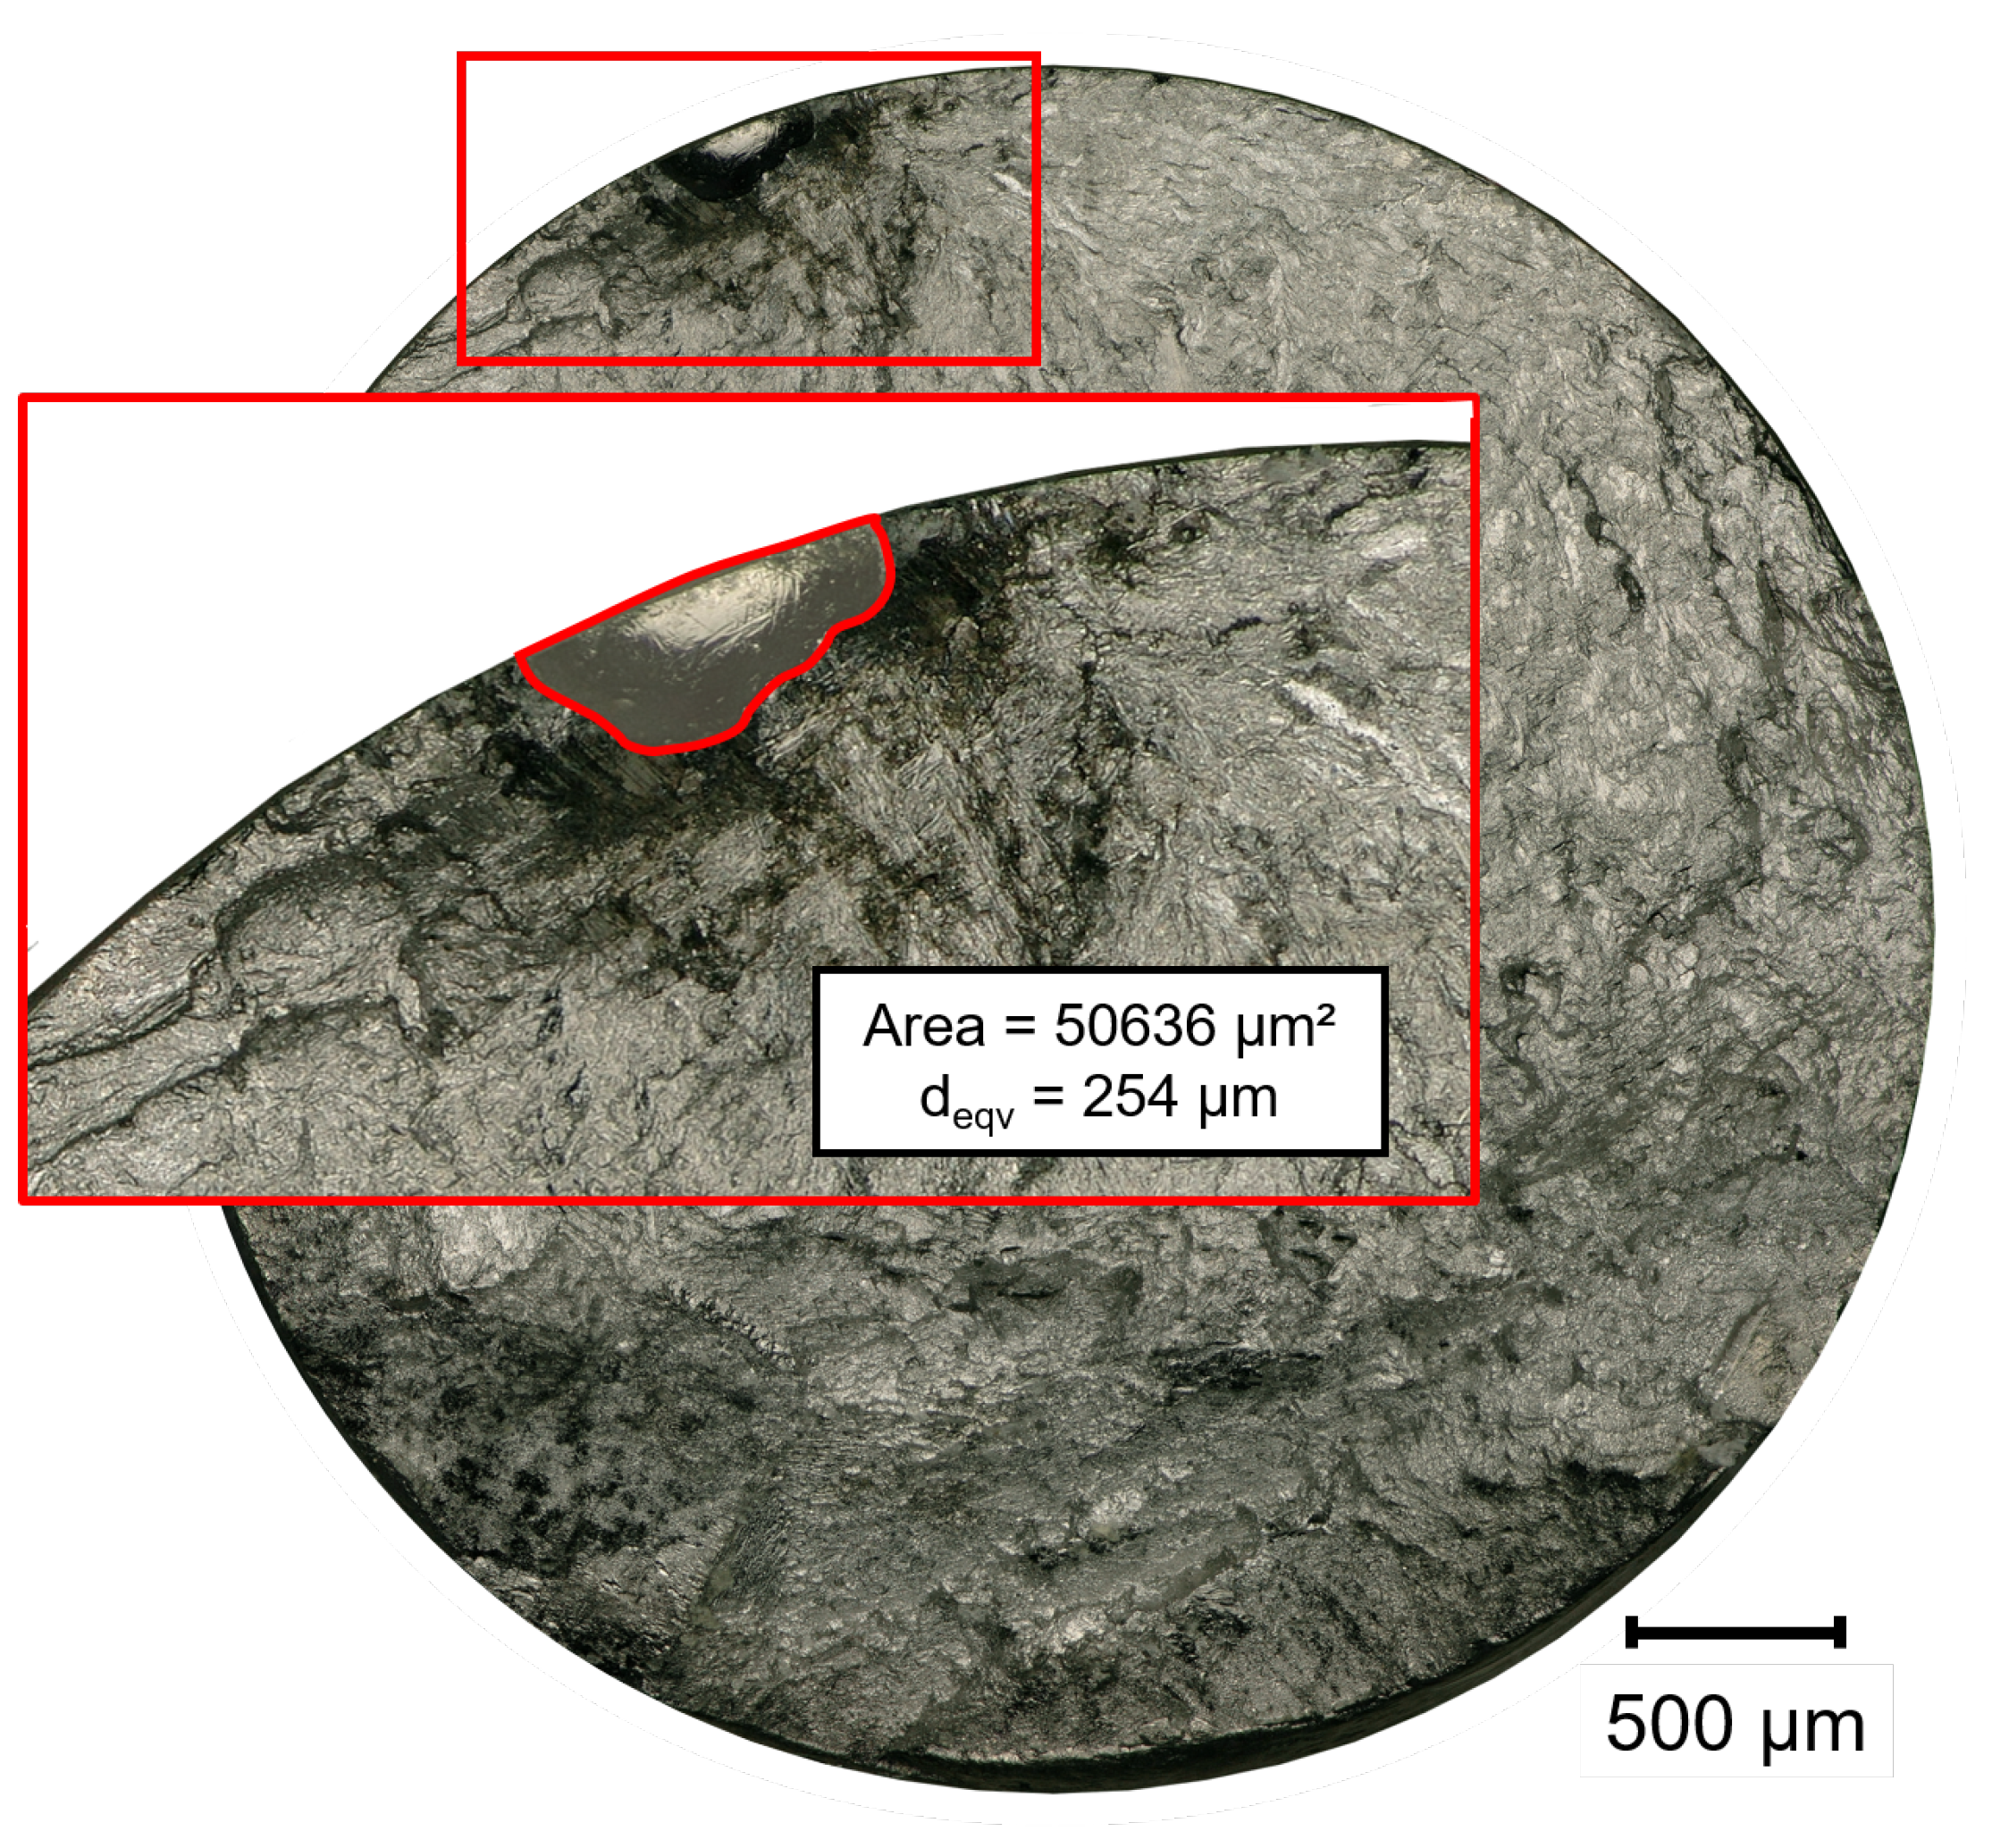
3.2. Fractography
3.3. Fatigue Assessment Methodology
4. Discussion
5. Conclusions
- Imperfections, in particular gas pores, significantly influence the fatigue strength of WAAM structures and should be taken into account within fatigue assessment methods.
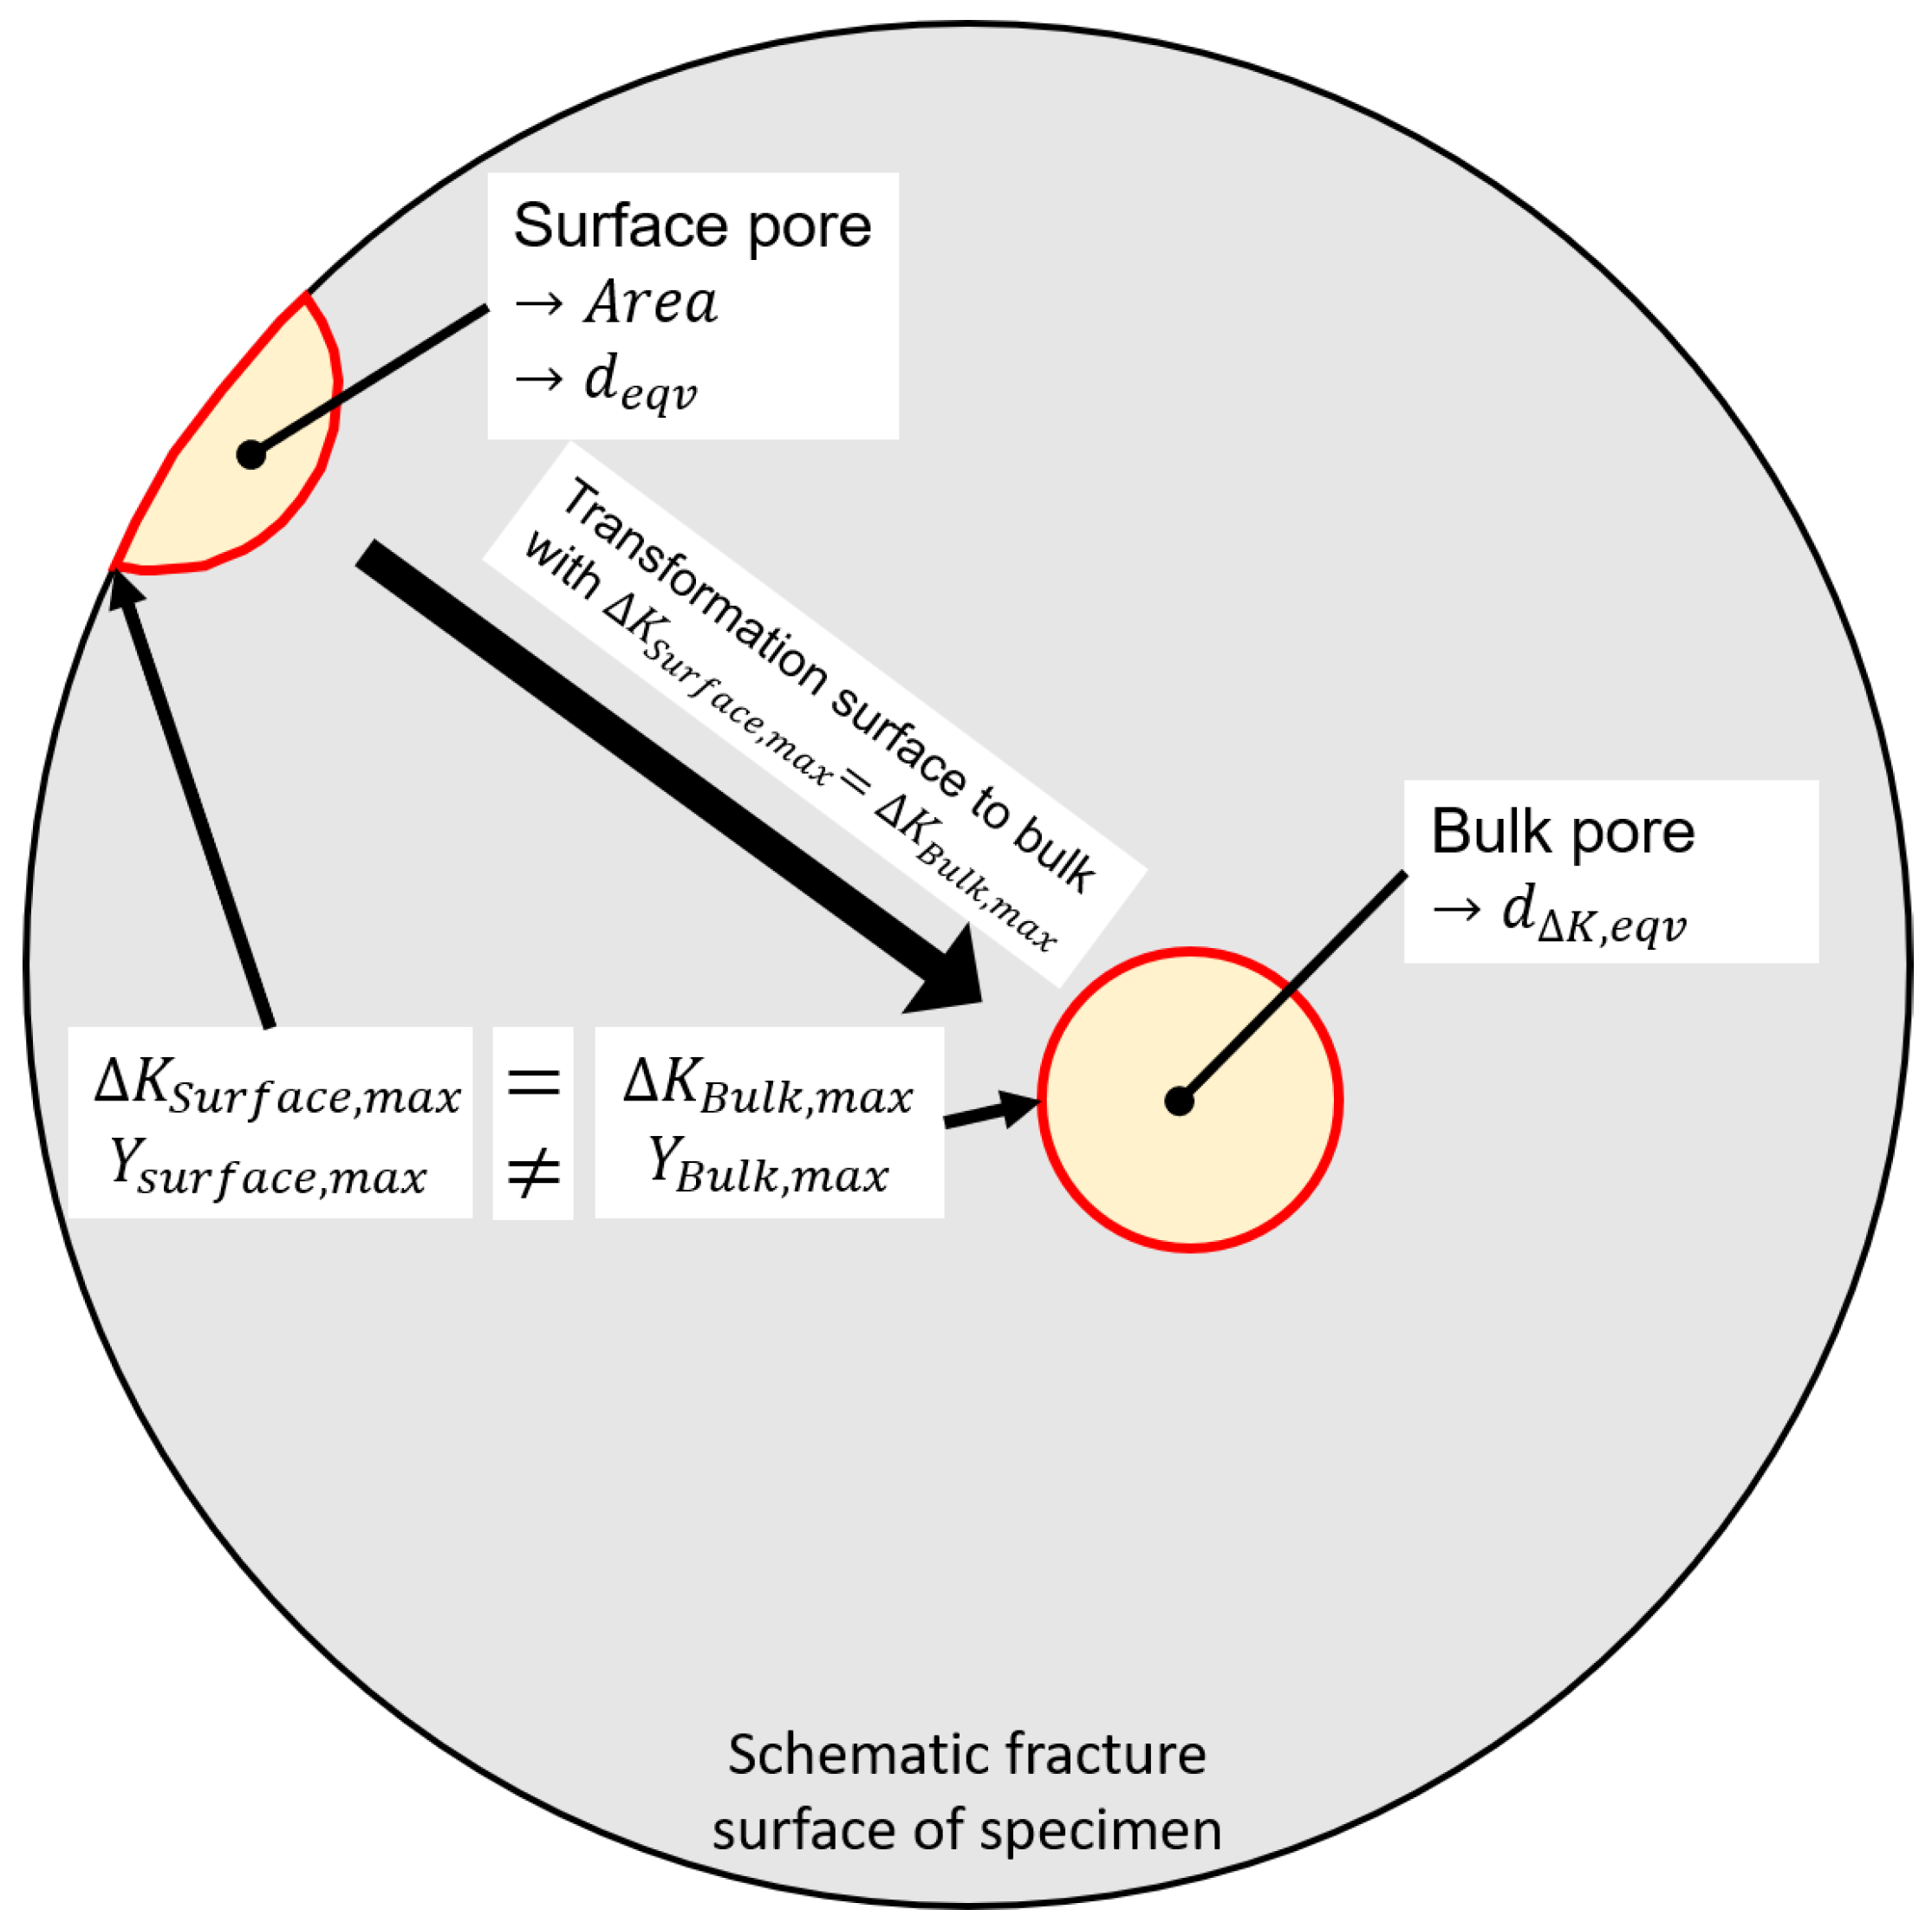
- A stress intensity equivalent transformation approach of surface pores to inner bulk material pores is presented and successfully validated.
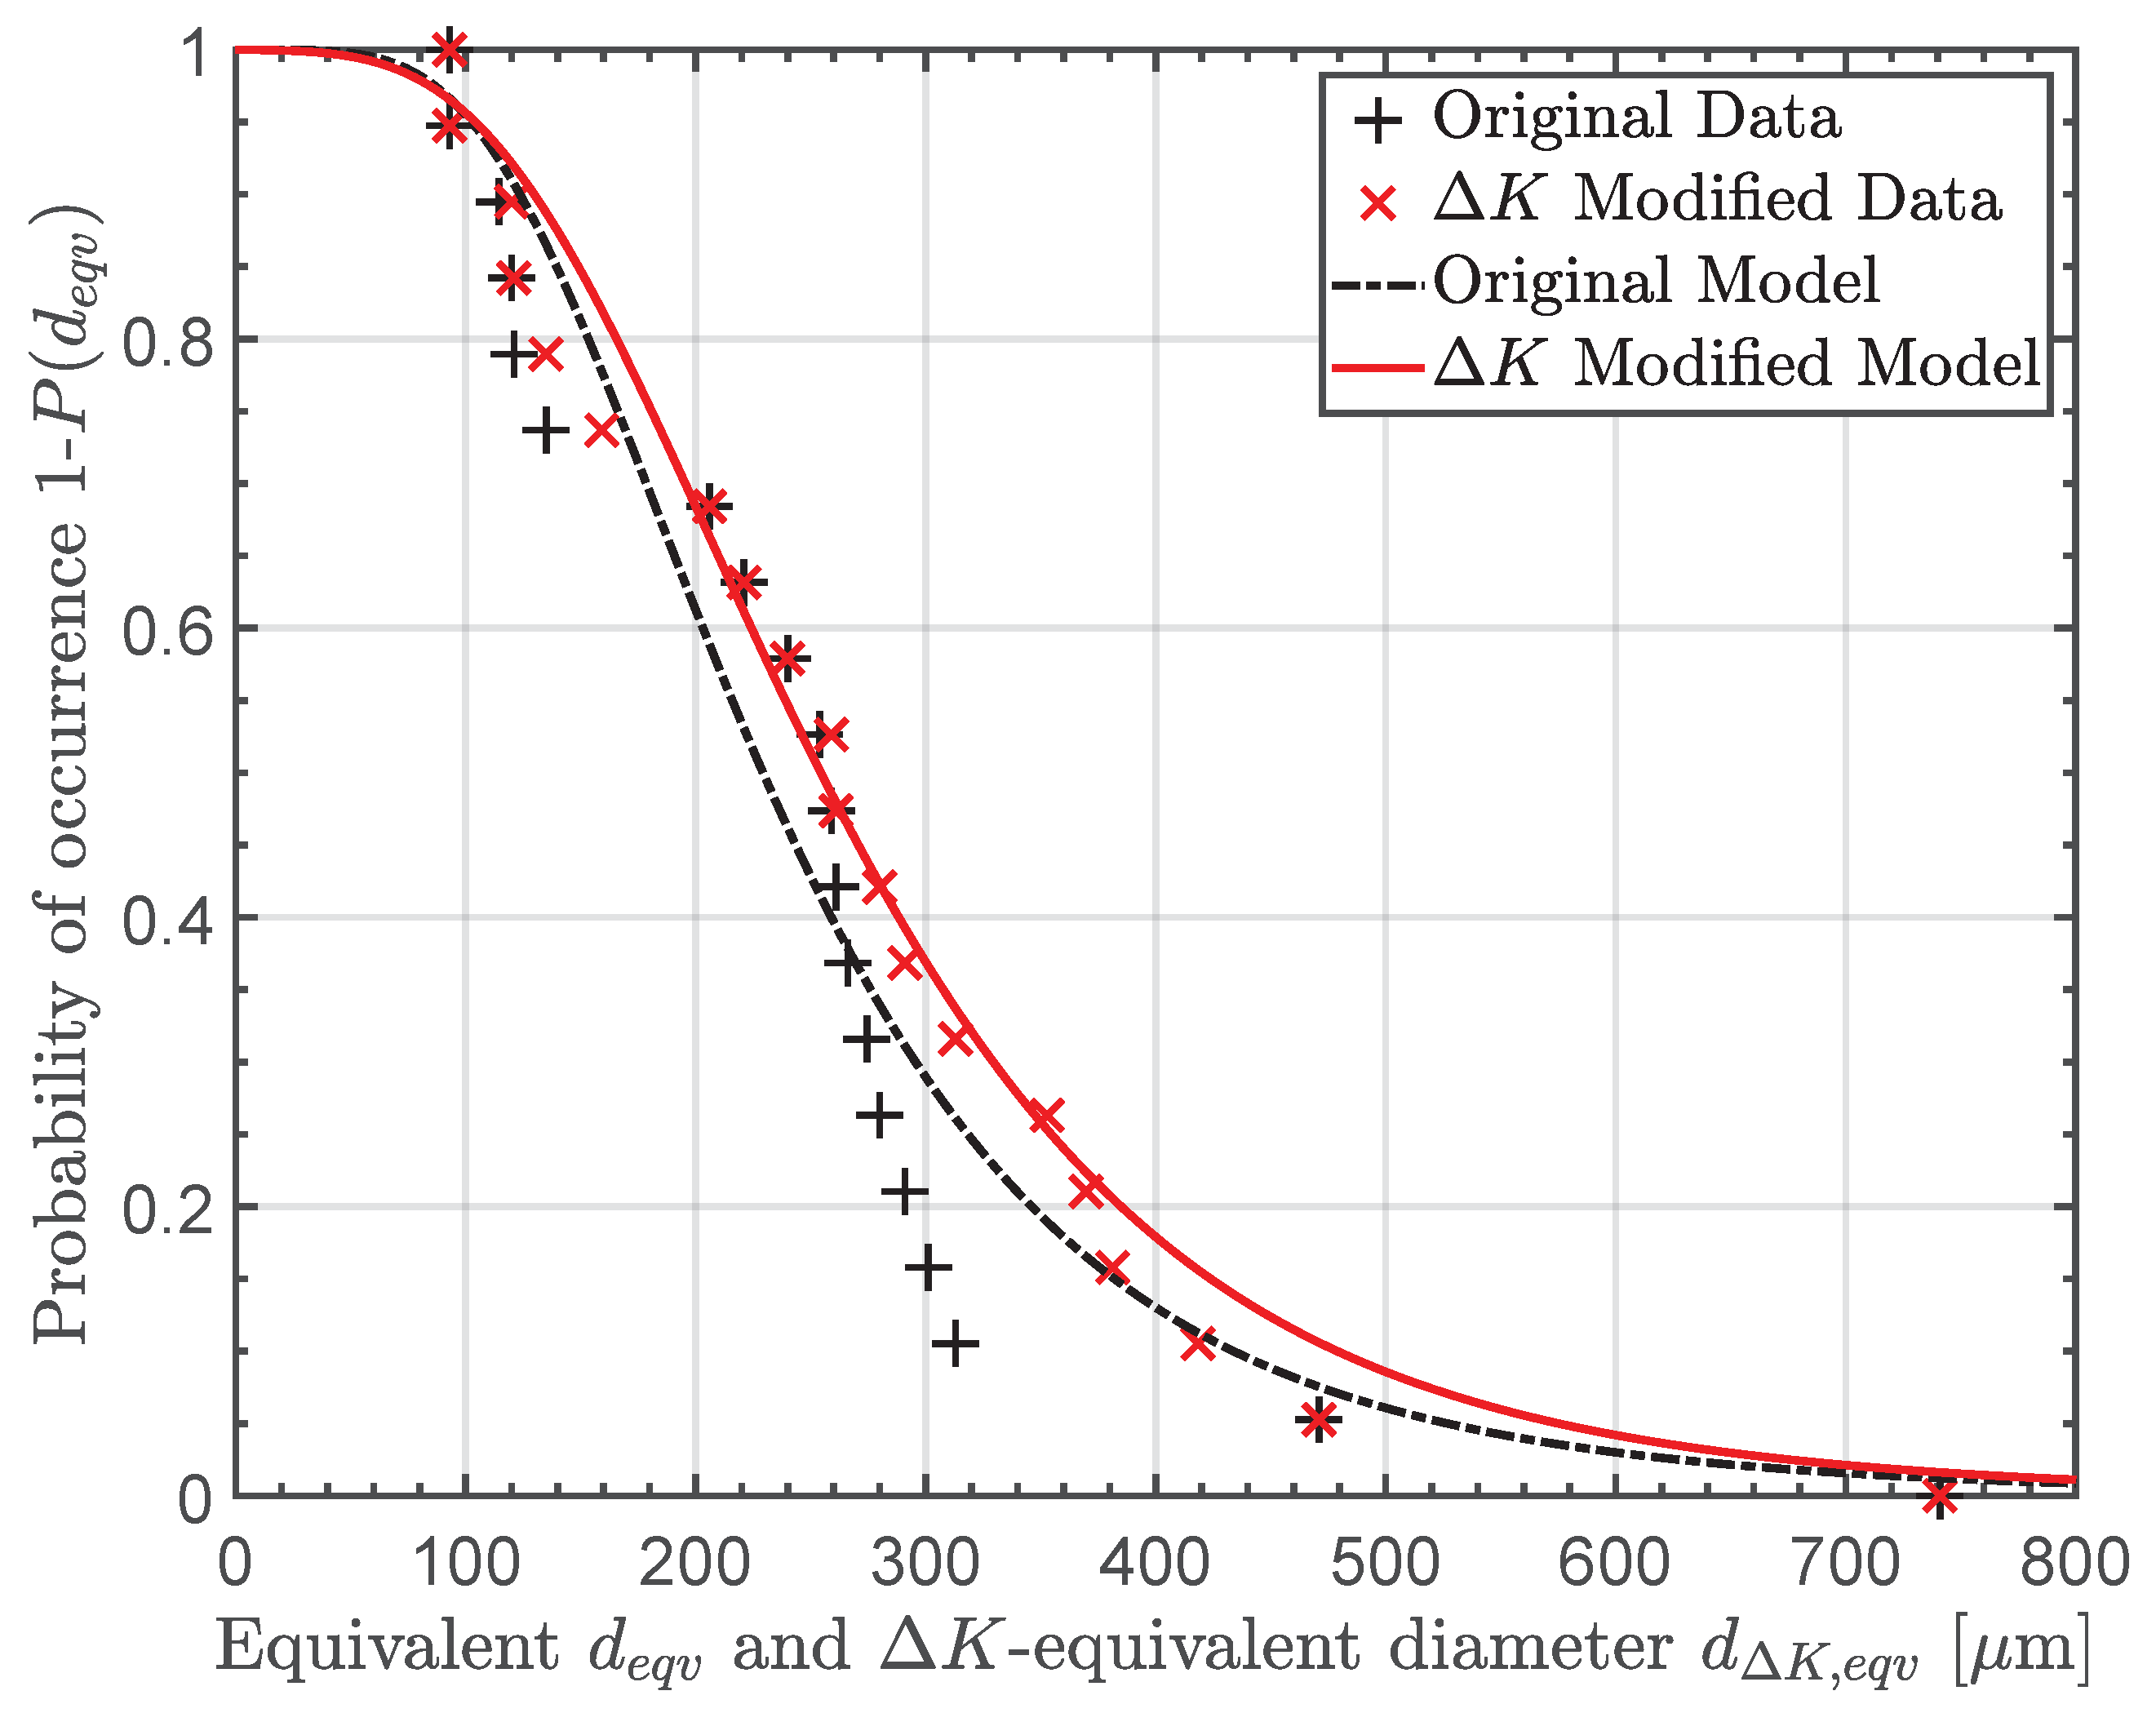
- A cumulative extreme value distribution by Gumbel fit extremal pore sizes. The fitted distribution reveals a sound agreement with the experimental defect size data with a goodness of fit test value of = 0.97, when the transformation of surface to inner pores is used. In contrast, the distribution fit with the unmodified defect sizes shows a lack of fit to the measured defects sizes with an goodness of fit test value of = 0.61. Thus, the transformation of surface to inner bulk pores leads to a significant improvement in the goodness of the distribution’s fit.
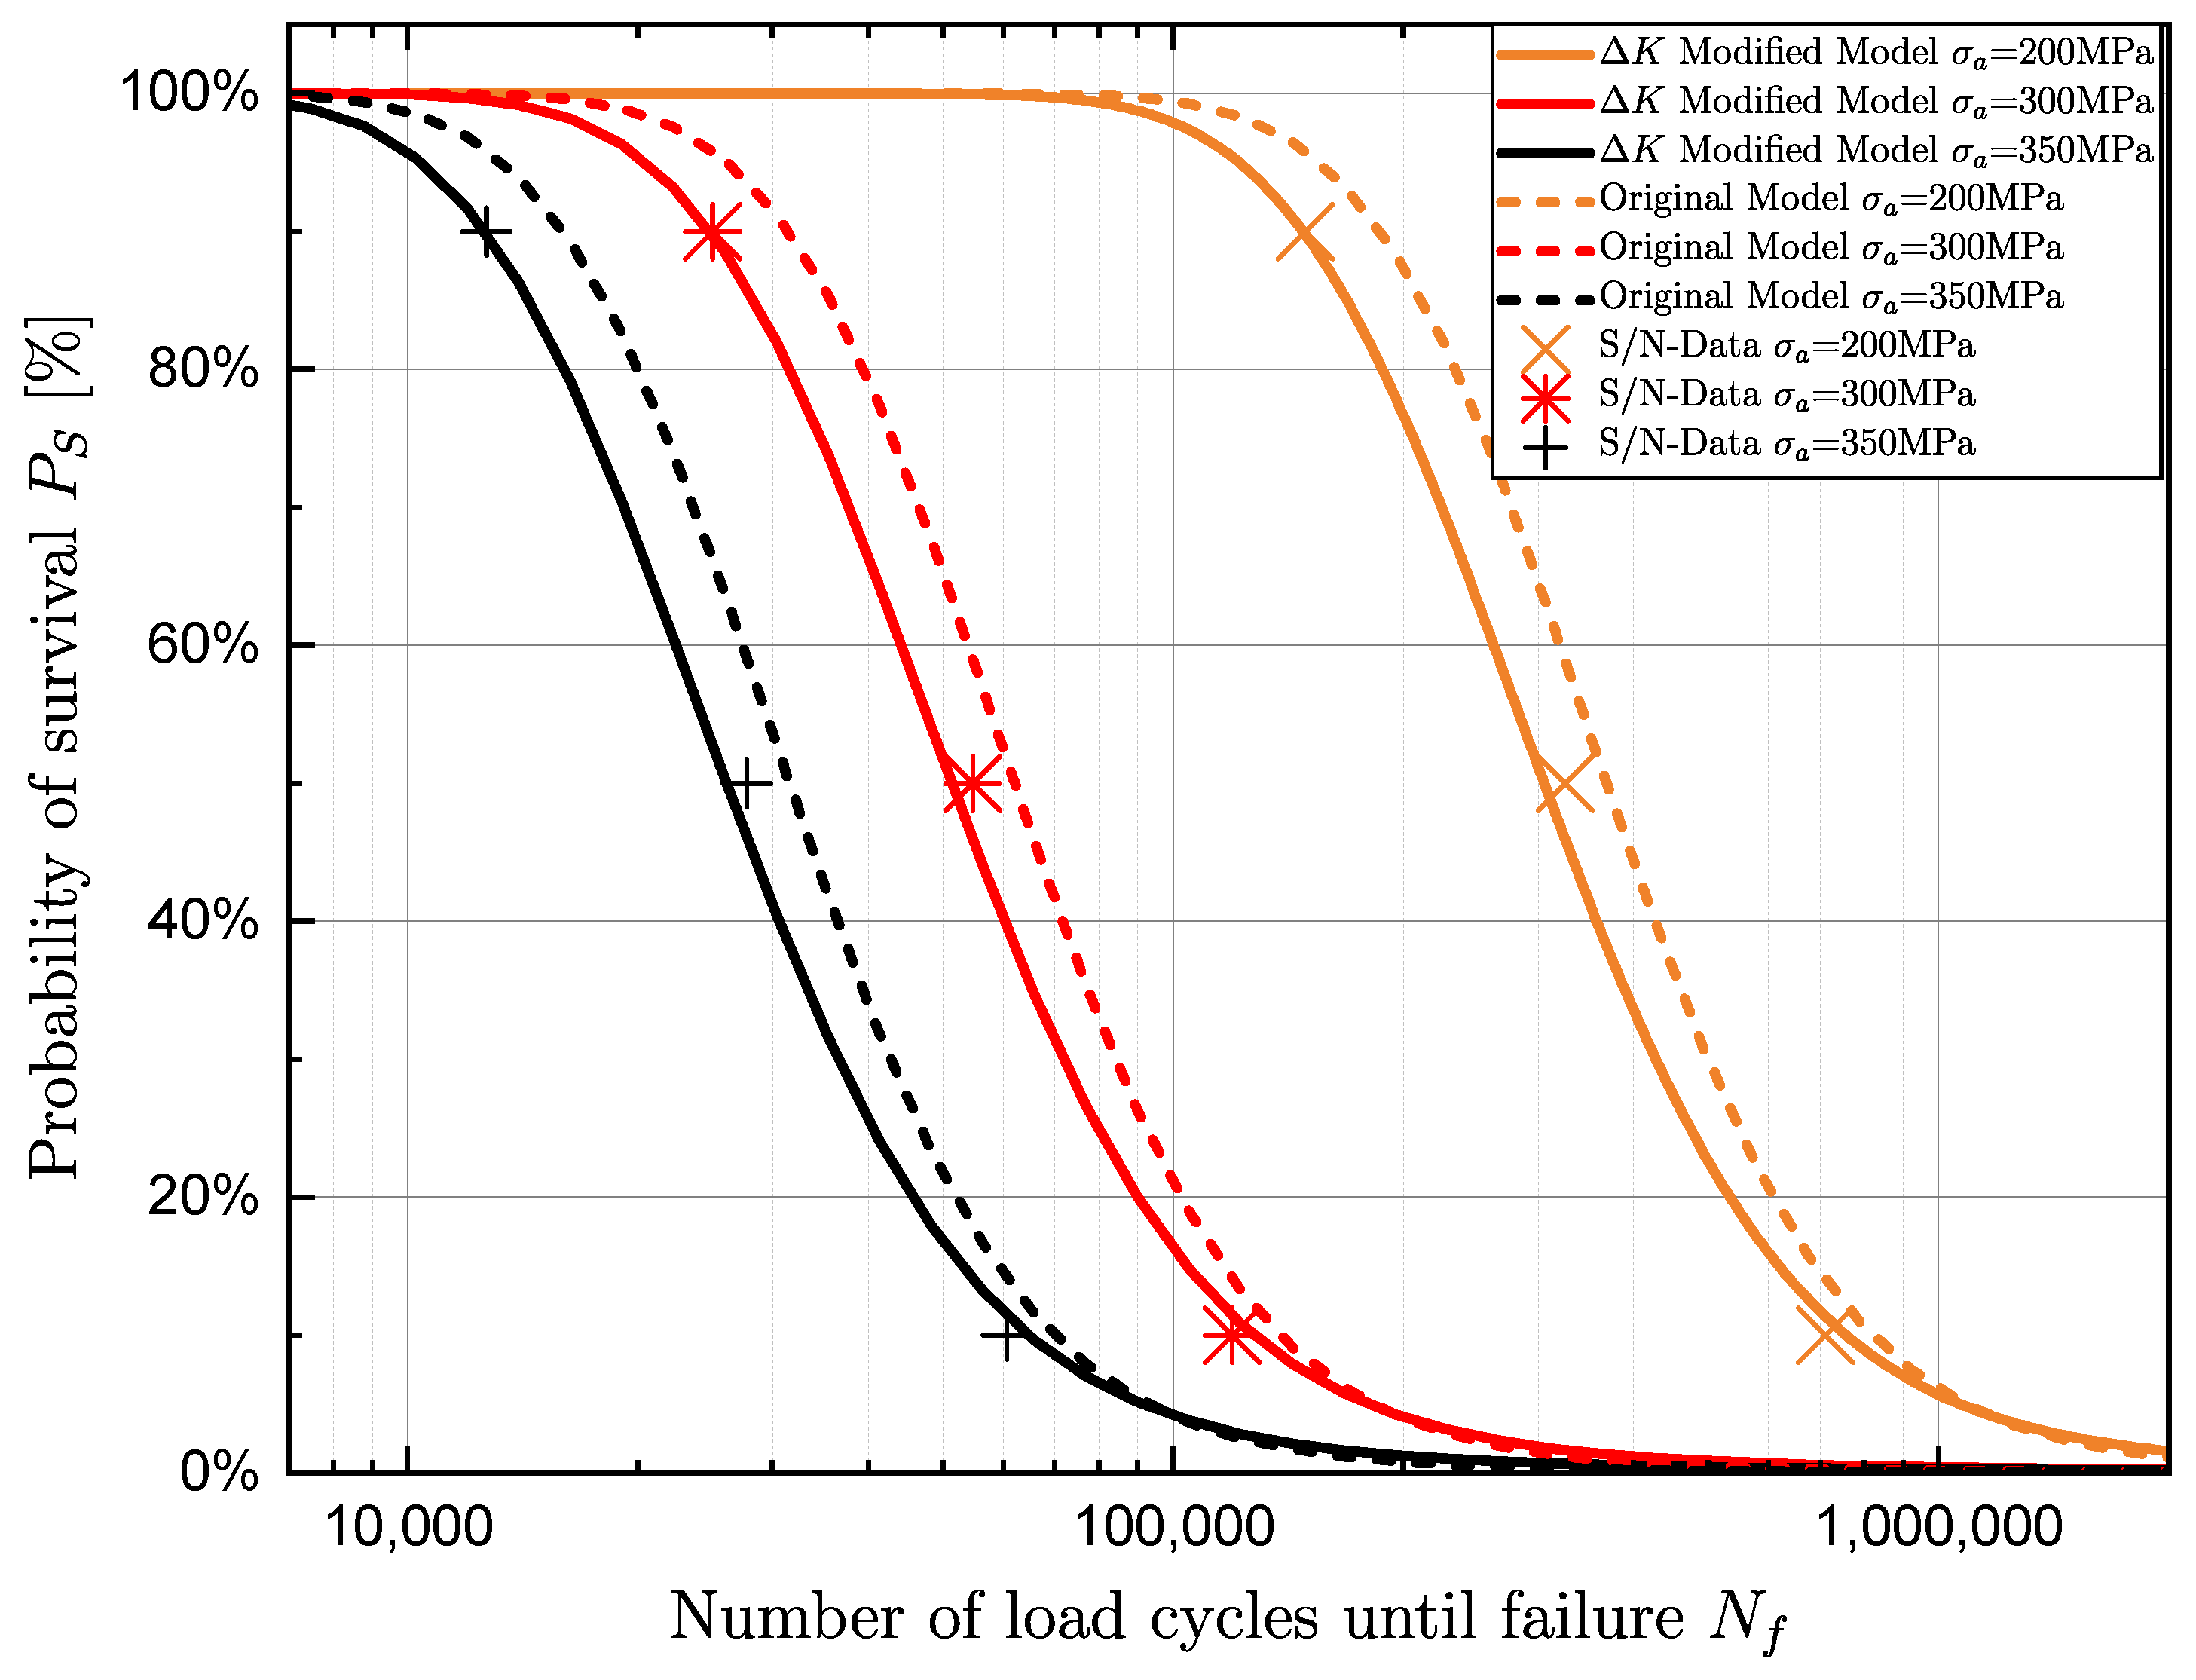
- The used fatigue assessment method according to Tiryakioğlu is well applicable for this defect containing, additive manufacturing system structures. By utilizing the transformation, the fatigue assessment reveals a sound agreement with an underestimation of up to −7% compared to the experiments. Fatigue assessed with the original data reveals an overestimation of up to 14%. Therefore, fatigue estimation can be significantly improved by considering the transformation of surface pores to inner bulk pores.
Author Contributions
Funding
Institutional Review Board Statement
Informed Consent Statement
Data Availability Statement
Acknowledgments
Conflicts of Interest
Abbreviations
| Projected defect area of pore; | |
| Goodness of fit test value of the Anderson-Darling test; | |
| a | Crack length; |
| B | Offset parameter; |
| Stress intensity equivalent diameter of defect; | |
| Equivalent diameter of defect; | |
| Scale parameter of the Gumbel distribution; | |
| Stress intensity factor; | |
| Equivalent stress intensity factor; | |
| Stress intensity factor of surface pore; | |
| Stress intensity factor of bulk pore; | |
| k | Slope of S-N curve in finite life region; |
| Location parameter of the Gumbel distribution; | |
| m | Slope of crack propagation in stable crack growth region; |
| Number of load cycles until failure; | |
| P | Probability; |
| Probability of occurrence; | |
| Probability of survival; | |
| Probability of failure; | |
| Goodness of fit test value of the Kolmogorov–Smirnov test; | |
| R | Load ratio; |
| Stress amplitude; | |
| Scatter band of load cycles of the S/N-curve; | |
| Scatter band of stress amplitude of the S/N-curve; | |
| Y | Geometry factor; |
| Geometry factor of surface pore; | |
| Geometry factor of bulk pore; | |
| A | Elongation at fracture; |
| UTS | Ultimate tensile strength; |
| WAAM | Wire arc additive manufacturing; |
| YS | Yield strength. |
References
- Baufeld, B.; van der Biest, O.; Gault, R. Additive manufacturing of Ti–6Al–4V components by shaped metal deposition: Microstructure and mechanical properties. Mater. Des. 2010, 31, S106–S111. [Google Scholar] [CrossRef]
- Herzog, D.; Seyda, V.; Wycisk, E.; Emmelmann, C. Additive manufacturing of metals. Acta Mater. 2016, 117, 371–392. [Google Scholar] [CrossRef]
- Prakash, K.S.; Nancharaih, T.; Rao, V.S. Additive Manufacturing Techniques in Manufacturing—An Overview. Mater. Today Proc. 2018, 5, 3873–3882. [Google Scholar] [CrossRef]
- Kruth, J.P.; Leu, M.C.; Nakagawa, T. Progress in Additive Manufacturing and Rapid Prototyping. CIRP Ann. 1998, 47, 525–540. [Google Scholar] [CrossRef]
- Singh, S.R.; Khanna, P. Wire arc additive manufacturing (WAAM): A new process to shape engineering materials. Mater. Today Proc. 2020, 67, 1191. [Google Scholar] [CrossRef]
- Rodrigues, T.A.; Duarte, V.; Miranda, R.M.; Santos, T.G.; Oliveira, J.P. Current Status and Perspectives on Wire and Arc Additive Manufacturing (WAAM). Materials 2019, 12, 1121. [Google Scholar] [CrossRef] [PubMed] [Green Version]
- Frazier, W.E. Metal Additive Manufacturing: A Review. J. Mater. Eng. Perform. 2014, 23, 1917–1928. [Google Scholar] [CrossRef]
- Liu, S.; Shin, Y.C. Additive manufacturing of Ti6Al4V alloy: A review. Mater. Des. 2019, 164, 107552. [Google Scholar] [CrossRef]
- Martina, F.; Mehnen, J.; Williams, S.W.; Colegrove, P.; Wang, F. Investigation of the benefits of plasma deposition for the additive layer manufacture of Ti–6Al–4V. J. Mater. Process. Technol. 2012, 212, 1377–1386. [Google Scholar] [CrossRef] [Green Version]
- Springer, S.; Röcklinger, A.; Leitner, M.; Florian, G.; Gruber, T.; Lasnik, M.; Oberwinkler, B. Implementation of a viscoplastic creep model in the thermomechanical simulation of the WAAM process. Weld. World 2021, 66, 441–453. [Google Scholar] [CrossRef]
- de Jesus, J.; Martins Ferreira, J.A.; Borrego, L.; Costa, J.D.; Capela, C. Fatigue Failure from Inner Surfaces of Additive Manufactured Ti-6Al-4V Components. Materials 2021, 14, 737. [Google Scholar] [CrossRef] [PubMed]
- Sandell, V.; Hansson, T.; Roychowdhury, S.; Månsson, T.; Delin, M.; Åkerfeldt, P.; Antti, M.L. Defects in Electron Beam Melted Ti-6Al-4V: Fatigue Life Prediction Using Experimental Data and Extreme Value Statistics. Materials 2021, 14, 640. [Google Scholar] [CrossRef] [PubMed]
- Greitemeier, D.; Palm, F.; Syassen, F.; Melz, T. Fatigue performance of additive manufactured TiAl6V4 using electron and laser beam melting. Int. J. Fatigue 2017, 94, 211–217. [Google Scholar] [CrossRef]
- Akgun, E.; Zhang, X.; Biswal, R.; Zhang, Y.; Doré, M. Fatigue of wire+arc additive manufactured Ti-6Al-4V in presence of process-induced porosity defects. Int. J. Fatigue 2021, 150, 106315. [Google Scholar] [CrossRef]
- Beretta, S.; Romano, S. A comparison of fatigue strength sensitivity to defects for materials manufactured by AM or traditional processes. Int. J. Fatigue 2017, 94, 178–191. [Google Scholar] [CrossRef]
- Beretta, S.; Gargourimotlagh, M.; Foletti, S.; Du Plessis, A.; Riccio, M. Fatigue strength assessment of “as built” AlSi10Mg manufactured by SLM with different build orientations. Int. J. Fatigue 2020, 139, 105737. [Google Scholar] [CrossRef]
- Romano, S.; Brandão, A.; Gumpinger, J.; Gschweitl, M.; Beretta, S. Qualification of AM parts: Extreme value statistics applied to tomographic measurements. Mater. Des. 2017, 131, 32–48. [Google Scholar] [CrossRef] [Green Version]
- Romano, S.; Brückner-Foit, A.; Brandão, A.; Gumpinger, J.; Ghidini, T.; Beretta, S. Fatigue properties of AlSi10Mg obtained by additive manufacturing: Defect-based modelling and prediction of fatigue strength. Eng. Fract. Mech. 2018, 187, 165–189. [Google Scholar] [CrossRef]
- Romano, S.; Nezhadfar, P.D.; Shamsaei, N.; Seifi, M.; Beretta, S. High cycle fatigue behavior and life prediction for additively manufactured 17-4 PH stainless steel: Effect of sub-surface porosity and surface roughness. Theor. Appl. Fract. Mech. 2020, 106, 102477. [Google Scholar] [CrossRef]
- Valbruna Edel Inox GmbH. Material Datasheet Ti-Grade5/Ti-6Al-4V; Valbruna Edel Inox GmbH: Dormagen, Germany, 2021. [Google Scholar]
- Voestalpine Böhler Welding GmbH. Material Datasheet 3Dprint AM Ti Grade 5/Ti-6Al-4V; Voestalpine Böhler Welding GmbH: Düsseldorf, Germany, 2021. [Google Scholar]
- EN ISO 6892-1; Metallic Materials-Tensile Testing—Part 1: Method of Test at Room Temperature. Committee for Standardization: Brussels, Belgium, 2016.
- Tiryakioğlu, M. Statistical distributions for the size of fatigue-initiating defects in Al–7%Si–0.3%Mg alloy castings: A comparative study. Mater. Sci. Eng. A 2008, 497, 119–125. [Google Scholar] [CrossRef]
- Tiryakioğlu, M. On the size distribution of fracture-initiating defects in Al- and Mg-alloy castings. Mater. Sci. Eng. A 2008, 476, 174–177. [Google Scholar] [CrossRef]
- Gumbel, E.J. Statistics of Extremes; Columbia University Press: New York, NY, USA, 1958. [Google Scholar]
- Tiryakioğlu, M. On the relationship between statistical distributions of defect size and fatigue life in 7050-T7451 thick plate and A356-T6 castings. Mater. Sci. Eng. A 2009, 520, 114–120. [Google Scholar] [CrossRef]
- Tiryakioğlu, M. Relationship between Defect Size and Fatigue Life Distributions in Al-7 Pct Si-Mg Alloy Castings. Metall. Mater. Trans. A 2009, 40, 1623–1630. [Google Scholar] [CrossRef]
- Leitner, M.; Garb, C.; Remes, H.; Stoschka, M. Microporosity and statistical size effect on the fatigue strength of cast aluminium alloys EN AC-45500 and 46200. Mater. Sci. Eng. A 2017, 707, 567–575. [Google Scholar] [CrossRef]
- Aigner, R.; Leitner, M.; Stoschka, M.; Hannesschläger, C.; Wabro, T.; Ehart, R. Modification of a Defect-Based Fatigue Assessment Model for Al-Si-Cu Cast Alloys. Materials 2018, 11, 2546. [Google Scholar] [CrossRef] [Green Version]
- Paris, P.; Erdogan, F. A Critical Analysis of Crack Propagation Laws. J. Basic Eng. 1963, 85, 528–533. [Google Scholar] [CrossRef]
- Richard, H.A.; Sander, M. Ermüdungsrisse: Erkennen, Sicher Beurteilen, Vermeiden, 2nd ed.; Vieweg+Teubner Verlag: Wiesbaden, Germany, 2012. [Google Scholar] [CrossRef]
- Lin, J.J.; Lv, Y.H.; Liu, Y.X.; Xu, B.S.; Sun, Z.; Li, Z.G.; Wu, Y.X. Microstructural evolution and mechanical properties of Ti-6Al-4V wall deposited by pulsed plasma arc additive manufacturing. Mater. Des. 2016, 102, 30–40. [Google Scholar] [CrossRef]
- Wu, B.; Pan, Z.; Ding, D.; Cuiuri, D.; Li, H. Effects of heat accumulation on microstructure and mechanical properties of Ti6Al4V alloy deposited by wire arc additive manufacturing. Addit. Manuf. 2018, 23, 151–160. [Google Scholar] [CrossRef]
- Wang, F.; Williams, S.; Colegrove, P.; Antonysamy, A.A. Microstructure and Mechanical Properties of Wire and Arc Additive Manufactured Ti-6Al-4V. Metall. Mater. Trans. A 2013, 44, 968–977. [Google Scholar] [CrossRef]
- Xie, Y.; Gao, M.; Wang, F.; Zhang, C.; Hao, K.; Wang, H.; Zeng, X. Anisotropy of fatigue crack growth in wire arc additive manufactured Ti-6Al-4V. Mater. Sci. Eng. A 2018, 709, 265–269. [Google Scholar] [CrossRef]
- ASTM International E 739; Standard Practice for Statistical Analysis of Linear or Linearized Stress-Life (S-N) and Strain Life (E-N) Fatigue Data. ASTM: West Conshohocken, PA, USA, 2015.
- Razavi, S.M.J.; Bordonaro, G.G.; Ferro, P.; Torgersen, J.; Berto, F. Fatigue Behavior of Porous Ti-6Al-4V Made by Laser-Engineered Net Shaping. Materials 2018, 11, 284. [Google Scholar] [CrossRef] [PubMed] [Green Version]
- Haibach, E. Structural Durability: Procedures and Data for Calculation of Components (Original Title in German: Betriebsfestigkeit: Verfahren und Daten zur Bauteilberechnung), 3rd ed.; VDI-Buch, Springer: Berlin, Germany, 2006. [Google Scholar]
- Murakami, Y.; Beretta, S. Small Defects and Inhomogeneities in Fatigue Strength: Experiments, Models and Statistical Implications. Extremes 1999, 2, 123–147. [Google Scholar] [CrossRef]
- Irwin, G.R. Analysis of Stresses and Strains Near the End of a Crack Traversing a Plate. J. Appl. Mech. 1957, 24, 361–364. [Google Scholar] [CrossRef]
- Aigner, R.; Pusterhofer, S.; Pomberger, S.; Leitner, M.; Stoschka, M. A probabilistic Kitagawa-Takahashi diagram for fatigue strength assessment of cast aluminium alloys. Mater. Sci. Eng. A 2019, 745, 326–334. [Google Scholar] [CrossRef]
- Mahdi, S.; Cenac, M. Estimating Parameters of Gumbel Distribution using the Methods of Moments, probability weighted moments and maximum likelihood. Rev. Mat. Teor. Apl. 2005, 12, 151–156. [Google Scholar] [CrossRef] [Green Version]
- Anderson, T.W.; Darling, D.A. A Test of Goodness of Fit. J. Am. Stat. Assoc. 1954, 49, 765–769. [Google Scholar] [CrossRef]
- Massey, F.J. The Kolmogorov-Smirnov Test for Goodness of Fit. J. Am. Stat. Assoc. 1951, 46, 68–78. [Google Scholar] [CrossRef]
- Abidin, N.; Adam, M.; Midi, H. The goodness-of-fit test for Gumbel Distrubution: A comparative study. Matematika 2012, 28, 35–48. [Google Scholar]
- Syed, A.K.; Zhang, X.; Davis, A.E.; Kennedy, J.R.; Martina, F.; Ding, J.; Williams, S.; Prangnell, P.B. Effect of deposition strategies on fatigue crack growth behaviour of wire + arc additive manufactured titanium alloy Ti–6Al–4V. Mater. Sci. Eng. A 2021, 814, 141194. [Google Scholar] [CrossRef]
- Coro, A.; Abasolo, M.; Aguirrebeitia, J.; López de Lacalle, L.N. Inspection scheduling based on reliability updating of gas turbine welded structures. Adv. Mech. Eng. 2019, 11. [Google Scholar] [CrossRef] [Green Version]
- Coro, A.; Macareno, L.M.; Aguirrebeitia, J.; López de Lacalle, L.N. A Methodology to Evaluate the Reliability Impact of the Replacement of Welded Components by Additive Manufacturing Spare Parts. Metals 2019, 9, 932. [Google Scholar] [CrossRef] [Green Version]
- Pérez-Ruiz, J.D.; de Lacalle, L.N.L.; Urbikain, G.; Pereira, O.; Martínez, S.; Bris, J. On the relationship between cutting forces and anisotropy features in the milling of LPBF Inconel 718 for near net shape parts. Int. J. Mach. Tools Manuf. 2021, 170, 103801. [Google Scholar] [CrossRef]
- Tolosa, I.; Garciandía, F.; Zubiri, F.; Zapirain, F.; Esnaola, A. Study of mechanical properties of AISI 316 stainless steel processed by “selective laser melting”, following different manufacturing strategies. Int. J. Adv. Manuf. Technol. 2010, 51, 639–647. [Google Scholar] [CrossRef]


| Al | V | Fe | O | N | C | H | Ti | |
|---|---|---|---|---|---|---|---|---|
| Substrate | 5.50–6.75 | 3.50–4.50 | <0.30 | <0.20 | <0.05 | <0.08 | <0.015 | Balance |
| Wire | 6.00 | 4.00 | <0.15 | 0.18 | <0.03 | <0.05 | <0.01 | Balance |
| Process Parameter | Unit | Value |
|---|---|---|
| Current | A | 92.0 |
| Voltage | V | 18.1 |
| Travel speed | mm/s | 2.5 |
| Wire feed speed | m/min | 5.0 |
| Wire diameter | mm | 1.2 |
| Condition | Orientation | UTS [MPa] | YS [MPa] | A (%) | References |
|---|---|---|---|---|---|
| As-built | Horizontal | 957 ± 4 | 867 ± 16 | 6 ± 1 | This study |
| As-built | Horizontal | 923–995 | 840–909 | 5–11 | [32,33,34,35] |
| Condition | Orientation | [MPa] | Slope k | 1: | 1: |
|---|---|---|---|---|---|
| As-built | Horizontal | 261.6 | 4.40 | 1.43 | 4.78 |
| Specimen | Pore Position | Area [µm2] | [µm] | [µm] |
|---|---|---|---|---|
| 1 | Bulk | 38,360 | 221 | |
| 2 | Bulk | 14,314 | 135 | |
| 3 | Bulk | 11,310 | 120 | |
| 4 | Bulk | 53,502 | 261 | |
| 5 | Bulk | 76,945 | 313 | |
| 6 | Bulk | 45,239 | 240 | |
| 7 | Bulk | 52,685 | 259 | |
| 8 | Surface | 59,155 | 274 | 381 |
| 9 | Surface | 50,636 | 253 | 353 |
| 10 | Bulk | 61,757 | 280 | |
| 11 | Bulk | 66,508 | 291 | |
| 12 | Surface | 71,227 | 301 | 418 |
| 13 | Bulk | 431,247 | 741 | |
| 14 | Bulk | 174,234 | 471 | |
| 15 | Bulk | 11,499 | 121 | |
| 16 | Surface | 55,623 | 266 | 370 |
| 17 | Surface | 10,311 | 114 | 159 |
| 18 | Bulk | 33,329 | 206 | |
| 19 | Bulk | 6793 | 93 |
| Dataset | [µm] | [µm] | ||
|---|---|---|---|---|
| Original | 202.3 | 96.3 | 0.74 | 0.61 |
| Modified | 232.9 | 119.8 | 0.33 | 0.97 |
| Dataset | |||||||
|---|---|---|---|---|---|---|---|
| 1: | 1: | 1: | |||||
| Experiment | 4.78 | 4.78 | 4.78 | ||||
| Model | Original | 4.39 | 4.38 | 4.38 | |||
| Deviation | 13% | 13% | 14% | ||||
| Model | Modified | 5.12 | 5.12 | 5.12 | |||
| Deviation | −6% | −6% | −6% | ||||
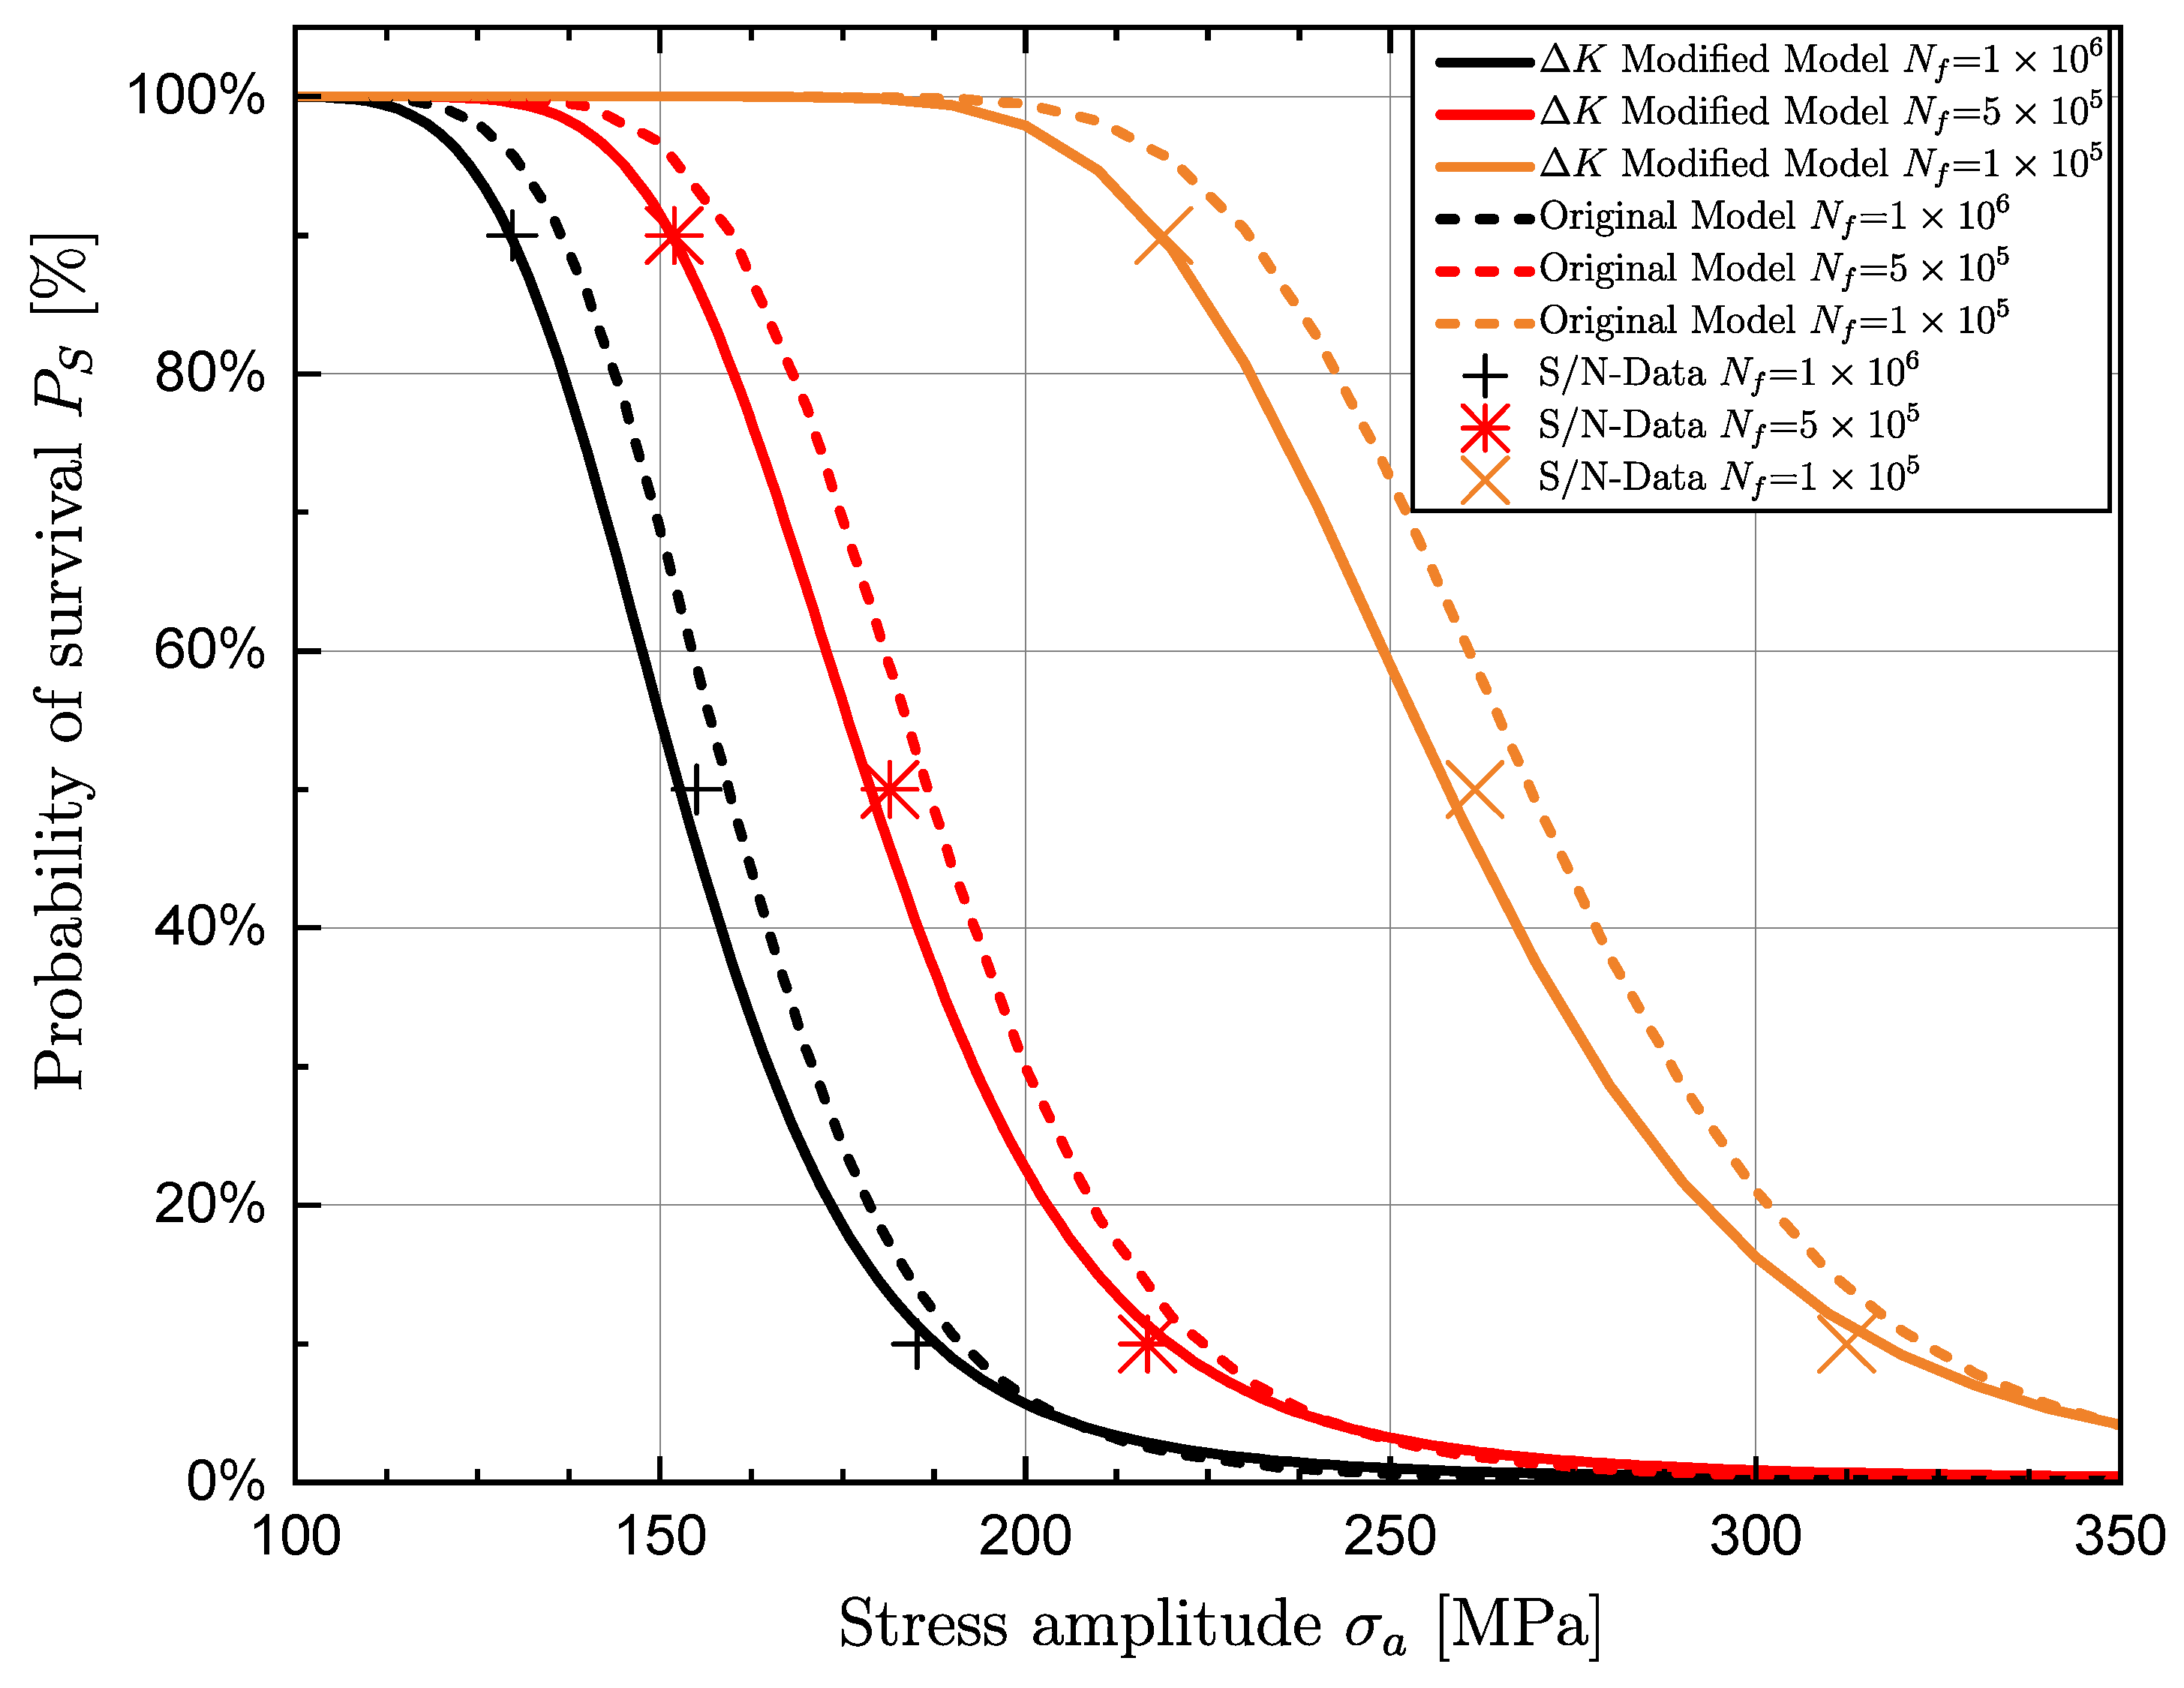
| Dataset | |||||||
|---|---|---|---|---|---|---|---|
| [MPa] | 1: | [MPa] | 1: | [MPa] | 1: | ||
| Experiment | 155 | 1.43 | 182 | 1.43 | 262 | 1.43 | |
| Model | Original | 159 | 1.40 | 187 | 1.40 | 269 | 1.40 |
| Deviation | 3% | 3% | 3% | ||||
| Model | Modified | 153 | 1.45 | 179 | 1.45 | 258 | 1.45 |
| Deviation | −2% | −2% | −1% | ||||
Publisher’s Note: MDPI stays neutral with regard to jurisdictional claims in published maps and institutional affiliations. |
© 2022 by the authors. Licensee MDPI, Basel, Switzerland. This article is an open access article distributed under the terms and conditions of the Creative Commons Attribution (CC BY) license (https://creativecommons.org/licenses/by/4.0/).
Share and Cite
Springer, S.; Leitner, M.; Gruber, T.; Oberwinkler, B.; Lasnik, M.; Grün, F. Fatigue Assessment of Wire and Arc Additively Manufactured Ti-6Al-4V. Metals 2022, 12, 795. https://doi.org/10.3390/met12050795
Springer S, Leitner M, Gruber T, Oberwinkler B, Lasnik M, Grün F. Fatigue Assessment of Wire and Arc Additively Manufactured Ti-6Al-4V. Metals. 2022; 12(5):795. https://doi.org/10.3390/met12050795
Chicago/Turabian StyleSpringer, Sebastian, Martin Leitner, Thomas Gruber, Bernd Oberwinkler, Michael Lasnik, and Florian Grün. 2022. "Fatigue Assessment of Wire and Arc Additively Manufactured Ti-6Al-4V" Metals 12, no. 5: 795. https://doi.org/10.3390/met12050795