Article

Microstructural Impact on Fatigue Crack Growth Behavior of Alloy 718

by
Christian Gruber
1,2,*,
Peter Raninger
1,
Jürgen Maierhofer
1,
Hans-Peter Gänser
1,
Aleksandar Stanojevic
2,
Anton Hohenwarter
3 and
Reinhard Pippan
4
1
Materials Center Leoben Forschung GmbH, 8700 Leoben, Austria
2
Voestalpine BÖHLER Aerospace GmbH & Co KG, 8605 Kapfenberg, Austria
3
Montanuniversität Leoben—Chair of Materials Physics, 8700 Leoben, Austria
4
Erich Schmid Institute of Materials Science, 8700 Leoben, Austria
*
Author to whom correspondence should be addressed.
Metals 2022, 12(5), 710; https://doi.org/10.3390/met12050710
Submission received: 28 February 2022 / Revised: 25 March 2022 / Accepted: 19 April 2022 / Published: 21 April 2022
(This article belongs to the Special Issue Technological Aspects in Fatigue Design of Metallic Structures)

Abstract

:
Alloy 718 for forged parts can form a wide range of microstructures through a variety of thermo-mechanical processes, depending on the number of remelting processes, temperature and holding time of homogenization annealing, cogging and the number of forging steps depending on the forming characteristics. In industrial practice, these processing steps are tailored to achieve specific mechanical and microstructural properties in the final product. In the present work, we investigate the dependence of the threshold of stress intensity factor range ΔKth on associated microstructural elements, namely grain size and distribution. For this purpose, a series of tests with different starting microstructures were performed at the falling stress intensity factor range, ΔK, and a load ratio of R = 0.1 to evaluate the different threshold values. Fracture initiation and crack propagation were analyzed afterward using scanning electron microscopy of the resulting fracture surfaces. In order to obtain comparable initial conditions, all specimens were brought to the same strength level by means of a two-stage aging heat treatment. In the future, this knowledge shall be used in the context of simulation-aided product development for estimating local fatigue crack propagation properties of simulated microstructures obtained from forging and heat treatment modeling.

1. Introduction

For structural components in the aircraft industry made of alloy 718, which are manufactured via cast and wrought routes, there are high demands on mechanical properties, especially on fatigue crack resistance and fracture toughness. In addition to the characterization of mechanical properties, the microstructural influence on fatigue crack growth and on fracture mechanical parameters ought to be well known. Although components from production routes such as selective laser melting [1,2,3,4] or electron beam melting [5] exhibit significantly lower fatigue crack growth threshold and lower fracture toughness, a production route with polycrystalline microstructures using a forging or thermomechanical forming process [6,7,8] show improved parameters and are more suitable for components subjected to fatigue loading. Through thermomechanical processing, the microstructure of alloy 718 with low stacking fault energy and pronounced recrystallization behavior [9,10,11,12], which is typical for nickel-based superalloys, can be specifically adjusted. In this work, the influence of the microstructural constituents such as the grain size [13,14,15], as large as (ALA) grains, yield and ultimate tensile strength of the heat-treated state on the threshold of stress intensity factor range (ΔKth) have been characterized. For this purpose, high-resolution SEM images of the fracture surfaces of different initial states with specific microstructural parameters have been performed and considered in detail in the results. From these findings, a tentative phenomenological model for the dependence of the fatigue crack propagation properties on the microstructural and strength parameters is derived. In addition, the exposed fracture surfaces in the transition area from the long crack fatigue regime are compared to the surfaces of the residual ligament and the fracture toughness samples with the same microstructure.

2. Materials and Methods

For the series of experiments and differentiation of the individual microstructural elements, the used material was chosen from the same manufacturer and adjusted to representative extreme cases in forging production by means of variation in the process route and grain sizes. In order to maintain comparability within the test series, all samples were adjusted to a similar strength level by means of two-stage aging heat treatments; at least three experiments with the same microstructure were conducted.

2.1. Materials

The initially cast and wrought polycrystalline material made of alloy 718 was processed into four different microstructural states in terms of grain size, ALA grains, precipitates and strength by means of targeted thermomechanical processing. A difference in adjustable grain size is shown in Figure 1. The difference in equivalent circle diameter (ECD) is already well apparent from the figure and is quantified in Table 1. Further key parameters such as yield strength, tensile strength and fracture toughness in the same direction of crack propagation are also represented in the table and are the average of three measurements of the same material (Tensile test: ASTM E8 [16]; Fracture toughness: ASTM E399 [17]). Material A, B and C are double melted (Vacuum Induction Melted + Vacuum Arc Remelted) initial materials, whereas Material D was triple melted (Vacuum Induction Melted + Electro Slag Remelted + Vacuum Arc Remelted). This difference should help to adjust the size variation of the precipitates in terms of the niobium and titanium precipitates and affecting in this way the ΔKth. The difference between Material A and B is used to study the grain size influence at the same strength level, whereas Material B further has a broader range of grain size distribution (heterogeneities) and a varying unknown amount of plastification due to the processing and position of the sample from a forged billet. Differences between Material B and C shall show the effect on ΔKth at the same grain size with slight variation in strength; Material D represents the smallest grain size with the highest obtainable strength during the forging process for aircraft parts.

2.2. Experiments

The experiments for determining the fatigue crack growth threshold ΔKth by using the continuous load shedding (K-decreasing) procedure [18] were conducted in an air-conditioned testing room with a room temperature of 22 ± 2 °C and relative humidity of 49 ± 3%. The used sample size was 100 mm × 20 mm × 6 mm with a radial crack propagation direction; this is the same direction as for the specimens from which the fracture toughness values in Table 1 had been obtained. By controlling temperature and humidity, it is ensured that any observed variation in the experimental results is not due to a variation in the environmental conditions. The experiments were performed at a resonant testing rig (Rumul Testronic 150 kN, Russenberger Prüfmaschinen AG, Neuhausen am Rheinfall, Switzerland) at a frequency of ~90 Hz by using an eight-point bending mount. The crack growth was measured using the direct current potential drop (DCPD: Matelect Crack Growth Monitor DCM-2, Matelect LTD, Newdigate road, UK) technique.
To exclude effects from manufacturing and to avoid short crack effects, the load shedding tests were started after a total crack length of a = 6.5 mm was reached by keeping ΔK constant and somewhat lower than the ΔK value used for starting the subsequent load shedding experiment. The load shedding tests were conducted by using an automatized ΔK-decreasing procedure with a normalized stress intensity factor gradient of −0.04 mm−1 and a crack extension increment of Δa = 50 μm. The stress intensity factor K was calculated from force and crack length according to ISO 12108 [19].

3. Results

In the following subsections, the results of the load shedding experiments are considered separately for each material, and the result plots are presented. Afterward, the factors influencing the threshold value and the crack propagation are compared with each other and analyzed on the basis of the corresponding fracture surfaces. The specimen geometry and the driving mode of the experiment also allowed conclusions to be drawn about the Paris region of the long crack.

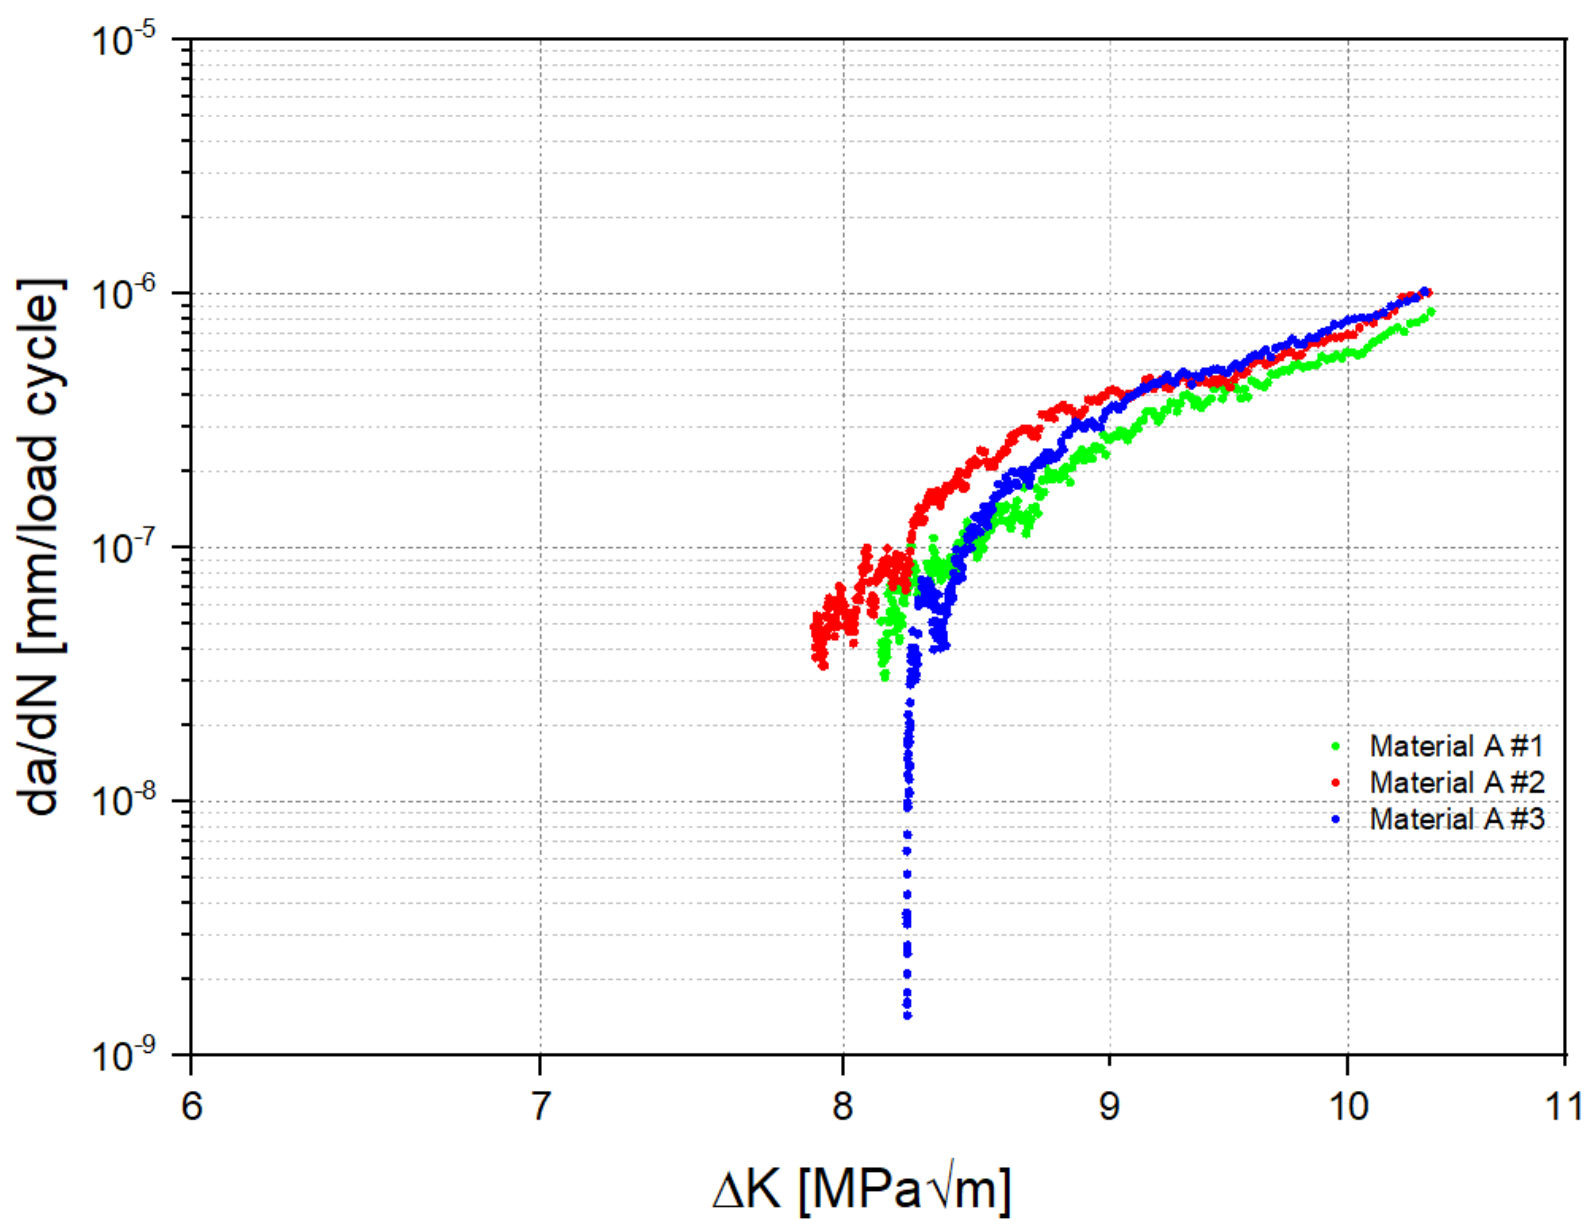
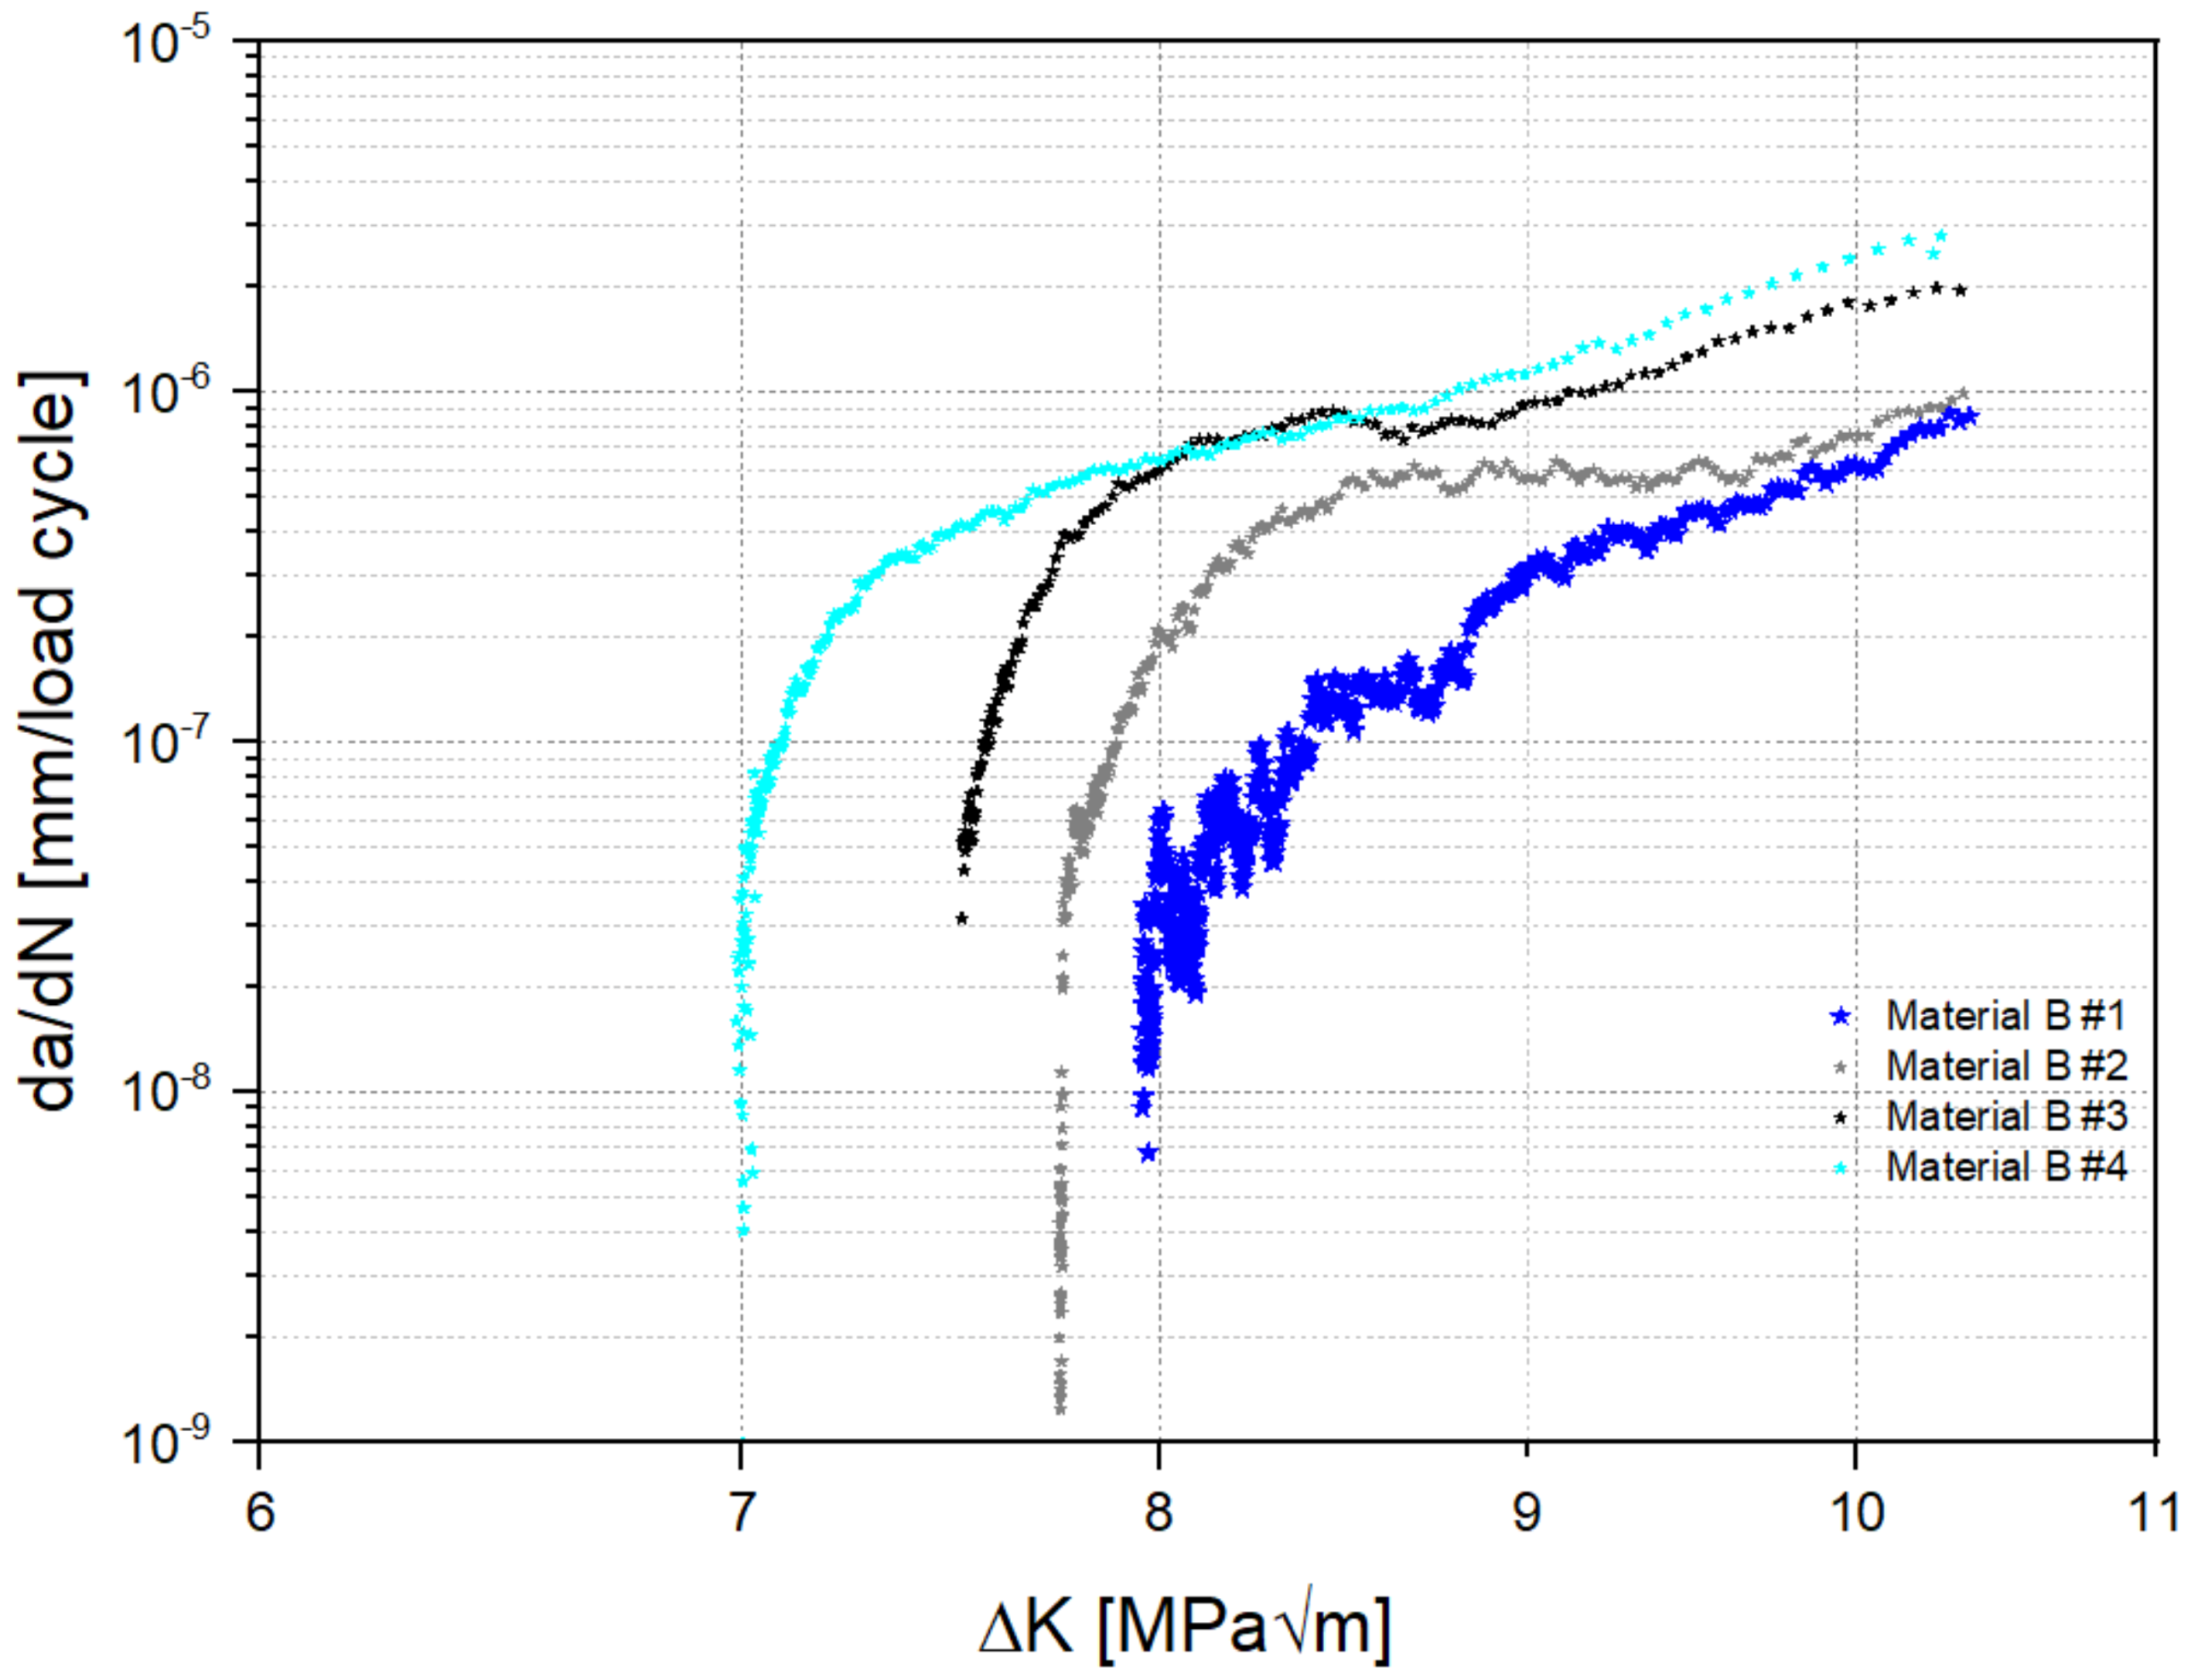
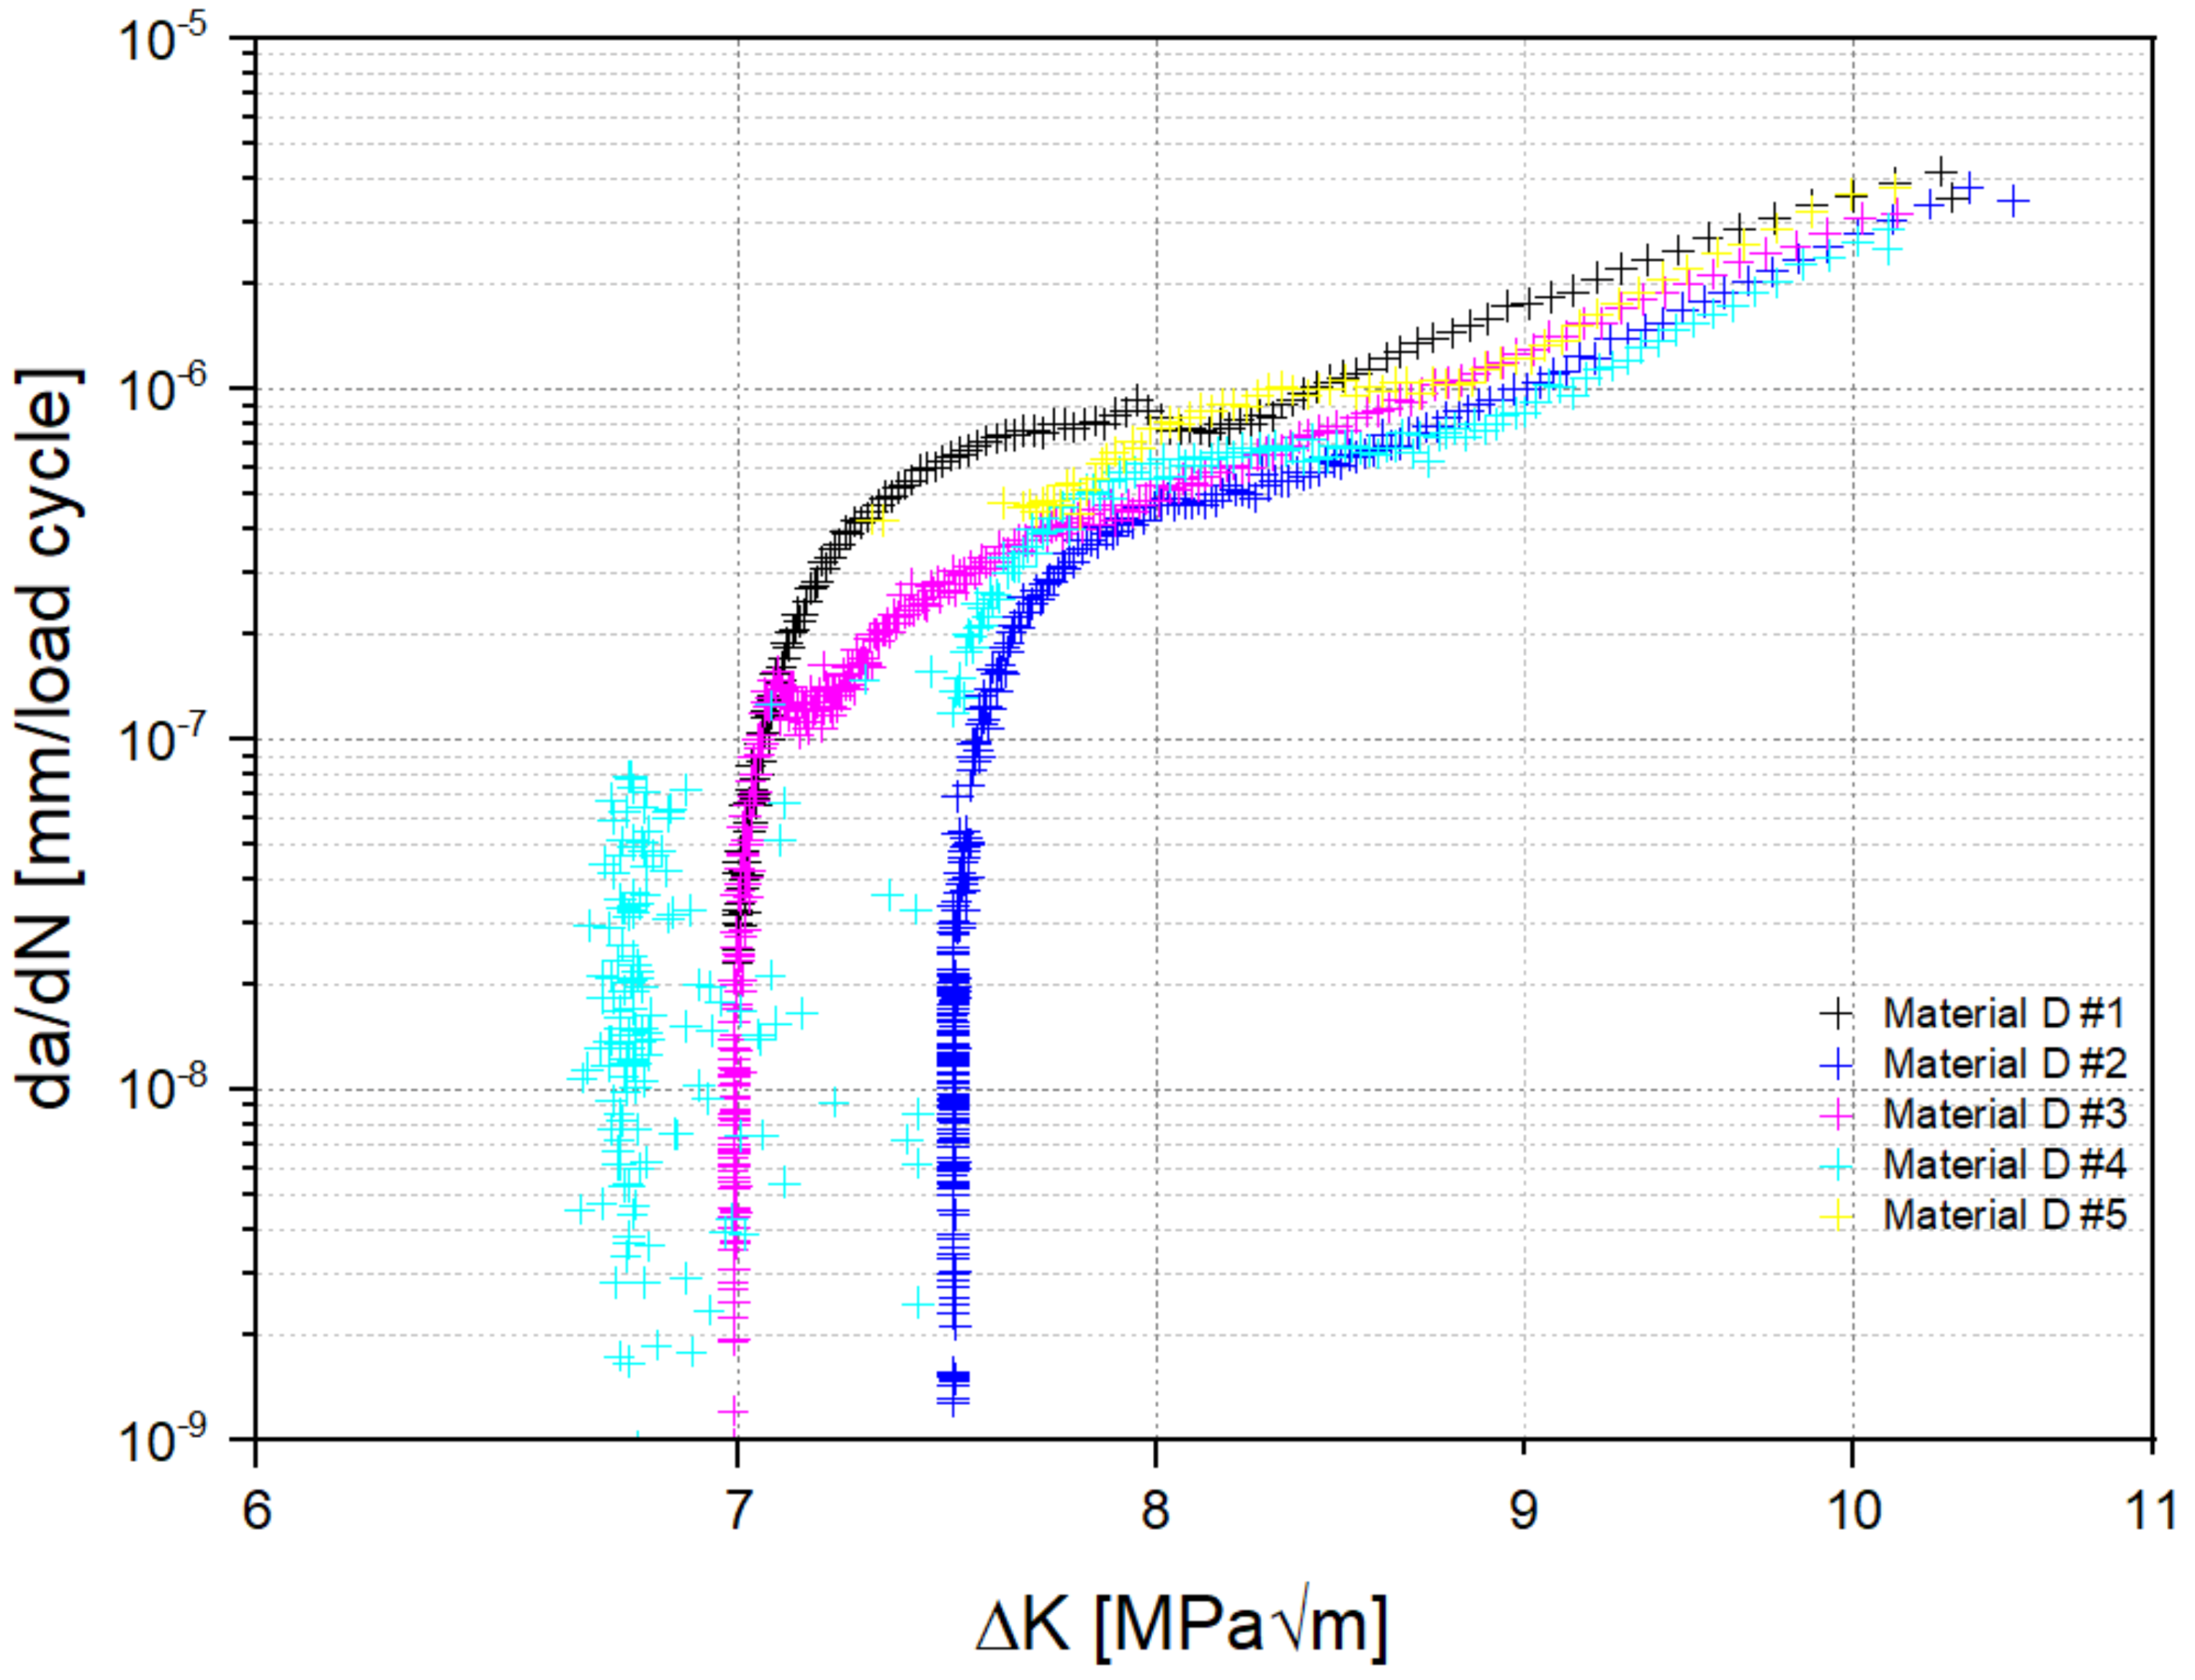
3.1. Threshold of Stress Intensity Factor Range for Fatigue Growth

The threshold values were determined by the falling mode of the tests (K-decreasing) and the respective resulting parameter of each material is represented in Table 2. In addition, the beginning of the Paris regime (transition from I to II, [6]) was recorded during the experimental procedure; the constants of the Paris law (Equation (1)) were also determined for each material and their results are also given in the table.
da / dN [ mm / cyc ] = C ( Δ K [ MPa m ] ) m
Note that this is a quantity equation, with ΔK to be inserted in units of [MPa√m] and da/dN in units of [mm/cyc]. Accordingly, the parameters of this equation, viz. C and m, are dimensionless.

3.1.1. Material A

The first displayed and evaluated Material A represents the reference for the present investigations. This material had the coarsest microstructure (highest ECD) and also the largest ALA grains. The curves (Figure 2) nearly coincide in the initial part of the linear (Paris) regime and all have a threshold value ΔKth between 7.90 and 8.23 MPa√m.

3.1.2. Material B

In comparison, Material B shows a significantly larger scatter of the measured curves. This scatter is likely to be linked to plastification due to the processing of the specimens during the adjustment of the microstructure and possible local fluctuations. Material B had a significantly lower ECD at the same strength as Material A, but the grain size distribution was significantly more inhomogeneous. The scatter of the curves (Figure 3) already indicates the influence of these elements and is discussed in detail in the chapter fractography. The ΔKth varies here between 7.0 and 8.0 MPa√m.

3.1.3. Material C

Another state is represented by Material C, in which the microstructure is similarly fine to that of Material B, but much more homogeneous and, due to different distribution and quantity of precipitates, somewhat lower in absolute strength; therefore, the curves of these samples in Figure 4 are again more similar to each other. The abrupt end in the threshold regime has experimental reasons due to the sample geometry and a small remaining ligament with a high particle density. This higher density, combined with the size of the precipitates in Material C, led to an abrupt final rupture so that no measurement points below 4 × 10⁻⁷ mm/cyc could be recorded.

3.1.4. Material D

The lowest threshold was consistently provided by Material D, which was defined by the lowest ECD and the highest strength. After comparison with the literature [14], this behavior is explainable by roughness-induced crack closure. The curves shown in Figure 5 nearly coincide with the Paris regime; however, there is a noticeable scatter range for ΔKth between 6.8 and 7.5 MPa√m. For a more precise description of the influence of the constituents from the microstructure, an evaluation of the results based on the fracture surfaces is also necessary.

3.2. Fractography

In order to link the differences in the previous results to microstructural elements, the fracture surfaces were investigated with respect to the propagation of the fatigue crack. The fractographic investigations were performed with a scanning electron microscope from TESCAN (MAGNA) using an accelerating voltage of 15 kV and a secondary electron detector. First, Figure 6 shows the overview of the entire samples of Material A compared to Material B with the lowest measured threshold value of this series. The length of the crack surface of the long crack and the shortness of the overload fracture surface, determined by the position of the transition marked in the figures, indicate a microstructure effect on the threshold value since both materials have the same strength and fracture toughness, but with different grain size (ECD and ALA).
The marked areas in Figure 6 are pointed out at higher magnification in Figure 7. Based on the declared position of the crack propagation of the sample (notch—0%, center—50% and transition—100%), this progress can be assigned to the decreasing progress of ΔK (Figure 3 for Material A and Figure 4 for Material B). In the complete regime of crack growth with generally low ΔK throughout the test, roughness-induced crack closure is dominant, which can be deduced from the appearance of the fracture surface. In addition, no other components of the microstructure (carbides, nitrides or delta phase) were exposed or detectable in higher amounts in the region from the specimen’s notch, center and the beginning of the transition. In the area of the transition to the final fracture (rupture), the first particles are exposed in Material B and indicate a change of the fracture mode from fatigue to rupture.
Due to the large variation within the series of Material B, additional experiments were carried out with load-increasing crack growth with the same R-value to analyze the differences in the threshold regime as well as in the early Paris regime. Since the ECD only reflects the mean grain diameter of a measured representative area but not its distribution, individual ALA grains are not reflected by this quantity. Figure 8 shows the impact of ALA grains on the roughness of the fracture surface and thus on the crack propagation and explains the differences in the curves in Figure 3. Furthermore, due to the process route of the corresponding pre-material billet involving cogging, a varying degree of plastic deformation, i.e., cold work, is present in the samples, which is an additional reason for the scatter of the measured curves. This cannot be investigated in detail by the applied methods but is considered in the threshold determination.

3.3. Fracture Toughness

In order to compare the threshold values and crack propagation behavior with fracture toughness KIC, a comparative test series was carried out for Material B (same initial condition and same crack propagation direction). Results show a completely different picture in terms of the fracture surfaces, where mainly clusters of carbides are exposed, which are clearly the decisive microstructural feature for KIC. Figure 9a provides an overview of a characteristic fracture surface, while (b) shows in detail the band structure of the particles, which is determined by the material flow during the melting process and subsequent thermomechanical treatment where the microstructure is finally set.

3.4. Modelling Approach

To derive the microstructure–property relations, the data from Table 1 and Table 2 are merged and subjected to an exploratory data analysis. This analysis will serve for knowledge discovery, i.e., for identifying relevant correlations between the various microstructural, strength and crack growth parameters. Given the fact that, except for the dependence of the intrinsic threshold contribution on Young’s modulus, so far, no physically based quantitative relations between the fatigue crack growth properties and microstructural and strength properties exist (cf. [18]), this pragmatic approach seems justifiable. Although it is phenomenological in nature, it might well prove useful for mechanical design purposes. A similar approach has been followed by Ashby in his classical work on materials selection in mechanical design [20]; in contrast to Ashby, who gives comparisons across various material classes, we limit ourselves here to different treatments of a single alloy, viz. alloy 718.
Regarding the kinetics of fatigue crack propagation, the well-known correlation between log C and m [20] is observed also in the present data set, see Figure 10. Note, however, that the values for m and C are exceptionally high and low, respectively. This is due to the fact that the load shedding experiments have concentrated on the near-threshold region and have started only in the very early linear (Paris) regime; keeping in mind the S-shape of the da/dN vs. ΔK curve, it is easily reasoned that the slope in the very early Paris regime is higher than in the center of that regime.
Proceeding to the microstructure–property relations, it turns out that ECD, ALA and UTS are nearly linearly correlated. This means that each of the two microstructural properties ECD and ALA, as well as the mechanical property UTS, will give similar performance as an explanatory variable for the fracture mechanical properties ΔKth, log C, m, and KIC. So, Rp0.2 is the only remaining mechanical property possibly adding explanatory value; however, no strong correlation between Rp0.2 and any of the other properties is observed; therefore, we choose, in what follows, the variables from ECD, ALA and UTS that correlate best with the respective fracture mechanical property of interest.
As can be seen from Figure 11a,b, ΔKth exhibits a marked negative correlation with UTS and a positive correlation with ALA. As the threshold increases, its scatter decreases somewhat. A notable exception is Material B (indicated by triangles in the diagrams), which shows very high scatter; as mentioned above, this may be due to locally varying plastic deformation.
In this context, it is of interest to note that there is a marked positive linear correlation between ALA and KIC for Materials A, C and D, which are produced via the standard route, see Figure 12; however, KIC is much higher for the plastically deformed Material B compared to Material C, which has nearly the same ALA.
Finally, the Paris exponent m describing fatigue crack growth kinetics does not show any significant correlation with the microstructural and mechanical properties; see Figure 13 as an example plot of m vs. ALA; however, the scatter of m decreases with increasing ALA (and ECD) and decreasing UTS, respectively.

4. Discussion

By investigating four batches with different microstructural parameters, we sought to identify the relevant microstructural parameters influencing the fatigue crack growth parameters. Lacking physically based quantitative relations between the fatigue crack growth properties and microstructural and strength properties, a phenomenological approach has been pursued. First promising correlations between grain size, tensile strength and threshold have been observed in this first test series on wrought alloy 718. Given the still very limited amount of data and their scatter, these linear correlations may serve as a valuable first step towards modeling the influence of microstructure and strength on the fatigue crack growth properties of alloy 718.
Specifically, the difference in the mode of crack propagation between fatigue and fracture toughness testing could be shown by a thorough analysis of the fracture surfaces. The fractography confirms the hypothesis of grain size dependence of the threshold, which may be attributed to the mechanism of roughness-induced crack closure.
Clearly, further evaluations need to be supplemented in the future in order to distinguish between the influences of grain size, size distribution of γ′ and γ″ precipitates and δ phase and contents of alloying elements influencing solid solution hardening on the fatigue crack growth properties, as it has been shown for the static strength in [21]; however, it will be hardly possible to derive an experimental design controlling all those parameters. Rather, it should be sought to build a database covering a large variety of different batches, and therefore different parameter combinations, and then to extract statistically relevant correlations in an attempt at knowledge discovery. In the next step, this may serve as useful phenomenological input for developing a physically based theory of microstructural influences on the threshold behavior.
In addition, a description of the mean stress influence (load ratio), as well as higher ΔK loads for a better description of the Paris regime (C and m), might be of interest; however, since the Paris regime is not of high relevance for typical rotating machinery applications of forged alloy 718, efforts should rather concentrate on the threshold behavior. The load ratio, on the other hand, is important for modeling the residual stress influence; for the specimens investigated in the present work, the residual stresses are negligible due to the small specimen size [22].

5. Conclusions

From a series of experiments with material batches of different grain sizes and production routes, we have shown that the threshold value ΔKth depends only on the grain size. This means that ΔKth is mainly governed by roughness-induced crack closure.
Furthermore, marked negative correlations between grain size and UTS and hence also between UTS and ΔKth are observed. Interestingly, the plastically deformed material batch follows the same correlation, i.e., added plastic deformation does—other than adding notable scatter—not influence UTS and ΔKth.
In contrast, plastic deformation seems to influence the fracture toughness KIC advantageously. It remains to be further investigated how this finding can be related to our fractographic observations, viz., that fracture is driven by the density of second phase particles, whereas fatigue crack growth is largely independent of these particles. More specifically, not a single precipitate (carbides and nitrides) was exposed and no δ-phase was seen on the fracture surfaces of samples from threshold tests. The opposite is true for the samples from fracture toughness tests, where the particles are predominantly visible on the fracture surface and thus appear to control the fracture.
While the present work offers first interesting insights into the microstructure–property relations of alloy 718, further in-depth research is clearly needed; an outline of a possible methodological approach for knowledge discovery towards the development of a complete set of microstructure–property relations for the fatigue crack growth behavior of this superalloy has been given.

Author Contributions

Conceptualization, C.G. and P.R.; methodology experiments, J.M., A.H. and R.P.; methodology modeling, H.-P.G.; methodology fractography, A.H.; validation A.S. and H.-P.G. writing—original draft preparation, C.G.; writing—review and editing, P.R. and A.S.; supervision, R.P. All authors have read and agreed to the published version of the manuscript.

Funding

The research leading to these results has received funding from the TakeOff program. TakeOff is a Research, Technology and Innovation Funding Program of the Austrian Federal Ministries for Climate Action, Environment, Energy, Mobility, Innovation and Technology (BMK) (867403). The Austrian Research Promotion Agency (FFG) has been authorized for the Program Management.

Institutional Review Board Statement

Not applicable.

Informed Consent Statement

Not applicable.

Data Availability Statement

The data presented in this study are available on request from the corresponding author. The data are not publicly available due to restrictions from industrial partners.

Conflicts of Interest

The authors declare no conflict of interest.

References

  1. Konečná, R.; Kunz, L.; Nicoletto, G.; Bača, A. Long fatigue crack growth in Inconel 718 produced by selective laser melting. Int. J. Fatigue 2016, 92, 2. [Google Scholar] [CrossRef]
  2. Wang, Z.; Guan, K.; Gao, M.; Li, X.; Chen, X.; Zeng, X. The microstructure and mechanical properties of deposited-IN718 by selective laser melting. J. Alloy Compd. 2012, 513, 518–523. [Google Scholar] [CrossRef]
  3. Amato, K.N.; Gaytan, S.M.; Murr, L.E.; Martinez, E.; Shindo, P.W.; Hernandez, J.; Collins, S.; Medina, F. Microstructures and mechanical behavior of Inconel 718 fabricated by selective laser melting. Acta Mater. 2012, 60, 2229–2239. [Google Scholar] [CrossRef]
  4. Kruth, J.-P.; Levy, G.; Klocke, F.; Childs, T.H.C. Consolidation phenomena in laser and powder-bed based layered manufacturing. CIRP Ann. 2007, 56, 730–759. [Google Scholar] [CrossRef]
  5. Murr, L.E.; Martinez, E.; Gaytan, S.M.; Ramirez, D.A.; Machado, B.I.; Shindo, P.W.; Martinez, J.L.; Medina, F.; Wooten, J.; Ciscel, D.; et al. Microstructural Architecture, Microstructures, and Mechanical Properties for a Nickel-Base Superalloy Fabricated by Electron Beam Melting. Met. Mater. Trans. A 2011, 42, 3491–3508. [Google Scholar] [CrossRef] [Green Version]
  6. Mercer, C.; Soboyejo, A.B.O.; Soboyejo, W.O. Micromechanisms of fatigue crack growth in a forged Inconel 718 nickel-based superalloy. Mater. Sci. Eng. A 1999, 270, 308–322. [Google Scholar] [CrossRef]
  7. Clavel, M.; Pineau, A. Frequency and wave-form effects on the fatigue crack growth behavior of alloy 718 at 298 K and 823 K. Met. Trans. A 1978, 9, 471–480. [Google Scholar] [CrossRef]
  8. Clavel, M.; Pineau, A. Fatigue behaviour of two nickel-base alloys I: Experimental results on low cycle fatigue, fatigue crack propagation and substructures. Mater. Sci. Eng. 1982, 55, 157–171. [Google Scholar] [CrossRef]
  9. Chen, X.; Lin, Y.C.; Chen, M.; Li, H.; Wen, D.; Zhang, J.; He, M. Microstructural evolution of a nickel-based superalloy during hot deformation. Mater. Des. 2015, 77, 41–49. [Google Scholar] [CrossRef]
  10. Zhang, H.; Zhang, K.; Zhou, H.; Lu, Z.; Zhao, C.; Yang, X. Effect of strain rate on microstructure evolution of a nickel-based superalloy during hot deformation. Mater. Des. 2015, 80, 51–62. [Google Scholar] [CrossRef]
  11. Sommitsch, C.; Mitter, W. On modelling of dynamic recrystallisation of fcc materials with low stacking fault energy. Acta Mater. 2006, 54, 357–375. [Google Scholar] [CrossRef]
  12. Gruber, C.; Raninger, P.; Stanojevic, A.; Godor, F.; Rath, M.; Kozeschnik, E.; Stockinger, M. Simulation of Dynamic and Meta-Dynamic Recrystallization Behavior of Forged Alloy 718 Parts Using a Multi-Class Grain Size Model. Materials 2020, 14, 111. [Google Scholar] [CrossRef] [PubMed]
  13. Pokluda, J.; Pippan, R. Analysis of roughness-induced crack closure based on asymmetric crack-wake plasticity and size ratio effect. Mater. Sci. Eng. A 2007, 462, 355–358. [Google Scholar] [CrossRef]
  14. Pippan, R.; Hohenwarter, A. Fatigue crack closure: A review of the physical phenomena. Fatigue Fract. Eng. Mater. Struct. 2017, 40, 471–495. [Google Scholar] [CrossRef] [PubMed]
  15. Pippan, R.; Riemelmoser, F.O.; Weinhandl, H.; Kreuzer, H. Plasticity-induced crack closure under plane-strain conditions in the near-threshold regime. Philos. Mag. A 2009, 82, 3299–3309. [Google Scholar] [CrossRef]
  16. ASTM E8/E8M-13a; Standard Test Methods for Tension Testing of Metallic Materials. American Society for Testing and Materials: West Conshohocken, PA, USA, 2013.
  17. ASTM E399–20a; Standard Test Method for Linear-Elastic Plane-Strain Fracture Toughness of Metallic Materials. American Society for Testing and Materials: West Conshohocken, PA, USA, 2020.
  18. Maierhofer, J.; Kolitsch, S.; Pippan, R.; Gänser, H.P.; Madia, M.; Zerbst, U. The cyclic R-curve—Determination, problems, limitations and application. Eng. Fract. Mech. 2018, 198, 45–64. [Google Scholar] [CrossRef]
  19. ISO 12108:2018; Metallic Materials—Fatigue Testing—Fatigue Crack Growth Method. International Organization for Standardization: Geneva, Switzerland, 2018.
  20. Ashby, M.F. Materials Selection in Mechanical Design, 5th ed.; Butterworth-Heinemann: Oxford, UK, 2016. [Google Scholar]
  21. Rielli, V.V.; Godor, F.; Gruber, C.; Stanojevic, A.; Oberwinkler, B.; Primig, S. Effects of processing heterogeneities on the micro- to nanostructure strengthening mechanisms of an alloy 718 turbine disk. Mater. Des. 2021, 212, 110295. [Google Scholar] [CrossRef]
  22. Maierhofer, J.; Gänser, H.P.; Pippan, R. Crack closure and retardation effects—Experiments and modelling. Procedia Struct. Integr. 2017, 4, 19–26. [Google Scholar] [CrossRef]
Figure 1. Electron backscatter diffraction (EBSD) grain maps with inverse pole figure (IPF) coloring and removed twins: (a) Material A: coarse microstructure; (b) Material B: fine microstructure.
Metals 12 00710 g001
Figure 2. Fatigue crack growth curves for Material A; ECD: 11.83 mm; ALA: 36.20 mm; UTS: 1432 MPa; KIC: 128 MPa√m—not valid.
Metals 12 00710 g002
Figure 3. Fatigue crack growth curves for Material B; ECD: 9.29 mm; ALA: 28.66 mm; UTS: 1466 MPa; KIC: 128 MPa√m—not valid.
Metals 12 00710 g003
Figure 4. Fatigue crack growth curves for Material C; ECD: 9.99 mm; ALA: 29.48 mm; UTS: 1469 MPa; KIC: 116 MPa√m—not valid.
Metals 12 00710 g004
Figure 5. Fatigue crack growth curves for Material D; ECD: 7.67 mm; ALA: 21.97 mm; UTS: 1530 MPa; KIC: 107 MPa√m—valid.
Metals 12 00710 g005
Figure 6. Overview images of the fatigue crack surfaces (20 mm × 6 mm) from the notch to the transition into final fracture: (a) Material A: coarse microstructure; (b) Material B: fine microstructure.
Metals 12 00710 g006
Figure 7. Comparison of fracture surfaces with comparable ΔK at the notch, center and transition area of Material A and Material B.
Metals 12 00710 g007
Figure 8. Grain size inhomogeneity of Material B from crack propagation samples with increasing ΔK: R = 0.1; (a) coarse area—ALA grains, (b) homogeneous fine microstructure.
Metals 12 00710 g008
Figure 9. Fractography of a CT specimen for fracture toughness testing of Material B: (a) overview of complete fracture sample; (b) detailed view showing the orientation of niobium carbides on the fracture surface in the transition area of the pre-crack to the overload fracture surface.
Metals 12 00710 g009
Figure 10. Linear correlation between the parameters log C and m describing the kinetics of fatigue crack growth; the samples from the plastically deformed Material B are marked by asterisks.
Metals 12 00710 g010
Figure 11. Linear correlations between (a) the mechanical parameter UTS and the fracture mechanical parameter ΔKth, (b) the microstructural parameter ALA and the fracture mechanical parameter ΔKth; the samples from the plastically deformed Material B are marked by asterisks.
Metals 12 00710 g011aMetals 12 00710 g011b
Figure 12. Linear correlation between the microstructural parameter ALA and the fracture mechanical parameter KIC for materials produced via the standard route; the sample from the plastically deformed Material B is marked by an asterisk and does not follow this correlation.
Metals 12 00710 g012
Figure 13. No clear correlation is observed between the microstructural parameter ALA and fatigue crack growth kinetics parameter m.
Metals 12 00710 g013
Table 1. Microstructural constituents and mechanical properties from all tested materials.
MaterialECD
[µm]
ALA
[µm]
Rp0.2
[MPa]
UTS
[MPa]
KIC
[MPa√m]
Validity
Material A11.8336.2012371432128not valid
Material B9.2928.6612741466128not valid
Material C9.9929.4811741469116not valid
Material D7.6721.9713901530107valid
Table 2. Summarized results for the fatigue crack growth threshold stress intensity factor range ΔKth and the parameters C and m describing fatigue crack growth in the early Paris regime.
MaterialΔKth
[MPa√m]
C
[-]
m
[-]
Material A #18.137.41 × 10−146.91
Material A #27.901.20 × 10−136.77
Material A #38.238.91 × 10−146.94
Material B #17.966.92 × 10−146.96
Material B #27.759.55 × 10−146.90
Material B #37.511.29 × 10−126.13
Material B #47.002.69 × 10−125.92
Material C #17.713.89 × 10−169.59
Material C #27.478.51 × 10−158.25
Material C #37.645.13 × 10−158.37
Material D #17.002.75 × 10−137.11
Material D #27.504.07 × 10−158.81
Material D #36.992.24 × 10−148.13
Material D #46.842.75 × 10−169.96
Material D #57.334.90 × 10−169.87
Publisher’s Note: MDPI stays neutral with regard to jurisdictional claims in published maps and institutional affiliations.

