Article

Characteristics Analysis of Fluid Flow and Heating Rate of a Molten Bath Utilizing a Unified Model in a DC EAF

1
School of Metallurgy, Northeastern University, Shenyang 110819, China
2
State Key Laboratory of Rolling and Automation, Northeastern University, Shenyang 110819, China
*
Authors to whom correspondence should be addressed.
Metals 2022, 12(3), 390; https://doi.org/10.3390/met12030390
Submission received: 12 January 2022 / Revised: 15 February 2022 / Accepted: 18 February 2022 / Published: 23 February 2022

Abstract

:
Herein, a 2D unified model coupling a plasma arc–molten bath–cavity in a direct current electric arc furnace was developed for a characteristic analysis of the fluid flow and heating rate of the molten bath. The ‘local thermodynamic equilibrium–diffusion approximation’ method was employed for the physical phenomenon at the plasma arc/molten bath interface, and the volume-of-fluid method was used to track the free surface. After ensuring model validation, the formation processes of the cavity and the flow field and heating rate of the molten bath were investigated by utilizing the unified model. The numerical results showed that the formation processes of the cavity contained three stages, namely the expansion, compression, and dynamic equilibrium stages. The arc pressure and plasma shear stress both contributed to the cavity formation, and dominated the expansion of the cavity depth and diameter, respectively. Under plasma arc jet impingement, there were two flow patterns inside the molten bath: (i) a clockwise eddy on the top surface and lateral part of molten bath dominated by plasma shear stress, and (ii) a counter-clockwise eddy in the bottom part of the molten bath dominated by the electromagnetic force. Meanwhile, the main heated region of the molten bath with the plasma arc–molten bath–cavity coupling was in the radial range of 0.2–0.6 m, and a high-temperature region was formed on the top surface of the molten bath caused by plasma shear stress.

1. Introduction

Recently, increasingly efficient technologies have been developed to reduce the tap-to-tap time of electric arc furnace (EAF) steelmaking [1,2,3], including the ‘large hot heel’ operation and scrap-preheating technology. The large hot heel operation [4,5,6], as one of efficient technologies, is becoming increasingly important in modern direct current (DC) EAFs. In this process, a large amount of molten steel is left in the bottom of the furnace from the prior heating to assist in the melting of fresh scrap entering the DC EAF [5]. In the large hot heel operation, the plasma arc is utilized to heat the molten steel at first, and then to melt the scrap through a heat exchange between the molten steel and scrap. Therefore, the fluid flow and heating rate of the molten steel is dominated by both complex energy and momentum transfer at the interface between the molten steel and plasma arc [7,8,9,10,11,12,13], which is closely related to the steelmaking productivity of EAFs using a large hot heel operation.
It is well known that both the plasma arc and molten bath interact with each other during the steelmaking process in a DC EAF. When the plasma arc impinges on the molten bath surface, it exerts intensive heat and pressure on the surface. The high pressure of the plasma arc jet with high velocity leads to a cavity gradually forming on the deformable interface between the plasma arc and molten bath. When the shape of cavity evolves, the flow field and temperature field of the plasma arc change correspondingly, which in turn cause a variation in the flow field and temperature field in the molten bath [14]. It can be seen that the coupled characteristics of a plasma arc–molten bath–cavity is one of the key factors influencing the thermophysical transfer between the plasma arc and molten bath. However, it is difficult to experimentally determine the coupled characteristics—numerical simulations are more useful to investigate it [3]. Thus, it is essential to develop a unified model coupling the plasma arc, molten bath, and cavity in a DC EAF.
Recently, many researchers have investigated the complex process of a plasma arc impinging on a molten bath through numerical analysis in a DC EAF [15,16,17,18]. In order to simplify the numerical model, the physical field distribution of the plasma arc and molten bath were separately investigated in the model. Some investigators just modeled the plasma arc without considering the molten bath [19,20,21], while others focused on developing models of the molten bath while excluding the plasma arc [22,23,24]. However, in the unified models that included the plasma arc and molten bath that were reported for the coupled thermophysical behavior, the flat surface of the molten bath was assumed [18]. In short, all these models using a DC EAF assumed the interface was flat, and the interface deformation was not taken into account. These assumptions led to the neglect or simplification of some forces (such as arc pressure and plasma shear stress) in the models. However, these forces are closely related to the momentum and heat transfer between the plasma arc and molten bath. Therefore, the characteristics of the fluid flow and heating rate in a molten bath while considering the interface deformation need to be discussed in depth.
In this work, a 2D unified model coupling a plasma arc–molten bath–cavity in a DC EAF is presented. The ‘local thermodynamic equilibrium (LTE)–diffusion approximation’ method was employed for the physical phenomenon at the plasma arc/molten bath interface [25], and the volume-of-fluid (VOF) method was used to track the free surface. After verification of the plasma arc–molten bath–cavity unified model, the formation processes of the cavity, as well as the flow field and heating rate of the molten bath, were investigated in detail using the unified model.

2. Mathematical Model

2.1. Numerical Assumptions

Some assumptions were adopted to simplify the numerical calculation:
  • The plasma arc was optically thin and it satisfied the LTE state.
  • The plasma arc was free-burning in an air atmosphere without considering the foamy slag. Its properties were treated as temperature-dependent, because the air density–temperature behavior showed considerable departure from the ideal gas law under plasma arc conditions [23].
  • The interface between the plasma arc and molten bath was flat under the initial conditions, and its deformation was estimated by iteration of the numerical calculation.
  • The turbulence effect was considered in the whole domain [18,23,26] because the high-intensity flow field induced by the plasma arc was turbulent.
  • The molten steel evaporation at the interface was ignored for simplicity of the model.
  • Buoyance in the molten bath was formulated by a Boussinesq approximation.

2.2. Governing Equations

Mass conservation equation:
ρ t + 1 r r ρ v r r + ρ v z z = 0
where ρ is the fluid density (kg·m−3); t is the time (s); and vz and vr and are the axial and radial velocity components (m·s−1), respectively.
Momentum conservation equations:
ρ v z t + ρ v z 2 z + 1 r r ρ v r v z r = P z + z 2 μ v z z + 1 r r r μ v z r + v r z + ρ g + j r B θ + F
ρ v r t + ρ v z v r z + 1 r r r ρ v r 2 = P r + 1 r r 2 r μ v r r + z μ v r z + v z r 2 μ v r r 2 j z B θ
where P is the pressure (Pa); μ is the viscosity (Pa·s); jz and jr and are the axial and radial current density components (A m−2), respectively; Bθ is the azimuthal component of the magnetic field (T); g is the acceleration of gravity (m·s−2); and F is the additional momentum source term with different expressions in different domains.
Energy conservation equation:
ρ c p T t + ρ c p v z T z + 1 r ρ c p v r T r = 1 r r r k T r + z k T z + j r 2 + j z 2 σ + S
where cp is the specific heat (J·kg−1·K−1); T is the temperature (K); k is the thermal conductivity (W·m−1·K−1); σ is the electrical conductivity (Ω−1·m−1); and S is the additional energy source term with different expressions in different domains.
In the case of additional source terms in momentum equations, the thermal buoyancy was considered to be in the molten bath. For the additional energy source term, the enthalpy transport of electron and radiation losses were considered in the plasma arc. The additional source terms in Equations (2) and (4) are expressed as:
In   the   plasma   arc :   F   = 0 ,   S = 5 2 K b e j z T z + j r T r S R
In   the   molten   bath :   F   = ρ g β ( T T ref ) ,   S = 0
where Kb is the Boltzmann constant (W·m−2·K−4); e is the electron charge (C); and SR represents the radiation losses, which could be modeled by a radiation loss per unit volume, as the plasma arc was optically thin [18]. The radiation coefficient was taken from the literature [27]; β is the thermal expansion coefficient (K−1) and Tref is the reference temperature of molten steel (K).
The current continuity equation:
z σ φ z + 1 r r r σ φ r = 0
The axial and radial current density can be obtained from Ohm’s law:
j z = σ φ z ,   j r = σ φ r
The magnetic field is evaluated using Maxwell’s equation:
z A z z + 1 r r r A z r = μ 0 j z
z A r z + 1 r r r A r r = μ 0 j r + A r r 2
The azimuthal component of the magnetic field can be obtained from the below relation:
B θ = A r z A z r
where φ is the electrical potential (V); Az and Ar are the axial and radial magnetic potential vector, respectively; and μ0 is the magnetic permeability, and its value is 4π × 10−7 H·m−1 [18].
In addition, the VOF technique was used to track the plasma arc/molten bath interface. The different phases were treated as a continuum sharing a single set of momentum-conservation equations. The volume fraction of each phase in each cell was calculated with Equations (12) and (13):
α q t + × α q v = 0
q 1 n α q = 1
where αq is the volume fraction of phase q and v is the velocity of phase q.
The physical properties of the fluids were calculated with the volume fraction for each of the phases:
ϕ = ϕ 1 α 1 + 1 α 2 ϕ 2
Additionally, the renormalization group (RNG) model was utilized to calculate the turbulent viscosity [26,28,29,30]. Transport equations for the turbulent kinetic energy (k) and the turbulent rate of dissipation (ε) are given as Equations (15) and (16), respectively:
ρ k t + ρ v k = α k μ eff k + G k + G b ρ ε Y M + S K
ρ ε t + ρ v ε = α k μ eff ε + C 1 ε ε k G k + C 3 ε G b C 2 ε ρ ε 2 k + S ε
where Gk is the generation of turbulence kinetic energy due to the mean velocity gradients; Gb is the turbulence kinetic energy generated by buoyancy; YM is the contribution of the fluctuating dilatation-incompressible turbulence to the overall dissipation rate; SK and Sε are source terms for k and ε, respectively; C1ε, C2ε, and C3ε are constants; αk and αε are the turbulent Prandtl number of k and ε, respectively; and μeff is the effective viscosity.

2.3. Computational Domain

The 2D plasma arc–molten bath–cavity unified model in a 12 t DC EAF is shown in Figure 1. There were two calculation domains: the plasma arc domain (AaBCDEIA) and the molten bath domain (EFGHIE). AB is the graphite cathode and BC is the graphite electrode’s side. CD and DE correspond to roof and furnace walls, respectively, while EF and FG are the walls of molten bath. GH is the anode electrode, AH is the axis, and EI is the initial flat interface between the plasma arc and molten bath. When the plasma arc jet impinged onto the molten bath surface, EI depressed and became a free surface that was traced by the VOF method.

2.4. Boundary Conditions

2.4.1. Interface of Plasma Arc and Molten Bath

There was a thin layer at the interface of the plasma arc and molten bath. Inside the thin layer, the electron density was unequal to the positive ion density, and the electron temperature was different from the heavy particle temperature [20,31,32,33,34]. So, this layer could not be assumed to be in an LTE state. However, it was impossible to accomplish the investigation of the interfacial physical phenomenon between the plasma arc and molten bath by optimizing the mesh or others due to the very thin non-LTE layer (less than 2 × 10⁻⁶ m thickness). In order to consider the influence of this thin layer in a unified model, the LTE–diffusion approximation method was used to deal with the plasma arc/molten bath interface [32,33,34]. By adopting this method, the ambipolar diffusion effects were indirectly considered with a particular mesh size at the interface that was equal to the diffusion length of the electrons. According to theories in the literature [32,35], in this work, a mesh size of 0.15 mm at the estimated region near the plasma arc/molten bath interface was selected. The LTE–diffusion approximation method ensured the current continuity and greatly reduced the computation time.

2.4.2. Heat and Momentum Transfer at the Interface

The interface of the plasma arc/molten bath required special treatment. In this work, the total heat flux of the interface was composed of three contributions; i.e., the heat of convection and conduction from the plasma arc, and condensation heat from electrons. The convection and conduction heat flux were determined using the uniform energy conservation equation in the whole domain. However, to determine the condensation heat by electrons, the following source terms were added at the interface of plasma arc/molten bath:
S h = j a φ a + V a
where ja is the current density of the molten bath surface (A·m−2); Va is the anode fall; and φa is the work function. In the current model, Va and φa were both assumed to be 4 V [18,20].
Three forces acted on the molten bath surface. The arc pressure was induced by the large gradient of the plasma arc velocity, and the plasma shear stress was applied by the plasma arc jets on the surface of the molten bath. These were calculated by solving the uniform momentum-conservation equations in the whole domain. The surface tension played an important role in the movement of the plasma arc/molten bath interface. Hence, a continuum surface force (CSF) model proposed by Brackbin et al. [36] was implemented to consider the effects of surface tension.

2.4.3. Cathode Spot of Graphite Electrode

In the numerical model, the end face of the graphite electrode was chosen as flat. The cathode spot was fixed at the electrode center of the end face and its movement was ignored.
Inside the cathode spot [18,20,23], the current density was assumed to be a parabolic function of the radius, as determined by the following equation:
j = 2 J C 1 r R C 2
The radius of cathode spot is defined as:
R C = I π J C 0.5
where j is the current density inside the cathode spot (A·m−2); JC is the average current density of cathode spot, and is assumed to be 4.4 × 10⁷ A·m−2; I is the arc current (A); and RC is the radius of the cathode spot (m).

2.4.4. External Boundary Conditions

The detailed external boundary conditions are shown in Table 1 [18]. In the current simulations, a no-slip boundary condition was applied on all walls. A constant wall temperature of 1573 K was applied to the roof (CD) and the furnace wall (DE). In order to simulate the heat transfer of the molten bath, a constant temperature of 1773 K was applied to the wall (EF and FH). A constant temperature of 1800 K was applied to the electrode surface (BC). Inside the cathode spot (Aa), a constant temperature of 4000 K was applied. Outside the cathode spot (aB), a constant temperature of 1800 K was applied. The electric potential was set to zero at the surfaces of graphite electrode anode (GH). Moreover, its gradient was set to zero at the other external boundaries, except for the surface of cathode spot (Aa), where j = 2 J C 1 r R C 2 . The magnetic vector potential was set to zero at the furnace wall (DE) and the side surfaces of the molten bath (EF). Its gradient was set to zero at the other external boundaries.

2.5. Solution Methods and Material Properties

The governing equations were solved by the computational fluid dynamics (CFD) commercial software Fluent (ANSYS, Inc., Canonsburg, PA, USA) enhanced with a user-defined function (UDF). The Pressure Implicit with Splitting of Operators (PISO) algorithm was used for achieving the pressure–velocity coupling scheme. The compressive interface-capturing scheme was adopted for the arbitrary meshes scheme. The transport equations were all discretized by a second-order upwind scheme. The convergence criteria for the sum of normalized residues was set to 10−3 for the continuity and momentum equations, and 10−6 for the electromagnetic and energy equations. In order to ensure the convergence criterion, the initial time step size was set to 10−6 s. Thereafter, an adaptive method based on a global Courant number of 1 was chosen for the time steps. The calculations were carried out on a workstation with a 3.0 GHz Intel Xeon Gold 6154 CPU (Intel Corporation, Santa Clara, CA, USA). Normally, more than two weeks were needed for a simulation of a complete case.
In order to test the mesh sensitivity, the comparisons of cavity depth under an arc current of 10 kA and an arc length of 300 mm were performed between coarse (168,978), medium (323,824), and fine (573,616) meshes. The calculated cavity depth of the coarse mesh was 20.8 mm, which was 18% different from the result of the medium mesh (25.6 mm) calculation. The variation between the medium and fine meshes (26.5 mm) was decreased by less than 5%. The cavity depth deviation between the medium and fine mesh was acceptable. Thus, a medium mesh with 323,824 grids was used in the present study, because the fine mesh required a long time to solve the equation.
The thermodynamic and transport properties of the plasma arc (air) [18,37,38,39,40,41], such as density, specific heat, dynamic viscosity, thermal conductivity, electric conductivity, and radiation coefficient [27], were taken from published literature, and are shown in Figure 2. The thermophysical properties of the molten steel used for simulation are listed in Table 2 [18,42].

3. Results and Discussion

3.1. Model Validation

Based on the simulated results obtained by the 2D plasma arc–molten bath–cavity unified model, a cavity was formed on the deformable interface between the plasma arc and molten bath as the plasma arc jet impinged on the molten bath surface. To validate the unified model, a crucial parameter of the cavity, namely the cavity depth, was selected [43,44,45,46,47]. The simulated results of the cavity depth obtained by the unified model were compared with the measured results of Ahler [43,44] and the calculated results of Maecker [45]. The cavity depth (H) was determined using Maecker’s formula as follows [44,45,46,47]:
H = μ 0 4 π I a 2 ln R R C 9.8 ρ l π R 2
where RC is the radius of cathode spot, and R C = I a 4.4 × 10 7 × 1 π 0.5 (m); R is the radius of plasma arc, and R = R C 1 + L R C 0.5 (m); μ0 = 4π × 10−7 H·m−1; Ia is the arc current (A); L is arc length (m); while ρ1 is the density of molten steel, and ρ1 = 7200 kg·m−3.
The simulated results were obtained by the unified model using three process parameters (case 1: 10 kA—300 mm; case 2: 15 kA—300 mm; case 3: 20 kA—300 mm) in a 12 t DC EAF. The comparison of cavity depth between the calculated results of Maecker’s formula, the measured results of Ahler, and the simulated results of the unified model are shown in Figure 3. Under the same arc length, the simulated results of the unified model were between the calculated results of Maecker’s formula and the measured results of Ahler. It was found that all of them increased with an increase in currents and showed a good consistency of regular changes with each other. However, under the same current situation, the simulated results of the unified model were larger than the results measured by Ahler. This was caused by the negligence of the following phenomena in the unified model: (a) the shape of the arc column was changing, which caused the arc thrust to not be completely perpendicular to the molten bath surface; and (b) part of the arc thrust was consumed in removing the slag. Simultaneously, the simulated data of the unified model were less than the calculated results of Maecker’s formula. The main reason was that, during the formation of the cavity, the influence of interface deformation on the arc thrust was considered in the unified model, but ignored in Maecker’s formula.
According to the above analysis, the cavity depth of the unified model was credible. It was indicated that the unified model was sufficiently accurate to investigate the characteristics of the fluid flow and heating rate of the molten bath with the plasma arc–molten bath–cavity coupled in the DC EAF.

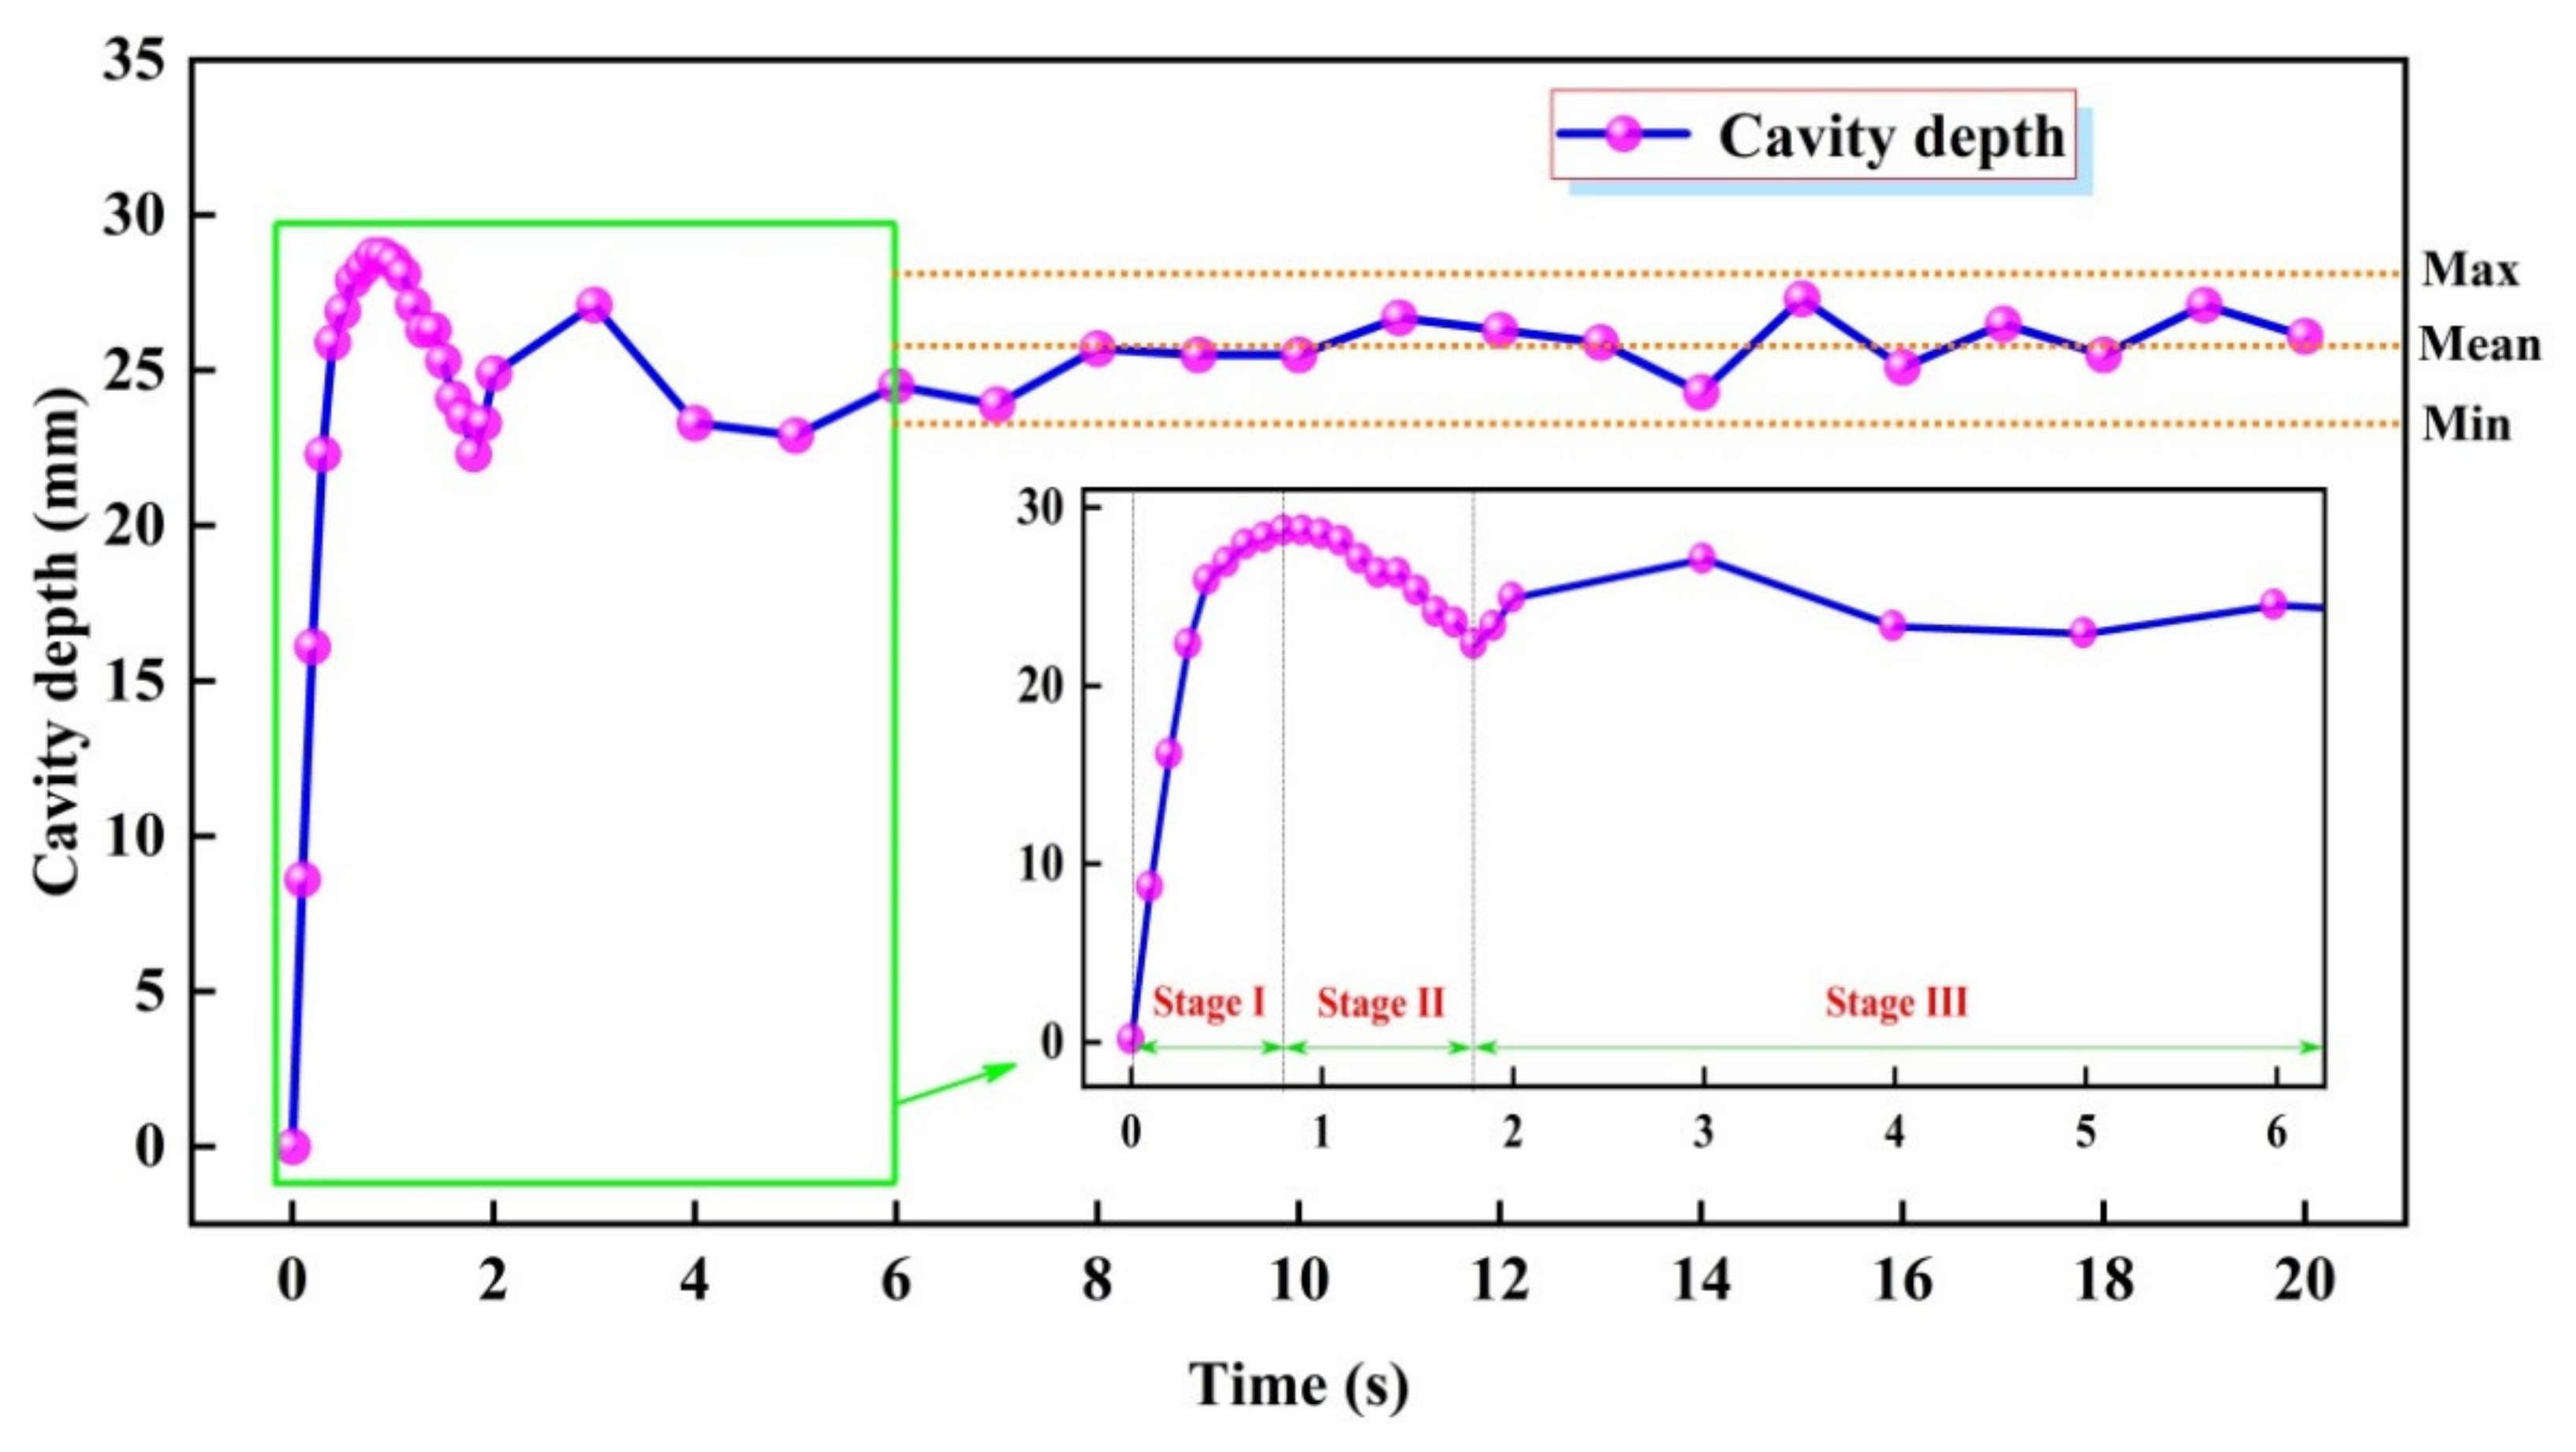
3.2. Formation Processes of Cavity

The plasma arc jet impinging on the surface of the molten bath resulted in plasma arc–molten bath interface deformation, namely the formation of a cavity. In order to investigate the formation processes of the cavity, a case (Case 1) of the unified model with an arc current of 10 kA and an arc length of 300 mm was taken as an example. Transient formation processes of the cavity in Case 1 are shown in Figure 4. The cavity depth (H) versus time in Case 1 is shown in Figure 5. An isotherm of 8000 K was selected as the arc profile [31].
The formation processes for the cavity contained Stages I (expansion stage), II (compression stage), and III (dynamic equilibrium stage). Stage I occurred immediately after the plasma arc jet impinged from the arc center on the molten bath surface. In the initial state, the molten bath surface was flat, and the arc profile was generally a bell shape. The plasma jet from the arc center impinged on the molten bath surface and flowed outward in a horizontal direction, as shown in Figure 4a. With the continuous impingement of the plasma arc jet, the interface began to deform, and a cavity was gradually formed and expanded. The plasma arc jet flowed into the molten bath and then flowed out along the tangential direction of the cavity, as shown in Figure 4b. As time progressed, the arc column became longer along with the increment in the cavity depth, as shown in Figure 4c. In Stage I, the cavity depth increased gradually, and reached the maximum of about 28.7 mm at 0.8 s, as shown in Figure 5. Owing to the influences of interface-deformation resistance, Stage II occurred. In this stage, the arc column was shortened and the cavity was compressed accordingly, as shown in Figure 4d. The cavity depth gradually decreased, and reached about 22.3 mm at 1.8 s, as shown in Figure 5. In Stage III, due to the interaction between the driving force and resistance, it was difficult for the cavity to be absolutely stable [48]. The depth of the cavity oscillated with time after 1.8 s, and the cavity depth fluctuated between 27.3 mm and 23.9 mm (mean 25.6 mm), as shown in Figure 5. The diameter (D) of the cavity changed synergistically with the depth [49,50], and remained relatively steady at about 135 ± 5 mm after 1.8 s. The variation law of cavities under the action of plasma arc jets has been shown in many studies on other jets impinging on a molten bath [48,49,50,51,52].
In order to clarify the formation mechanism of the cavity, the forces acting on the plasma arc–molten bath interface are schematically presented in Figure 6. The main forces during the formation processes of cavity included the arc pressure fs, buoyancy force fh, thermal buoyancy fT, surface tension fσ, plasma shear stress fτ, and electromagnetic force fe.
In the vertical direction, the arc pressure was downward, and was the dominant driven force of the interface deformation. Buoyancy force, thermal buoyancy, and surface tension were upward, and were the main resistance to the interface deformation. In Stage I, the cavity depth became deeper after the interface deformation because the initial arc pressure was large enough compared to the resistance [53,54,55]. However, the buoyancy force, thermal buoyancy, and surface tension [56] were also increased, which consequently suppressed the interface deformation. When at maximum cavity depth, the net forces of arc pressure, buoyancy force, thermal buoyancy, and surface tension were upward in the vertical direction, subsequently causing the cavity depth to decrease. This indicated the occurrence of Stage II. In Stage III, since the impinging velocity of the plasma arc jet was difficult to keep absolutely stable, the net forces in the vertical direction were in a dynamic equilibrium state, and the cavity depth oscillated with time [49].
In the horizontal direction, three acting forces (the horizontal component of the plasma shear stress, surface tension, and the electromagnetic force) worked for the change of cavity diameter. Similarly, the net forces in the horizontal direction were the dominant driven force for the change in cavity diameter. It should be noted that the plasma arc reached a relatively larger velocity as it flowed upward along the depressed surface, which could generate strong plasma shear stress [51]. The plasma shear stress had a major influence, while the surface tension and electromagnetic force had minor influences on the change in cavity diameter in the initial state. In Stage I, the net force was outward because the plasma shear stress in the horizontal direction was outward, and the diameter of the cavity became wider. In Stage II, the net force in the horizontal direction was inward because the horizontal components of surface tension and electromagnetic force were increased, and the diameter of the cavity was compressed. In Stage III, the net force in the horizontal direction was in a dynamic equilibrium state, and the cavity diameter oscillated with time [49,50].
In order to obtain the variation law of cavity depth with process parameters in the unified model, the linear regression equations of cavity depth with an arc current were fitted, as shown in Figure 3. The cavity depth obtained by the unified model was H = 4.42 × 10⁻¹¹ × I2 + 2.92 × 10⁻⁶ × I − 8.07×10⁻³. The cavity depth obtained by Maecker’s formula was H = 4.91 × 10⁻¹¹ × I2 + 3.25 × 10⁻⁶ × I − 6.46 × 10⁻³. Although there was a slight deviation in the cavity depth between them, they maintained a very consistent variation law. This was mainly because the influence of interface deformation on the arc thrust was considered in the unified model but ignored in Maecker’s formula. Therefore, in order to more accurately predict the variation in cavity depth with process parameters, the formula for cavity depth can be modified as follows:
H = α μ 0 4 π I a 2 ln R R C 9.8 ρ l π R 2
where the correction coefficient α is 0.8~0.9, and is preferably 0.85.

3.3. Flow Field of Molten Bath

A fully developed flow was required for the investigation of the flow field of the molten bath under plasma arc jet impingement. To estimate the changes in flow field of the molten bath, a velocity-monitoring method [49,57,58] was applied to monitor the flow velocity of the molten steel. Three points were set in the molten bath to monitor changes in velocity, as shown in Figure 7.
It can be seen that Point-A had the highest mean velocity, followed by Point-B and Point-C. Point-A was close to the bottom of the cavity, and its velocity sharply fluctuated over time. There were less fluctuations in velocity during the whole period at Point-B and Point-C. These results indicated that there was no steady state in the molten bath. This was because the net forces acting on the interface of the plasma arc and molten bath were in a dynamic equilibrium state [49,50]. After 80 s, the fluctuations in velocity at each point were relatively stable, as shown in Figure 7. This meant that the flow patterns of the molten bath were defined.
The flow field in the plasma arc domain and molten bath domain at 100 s are shown in Figure 8. It can be seen that the plasma arc jet impinged downward on the molten bath surface, then flowed upward and outward along the cavity, as shown in Figure 8a. On the molten bath surface, the plasma arc jet flowed horizontally outward, driving the molten steel to flow to the lateral wall [55]. Inside the molten bath, two flow patterns were observed: (i) a clockwise eddy on the top surface and lateral part of the molten bath, and (ii) and a counter-clockwise eddy in the bottom part of the molten bath, as shown in Figure 8b.
Based on the direction of the main driving forces and the flow field of the molten bath with a fully developed flow, the flow patterns of the molten bath under plasma arc jet impingement were determined [53,54,55], as shown in Figure 9. In flow pattern 1 inside the cavity, the plasma arc jet flowed downward into the molten bath, and then flowed outward along the cavity. It was dominated by the arc pressure. In flow pattern 2 on the top surface and lateral part of molten bath, the plasma arc jet drove the molten steel to flow to the lateral wall, and a clockwise eddy was formed inside the molten bath. Both the plasma shear stress and thermal buoyance contributed to the formation of the flow pattern, but this was dominated by the plasma shear stress. In flow pattern 3 at the bottom of molten bath, the molten steel flowed inward and downward, and a counter-clockwise eddy was formed inside the molten bath. As is known, the electromagnetic force inside the molten bath enabled the molten steel to flow inward and downward [17,18,20,55]. Accordingly, the counter-clockwise eddy was dominated by the electromagnetic force.

3.4. Heating Rate of Molten Bath

Figure 10 and Figure 11 show the heating rate of the molten bath as investigated by the plasma arc–molten bath–cavity coupling model (with interface deformation) and the plasma arc–molten bath coupling model (without interface deformation). For the plasma arc–molten bath–cavity coupling model, the heating rate of the molten bath increased first, and then decreased from the center to the furnace wall. The main heated region was in a radial range of 0.2–0.6 m, as shown in Figure 10a,c. A high-temperature region was formed on the top surface of molten bath, as shown in Figure 11a. However, in the plasma arc–molten bath coupling model, the heating rate of the molten bath decreased from the center to the furnace wall. The main heated region was only concentrated below the plasma arc, in a radial range of 0–0.1 m, as shown in Figure 10b,d. A high-temperature region was formed just below the plasma arc, as shown in Figure 11b. This phenomenon in the plasma arc–molten bath coupling model was consistent with previous models without interface deformation [18,20,22,23,24,26].
It is well known that the heating rate of a molten bath is closely related to the flow patterns of the molten bath. For the plasma arc–molten bath–cavity coupling model, the flow pattern on the top surface and lateral part of the molten bath dominated by the plasma shear stress was a clockwise eddy (as shown in Figure 9), which promoted the high-temperature molten steel, after heat exchange with the plasma arc, to flow along the radial direction [53,54]. For the plasma arc–molten bath coupling model, the flow pattern in the molten bath followed a counter-clockwise eddy in the molten bath center that was just below the plasma arc, which promoted the high-temperature molten steel to flow along the axial direction. Ultimately, compared with the plasma arc–molten bath coupling model, the plasma arc–molten bath–cavity coupling model of the main heated region and the high-temperature region was obviously larger.
To sum up, in the model with interface deformation, the plasma shear stress promoted the energy transportation in the radial direction, leading to a high-temperature region on the top surface of the molten bath. This characteristic of the heating rate of the molten bath was different from that of the model without interface deformation. For steelmaking in a DC EAF, the temperature distribution of the molten bath in the process of heating is very important. A plasma arc–molten bath–cavity coupling model with interface deformation provided more accurate information on the temperature distribution law of the molten bath. It provided theoretical guidance for the selection of the scrap-falling area in the molten bath, homogenization of the molten bath temperature, and improvement of the melting efficiency in a DC EAF [12,59,60].
The fluid flow and heat transfer in industrial DC EAFs are very complicated, including the plasma arc jet, oxygen jet, bottom-blowing gas stirring, foam slag, scrap melting, and so on. In this work, only the influence of the plasma arc jet on the fluid flow and heating rate of the molten bath was considered and analyzed. The unified model established in this work was coupled with electromagnetism, two-phase flow, and heat transfer. If more numerical modules were to be added, the cost and time of computation would be large, and the process would be difficult. Here, we want to emphasize that this work was more biased toward basic research than industrial applications. Further study is needed to develop more complex numerical models for industrial applications.

4. Conclusions

In this work, a 2D unified model coupling plasma arc–molten bath–cavity in a DC EAF was developed. After verification of the unified model, the formation processes of the cavity, as well as the flow field and heating rate of the molten bath, were investigated by utilizing the unified model. The main conclusions are as follows:
  • The formation processes of cavity contained three stages, namely the expansion, compression, and dynamic equilibrium stages. The arc pressure and plasma shear stress both contributed to the cavity formation, and dominated the expansion of the cavity’s depth and diameter, respectively.
  • The variation law of the cavity depth with different process parameters was H = α μ 0 4 π I a 2 ln R R C 9.8 ρ l π R 2 , α = 0.8~0.9, preferably 0.85.
  • Under plasma arc jet impingement, there were two flow patterns inside the molten bath: (i) a clockwise eddy on the top surface and lateral part of the molten bath dominated by plasma shear stress, and (ii) a counter-clockwise eddy in the bottom part of the molten bath dominated by the electromagnetic force.
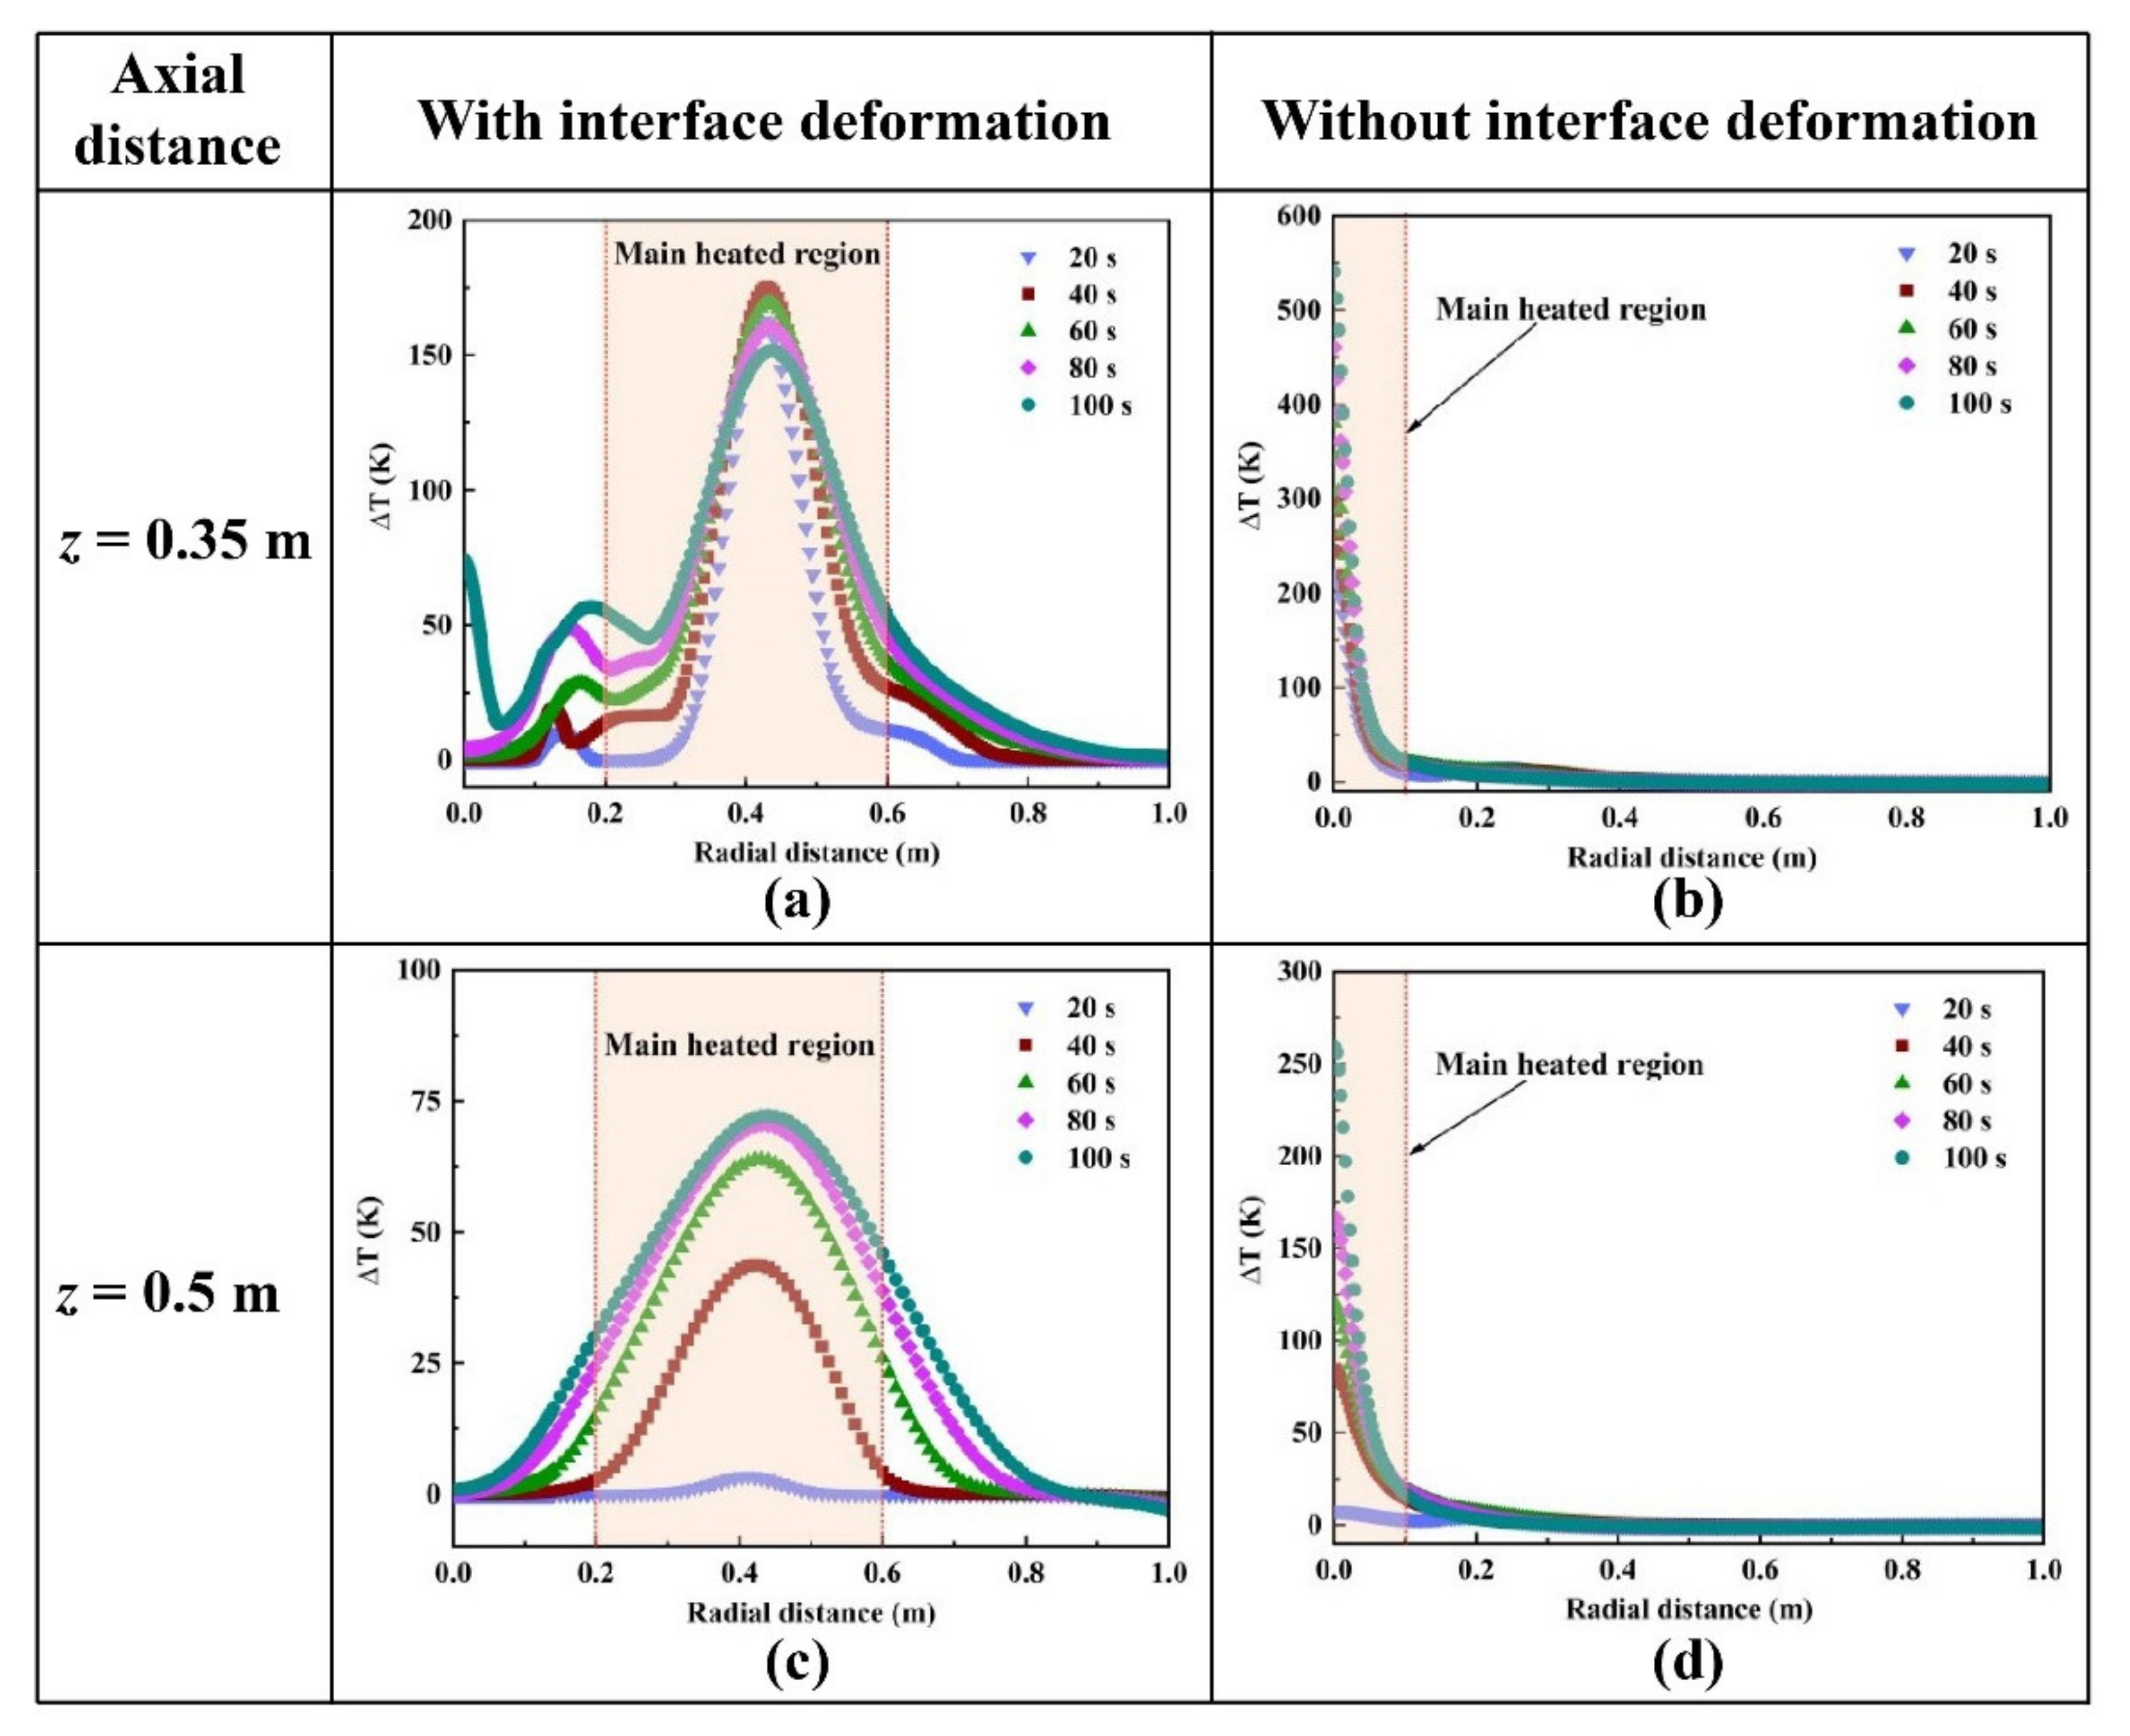
  • The characteristic of the heating rate of the molten bath was closely related to the interface deformation. In the radial direction, the main heated region was 0.2–0.6 m, far away from the axis of the plasma arc, and a high-temperature region was formed on the top surface of the molten bath due to the energy transportation promoted by the plasma shear stress.

Author Contributions

Conceptualization, C.Y. and H.Z.; methodology, C.Y.; software, C.Y., H.Z. and T.P.; validation, C.Y.; formal analysis, C.Y.; investigation, C.Y.; resources, C.Y.; data curation, C.Y.; writing—original draft preparation, C.Y.; writing—review and editing, C.Y., Z.J. and H.Z.; visualization, C.Y. and H.Z.; supervision, H.Z.; project administration, Z.J.; funding acquisition, Z.J. All authors have read and agreed to the published version of the manuscript.

Funding

This work was supported by the National Key R&D Program of China (grant no. 2017YFB0304205).

Institutional Review Board Statement

Not applicable.

Informed Consent Statement

Not applicable.

Data Availability Statement

All data generated or analyzed during this study are included in this published article.

Conflicts of Interest

The authors declare no conflict of interest.

Nomenclature

A r Radial magnetic potential vector
A z Axial magnetic potential vector
B θ Azimuthal component of the magnetic field
c p Specific heat
DThe diameter of cavity
e Electron charge
HCavity depth
I Arc current
J C Average current density in the cathode spot
k b Stefan–Boltzmann constant
L Arc length
R C The radius of the cathode spot
S R Radiation loss
T Temperature
t Time
V a Anode fall
v r Radial velocity component
v z Axial velocity component
Greek symbols
α q Volume fraction of the qth phase
β Thermal expansion coefficient
μ Dynamic viscosity
μ 0 Permeability of vacuum
μ eff Effective viscosity
ρ Mass density
σ Electric conductivity
φ Electric potential
φ a Work function
Abbreviations
CFDComputational fluid dynamics
CSFContinuum surface force
DCDirect current
EAFElectric arc furnace
LTELocal thermodynamic equilibrium
RNGRenormalization group
UDFUser defined function
VOFVolume of fluid

References

  1. Teng, L.; Meador, M.; Ljungqvist, P. Application of New Generation Electromagnetic Stirring in Electric Arc Furnace. Steel Res. Int. 2016, 88, 1600202. [Google Scholar] [CrossRef]
  2. Hay, T.; Echterhof, T.; Visuri, V.-V. Development of an Electric Arc Furnace Simulator Based on a Comprehensive Dynamic Process Model. Processes 2019, 7, 852. [Google Scholar] [CrossRef] [Green Version]
  3. Hay, T.; Visuri, V.-V.; Aula, M.; Echterhof, T. A Review of Mathematical Process Models for the Electric Arc Furnace Process. Steel Res. Int. 2020, 92, 2000395. [Google Scholar] [CrossRef]
  4. Li, J.; Provatas, N. Kinetics of Scrap Melting in Liquid Steel: Multipiece Scrap Melting. Met. Mater. Trans. A 2008, 39, 268–279. [Google Scholar] [CrossRef]
  5. Memoli, F.; Guzzon, M.; Giavani, C. The evolution of preheating and the importance of hot heel in supersized consteel® systems. Iron Steel Technol. 2011, 9, 823–832. [Google Scholar]
  6. Toulouevski, Y.N.; Zinurov, I.Y. Analysis of technologies and designs of the EAF as an aggregate for heating and melting of scrap. In Fuel Arc Furnace (FAF) for Effective Scrap Melting; Springer: Singapore, 2017; pp. 7–39. [Google Scholar] [CrossRef]
  7. Cano-Plata, E.A.; Ustariz-Farfan, A.J.; Arango-Lemoine, C. EAF Arc Stability Through the Use of UPFCs. IEEE Trans. Ind. Appl. 2019, 55, 6624–6632. [Google Scholar] [CrossRef]
  8. Stopar, K.; Kovačič, M.; Kitak, P.; Pihler, J. Electric arc modeling of the EAF using differential evolution algorithm. Mater. Manuf. Process. 2017, 32, 1189–1200. [Google Scholar] [CrossRef]
  9. Gruber, J.C.; Echterhof, T.; Pfeifer, H. Investigation on the Influence of the Arc Region on Heat and Mass Transport in an EAF Freeboard using Numerical Modeling. Steel Res. Int. 2015, 87, 15–28. [Google Scholar] [CrossRef]
  10. Wei, G.; Zhu, R.; Tang, T.; Dong, K. Study on the melting characteristics of steel scrap in molten steel. Ironmak. Steelmak. 2018, 46, 609–617. [Google Scholar] [CrossRef]
  11. Penz, F.M.; Schenk, J. A Review of Steel Scrap Melting in Molten Iron-Carbon Melts. Steel Res. Int. 2019, 90, 1900124. [Google Scholar] [CrossRef]
  12. Xi, X.; Yang, S.; Li, J.; Wu, J.; Zhao, M.; Ye, M. Physical model experiment and theoretical analysis of scrap melting process in electric arc furnace combined blowing system. Ironmak. Steelmak. 2019, 47, 748–756. [Google Scholar] [CrossRef]
  13. Odenthal, H.-J.; Kemminger, A.; Krause, F.; Sankowski, L.; Uebber, N.; Vogl, N. Review on Modeling and Simulation of the Electric Arc Furnace (EAF). Steel Res. Int. 2017, 89, 1700098. [Google Scholar] [CrossRef]
  14. Yang, M.; Liu, H.; Qi, B. The surface depression and temperatures in molten pool with pulsed arc welding. J. Manuf. Process. 2018, 37, 130–138. [Google Scholar] [CrossRef]
  15. González, O.J.P.; Ramírez-Argáez, M.A.; Conejo, A.N. Effect of Arc Length on Fluid Flow and Mixing Phenomena in AC Electric Arc Furnaces. ISIJ Int. 2010, 50, 1–8. [Google Scholar] [CrossRef] [Green Version]
  16. Logar, V.; Škrjanc, I. Modeling and Validation of the Radiative Heat Transfer in an Electric Arc Furnace. ISIJ Int. 2012, 52, 1225–1232. [Google Scholar] [CrossRef] [Green Version]
  17. Szekely, J.; Mckelliget, J.; Choudhary, M. Heat Transfer Fluid Flow and Bath Circulation in Electric Arc Furnaces and DC Plasma Furnaces. Ironmak. Steelmak. 1983, 10, 169. [Google Scholar]
  18. Wang, F.; Jin, Z.; Zhu, Z. Numerical study of dc arc plasma and molten bath in dc electric arc furnace. Ironmak. Steelmak. 2006, 33, 39–44. [Google Scholar] [CrossRef]
  19. Fathi, A.; Saboohi, Y.; Škrjanc, I.; Logar, V. Low Computational-complexity Model of EAF Arc-heat Distribution. ISIJ Int. 2015, 55, 1353–1360. [Google Scholar] [CrossRef] [Green Version]
  20. Alexis, J.; Ramirez, M.; Trapaga, G.; Jonsson, P. Modeling of a DC Electric Arc Furnace. Heat Transfer from the Arc. ISIJ Int. 2000, 40, 1089–1097. [Google Scholar] [CrossRef]
  21. Dong, Q.; Zhang, J. Simulation of fluid flow and heat transfer in plasma ARC region of AC electric ARC furnace. In CFD Modeling and Simulation in Materials Processing 2016; Nastac, L., Zhang, L., Thomas, B.G., Zhu, M., Ludwig, A., Sabau, A.S., Pericleous, K., Combeau, H., Eds.; Springer: Cham, Switzerland, 2016; pp. 35–42. [Google Scholar] [CrossRef]
  22. Kurimoto, H.; Mondal, H.N.; Morisue, T. Analysis of Velocity and Temperature Fields of Molten Metal in DC Electric Arc Furnace. J. Chem. Eng. Jpn. 1996, 29, 75–81. [Google Scholar] [CrossRef] [Green Version]
  23. Qian, F.; Farouk, B.; Mutharasan, R. Modeling of fluid flow and heat transfer in the plasma region of the dc electric arc furnace. Met. Mater. Trans. A 1995, 26, 1057–1067. [Google Scholar] [CrossRef]
  24. Ramírez, M.; Alexis, J.; Trápaga-Martínez, L.G.; Jönsson, P.; McKelliget, J. Mathematical Modeling of Iron and Steel Making Processes. Modeling of a DC Electric Arc Furnace. Mixing in the Bath. ISIJ Int. 2001, 41, 1146–1155. [Google Scholar] [CrossRef] [Green Version]
  25. Lowke, J.J.; Tanaka, M. ‘LTE-diffusion approximation’ for arc calculations. J. Phys. D Appl. Phys. 2006, 39, 3634–3643. [Google Scholar] [CrossRef]
  26. Yao, C.-L.; Zhu, H.-C.; Jiang, Z.-H.; Pan, T. Numerical Analysis of Fluid Flow and Heat Transfer by Means of a Unified Model in a Direct Current Electric Arc Furnace. Steel Res. Int. 2021, 2000664. [Google Scholar] [CrossRef]
  27. Naghizadeh-Kashani, Y.; Cressault, Y.; Gleizes, A. Net emission coefficient of air thermal plasmas. J. Phys. D Appl. Phys. 2002, 35, 2925–2934. [Google Scholar] [CrossRef]
  28. El-Hadj, A.A.; Messaoudene, N.A. Comparison between Two Turbulence Models and Analysis of the Effect of the Substrate Movement on the Flow Field of a Plasma Jet. Plasma Chem. Plasma Process. 2005, 25, 699–722. [Google Scholar] [CrossRef]
  29. Yu, J.; Jiang, Z.; Liu, F.; Chen, K.; Li, H.; Geng, X. Effects of Metal Droplets on Electromagnetic Field, Fluid Flow and Temperature Field in Electroslag Remelting Process. ISIJ Int. 2017, 57, 1205–1212. [Google Scholar] [CrossRef] [Green Version]
  30. Liu, F.-B.; Yu, J.; Li, H.-B.; Jiang, Z.-H.; Geng, X. Numerical Simulation of the Magneto-Hydrodynamic Two-Phase Flow and Heat Transfer during Electroslag Remelting Hollow Ingot Process. Steel Res. Int. 2020, 91, 1900628. [Google Scholar] [CrossRef]
  31. Li, Y.; Wang, L.; Wu, C. A novel unified model of keyhole plasma arc welding. Int. J. Heat Mass Transf. 2019, 133, 885–894. [Google Scholar] [CrossRef]
  32. Pan, J.; Hu, S.; Yang, L.; Li, H. Simulation and analysis of heat transfer and fluid flow characteristics of variable polarity GTAW process based on a tungsten–arc-specimen coupled model. Int. J. Heat Mass Transf. 2016, 96, 346–352. [Google Scholar] [CrossRef]
  33. Wu, D.; Tashiro, S.; Hua, X.; Tanaka, M. Analysis of the energy propagation in the keyhole plasma arc welding using a novel fully coupled plasma arc-keyhole-weld pool model. Int. J. Heat Mass Transf. 2019, 141, 604–614. [Google Scholar] [CrossRef]
  34. Wu, D.; Tashiro, S.; Hua, X.; Tanaka, M. Coupled mechanisms of the keyhole, energy transfer and compositional change associated with the variable polarity plasma arc process. J. Phys. D Appl. Phys. 2020, 54, 115204. [Google Scholar] [CrossRef]
  35. Lago, F.; Gonzalez, J.J.; Freton, P.; Gleizes, A. A numerical modelling of an electric arc and its interaction with the anode: Part I. The two-dimensional model. J. Phys. D Appl. Phys. 2004, 37, 883–897. [Google Scholar] [CrossRef]
  36. Brackbill, J.U.; Kothe, D.B.; Zemach, C. A continuum method for modeling surface tension. J. Comput. Phys. 1992, 100, 335–354. [Google Scholar] [CrossRef]
  37. Capitelli, M.; Colonna, G.; Gorse, C.; D’Angola, A. Transport properties of high temperature air in local thermodynamic equilibrium. Eur. Phys. J. D 2000, 11, 279–289. [Google Scholar] [CrossRef]
  38. Dorraki, N.; Niayesh, K. Optical investigation on pre-strike arc characteristics in medium-voltage load break switches. J. Phys. D Appl. Phys. 2021, 54, 255503. [Google Scholar] [CrossRef]
  39. Träuble, F.; Millmore, S.T.; Nikiforakis, N. An improved equation of state for air plasma simulations. Phys. Fluids 2021, 33, 036112. [Google Scholar] [CrossRef]
  40. Liu, J.; Zhang, Q.; Yan, J.D.; Zhong, J.; Fang, M.T.C. Analysis of the characteristics of DC nozzle arcs in air and guidance for the search of SF6replacement gas. J. Phys. D Appl. Phys. 2016, 49, 435201. [Google Scholar] [CrossRef]
  41. Sary, G.; Dufour, G.; Rogier, F.; Kourtzanidis, K. Modeling and Parametric Study of a Plasma Synthetic Jet for Flow Control. AIAA J. 2014, 52, 1591–1603. [Google Scholar] [CrossRef]
  42. Liu, F.; Zhu, R.; Dong, K.; Bao, X.; Fan, S. Simulation and Application of Bottom-Blowing in Electrical Arc Furnace Steelmaking Process. ISIJ Int. 2015, 55, 2365–2373. [Google Scholar] [CrossRef] [Green Version]
  43. Ahlers, V.; Timm, K. Untersuehungen von Frei Brennenden Gleiehstroliehthogen Bis 12MW an Electrostahlofen. Elektrowarme Int. 1987, 45, 224–235. [Google Scholar]
  44. Yang, J.; Yan, L.; Wu, Z. Magnetohydrodynamics (MHD) applications to DC arc furnace. Iron Steel 1996, 31, 14–17. (In Chinese) [Google Scholar]
  45. Maecker, H. Plasmastrmungen in Lichtbgen infolge eigenmagnetischer Kompression. Ztschrift für Physik 1955, 141, 198–216. [Google Scholar] [CrossRef]
  46. Nanjo, T. Steelmaking EAF Equipment and High Benefit Operation; Metallurgical Industry Press: Beijing, China, 2000; p. 79. (In Chinese) [Google Scholar]
  47. Zhu, Y. Steelmaking Technology of DC Electric Arc Furnace; Metallurgical Industry Press: Beijing, China, 1997; p. 74. (In Chinese) [Google Scholar]
  48. Lee, M.; Whitney, V.; Molloy, N. Jet-liquid interaction in a steelmaking electric arc furnace. Scand. J. Met. 2001, 30, 330–336. [Google Scholar] [CrossRef]
  49. Cao, L.; Liu, Q.; Wang, Z.; Li, N. Interaction behaviour between top blown jet and molten steel during BOF steelmaking process. Ironmak. Steelmak. 2016, 45, 239–248. [Google Scholar] [CrossRef]
  50. Sun, J.; Zhang, J.; Lin, W.; Cao, L.; Feng, X.; Liu, Q. Effect of Impact Cavity Shape Induced by Supersonic Oxygen Jet on the Dynamic Characteristics of Molten Bath in Converter. Steel Res. Int. 2021, 92, 2100179. [Google Scholar] [CrossRef]
  51. Sabah, S.; Brooks, G. Splashing in Oxygen Steelmaking. ISIJ Int. 2014, 54, 836–844. [Google Scholar] [CrossRef] [Green Version]
  52. Asahara, N.; Naito, K.-I.; Kitagawa, I.; Matsuo, M.; Kumakura, M.; Iwasaki, M. Fundamental Study on Interaction between Top Blown Jet and Liquid Bath. Steel Res. Int. 2011, 82, 587–594. [Google Scholar] [CrossRef]
  53. Wu, D.; Van Nguyen, A.; Tashiro, S.; Hua, X.; Tanaka, M. Elucidation of the weld pool convection and keyhole formation mechanism in the keyhole plasma arc welding. Int. J. Heat Mass Transf. 2018, 131, 920–931. [Google Scholar] [CrossRef]
  54. Wu, D.; Tashiro, S.; Wu, Z.; Nomura, K.; Hua, X.; Tanaka, M. Analysis of heat transfer and material flow in hybrid KPAW-GMAW process based on the novel three dimensional CFD simulation. Int. J. Heat Mass Transf. 2019, 147, 118921. [Google Scholar] [CrossRef]
  55. Wang, X.; Luo, Y.; Fan, D. Investigation of heat transfer and fluid flow in high current GTA welding by a unified model. Int. J. Therm. Sci. 2019, 142, 20–29. [Google Scholar] [CrossRef]
  56. Wang, Y.; Shi, Q.; Tsai, H.L. Modeling of the effects of surface-active elements on flow patterns and weld penetration. Met. Mater. Trans. A 2001, 32, 145–161. [Google Scholar] [CrossRef]
  57. Zhou, X.; Ersson, M.; Zhong, L.; Jonsson, P. Optimization of Combined Blown Converter Process. ISIJ Int. 2014, 54, 2255–2262. [Google Scholar] [CrossRef] [Green Version]
  58. Zhou, X.; Ersson, M.; Zhong, L.; Yu, J.; Jönsson, P. Mathematical and Physical Simulation of a Top Blown Converter. Steel Res. Int. 2013, 85, 273–281. [Google Scholar] [CrossRef]
  59. Wei, G.; Zhu, R.; Dong, K.; Ma, G.; Cheng, T. Research and Analysis on the Physical and Chemical Properties of Molten Bath with Bottom-Blowing in EAF Steelmaking Process. Met. Mater. Trans. A 2016, 47, 3066–3079. [Google Scholar] [CrossRef]
  60. Deng, S.; Xu, A.; Yang, G.; Wang, H. Analyses and Calculation of Steel Scrap Melting in a Multifunctional Hot Metal Ladle. Steel Res. Int. 2018, 90, 1800435. [Google Scholar] [CrossRef]
Figure 1. Schematic illustration of calculation domain.
Metals 12 00390 g001
Figure 2. Thermodynamic and transport properties of the plasma arc: (a) density; (b) viscosity; (c) thermal conductivity; (d) specific heat; (e) electric conductivity; (f) radiation coefficient.
Metals 12 00390 g002
Figure 3. Comparison of cavity depth between the calculated results of Maecker’s formula, measured results of Ahler, and simulated results of the unified model.
Metals 12 00390 g003
Figure 4. Transient formation processes of cavity with an arc current of 10 kA and an arc length of 300 mm: (a) t = 0.01 s; (b) t = 0.4 s; (c) t = 0.8 s; (d) t = 1.8 s.
Metals 12 00390 g004
Figure 5. The cavity depth as a function of time in the unified model with an arc current of 10 kA and an arc length of 300 mm.
Metals 12 00390 g005
Figure 6. Schematic diagram of cavity-formation mechanism.
Metals 12 00390 g006
Figure 7. Velocity change in three different monitoring positions.
Metals 12 00390 g007
Figure 8. Flow fields in plasma arc and molten bath (case 1: t = 100 s): (a) plasma arc domain; (b) molten bath domain.
Metals 12 00390 g008
Figure 9. Schematic illustration of the main driving forces and flow patterns of the molten bath.
Metals 12 00390 g009
Figure 10. Heating rate of molten bath with an arc current of 10 kA and an arc length of 300 mm: (a,c) with interface deformation; (b,d) without interface deformation.
Metals 12 00390 g010
Figure 11. Temperature field in molten bath domain with an arc current of 10 kA and an arc length of 300 mm (t = 100 s): (a) with interface deformation; (b) without interface deformation.
Metals 12 00390 g011
Table 1. External boundary conditions of the model.
Boundaryν (m·s−1)Τ (Κ)φ (V)A (T·m)
Aa-4000Equation (18) A / n = 0
aB-1800 φ / n = 0 A / n = 0
BC-1800 φ / n = 0 A / n = 0
CD-1573 φ / n = 0 A / n = 0
DE-1573 φ / n = 0 0
EF-1773 φ / n = 0 0
FG-1773 φ / n = 0 A / n = 0
GH-17730 A / n = 0
where ν is the velocity, Τ is the temperature, φ is the electric potential, A is the magnetic potential vector, n is the normal vector.
Table 2. Thermophysical properties of the molten steel.
ParametersValue
Density (kg·m−3)7200
Viscosity (kg·m−1·s−1)0.0065
Thermal conductivity (W·m−1·K−1)15
Specific heat (J·kg−1·K−1)670
Thermal expansion coefficient (K−1)1.4 × 10⁻⁴
Electric conductivity (Ω−1·m−1)714,000
Surface tension (N·m−1)1.6
Reference temperature (K)1800
Anode fall, Va (V)4
Work function, φa (V)4
Publisher’s Note: MDPI stays neutral with regard to jurisdictional claims in published maps and institutional affiliations.

