1. Introduction
Ti6Al4V alloy, due to its excellent performance and attractive properties, such as high-temperature specific strength, low density, excellent creep, and corrosion resistance, is the most used commercial titanium alloy [
1]. Combining this titanium alloy with advanced ceramics, e.g., zirconia (ZrO
2) or alumina (Al
2O
3), which have high wear resistance, excellent thermal stability, or even thermal and electrical conductivity, can be interesting for applications in electronics, aerospace, nuclear and transportation industries [
2,
3]. However, the production of complex-shaped and large-sized components is complex due to the inherent brittleness of ceramics [
3]. The possibility of joining ceramic materials to metals can be an excellent option to overcome the challenges in producing this component.
For ceramic-metal joining, diffusion bonding and brazing are the most reported processes that produce a homogeneous interface and high strength joints [
4]. Brazing using Ti-based or Ag-based filler alloys or even amorphous fillers is an auspicious processing route to produce dissimilar ZrO
2 and Ti6Al4V joints [
5,
6,
7,
8,
9,
10,
11,
12,
13]. Ag-based fillers seem to be a suitable option to overcome the problems related to poor wettability and the development of residual stresses at the brazing interface. The use of these alloys requires low brazing temperatures (from 860 to 880 °C), however the shear strength of joints is reported to be as low as 52 MPa [
5]. The formation of (Ag) at the interface is rarely avoided, which is detrimental to the allowable service temperature of joints [
14]. Other brittle intermetallic compounds are generally present at the interface, such as Ti-Cu-Al. Brazing with Ti-based filler alloys allows producing joints with higher shear strength (c.a. 113 MPa) [
6]. However, higher brazing temperatures are required. The brazing temperature can be a critical issue for joining Ti6Al4V since they often exceed the β-transus of this alloy, as temperatures around or above 1000 °C are typically needed.
There are several possibilities for improving the mechanical properties of these dissimilar joints. Alloying the braze with active/reactive elements, such as Ti, to enhance the formation of phases that are chemically compatible with both the ceramic and metallic parts of the joining is a common practice. Furthermore, other alloying additions could promote the formation of more favorable phases at the interface. Another option consists of brazing with alloys designed to improve diffusion during the bonding process. For instance, Dai et al. [
7] investigated the effect of WB addition on the Ag-28Cu (wt%) filler alloy for brazing Ti6Al4V to ZrO
2. The addition of 7.5 wt% of WB promoted of joints with a shear strength of 83 MPa after processing at 870 °C. The addition of WD particles to the brazing alloy proved to be effective in relieving residual stresses, leading to the improved mechanical performance of the joints.
The use of amorphous filler alloys can also be an appropriate approach for brazing titanium alloys to ZrO
2, as shown by Liu et al. [
8,
9]. These authors studied the joining of Ti6Al4V to ZrO
2 using Ti-based amorphous filler. Brazing was performed at temperatures between 850 and 1000 °C using Ti-28Zr-14Cu-11Ni foil. The processing temperature had a significant impact on the possibility of producing defect-free interfaces. The maximum shear strength was obtained for joints processed at 850 °C for 30 min (63 MPa). In another work [
11], Ti-17Zr-50Cu amorphous brazing filler was used, and the highest shear strength (162 MPa) was obtained for joints processed at 900 °C for 10 min. Higher mechanical strength for Ti6Al4V/ZrO
2 joints was reported by Cao et al. [
12]. In this study, a NiCrSiB amorphous foil was used as a brazing filler for joining at temperatures ranging from 950 to 1050 °C, with a dwelling stage of 10 min and an applied pressure of 30 kPa. Although defect-free interfaces were produced with a shear strength of 160 MPa at 950 °C, the highest shear strength (284 MPa) value was obtained for joints processed at 1025 °C.
In previous works [
15,
16,
17], a Ti foil sputter-coated with Ag and Cu films was successfully used as filler to braze several materials systems. Specifically, this brazing filler was used to produce Al
2O
3/γ-TiAl alloy and Al
2O
3/Ti6Al4V joints [
15], as well as γ-TiAl alloy/Hastelloy [
16] and similar γ-TiAl alloy joints [
17]. In all these studies, the large formation amount of (Ag) at the interface was avoided, potentially enhancing the operating temperature of joints. In addition, the extensive formation of hard phases was also pre-vented, and consequently, the need to perform post-brazing heat treatments was avoided [
14]. The reported results were promising for the prospective use of this filler for brazing other systems of dissimilar materials, for joining ceramics to metals.
In this context, the present study aims to evaluate the use of this novel Ag-Cu sputter-coated Ti brazing filler to join ZrO2 to Ti6Al4V alloy. The interfacial microstructural and chemical features of the brazed interfaces were analyzed by scanning electron microscopy and energy dispersive X-ray spectroscopy. Vickers microhardness and room temperature shear tests were used to evaluate the mechanical strength of joints.
3. Results
The interfacial microstructural of joints is rather complex and strongly influenced by the brazing temperature.
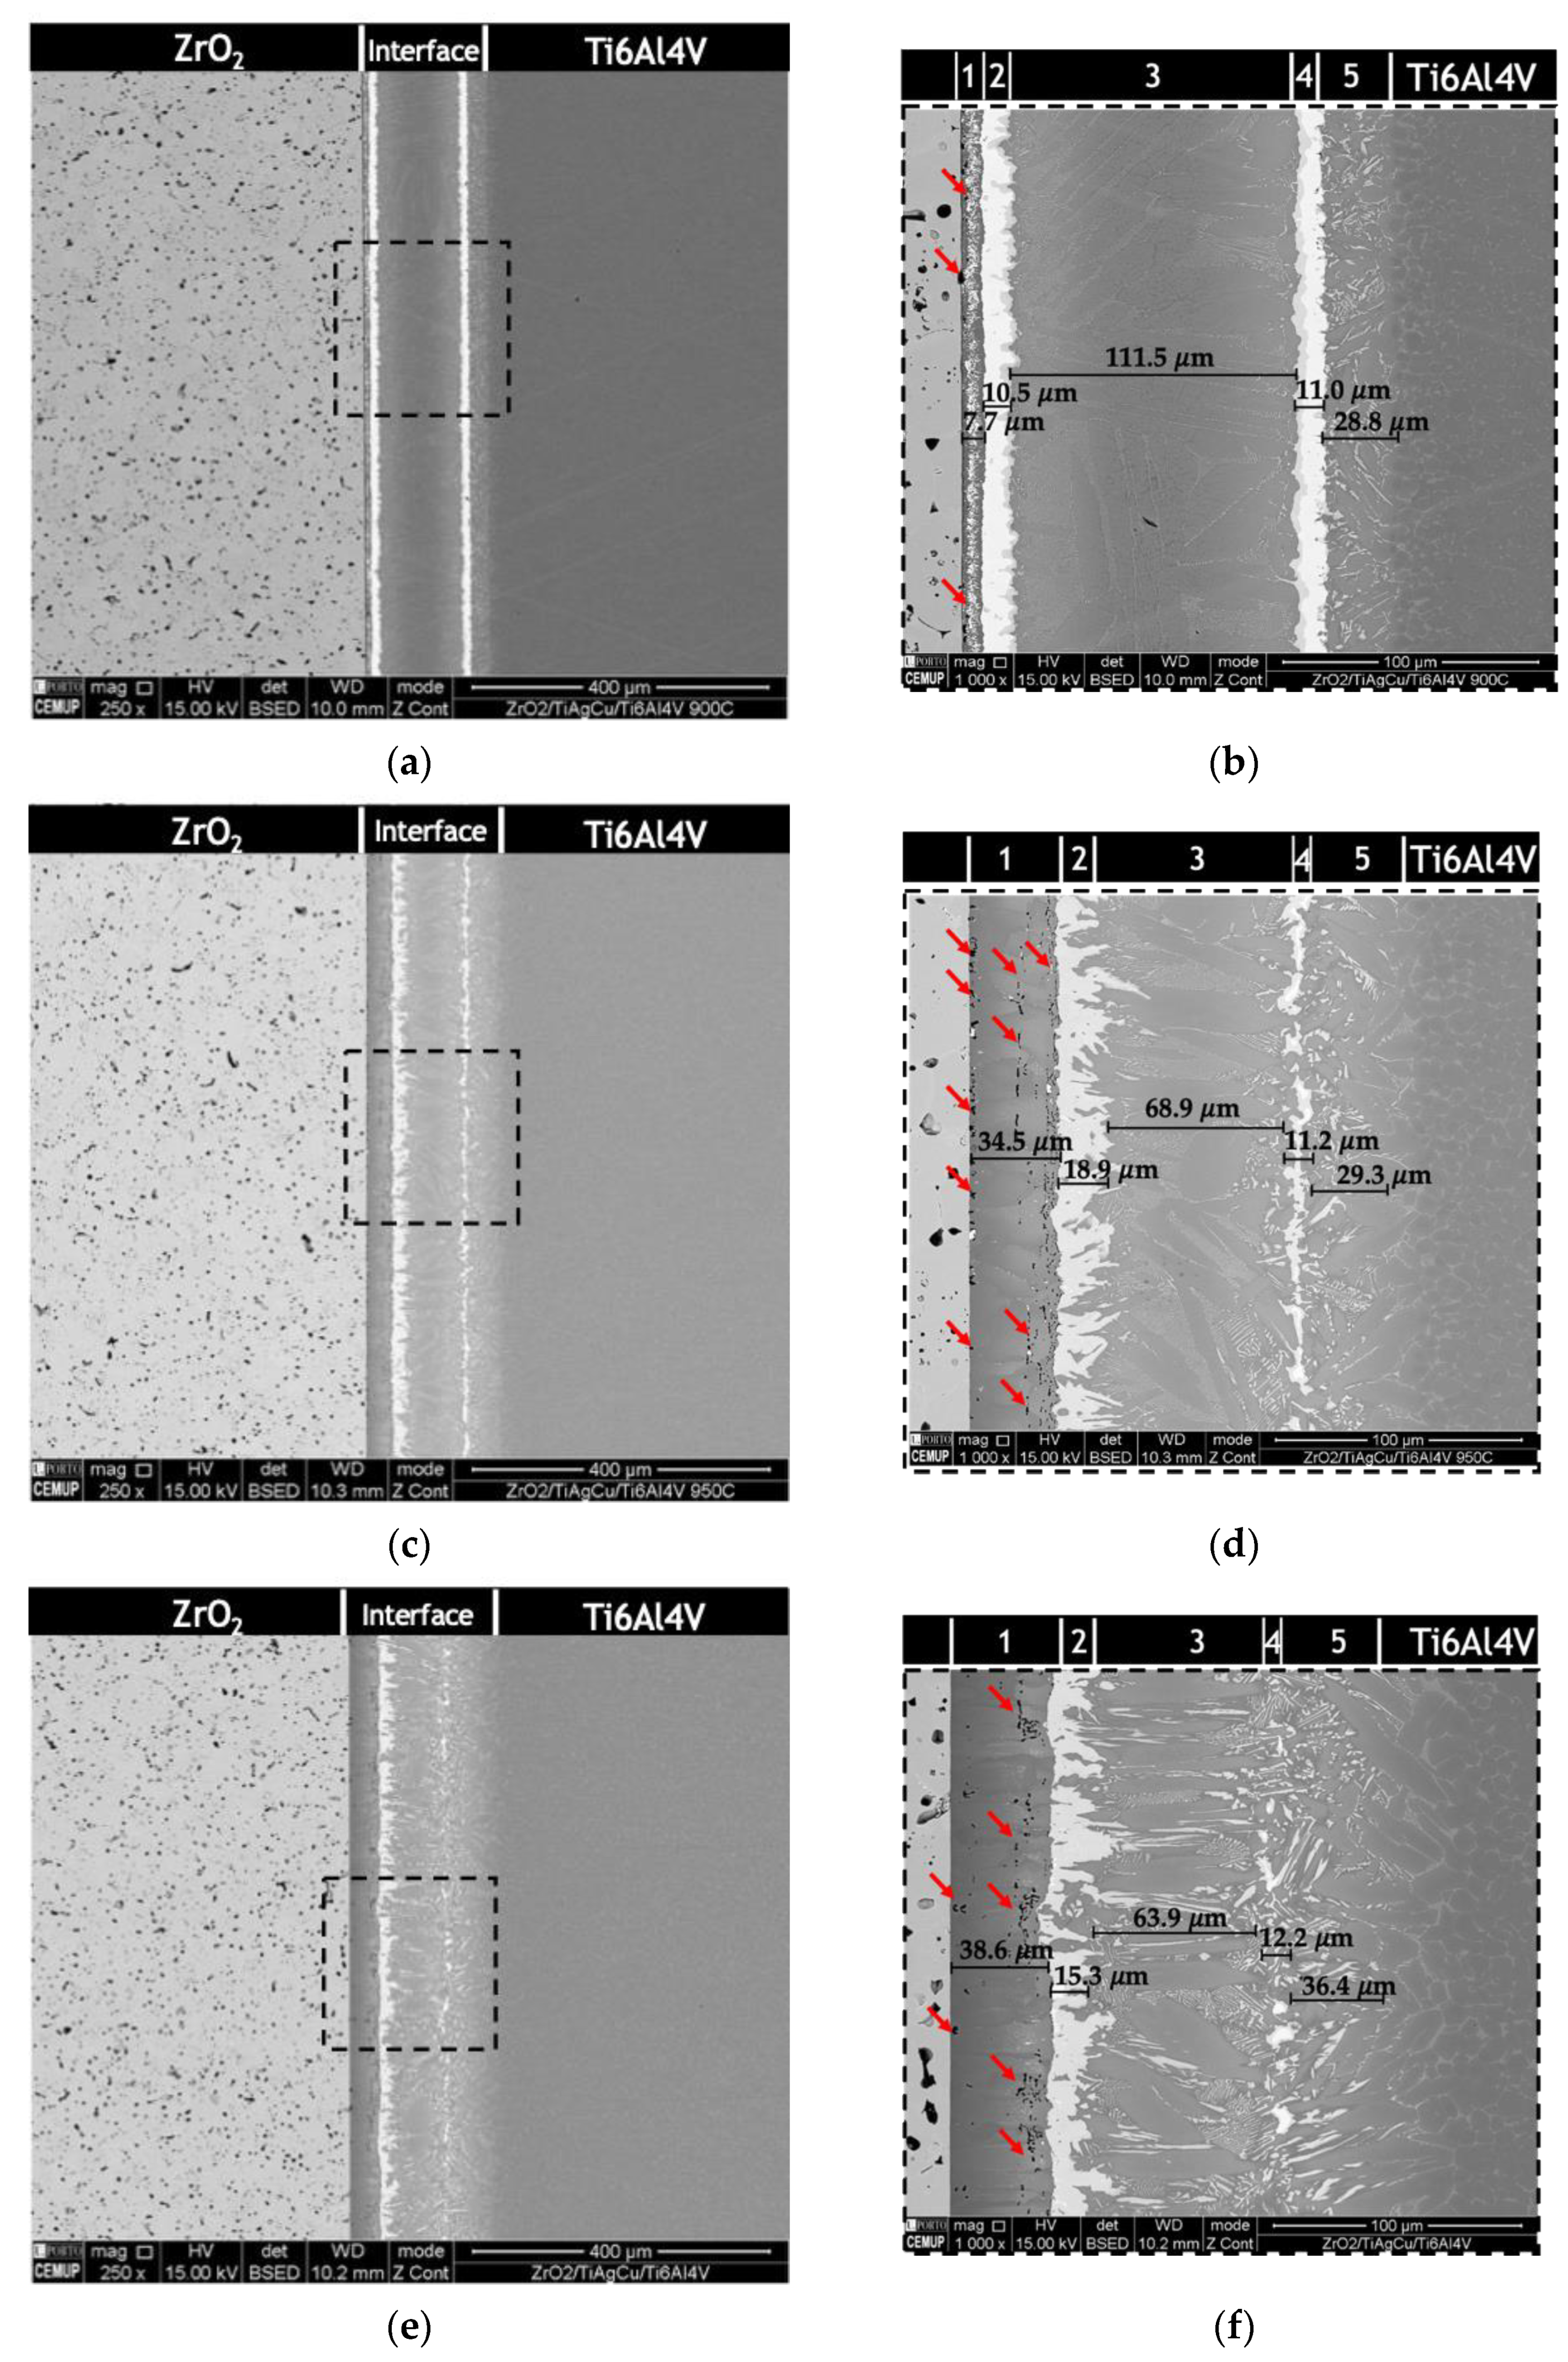
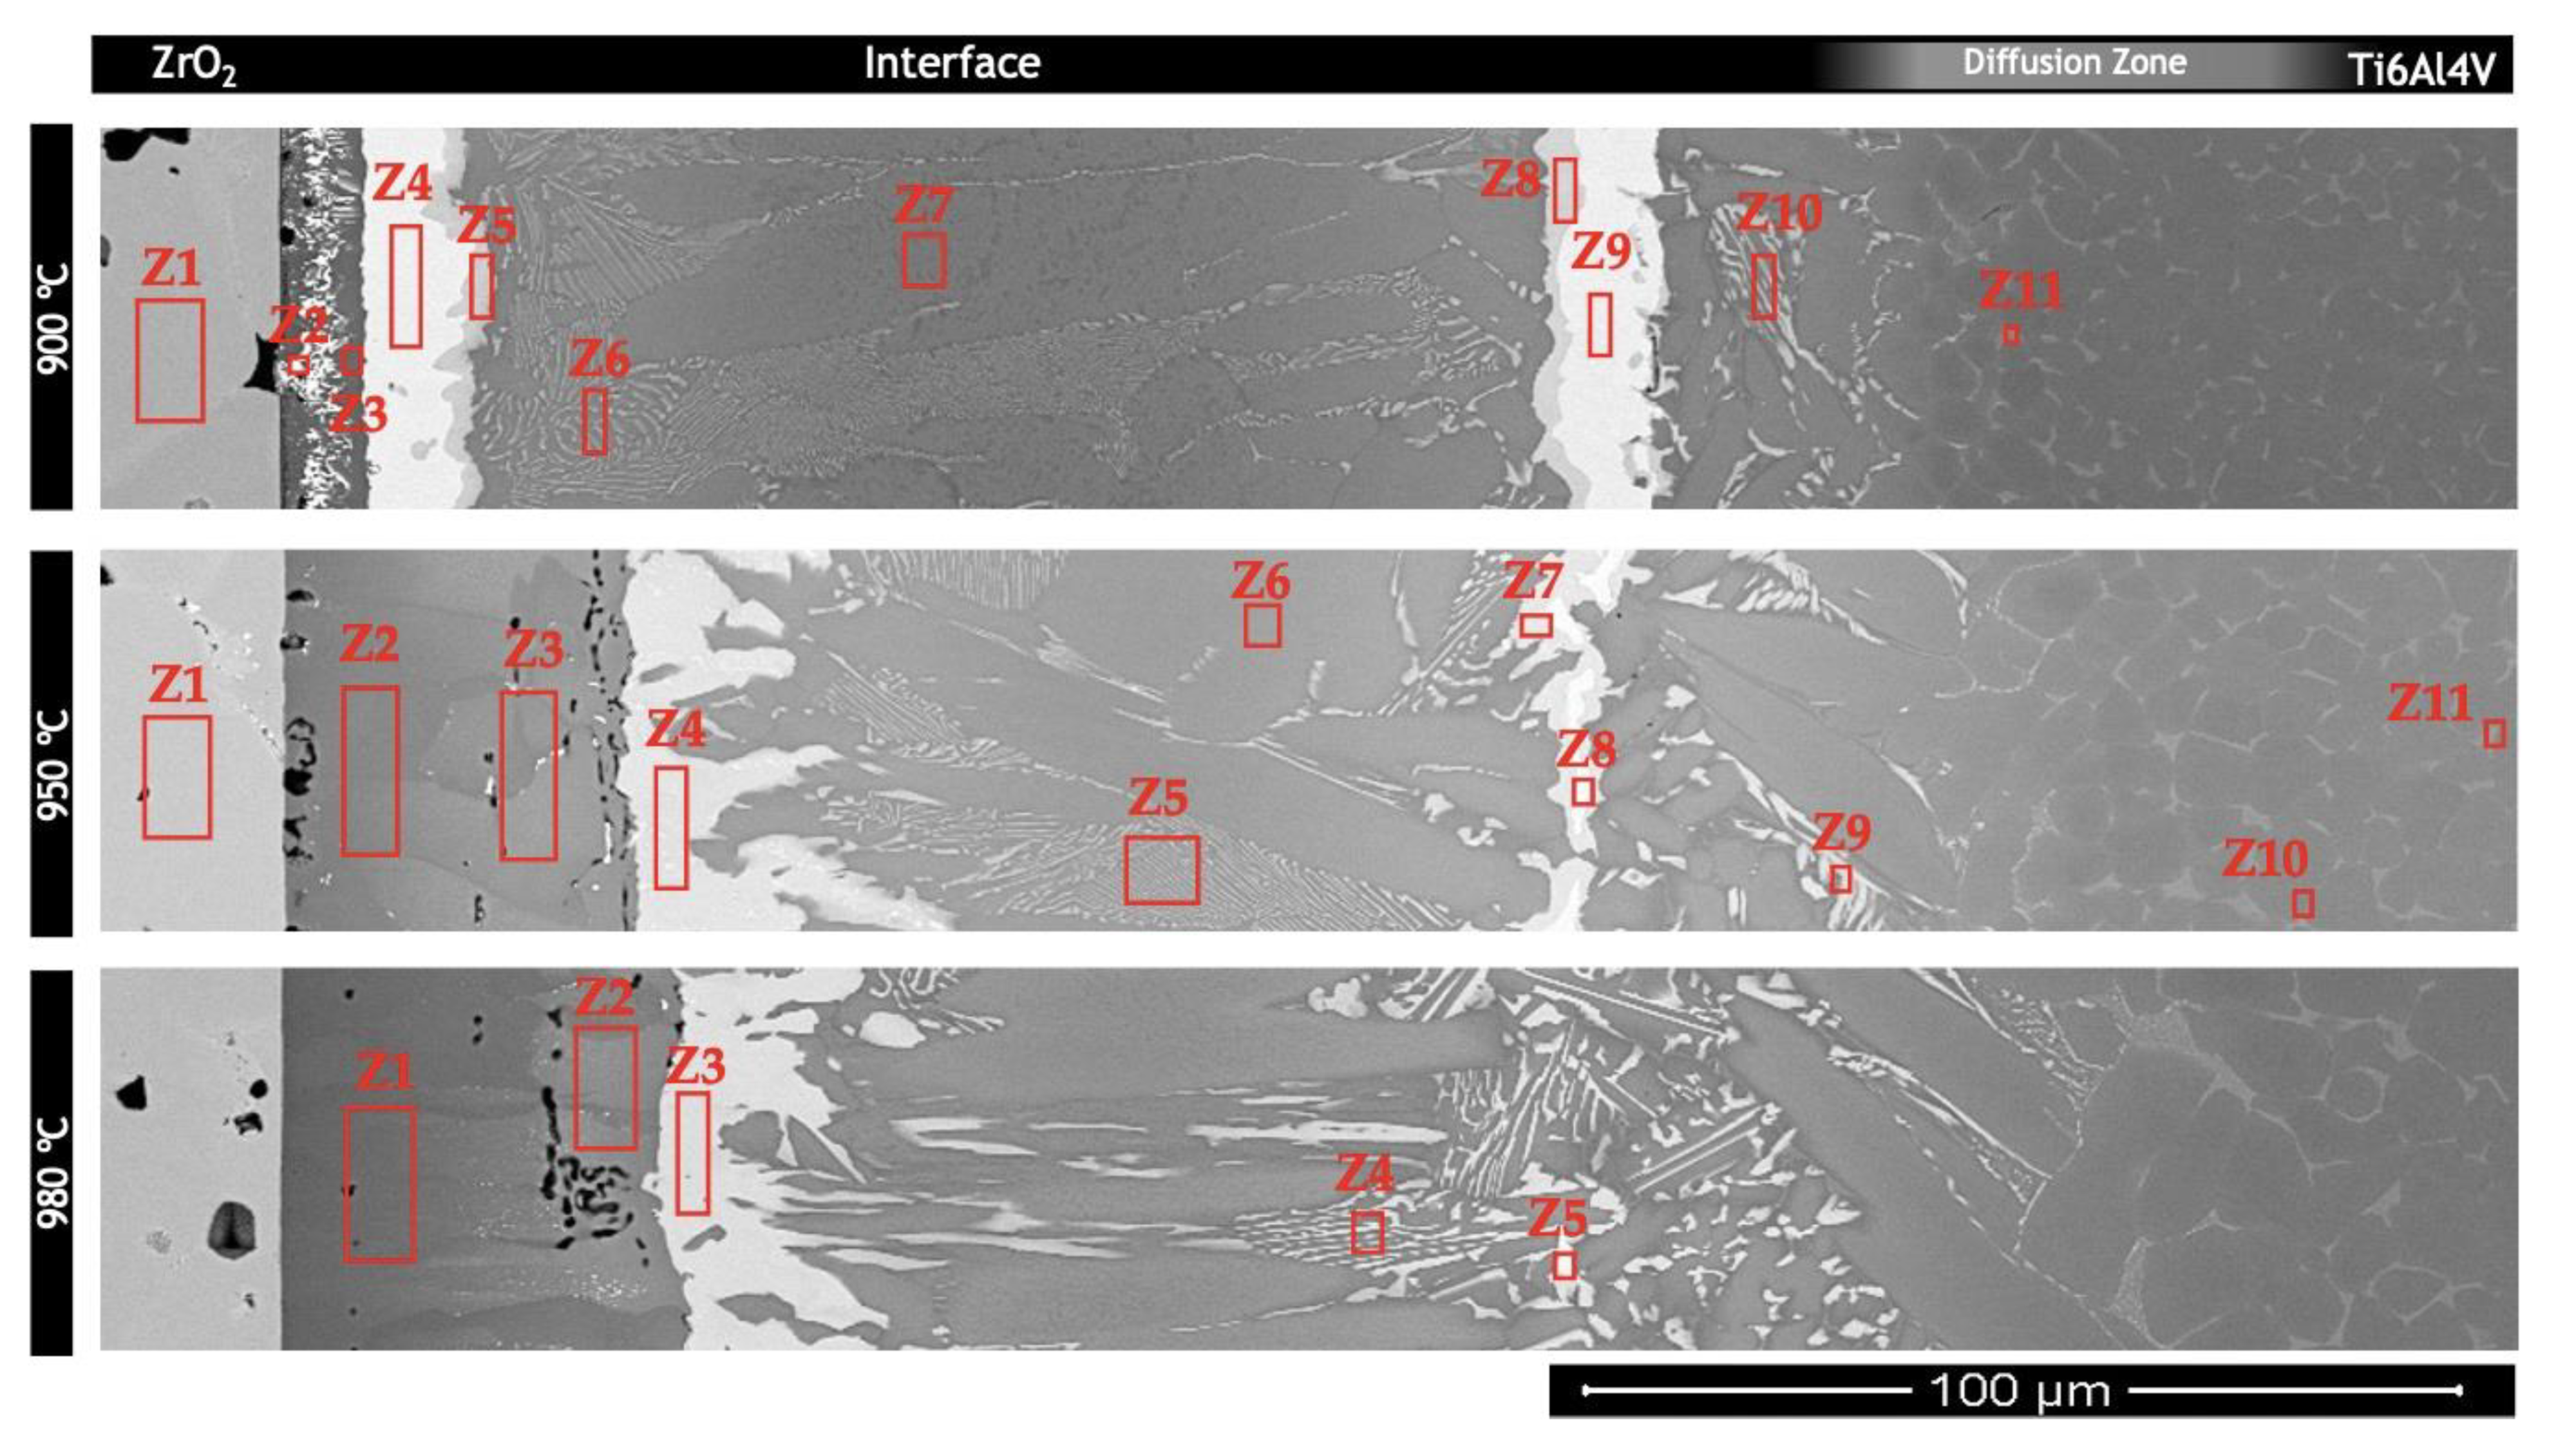
Figure 3 shows SEM images of the interfaces of the joints processed at 900, 950, and 980 °C. The interface could be divided into up to five layers and at 900 °C, starting from the base ZrO
2 sample, it could be described as the following sequence of layers: (i) a layer consisting in a mixture of dark zones with bright smaller particles mainly located at its center (layer
1); (ii) a layer, with a rather irregular thickness that consists of two sub-layers (layer
2), one essentially consisting in a light grey phase, followed by another composed of grey phase that delimits this layer from layer
3; (iii) the central region of the interface, composed of a mixture coarse grey plates and lamellar zones (layer 3); (iv) a layer presenting the same microstructural features as layer
2 (layer
4); (v) a layer presenting some similar microstructural features to those of the central region of the interface and another similar to those of the base Ti6Al4V alloy (layer
5).
Increasing the brazing temperature to 950 °C increases the thickness of layer
1 and eliminates most of the bright particles that were observed dispersed in this layer after brazing at 900 °C. The pores (red arrows marked in
Figure 3) observed for all brazing temperatures are a noteworthy feature of layer
1. After brazing at 900 °C, porosity is detected in the vicinity of the base ZrO
2 sample, while after brazing at 980 °C porosity it is essential it is observed close to layer
2. The worst porosity feature is observed after brazing at 950 °C, since pores are observed near the ZrO
2 sample as well as close to layer
2.
The interfaces obtained at 950 and 980 °C are somewhat similar, differing in thickness and in a few microstructural features presented by some of the layers. For instance, the thickness of layer 2, although rather irregular, tends to increase as the brazing temperature increases and for the higher processing temperatures this layer is mainly composed of the grey phase that was delimiting the central zone of interface after brazing at 900 °C. The thickness of layer 3, which corresponds to c.a. 50% of the overall thickness of the interface, decreases as the brazing temperature is incremented and its microstructure tends to coarsen. Layer 4 is barely observable after joining at 980 °C and consists of a mixture of light grey particles and lamellar zones that are similar to those observed in layer 3, although with coarser lamellae. Finally, the thickness of layer 5 tends to increase as the processing temperature is incremented.
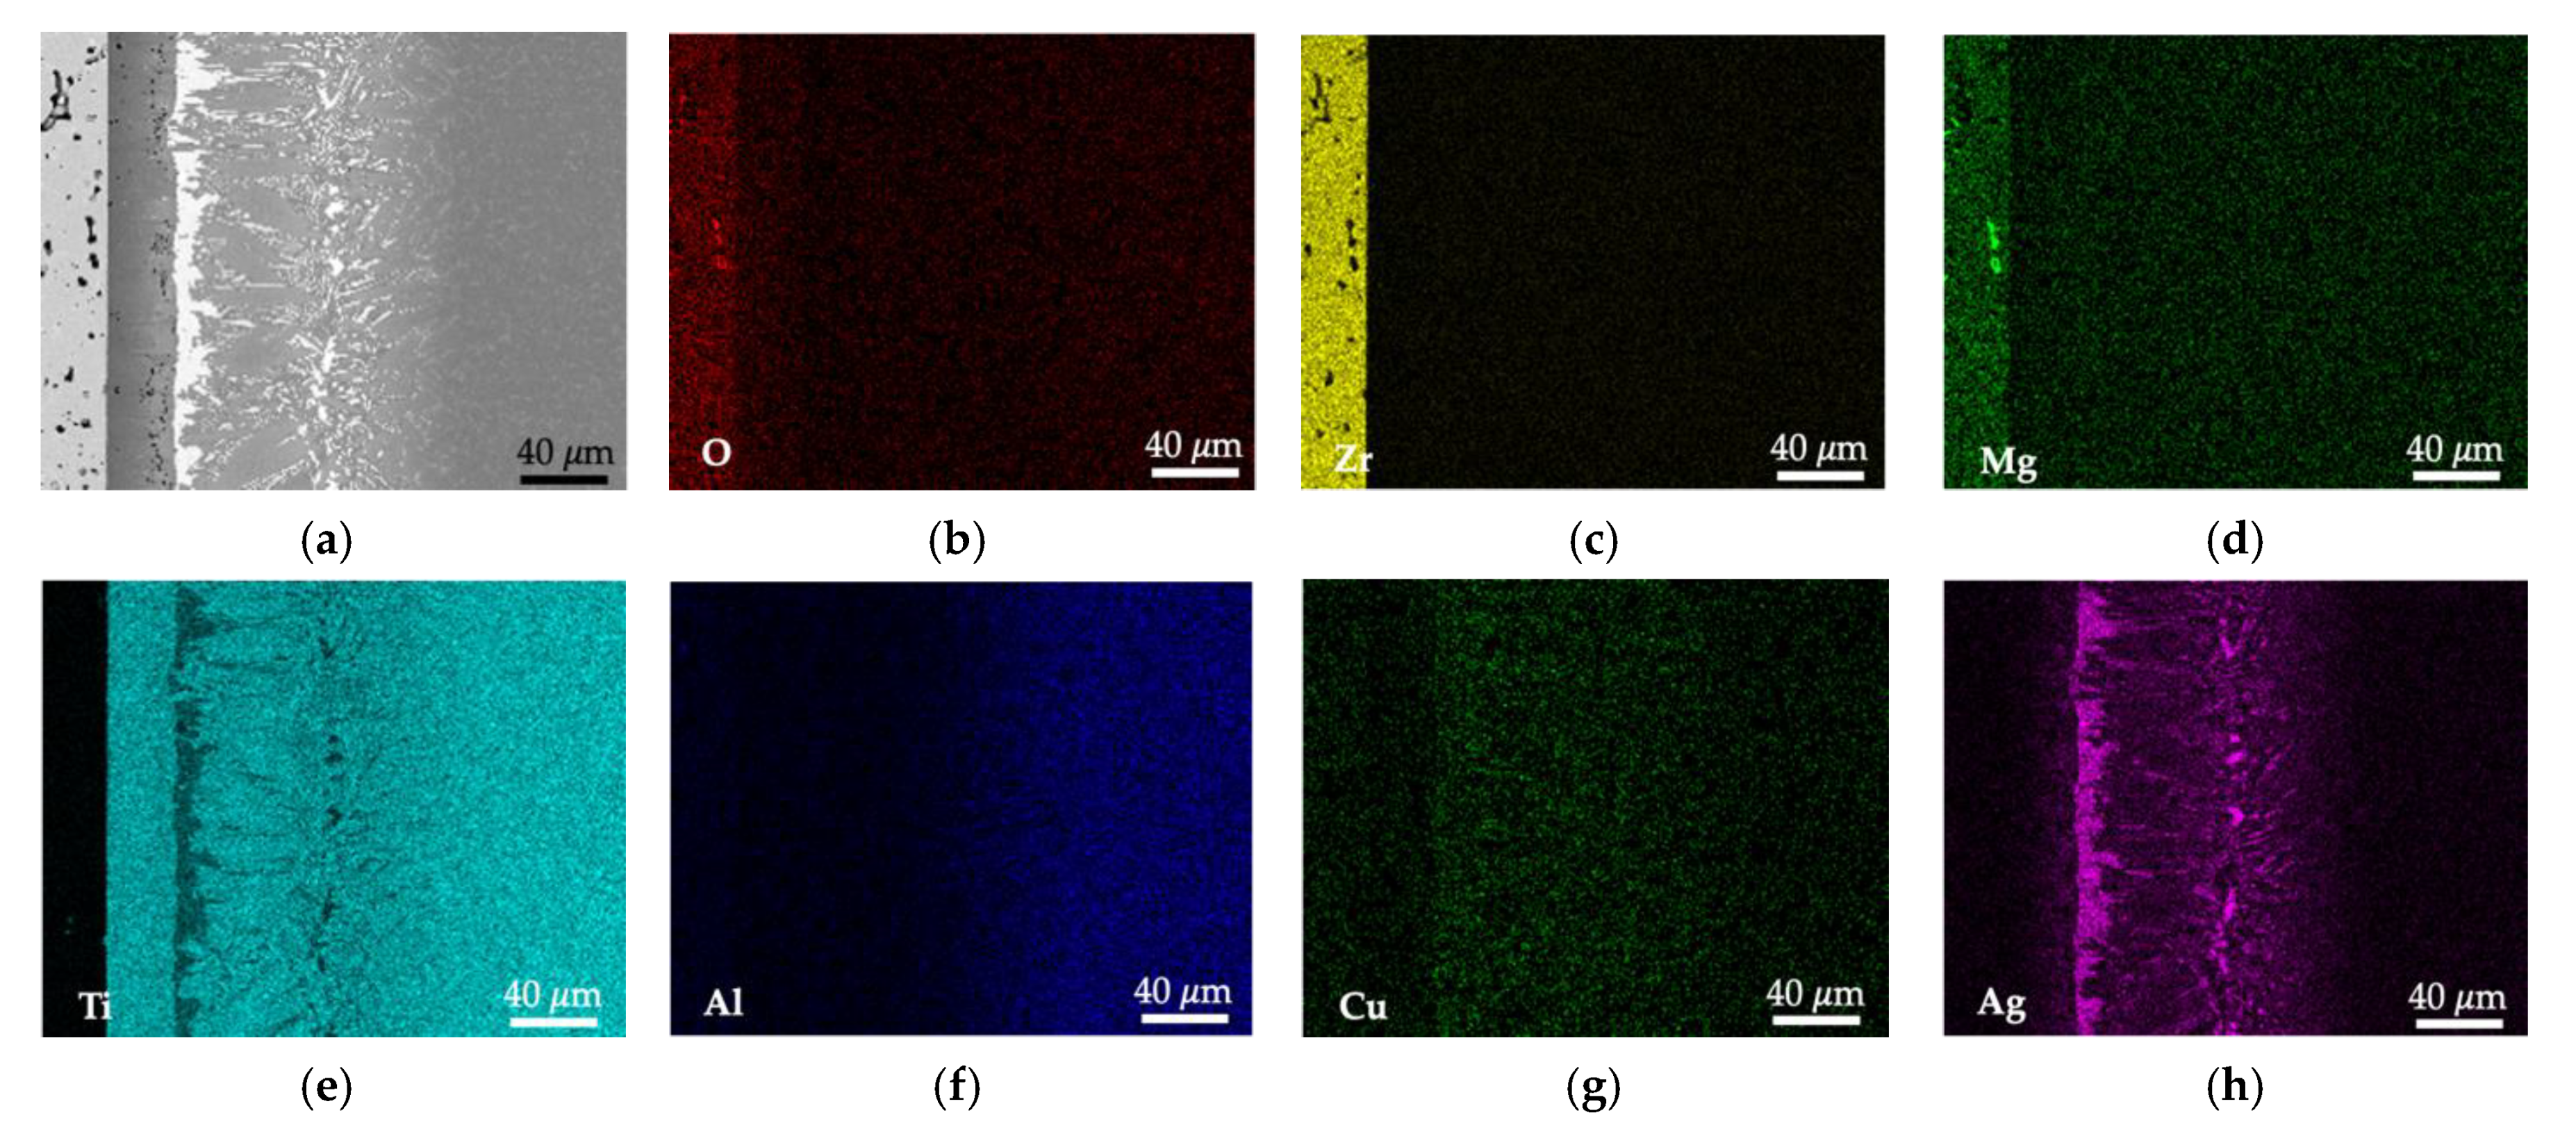
A SEM image of the interface and EDS interfacial elemental distribution maps of ZrO
2/Ti6Al4V joints processed at 980 °C are presented in
Figure 4. The distribution map of oxygen shows that this element is detected at the interface only in layer
1, close to the ceramic sample and in low contents, indicating the eventual formation of a thin oxide sub-layer. Ag, Cu and Ti are present throughout the entire interface, although Ag is mainly detected in layers
2 and
4, in contrast to Ti, which is the element detected in higher contents across the interface.
To identify the possible phases constituting the reaction layers formed at the interfaces, EDS chemical analyses results and SEM images of the interfaces were combined with the information provided by the Ti-Al [
18], Ti-Al-Ag [
19,
20], Ti-Ag-Cu [
19], Ti-Al-V [
21], Ti-Al-Nb [
22] and Ti-Al-Cu [
23] equilibrium phase diagrams.
Figure 5 presents SEM images of the interfaces showing typical detailed microstructural features for the three brazing temperatures. The EDS analysis results of each zone marked in these images are shown in
Table 1.
Independently of the brazing temperatures tested in this investigation, the same phases should constitute the resulting interfaces. The differences were essentially related to the relative amounts of the phases present in each layer, and also in the grain size coarsening of some phases, as the brazing temperature was increased. Layer
1, after brazing at 900 °C, is composed of a mixture of Ti-rich zones and of Ag-rich particles, which are observed at the central zone of the layer. Attending to the EDS analysis and the Ag-Ti phase diagram, Ti-rich zones should consist of α-Ti, while the central zone of layer
1 should be essentially composed of (Ag). It is also worthy to mention that the formation of oxides such as TiO, TiO
2, and CuTi
4O near ZrO
2 was suggested or confirmed by other authors [
7,
8,
9,
10,
11,
12,
13]. Oxides presenting a semi-metallic nature, such as TiO and TiO
2, are reported to ensure chemical compatibility and bonding between the ceramic base materials and the interfacial metallic phases. However, the formation of an oxide layer near ZrO
2 could not be clearly confirmed through the SEM/EDS characterization performed in the present study; this may be due in part to the fact that the eventual oxide reaction layer was too thin to be detected by the techniques used in this investigation. Layer
2, should consist of TiAg (light-grey sub-layer) and Ti
2(Cu, Ag) (grey sub-layer). The central zone of the interface (layer
3) consists in a mixture of α-Ti + Ti
2(Ag, Cu). Layer
4 present similar microstructural features and composition as those of layer
2. Layer
5 consists primarily of α-Ti and Ti
2(Ag, Cu) and promotes bonding to the Ti6Al4V alloy. Finally, a diffusion zone was detected, extending up to 50 µm into the base Ti6Al4V alloy, where both the Cu and Ag contents do not exceed 6%.
The characteristic sequence of phases formed at the interface, starting from the ZrO
2 side of the interface, was: Ti oxide(s) + α-Ti (layer
1)/TiAg + Ti2(Cu, Ni) (layer
2)/α-Ti + Ti
2(Cu, Ni) (layer
3)/Ti
2(Cu, Ni) + TiAg (layer
4)/α-Ti + Ti
2(Cu, Ni) (layer
5).
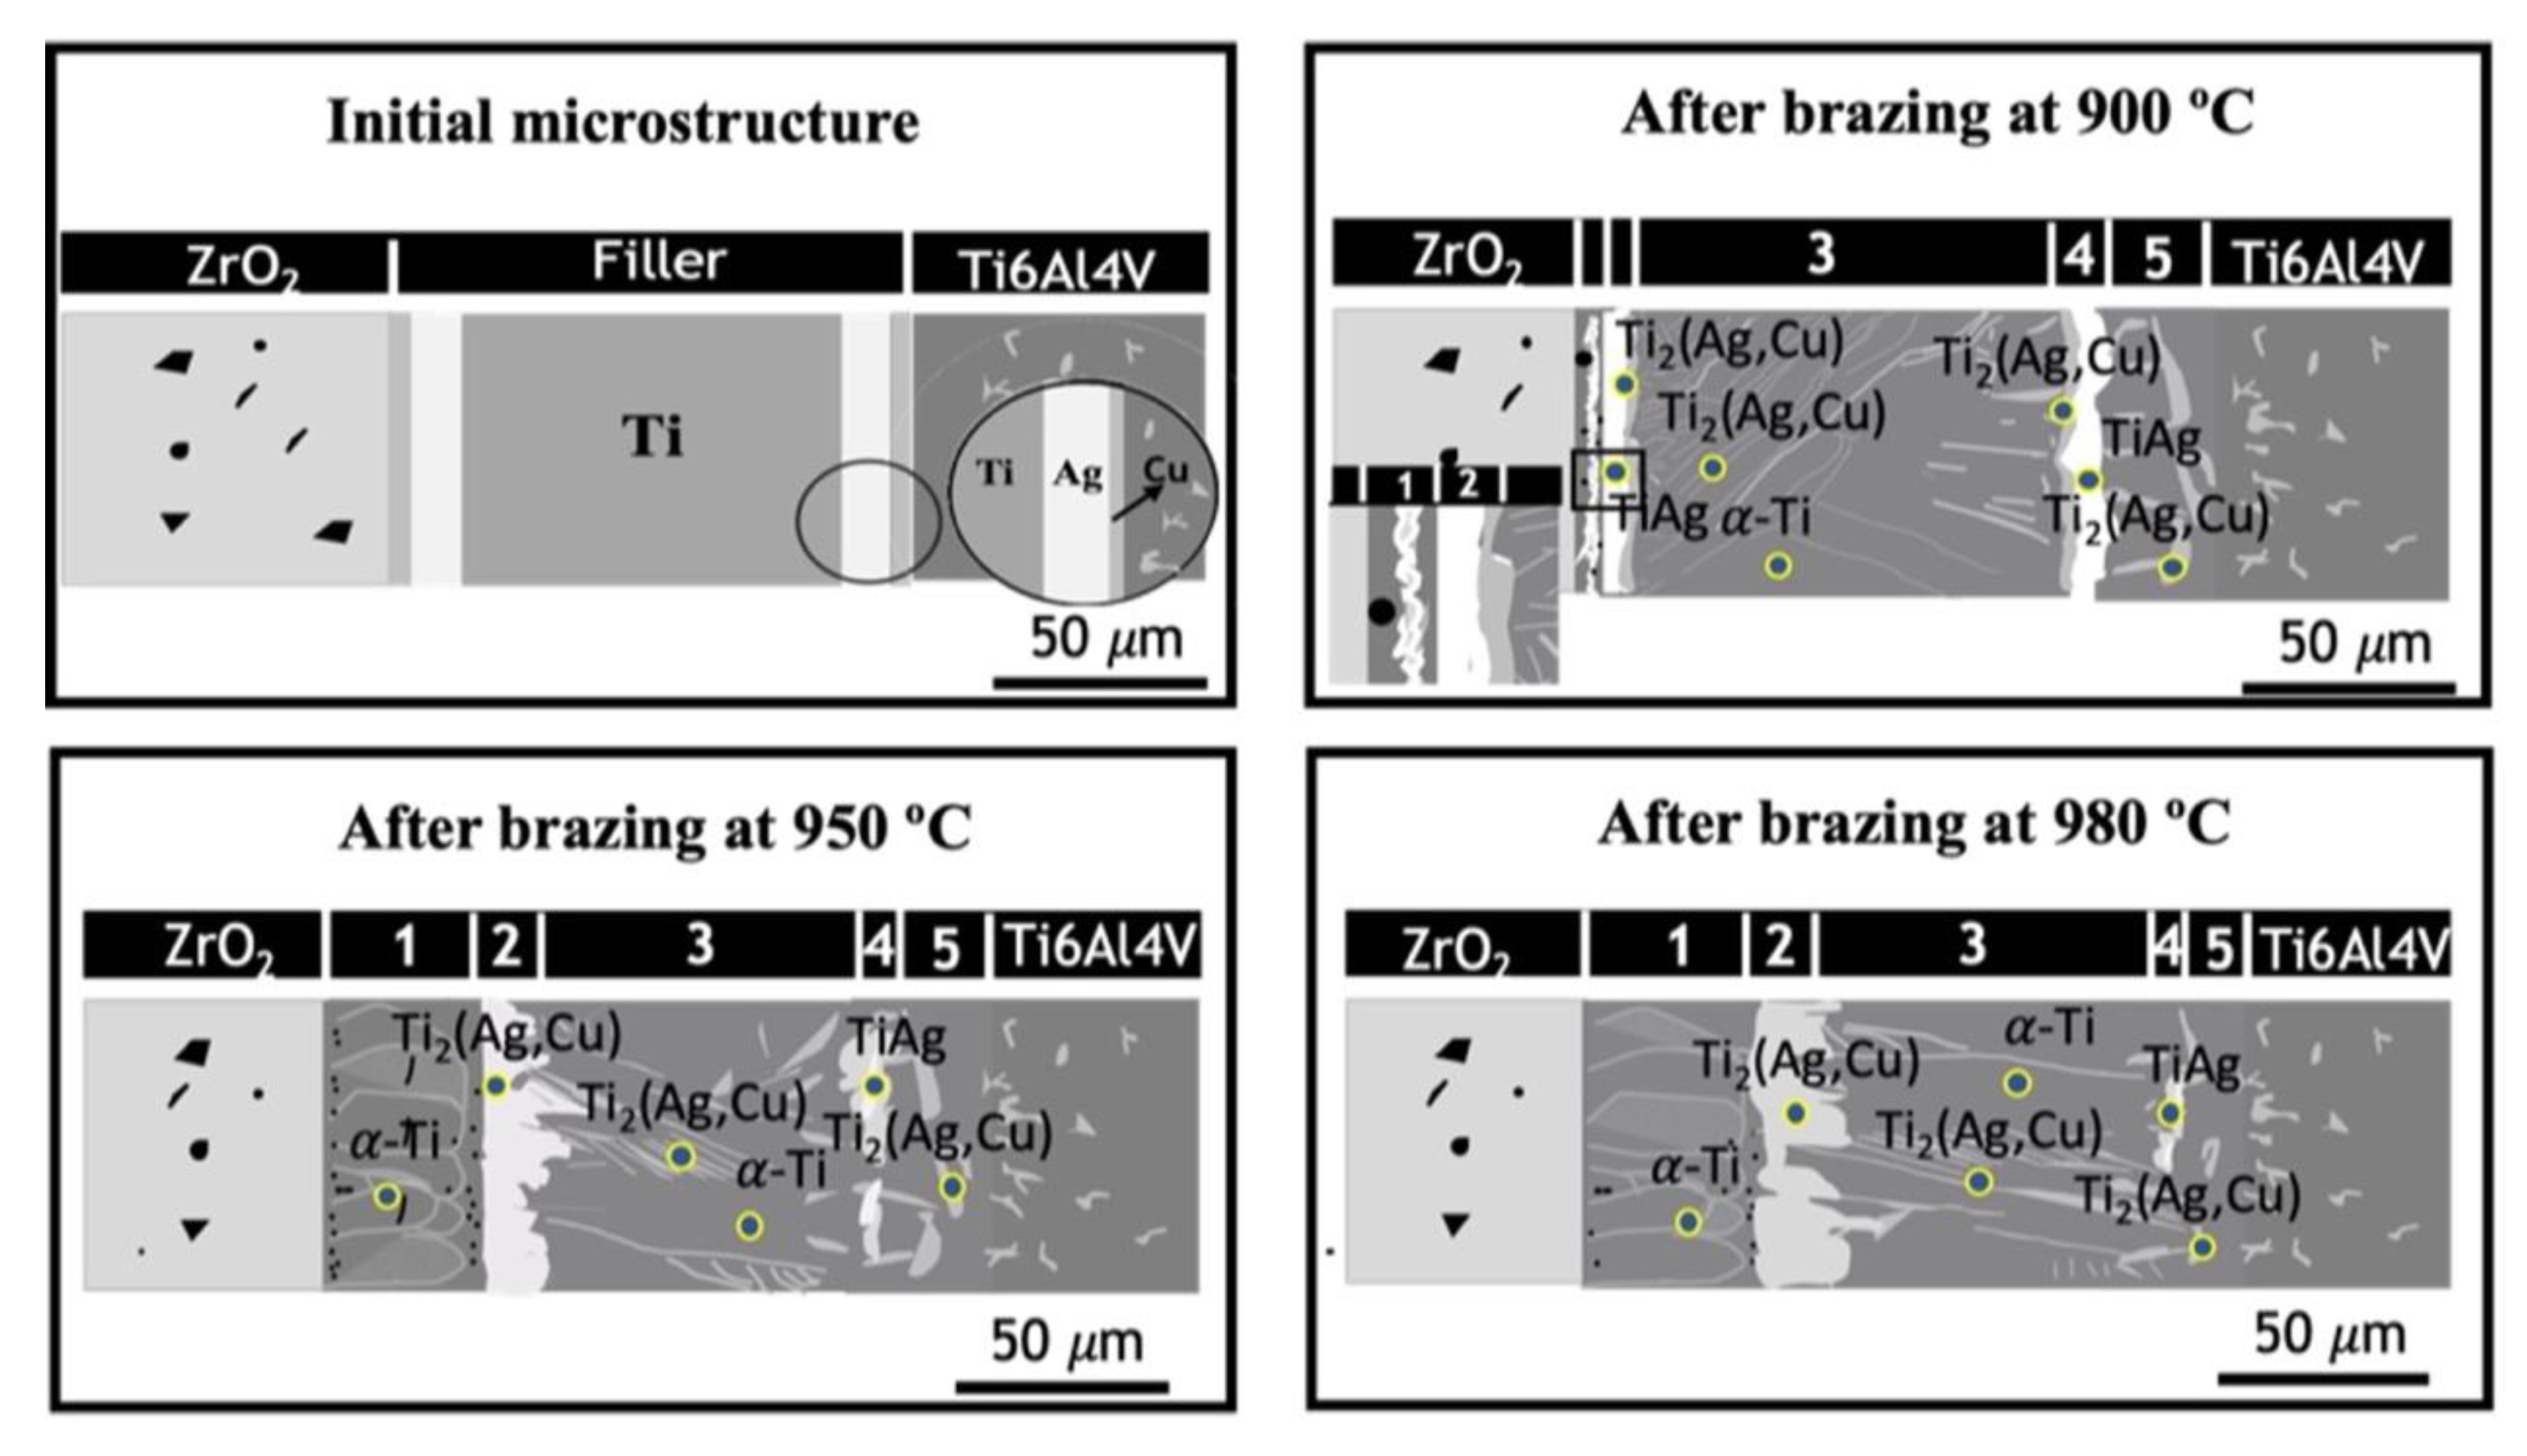
Figure 6 shows a schematic representation of the evolution of the interfacial microstructure with the brazing temperature. It should be noted that although not depicted in
Figure 6, the formation of a thin oxide layer near ZrO
2, ensuring chemical bonding to either the ceramic sample or the metallic phases that constitute layer 1, should not be discarded.
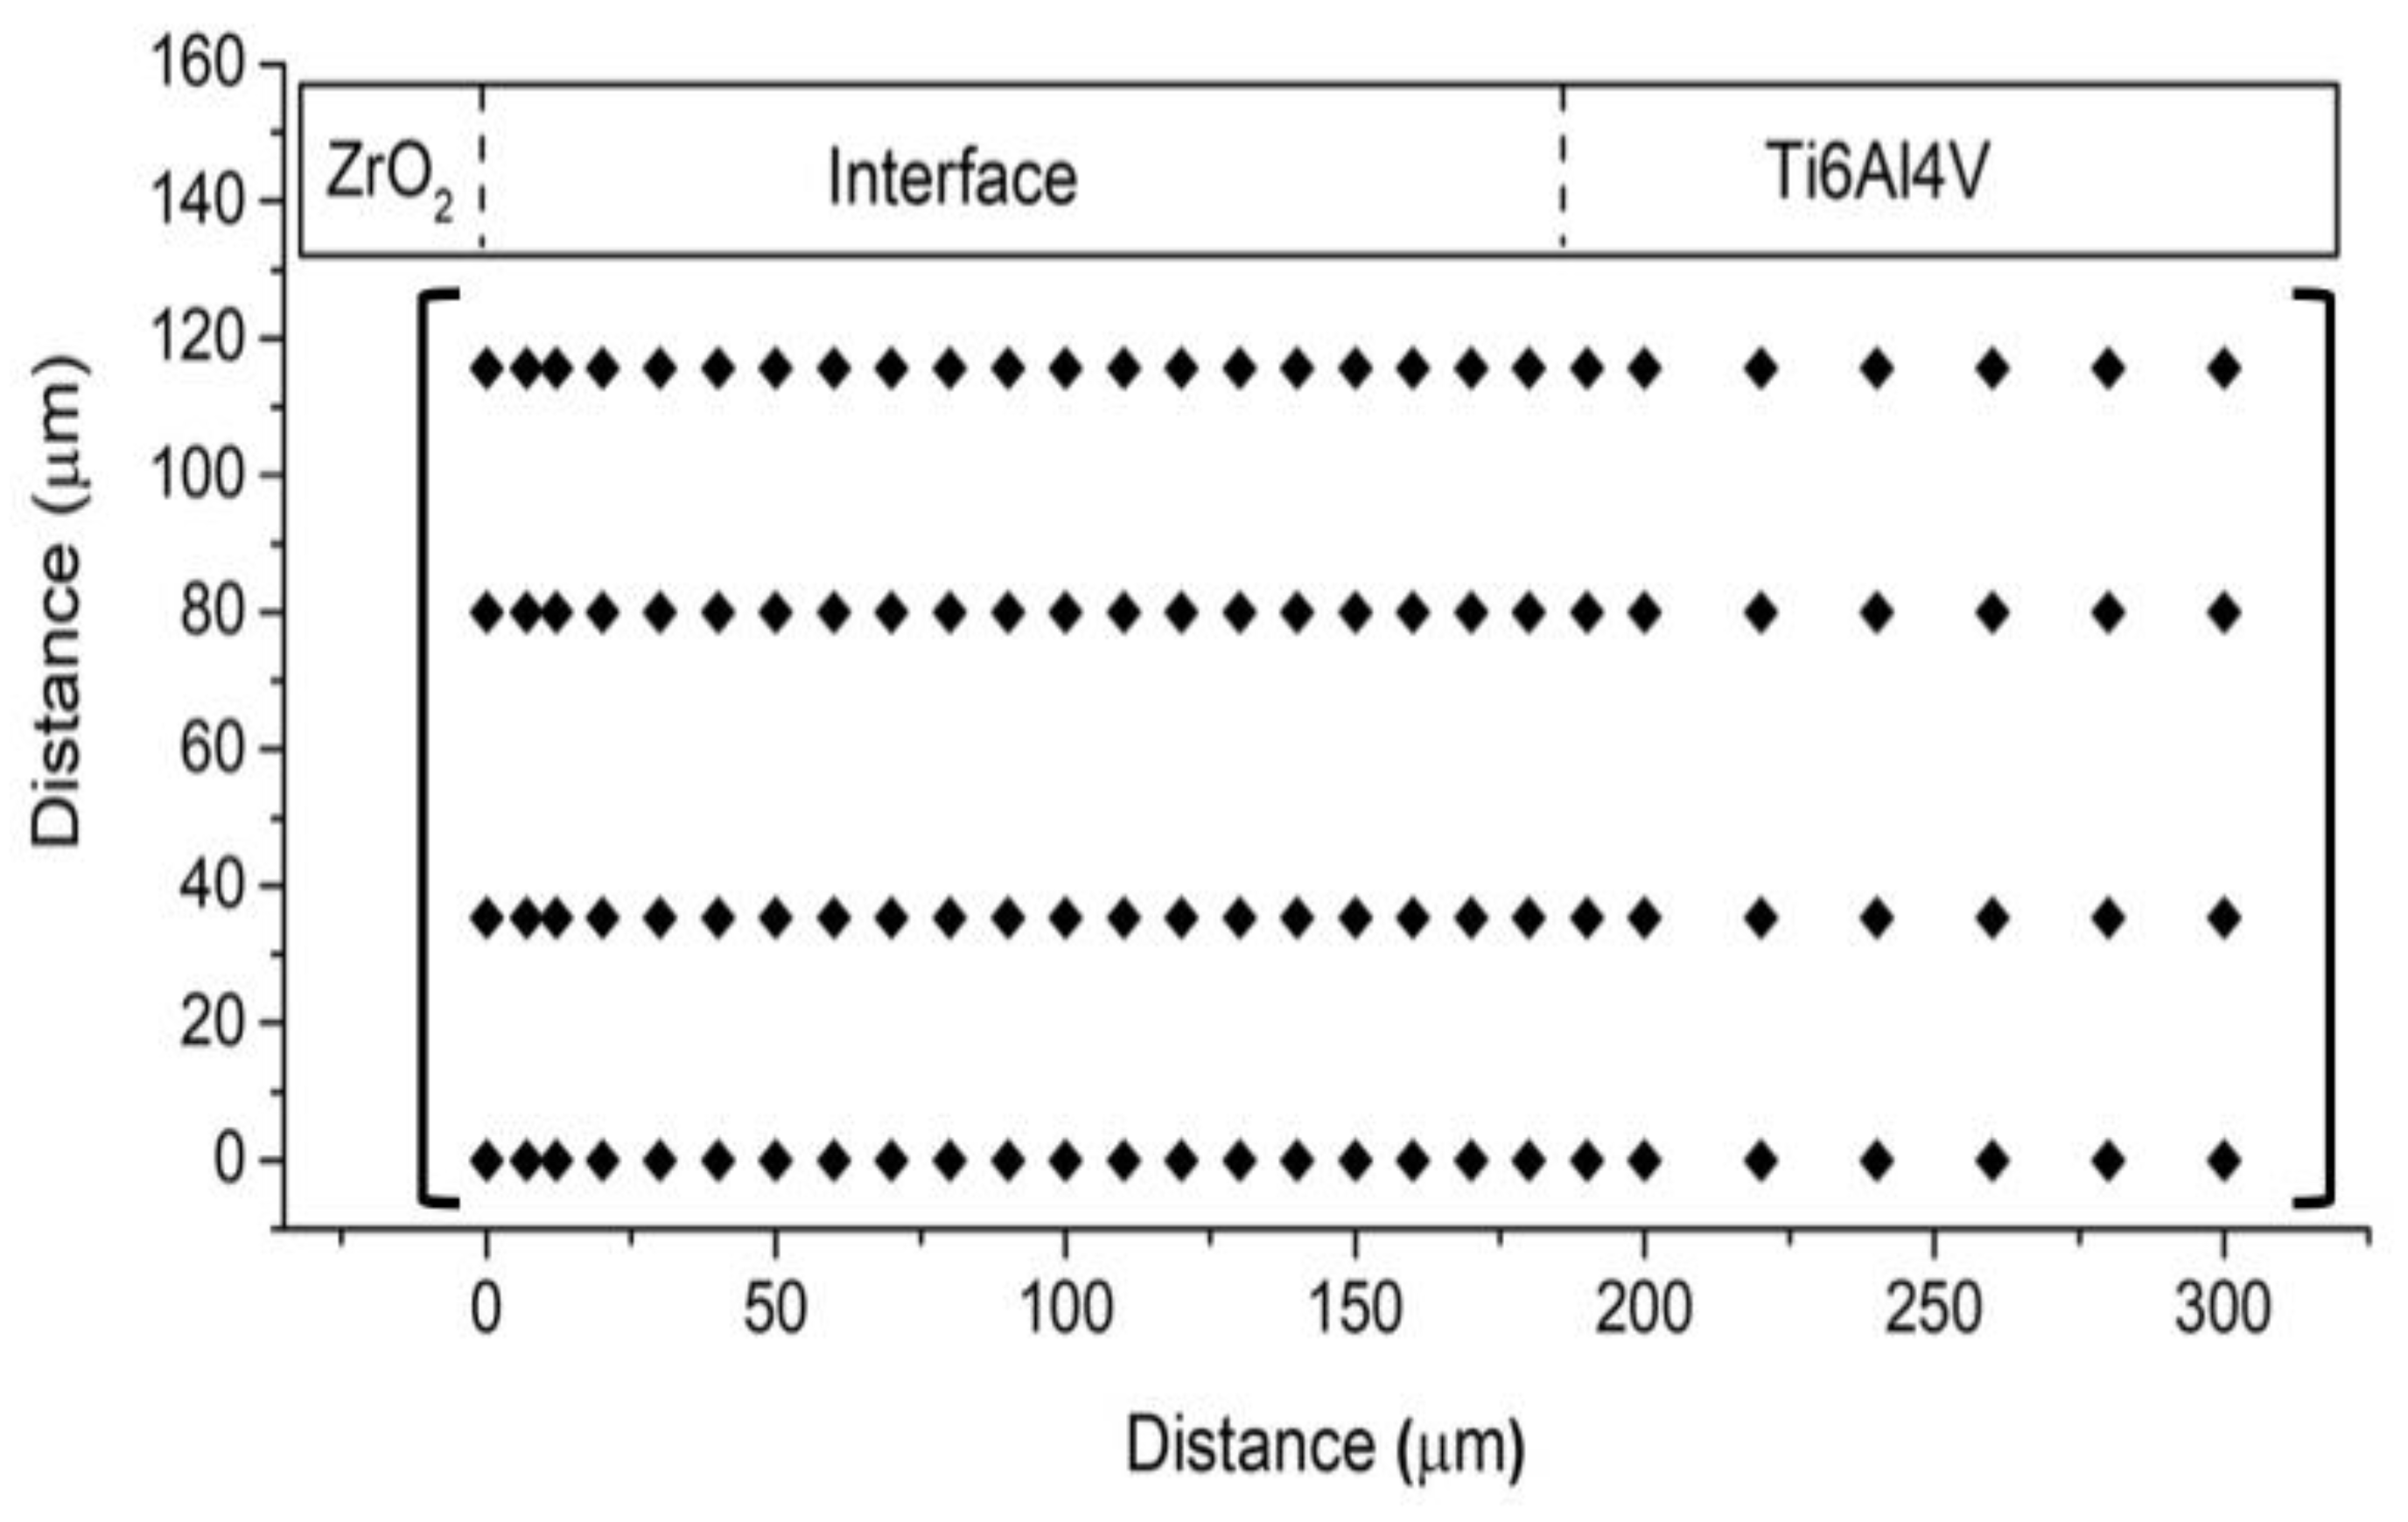
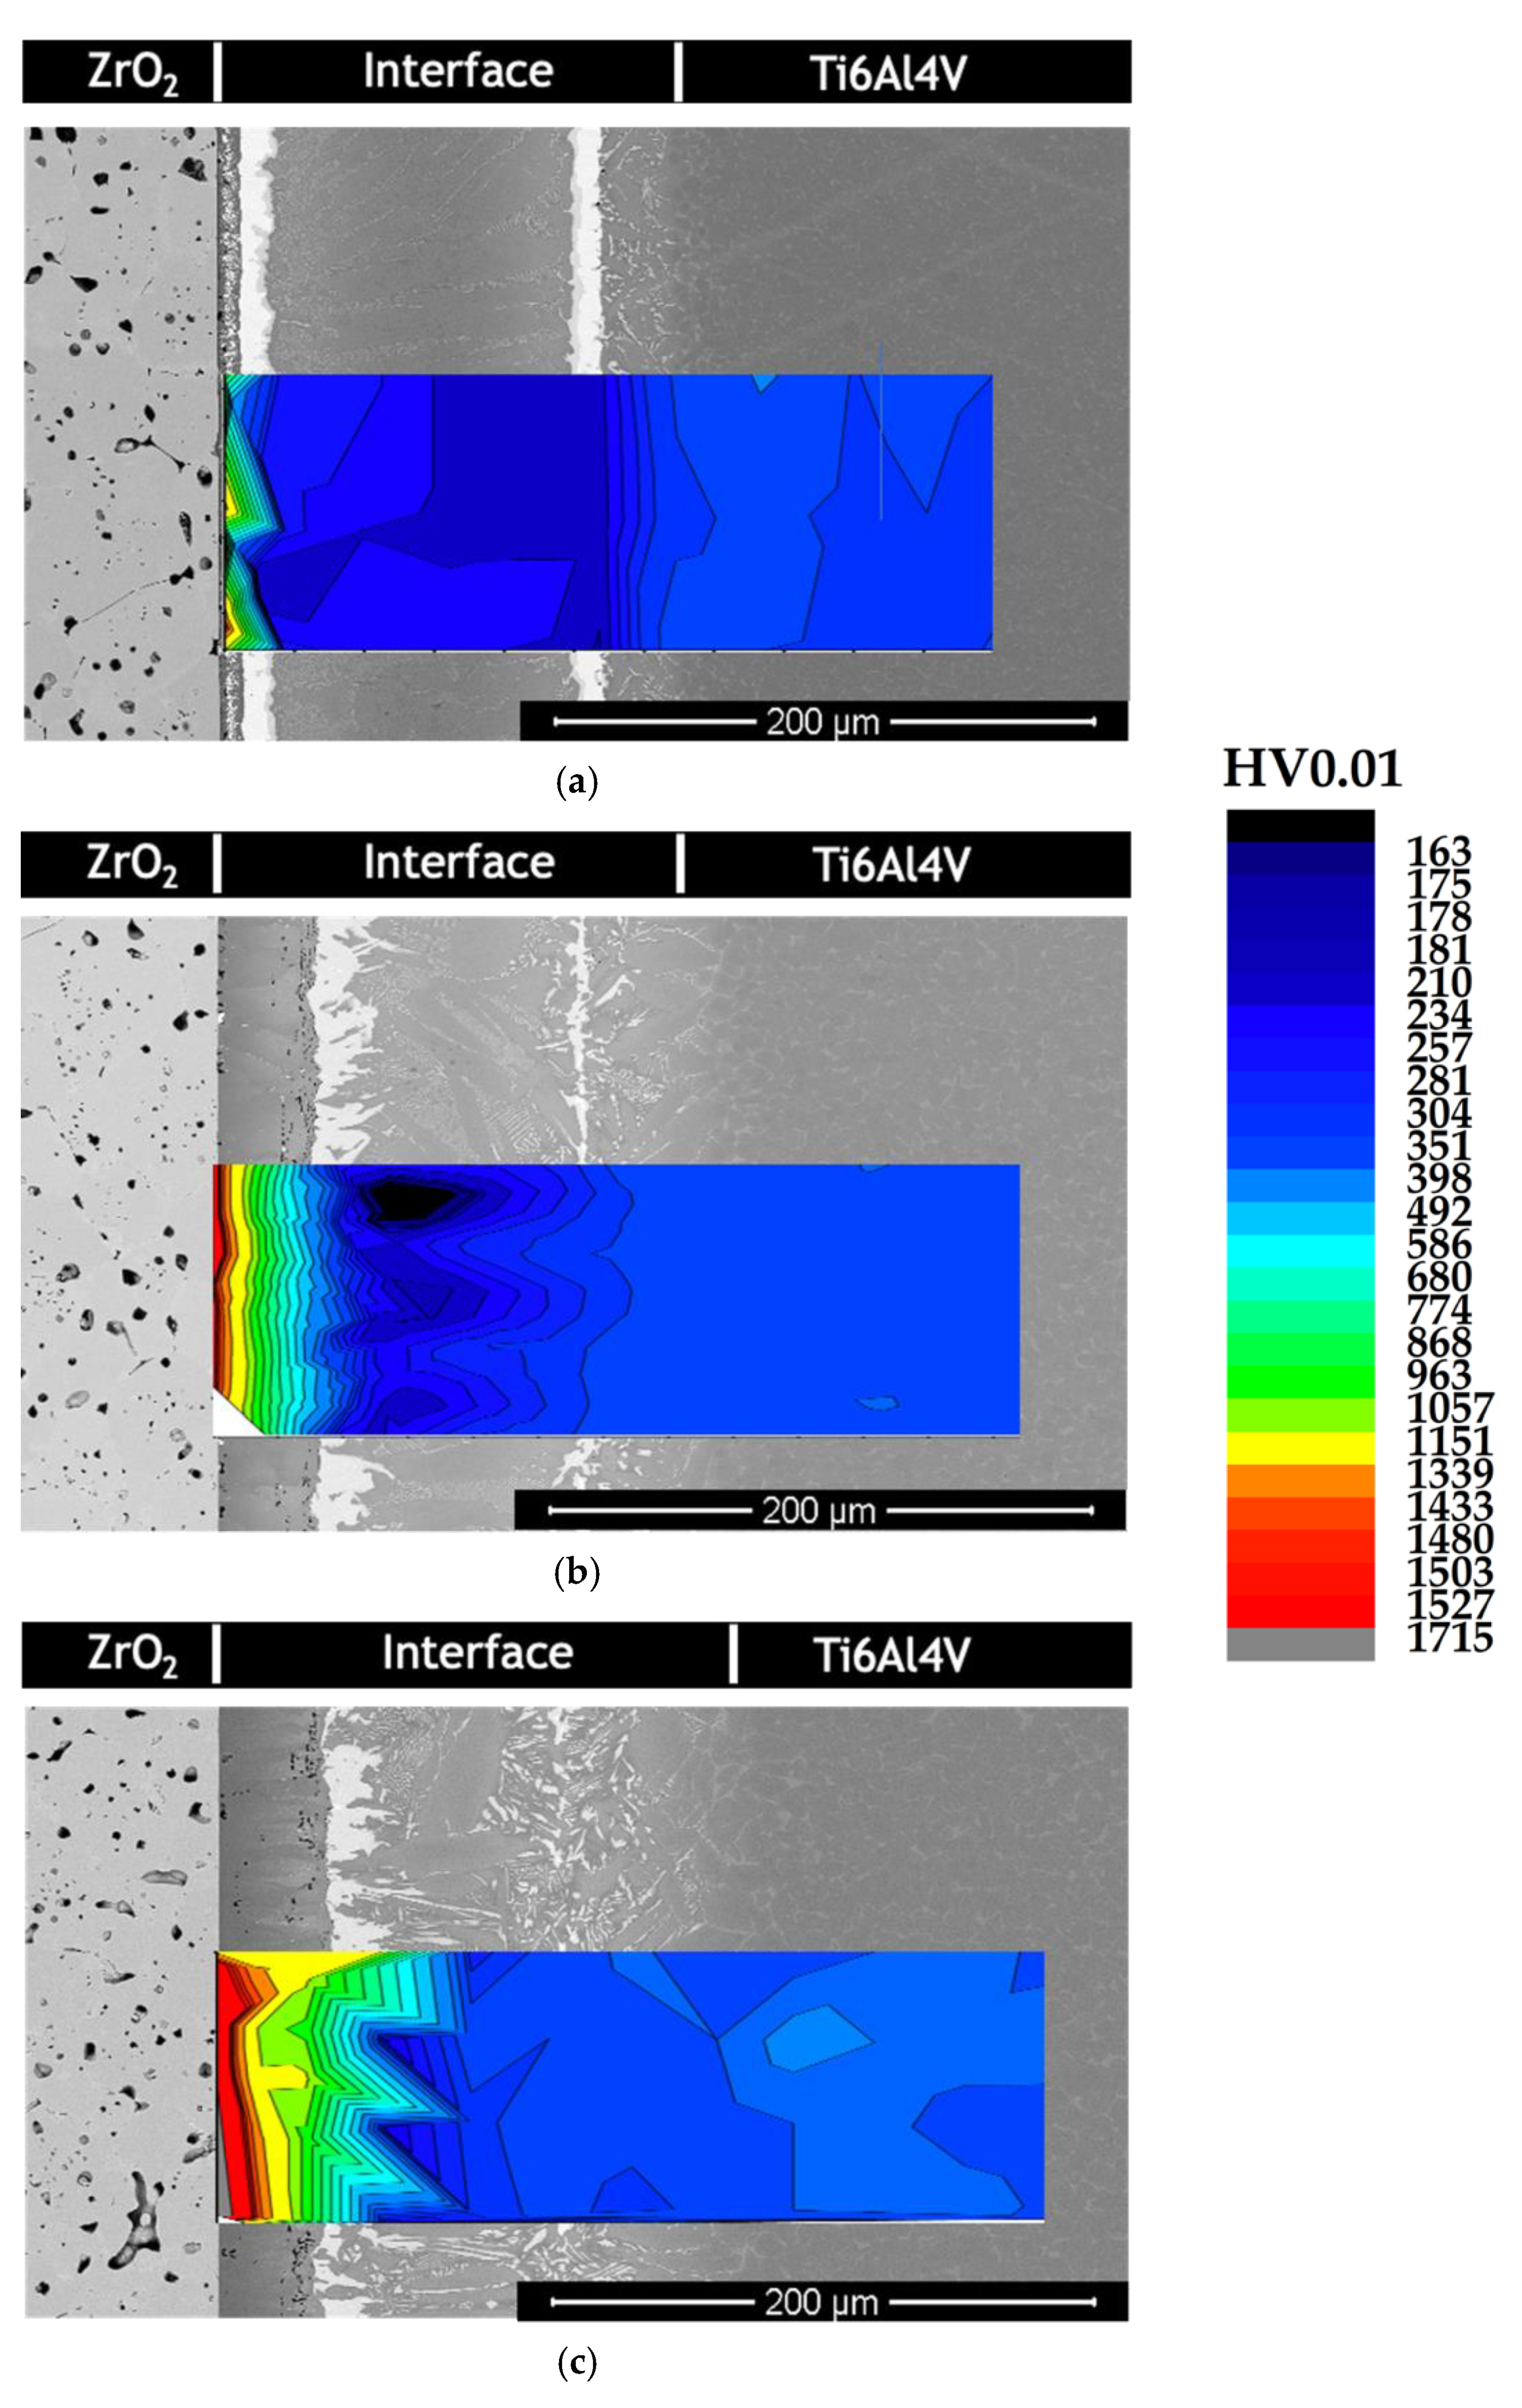
The hardness distribution maps of the brazed joints processed at different temperatures are presented in
Figure 7. The maps show that the hardness across the interface is relatively uniform and similar to the hardness of Ti6Al4V alloy, with the exception of layer
1. In fact, the global hardness of layer
1, which reaches 1715 HV0.01 close to ZrO
2, is significantly higher than the hardness of the remaining interface. These hardness values indicate that layer
1, in the vicinity of ZrO
2, should be essentially composed of hard phases, instead of just α-Ti and are consistent with the formation of oxide phases reported in other studies. In addition, the hardness distribution maps show that extensive formation of soft phases did not occur, contrarily to the reports in other studies [
24,
25,
26,
27] where Ag-based fillers were used. This indicates that the novel Ag-Cu sputter-coated Ti brazing filler used in the present investigation potentially avoids the need of eventual post-joining heat treatments to eliminate or minimize the formation of undesirable segregated phases at the interface.
The higher shear strength of joints (152 ± 4 MPa) was obtained after brazing at 980 °C. However, it was not possible to evaluate the shear strength of joints brazed at 950 °C as samples separated as they were being placed in the shear test apparatus. Thus, this processing temperature is inadequate to braze ZrO
2 to Ti6Al4V alloy using Ag-Cu sputter-coated Ti filler. This could be mainly related to the presence of the pores in layer
1, specifically those observed between the ceramic base material and the interface. In fact, as can be observed in
Figure 5, after brazing at 950 °C, the porosity level in layer
1, near the base ceramic sample, is visibly higher than after processing at either 900 and 980 °C. Indeed, for the two limiting processing temperature used in this study, only residual porosity was observed at this zone of the interface. It should be noted that although brazing at 980 °C induced the formation of pores in layer
1, these are mainly located near the transition between layer
1 and layer
2, contrarily to the lower processing temperatures, where pores are mainly located near the ceramic sample. This shifting in the location of most pores, from the hardest zone of layer
1 to a much softer and less brittle zone, appears to be a critical factor impacting the mechanical strength of joints.
The lower shear strength of joints (97 ± 2 MPa) after brazing at 900 °C in comparison to brazing at 980 °C, could be related to the combination of two factors. One is related to the already mentioned different porosity distribution features, and the other concerns the formation of a less consolidated/continuous and thinner oxide layer, close to the ZrO
2 sample. Indeed, as the hardness distribution maps presented in
Figure 7 denote, the extension of the hardest zone of the interface, which is most likely related to the formation of oxides phases, increases with the brazing temperature. Thus, after joining at 980 °C, a thicker and possibly more continuous oxide layer, in conjunction with a more favorable porosity distribution in layer
1, produced the joints displaying the higher shear strength.
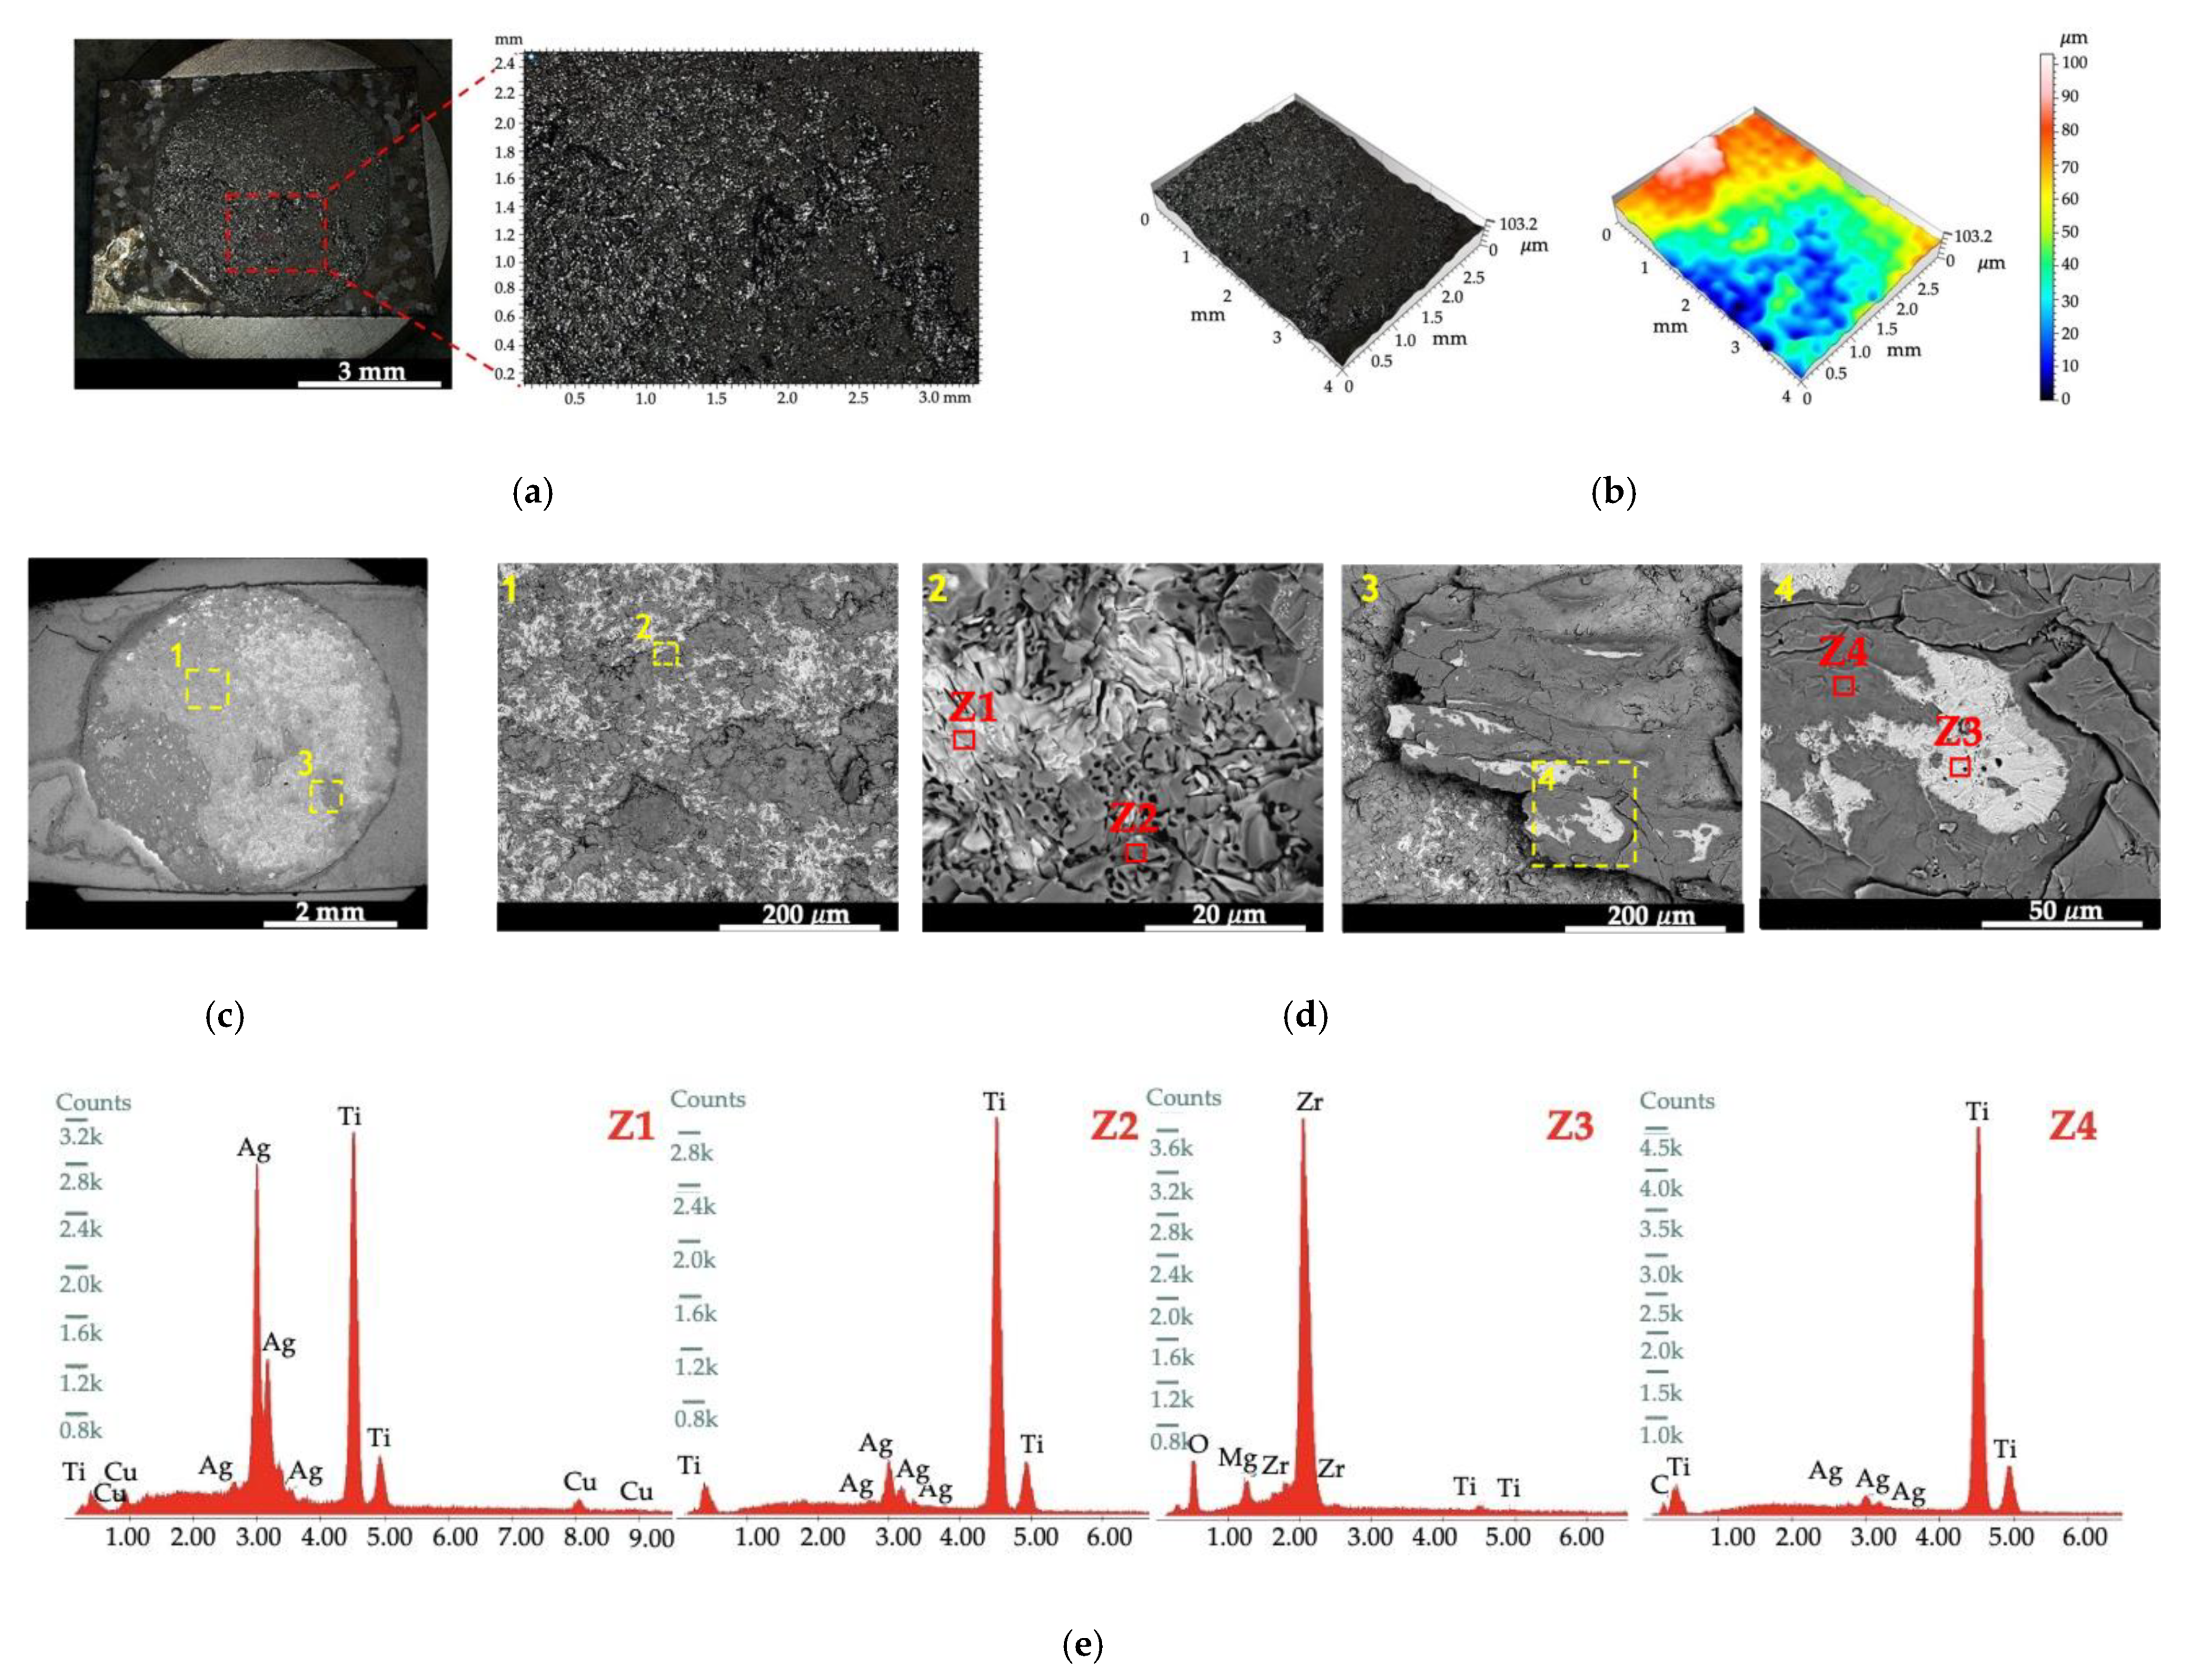
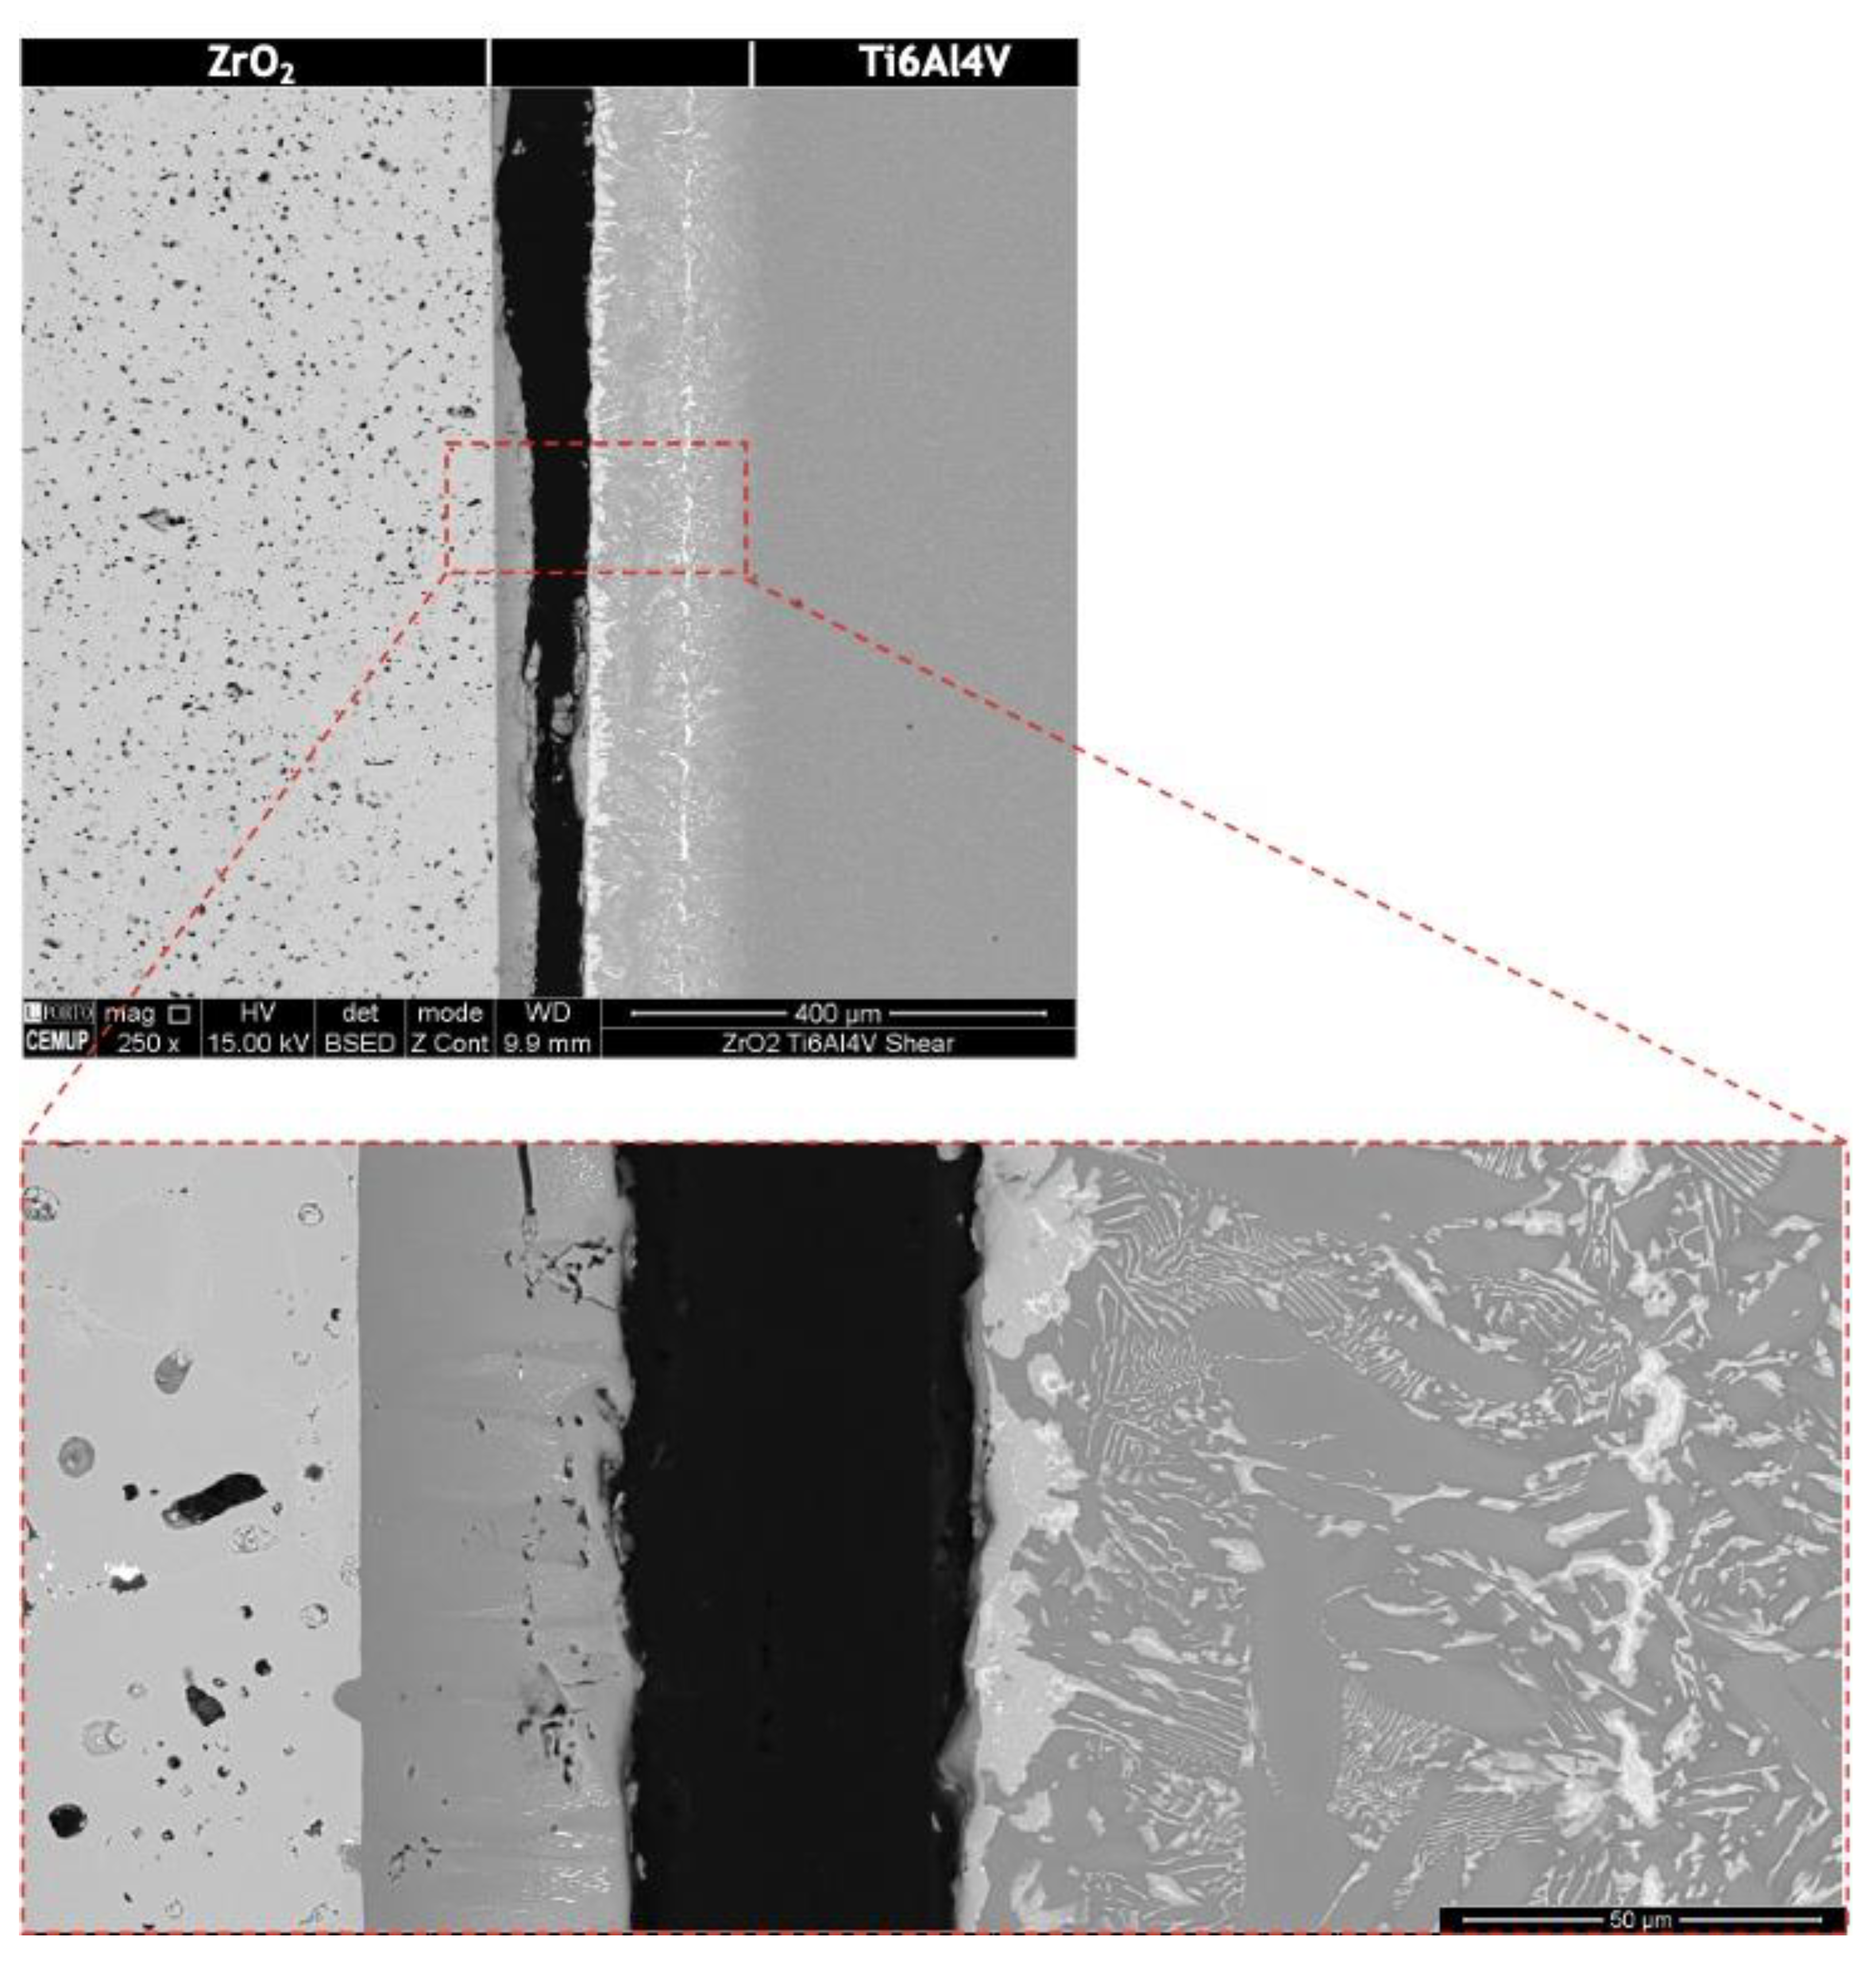
Figure 8 shows the results of the fracture surface analysis for the samples with the higher shear strength.
Fracture of joints occurred partially across the interface and partially across the ceramic sample. The Ti6Al4V sample was covered by reaction products and with some ceramic fragments still attached to it, while ZrO
2 was partially covered by a visibly thinner layer of reaction products. The SEM/EDS analysis of the fracture surface on the Ti6Al4V alloy side indicates the presence Ti-Ag rich zones, Zr-rich zones and Ti-rich zones. Layer
2 is the only layer, after brazing at 980 °C, which is Ti and Ag rich and, thus, the reactions products labelled as Z1 in
Figure 8 should correspond to this layer. The EDS spectra marked as Z2 and Z4 and should correspond to layer
1, since they correspond to zones essentially composed of Ti with a minor content of Ag. Finally, the ZrO
2 fragments correspond to the spectrum marked as Z3. These results indicate that the fracture of joints occurred partially across the interface, throughout layers
1 and
2, and partially across the ceramic sample. As can be observed in
Figure 9, fracture across the interface occurs essentially at the transition between layer
1 and layer
2, where porosity is concentrated, and crack nucleation and propagation are facilitated. Some cracks propagate towards the ceramic sample, across an increasingly harder and brittle layer, eventually penetrating into the ZrO
2 sample, assisting the facture of the joints.


