Article

Microstructure Analysis and Segmented Constitutive Model for Ni-Cr-Co-Based Superalloy during Hot Deformation

1
School of Materials Science and Engineering, Wuhan University of Technology, Wuhan 430070, China
2
Hubei Key Laboratory of Advanced Technology for Automotive Components, Wuhan University of Technology, Wuhan 430070, China
3
Hubei Engineering Research Center for Green Precision Material Forming, Wuhan 430070, China
*
Authors to whom correspondence should be addressed.
Metals 2022, 12(2), 357; https://doi.org/10.3390/met12020357
Submission received: 13 January 2022 / Revised: 11 February 2022 / Accepted: 14 February 2022 / Published: 18 February 2022

Abstract

:
In a thermal simulator of Gleeble-3500, isothermal hot compression tests were performed on a Ni-Cr-Co-based superalloy at deformation temperatures ranging from 1323 K to 1423 K and with strain rates of 0.01, 0.1, 1, and 5 s−1. We obtained the true stress–strain curves, and the microstructures of deformed samples were analyzed by electron backscatter diffraction (EBSD) technique. The segmented constitutive models were developed to predict the flow stress, and the dynamic recrystallization grain size model was established to evaluate the microstructure evolution for a Ni-Cr-Co-based superalloy. It is found that discontinuous dynamic recrystallization (DDRX) and continuous dynamic recrystallization (CDRX) appear simultaneously in the Ni-Cr-Co-based superalloy during hot deformation, with the latter not being active. Comparison between the experimental and predicted results indicates that the proposed models can describe and interpret the work-hardening and dynamic softening behaviors as well as the evolution characteristic of dynamic recrystallization grain size of the Ni-Cr-Co-based superalloy. In the error analysis of the segmented constitutive models, correlation coefficient (R) is 0.988 and average absolute relative error (AARE) is 6.94%, and for the AGS of DRX, R is 0.974 and AARE is 5.83%, which both have good accuracy.

1. Introduction

A Ni-Cr-Co-based superalloy is a precipitation hardening deformation superalloy with high strength, good fatigue, strong resistance to corrosion, and excellent oxidation resistance at temperatures up to 1173 K [1]. Furthermore, it also has good microstructure stability because of Co addition [2]. Applications are widely available for this alloy in the aerospace and energy industries [3,4]. However, a large amount of alloying elements leads to poor plasticity of the superalloy at high temperatures. Moreover, what happens during the hot forming of the superalloy is very complex in terms of behavior and microstructure evolution [4,5]. On the one hand, in the case of formed materials, the thermal processing parameters including deformation temperature and strain rate are crucial for their flow behaviors [6,7]. On the other hand, the phenomena of work hardening (WH), dynamic recovery (DRV), and dynamic recrystallization (DRX) occur during hot forming of the superalloy and result in the complex microstructure characteristics of the material [8]. Additionally, the relationship between strain and stress under different deformation conditions during hot deformation is an important tool in guiding the actual production and analysis of finite elements [9]. Hence, to better study and understand the flow behavior and microstructure evolution of superalloys, and in turn to optimize hot forming processing parameters to manufacture superalloy products with excellent performance, an accurate constitutive equation is of great importance.
Recently, many researchers have employed the Arrhenius model to investigate the deformation behavior and microstructure evolution of nickel-based alloys under high temperatures. Lin et al. [4] applied the Arrhenius model to describe the flow behavior of the work-hardening–dynamic recovery stage (WH-DRV) and dynamic softening stage of a typical Ni-based superalloy, incorporating the combined effects of temperature, strain rate, and strain. Ma et al. [10] utilized the Arrhenius equation to construct the constitutive model for strain compensation of a GH901 superalloy. Jiang et al. [11] proposed a segmented dynamic recrystallization fraction model of strain rate to reflect DRX kinetics behavior of alloy 617B by using the Arrhenius type function, which can express peak strain. The above studies focused on the phenomenological method to establish the constitutive model of a superalloy, combining proper mathematical equations with experimental data, which can be able to accurately predict flow stress, but the physical essence of material forming is not very clear.
The physically based constitutive model can help us better understand the essence of material deformation and has higher accuracy, combining DRX kinetics with dislocation density theory. It has been applied widely by many scholars in recent years. Lin et al. [12] developed a physically based constitutive model to investigate the hot forming behavior of flow stress for a Ni-based superalloy according to dislocation density theory. He et al. [13] developed a two-stage physically based constitutive model of a nitrogen-alloyed ultralow-carbon stainless steel based on dislocation density theory and DRX kinetics. Wan et al. [14] developed a physically based constitutive model based on strain compensation for accurately estimating the flow stress of the Ti-12Mo-4Zr-5Sn alloy, considering the relationship between Young’s modulus and self-diffusion coefficient and temperature. According to the researches above, it has been demonstrated that segmented physically based constitutive models can effectively predict and interpret the hot deformation behavior of metal materials.
Experimental studies have revealed that the main strengthening phase of a Ni-Cr-Co-based superalloy is γ′-Ni3(Al, Ti) [1,2]. The volume fraction of γ′ is about 45%, which leads to microstructure evolution being more complicated within the metal during hot forming. Accordingly, the high-temperature hot compression tests were carried out with a temperature range of 1323–1423 K and strain rates of 0.01, 0.1, 1, and 5 s−1 using a Gleeble-3500 thermal-mechanical simulator. The microstructure of a Ni-Cr-Co-based superalloy was observed by the electron backscatter diffraction (EBSD) technique. The hot flow behavior and the microstructure evolution characteristics during hot deformation were investigated. A two-stage physically based constitutive model was developed to describe the effects of work-hardening, dynamic softening, and dislocation evolution on the flow stress of a hot-formed Ni-Cr-Co-based superalloy on the basis of dislocation density theory and the kinetics of dynamic recrystallization. The dynamic recrystallization grain size model was established to evaluate the microstructure evolution behavior. The constitutive models established are compared with the experiment results, and the accuracy of the predicted model is analyzed.

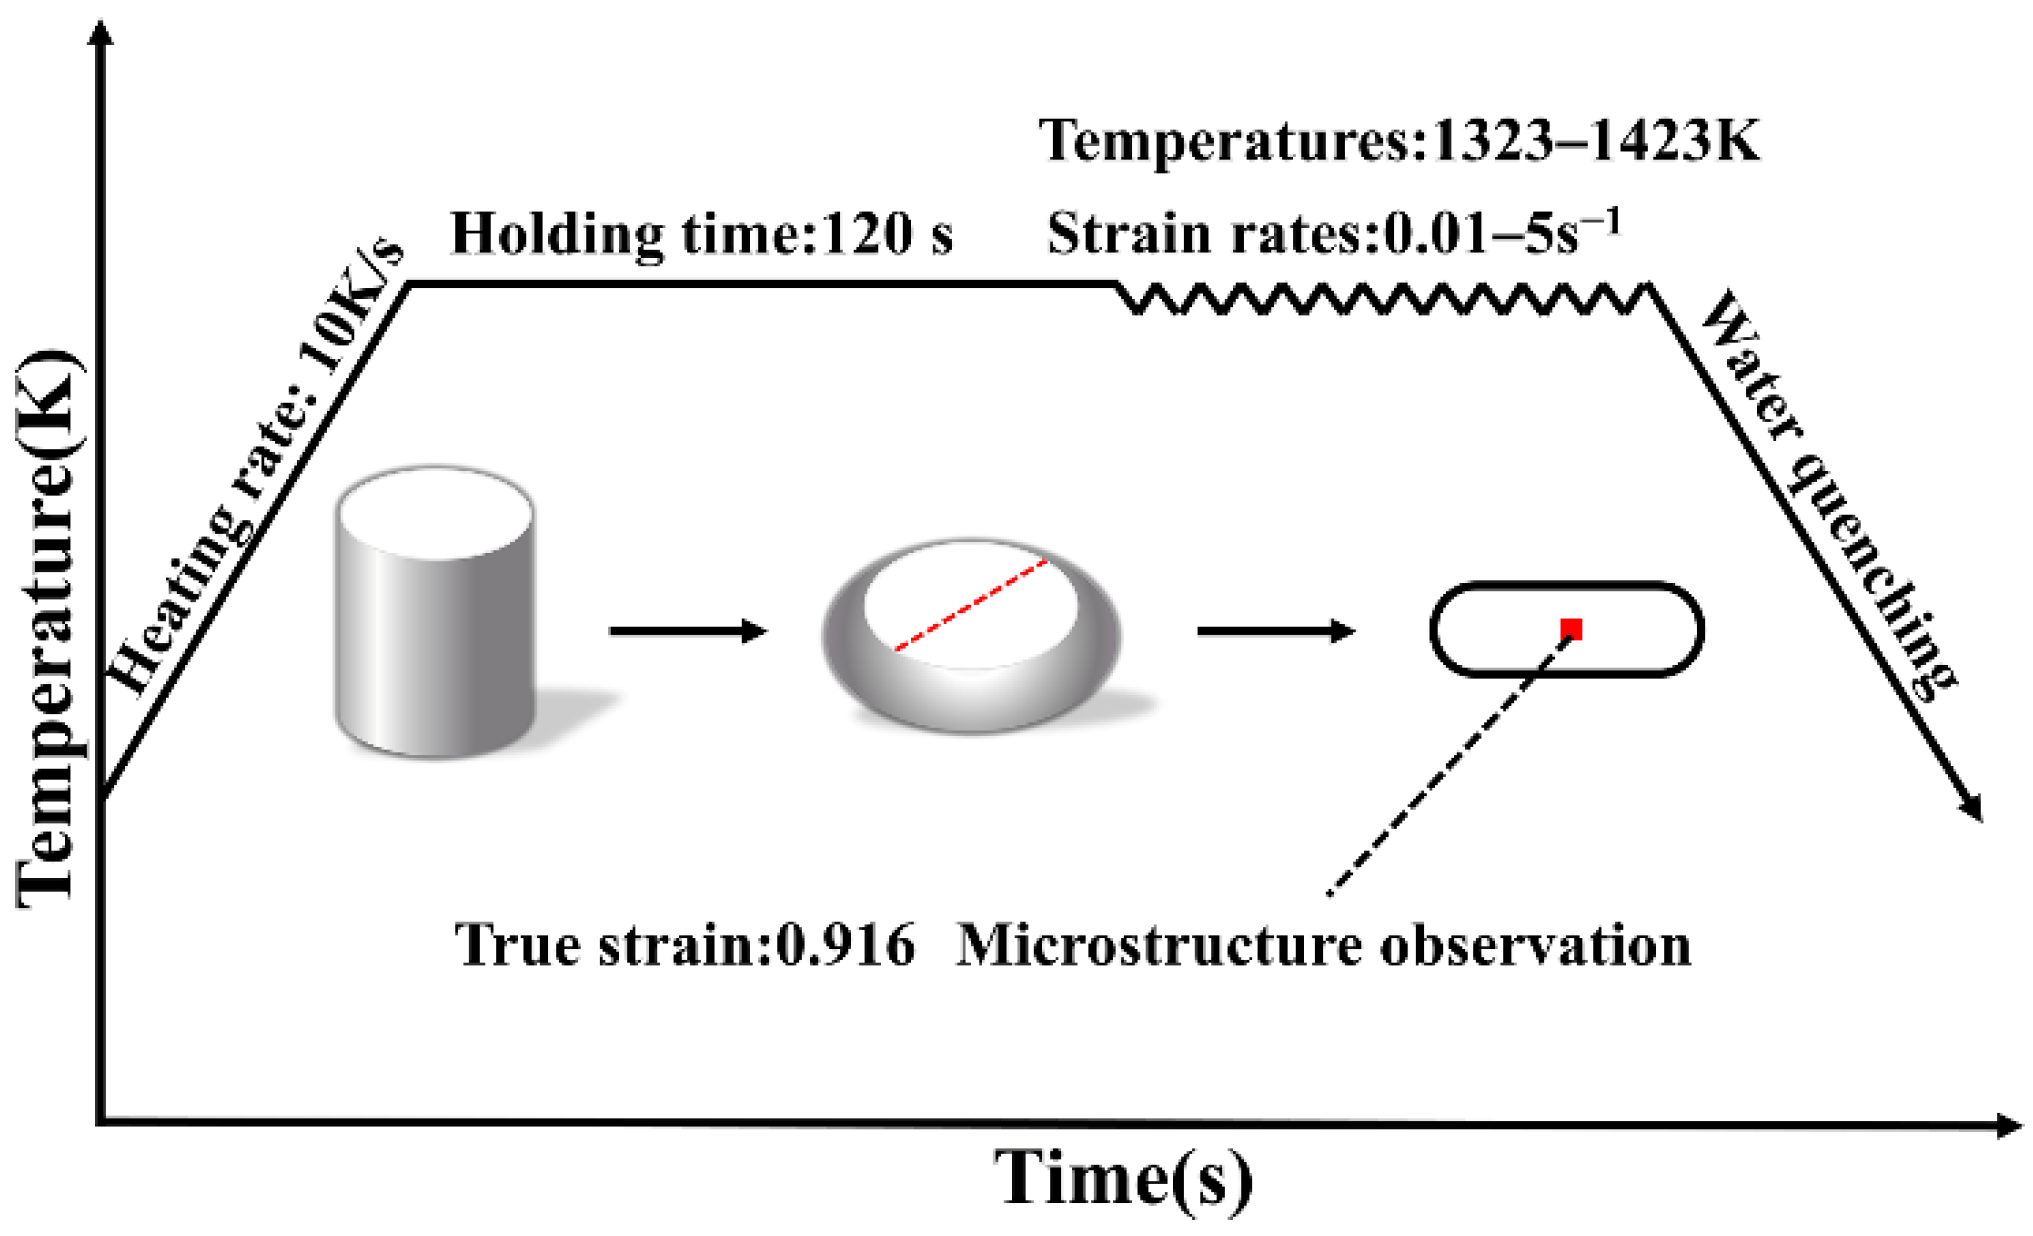
2. Material and Experimental Details

The chemical compositions (wt.%) of Ni-Cr-Co-based superalloy are as follows: 0.05C-17.7Cr-15.7Co -3.2Mo-1.5W-0.18Fe-0.03B-2.5Al-4.7Ti-0.04Zr and (Bal.) Ni. The specimens were machined from a forged bar to a diameter of 8 mm and a height of 12 mm in accordance with the ASTM E209 standard for hot compression tests of metallic materials at elevated temperatures. Following the experimental plans presented in Figure 1, various hot compression tests were performed using the Gleeble-3500 thermal simulator (Dynamic Systems Inc. (DSI), Poestenkill, NY, USA). The hot deformation temperatures were 1323, 1353, 1373, 1393, and 1423 K, and the strain rates were 0.01, 0.1, 1 and 5 s−1, respectively. The height of all samples was compressed by 60%, resulting in a true strain of 0.916. The thermocouple was welded to the sample before each test to identify the temperature precisely. Concurrently, to diminish the friction between the sample surface and anvils during the hot compression tests, graphite lubricants and tantalum foils were added. Subsequently, a 10 K/s rate of heating was used to reach the set deformation temperature, and an isothermal hold was performed for 120 s to ensure that the temperature was uniform throughout the sample. Finally, the compressed sample was instantly quenched in cold water to retain the microstructure at elevated temperatures.
Microstructural analysis of the compressed samples at different parameters was performed utilizing electron backscatter diffraction (EBSD) technology of EDAX-TSL Hikari (AMETEK Inc., Beijing, China) to investigate the deformation mechanisms of studied superalloy. To begin with, the sections of compressed samples obtained from splitting along the compression axis in the center were ground by using sandpaper with different mesh numbers in turn, then polished with 9, 3, and 1 μm diamond solution for 10 min, and finally vibration polished with 50 nm amorphous silica gel solution for 8 h to achieve an unblemished surface without residual stress. The commercial software application known as HKL Channel 5 and OIM analysis software were used for analyzing the EBSD data.

3. Experimental Results and Analysis

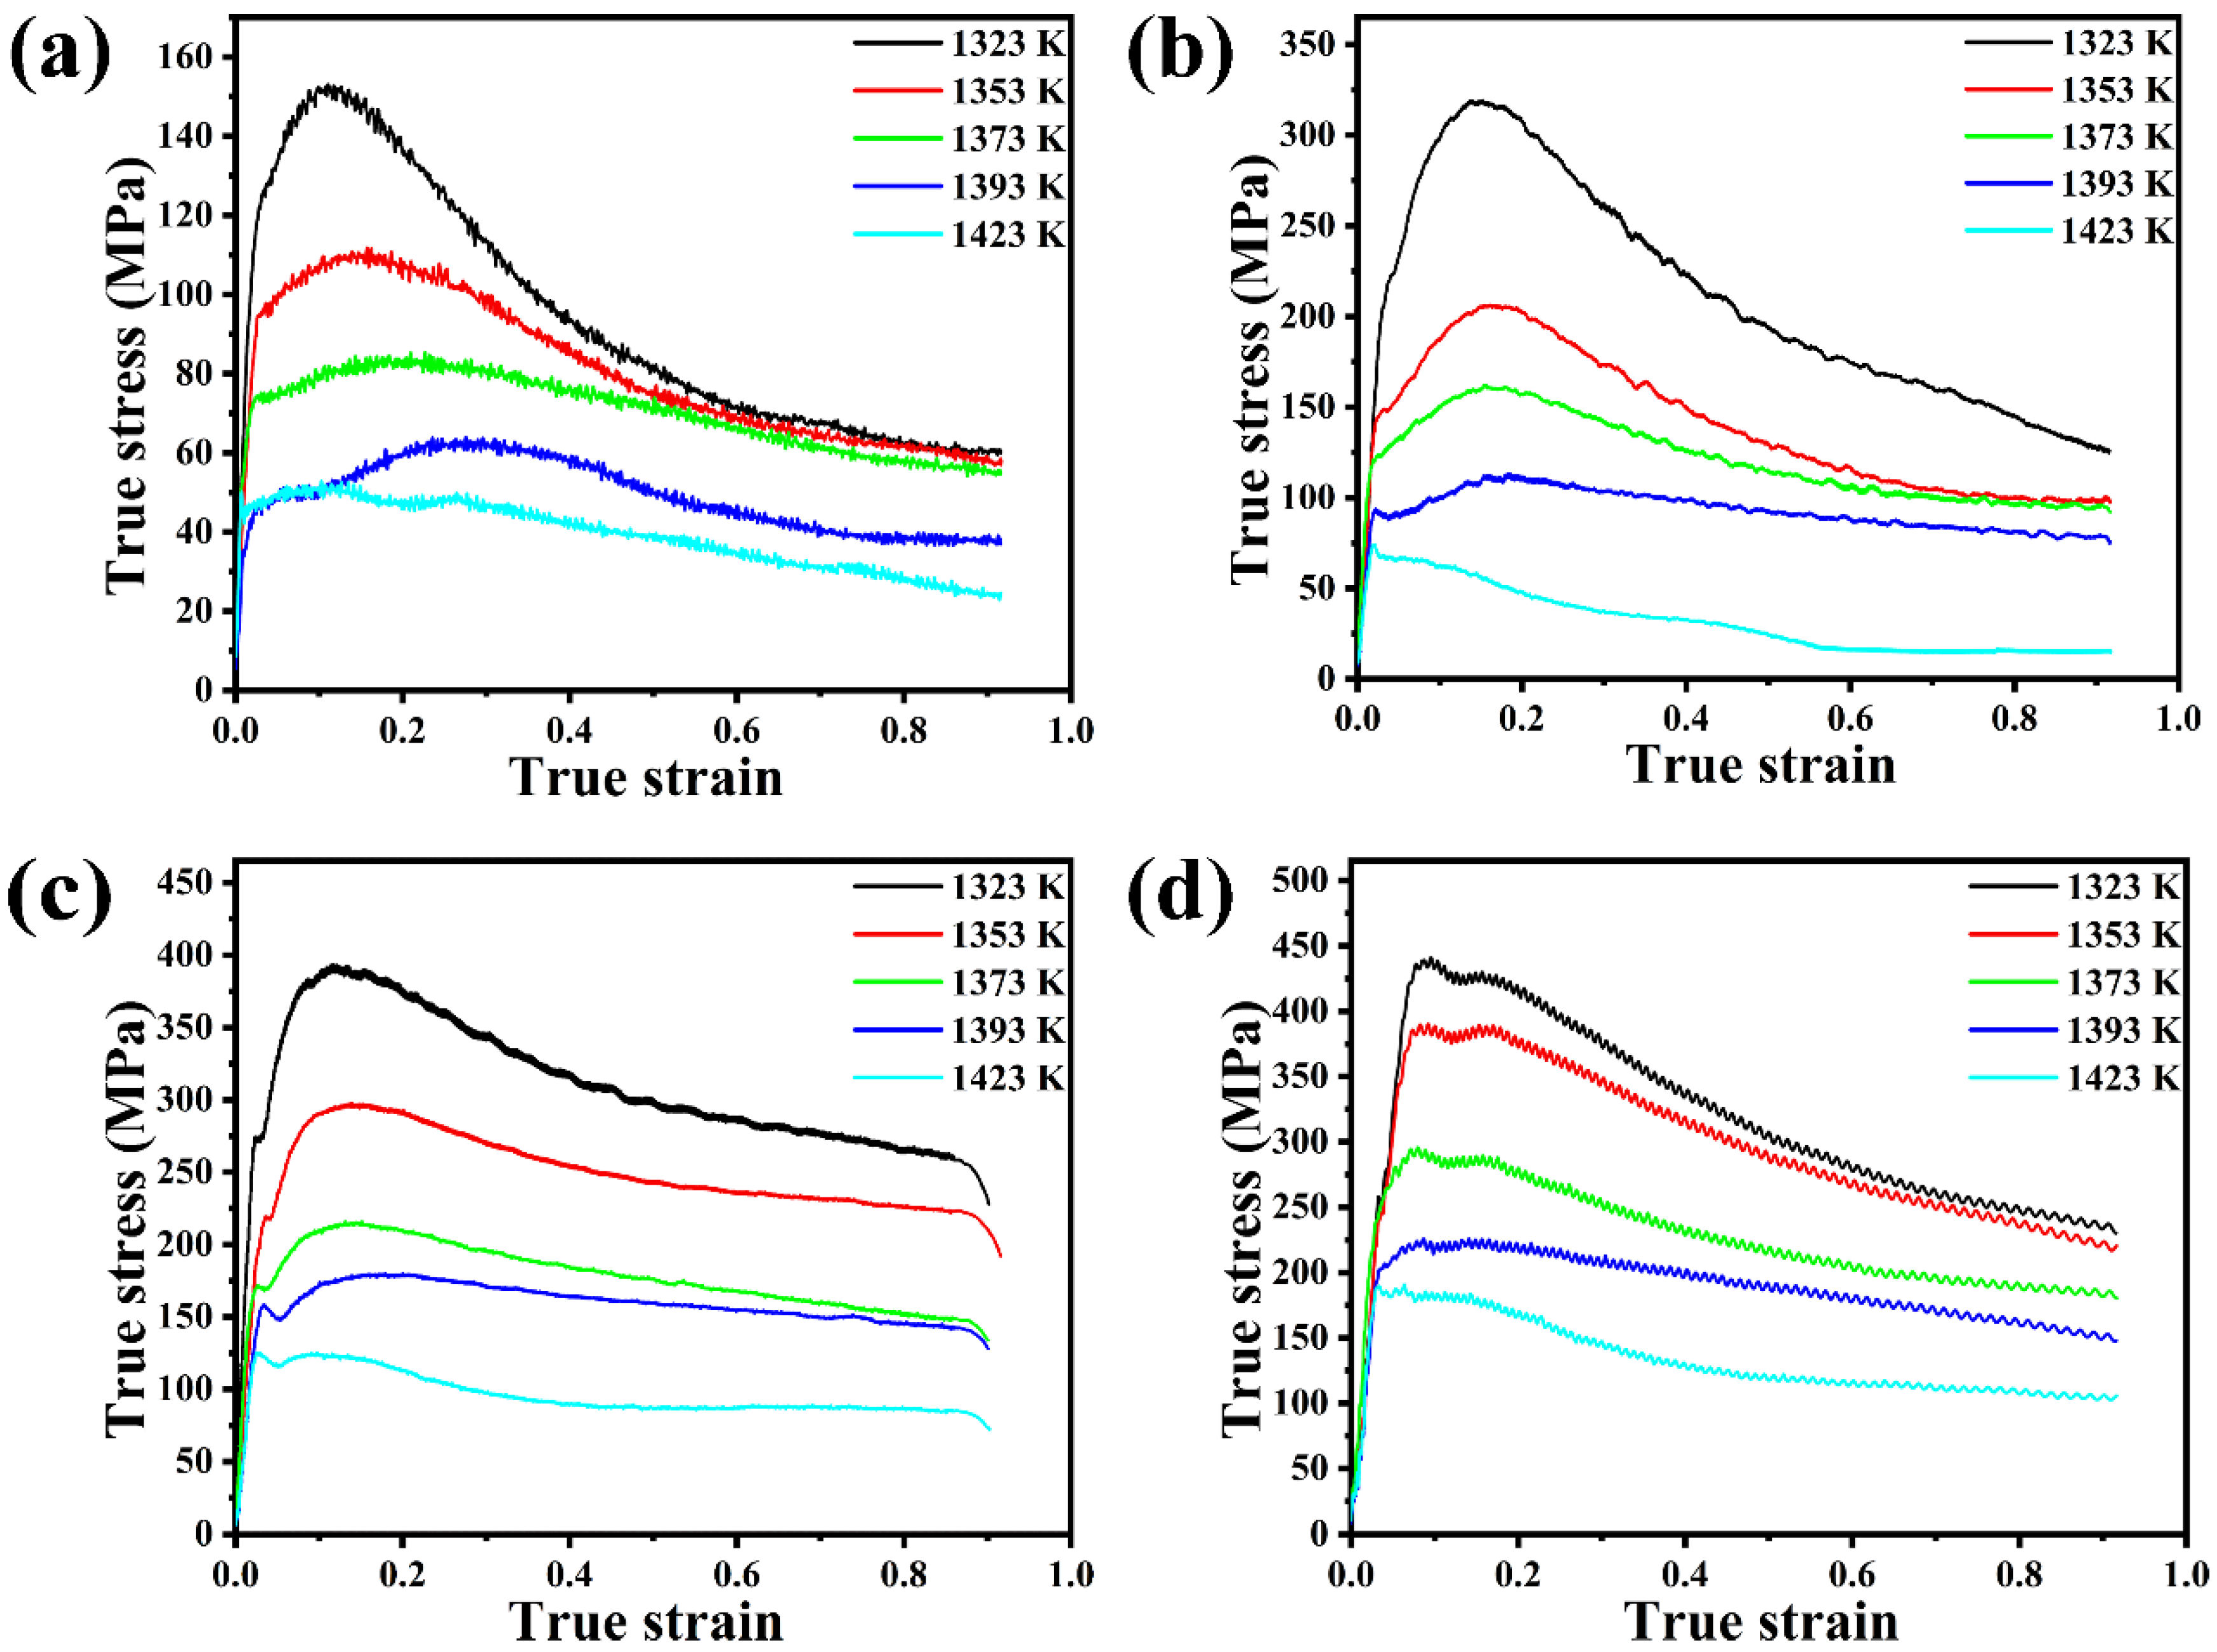
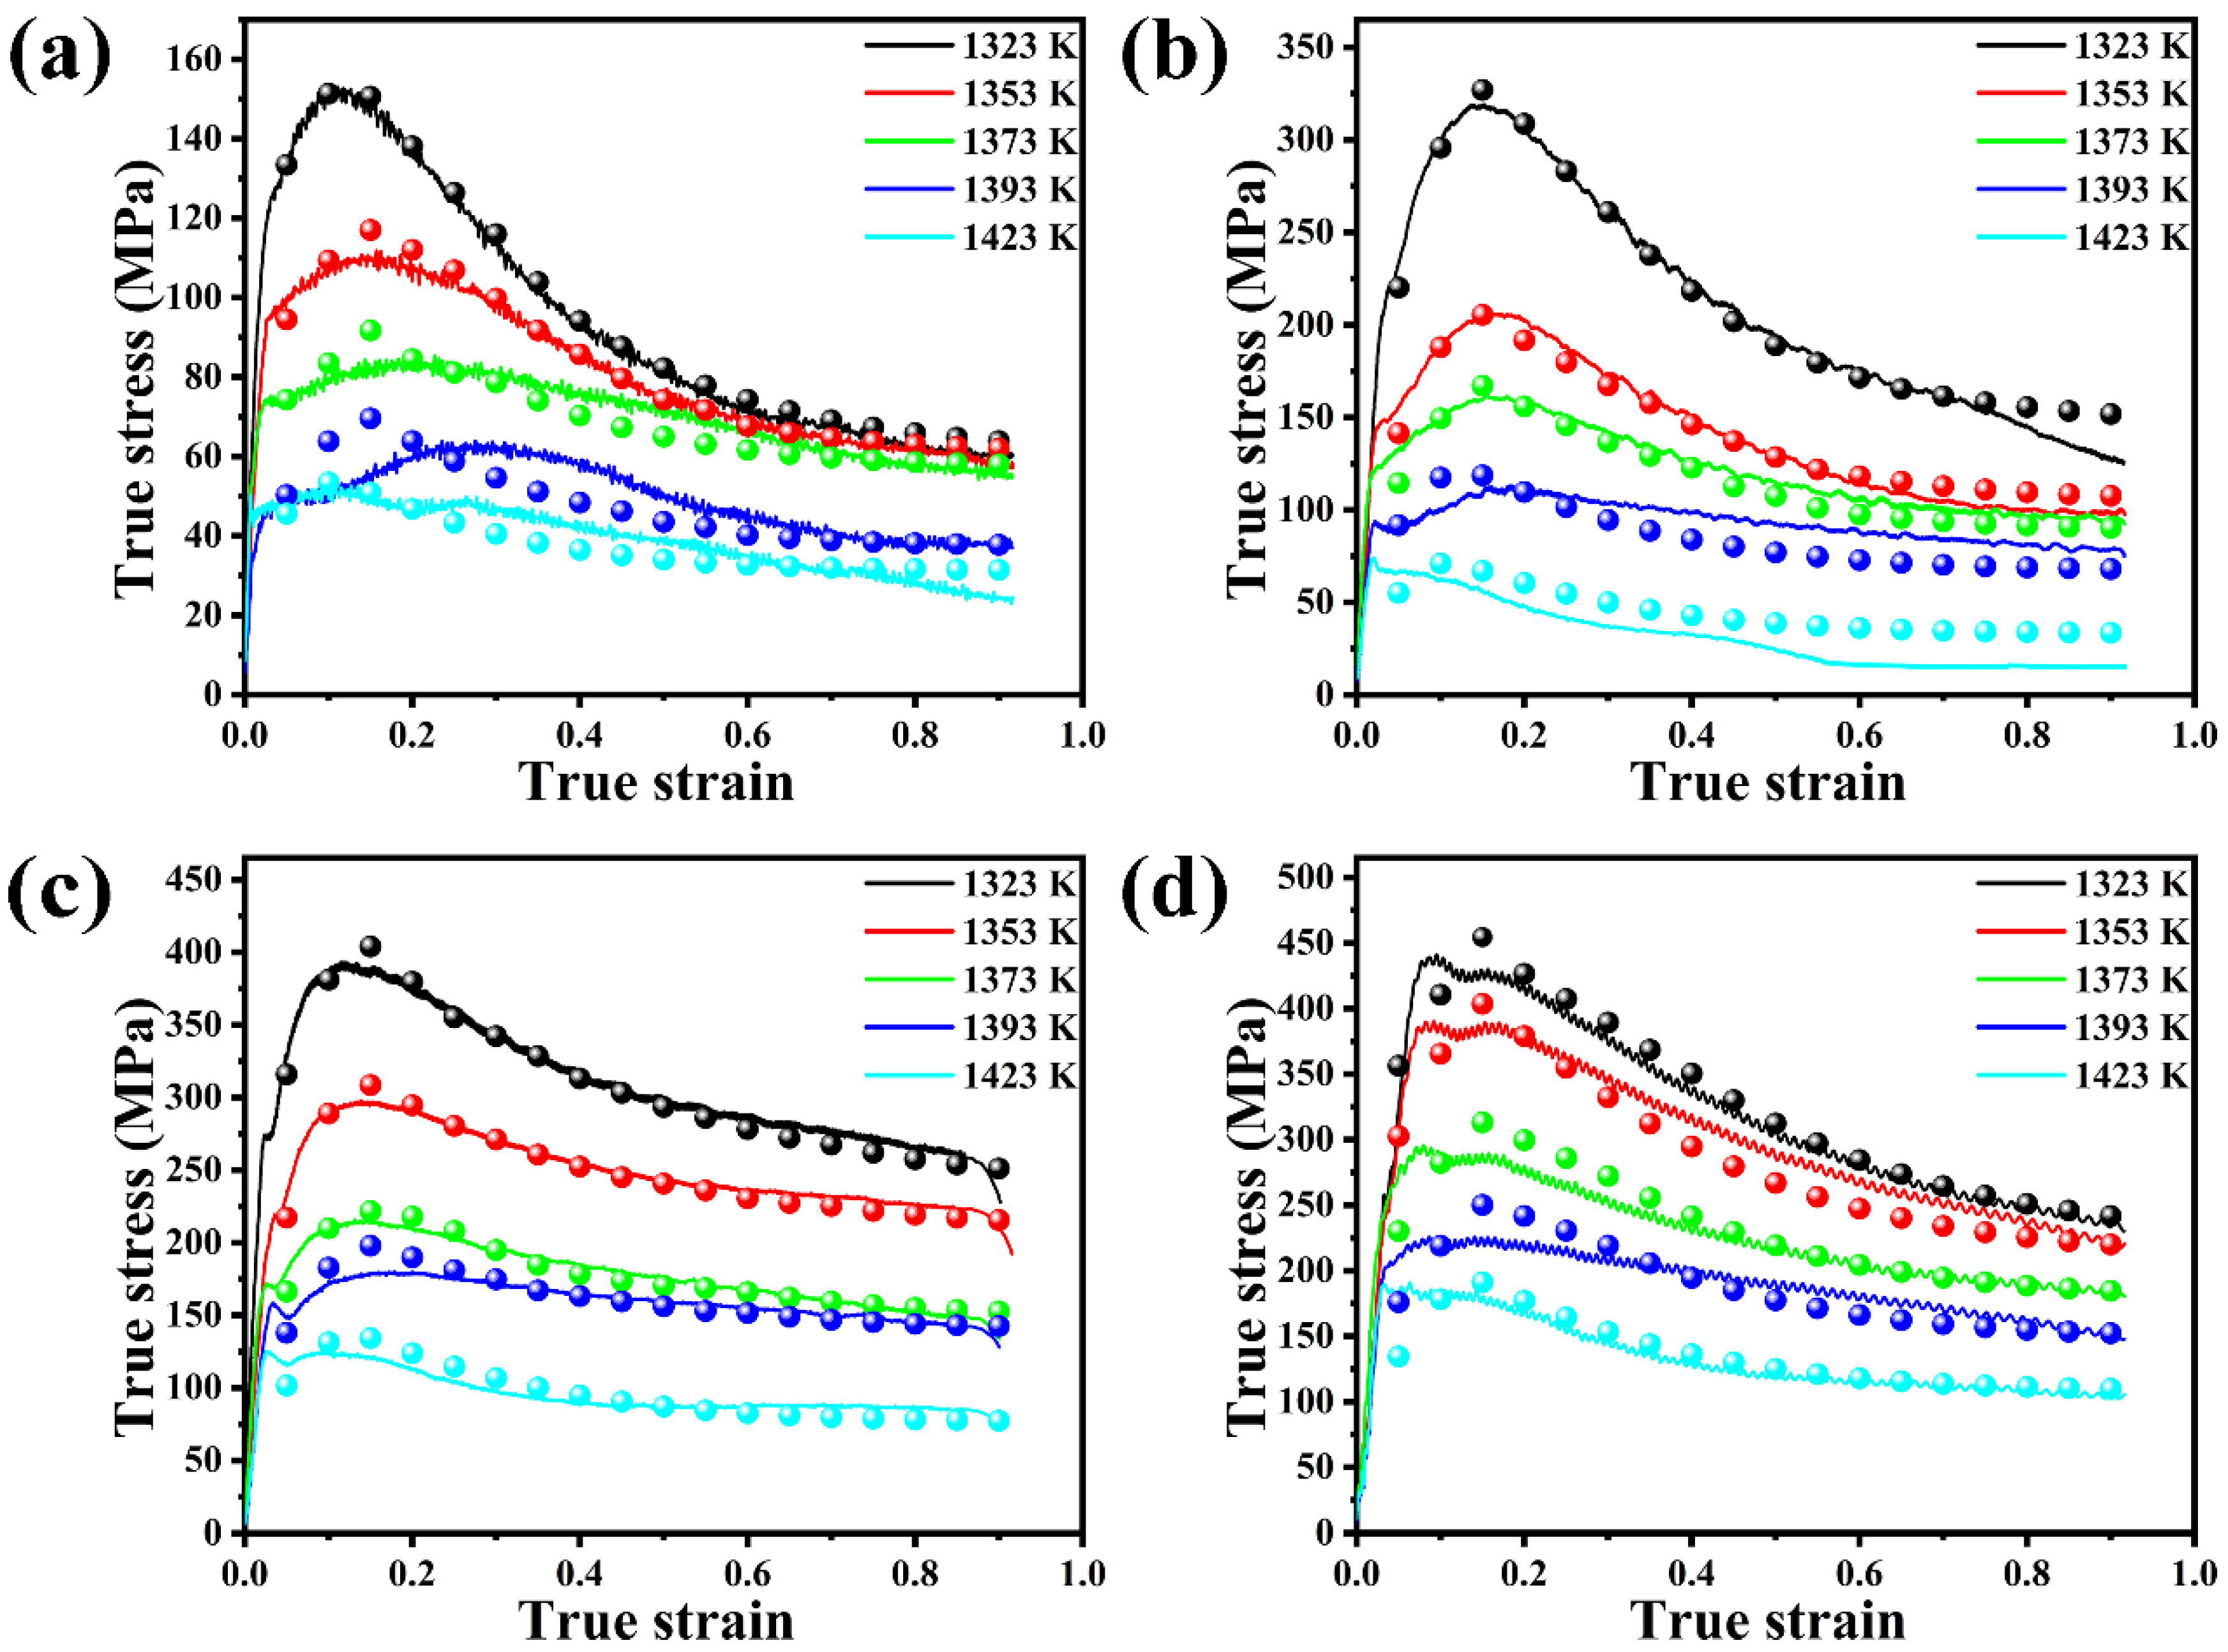
3.1. True Stress–Strain Curves

Figure 2 shows the true stress–strain curves of the Ni-Cr-Co-based superalloy at deformation temperatures ranging from 1323 K to 1423 K and a strain rate of 0.01–5 s−1. As illustrated in Figure 2, there is a strong relationship between the flow stress and deformation parameters. The lower the deformation temperature, the higher the flow stress in the case of constant strain rate. When the deformation temperature is constant, the faster the strain rate, the higher the flow stress. Furthermore, it also can be seen from Figure 2 that the flow stress increases rapidly in the initial deformation stage, then reaches a peak value with the increase in strain, later gradually decreases as the compression test proceeds, and finally remains almost unchanged at certain strains. According to the characteristics of these curves, the flow stress–strain curves of the Ni-Cr-Co-based superalloy show three obvious stages: stage I (work-hardening (WH) stage), stage II (dynamic softening (DRV and DRX) stage), and stage III (steady stage). This is a consequence of the competition between work-hardening (WH) and dynamic softening (DRV and DRX). During the work-hardening stage (stage I), the number of dislocations increases dramatically, contributing to the flow stress increasing rapidly to an extreme. Subsequently, dynamic softening behaviors such as DRX can be induced by the progressive increase in strain, resulting in a reduction in dislocation density and counteracting the work-hardening effect [15,16,17,18].
In Figure 2, a noticeable difference can also be observed, in that the stress–strain curves present an apparent single-peak characteristic and then decrease progressively at the low temperatures of 1323 K and 1353 K. When the deformation temperature is greater than 1353 K, the flow stress drops very slowly after it reaches peak stress. The peak stress decreases with increasing deformation temperature and decreasing strain rate. This is because dislocation is annihilated easily by climbing temperature, the DRV easily takes place, and the nucleation rate and growth rate of dynamically recrystallized grains also increase through the mobility of grain boundaries under the high formation temperature. Thus, the balance between work-hardening and dynamic softening could be efficiently achieved. Accordingly, the flow stress dropping stages were shortened.

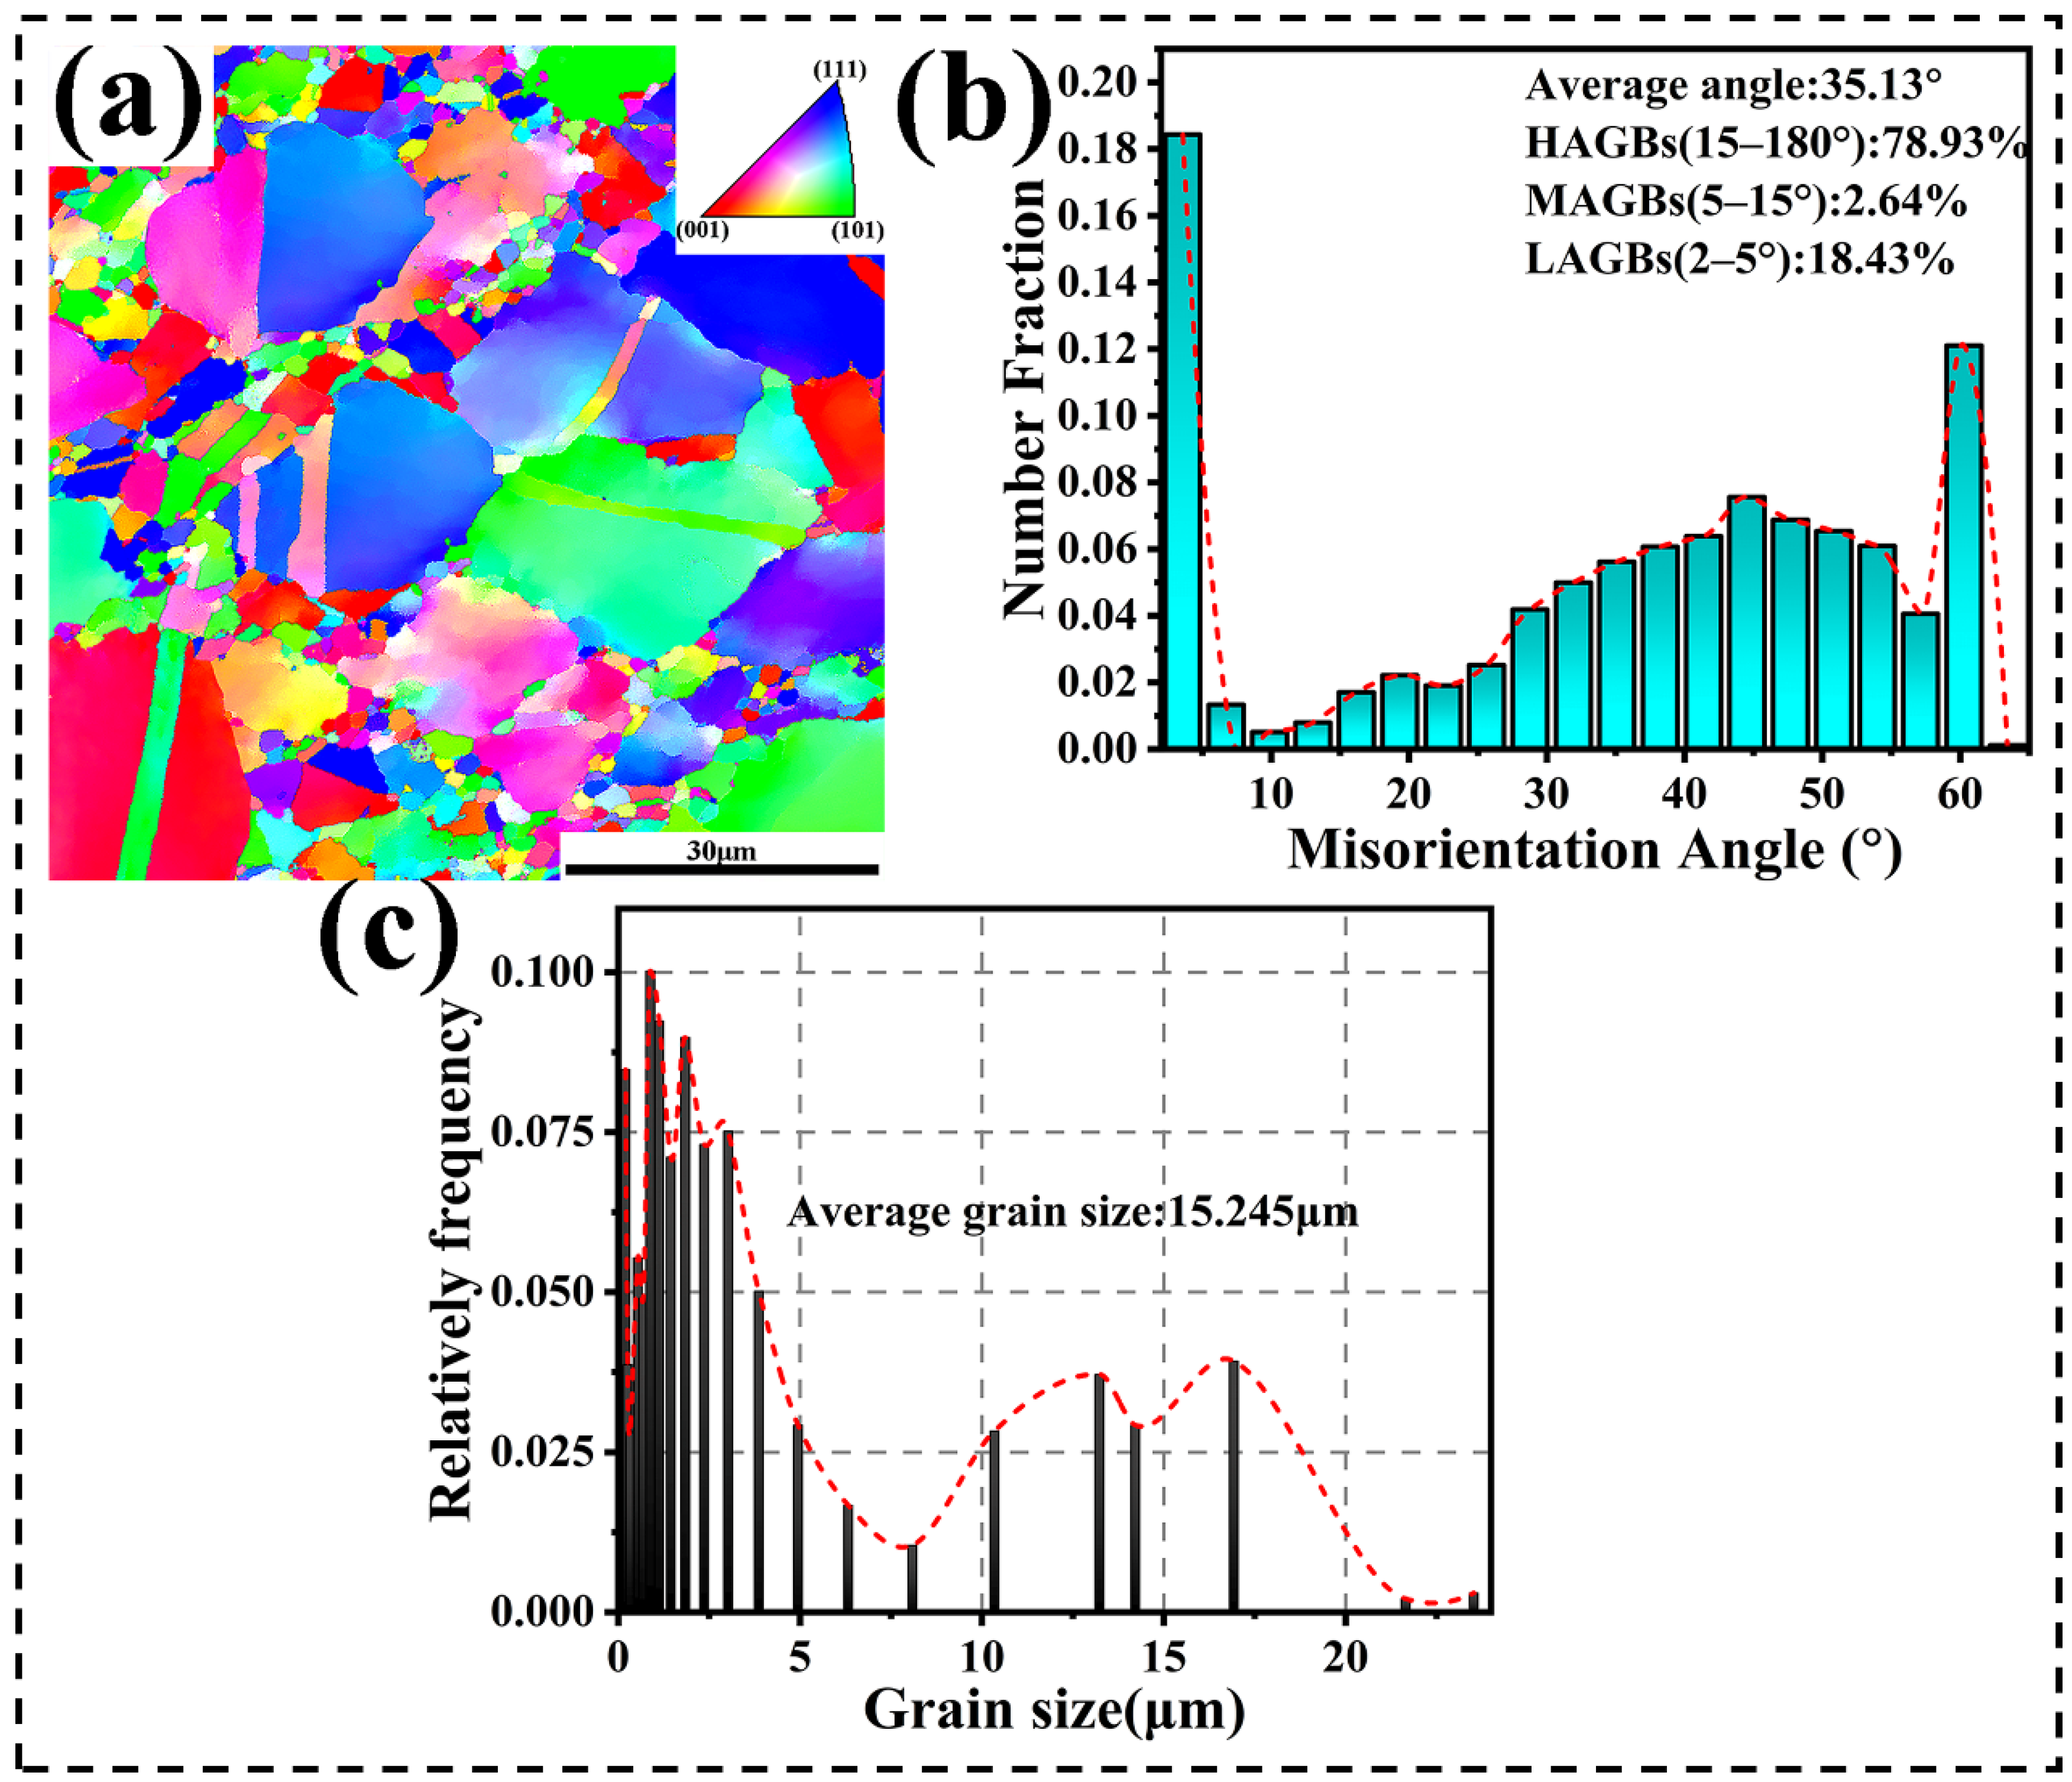
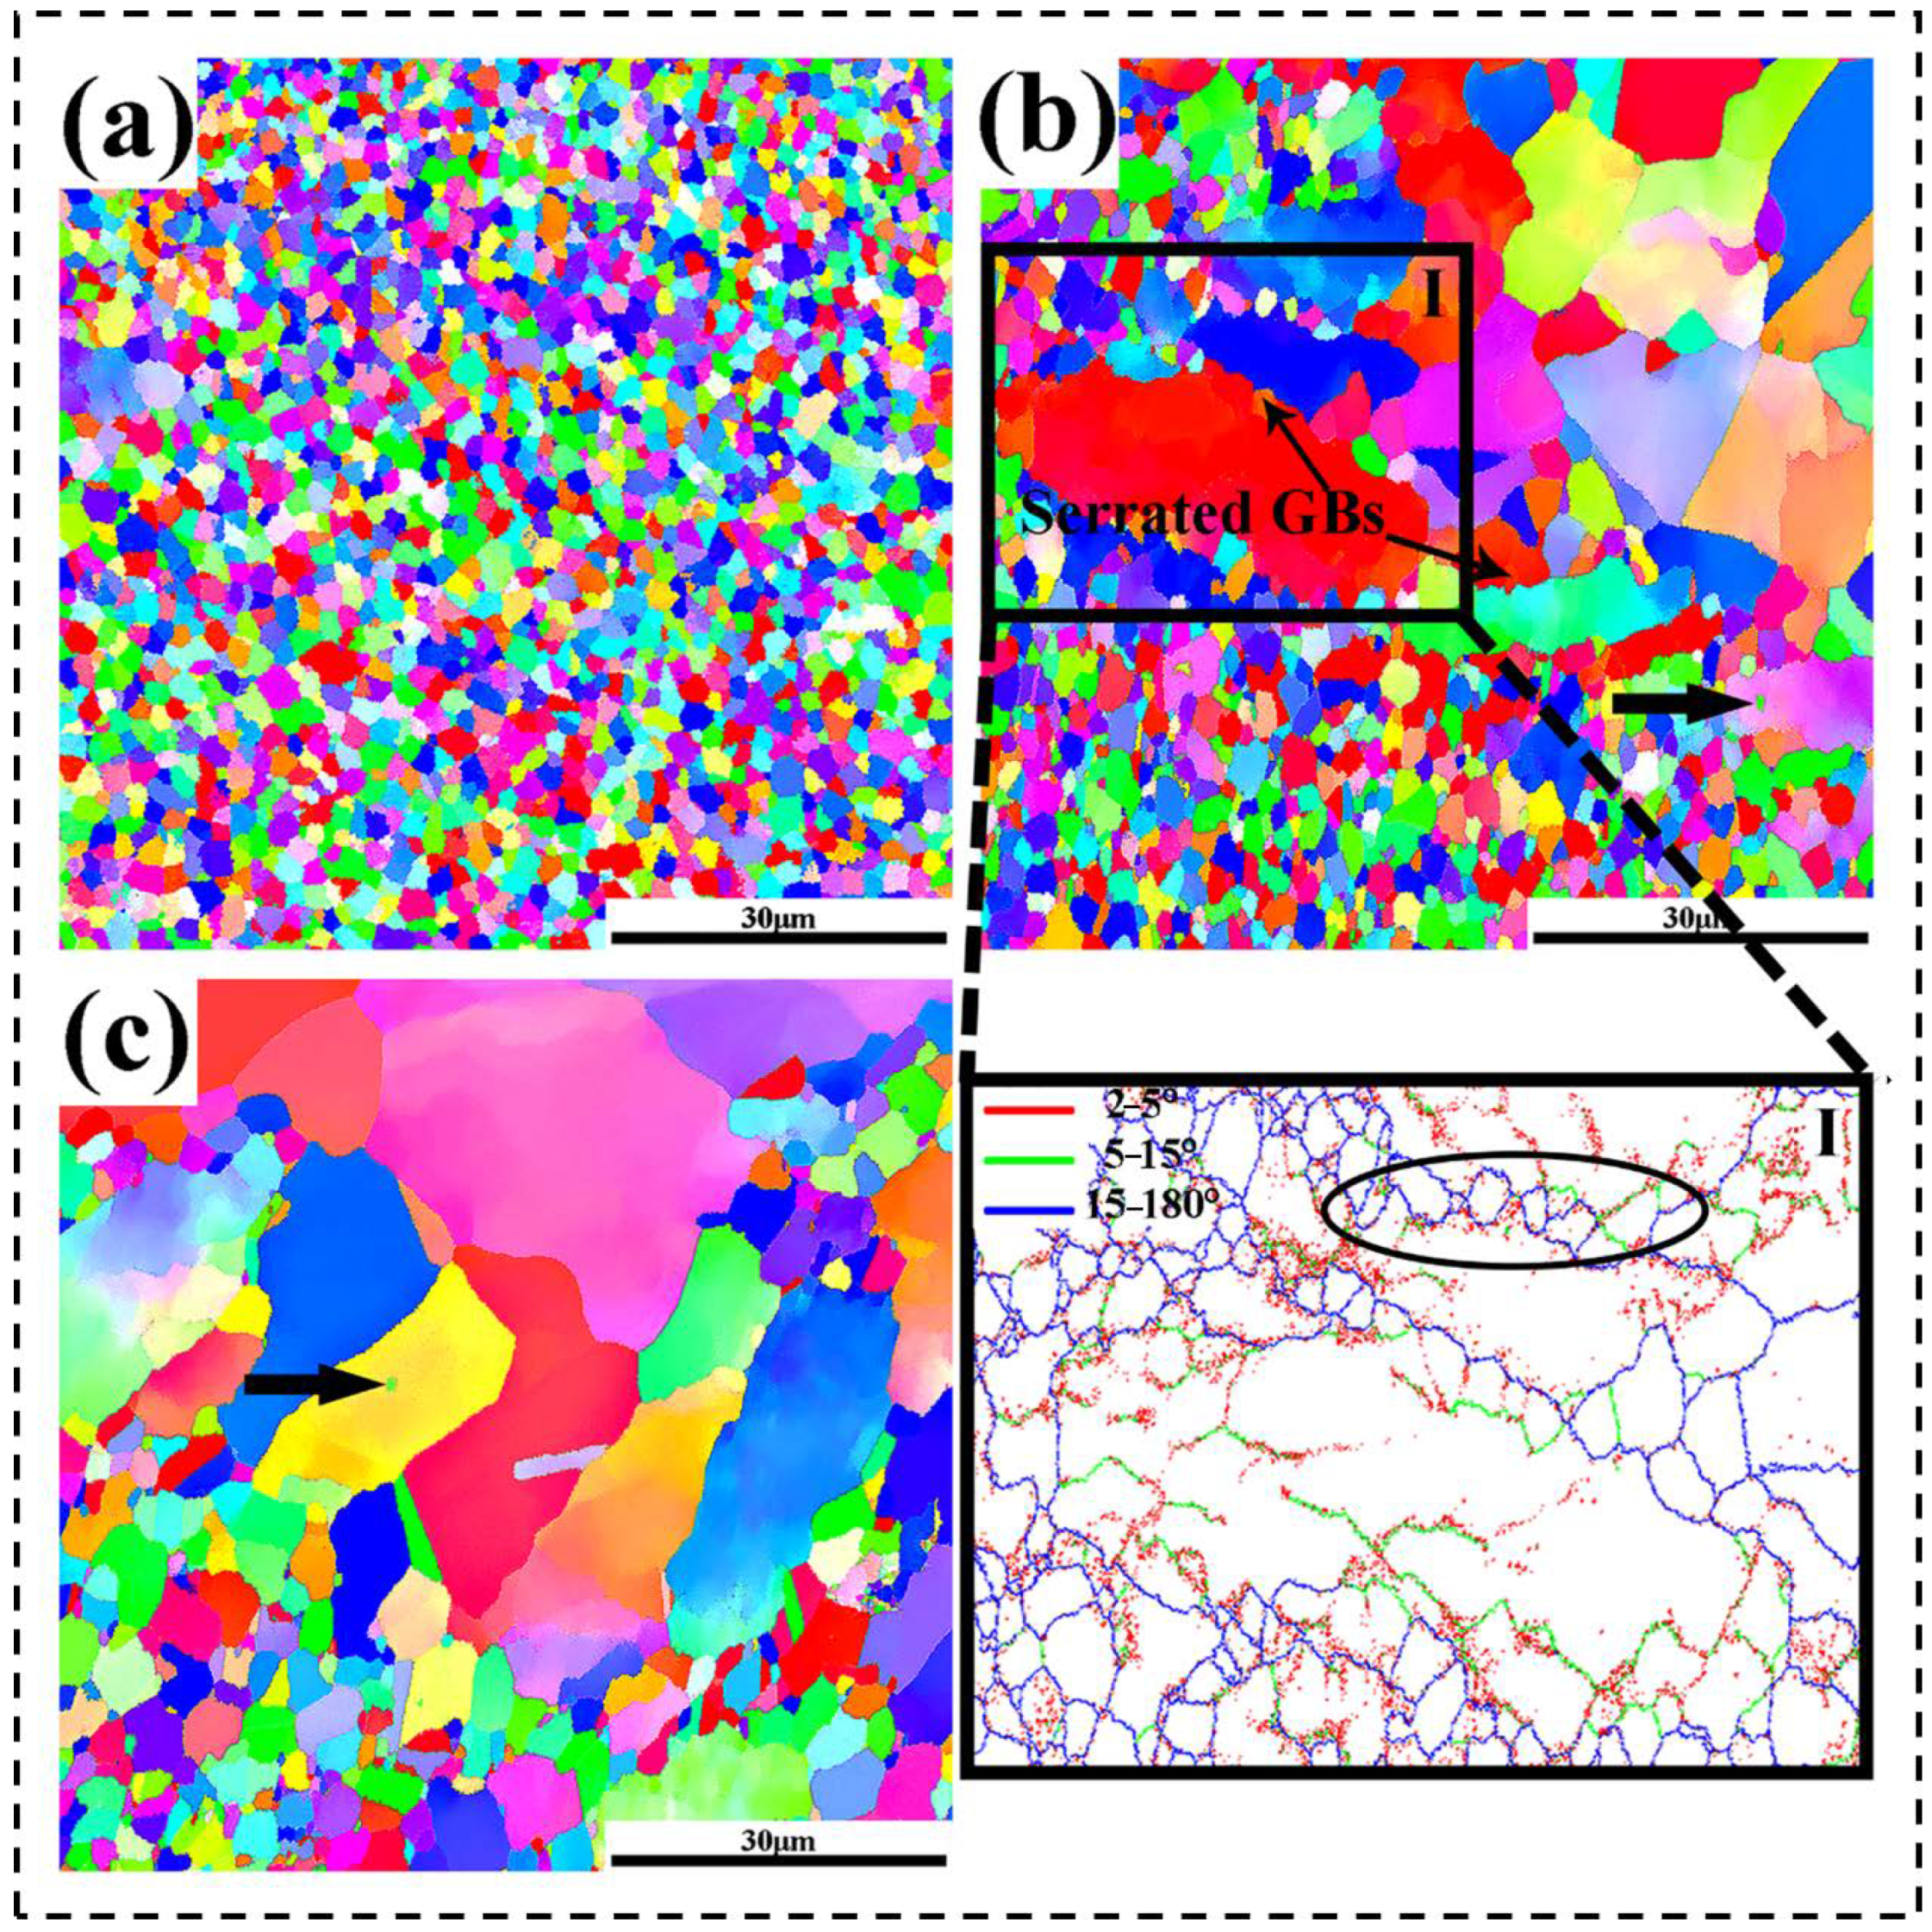
3.2. Initial Microstructure

Figure 3 illustrates the microstructure, distribution of misorientation angle, and grain size of the original condition, known as the microstructure after annealing and before hot deformation, of the studied superalloy. We can see the near-equiaxial grains formed by static recrystallization (SRX) in Figure 3a. The color codes of grain orientation in Figure 3a correspond to the inverse pole figure (IPF) maps below. In Figure 3b, the fraction of high-angle grain boundaries (HAGBs) of initial misorientation is very high. The percentages of low-angle grain boundaries (LAGBs), middle-angle grain boundaries (MAGBs), and HAGBs are 18.43, 2.64, and 78.93, respectively, and the average misorientation angle is evaluated as 35.13°. There are plentiful annealing twins with a misorientation angle greater than 15°as well as some of the small SRX grains, resulting in the erratic grain size distribution, and the average grain size (AGS) of the initial state of the studied superalloy is identified as 15.245 μm in Figure 3c.

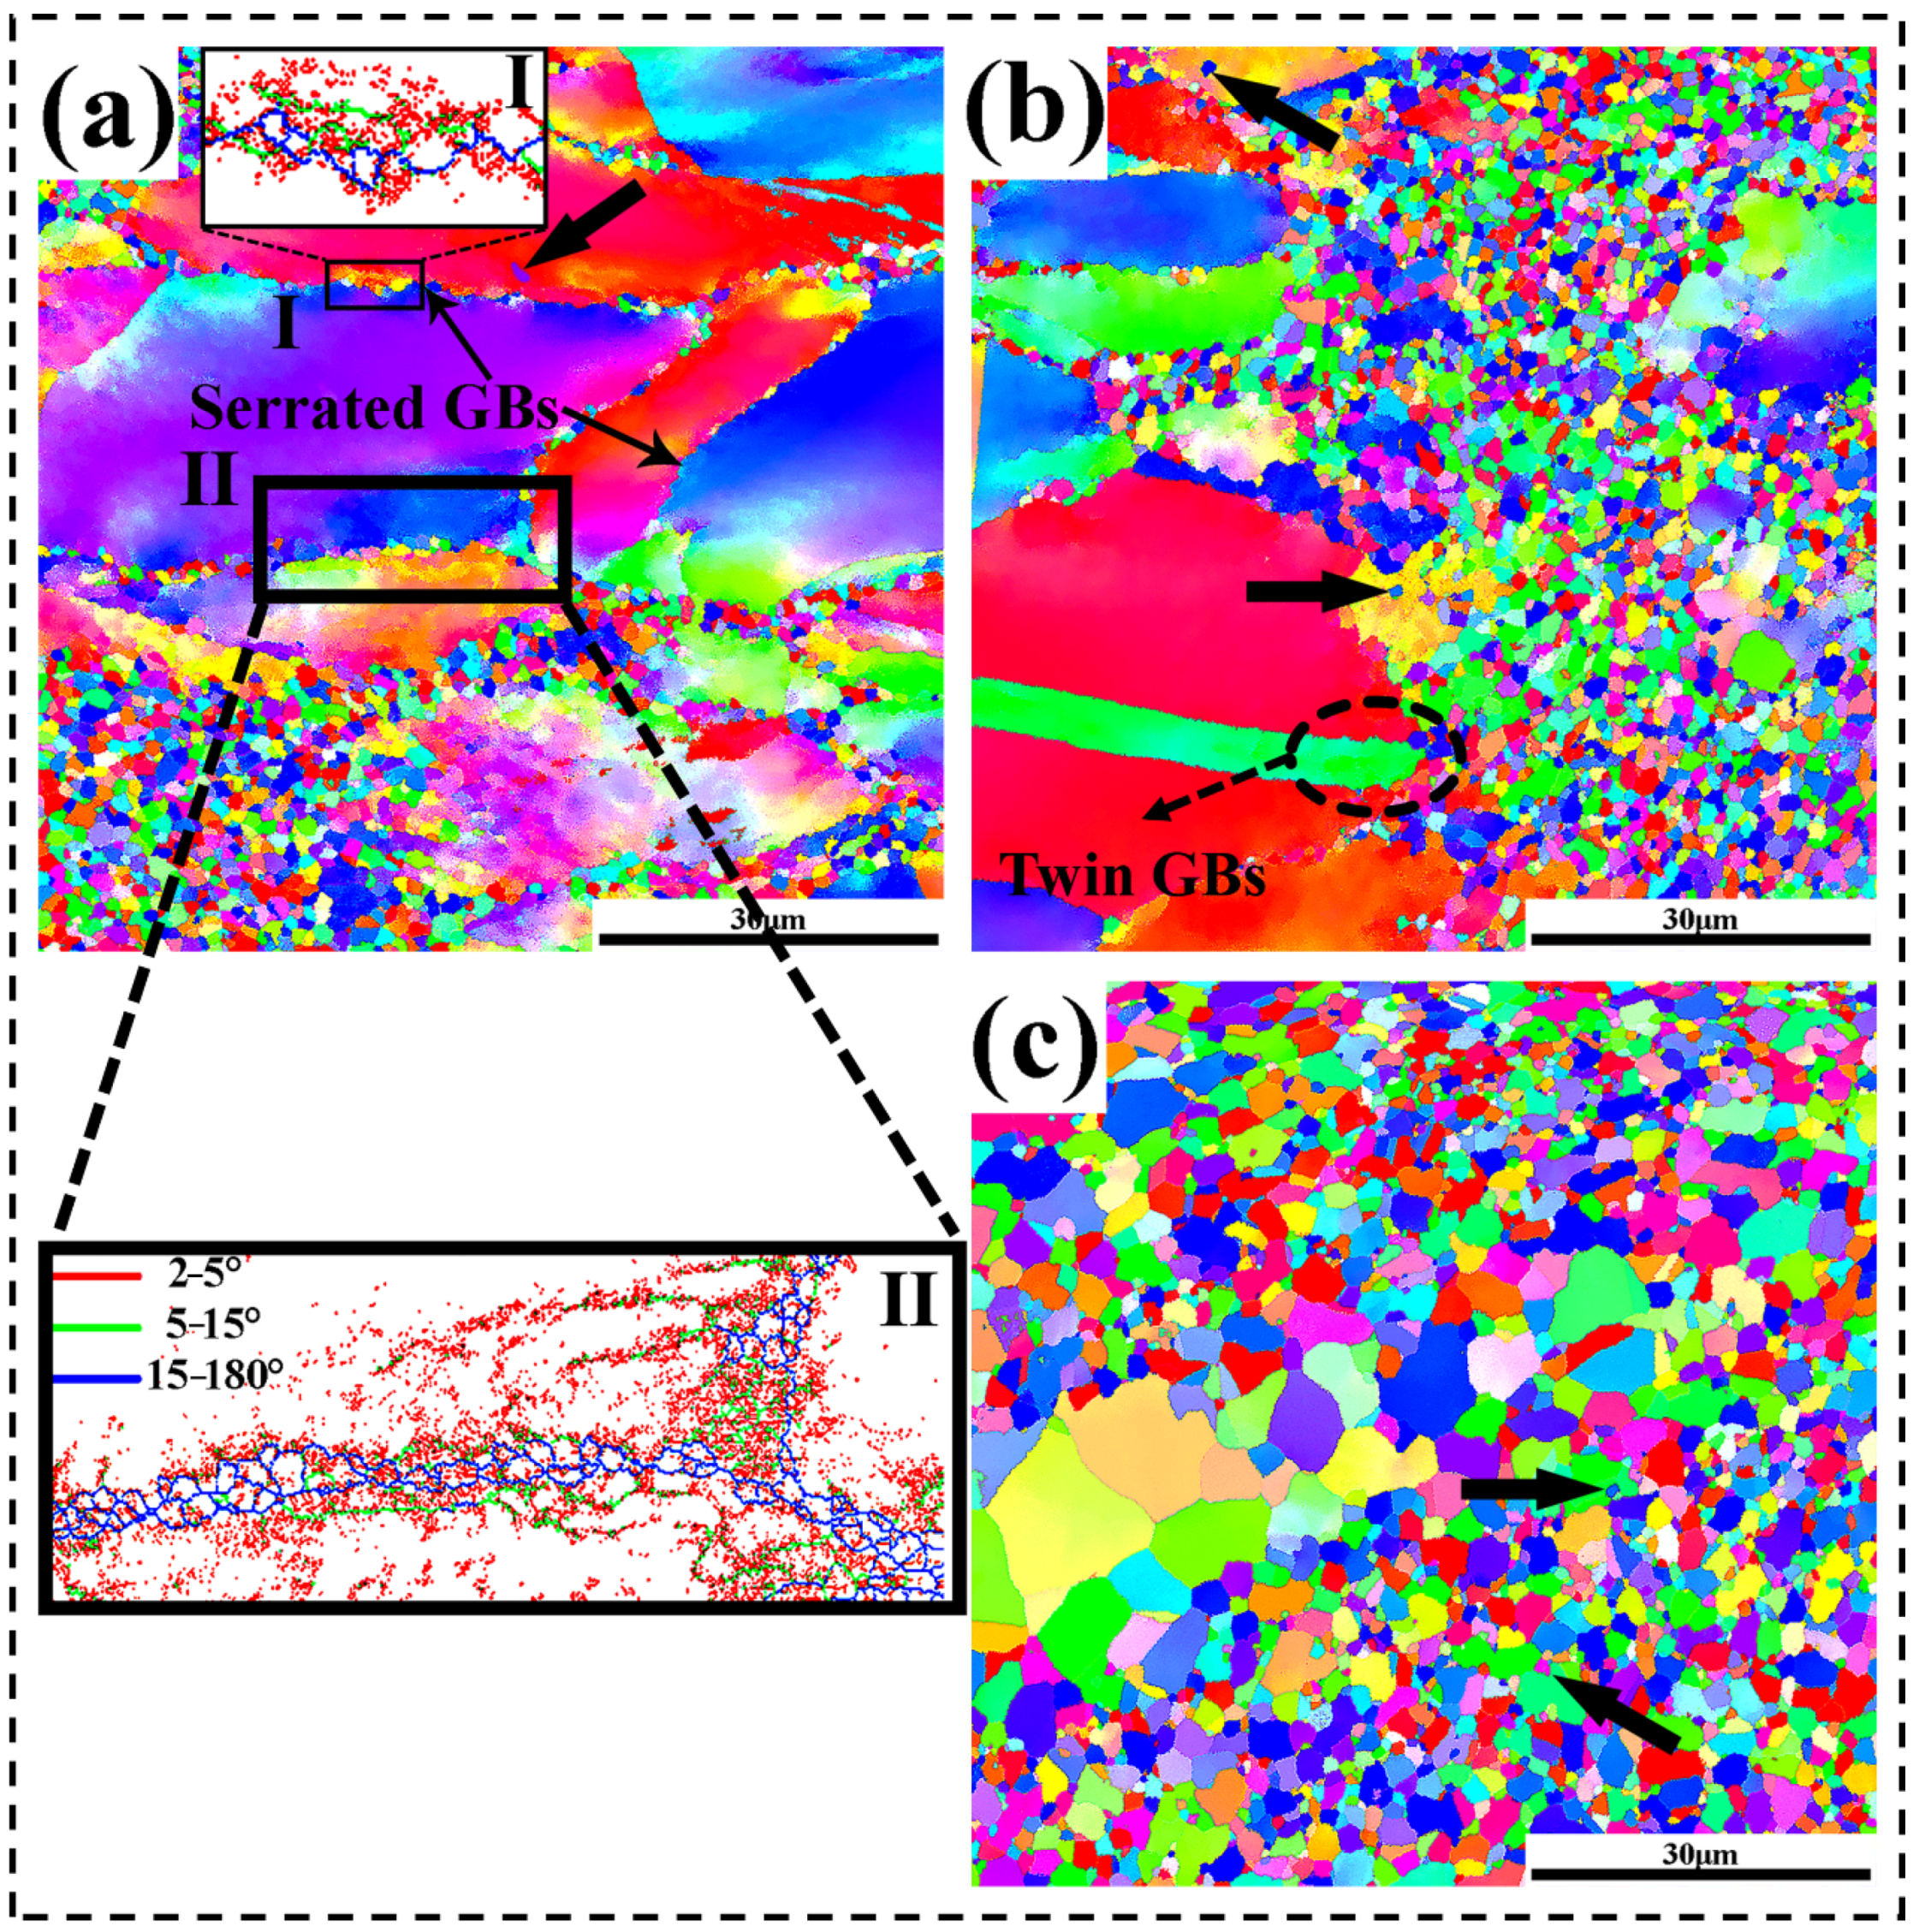
3.3. Influence of Deformation Temperature for Microstructure

The microstructures of the Ni-Cr-Co-based superalloy at varied deformation temperatures with a strain rate of 1 s−1 are shown in Figure 4. There is a clear trend that the percentage and size of DRX grains increase with increasing deformation temperature. This is due to the sufficient driving force employed for migration of the grain boundaries being enlarged by the increasing deformation temperature, which facilitates the growth of DRX grains [19]. As illustrated by the rectangular region in Figure 4a, there are DRX grains with necklace-like constructions formed along the original grain boundaries. According to the magnified view of grain boundaries of region I and region II in Figure 4a, the subgrains with LAGBs are typically attached to the original HAGBs with a sawtooth shape (serrated GBs) and also exist in the triangle junctions. In Figure 4b, some DRX grains near the initial twin grain boundaries (twin GBs) can be observed. The original twin GBs drop their twinning characteristic because of dislocation accumulation [20]. Thus, they are converted into normal HAGBs. The nucleation of DRX grains at initial twin boundaries is postponed, and more DRX grains are formed at grain boundaries. The original deformed grains practically vanish, while the DRX grains with near-equiaxed form are more prevalent at 1423 K in Figure 4c. As indicated by the arrows in Figure 4, several other DRX grains are also observed inside the larger deformed grains, which may have resulted from sub-grain boundaries migrating or sub-grains coalescing under high strain [21].

3.4. Influence of Strain Rate on Microstructure

Figure 5 shows how strain rates influence the microstructure evolution of the studied superalloy at 1393 K. With increasing strain rates, the DRX volume fraction and DRX grain size are reduced. Commonly, the higher the strain rate is, the greater dislocation density is, which is exploited for DRX grain nuclei [22]. The larger strain rate, however, leads to insufficient deformation time to impede nuclei of DRX grains from forming and growing [23]. In addition, closer inspection of Figure 5b shows that numerous bulging and serrated GBs are also observed. During subsequent hot deformation, these serrated GBs are assumed to serve as a potential site for nucleation of new grains [24,25]. Likely, a necklace-shaped arrangement of DRX grains is chiefly created at the initial grain boundary as marked with a circle in the magnified view of grain boundaries of region I in Figure 5b. The rectangular region I outlined in Figure 5b also shows the formation of new grains through the evolution of subgrains [23,26]. In this case, there is a difference in orientation between the parent grains and subgrains, and the subgrain boundaries are converted into one with a misorientation angle greater than 15 degrees. Furthermore, there are a small number of new grains emerging in the interiors of deformed grains, as shown by arrows in Figure 5b,c. It is found that these DRX grains are derived from the continuing rotation of subgrains [23,27].

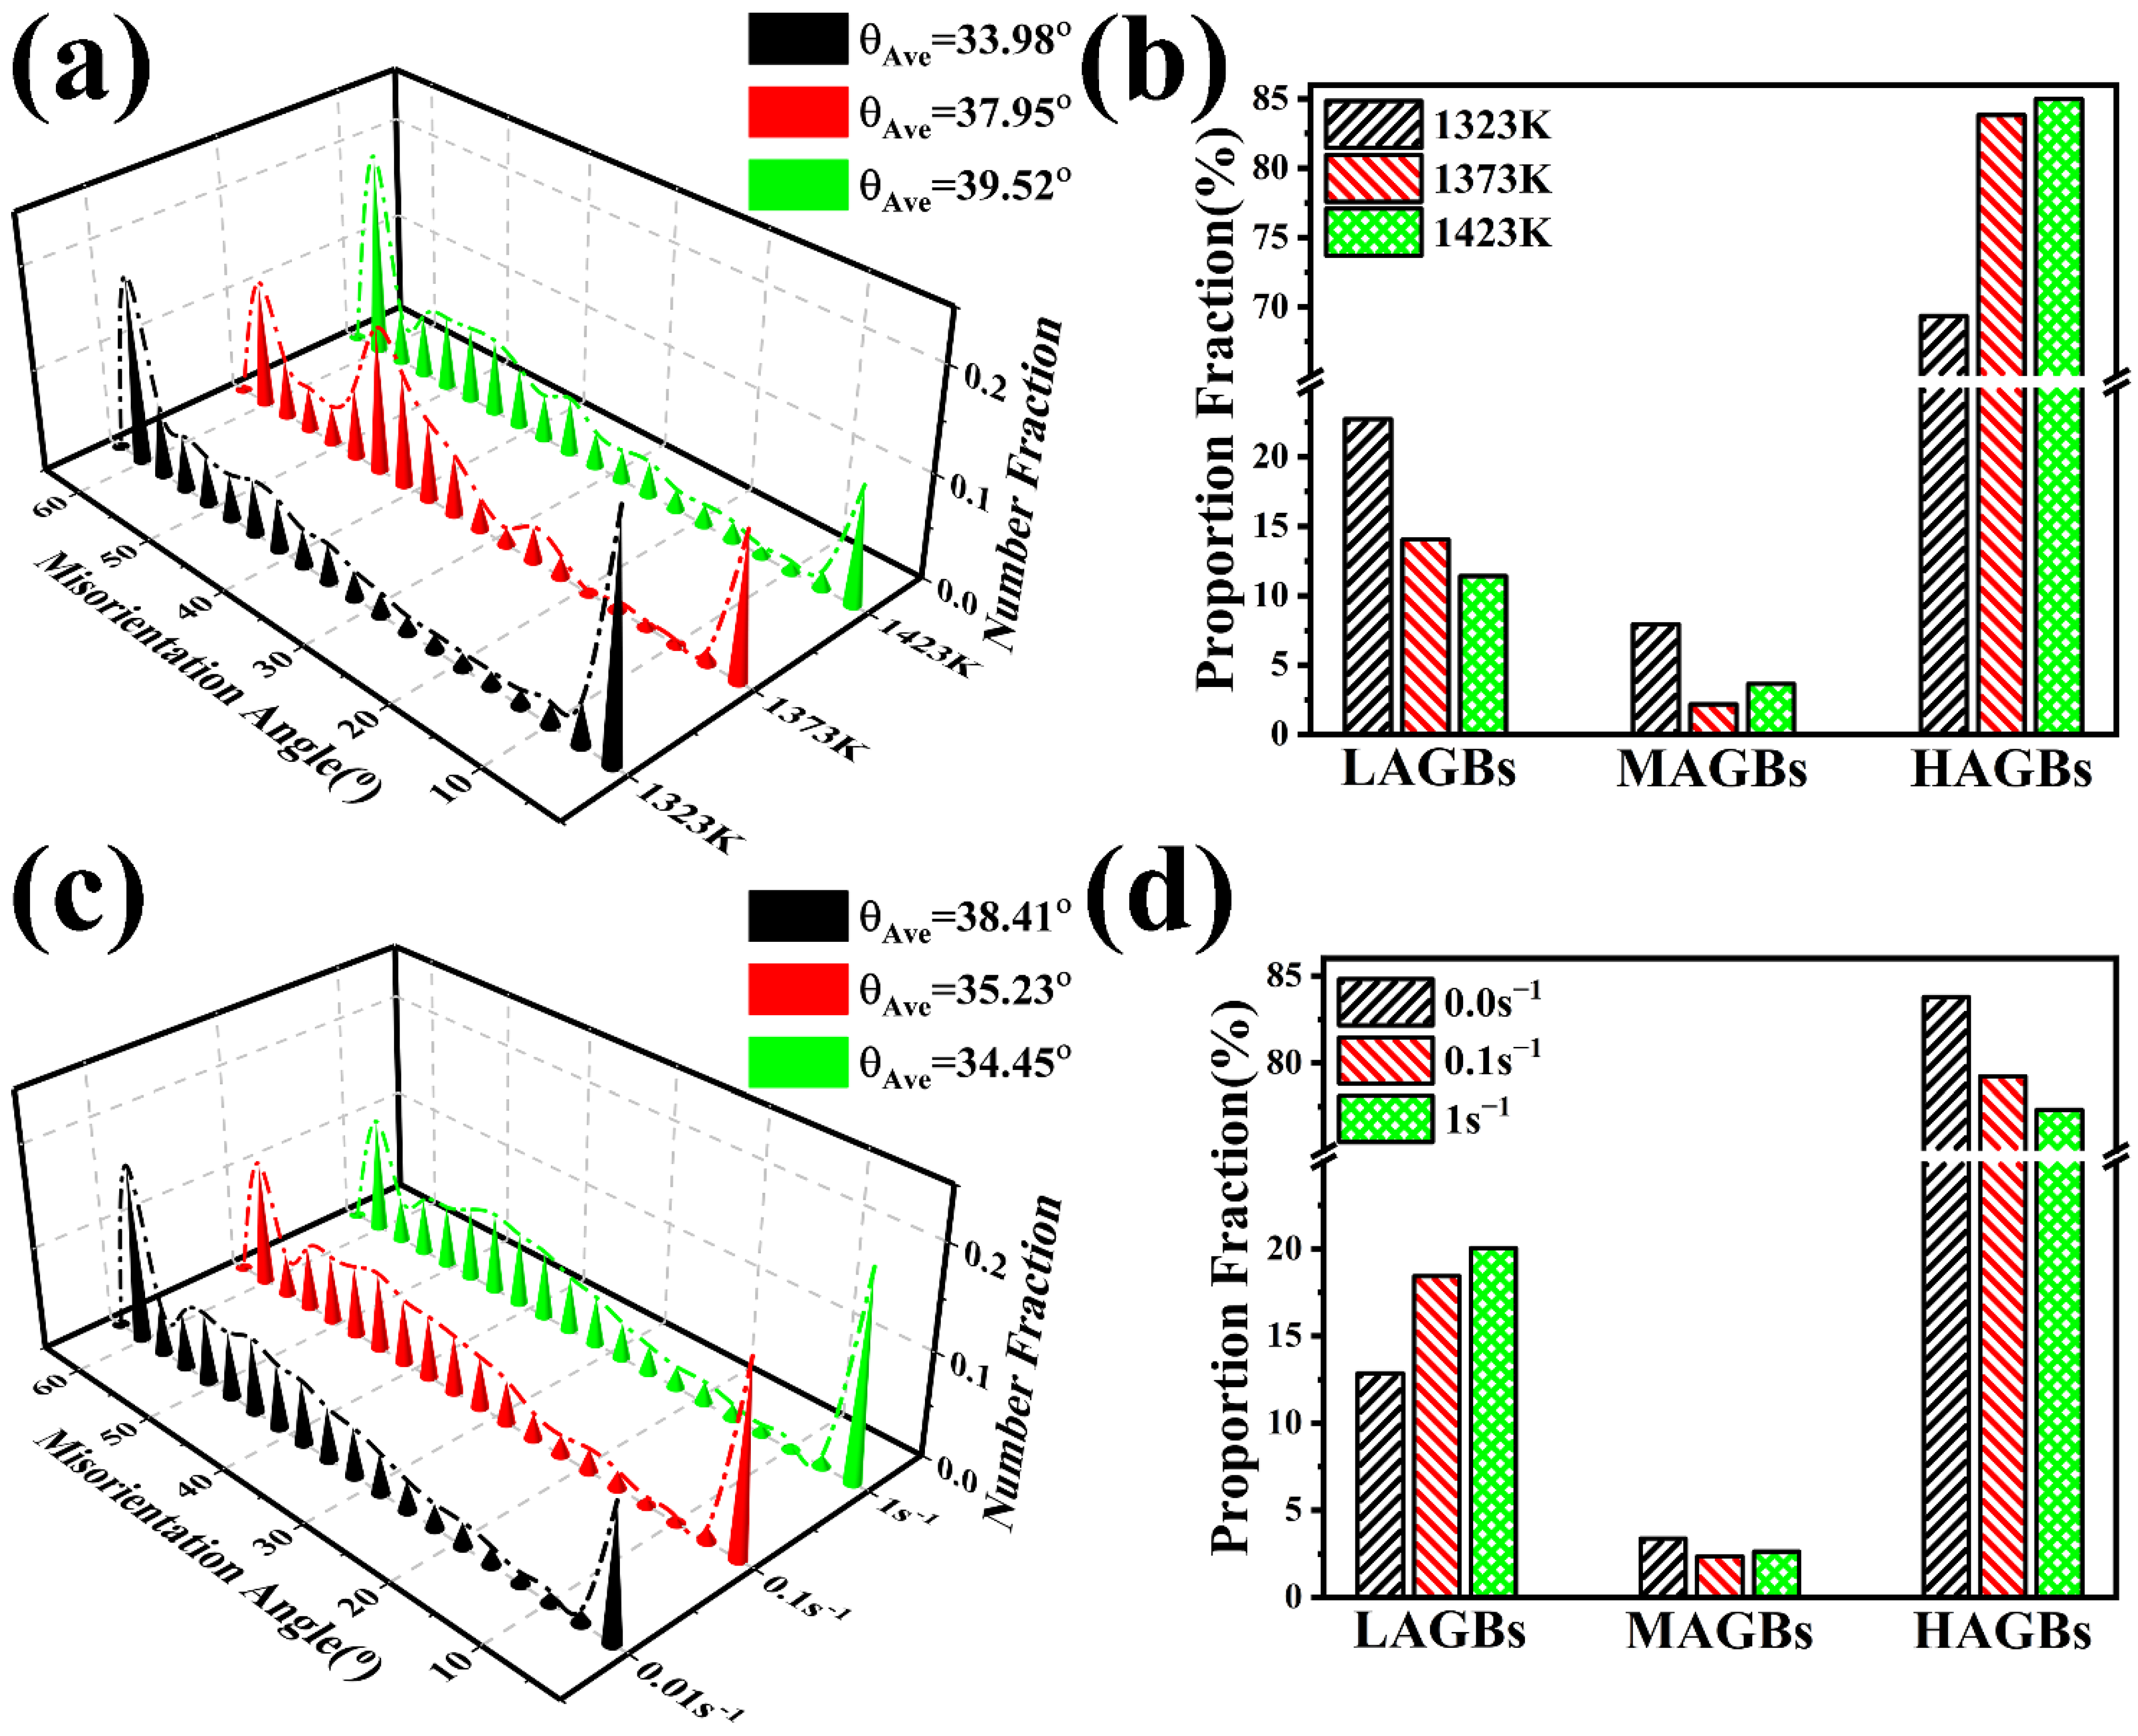
3.5. Variation Pattern of Misorientation Angle

Figure 6a,c displays the distribution of misorientation angles under different deformation temperatures and strain rates. According to Figure 6a, the average misorientation angle (θAve) increases from 33.98° to 39.52° when the temperature rises from 1323 to 1423 K at the strain rate of 1 s−1. Based on Figure 6c, with an increase in the strain rate from 0.01 to 1.0 s−1, the θAve decreases from 38.41° to 34.45°. The evolution characteristic of θAve is tightly coupled with the volume fraction of DRX and grain growth [28,29]. As a result, θAve is larger if the deformation conditions are favorable for DRX to occur.
Additionally, the fractions of HAGBs, MAGBs, and LAGBs of the different deformation conditions in Figure 6b,d are provided to gain a comprehensive understanding of DDRX and CDRX mechanisms reflected in the grain boundary nature. Figure 6b reveals that as the deformation temperature increases, the fraction of LAGBs decreases expeditiously, while that of HAGBs increases with the increasing temperature. This occurs because the dislocation-free DRX grains multiply with the increasing temperature, as evidenced in Figure 4. Figure 6d shows that as the strain rate increases, the fraction of HAGBs decreases, whereas that of LAGBs increases rapidly. Due to the high strain rate, the dislocation interaction intensifies, resulting in a multitude of LAGB networks (Figure 5) adjoining to HAGBs within the deformed grains [30]. From Figure 6b,d, it is also known that the MAGBs are far less than the HAGBs.
The necklace-shaped arrangement of DRX grains and original protuberant HAGBs are observed in Figure 4 and Figure 5, which show that the DRX grain nucleation follows a conventional discontinuous dynamic recrystallization (DDRX) mechanism during thermal deformation of the studied superalloy. Likewise, the feature of the higher fraction of HAGBs in Figure 6b,d at higher temperatures and lower strain rates indicates a characteristic of DDRX as well. Usually, a higher proportion of MAGBs is considered to be conducive to continuous dynamic recrystallization (CDRX), since MAGBs represent a transitional period from LAGBs to HAGBs [30,31]. The presence of green MAGBs is distinct in Figure 4 and Figure 5. Hence, the DDRX and CDRX mechanisms occur concurrently during the hot deformation of the studied superalloy. Furthermore, ss illustrated in Figure 6b,d, the fraction of MAGBs never exceeds 7.93%, whereas that of LAGBs is far higher, which indicates that LAGBs are speedily converted into HAGBs even when CDRX is easily implemented [32]. As a result, DDRX is the controlling DRX mechanism in the studied superalloy, whereas CDRX is a passive mechanism due to a negligible presence of MAGBs.

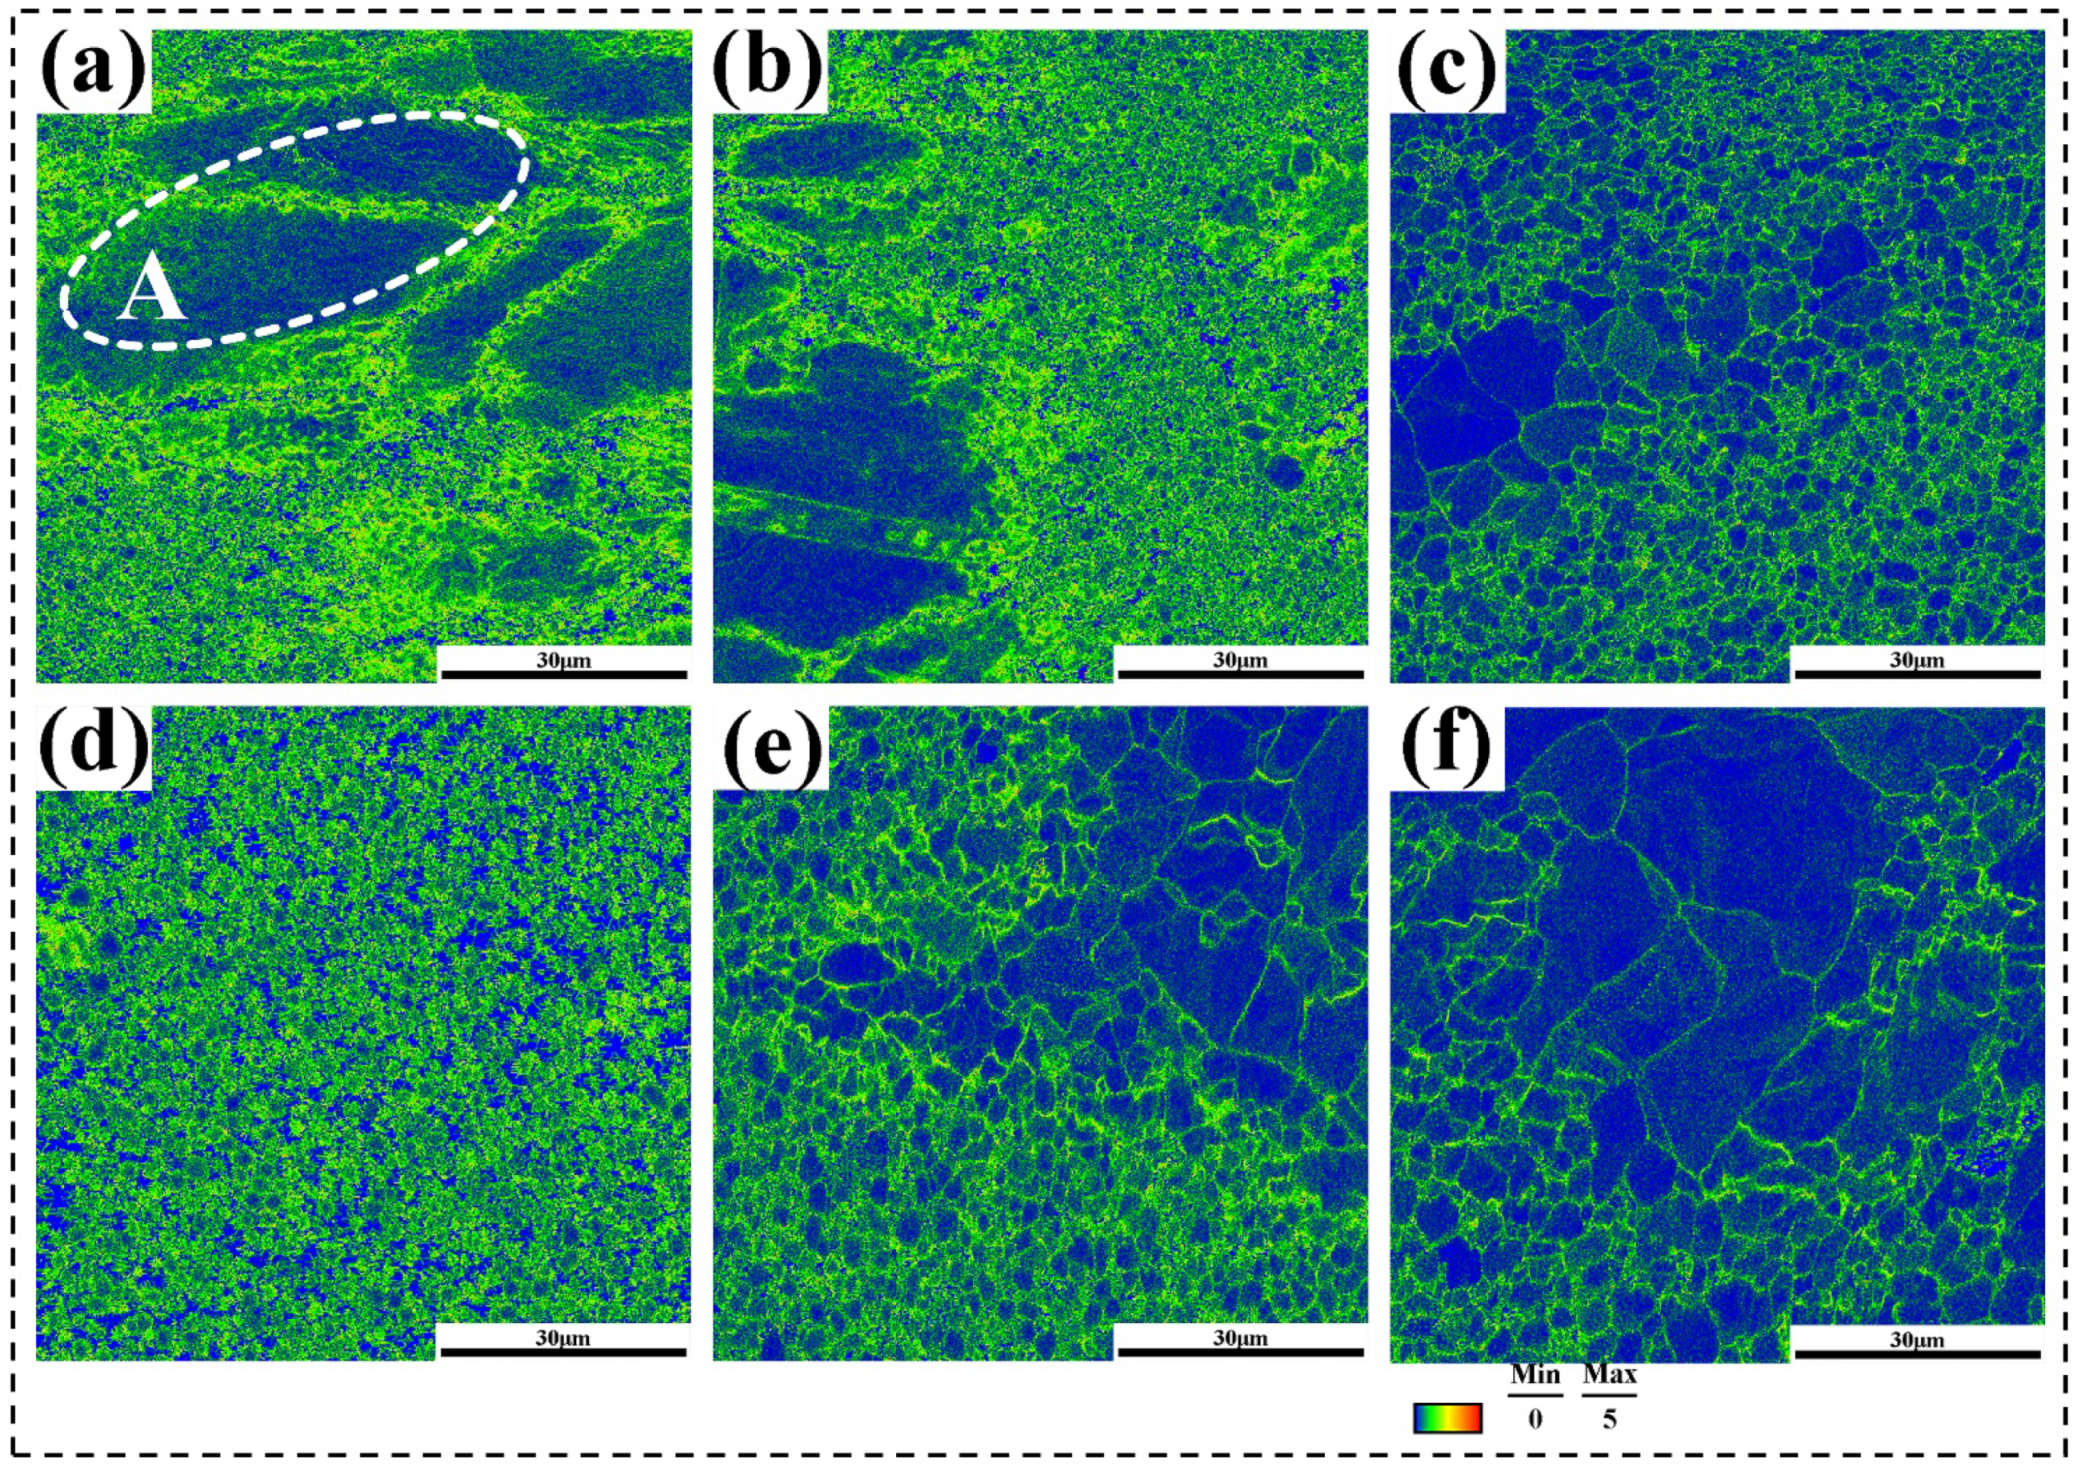
3.6. Analysis of KAM Maps for Studied Superalloy

Further analysis of the recrystallization behavior of the studied superalloy was conducted using the KAM (kernel average misorientation) maps derived from EBSD. KAM is an indicator of the geometrically necessary dislocation density. The lower KAM values represent lower dislocation density, whereas higher KAM values represent higher dislocation density [33]. Figure 7 shows the KAM maps for the studied superalloy at different deformation conditions. As can be seen in Figure 7, dislocations formed uniformly near the original grain boundaries; what is more, dislocations in some large grain regions (e.g., region A in Figure 7a) gradually expanded from the grain boundary to the grain interior. In the grain boundary diagrams of Figure 4 and Figure 5, some subcrystals with LAGBs are formed near the original grain boundaries accordingly, and newly formed dynamically recrystallized grains with HAGBs are observed as well. This indicates that the LAGBs continuously absorb dislocations and transform to HAGBs, resulting in the formation of a large number of dislocations and LAGBs near the original grain boundaries, which represents that the continuous dynamic recrystallization with gradual lattice rotation near the original grain boundaries occurs during the hot deformation of the studied superalloy. In addition, the presence of the main strengthening phase (γ′-Ni3(Al, Ti)) of the studied superalloy promotes the accumulation of dislocations in the surrounding dynamically recrystallized grains as well, which in turn facilitates the occurrence of continuous dynamic recrystallization.

4. Establishment of the Segmented Constitutive Models of Ni-Cr-Co-Based Superalloy

Depending on the flow behavior of the studied superalloy mentioned above, the constitutive models are established using the piecewise functions with different equations:
  • the flow stress constitutive model during work-hardening–dynamic recovery stage;
  • the flow stress constitutive model during dynamic recrystallization stage;
  • the grain size model of DRX during the dynamic recrystallization stage.
As a result, the values of feature points, such as εc, σc, etc., were resolved from the true stress–strain curves of the studied superalloy at first. Then, the critical strain was used to judge the two stages, derived from the dislocation density model and the dynamic recrystallization kinetic model, and segmented constitutive models were established for predicting the flow stress. In addition, the grain size model of DRX was developed to evaluate the microstructure evolution behavior in this study.

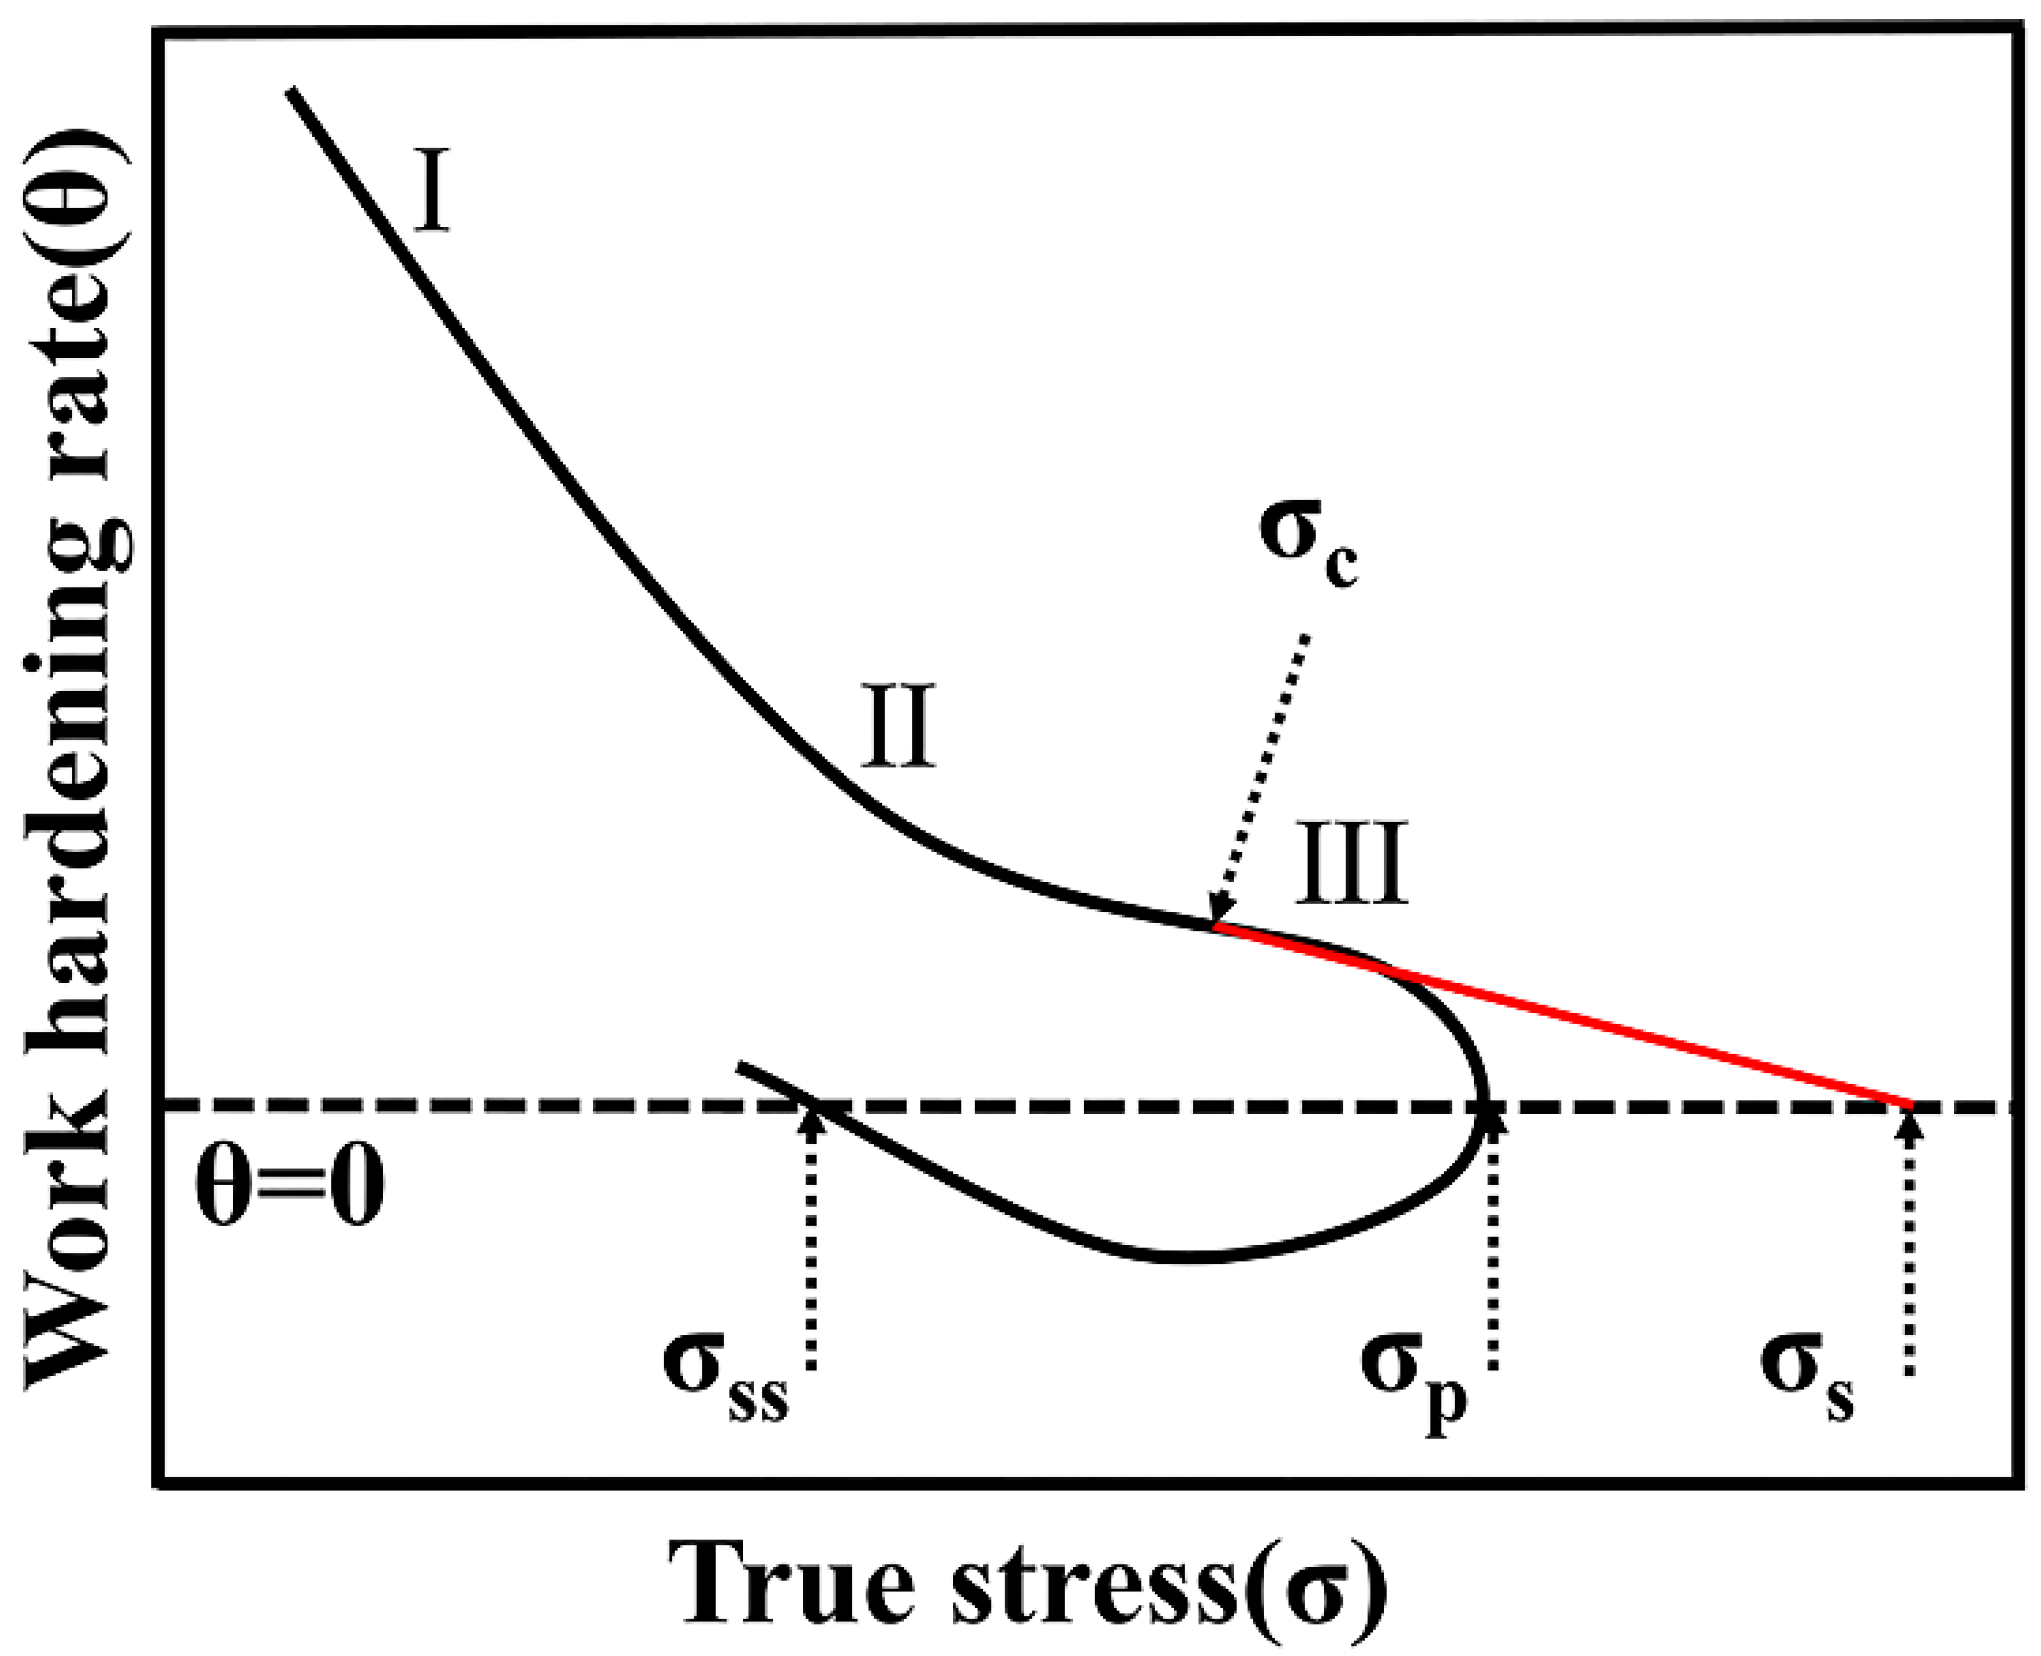
4.1. Constitutive Model for Work-Hardening–Dynamic Recovery Stage

The evolution of dislocations resulted from the coexisting and competing events of dislocation multiplication and annihilation during the hot deformation of metals [34]. With the progressive strain, there exist large amounts of dislocation pile-up causing the dislocation density to rapidly grow, which results in work-hardening of the superalloy. Meanwhile, the softening effect of dynamic recovery occurs as well in the studied superalloy, which is the opposite of the response of work-hardening with regards to dislocation density. As a consequence, before DRX occurs, work-hardening and dynamic recovery work together to determine whether the dislocation density will increase or decrease during thermal deformation. The relationship between dislocation density and strain can be expressed as follows [35]:
d ρ d ε = K 1 ρ K 2 ρ
where ρ is the dislocation density, K1 is the work-hardening coefficient, and K2 is the dynamic softening factor. When ε = 0, ρ= ρ0, ρ0 being the dislocation density at the moment of yield stress σ0(MPa), Equation (2) can be obtained by integrating with Equation (1):
ρ = ( K 1 K 2 K 1 K 2 e K 2 2 ε + ρ 0 e K 2 2 ε ) 2
When dρ/dε = 0,
ρ s = ( K 1 K 2 ) 2
where ρs is the dislocation density at the moment of the saturation stress σs (MPa).
During the thermal deformation process, dislocations are constantly generated and annihilated, which subsequently leads to the constant change in the dislocation density and causes the changes in flow stress. Therefore, it can be revealed that there is a very strong connection between the dislocation density and flow stress [36]:
σ = α λ b ρ
where α is the dislocation interaction coefficient, λ is the shear modulus, and b is the Burgers vector. As a result, the flow stress mathematical model of the work-hardening–dynamic recovery stage (σWH) can be obtained by organizing the above formulas:
σ W H = σ s + ( σ 0 σ s ) e K 2 2 ε

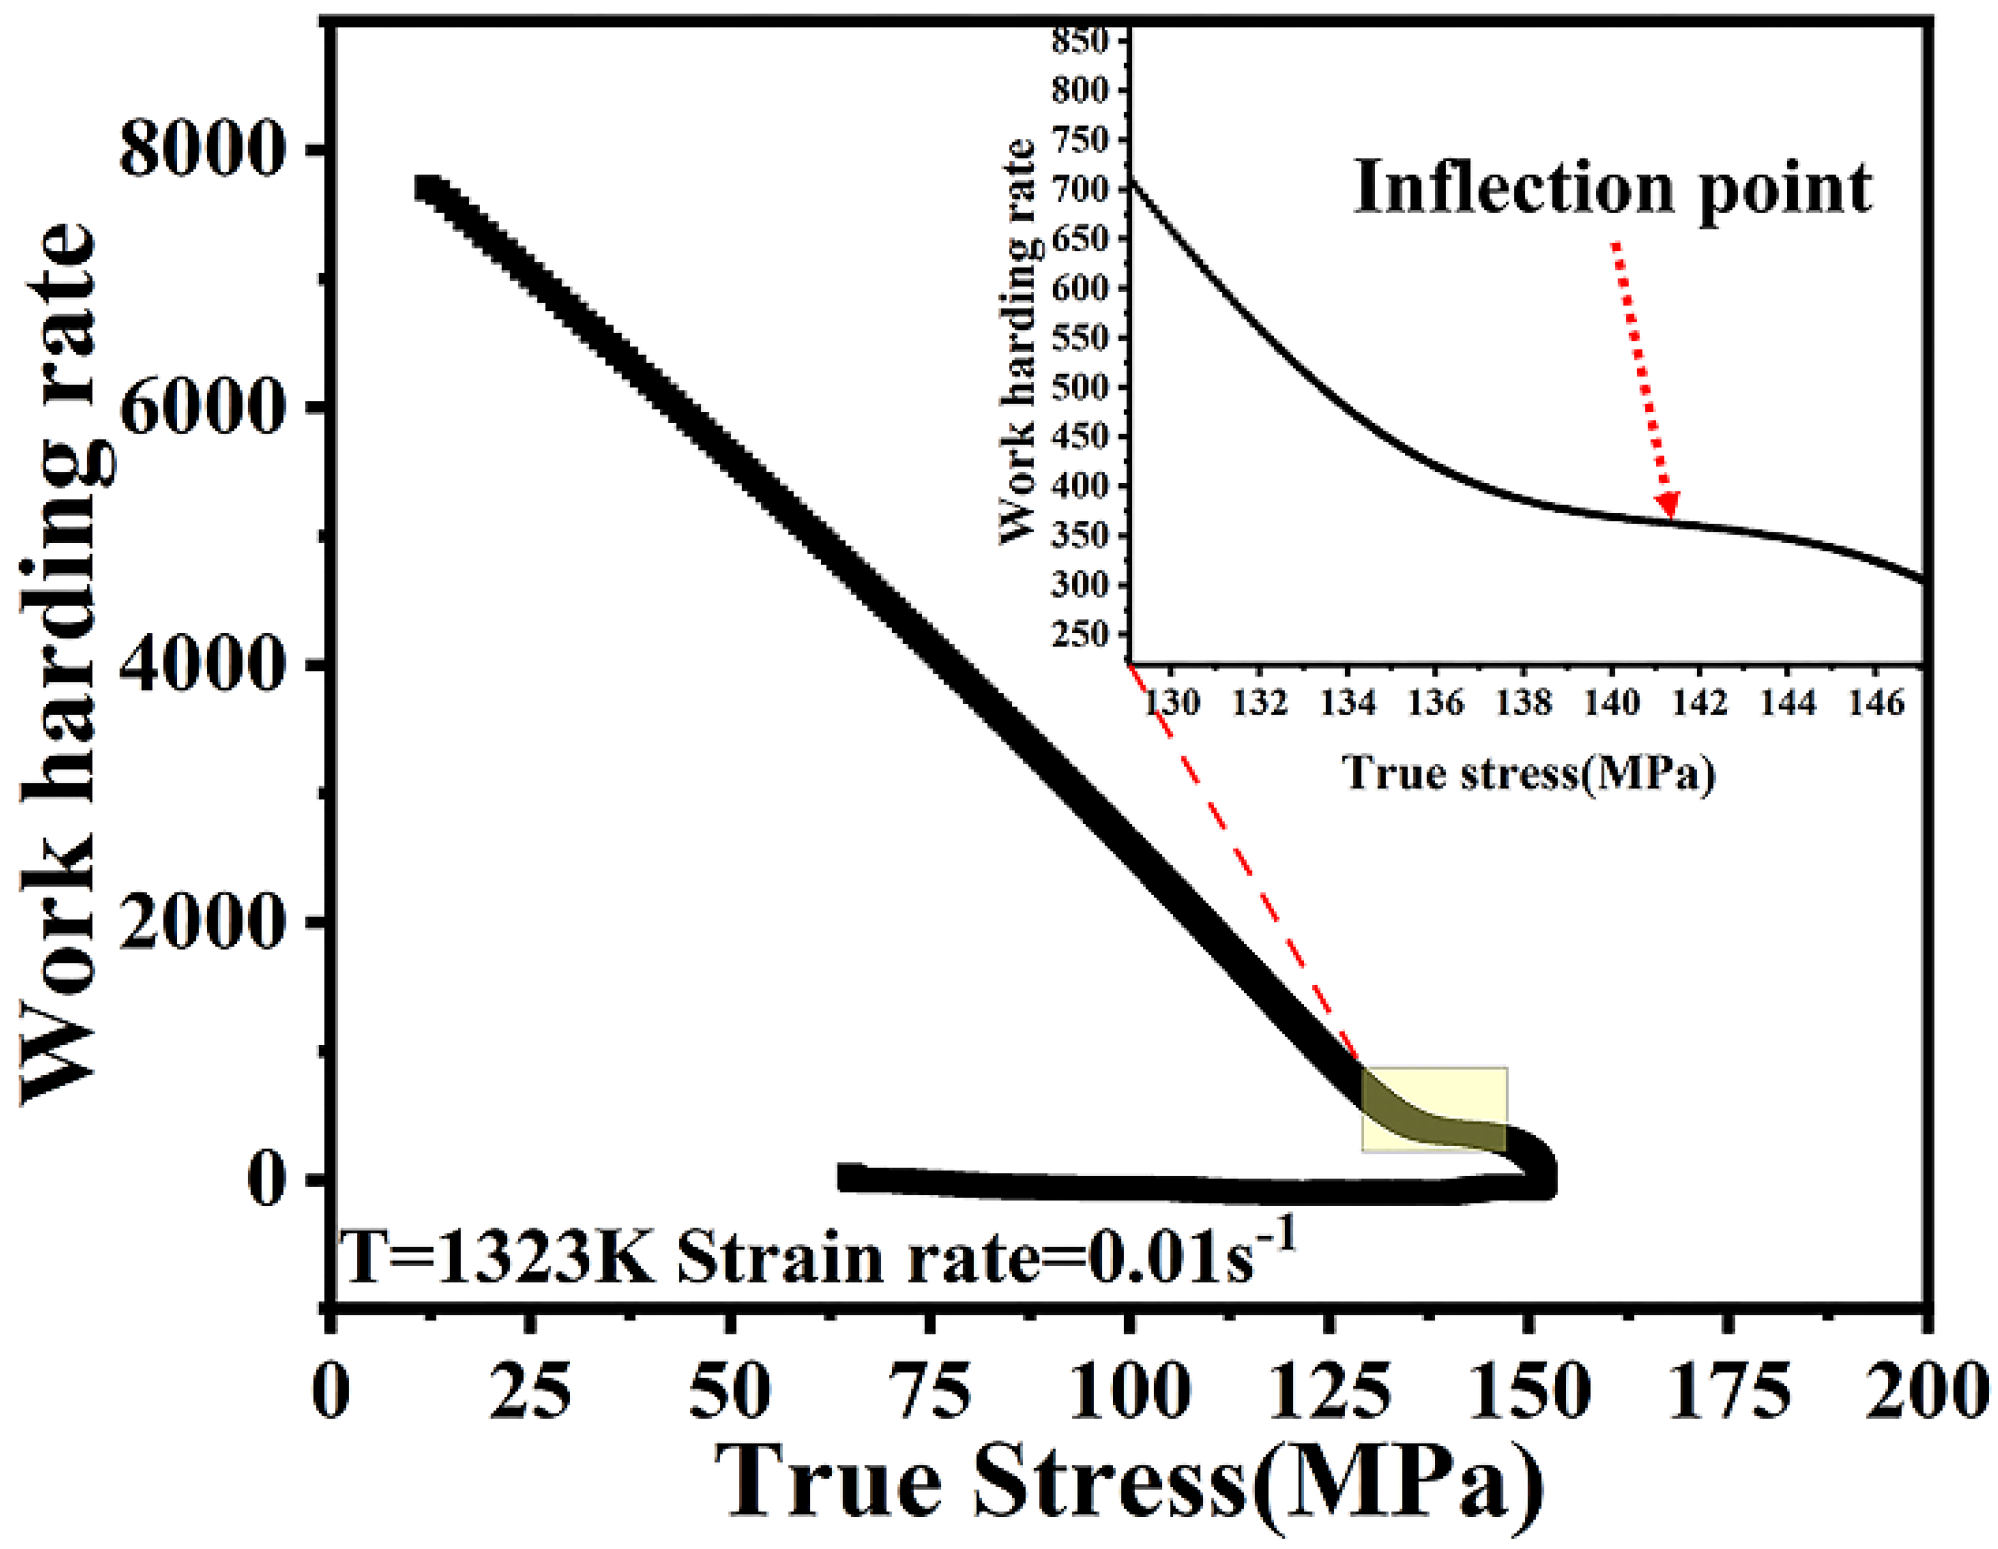
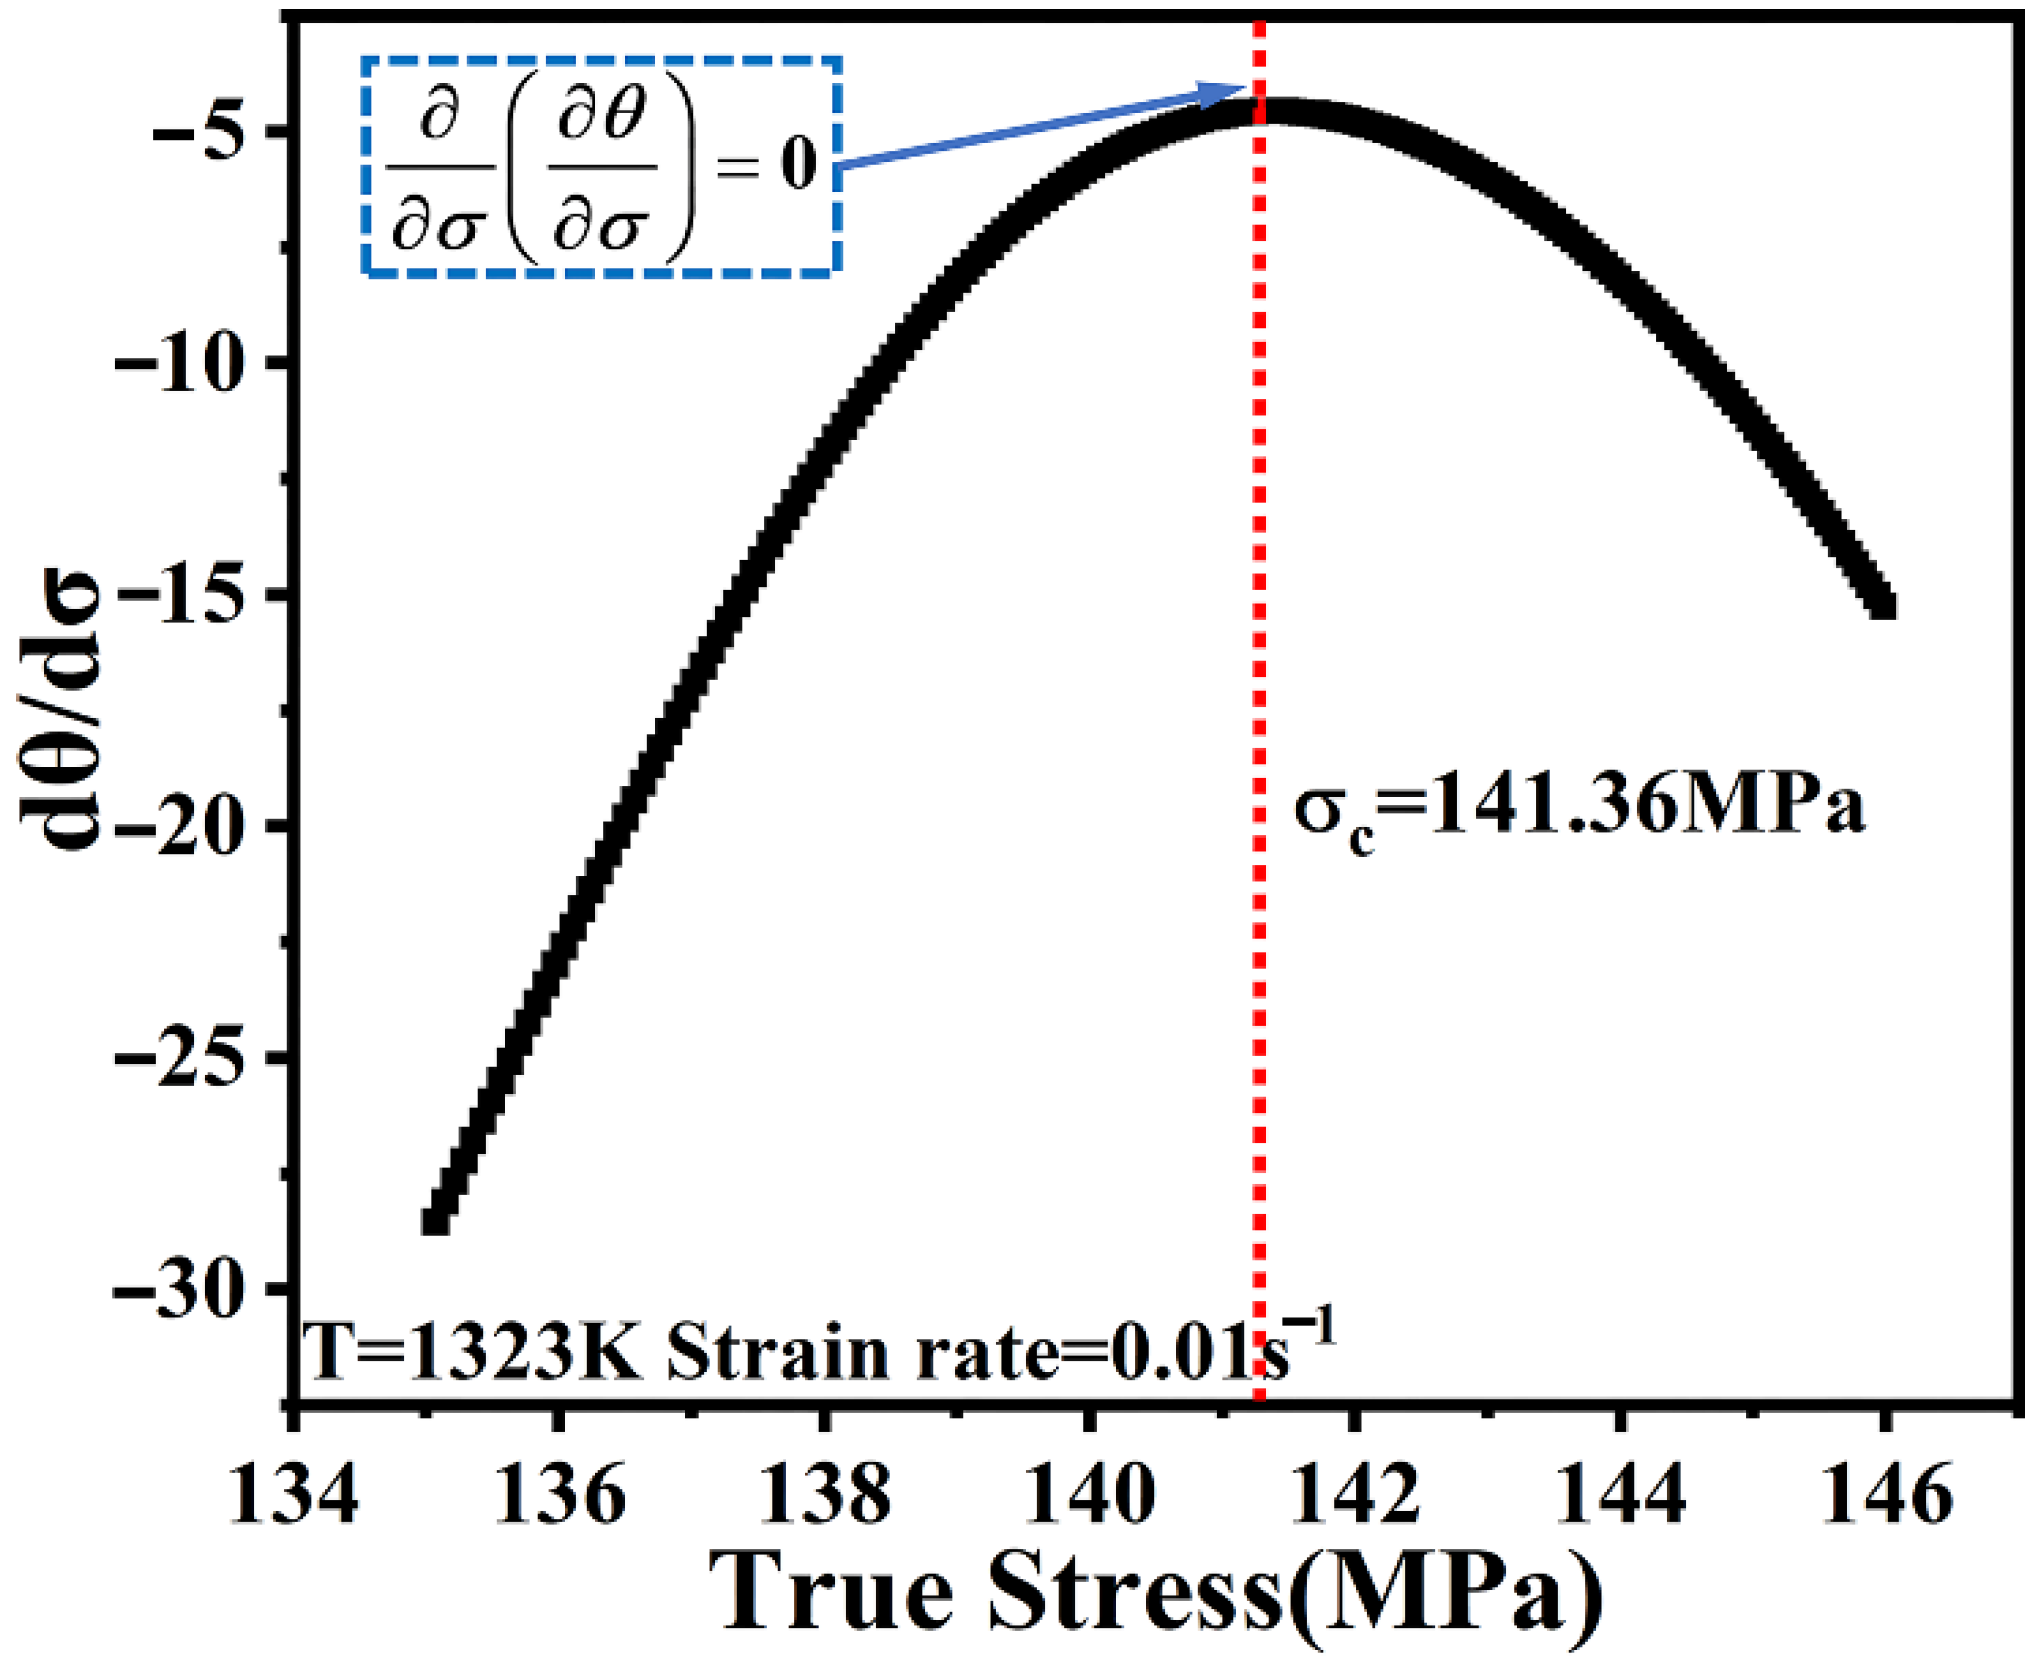
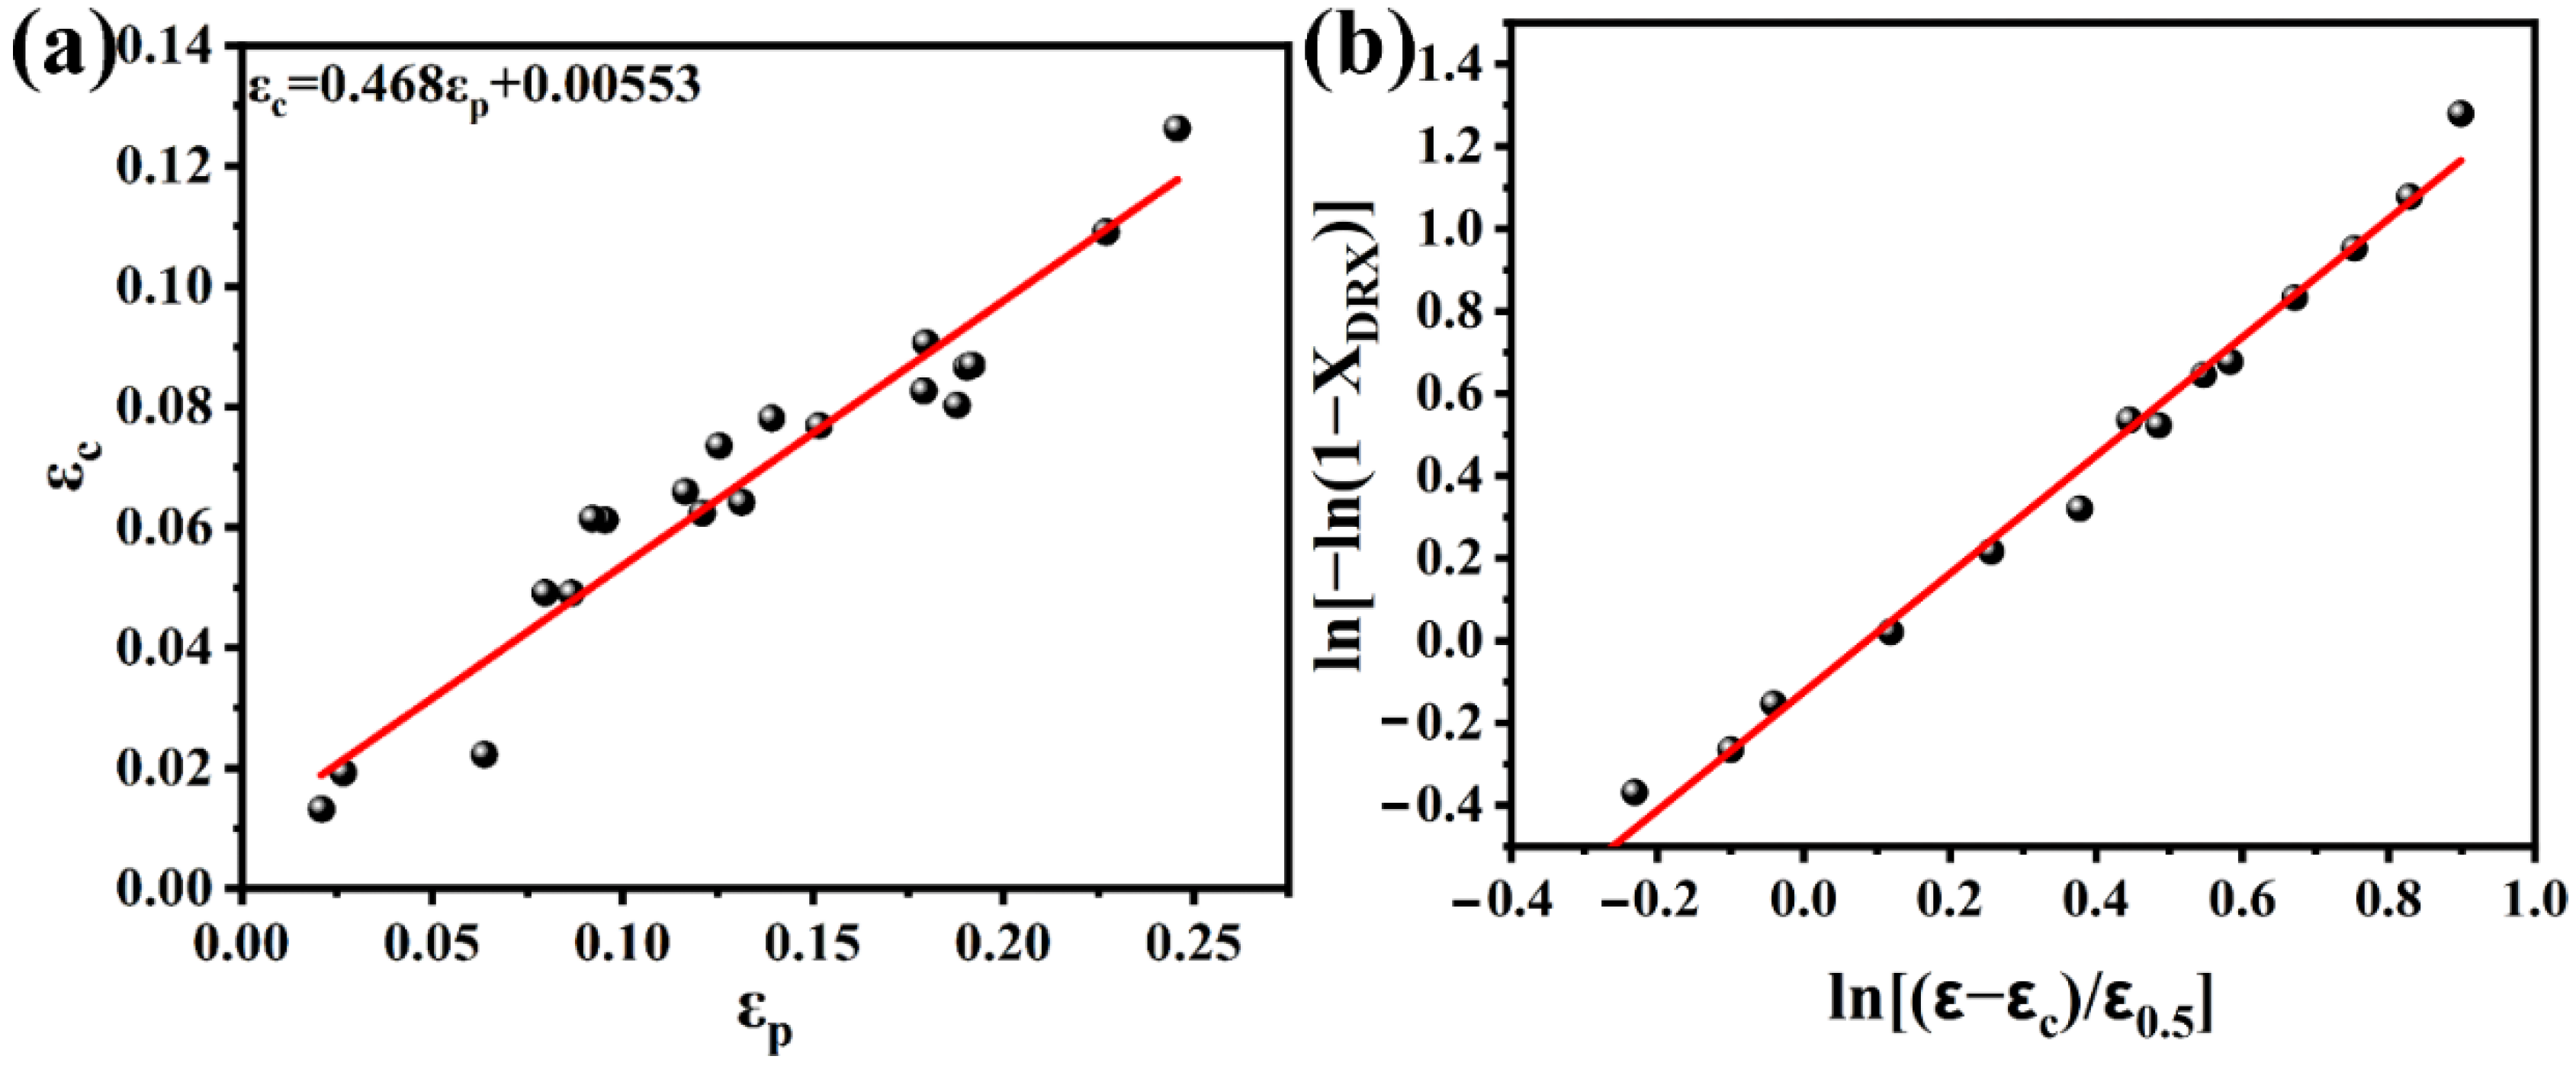
4.2. Constitutive Model of the Dynamic Recrystallization Stage

During high-temperature deformation, dynamic recrystallization occurs when the amount of deformation exceeds the critical strain εc, and DRX nucleation takes place as well as the growth of DRX grains near grain boundaries and twin boundaries, all of which affect the microstructure distribution of the formed component and play a significant role in determining its mechanical properties. Furthermore, when DRX is completed and the flow stress reaches steady-state, a lot of dislocations vanish, and the deformation resistance of metals drops [37]. Therefore, the dynamic recrystallization kinetic equation is required for this stage, as shown in Equation (6) [38]:
X D R X = 1 exp ( β d ( ε ε c ε 0.5 ) k d )
where XDRX is the dynamic recrystallization volume fraction, ε is the strain, εc is the critical strain, ε0.5 is the strain corresponding to the moment when the fraction of dynamic recrystallization reaches 50%, and βd and Kd are the material constants. Furthermore, the steady stress σss, the saturation stress σs, and the instantaneous flow stress σ also affect XDRX. XDRX can also be given as the Formula (7) [38]:
X DRX = σ W H σ σ s σ ss , ( ε ε c )
Moreover, the saturation stress σs and the steady stress σss can be shown as follows:
sinh ( A 1 σ s ) = n 1 [ ε ˙ exp ( Q R T ) ] n 2
sinh ( A 2 σ s s ) = n 3 [ ε ˙ exp ( Q R T ) ] n 4
where ε ˙ is the strain rate (s−1); T is the absolute temperature (K); Q is the activation energy during hot deformation (KJ·mol−1); A1, A2, n1, n2, n3, and n4 are material constants; and R is the universal gas constant (8.314 J·mol−1·K−1).
The critical strain εc in Equation (6) can be given in Equation (10) [11]:
ε c = K ε p = a 1 ε ˙ m 1 exp ( Q 1 R T )
where εp represents the peak strain, K, a1, and m1 are constants.
The strain ε0.5 which is the strain when XDRX reaches 50% in Equation (5) can be presented as follows:
ε 0.5 = a 2 ε ˙ m 2 exp ( Q 2 R T )
Similarly, the parameters a2 and m2 are constants.
As a consequence, the mathematical model of the dynamic recrystallization stage can be arranged as follows:
σ = σ W H ( σ s σ ss ) { 1 exp [ β d ( ε ε c ε 0.5 ) k d ] }

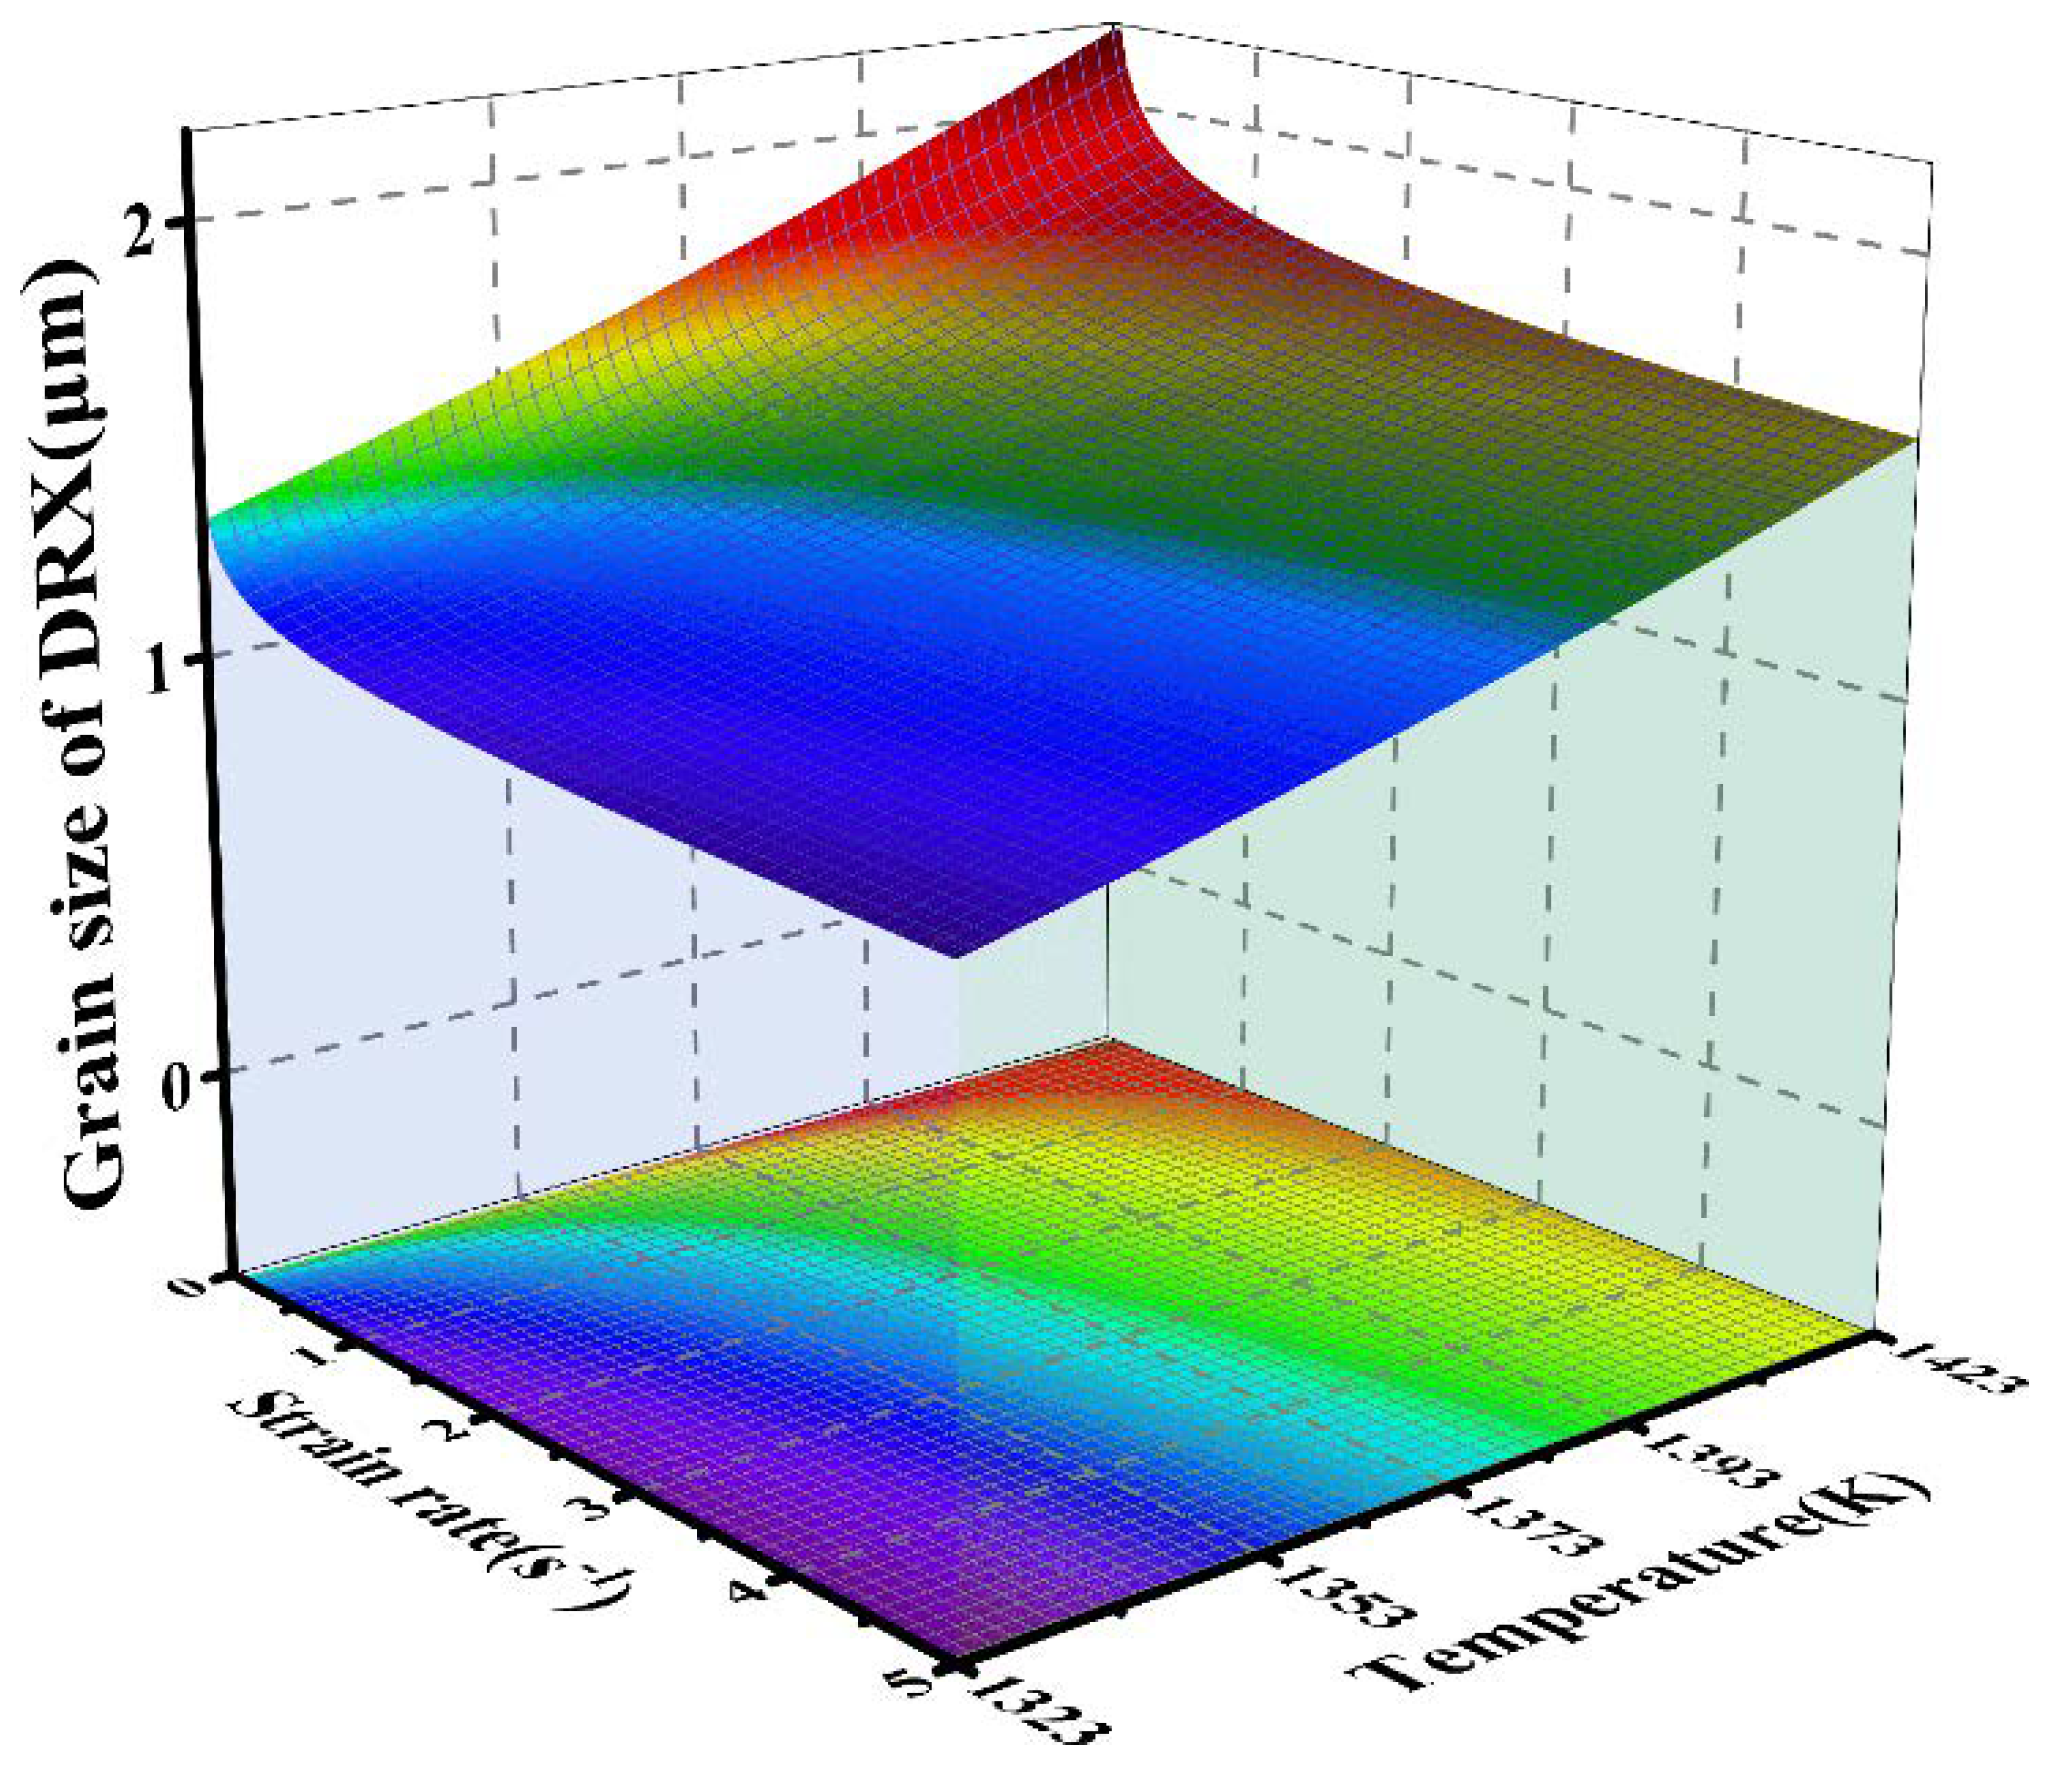
4.3. Mathematical Model for Dynamic Recrystallization of Grain Size

Dynamic recrystallization occurs when strain reaches a critical strain point during hot deformation, allowing grains to nucleate and grow, with the grain size of DRX continuously changing due to the deformation temperature and strain rate. Sellars’ equation can be used to express the dynamic recrystallization grain size model [39]:
d D R X = a 0 ε ˙ n exp ( Q R T )
Similarly, the parameters a0 and n are constants.

4.4. Determination of Material Constants

Commonly, the critical stress σc and critical strain εc associated with the initiation of DRX were calculated using the work-hardening rate θ. In true stress–strain curves of the superalloys during hot deformation, work-hardening rate θ is the derivative of stress concerning strain, indicating the changing rate of true stress with true strain, and can be expressed as:
θ = σ / ε
As shown in Figure 8, steady-state stress σss and saturation stress σs can be figured out through plotting the relationship curve between the work-hardening rate θ and flow stress σ [40]. The work-hardening rate is positive at the beginning, which indicates that work-hardening is dominating at this stage. With an increase in true stress, there is an inflection point on the curve, at which the second derivative of θ with respect to σ is equal to zero and is defined as critical stress σc illustrated by arrows in Figure 8. At the inflection point of the curve, the abscissa of the intersection of the tangent and the horizontal axis (corresponding to the work-hardening rate of 0) is the saturation stress σs. Accordingly, the peak stress σp and the steady-state stress σss are also obtained when the work-hardening rate is zero, as seen in Figure 8. The work-hardening rate is negative from peak stress to steady-state stress, indicating that dynamic recovery and dynamic recrystallization assume dominant roles [41].
Based on the method described above, it is apparent that the saturated stress σs, the peak stress σP, and the steady-state stress σss can all be determined using the work-hardening rate and the flow stress relationship curve. Figure 9 presents the relationship between work-hardening rate and the true stress through an example given with the condition of a strain rate of 0.1 s−1 and a deformation temperature of 1323 K.
Based on Figure 9, it is clear that the steady-state stress σss is 65.41 MPa and the peak stress σp is 153.03 MPa. As a follow-up, find the coordinates of the inflection point in Figure 10 and derive from the enlarged part of the curve to obtain the relationship curve of dθ/dσ-σ in Figure 10.
In Figure 10, the curve increases initially and then decreases. Therefore, the critical stress σc of this condition is 141.36 MPa, and the critical strain εc can be obtained with the aid of the true stress–strain curve, which is 0.0615. Thus, σc and εc for other deformation conditions according to the same method are shown in Table 1. Likewise, the steady-state stress σss, saturation stress σs, and peak stress σp can be determined as well under any other given conditions.
Then, a linear fit was performed to determine the relationship between the critical strain and peak strain, as illustrated in Figure 11a. In this case, the 1STOPT software can be used to solve the coefficients of the critical strain model, saturated stress model, and steady-state stress model. The results are as follows:
ε c = 3.76 × 10 5 ε ˙ 0.08944 exp ( 87102.85 / R T )
σ s = 243.91 arcsin h { 1.57 × 10 9 [ ε ˙ exp ( 963903 R T ) ] 0.2438 }
σ s s = 95.69 arcsin h { 1.22 × 10 10 [ ε ˙ exp ( 963903 R T ) ] 0.2787 }
As shown by Formula (7), extrapolation can be made use of for determining a dynamic recrystallization fraction, which would then be inversed to determine stress and strain. Combining Formulas (6) and (7), ε0.5 can be calculated under different deformation conditions. Similarly, the coefficients can be determined through 1STOPT software as shown in Formula (18):
ε 0.5 = 8.59 × 10 3 ε ˙ 0.0215 exp ( 39194.44 / R T )
To figure out the coefficients of the recrystallization kinetic formula, we logarithmically transformed both sides of Formula (6) simultaneously, and then it can be converted to Formula (19):
ln [ ln ( 1 X drex ) ] = ln β d + k d ln ( ε ε c ε 0.5 )
Figure 11b demonstrates the relationship between ln[(ε − εc)/ε0.5] and ln[−ln(1 − XDRX]. The discrete points are linearly simulated in Figure 11b. Therefore, the coefficients of βd and Kd can be determined from the slope and intercept of the fitted line, which are 0.8936 and 1.2555, separately. Therefore, the volume fraction dynamic recrystallization for the studied superalloy at the DRX stage is described as follows:
X D R X = 1 exp [ 0.8936 { ( ε ε c ) ε 0.5 } 1.2555 ]
The yield stress σ0 under various hot deformation conditions can be derived directly from the true stress–strain curve. According to Formula (5), the data of stress σ and strain ε can be used for solving the K2 under various hot deformation conditions. On the yield stress σ0 and the coefficient K2, the nonlinear fitting is performed, and the results are shown as follows respectively:
σ 0 = 0.001581 [ ε ˙ exp ( 963903 / R T ) ] 0.1206
K 2 = 1500.7413 [ ε ˙ exp ( 963903 / R T ) ] 0.04585
In addition, since the average grain size (AGS) of DRX is relatively uniform, the number average method (Number) in the OIM analysis software is used to count the grain size of DRX of the samples under different deformation conditions. The obtained size values are then analyzed in the 1STOPT software. Therefore, the coefficients of the grain size model of dynamic recrystallization can be obtained as shown in the following formula:
d D R X = 1423.7466 ε ˙ 0.0702 exp ( 79055.42 R T )
In summary, the segmented constitutive models of Ni-Cr-Co-based superalloy have all been solved, so they can be expressed in the form of Formula (24).
{ σ W H = σ s + ( σ 0 σ s ) e K 2 2 ε ( ε < ε c ) σ = σ W H ( σ s σ s s ) { 1 exp [ β d ( ε ε c ε 0.5 ) k d ] } ( ε ε c ) σ s = 243.91 arcsin h { 1.57 × 10 9 [ ε ˙ exp ( 963903 R T ) ] 0.2438 } σ s s = 95.69 arcsin h { 1.22 × 10 10 [ ε ˙ exp ( 963903 R T ) ] 0.2787 } ε c = 3.76 × 10 5 ε ˙ 0.08944 exp ( 87102.85 / R T ) ε 0.5 = 8.59 × 10 3 ε ˙ 0.0215 exp ( 39194.44 / R T ) σ 0 = 0.001581 [ ε ˙ exp ( 963903 / R T ) ] 0.1206 K 2 = 1500.7413 [ ε ˙ exp ( 963903 / R T ) ] 0.04585 k d = 1.2555     β d = 0.8936 d D R X = 1423.7466 ε ˙ 0.0702 exp ( 79055.42 / R T )

5. Verification of the Established Constitutive Model

The comparison curves of experimental flow stress and predicted flow stress are shown in Figure 12 for the studied superalloy under different hot deformation conditions. The solid lines are the experimental stress–strain curves, while the symbols depict the predicted flow stress. In Figure 12, the experimental and the predicted stress–strain data change in good agreement, demonstrating the reliability of the constitutive model we established.
A quantitative assessment of the precision of the established models is made using some statistical parameters, including correlation coefficient (R) and average absolute relative error (AARE), and they are given respectively as follows:
R = i = 1 N ( E i E ¯ ) ( C i C ¯ ) i = 1 N ( E i E ¯ ) 2 i = 1 N ( C i C ¯ ) 2
A A R E = 1 N i = 1 N | E i C i E i | × 100 %
where Ei and Ci are the experimental and predicted data, N represents the number of data, and E and C are the averages of Ei and Ci.
The correlation of the experimental and calculated results is revealed in Figure 13. Figure 13a shows R and AARE for the true stress are 0.988 and 6.94%, respectively, which indicates that the established segmented flow stress constitutive models can predict the flow stress of studied superalloy under high-temperature deformation. Figure 13b gives the correlation of AGS of DRX. R and AARE are 0.974 and 5.83%, separately, which shows that the proposed grain size model of DRX can reflect the microstructure revolution behavior of the studied superalloy under high-temperature deformation.
Moreover, Figure 14 is the 3D map of the computed mathematical model of the AGS of DRX, which illustrates the comprehensive impact of deformation temperature and strain rate for the AGS of DRX. The AGS of DRX is impressionable to both deformation temperature and strain rate, as shown in Figure 14. With the progressive deformation temperature or decreasing strain rate, the grain size of DRX slowly increases. In other words, the higher temperature and lower strain rate of hot deformation allow the dynamic recrystallization grain to grow.

6. Conclusions

An investigation of the hot deformation behavior for a Ni-Cr-Co-based superalloy was performed through isothermal compression tests. The segmented flow stress constitutive models involving work-hardening–dynamic recovery and dynamic recrystallization and the dynamic recrystallization grain size model were developed. The primary conclusions drawn from this study are the following:
(1)
The hot compression microstructure evolution of Ni-Cr-Co-based superalloy was analyzed through EBSD. The volume fraction and AGS of DRX are impressionable to both the strain rate and deformation temperature and gradually increase with the progressive deformation temperature or decreasing strain rate. Additionally, DDRX is the dominant DRX mechanism in a Ni-Cr-Co-based superalloy, whereas CDRX is a passive mechanism due to a negligible presence of MAGBs.
(2)
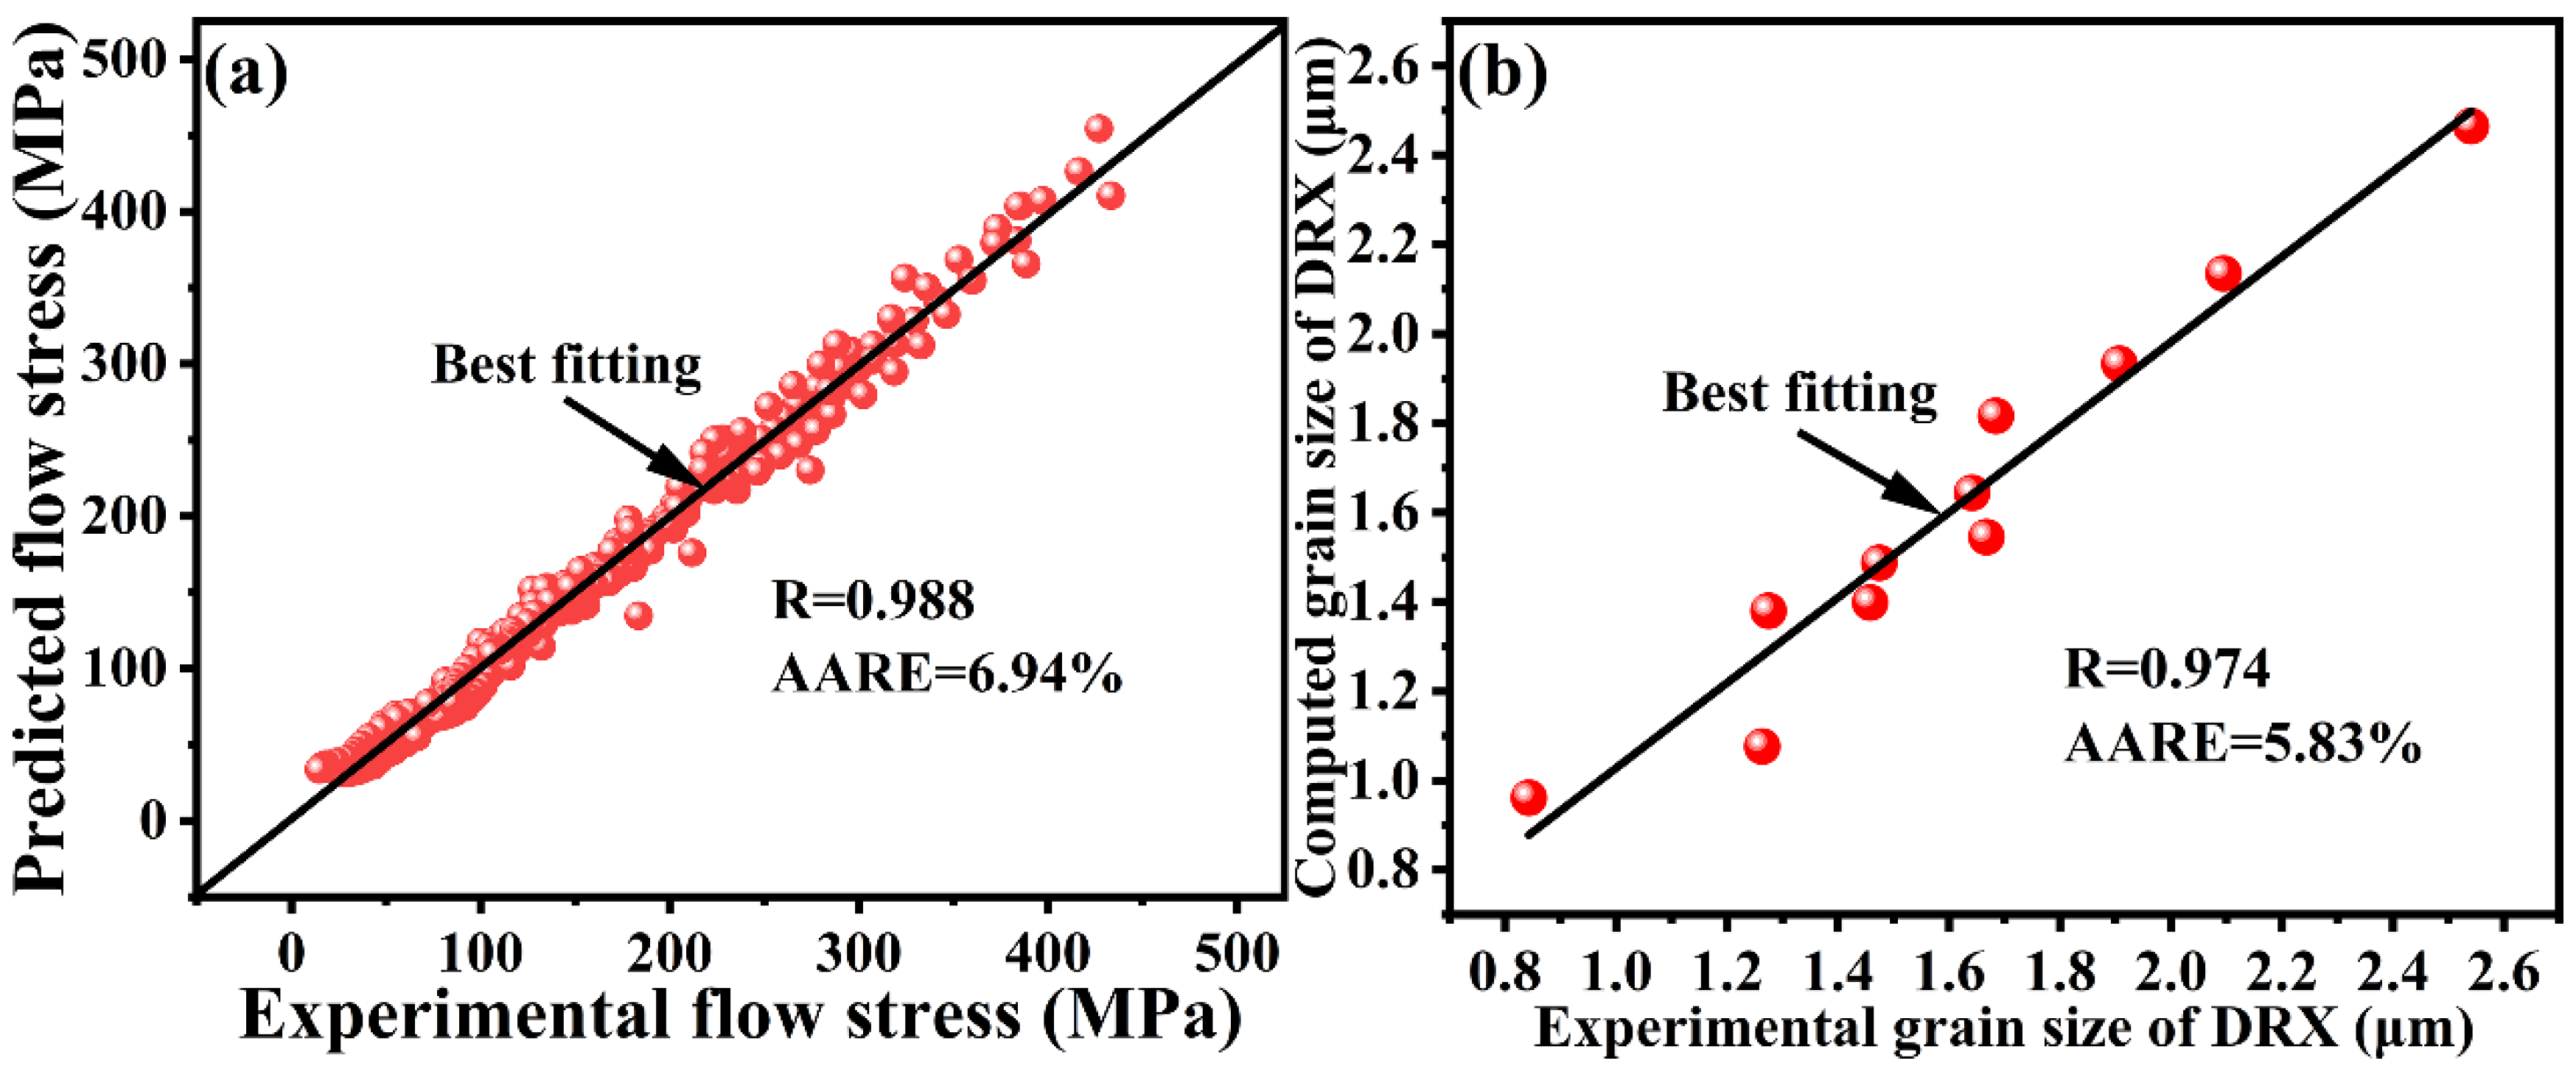
The segmented constitutive models are established to characterize the hardening-dynamic recovery stage and the dynamic recrystallization stage. In the error analysis of the segmented constitutive models, R is 0.988 and AARE is only 6.94%, indicating a good agreement between the experimental and predicted flow stress.
(3)
By comparing the experimental value and the computed value of the AGS of DRX, it is found that R is 0.974 and AARE is only 5.83%, indicating that the dynamic recrystallization grain size model can evaluate the microstructure revolution of a Ni-Cr-Co-based superalloy during hot deformation.

Author Contributions

Conceptualization and methodology, H.L., W.F.; software and experimental validation, H.L.; investigation, H.L., W.F.; data curation, H.L., W.F.; writing—original draft preparation, H.L., W.F.; writing—review and editing, H.L., W.F., W.Z., L.H.; supervision, W.F., L.H.; funding acquisition, W.Z., L.H. All authors have read and agreed to the published version of the manuscript.

Funding

This research was supported by 111 Project (No. B17034), Innovative Research Team Development Program of Ministry of Education of China (No. IRT13087), National Natural Science Foundation of China (No. 52005375), and China Postdoctoral Science Foundation (No. 2020M672429).

Institutional Review Board Statement

Not applicable.

Informed Consent Statement

Not applicable.

Data Availability Statement

Data are contained within the article.

Acknowledgments

The authors gratefully acknowledge the financial support of 111 Project (No. B17034), Innovative Research Team Development Program of Ministry of Education of China (No. IRT13087), National Natural Science Foundation of China (No. 52005375), and China Postdoctoral Science Foundation (No. 2020M672429).

Conflicts of Interest

The authors declare no conflict of interest.

References

  1. Wu, K.; Liu, G.; Hu, B.; Li, F.; Zhang, Y.; Tao, Y.; Liu, J. Hot compressive deformation behavior of a new hot isostatically pressed Ni–Cr–Co based powder metallurgy superalloy. Mater. Des. 2011, 32, 1872–1879. [Google Scholar] [CrossRef]
  2. Xu, L.; Cui, C.Y.; Sun, X.F. The effects of Co and Ti additions on microstructures and compressive strength of Udimet710. Mater. Sci. Eng. A-Struct. Mater. Prop. Microstruct. Process. 2011, 528, 7851–7856. [Google Scholar] [CrossRef]
  3. Hao, Z.P.; Ji, F.F.; Fan, Y.H.; Lin, J.Q.; Liu, X.Y.; Gao, S. Flow characteristics and constitutive equations of flow stress in high speed cutting Alloy 718. J. Alloys Compd. 2017, 728, 854–862. [Google Scholar] [CrossRef]
  4. Lin, Y.C.; Wen, D.X.; Deng, J.; Liu, G.; Chen, J. Constitutive models for high-temperature flow behaviors of a Ni-based superalloy. Mater. Des. 2014, 59, 115–123. [Google Scholar] [CrossRef]
  5. Lin, Y.C.; Wu, X.-Y.; Chen, X.-M.; Chen, J.; Wen, D.-X.; Zhang, J.-L.; Li, L.-T. EBSD study of a hot deformed nickel-based superalloy. J. Alloys Compd. 2015, 640, 101–113. [Google Scholar] [CrossRef]
  6. Jin, Y.; Xue, H.; Yang, Z.; Zhang, L.; Zhang, C.; Wang, S.; Luo, J. Constitutive Equation of GH4169 Superalloy and Microstructure Evolution Simulation of Double-Open Multidirectional Forging. Metals 2019, 9, 1146. [Google Scholar] [CrossRef] [Green Version]
  7. Lin, Y.C.; Chen, X.M. A critical review of experimental results and constitutive descriptions for metals and alloys in hot working. Mater. Des. 2011, 32, 1733–1759. [Google Scholar] [CrossRef]
  8. Lin, Y.C.; Wu, F.; Wang, Q.-W.; Chen, D.-D.; Singh, S.K. Microstructural evolution of a Ni-Fe-Cr-base superalloy during non-isothermal two-stage hot deformation. Vacuum 2018, 151, 283–293. [Google Scholar] [CrossRef]
  9. He, A.; Xie, G.; Yang, X.; Wang, X.; Zhang, H. A physically-based constitutive model for a nitrogen alloyed ultralow carbon stainless steel. Comput. Mater. Sci. 2015, 98, 64–69. [Google Scholar] [CrossRef]
  10. Ma, R.; Li, L.; Zhai, R.; Meng, X.; Zhao, J. Hot Deformation Behavior and Processing Map of GH901 Superalloy. Metals 2021, 11, 1808. [Google Scholar] [CrossRef]
  11. Jiang, H.; Dong, J.X.; Zhang, M.C.; Yao, Z.H. Phenomenological model for the effect of strain rate on recrystallization and grain growth kinetics in the 617B alloy. J. Alloys Compd. 2018, 735, 1520–1535. [Google Scholar] [CrossRef]
  12. Lin, Y.C.; Chen, X.-M.; Wen, D.-X.; Chen, M.-S. A physically-based constitutive model for a typical nickel-based superalloy. Comput. Mater. Sci. 2014, 83, 282–289. [Google Scholar] [CrossRef]
  13. He, D.G.; Lin, Y.C.; Wang, L.H.; Wu, Q.; Zu, Z.H.; Cheng, H. Influences of pre-precipitated 8 phase on microstructures and hot compressive deformation features of a nickel-based superalloy. Vacuum 2019, 161, 242–250. [Google Scholar] [CrossRef]
  14. Wan, P.; Zou, H.; Wang, K.; Zhao, Z.; Lu, S.; Nie, H. Hot Deformation Behaviors and Intrinsic Hot Workability Map of Ti-12Mo-4Zr-5Sn Alloy Based on Physical Model and Polar Reciprocity Model. Metals 2020, 10, 956. [Google Scholar] [CrossRef]
  15. Wan, Z.; Hu, L.; Sun, Y.; Wang, T.; Li, Z. Microstructure evolution and dynamic softening mechanisms during high-temperature deformation of a precipitate hardening Ni-based superalloy. Vacuum 2018, 155, 585–593. [Google Scholar] [CrossRef]
  16. Wu, R.; Liu, Y.; Geng, C.; Lin, Q.; Xiao, Y.; Xu, J.; Kang, W. Study on hot deformation behavior and intrinsic workability of 6063 aluminum alloys using 3D processing map. J. Alloys Compd. 2017, 713, 212–221. [Google Scholar] [CrossRef]
  17. Wang, Y.X.; Zhao, G.Q.; Xu, X.; Chen, X.X.; Zhang, C.S. Constitutive modeling, processing map establishment and microstructure analysis of spray deposited Al-Cu-Li alloy 2195. J. Alloys Compd. 2019, 779, 735–751. [Google Scholar] [CrossRef]
  18. Chuan, W.; Liang, H. Hot deformation and dynamic recrystallization of a near-beta titanium alloy in the beta single phase region. Vacuum 2018, 156, 384–401. [Google Scholar] [CrossRef]
  19. Zhang, F.X.; Liu, D.; Yang, Y.H.; Liu, C.X.; Zhang, Z.; Wang, H.; Wang, J.G. Investigation on the meta-dynamic recrystallization behavior of Inconel 718 superalloy in the presence of delta phase through a modified cellular automaton model. J. Alloys Compd. 2020, 817, 13. [Google Scholar] [CrossRef]
  20. Zouari, M.; Bozzolo, N.; Loge, R.E. Mean field modelling of dynamic and post-dynamic recrystallization during hot deformation of Inconel 718 in the absence of δ phase particles. Mater. Sci. Eng. A 2016, 655, 408–424. [Google Scholar] [CrossRef]
  21. Doherty, R.D.; Hughes, D.A.; Humphreys, F.J.; Jonas, J.J.; Jensen, D.J.; Kassner, M.E.; King, W.E.; McNelley, T.R.; McQueen, H.J.; Rollett, A.D. Current issues in recrystallization: A review. Mater. Sci. Eng. A 1997, 238, 219–274. [Google Scholar] [CrossRef] [Green Version]
  22. Li, H.; Cao, M.; Niu, L.; Huang, K.; Zhang, Q. Establishment of macro-micro constitutive model and deformation mechanism of semi-solid Al6061. J. Alloys Compd. 2021, 854, 157124. [Google Scholar] [CrossRef]
  23. Wang, M.J.; Sun, C.Y.; Fu, M.W.; Liu, Z.L.; Qian, L.Y. Study on the dynamic recrystallization mechanisms of Inconel 740 superalloy during hot deformation. J. Alloys Compd. 2020, 820, 13. [Google Scholar] [CrossRef]
  24. Zhang, J.Y.; Xu, B.; Tariq, N.U.; Sun, M.Y.; Li, D.Z.; Li, Y.Y. Effect of strain rate on plastic deformation bonding behavior of Ni-based superalloys. J. Mater. Sci. Technol. 2020, 40, 54–63. [Google Scholar] [CrossRef]
  25. Zhang, H.B.; Zhang, K.F.; Zhou, H.P.; Lu, Z.; Zhao, C.H.; Yang, X.L. Effect of strain rate on microstructure evolution of a nickel-based superalloy during hot deformation. Mater. Des. 2015, 80, 51–62. [Google Scholar] [CrossRef]
  26. Jia, Z.; Gao, Z.X.; Ji, J.J. A Mechanism for the Evolution of Hot Compression Cracking in Inconel 625 Alloy Ingot With Respect to Grain Growth. Adv. Eng. Mater. 2020, 22, 9. [Google Scholar] [CrossRef]
  27. Huang, K.; Loge, R.E. A review of dynamic recrystallization phenomena in metallic materials. Mater. Des. 2016, 111, 548–574. [Google Scholar] [CrossRef]
  28. Kumar, S.S.S.; Raghu, T.; Bhattacharjee, P.P.; Rao, G.A.; Borah, U. Work hardening characteristics and microstructural evolution during hot deformation of a nickel superalloy at moderate strain rates. J. Alloys Compd. 2017, 709, 394–409. [Google Scholar] [CrossRef]
  29. Guo, Q.M.; Li, D.F.; Guo, S.L.; Peng, H.J.; Hu, J. The effect of deformation temperature on the microstructure evolution of Inconel 625 superalloy. J. Nucl. Mater. 2011, 414, 440–450. [Google Scholar] [CrossRef]
  30. Kumar, S.S.S.; Raghu, T.; Bhattacharjee, P.P.; Rao, G.A.; Borah, U. Strain rate dependent microstructural evolution during hot deformation of a hot isostatically processed nickel base superalloy. J. Alloys Compd. 2016, 681, 28–42. [Google Scholar] [CrossRef]
  31. Li, D.F.; Guo, Q.M.; Guo, S.L.; Peng, H.J.; Wu, Z.G. The microstructure evolution and nucleation mechanisms of dynamic recrystallization in hot-deformed Inconel 625 superalloy. Mater. Des. 2011, 32, 696–705. [Google Scholar] [CrossRef]
  32. He, G.A.; Liu, F.; Huang, L.; Huang, Z.W.; Jiang, L. Microstructure evolutions and nucleation mechanisms of dynamic recrystallization of a powder metallurgy Ni-based superalloy during hot compression. Mater. Sci. Eng. A-Struct. Mater. Prop. Microstruct. Process. 2016, 677, 496–504. [Google Scholar] [CrossRef]
  33. Breitbarth, E.; Zaefferer, S.; Archie, F.; Besel, M.; Raabe, D.; Requena, G. Evolution of dislocation patterns inside the plastic zone introduced by fatigue in an aged aluminium alloy AA2024-T3. Mater. Sci. Eng. A 2018, 718, 345–349. [Google Scholar] [CrossRef]
  34. Ning, Y.Q.; Luo, X.; Liang, H.Q.; Guo, H.Z.; Zhang, J.L.; Tan, K. Competition between dynamic recovery and recrystallization during hot deformation for TC18 titanium alloy. Mater. Sci. Eng. A 2015, 635, 77–85. [Google Scholar] [CrossRef]
  35. Mecking, H.; Kocks, U.F. Kinetics of flow and strain-hardening. Acta Metall. 1981, 29, 1865–1875. [Google Scholar] [CrossRef]
  36. Ding, R.; Guo, Z.X. Coupled quantitative simulation of microstructural evolution and plastic flow during dynamic recrystallization. Acta Mater. 2001, 49, 3163–3175. [Google Scholar] [CrossRef]
  37. Wu, M.; Zhang, S.; Ma, S.; Yan, H.; Wang, W.; Li, Q. Hot Deformation Behavior of Q345 Steel and Its Application in Rapid Shear Connection. Materials 2019, 12, 2186. [Google Scholar] [CrossRef] [Green Version]
  38. Jonas, J.J.; Quelennec, X.; Jiang, L.; Martin, É. The Avrami kinetics of dynamic recrystallization. Acta Mater. 2009, 57, 2748–2756. [Google Scholar] [CrossRef]
  39. Sellars, C. Modelling microstructural development during hot rolling. Mater. Sci. Technol. 1990, 6, 1072–1081. [Google Scholar] [CrossRef]
  40. Kim, S.I.; Yoo, Y.C. Dynamic recrystallization behavior of AISI 304 stainless steel. Mater. Sci. Eng. A-Struct. Mater. Prop. Microstruct. Process. 2001, 311, 108–113. [Google Scholar] [CrossRef]
  41. Kim, S.I.; Lee, Y.S.; Lee, D.L.; Yoo, Y.C. Modeling of AGS and recrystallized fraction of microalloyed medium carbon steel during hot deformation. Mater. Sci. Eng. A-Struct. Mater. Prop. Microstruct. Process. 2003, 355, 384–393. [Google Scholar] [CrossRef]
Figure 1. The diagram illustration of Ni-Cr-Co-based superalloy during isothermal hot compression tests.
Metals 12 00357 g001
Figure 2. True stress–true strain curves of studied superalloy at different deformation conditions: (a) 0.01 s−1, (b) 0.1 s−1, (c) 1 s−1, (d) 5 s−1.
Metals 12 00357 g002
Figure 3. The initial microstructure of studied superalloy before hot deformation: (a) orientation image microscope map, (b) distribution of misorientation angles, (c) distribution of grain size.
Metals 12 00357 g003
Figure 4. The microstructure of studied superalloy under different deformation temperatures with strain rate 1 s−1: (a) 1323 K, (b) 1373 K, and (c) 1423 K.
Metals 12 00357 g004
Figure 5. The microstructure obtained for the studied superalloy at the true strain of 0.916 and 1393 K with a strain rate of (a) 0.01 s−1, (b) 0.1 s−1, and (c) 1.0 s−1.
Metals 12 00357 g005
Figure 6. Distributions of misorientation angle of studied superalloy obtained at: (a) strain rate of 1 s−1 with different deformation temperatures of 1323, 1373, and 1423 K; (c) deformation temperature of 1393 K with different strain rates of 0.01, 0.1, and 1.0 s−1. (b,d) correspond to the fractions of HAGBs, MAGBs, and LAGBs in (a,c), separately.
Metals 12 00357 g006
Figure 7. KAM maps of the studied superalloy obtained at: strain rate of 1 s−1 with different deformation temperatures of (a) 1323, (b) 1373, and (c) 1423 K; deformation temperature of 1393 K with different strain rates of (d) 0.01, (e) 0.1, and (f) 1.0 s−1.
Metals 12 00357 g007
Figure 8. Schematic diagram of the relationship between work-hardening rate (θ) and flow stress (σ).
Metals 12 00357 g008
Figure 9. The relationship between work-hardening rate and the true stress.
Metals 12 00357 g009
Figure 10. The curve of dθ/dσ-σ.
Metals 12 00357 g010
Figure 11. (a) The relationship between εc and εp, (b) the relationship between ln[(ε − εc)/ε0.5] and ln[−ln(1 − XDRX].
Metals 12 00357 g011
Figure 12. Comparison between the experimental (solid curves) and the predicted (symbols) stress–strain values with strain rates of (a) 0.01 s−1, (b) 0.1 s−1, (c) 1 s−1, and (d) 5 s−1.
Metals 12 00357 g012
Figure 13. Correlation of the experimental and the predicted values: (a) true stress and (b) AGS of DRX.
Metals 12 00357 g013
Figure 14. 3D map of the computed mathematical model of AGS of DRX.
Metals 12 00357 g014
Table 1. Critical strain (εc) and critical stress (σc) obtained from the work-hardening curves.
Temperature (K)Strain Rate (s−1)
0.010.115
σc (MPa)εcσc (MPa)εcσc (MPa)εcσc (MPa)εc
1323141.36340.0615234.57370.0827354.83940.0907390.8820.1263
1353103.36340.0612160.25940.0781277.56420.0869353.2070.1091
137377.504010.0492128.63840.0642184.41250.0866270.98560.0769
139353.715760.049196.831770.0624164.87650.0803210.7480.0735
142348.175780.033259.178420.0493109.78140.0523155.84540.0660
Publisher’s Note: MDPI stays neutral with regard to jurisdictional claims in published maps and institutional affiliations.

