Article

Effects of Low-Frequency Vibrations on Single Point Incremental Sheet Forming

1
Graduate School, Kyungpook National University, Daegu 41566, Korea
2
Hwashin Co., Ltd., 14, Eonhagongdan 1-gil, Yeongcheon-si 38828, Korea
3
School of Mechanical Engineering, Kyungpook National University, Daegu 41566, Korea
*
Author to whom correspondence should be addressed.
Metals 2022, 12(2), 346; https://doi.org/10.3390/met12020346
Submission received: 3 January 2022 / Revised: 4 February 2022 / Accepted: 12 February 2022 / Published: 16 February 2022
(This article belongs to the Topic Advanced Forming Technology of Metallic Materials)

Abstract

:
This study investigated the effects of longitudinal low-frequency vibrations on the performance of the single point incremental forming process of an aluminum alloy 1050 (AA1050) sheet. Low-frequency vibrations were added to the forming tool’s axial movement. A finite element model of low-frequency vibration single point incremental forming was established. Numerical simulation analyzed the effect of low-frequency vibrations on the entire forming process. Then, the simulation results were verified through actual experiments. The results showed that low-frequency vibrations could significantly reduce the forming force and improve the formed product’s geometric accuracy.

1. Introduction

Single point incremental sheet forming (SPIF) is a flexible sheet-forming process that has gained significant interest since the pioneering work of Iseki [1]. It is a die-less process where the forming tool is typically programmed to move along a computer numerical control (CNC)-controlled concrete path to form a predetermined shape by local layer-by-layer deformation (Figure 1) [2]. During the forming process, the workpiece/blank is clamped with a fixture while a pin-like tool is programmed to follow a circle’s circumference. After completing the circle, the tool steps down and toward the center to start a new circular pass. After several passes, a truncated cone can be generated. Apart from the conventional press-forming process, SPIF can directly form various part geometries from computer-aided design models and computer control codes without complex dies. This process is energy-saving and has immense potential for rapid part prototyping while only requiring small quantities of materials.
During the past few decades, researchers have focused on investigations into the formability, forming force, geometric accuracy, and surface finish in the SPIF process. Minutolo et al. [3] researched the SPIF process’s formability using the maximum forming angle. Jeswiet et al. [4] discussed the forces that develop during formation of the pyramid- and cone-shaped parts from aluminum alloy 3003-O. To measure these forces, a cantilever-type sensor was mounted on the forming tool’s spindle. The axial force was larger than the combined forces in the sheet surface’s plane. The wall angle was a crucial factor, as the forming force increases with increasing wall angle. Duflou et al. [5] experimentally investigated the relationship of the forming forces with four selected process parameters: the step depth, tool diameter, wall angle, and initial sheet thickness. It was concluded that the forming forces increased as the step depth, wall angle, and sheet thickness increased. Filice et al. [6] studied sheet metal’s stress state and deformation mode using SPIF technology. The results showed that the material in the deformation area is subjected to a large hydrostatic pressure, influencing the overall deformation ability of sheet metal.
When measuring a part’s strain distribution after the SPIF process, the part’s second principal strain is close to zero; that is, the circumferential strain is zero. Forming of the part is primarily derived from wall stretching and normal thinning. Ambrogio et al. [7] found sheet thickness and part depth to be the most significant factors affecting the geometric error using analysis of variance. Durante et al. [8] described a model for evaluating the roughness with respect to the amplitude and spacing associated with the forming angle, step size, and tool diameter. Fiorentino et al. [9] proposed a method to reduce the geometric error by compensation. This method is an iterative algorithm based on an artificial identification system. Experimental verification was conducted using different tool paths and materials in non-axisymmetric parts. Hamilton et al. [10] investigated the influence of tool feed rates and spindle rotation at high speeds during forming on non-contact-side roughness. Moreover, a model for orange peel prediction in SPIF was established, providing guidelines for improving external surface quality.
Friction in the SPIF process has also received extensive attention from scholars. In general, friction is not conducive to sheet metal forming, so, to reduce friction, SPIF is usually carried out by applying a lubricant between the sheet and the forming tool.
However, when the tool rotates at a high speed, the large amount of heat generated by rotational friction between the tool and the material is beneficial to the metal’s formability. Using this method, Park et al. [11] successfully formed a magnesium alloy sheet (hard-to-form material) without any lubrication (dry friction state). In their research, a large amount of heat (up to 200°) was generated due to excessive friction between the rotating tool and the unlubricated sheet, which significantly improved the plastic deformation ability of the magnesium alloy. This method was called friction stir incremental sheet forming (FS-ISF) by Otsu et al. [12].
Recent studies have proposed various auxiliary incremental forming systems to satisfy industrial requirements. Malhotra et al. [13] developed a novel accumulative double-sided incremental forming strategy where the forming begins at the deepest feature and gradually shapes up the features by taking advantage of rigid-body motions. Xiao et al. [14,15] have developed a heat-assisted incremental forming process (Hot-ISF) by adding a halogen heating system to process hard-to-form materials. They formed a good quality aluminum alloy 7075 and carbon-fiber-reinforced polymer sheets. Other proposed methods include electric auxiliary SPIF [16] and laser-assisted SPIF [17] that avoid defects by changing the magnitude and action mode of the forming force. These strategies improve geometric accuracy, increase material formability, and reduce the forming force.
Vibration-assisted forming (VAF) is a well-established technique. It is advantageous because it can reduce the flow stress, lower the friction force at the die-specimen interface, and improve surface quality. Ultrasonic vibration forming (UVF) has elicited considerable attention recently and has been applied in drawing [18], forging [19], extrusion [20], welding [21], and other methods, due to its significant softening and hardening effects on metallic materials. Recent research on ultrasonic SPIF has emerged. Amini et al. [22] investigated the effect of longitudinal ultrasonic vibration on the performance of SPIF processing of an AA1050 sheet. They found that the ultrasonic vibrations could decrease the forming force and significantly increase the metal sheet’s formability. Li et al. [23] analyzed the influence of different frequencies and amplitudes of ultrasonic vibrations on the forming force by finite element simulation. Ultrasonic vibrations could reduce the forming force and improve the formed parts’ surface quality. Long et al. [24] investigated the impacts of various processing parameters, including the sheet material, ultrasonic vibration power, feeding speed, and tool diameter, on force reduction and temperature variability. The material with higher yield stress showed higher force reduction and temperature variation.
With the development of vibration-production technology, low-frequency vibration can be superimposed with micro-amplitudes in sheet metal forming, called low-frequency vibration forming (LFVF). The softening and hardening effects in UVF also appear in LFVF. LFVF has lower costs, and can tolerate a greater forming force, than UVF, and is more suitable than UVF when used in practical industries requiring large forming forces. Many scholars have focused on developing LFVF technologies. Maeno et al. [25] developed a vibration-assisted plate-compression process to prevent a sharp increase in the load using a servo press. Elastic recovery between the die and plate automatically fed the liquid lubricant into the gap due to vibration, significantly improving the lubrication and markedly decreasing the compressive load.
Ali et al. [26] applied a pulsed blank holder force at 0–10 Hz to the blank deep drawing process, proving that a quality product could be acquired without tearing or wrinkles using a pulsed blank holder force at an ultra-low frequency (<1 Hz). Matsumoto et al. [27] superposed torsional oscillation with a maximum frequency of 1.5 Hz to reduce the axial forging load in the cold upsetting process. Meng et al. [28] proposed a vibration-assisted plastic-forming method and assessed its influence on the clutch hub-forming process, showing that applying vibration can effectively reduce the forming force and improve the part’s surface quality. The drop in forming load was proportional to the vibration frequency and amplitude, and the load decreased by up to 25%. Halicioglu et al. [29] demonstrated a prototype of a servo press with a programmable ram motion. A soft ram motion with 20 strokes/min enabled high velocity forming with large thicknesses and improved the material’s surface quality.
Wang et al. [30] introduced an electric–hydraulic chattering experimental setup for cold extrusion. With chattering in the bottom die, the deformation resistance decreased, and the material flow proceeded easily. The load reduction in vibration-assisted deformation processes is due to changes in friction conditions in the deformation zone and material structure. Meng et al. [31] investigated the effects of applying LFV in three directions (i.e., transverse, normal, and rolling) on a commercial steel sheet’s mechanical behavior and microstructure during tensile deformation to provide a fundamental understanding of LFV. The transverse application of low-frequency vibrations had a vibration softening effect, and vibrations in the normal/rolling directions resulted in a vibration hardening effect. Residual softening occurred in all cases during the yield period after removing the vibration. The maximum load drop after the vibration treatment in the transverse direction was more significant than in other cases. The low-angle grain boundaries increased significantly after the transverse vibration treatment, and the interior of the grains showed a notable trend toward forming subgrain boundaries.
As discussed above during the SPIF process, lubricants are applied on the sheet surface to reduce the contact friction between the forming tool and the sheet. As in the FS-ISF case, to form the hard-to-formable material, limited lubrication is known to be beneficial. Generally, in the process of no lubrication, the sliding friction coefficient between the tool and the sheet increases, and the sheet fractures prematurely due to excessive heat generation. However, even in a non-lubricated state, if the vibration is applied to the tool so that continuous sliding contact between the tool and the sheet does not occur, the continuous sliding contact between the tool and the sheet is broken every moment. Therefore, the increase in the sliding friction coefficient is suppressed, and the formability of the sheet can be increased in the SPIF process. The effect of imparting vibration can be remarkable when the lubricating oil is not applied between the sheet and the tool. This has the effect of cleaning the working environment by not needing to apply lubricating oil in the SPIF process.
This study focuses on applying LFV to the SPIF process. A mechanism transferring low-frequency vibrations to the forming tool used in the SPIF process was designed and manufactured. The system comprises a forming tool connecting device, a motor, and a cam system. Then, an LFV-SPIF finite element simulation model was established. By simulating the entire forming process, the deformation mechanism of a sheet under low-frequency vibrations was analyzed, and the effect of low-frequency vibrations on the forming quality of the formed product was revealed. Finally, a series of experiments were conducted to verify the simulation results through the built LFV-SPIF system. At the same time, this study evaluated the effect of LFV on the change of friction conditions in the dry friction state, which created the possibility of not using lubricants in the SPIF process.

2. LFV-SPIF Process and Materials

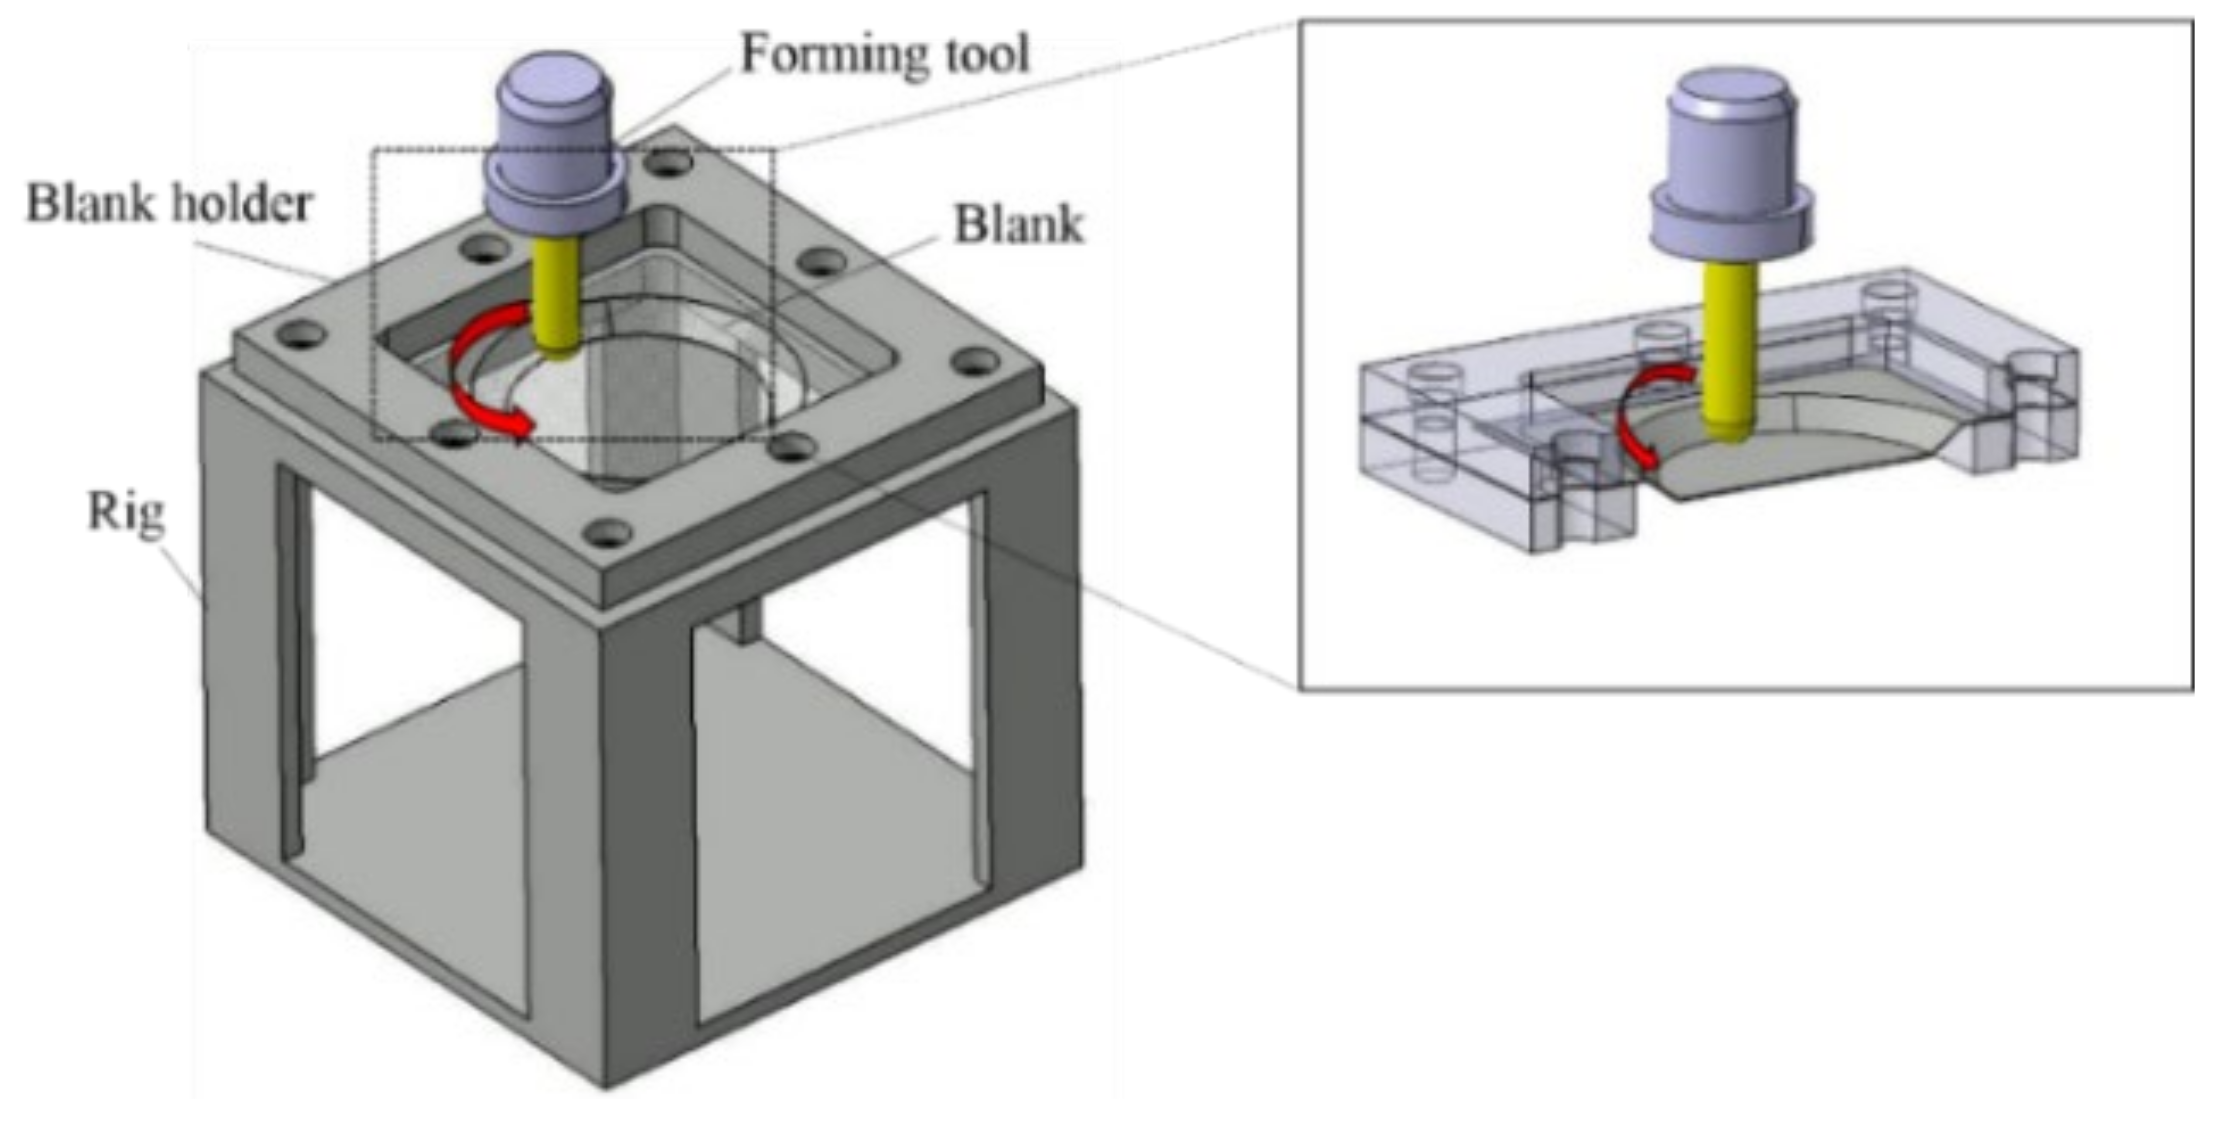
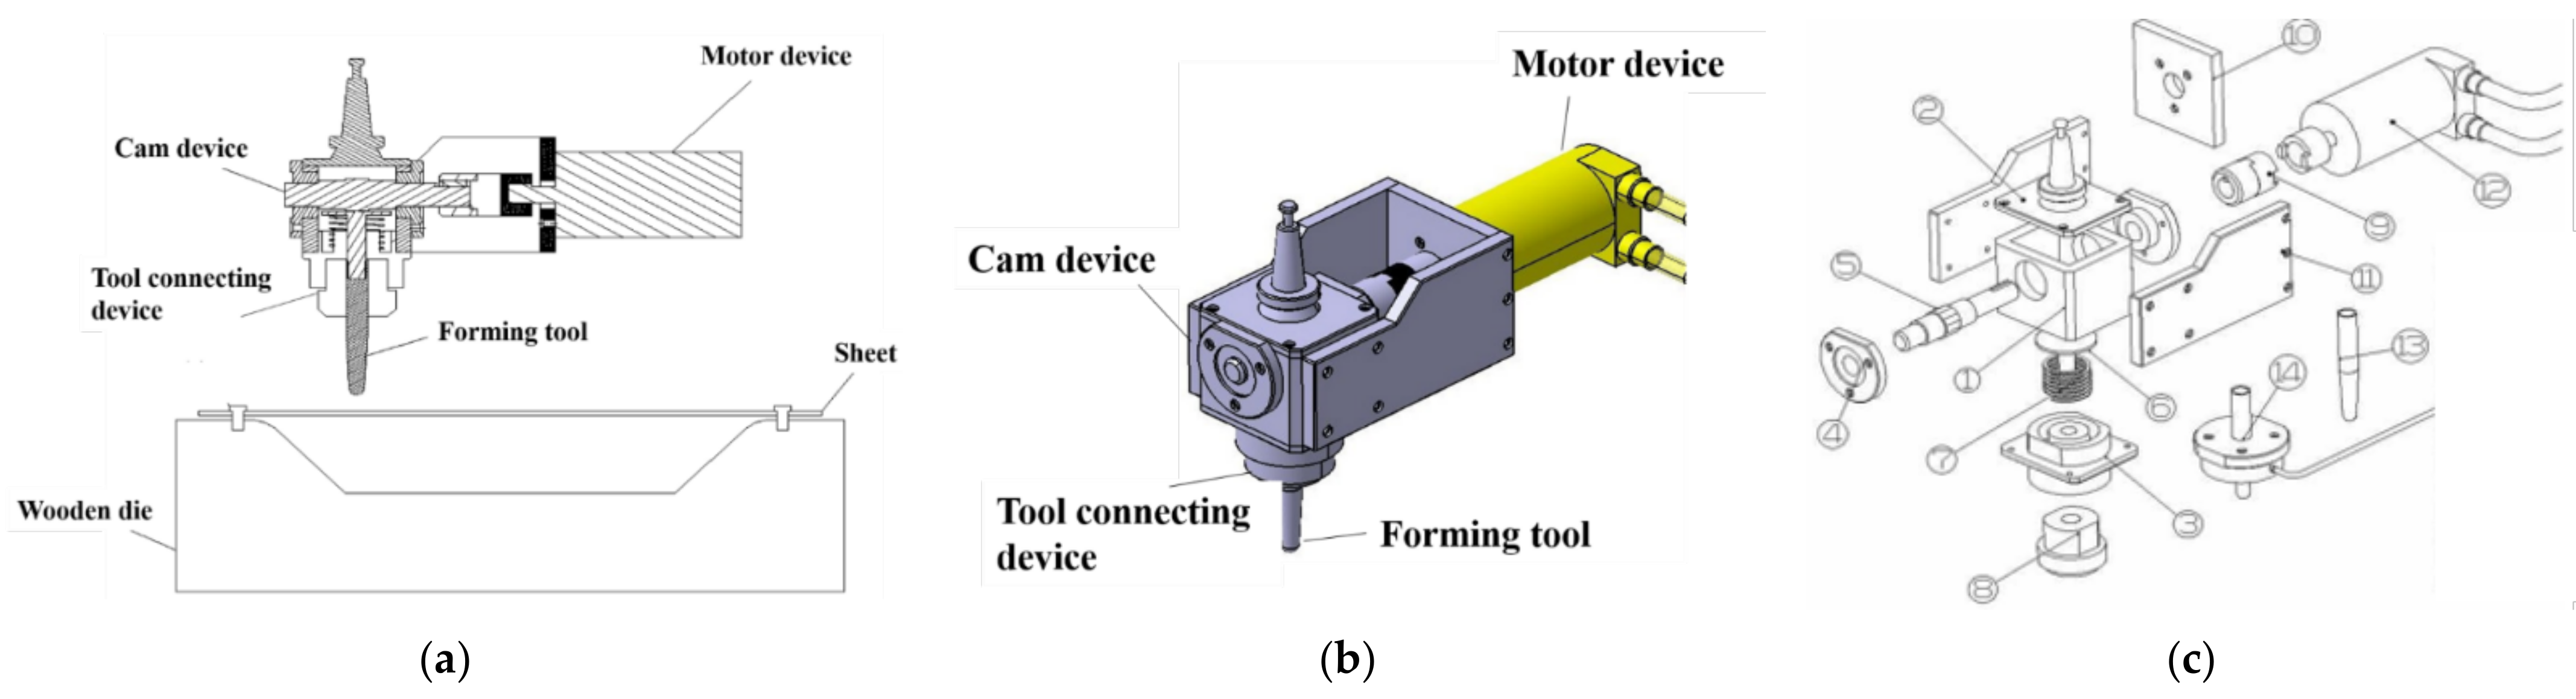
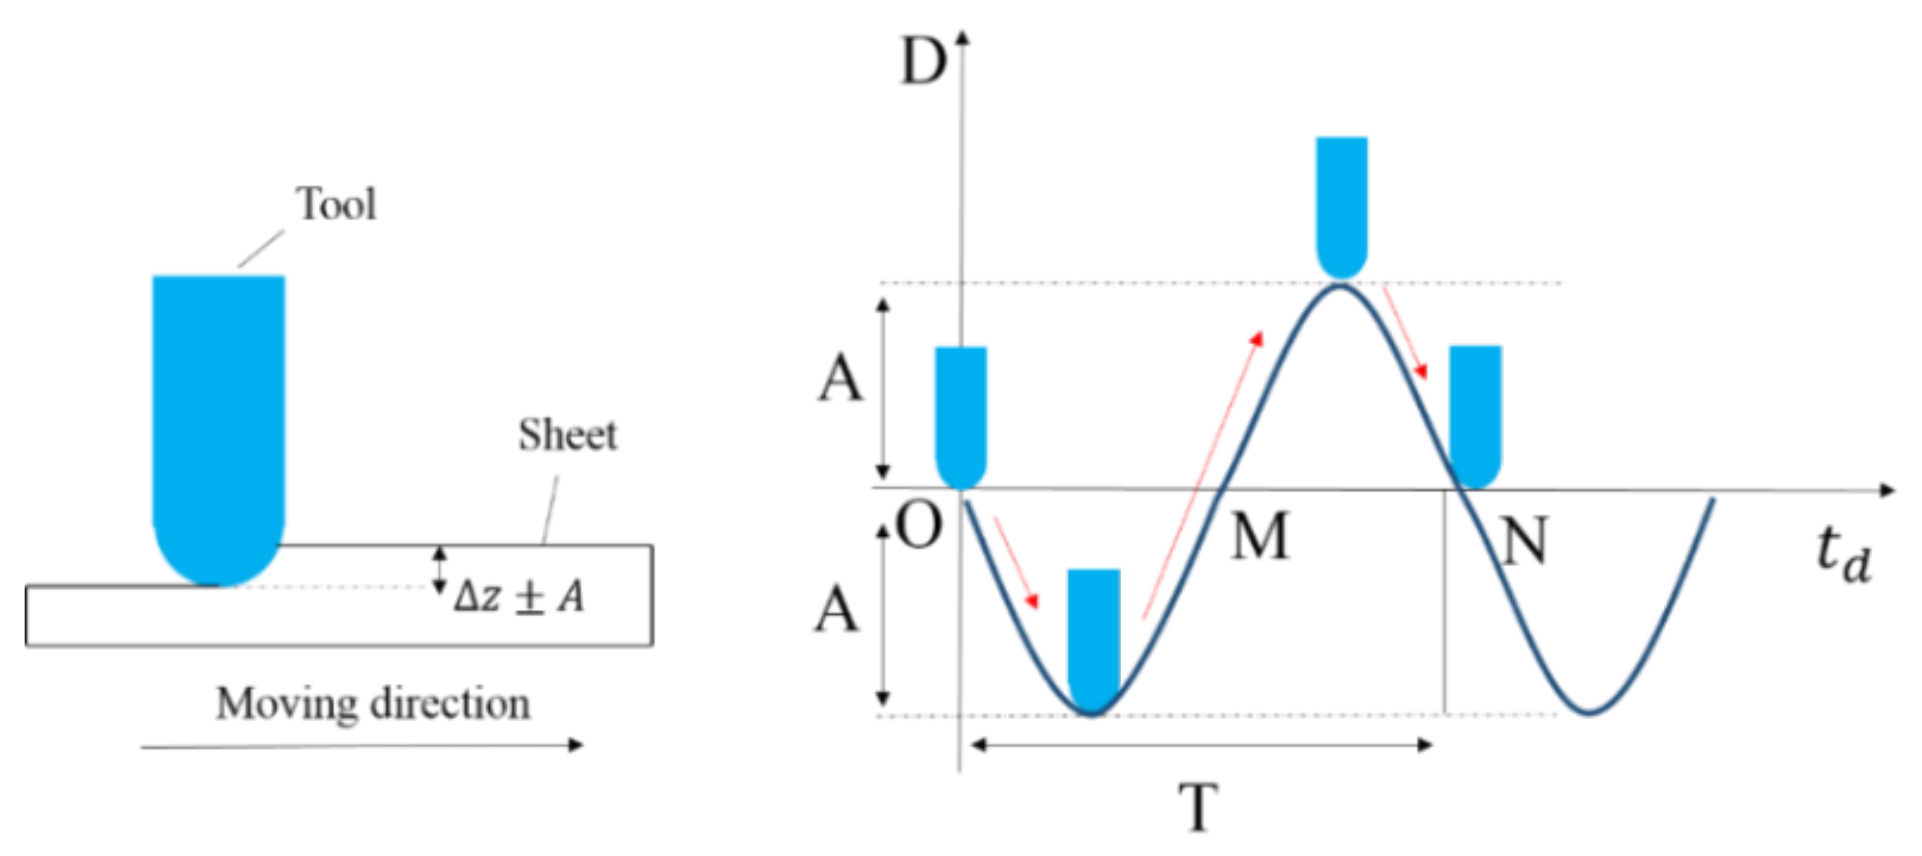
2.1. LFV-SPIF Process

Based on SPIF technology, in this study, an LFV-SPIF system was developed where low-frequency vibrations were applied to the forming tool. The LFV-SPIF system (Figure 2) comprises a forming tool connecting device, motor, and cam system. In this vibration application setup, the motor provides a stable processing force. The designed cam device converts the motor’s uniform speed rotary motion to a uniform reciprocating motion in the Z-direction. Through calculation, along the circumference of the cam’s central axis 14 equal divisions are made to establish 14 peak points so that the designed cam device can convert the natural frequency (90–1700 rpm/min, controlled by the controller) of the motor into 0–100 vibrations per second vertically. Consequently, the forming tool could have an arbitrarily adjusted low-frequency vibration of 0–100 Hz in the Z-direction. In the LFV-SPIF system, forming tools with different diameters can be arbitrarily replaced. The CNC control can freely adjust the amplitude from 0 to 100 μm.

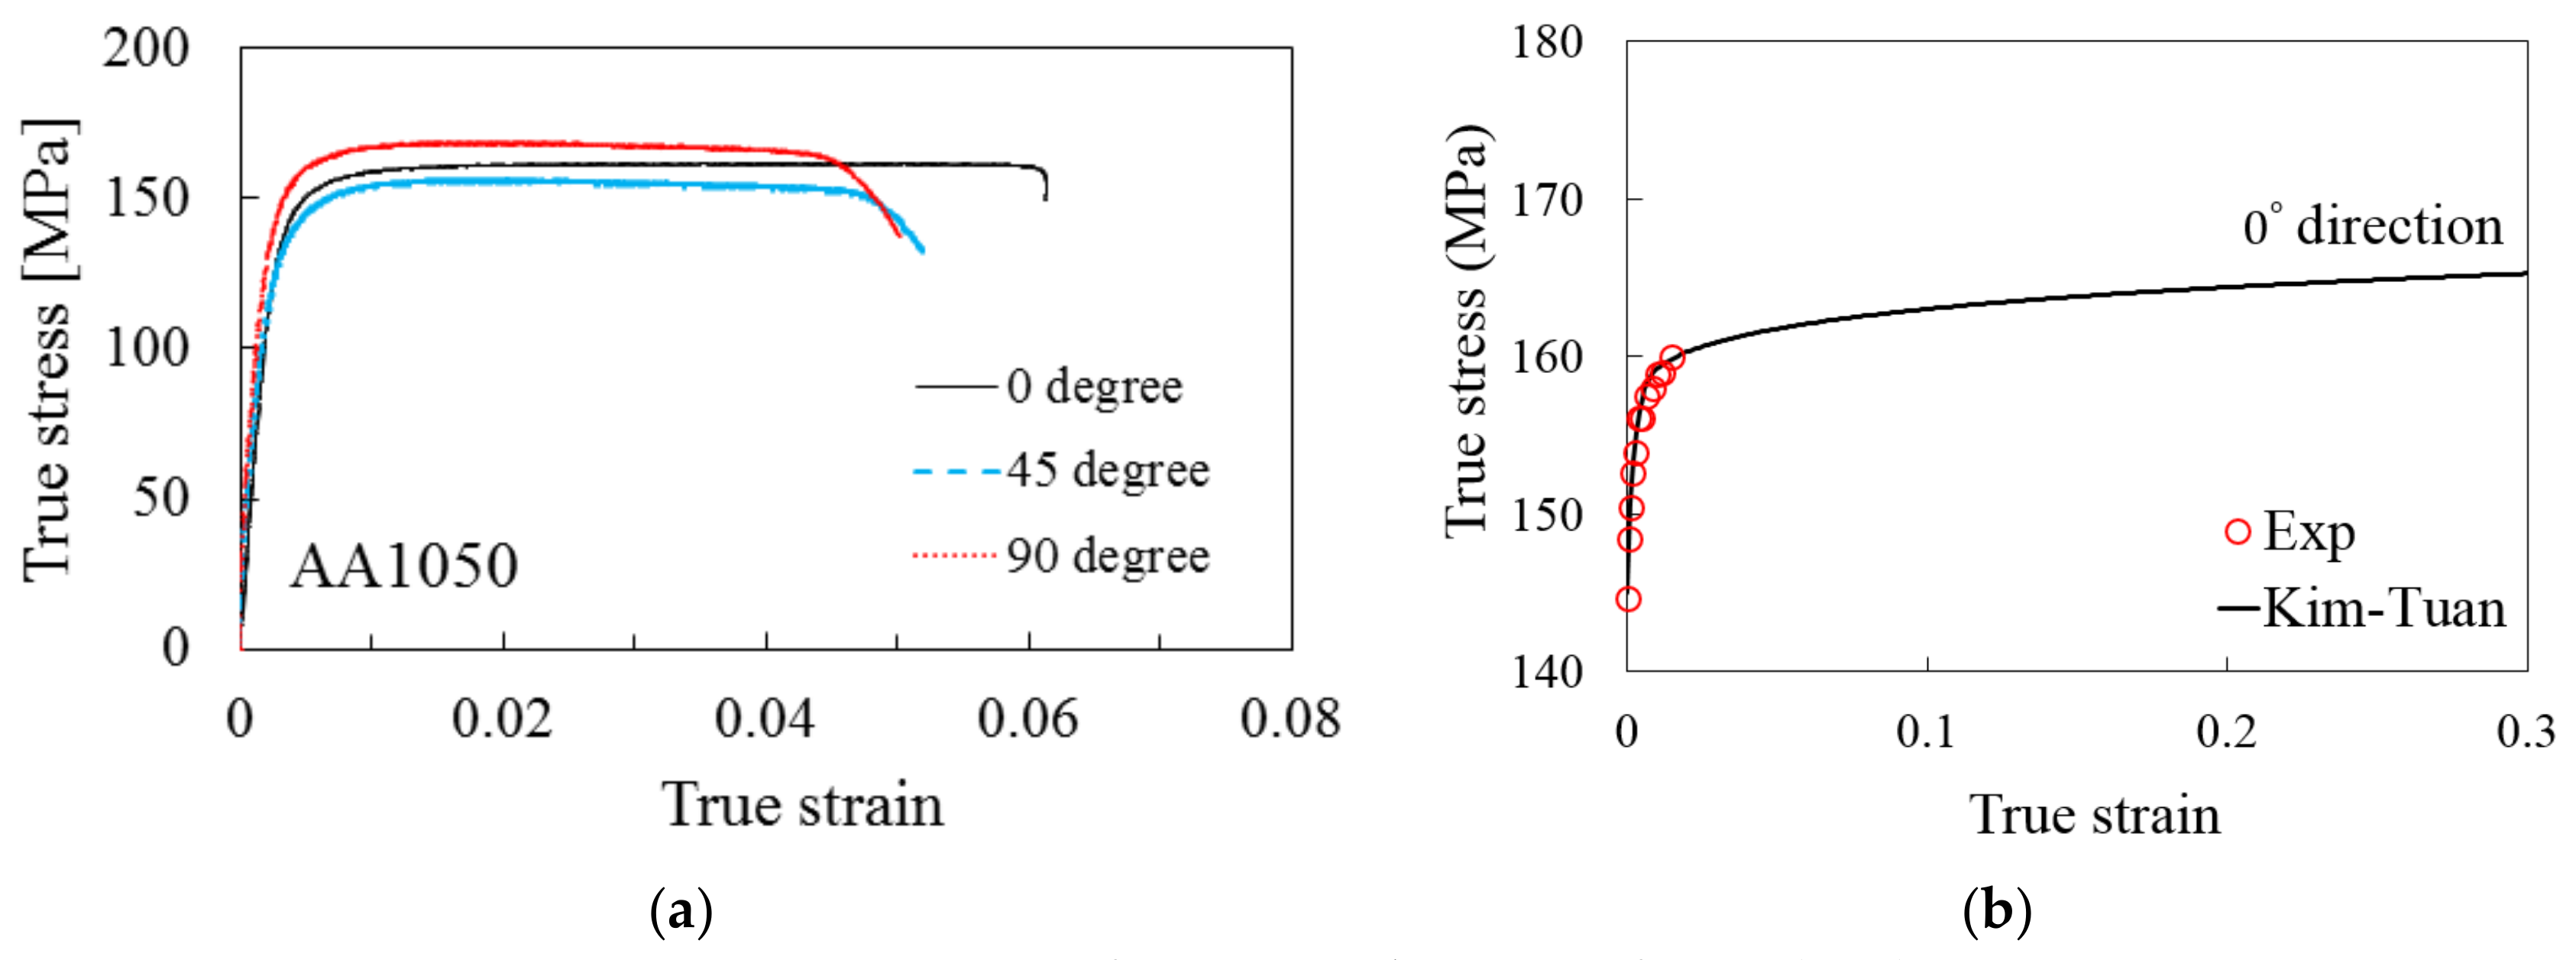
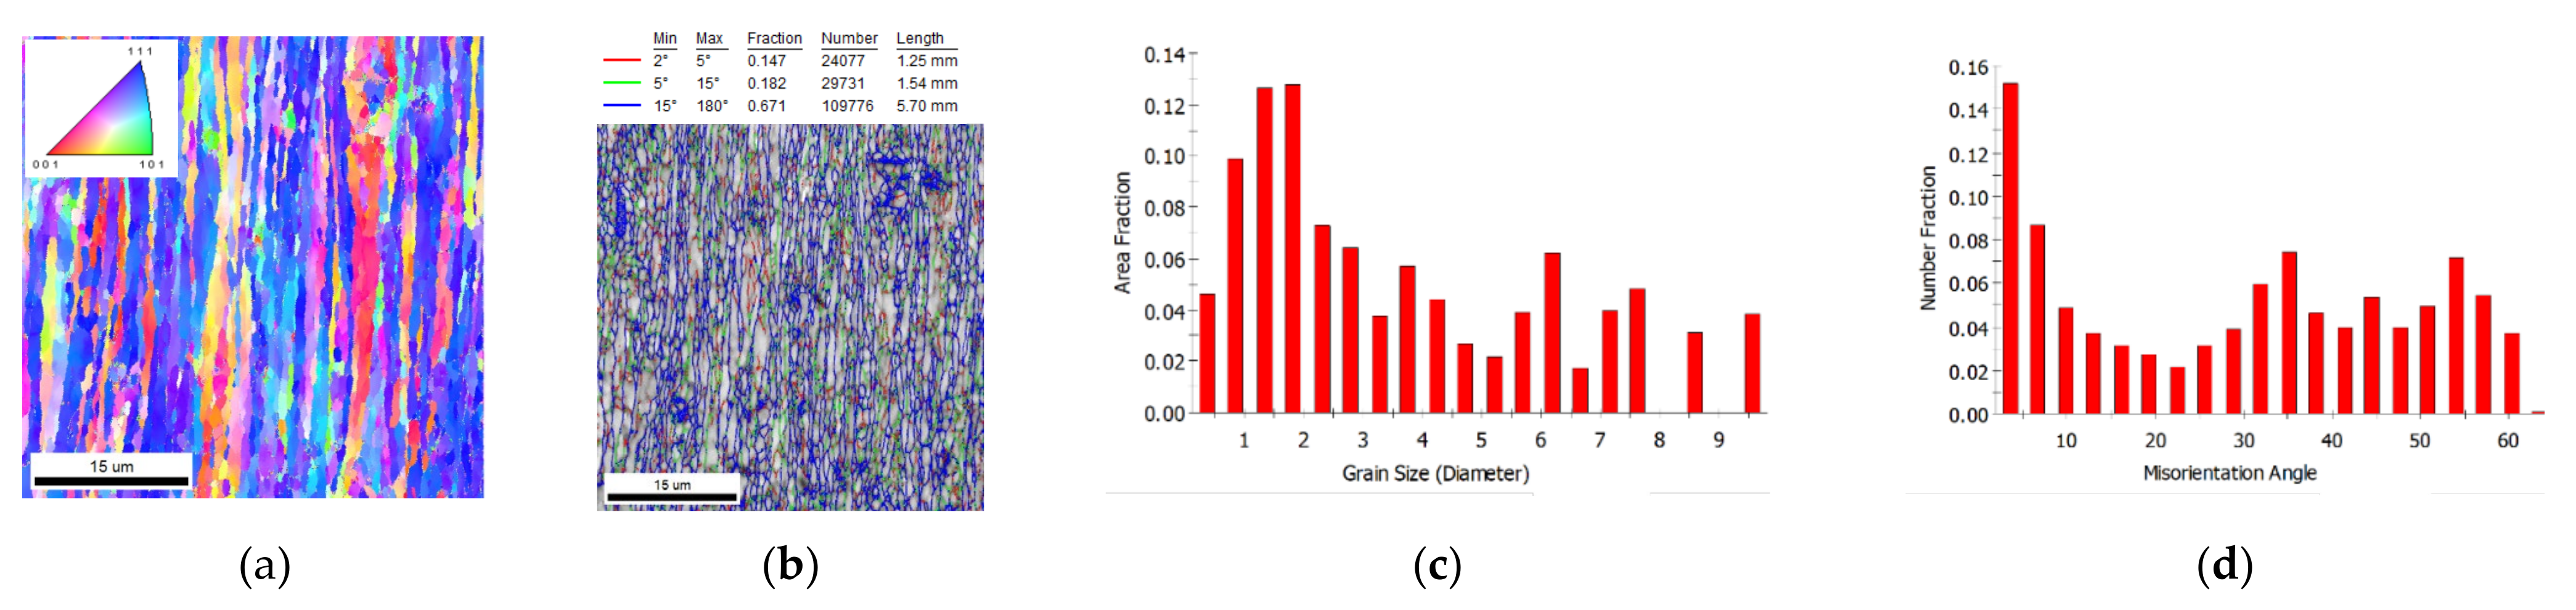
2.2. Material Properties

AA1050 sheet was selected as the forming material in this study. In defining its material properties, all property parameters were obtained from testing samples made of the same batch of sheets used in the experiment. To evaluate the influence of the sheet’s rolling direction on the material’s anisotropy, three sets of specimens maintained at 0°, 45°, and 90° with the rolling direction were intercepted. Their average values were used as the AA1050 sheet’s material property parameters. Tensile tests were conducted on an R&B tensile testing machine at room temperature (25 °C), with a loading speed of 3 mm/min. The true stress–strain curves of the AA1050 sheet’s rolling directions at 0°, 45°, and 90° were obtained (Figure 3a); the mechanical properties of each direction of AA1050 are shown in Table 1. However, the evaluated material undergoes large deformation during incremental forming that could generate a high strain level. Therefore, the hardening function should provide an acceptable estimation for the stress–strain relation beyond the maximum-observed strain or post-necking prediction. The Kim–Tuan hardening model is a suitable choice because it provides a better prediction for the post-necking behavior of various sheet metals [32]. Therefore, this study adopted the Kim–Tuan hardening model (Equation (1)) to describe the stress–strain relation for the evaluated material (Figure 3b).
σ = σ 0 + K T ε + ε 0 h ( 1 exp ( c ε ) )
where K T , h , and c are the proposed equation’s parameters and ( ε 0 , σ 0 ) is the initial yield point in the true-stress–strain curve. Therefore, as shown in Table 2, the values of K T , h , and c can be calibrated using the curve-fitting tool available on some optimization packages, such as Excel or MATLAB.
In addition, the EBSD results of the as-received AA1050 sheet are shown in Figure 4. It is shown in Figure 4a,c that the grain size was nonuniform. Moreover, the misorientation angles between grains were relatively small and the low angle grain boundary accounted for more than 15%, as shown in Figure 4b,d. These two microstructural characters were caused by the rolling process.

3. Experimental Study of LFV-SPIF Process

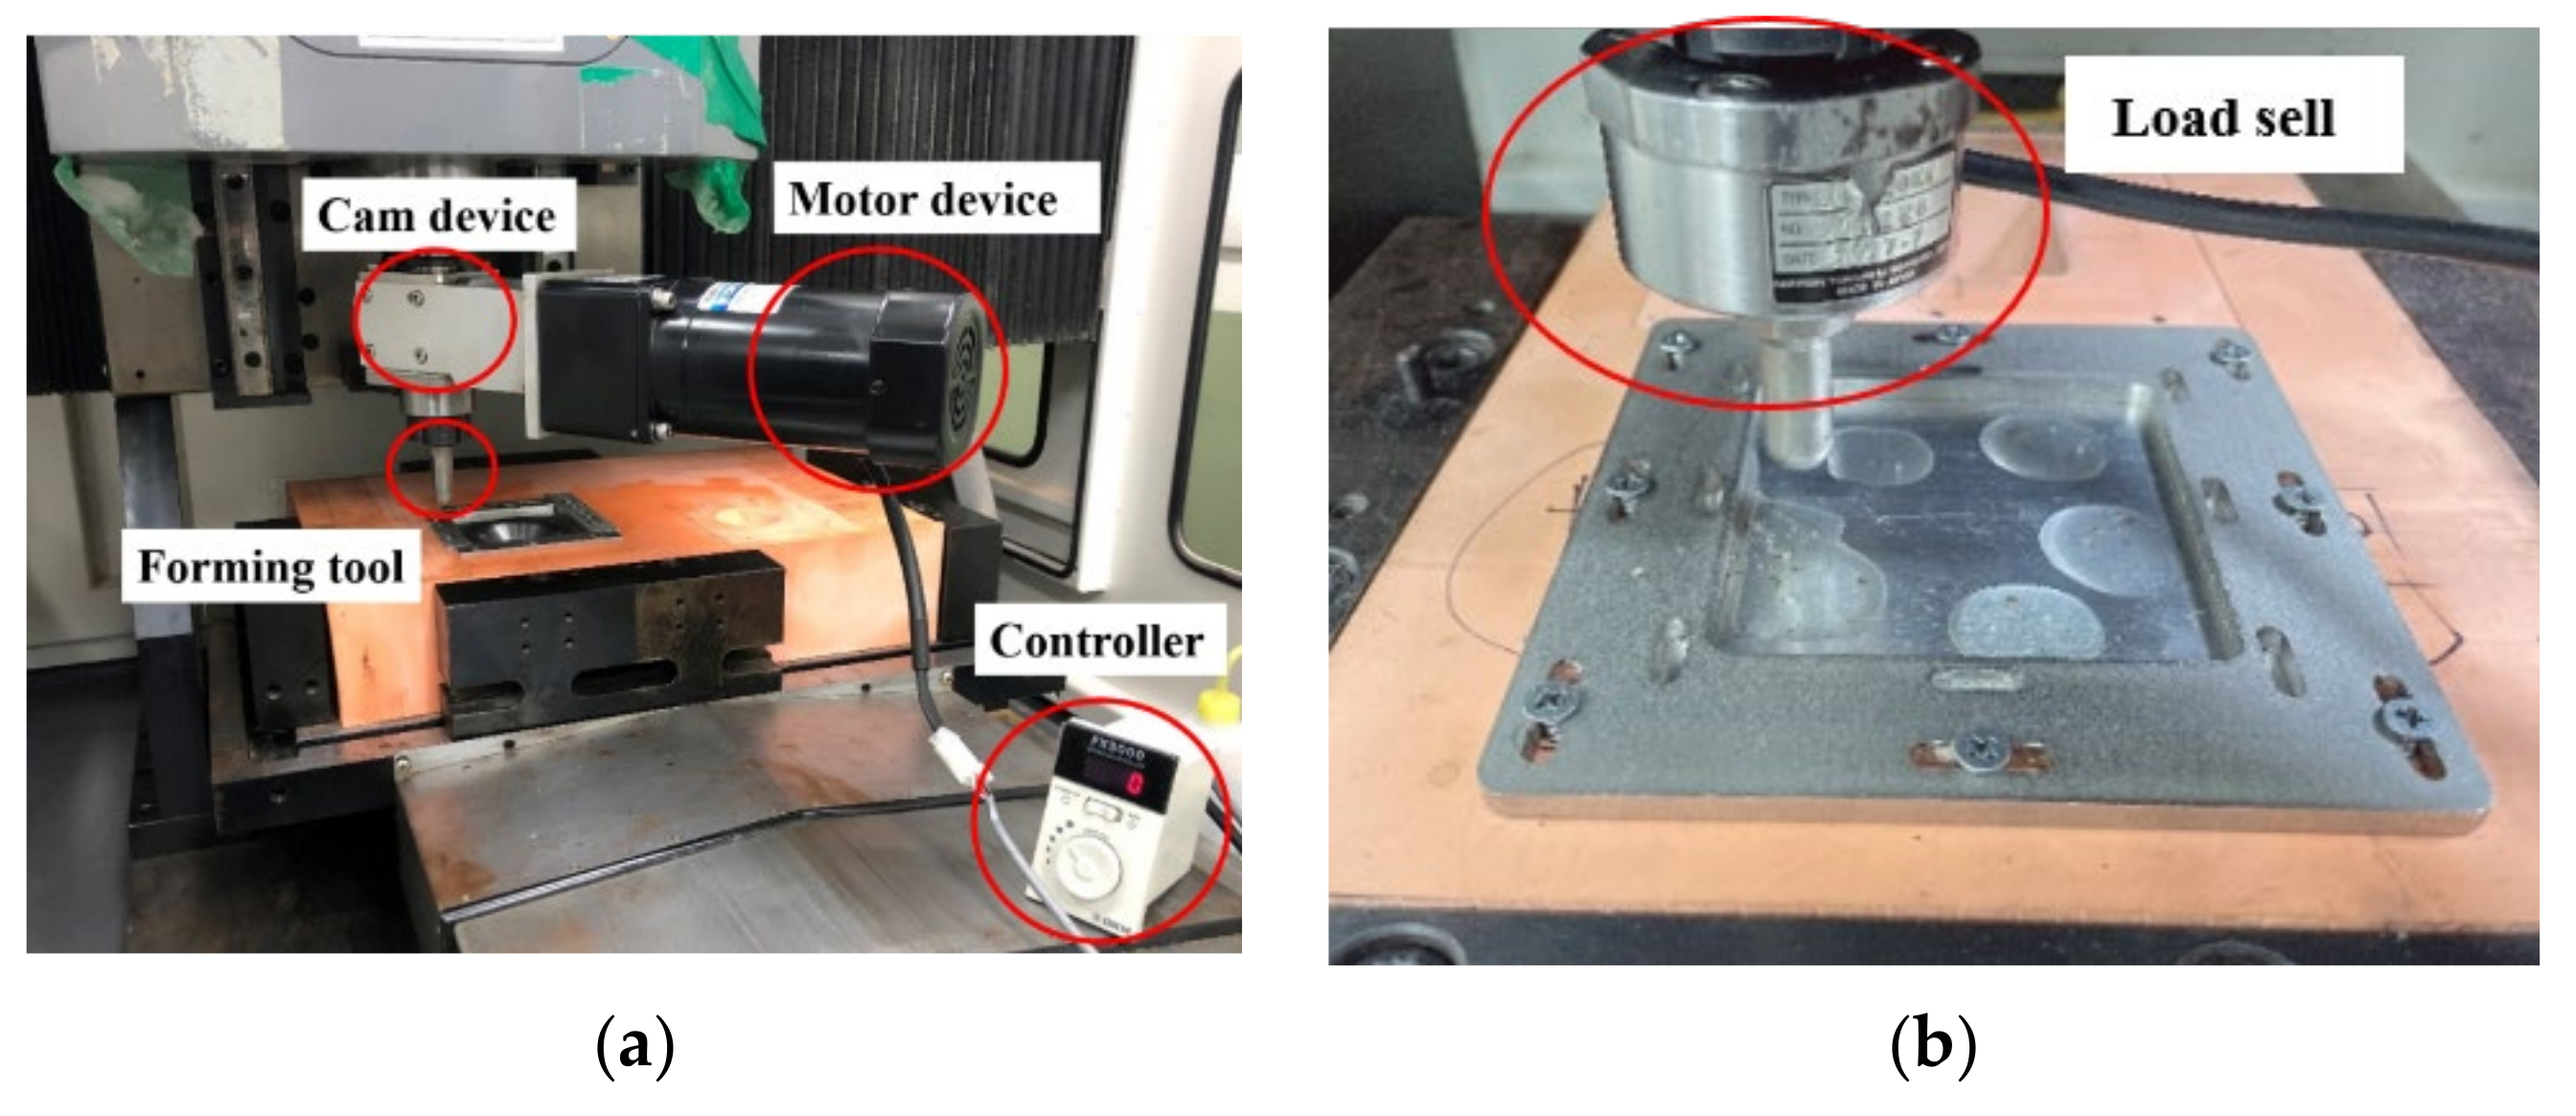
3.1. Experimental Methods

Figure 5a shows the experimental setup of the LFV-SPIF system in which a load cell (NTS-LRL-10kN) was connected to the forming tool for measuring the axial forming force during the forming process (Figure 5b). An AA1050 specimen of 100 mm × 100 mm was cut using laser cutting for forming. In addition, a slide-way oil with a kinematic viscosity of 68 was used for lubrication.

3.2. Experiment Results

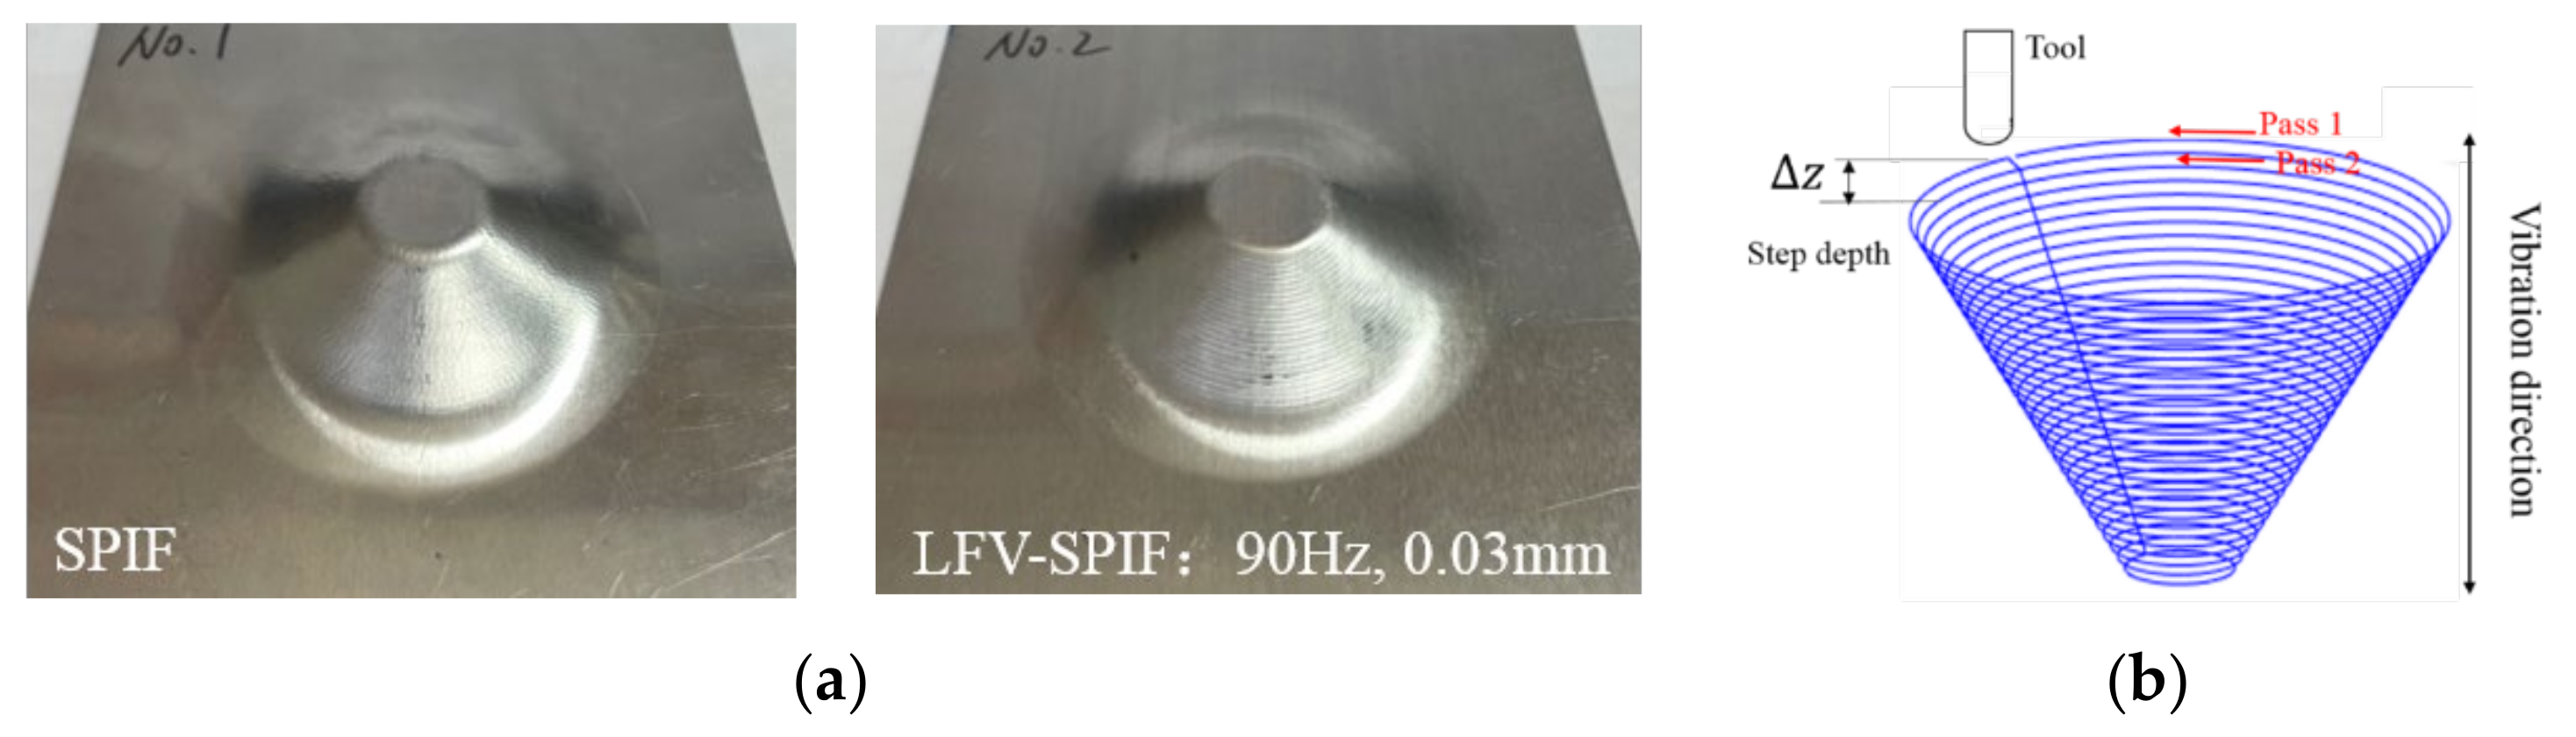
3.2.1. Effect of Low-Frequency Vibration on Formability

The material behavior and formability in the SPIF process can be determined based on the maximum forming angle. To reduce the number of attempts required to determine the formability, the variable wall angle conical frustum (VWACF) test [33] was used to evaluate the formability in this study. (Figure 6a) The surface roughness of the original sheet greatly affected the coefficient of friction and the surface quality of the formed part. In this study, the average surface roughness ( R a ) of the original AA1050 sheet was 0.217 μm.
In addition, due to the vibration, the action mode of the forming tool on the sheet material changed, which led to the continuous contact between the tool and the sheet material becoming an alternating contact, resulting in a significant change in the friction conditions between the sheet material and the forming tool. Therefore, in addition to analyzing the effect of vibration on sheet formability, the effect of vibration on friction condition was also evaluated in this study. According to the experimental plan shown in Table 3, the maximum forming angle of the AA1050 sheet at the forming conditions, with or without vibration, and with or without lubrication, were compared; the results are shown in Figure 6b. Each experiment was repeated three times.
As shown in Table 3, among the four cases, the AA1050 sheet had the lowest formability in the case without vibration and lubrication for which the maximum forming angle was 74.2°. In the other three cases, the maximum forming angle of the sheet was the same, increasing by 5.6% to 78.4°. As a result, although low-frequency vibration cannot improve the formability of sheet metal, the effect of vibration effectively changes the friction conditions. Due to the vibration, the continuous contact between the tool and the sheet becomes an alternating contact. This suppresses the increase in the sliding friction coefficient, leading to a substantial decrease in the friction resistance [34]. In other words, due to LFV, it is possible to minimize the effect of friction without using lubricating oil while maximizing the effect of SPIF in dry friction conditions.

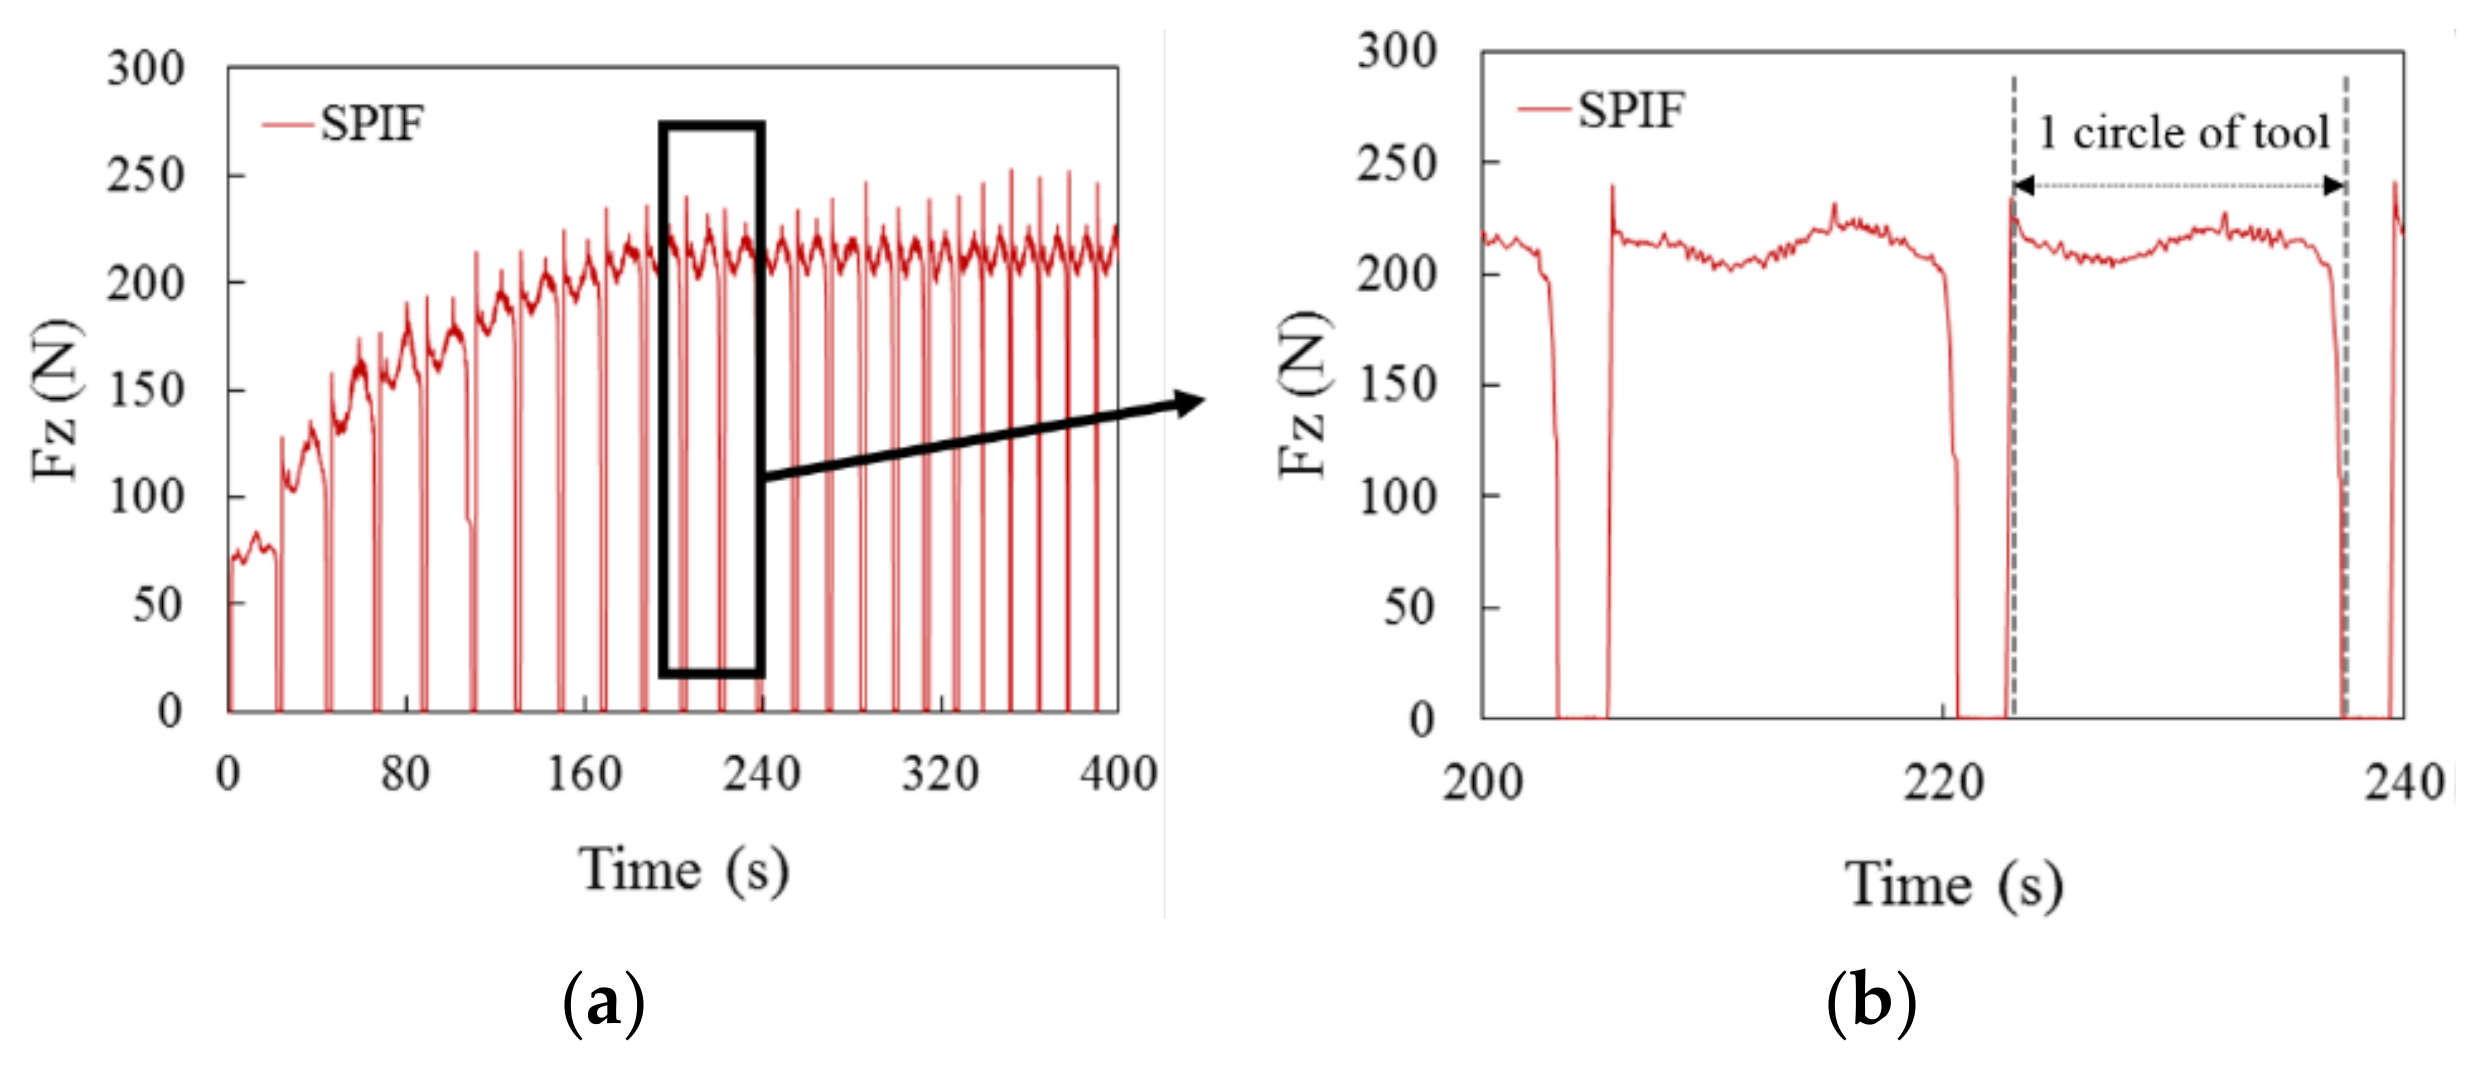
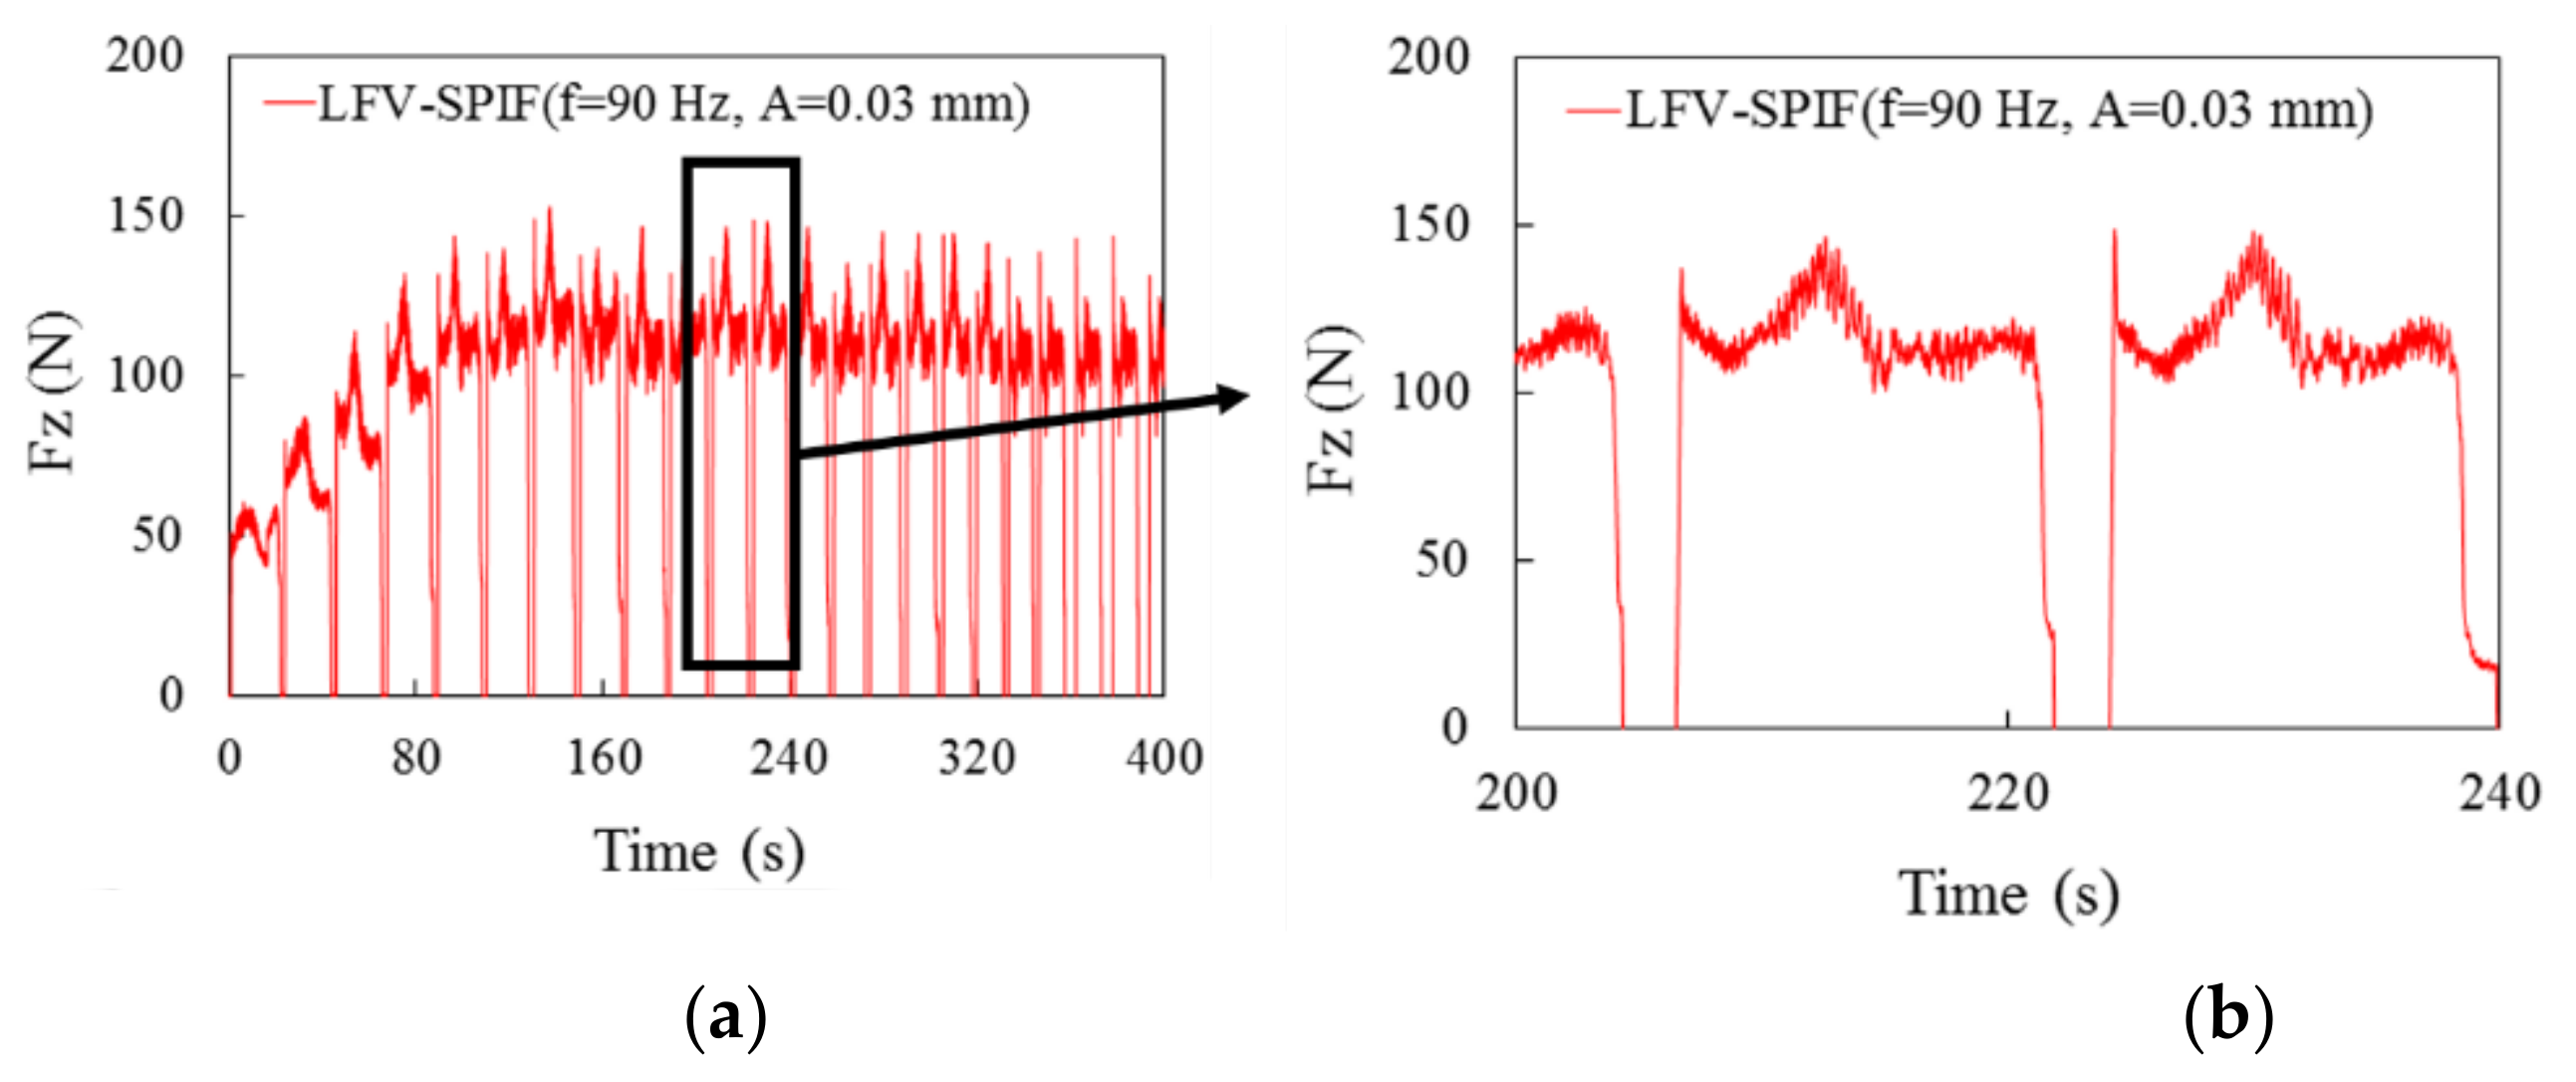
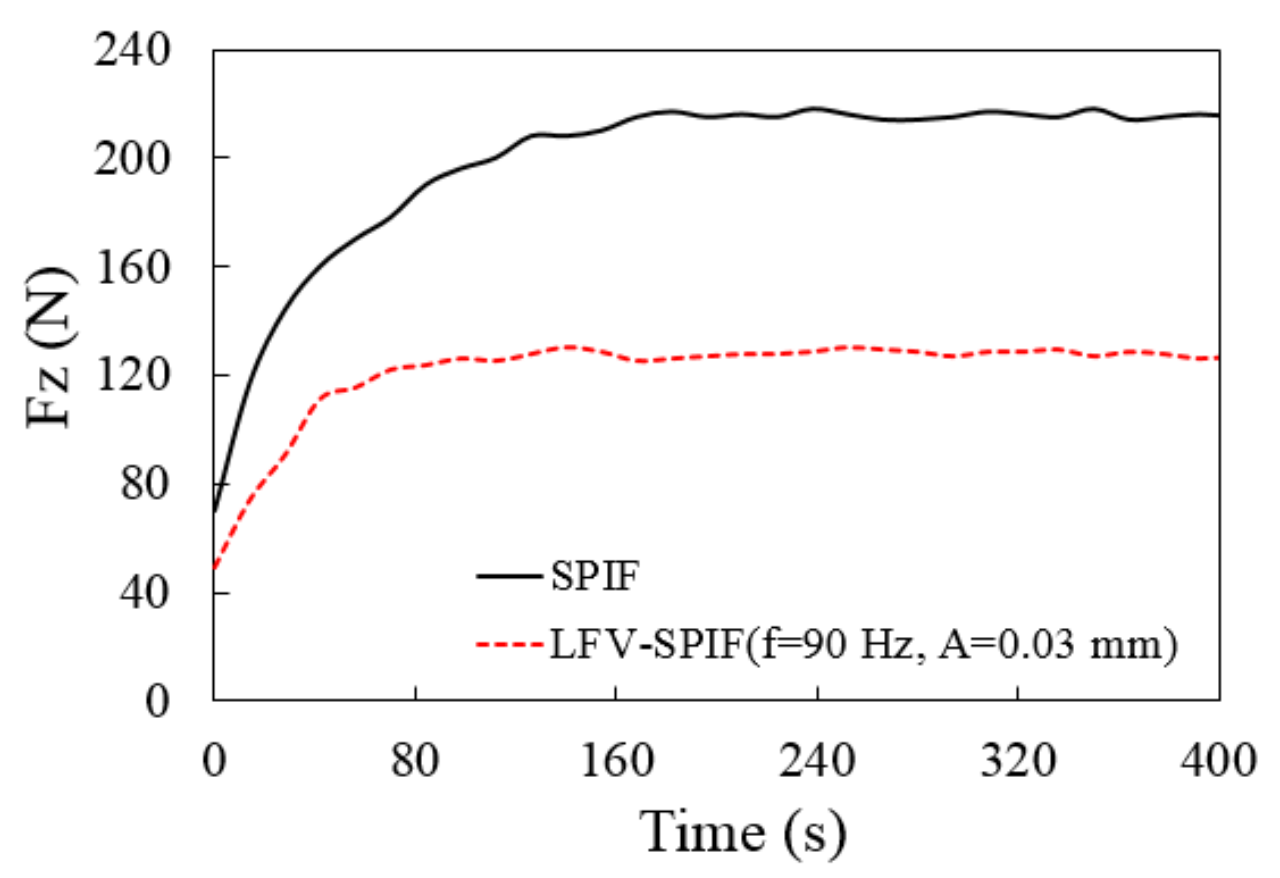
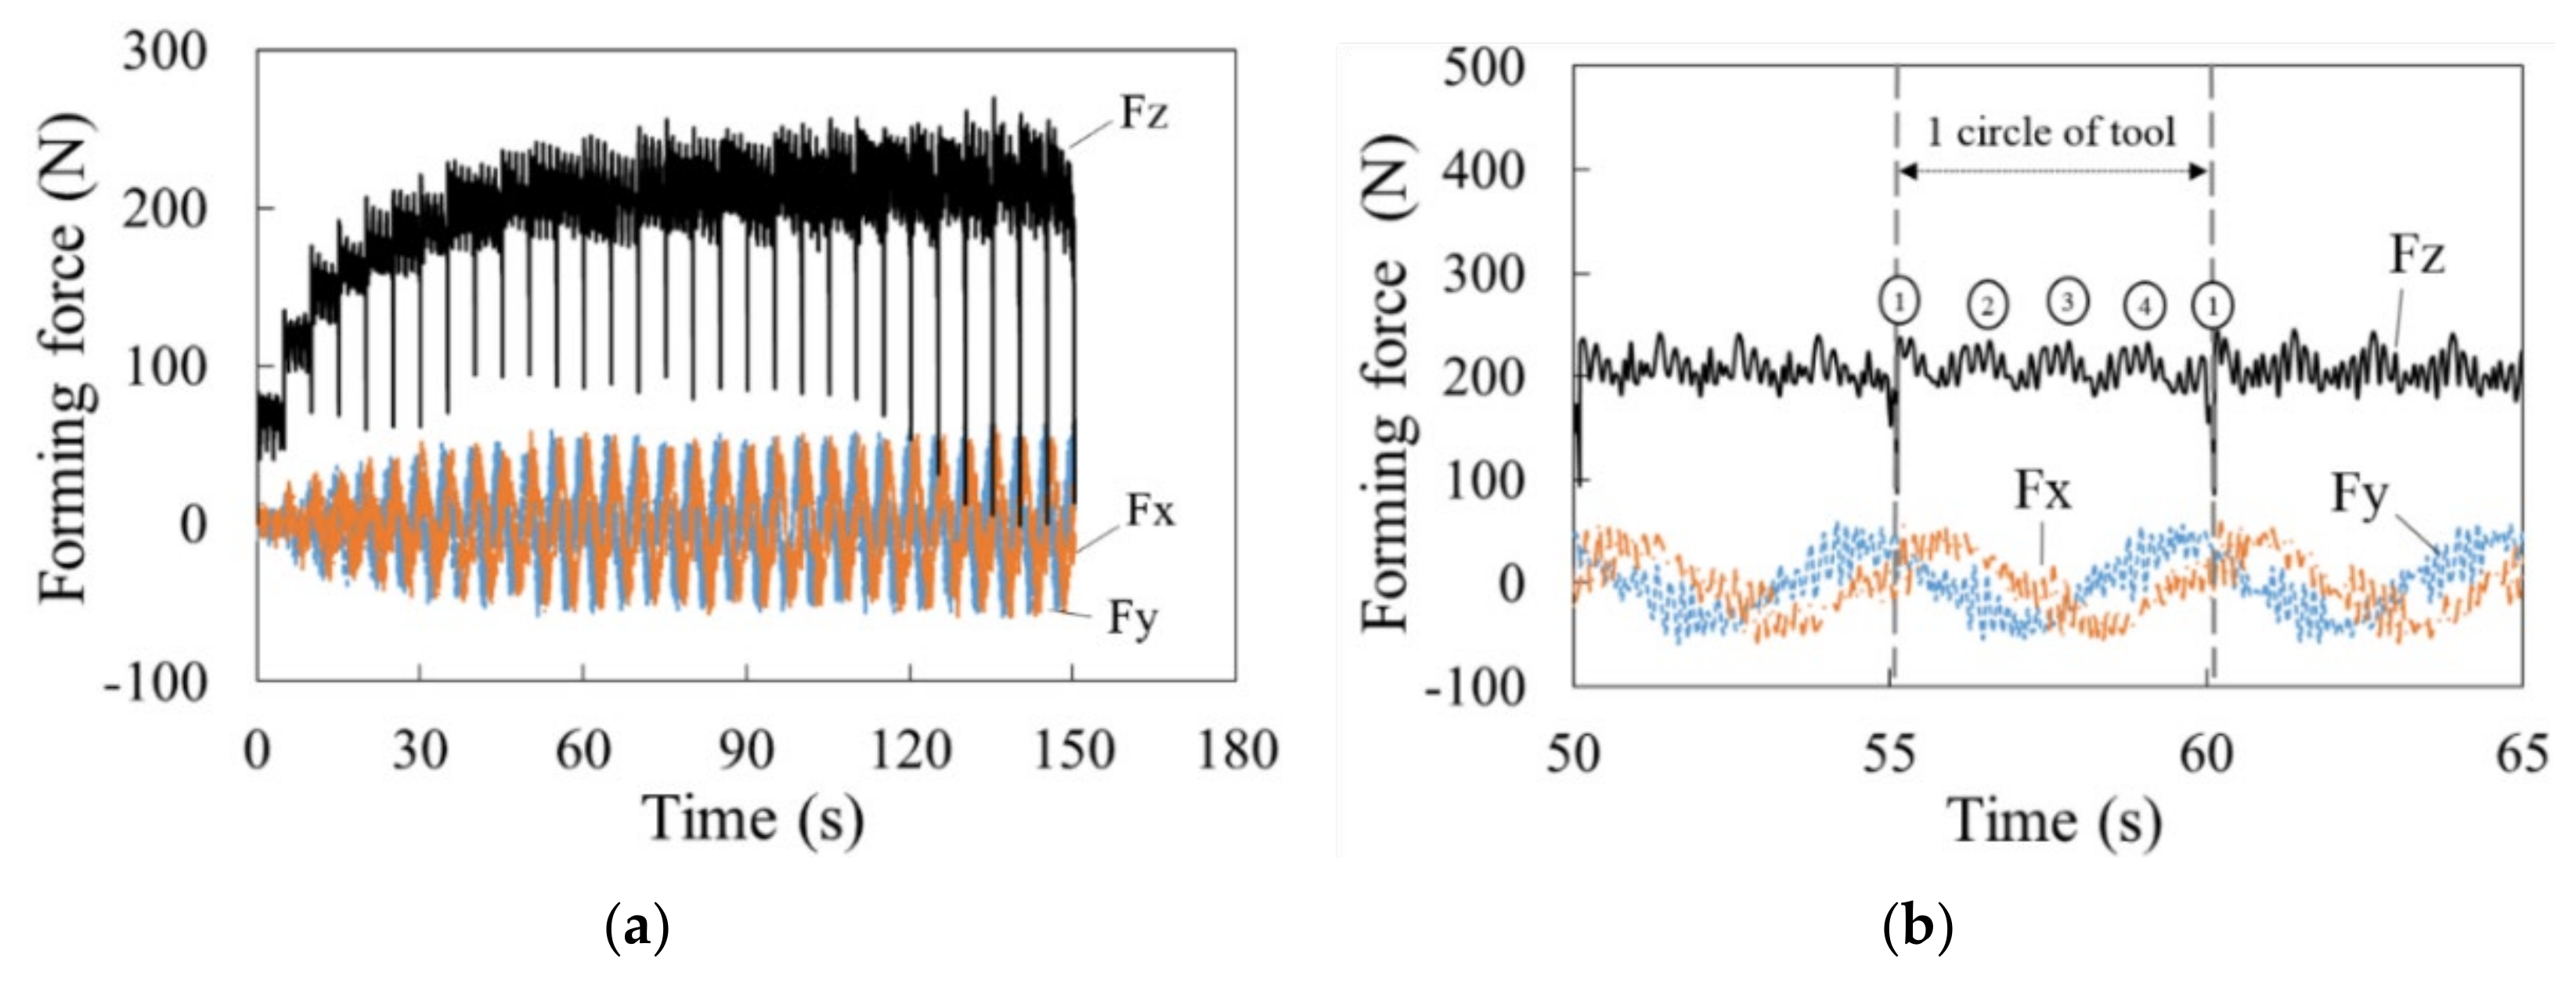
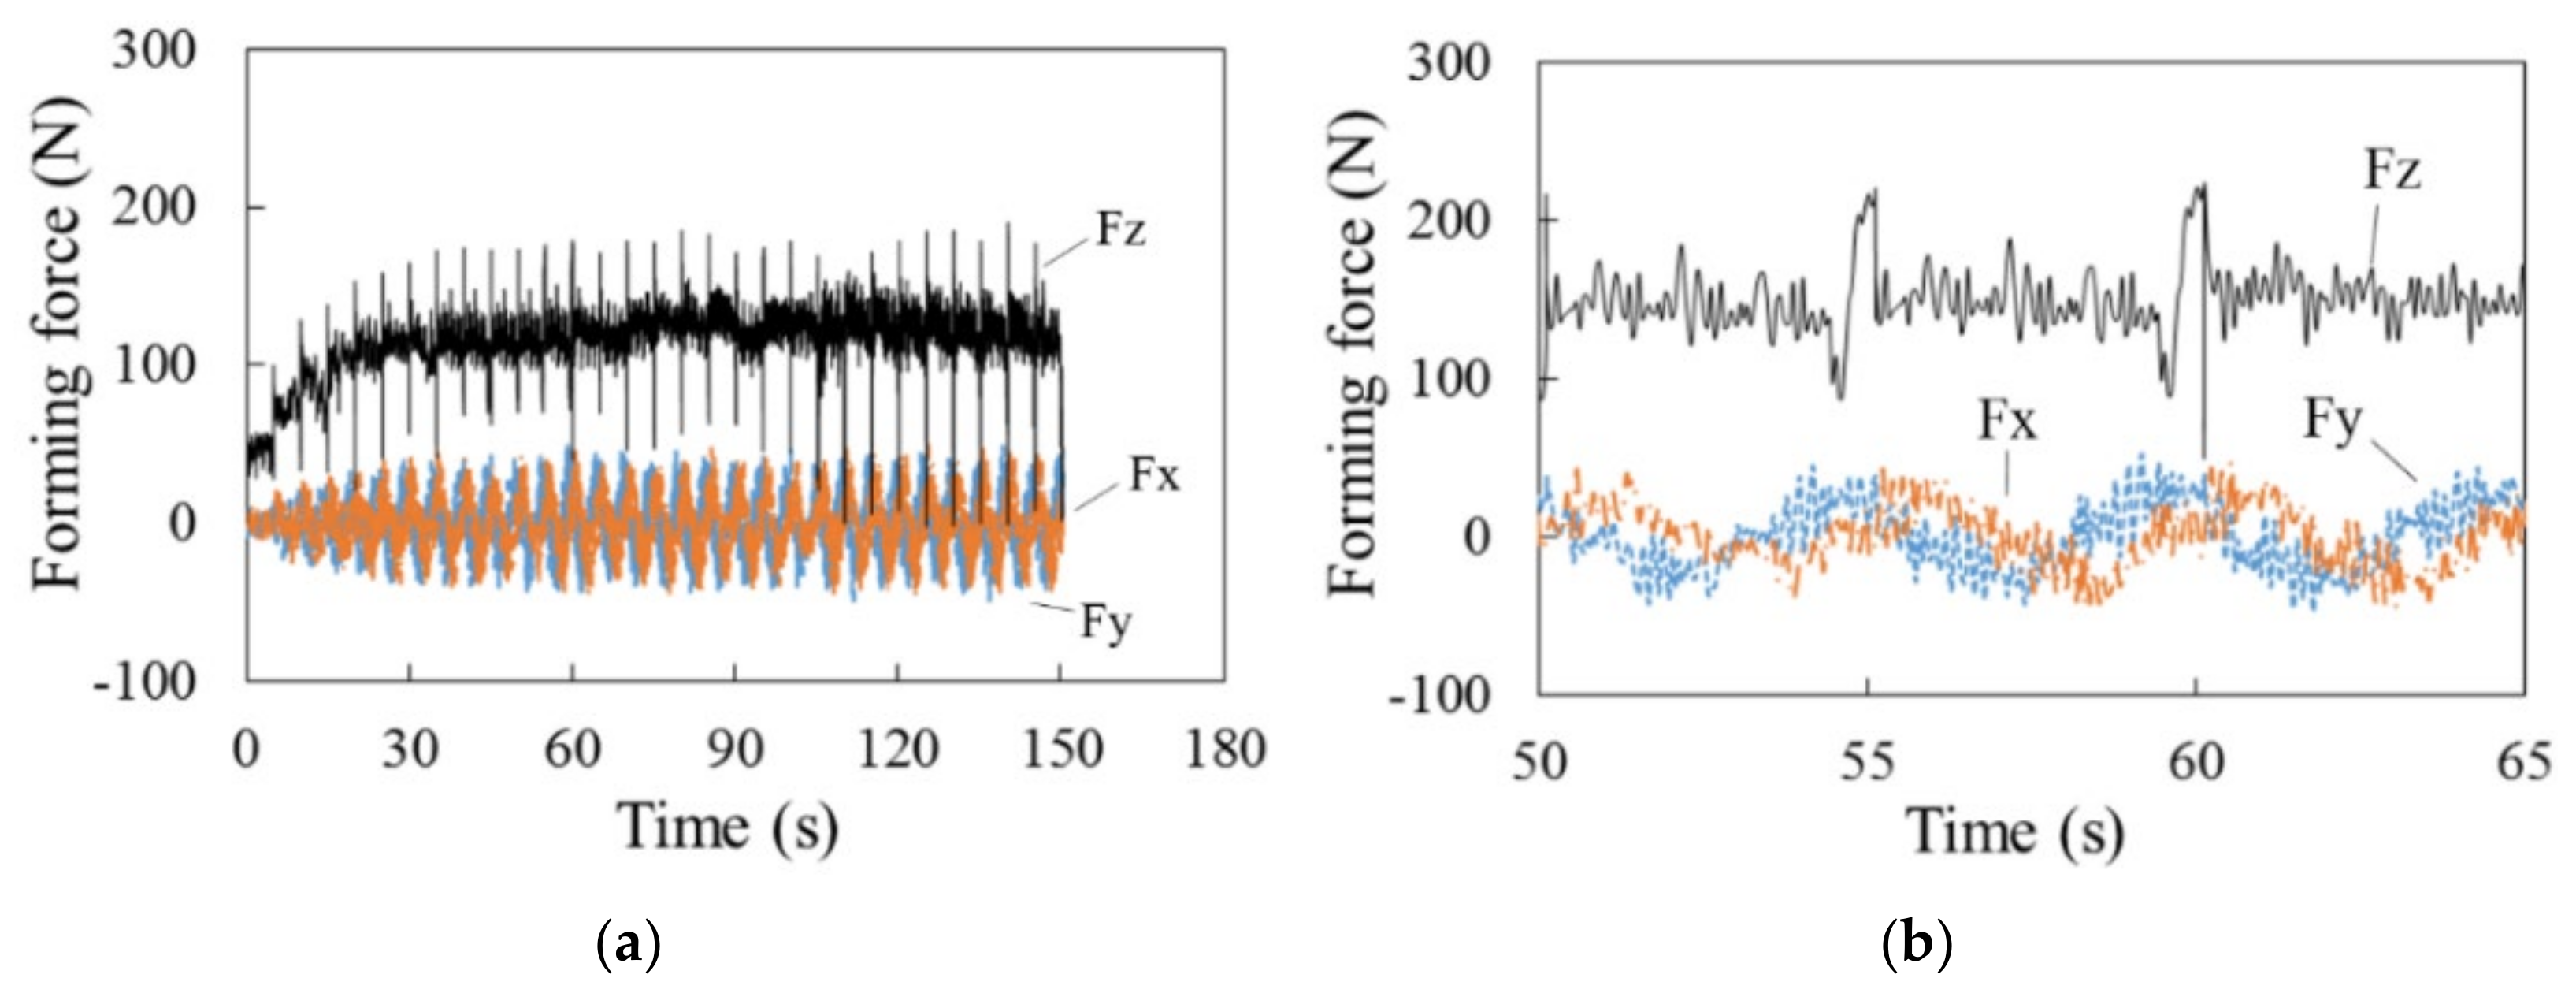
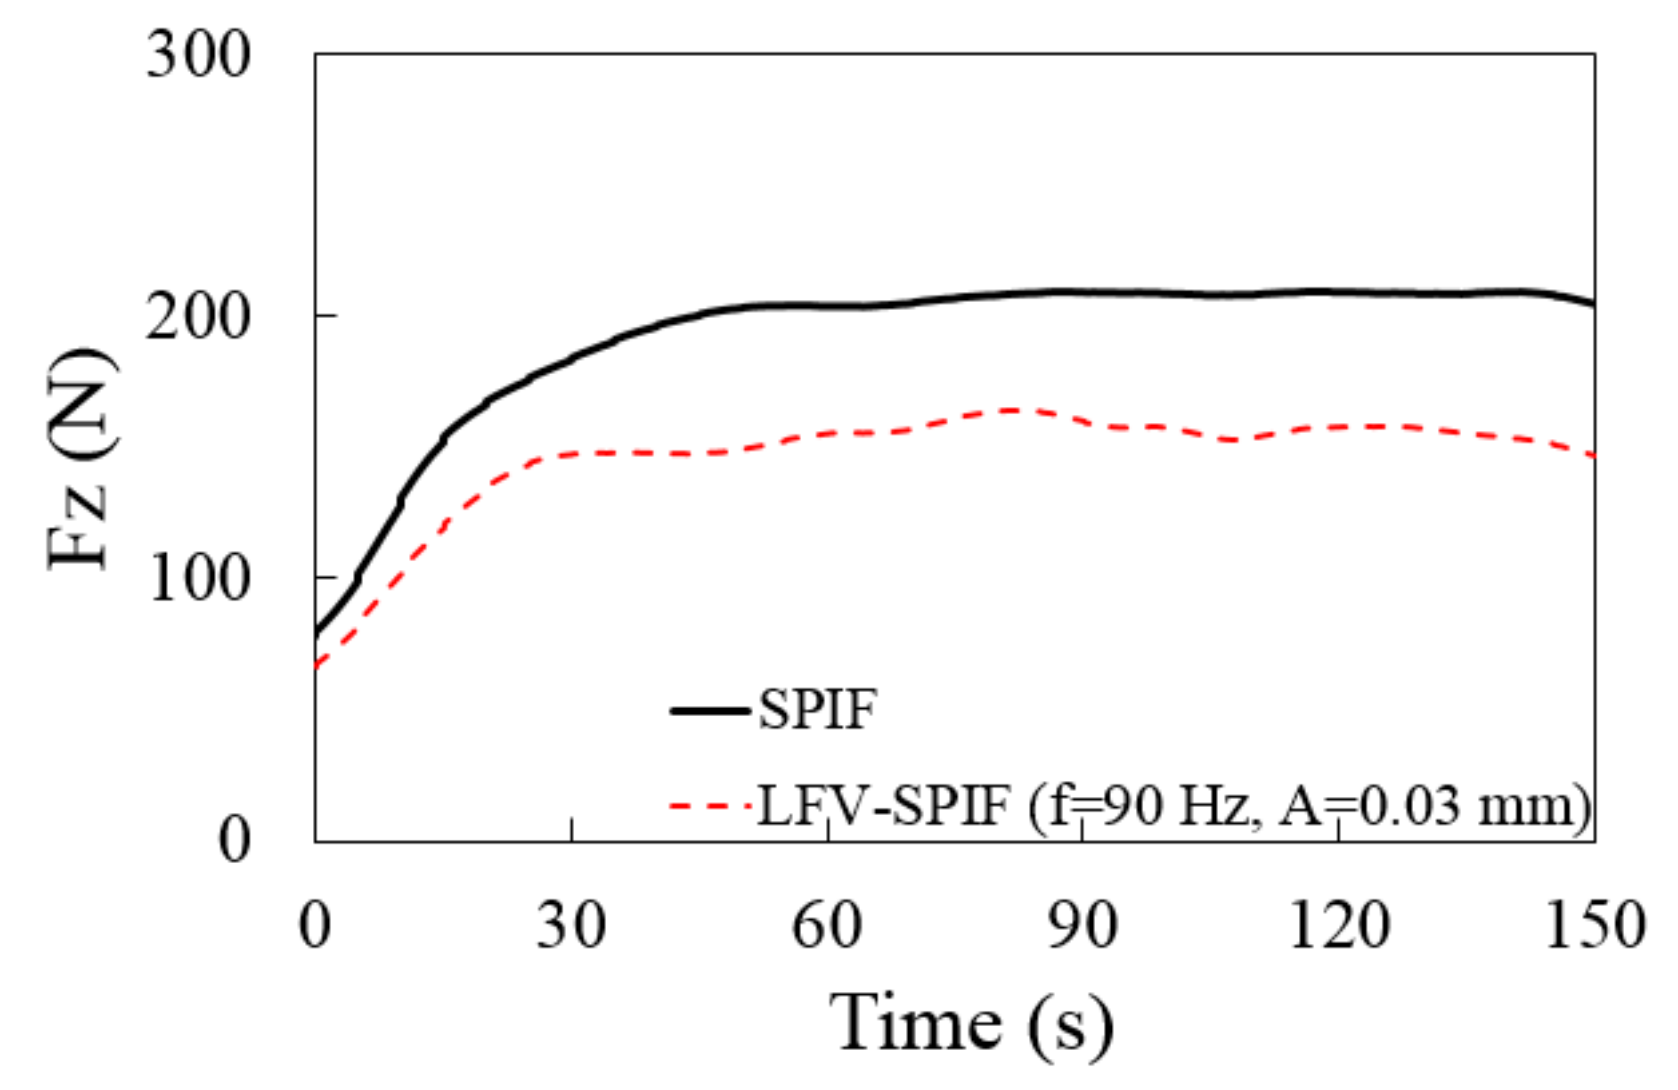
3.2.2. Effect of Low-Frequency Vibrations on the Axial Forming Force Fz

The axial forming force F z is a vital indicator for evaluating the forming conditions. To study the effect of low-frequency vibration on the axial forming force F z , Table 4 lists the forming parameters used in the experiment; the vibration parameter (frequency, amplitude) had four levels and other normal parameters were fixed. In addition, the axial forming force F z under different vibration variables was studied using a truncated cone shape with a diameter of 70 mm and a depth of 15 mm, as shown in Figure 7a. The profile toolpath was used in this study (Figure 7b). As the step depth and feed rate were fixed at 0.5 mm and 400 mm/min, there were, in total, 30 circles that needed to be formed, while for all the cases, the forming time was the same.
The measured axial forming force F z during the SPIF forming force is shown in Figure 8a in which the axial forming force F z showed a gradual and increasing rate of change. As shown in Figure 8b, a step within 18 s means that one circle has been formed, and a large instantaneous peak occurs at the step, indicating that the tool has an interlayer feed movement from the first layer to the second layer. The entire F z increased its limit near the 10th circle, and the forming process entered a stable stage where the influence of the sheet’s forming zone was approximately nonexistent, and its deformation only depended on the sheet’s characteristics (yield strength).
Figure 9 shows the results of the measured axial forming force F z during the LFV-SPIF process, with an amplitude of 0.03 mm and frequency of 90 Hz. As with SPIF, the F z in LFV-SPIF showed a stepwise increase law, with each step representing a layer’s forming process. The changing trend of F z in LFV-SPIF was similar to SPIF, indicating that although low-frequency vibrations change the action mode of the forming force, it does not affect the changing trend of F z as the number of circles increases. At the same time, each sinusoidal change cycle represents the forming process, stabilizing near the 9th–10th circle.
In addition, the mathematical smoothed forming force F z of the two processes were compared—by integrating low-frequency vibrations, a significant axial forming force reduction can be obtained in the SPIF process. As the frequency increased to 90 Hz, the axial forming force of the AA1050 was reduced by 45.6% (Figure 10).
Because the forming force in the forming process was stable around 10 circles, the analysis efficiency was improved by extracting the forming forces of the first 10 circles for comparative analysis (Figure 11). From Figure 11, the changing trends of F z under the three amplitude and three frequency conditions were similar; the average values of force during each circle were used to obtain the changing trend of F z for the different amplitudes. It can clearly be seen that as the amplitude and frequency increased, the vertical force F z decreased continuously.

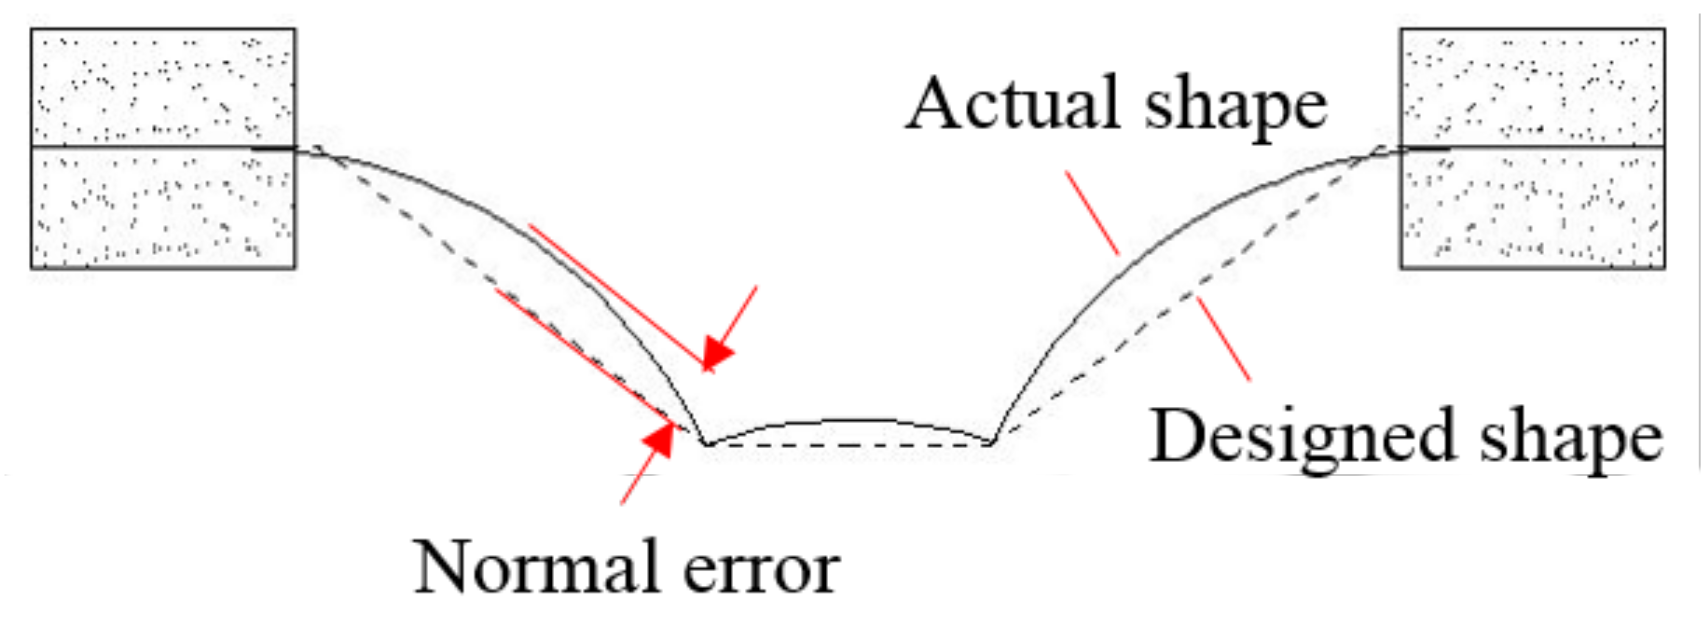
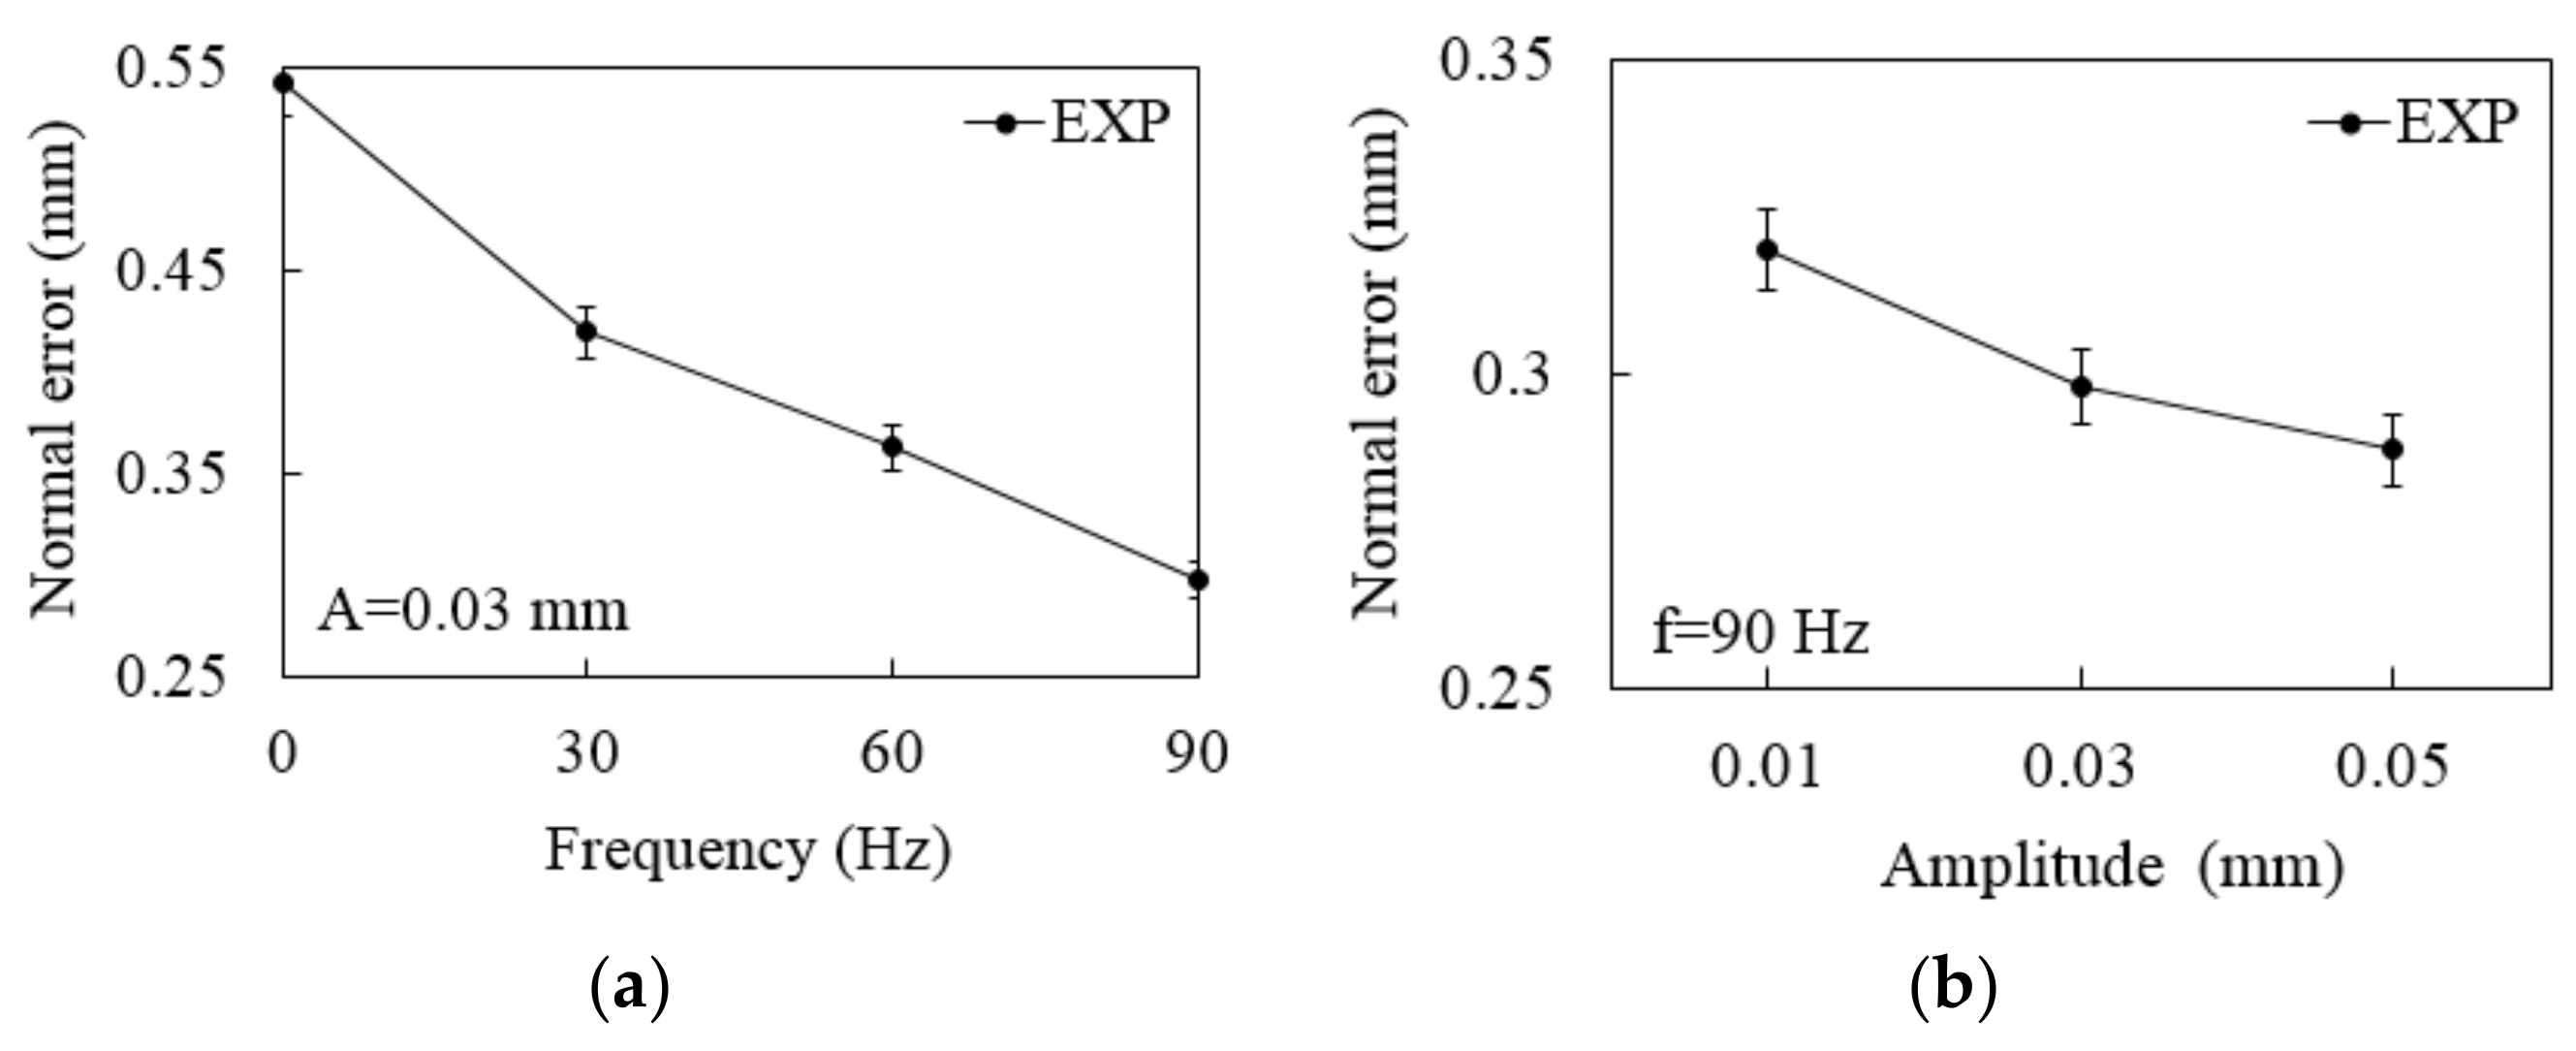
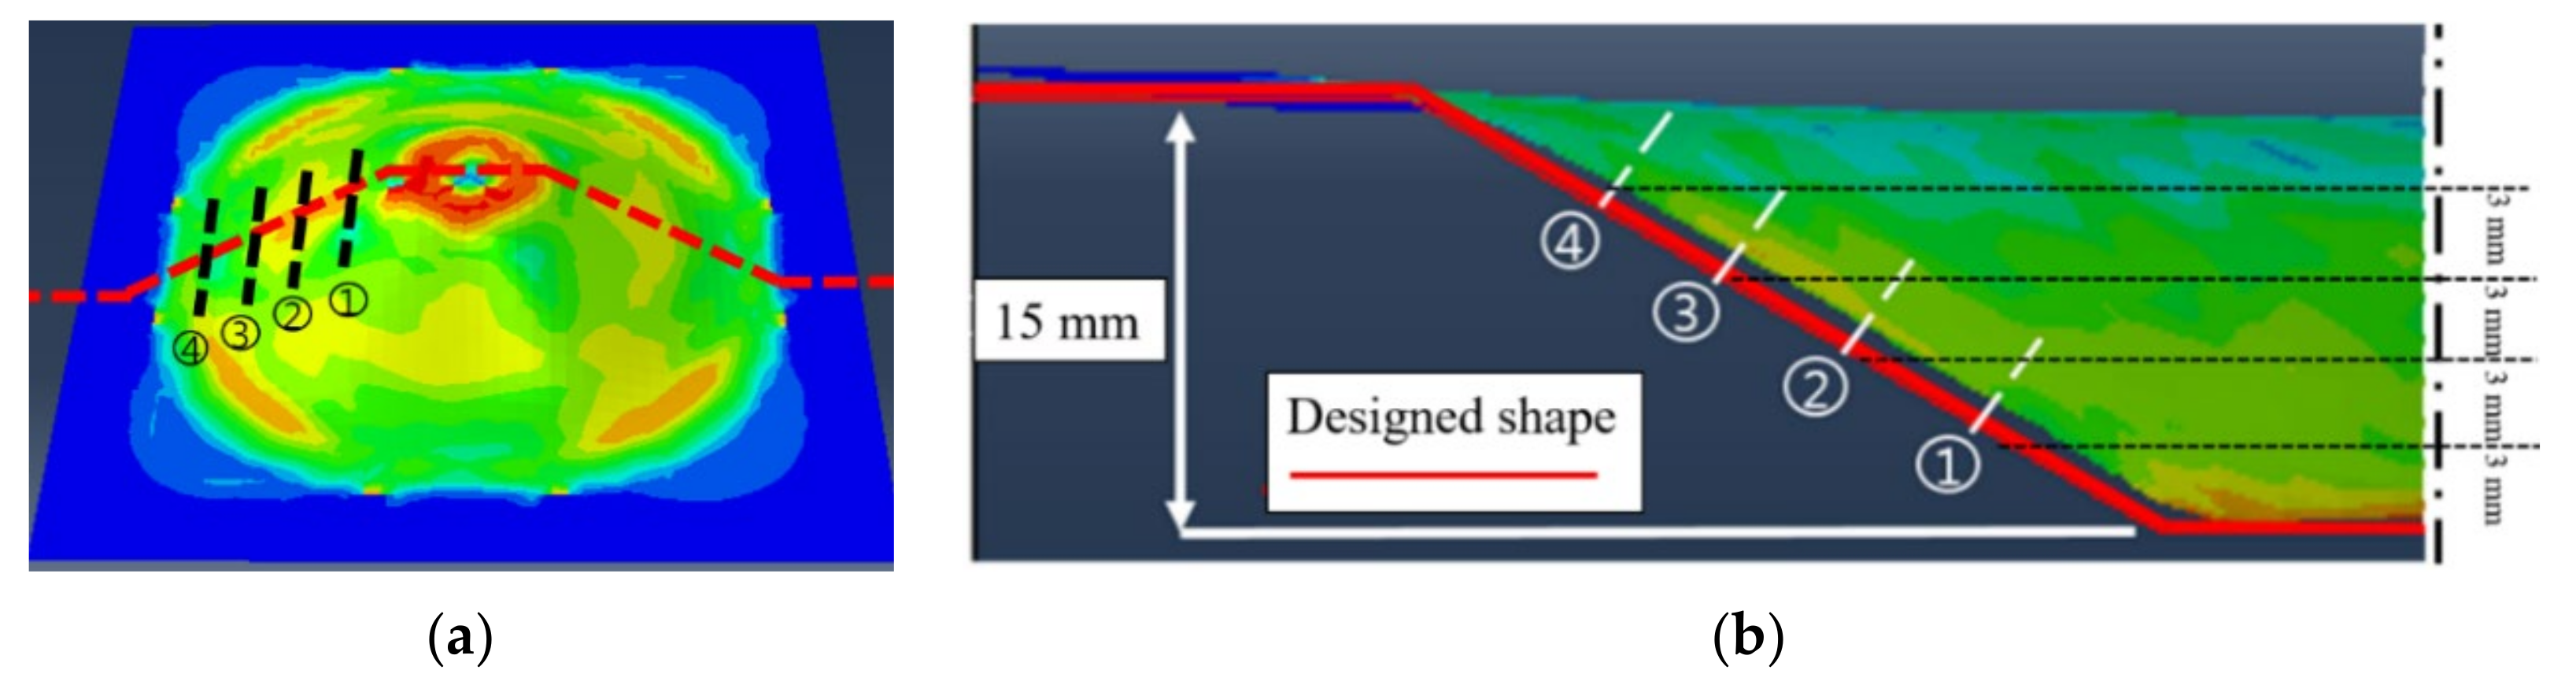
3.2.3. The Influence of Low-Frequency Vibrations on Geometric Accuracy

The sheet’s geometric error primarily comes from the springback caused by the sheet’s uneven residual stress distribution after unloading the fixture and tool. In particular, the sidewall’s inward springback deformation causes the geometric error of the part in the normal direction (Figure 12).
To study the impact of low-frequency vibrations on the accuracy of parts, the Atos Q 12M 3D scanner was selected. The device can determine the overall shape measurement and automatic splicing of the parts, with high scanning accuracy and fast speed. Accurate point cloud data of the parts can be obtained.
Following the same experimental plan for the forming force part, for all cases, four measurement positions were selected on the wall area at intervals of 3 mm from the bottom surface for each formed part, and the gap between each position with the target shape was measured (Figure 13). Finally, the average value of these points was calculated (Table 5 and Table 6).
Figure 14 shows the normal error measurement results under different frequencies and amplitudes. As the frequency and amplitude increased, the springback decreased. When A=0.05 mm and f=90 Hz, the part’s normal precision was the highest, which was 47% higher than the conventional SPIF process.

4. Research on Numerical Simulation of LFV-SPIF Process

Compared with the general SPIF process, when LFV is applied to the forming tool, the continuous rolling contact between the tool and the sheet becomes low frequency alternating contact, changing the forming force’s size and action mode. Simultaneously, as the sheet material absorbs low-frequency vibration energy, the material’s deformation performance changes. In this study, to study the forming mechanism of SPIF process under low-frequency vibration, based on the cone shape shown in Figure 7, ABAQUS/Explicit was used to numerically simulate the entire LFV-SPIF process and to analyze the changes in stress, strain, and forming force during the forming process. Then, ABAQUS/Standard was used to simulate the unloading process, and the effect of low-frequency vibrations on the sheet’s springback and residual stress was analyzed.

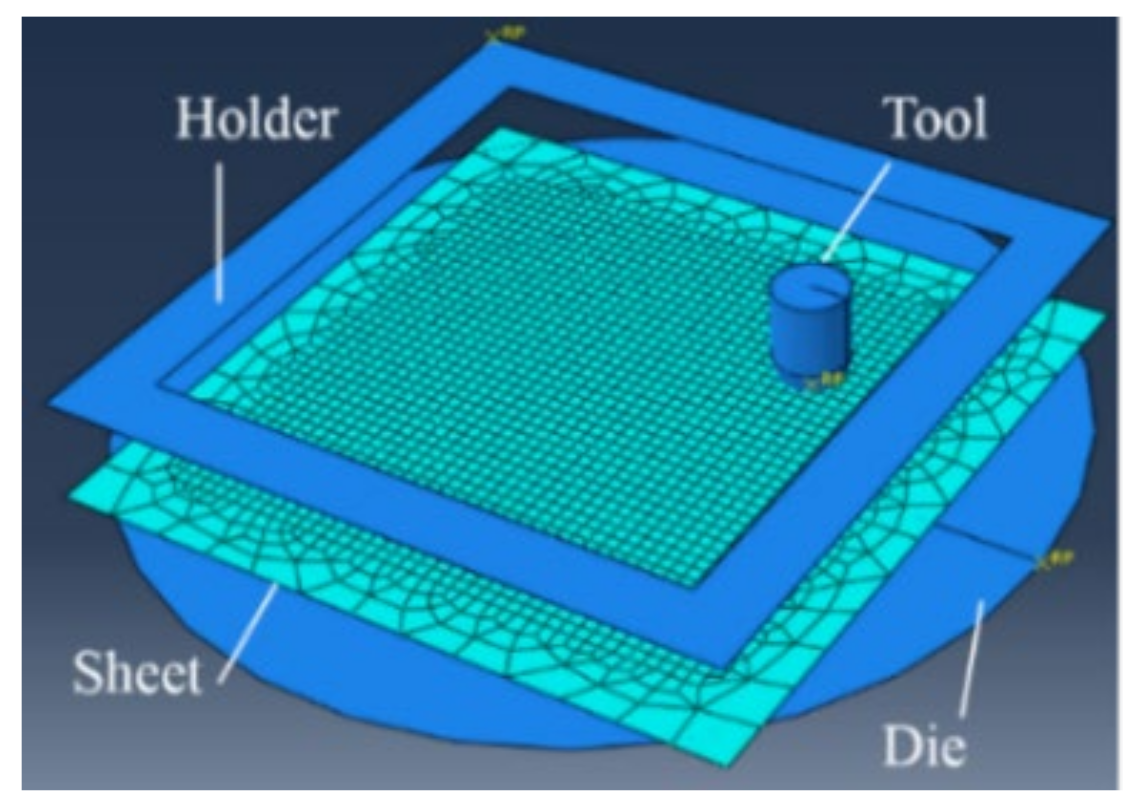
4.1. Finite Element Modeling
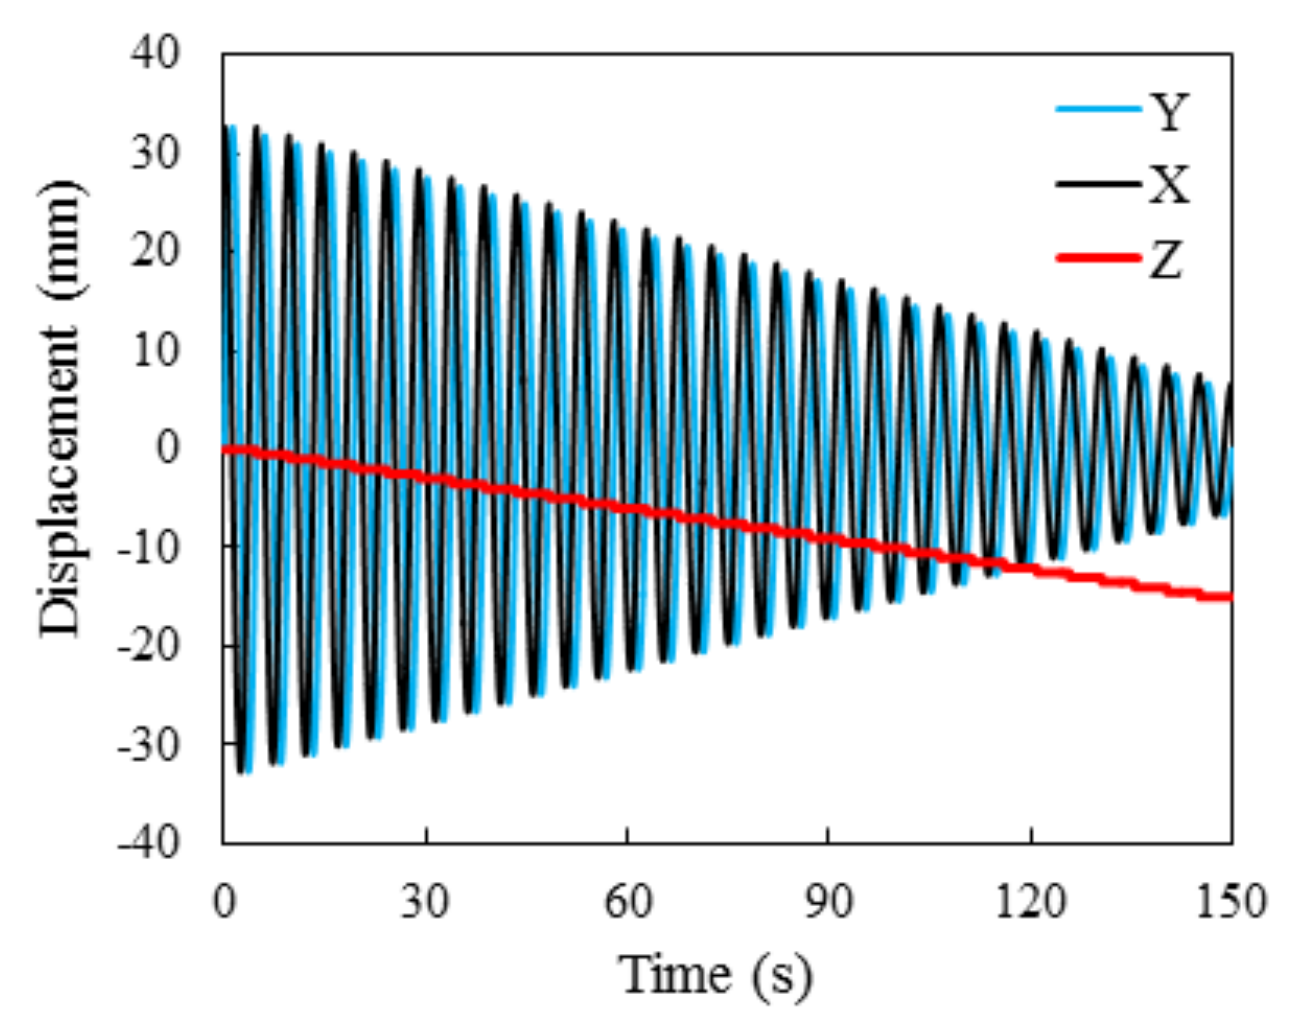
As shown in Figure 15, the LFV-SPIF model was established, comprising sheet metal, forming tool, holder, and die. The sheet material is a regular quadrilateral, with a length and width of 100 mm, and an initial thickness t 0 of 0.5 mm. The clamp is simplified into an upper holder and lower die. The holder has an inner length and width of 80 mm and an outer length and width of 100 mm. The forming tool is a cylindrical, hemispherical tool for which the ball head’s size is 10 mm. Because the deformation of the fixture and tool is negligible during the forming process, the tool, holder, and die are set as rigid analytical bodies without material property definition to improve the calculation efficiency. A shell element with a four-node reduced integral (S4R) divides the sheet model’s mesh, and the mesh size is set to 2 mm × 2 mm [35]. In addition, the Mises yield criterion is used in the finite element method (FEM) simulation. Table 7 shows other simulation conditions, such as mesh generation, material model selection, and contract conditions.

4.2. Forming Path

During the LFV-SPIF process, the tool performs periodic reciprocating actions along the axis while moving the toolpath (Figure 16). From Figure 16, the low-frequency vibrations during the tool’s machining are uncomplicated harmonic vibrations with frequency f and amplitude A. The tool starts from point O and sinusoidally moves axially. t d is the forming time, and D is the vibration displacement. During one cycle, the tool and the sheet material start to contact and squeeze downward at point O during processing. When the maximum amplitude is reached, the tool moves upwards. The tool and the sheet material are still in contact until point M begins to separate. The tool continues to move upwards to the maximum amplitude, starts moving downward to point N, and recontacts the sheet metal to complete a cycle. At the MN segment, the tool is separated from the sheet material, accounting for half of the entire cycle. Therefore, in theory, the tool is in contact with the sheet during only half of each vibration cycle.
The loaded forming path excludes the tool’s vibration, and the period amplitude must be defined to introduce low-frequency vibration. Because the research object of this article is a truncated cone, the tool’s trajectory formed layer-by-layer is circular (Figure 7). The amplitude of the movement in the X and Y directions of each layer is set as a periodic amplitude, expressed by a Fourier series, as in Equation (2).
a = A 0 + h = 1 H [ A h c o n h ω ( T 1 T 0 ) + B h s i n h ω T 1 T 0
where H is the number of terms in the Fourier series, ω is the circular frequency (rad/s), A 0 is the initial amplitude, T 0 is the initial time, T 1 is the independent variable time, and A h and B h are the cos and sine coefficient, respectively. The tool’s displacement in the X and Y directions can be realized using the Fourier series, as in Equations (3) and (4).
X = R d c o s 2 π T 1
Y = R d s i n 2 π T 1
In the formula, R d is each circle’s radius, and T 1 is each circle’s movement time. Combining the trajectories in the X and Y directions, the tool’s trajectory in each layer can be obtained. The low-frequency vibration tool makes a short-displacement low-frequency alternating motion relative to the sheet; therefore, the tool’s Z-direction movement can be expressed using Equation (5).
Z = A s i n 2 π f t d
Here, A and f in the equation represent the amplitude and frequency of low-frequency vibration parameters, respectively. When f = 90 Hz and A = 0.03 mm, the circular frequency’s value is 565 ( = 2 π f ). To make a truncated cone with a diameter of 70 mm and a depth of 15 mm, the movement time is 150 s, and the relationship between displacement and time in all directions is extracted (Figure 17). Following the profile toolpath, the motion trajectories in the X and Y directions are circular, and the motion in the Z-direction is maintained constantly downward, macroscopically.

4.3. The Effect of Low-Frequency Vibrations on the Forming Process

Following the forming parameters shown in Table 4, this study investigated the effect of low-frequency vibrations on equivalent stress, equivalent strain, thickness distribution, forming force, residual stress, and springback using ABAQUS/Explicit.

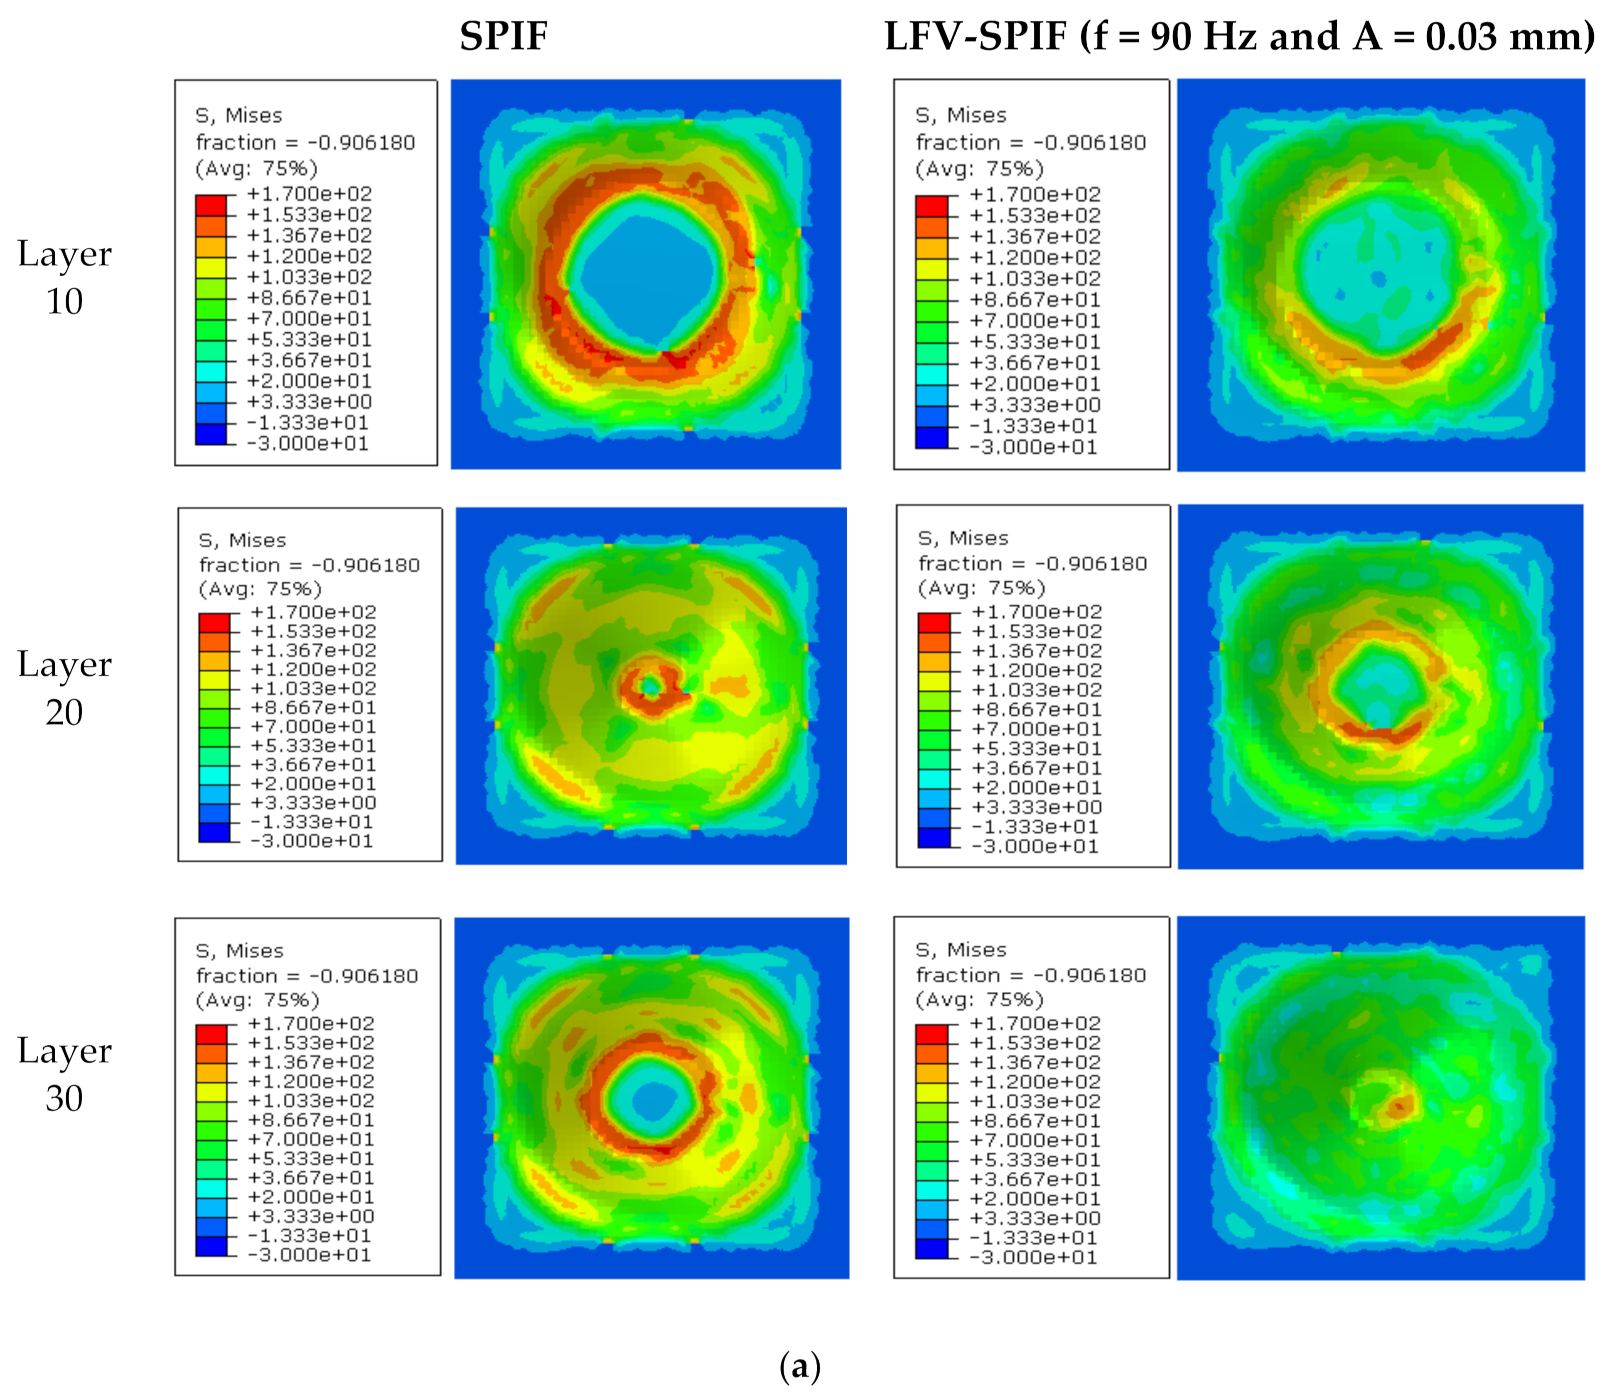
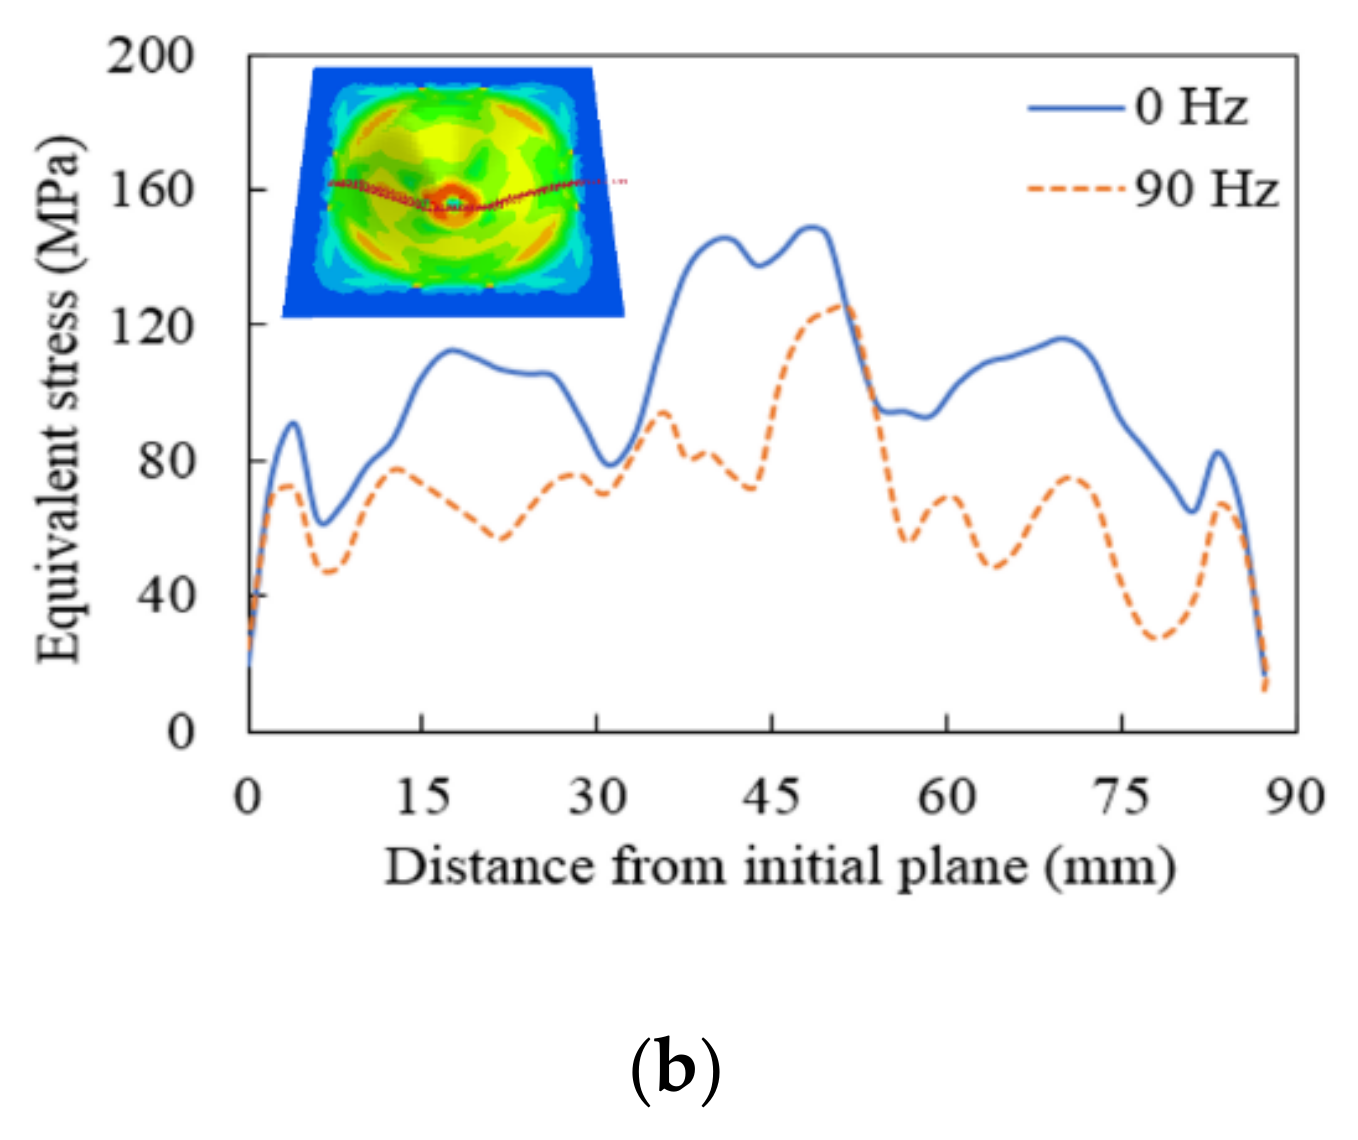
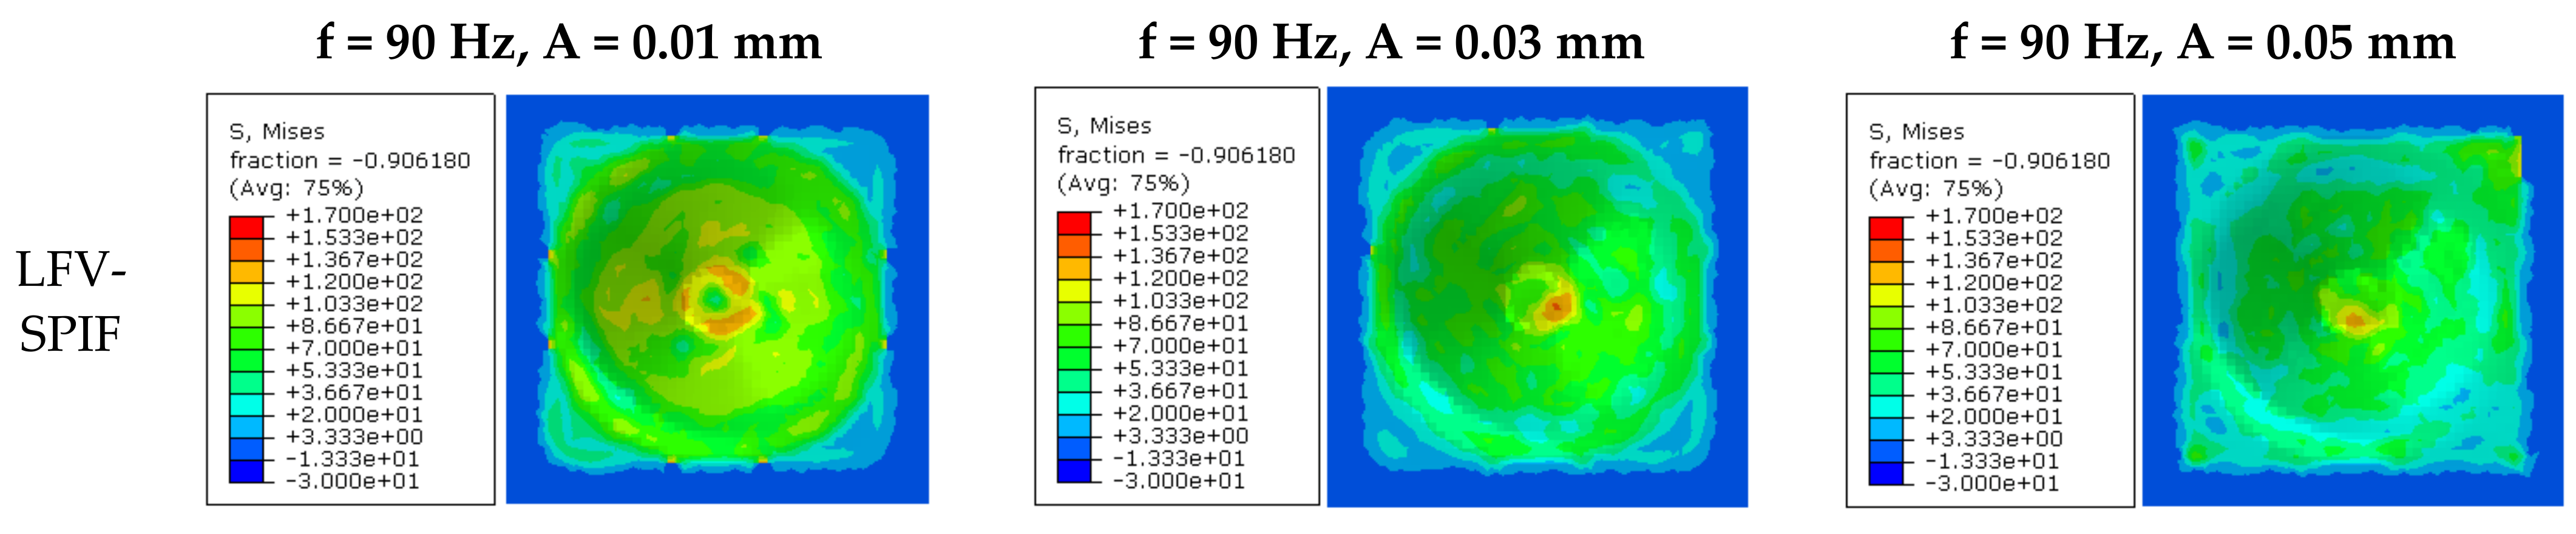
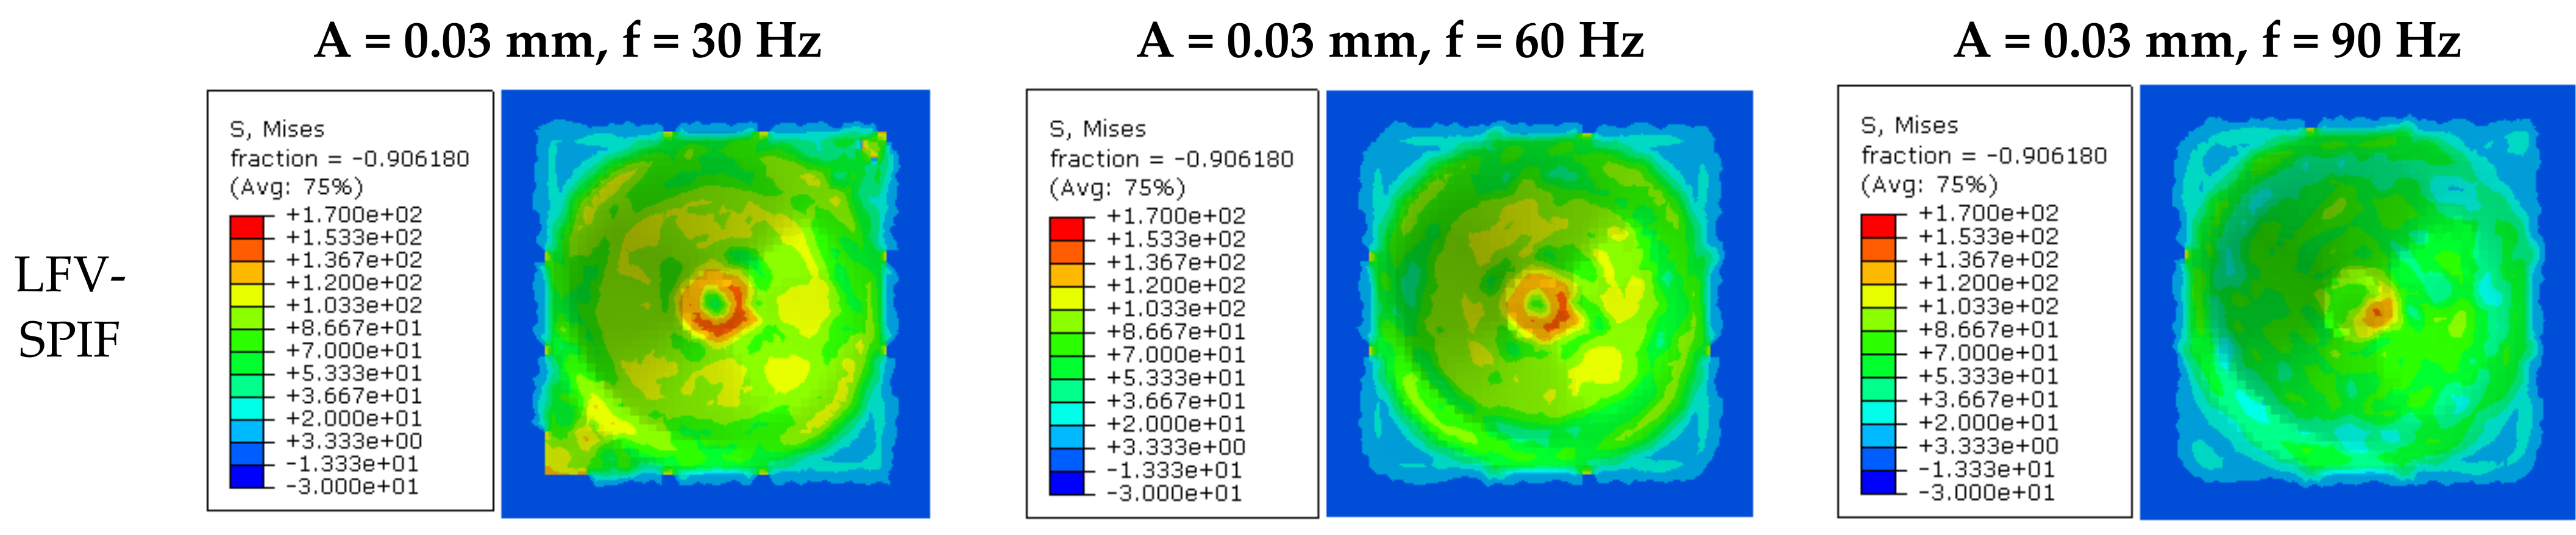
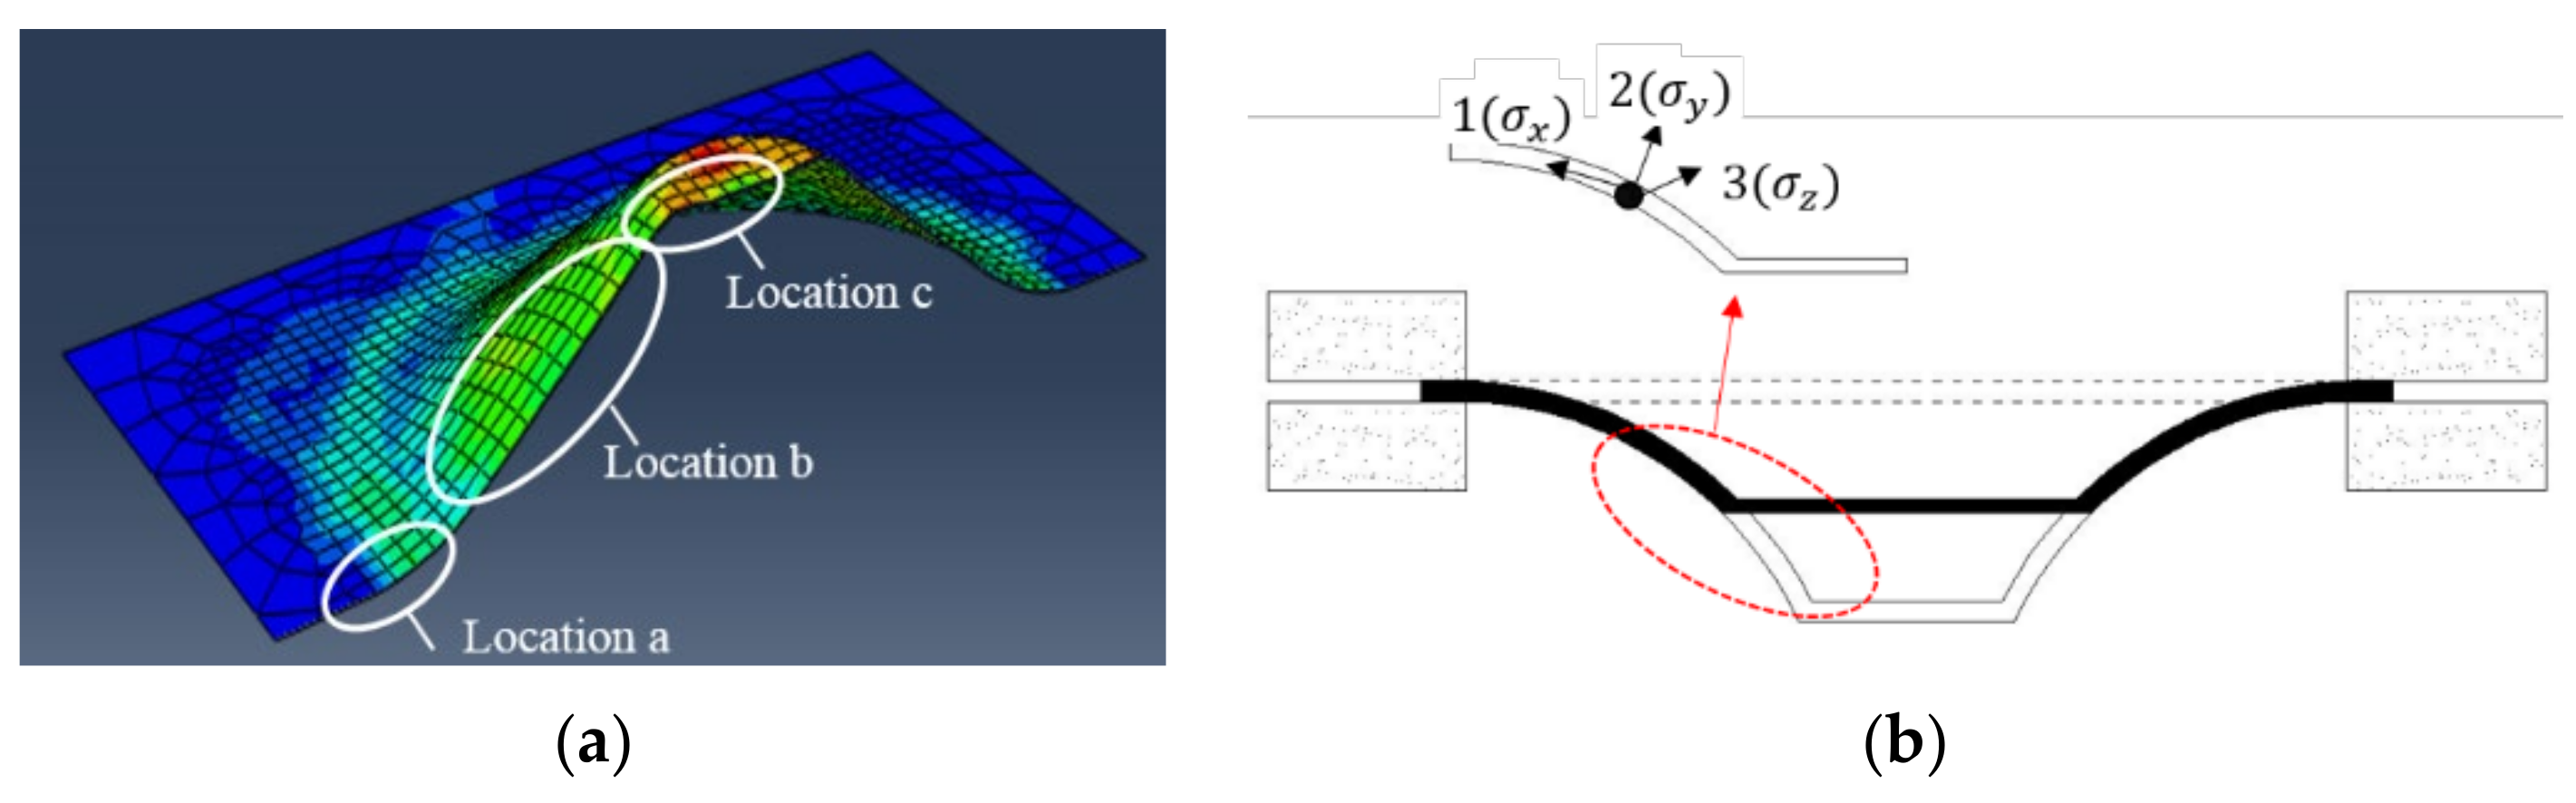
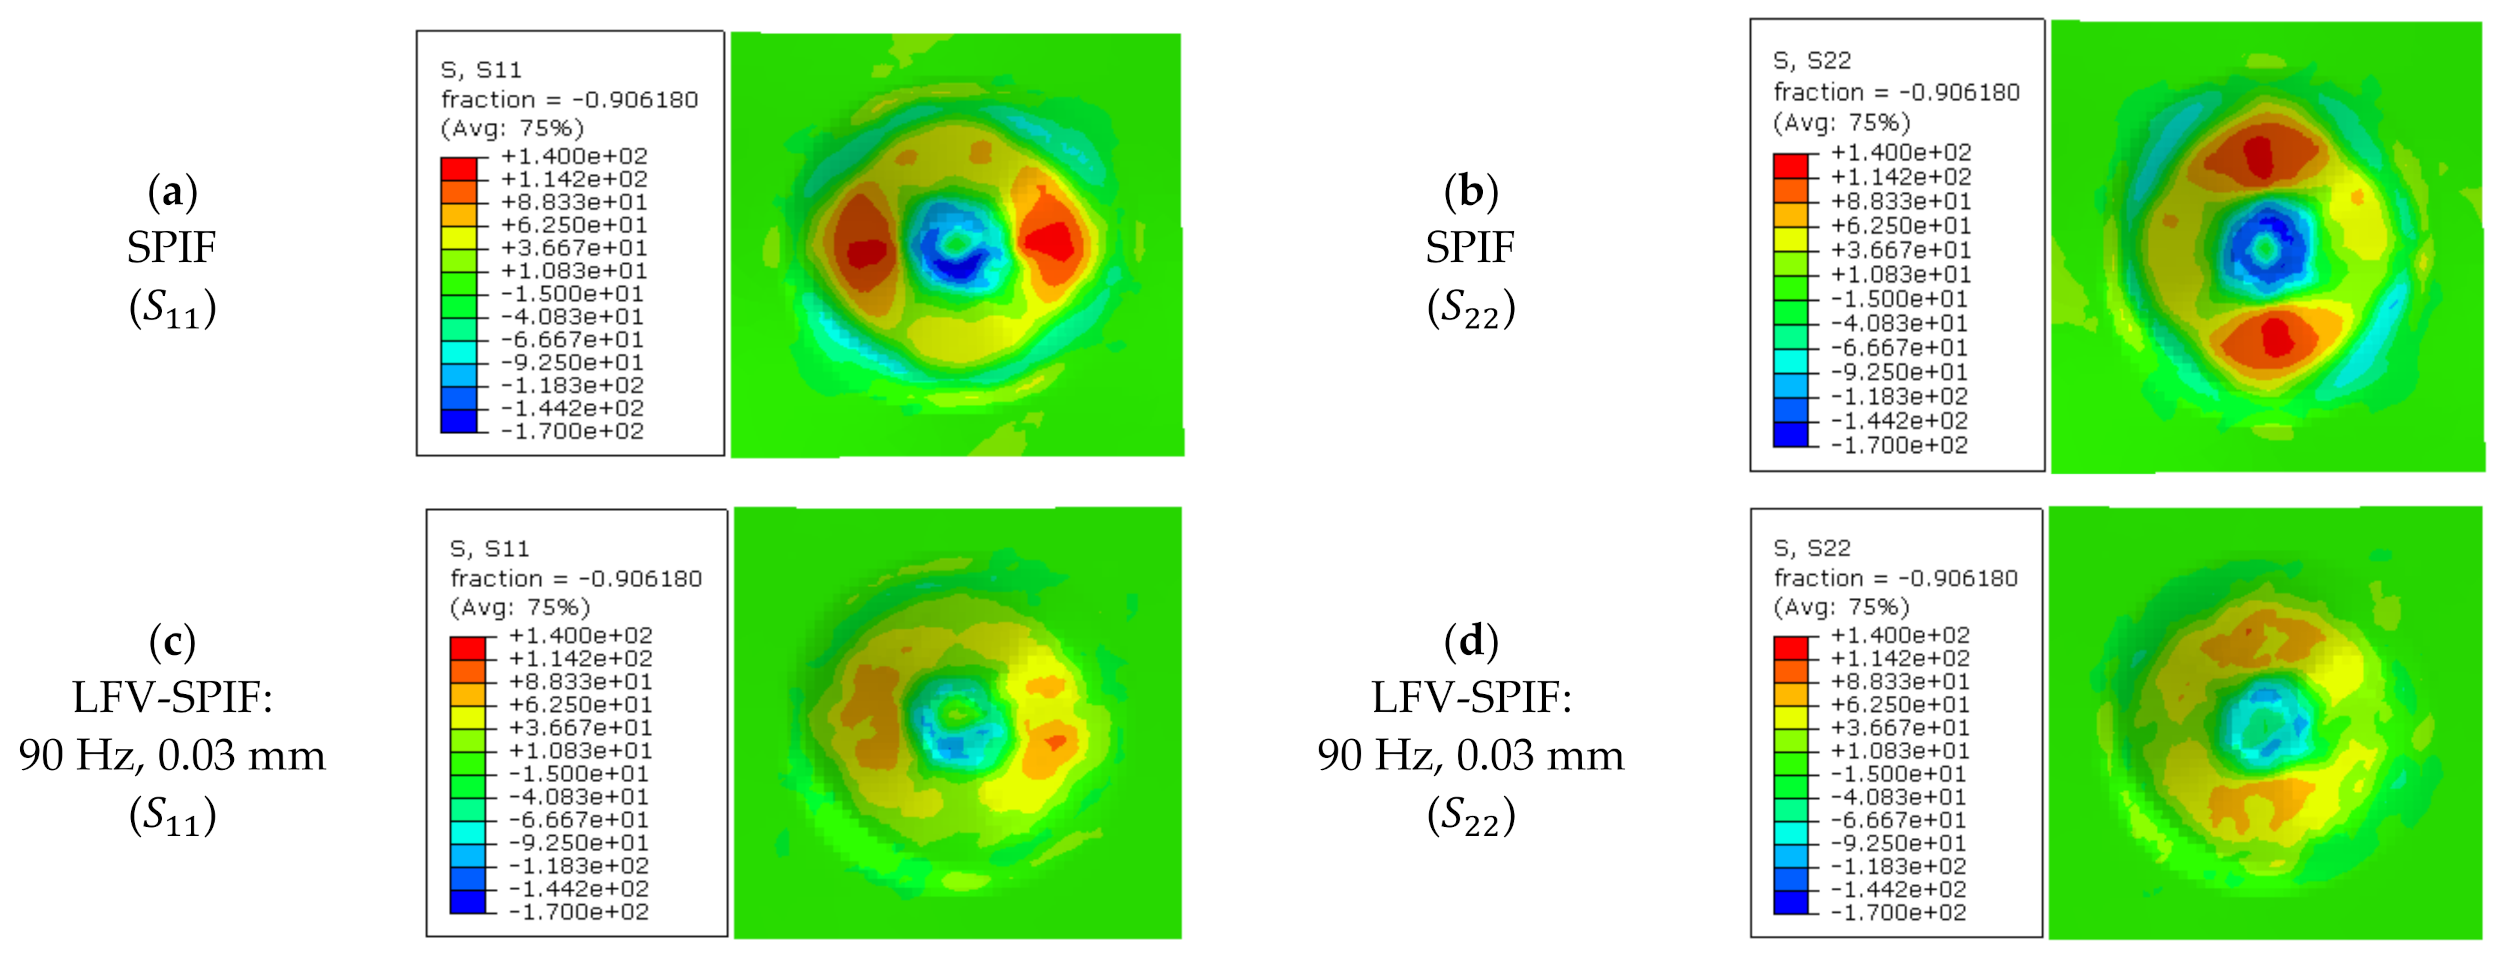
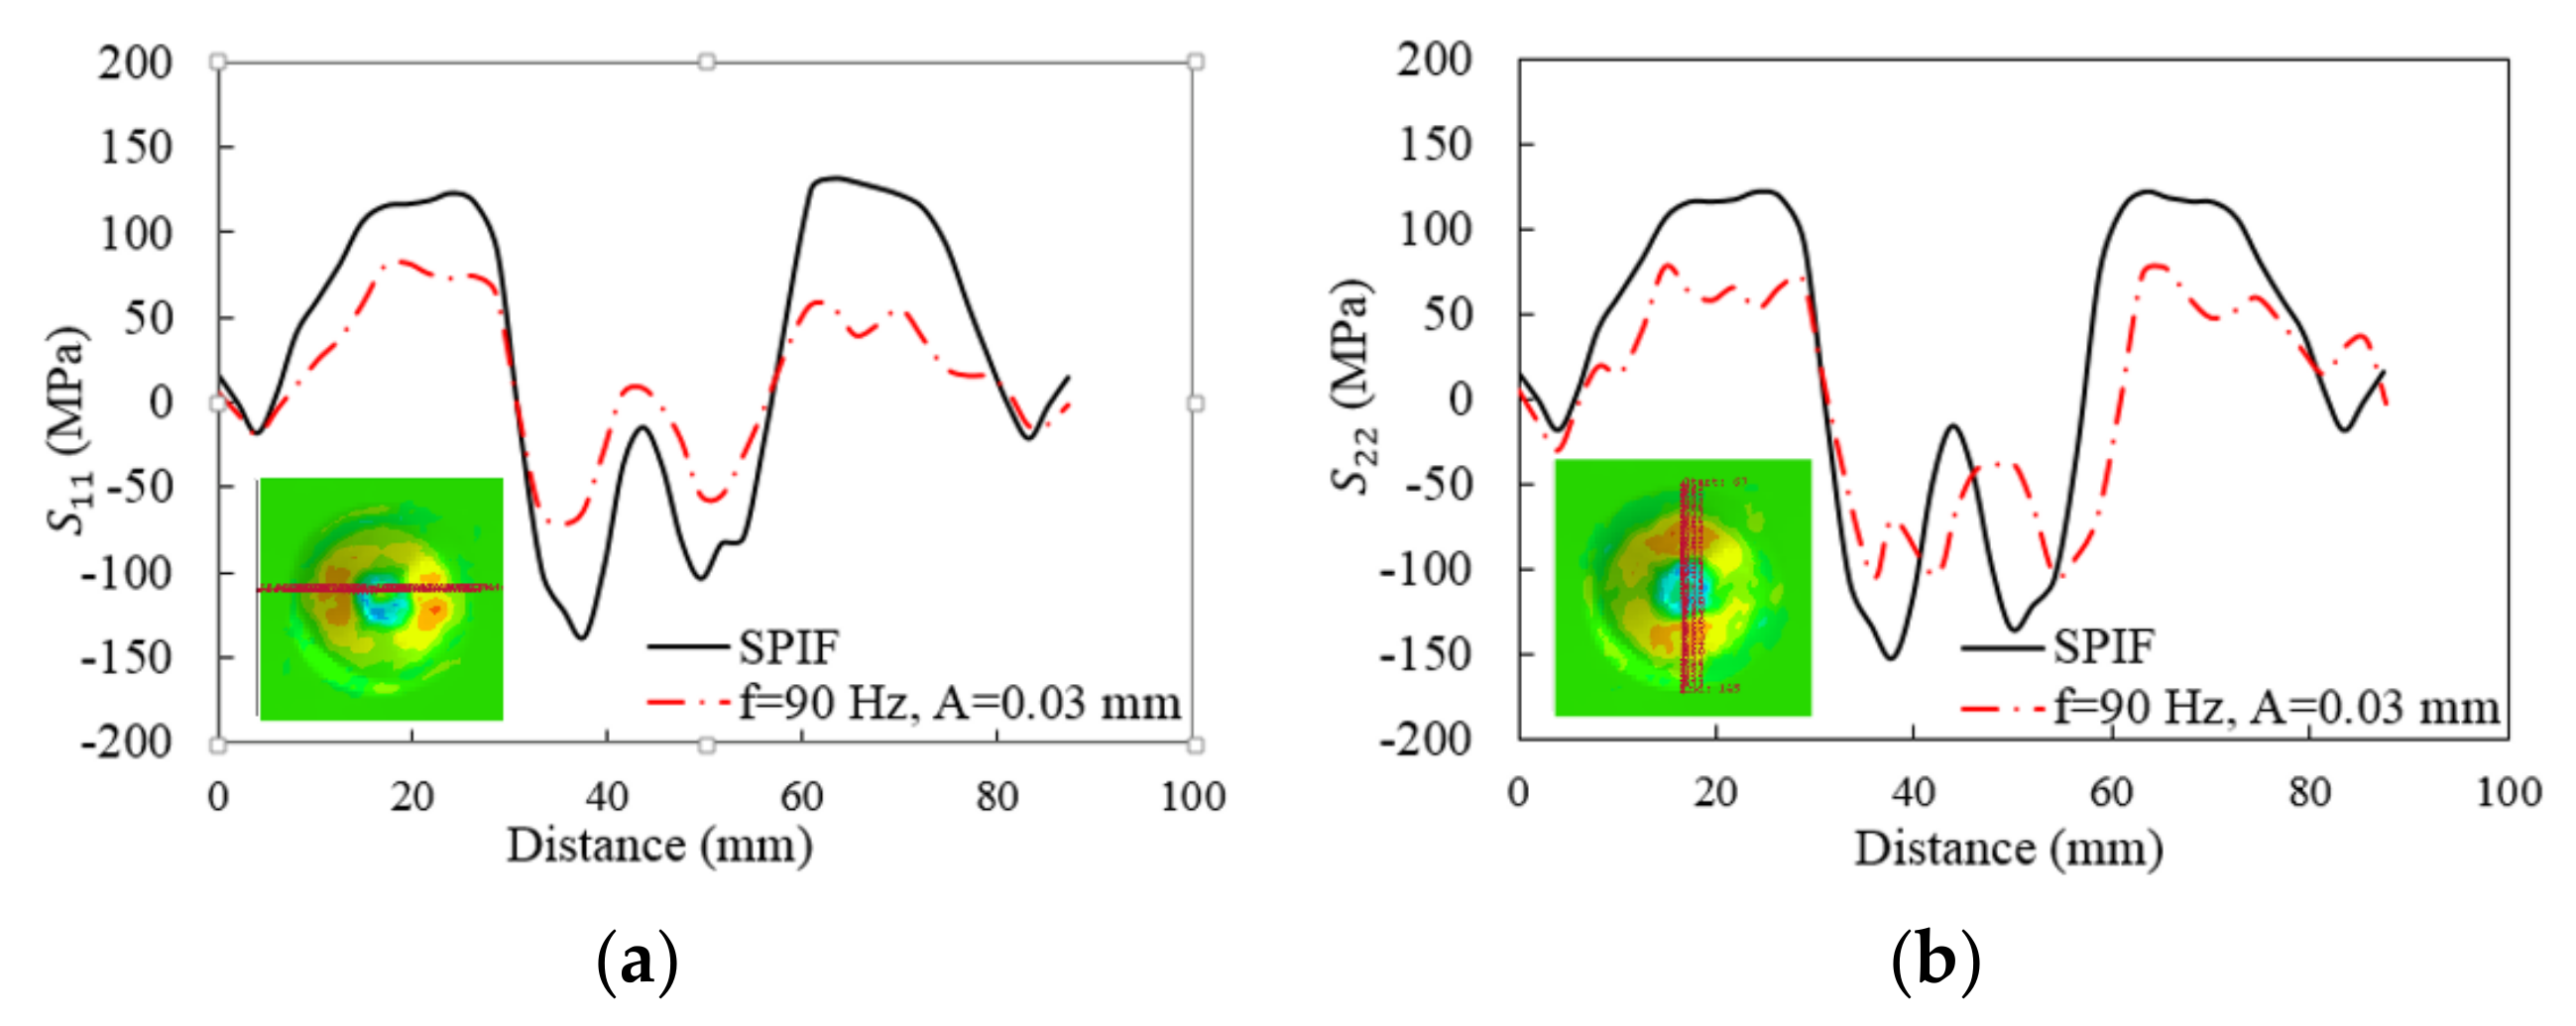
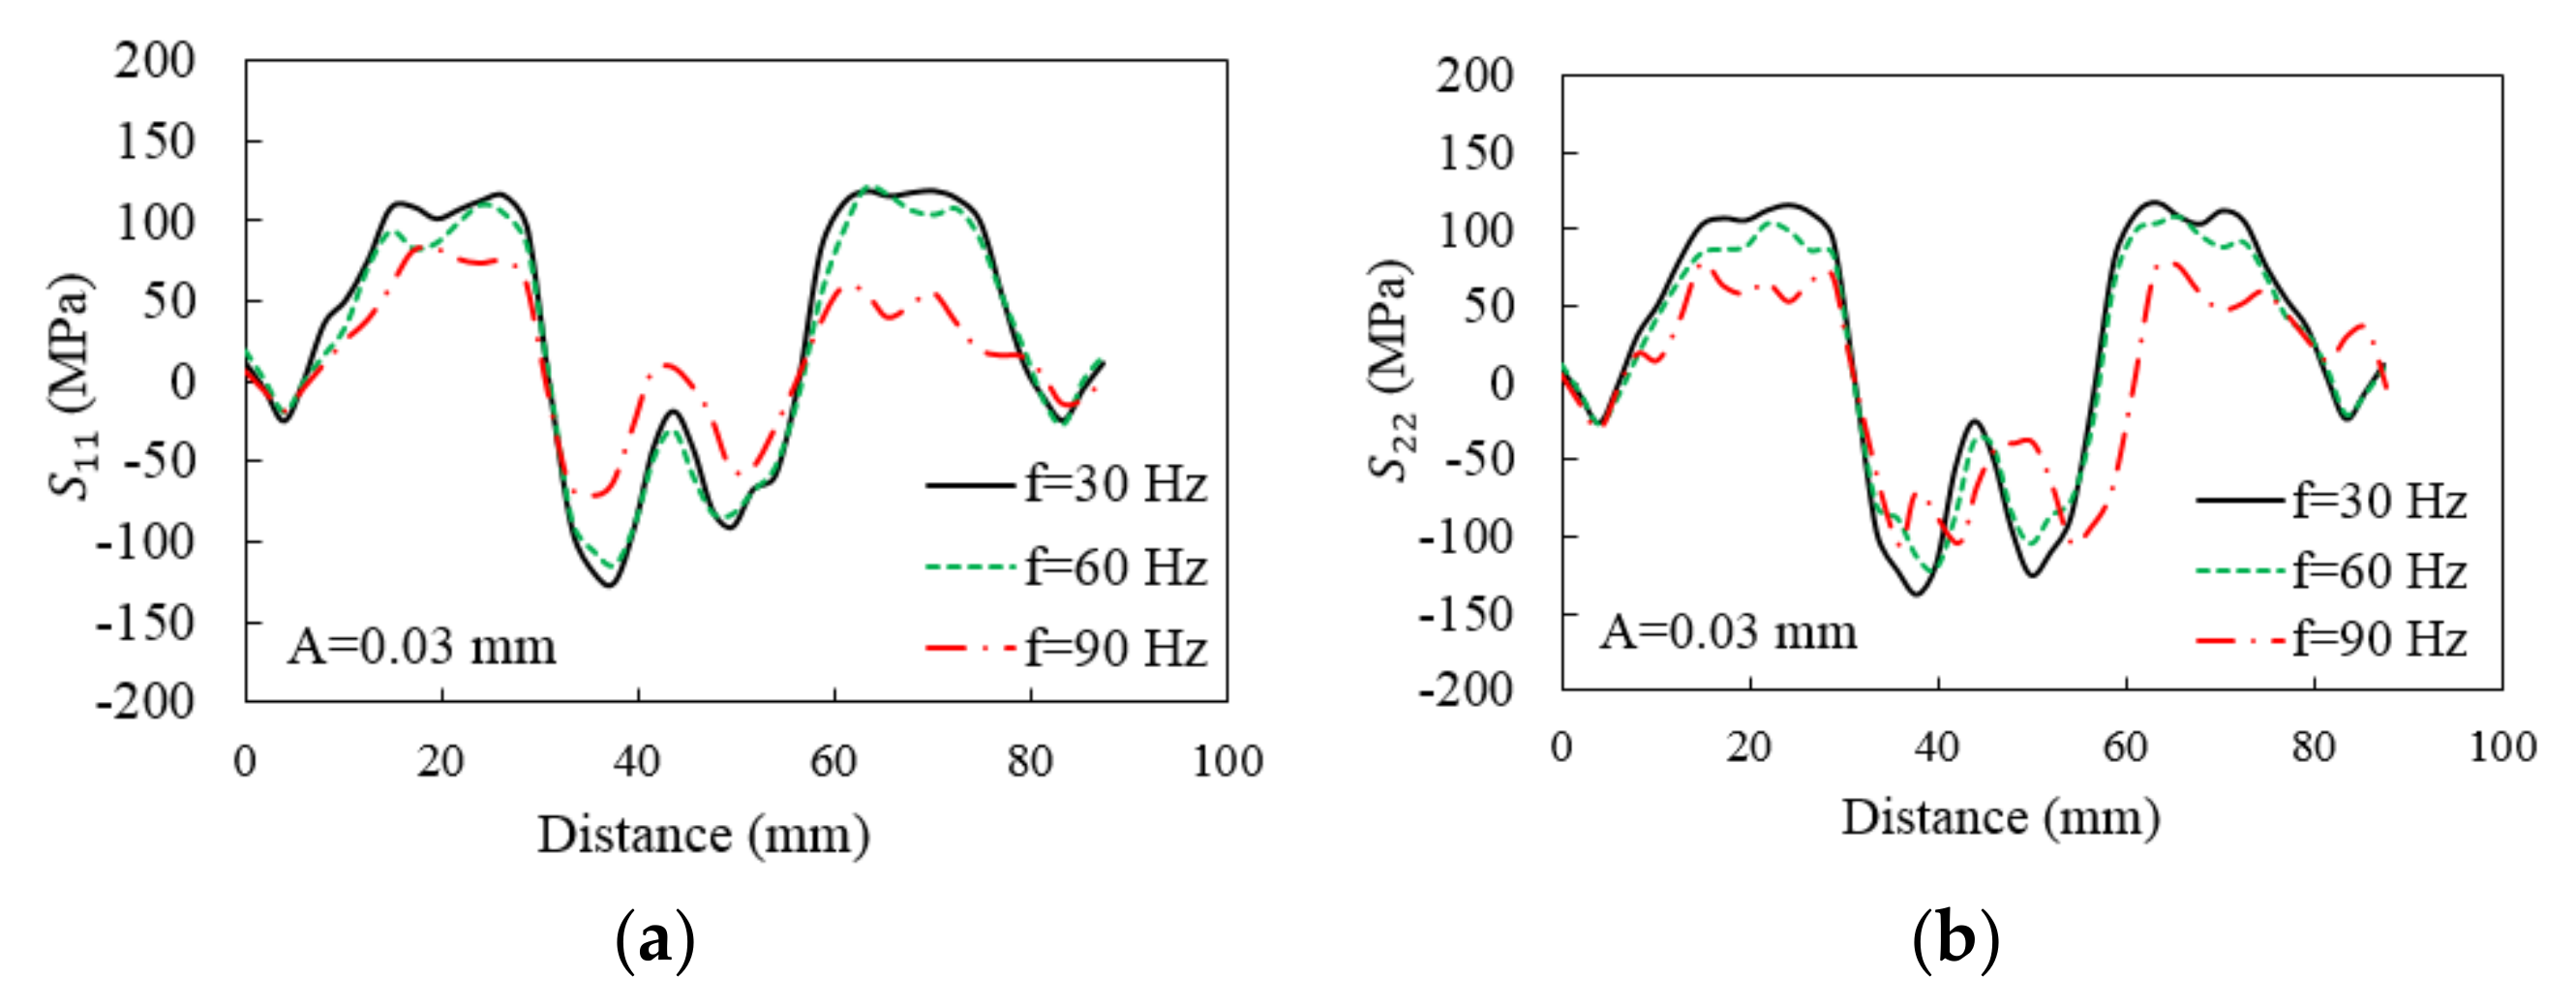
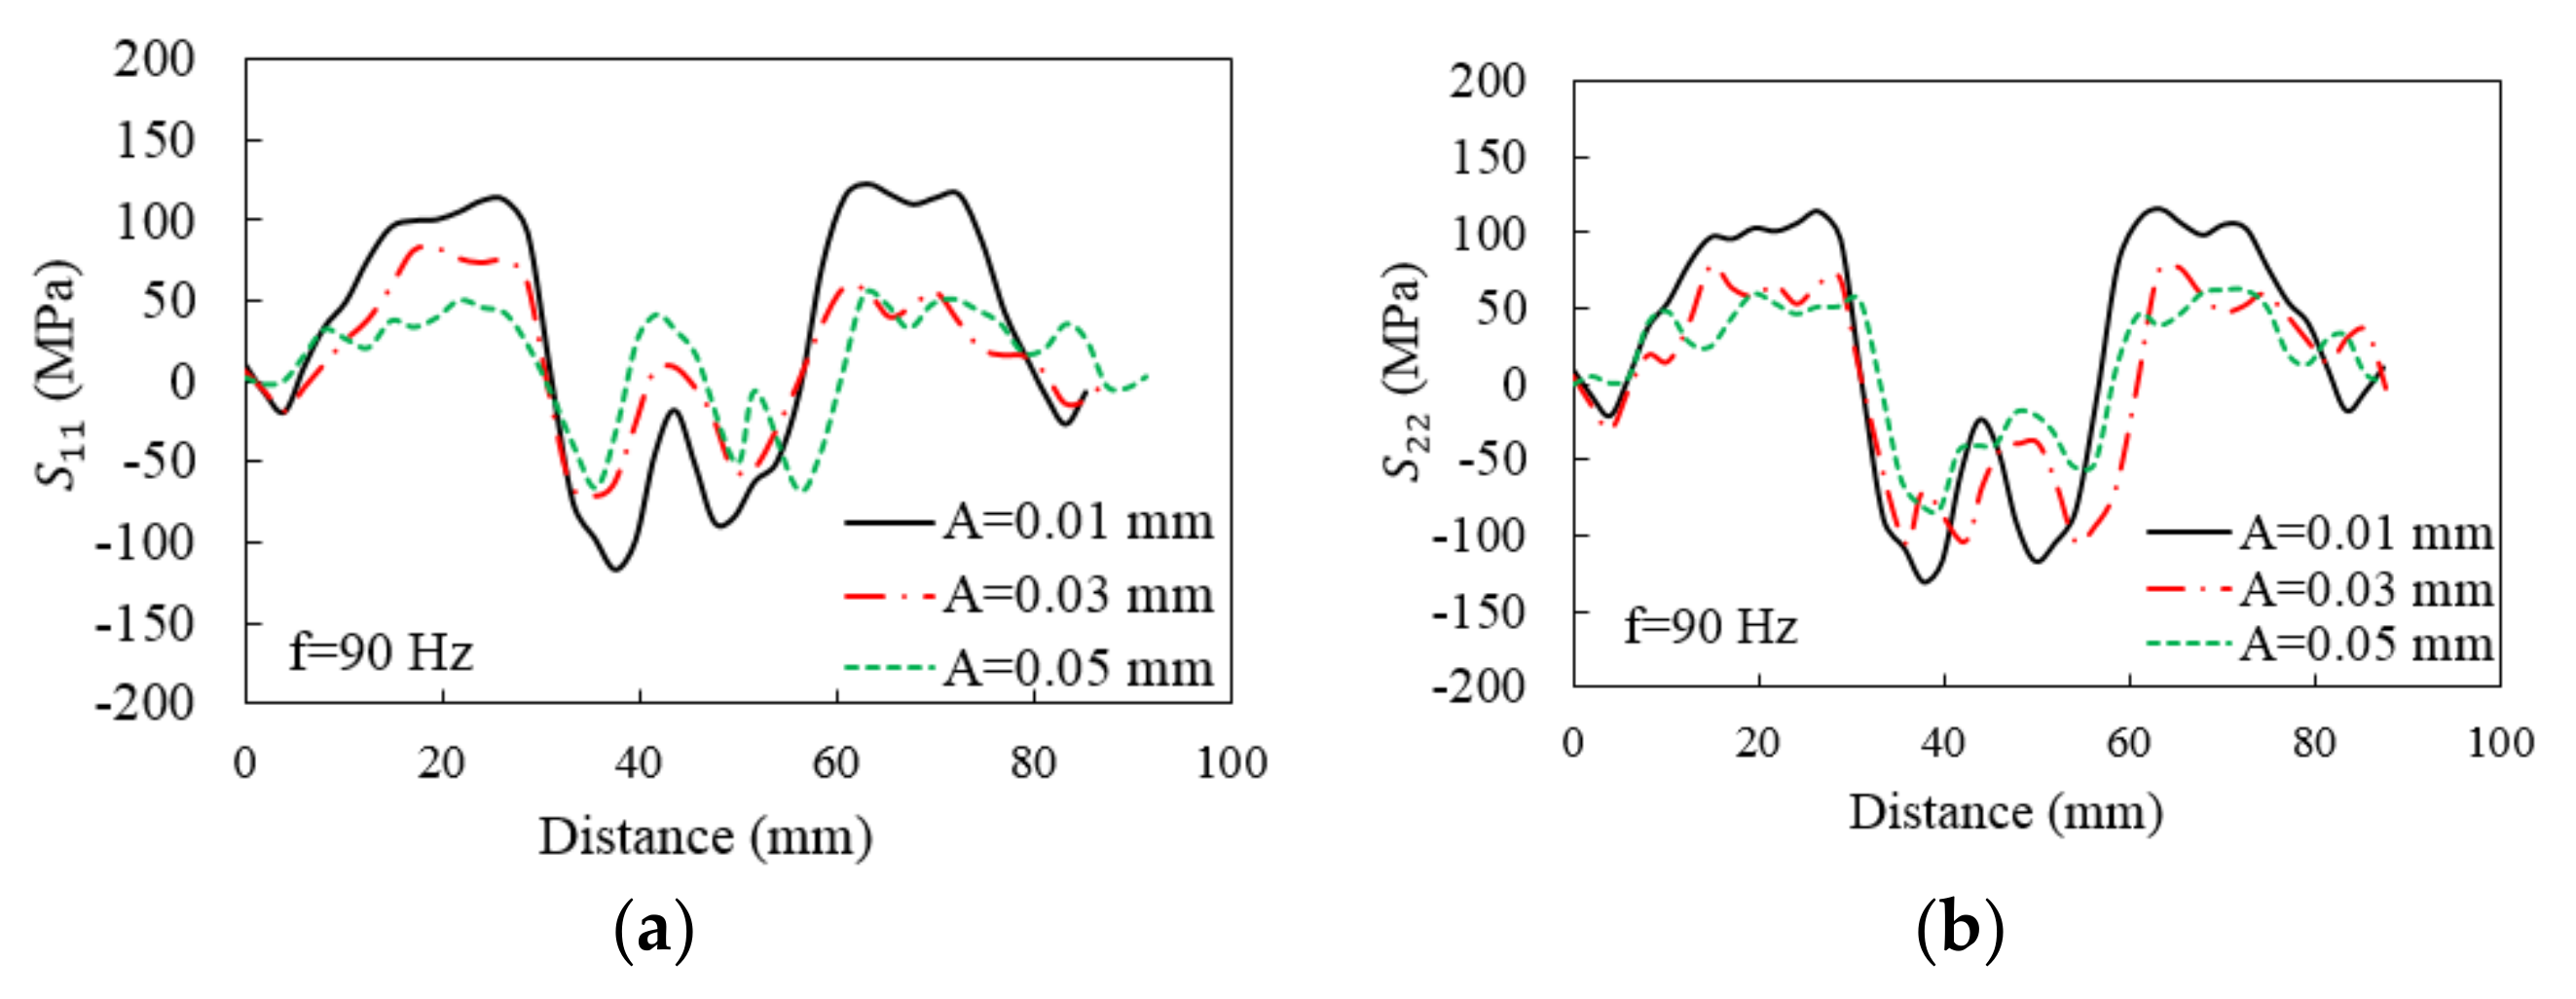
4.3.1. The Effect of Low-Frequency Vibrations on Equivalent Stress

First, the simulation results of equivalent stress after SPIF and LFV-SPIF processes were compared. From Figure 18a, to study the changing trend of equivalent stress in the two processes, the equivalent stress clouds of the 10th, 20th, and 30th layers in the two forming processes were compared. Compared with the SPIF process, as the forming progressed, the equivalent stress distribution of the parts in the LFV-SPIF became more uniform, and no obvious stress concentration occurred. Simultaneously, as the frequency increased to 90 Hz, the equivalent stress reduced by about 13% (Figure 18b).
The effect of different vibration parameters on the equivalent stress was investigated by maintaining the frequency (f = 90 Hz) or amplitude (A = 0.03 mm) and changing the amplitude or frequency to obtain the influence of different amplitudes and frequencies on equivalent stress (Figure 19 and Figure 20). The effect of low-frequency vibrations on equivalent stress is significant, i.e., as the frequency and amplitude increases, the equivalent stress value considerably reduces. When the amplitude A > 0.03 mm, the vibrating tool’s alternating force reaches the sheet’s yield limit, and the deformation is primarily plastic, where the elastic deformation is restrained, uniformly deforming the material under a lower force. When f > 60 Hz, the effect of stress superposition is significant. Simultaneously, the material’s dislocation slips, and rheological effects are high, the crystal grains are more refined, and the material’s plastic deformation ability increases. Hence, the equivalent stress value under this working condition is low.

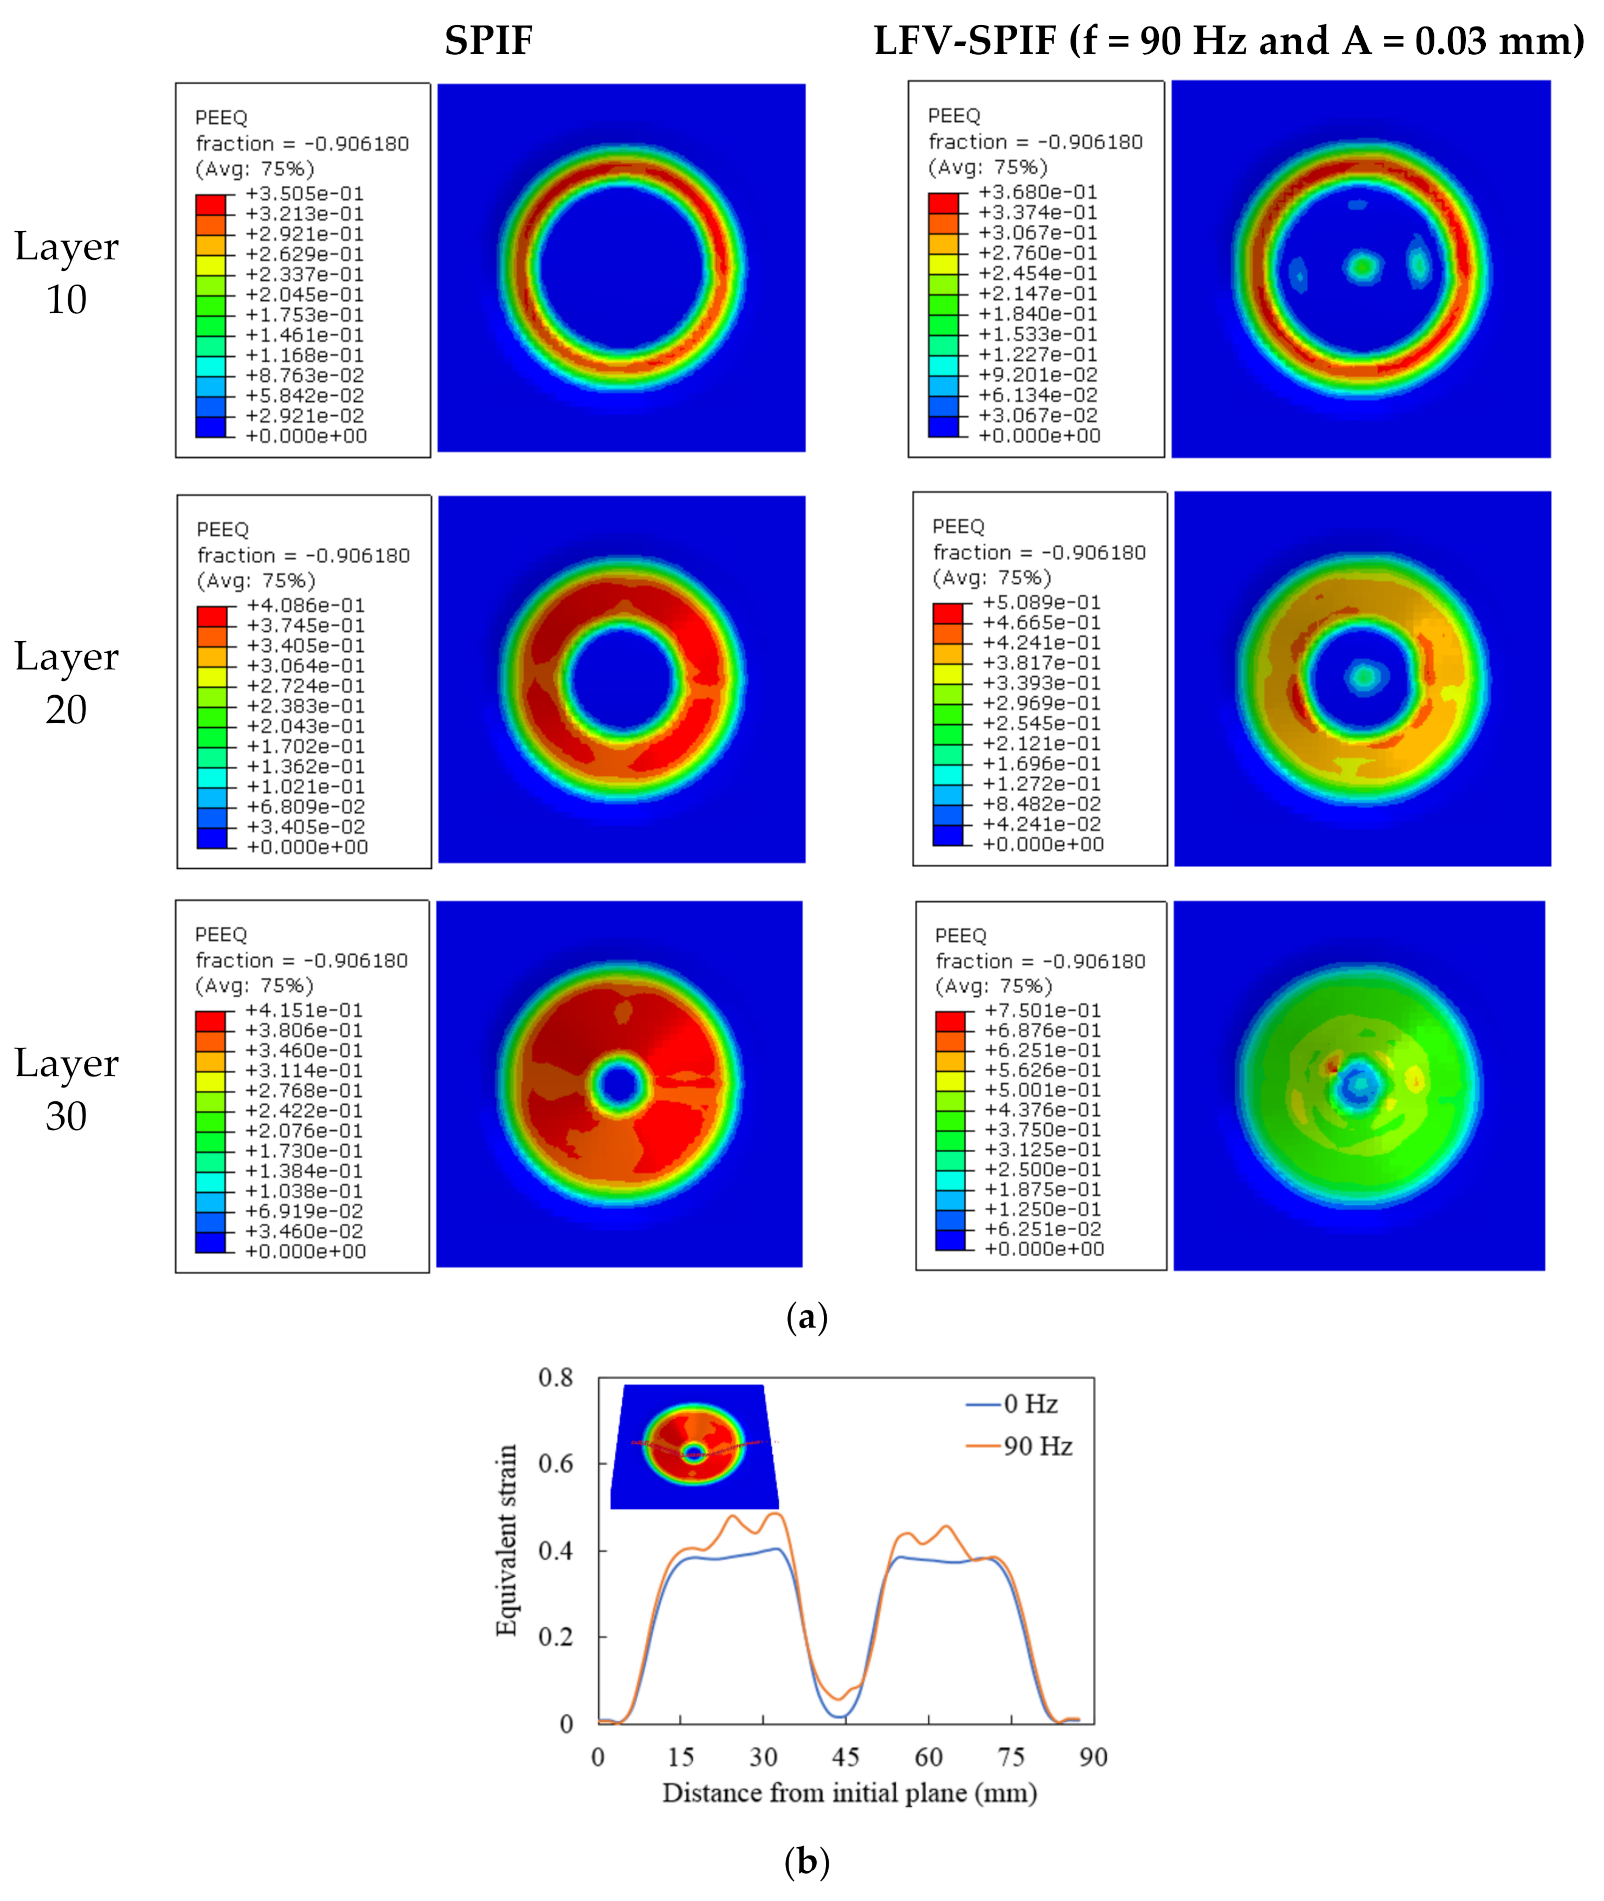
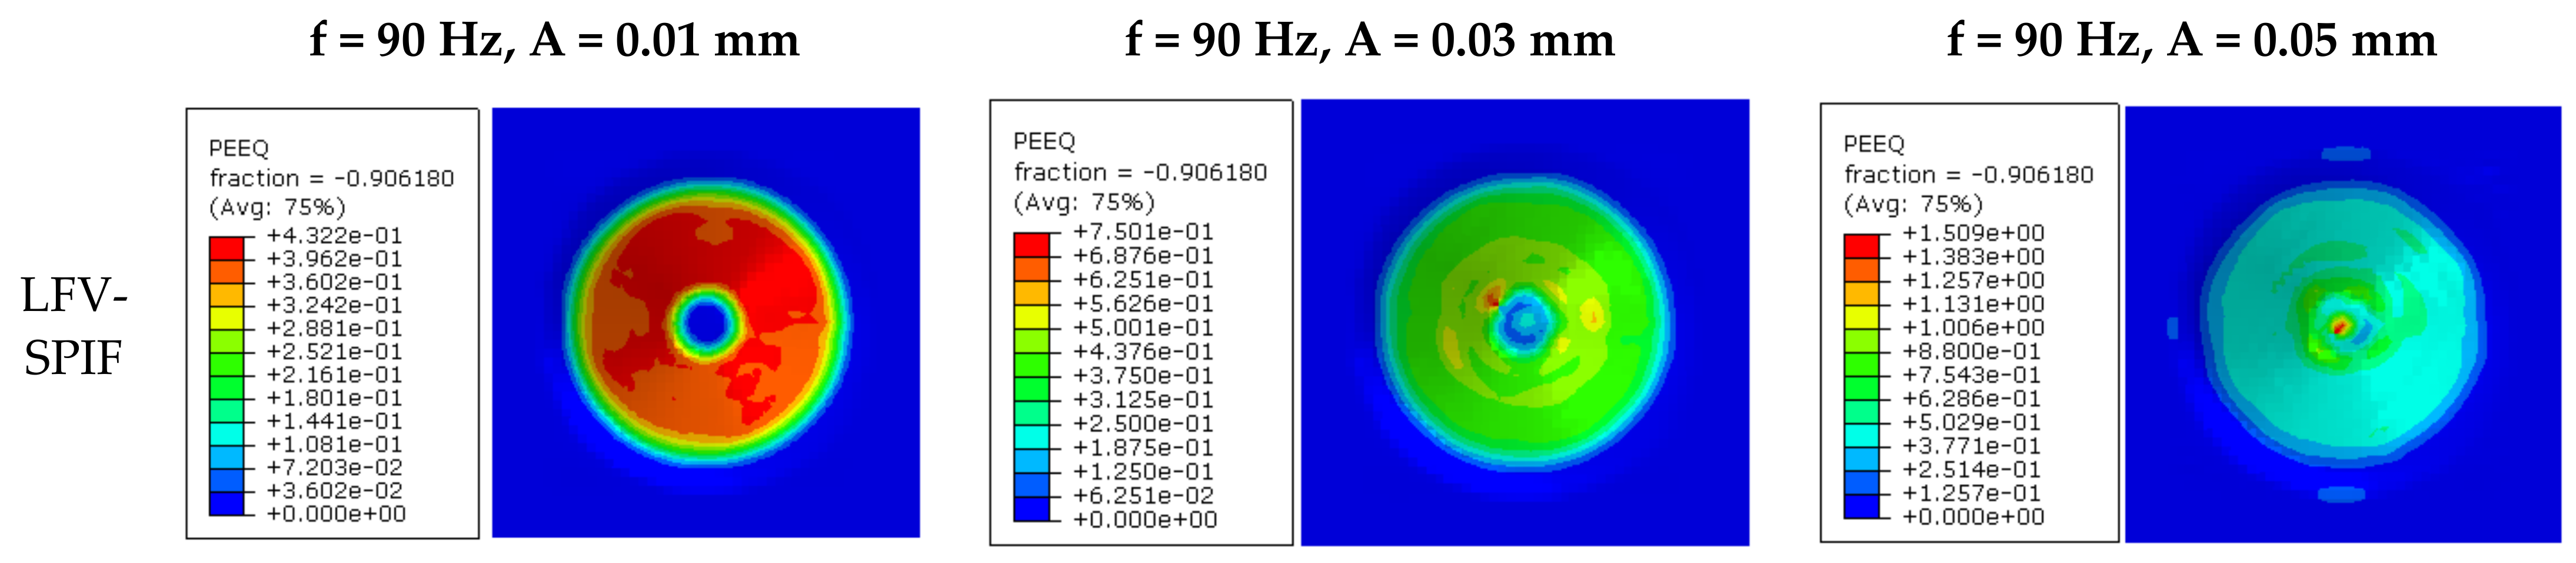
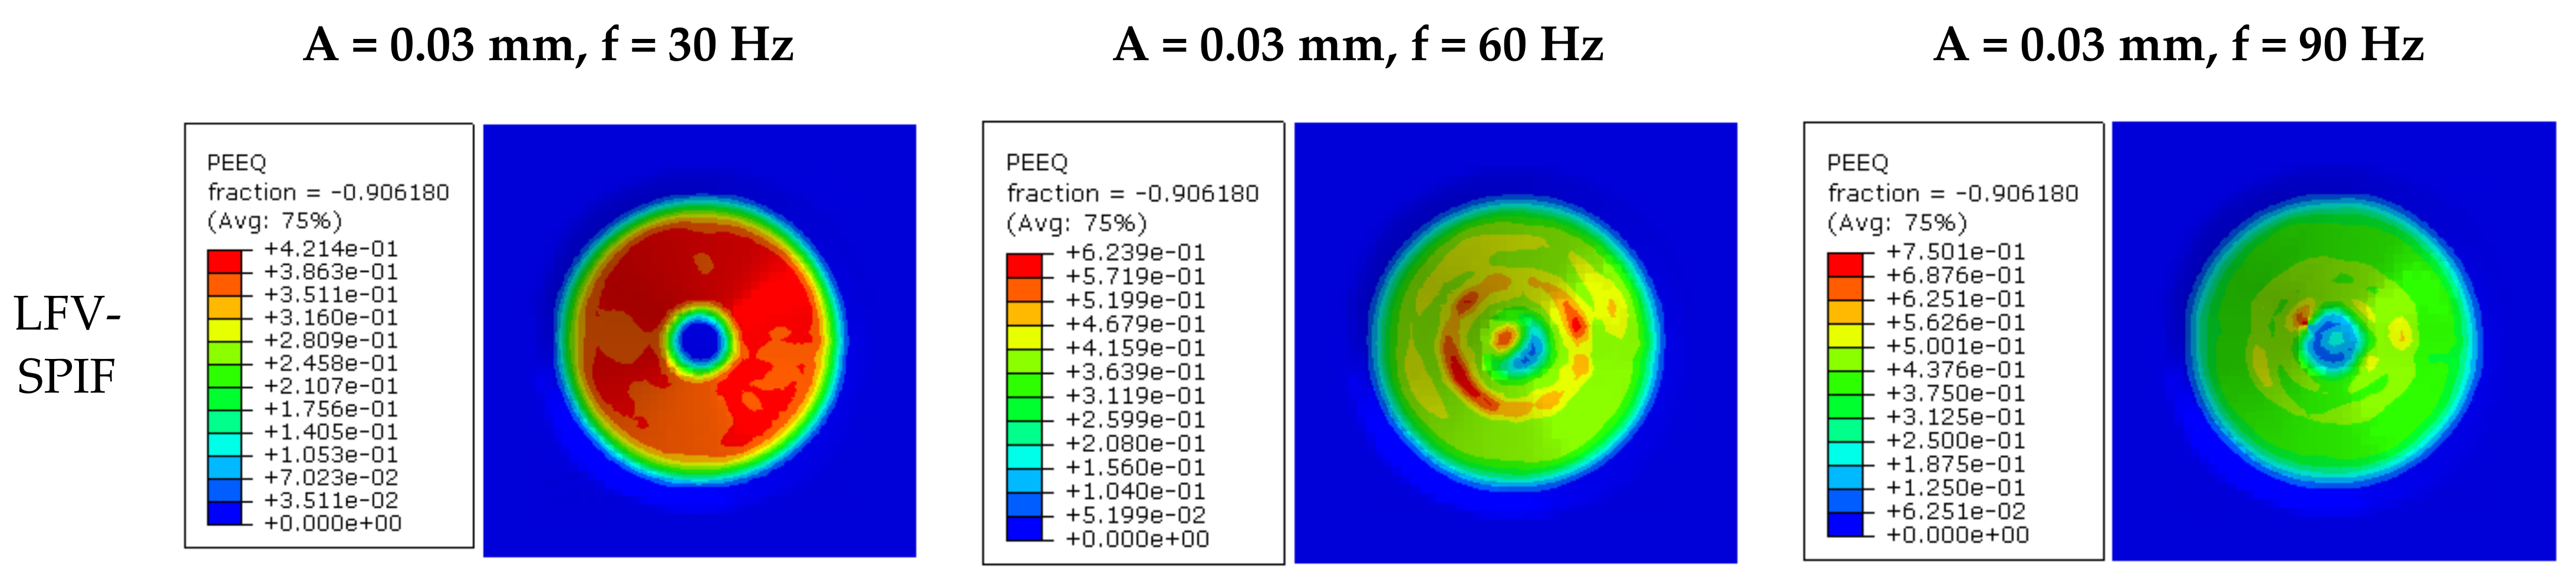
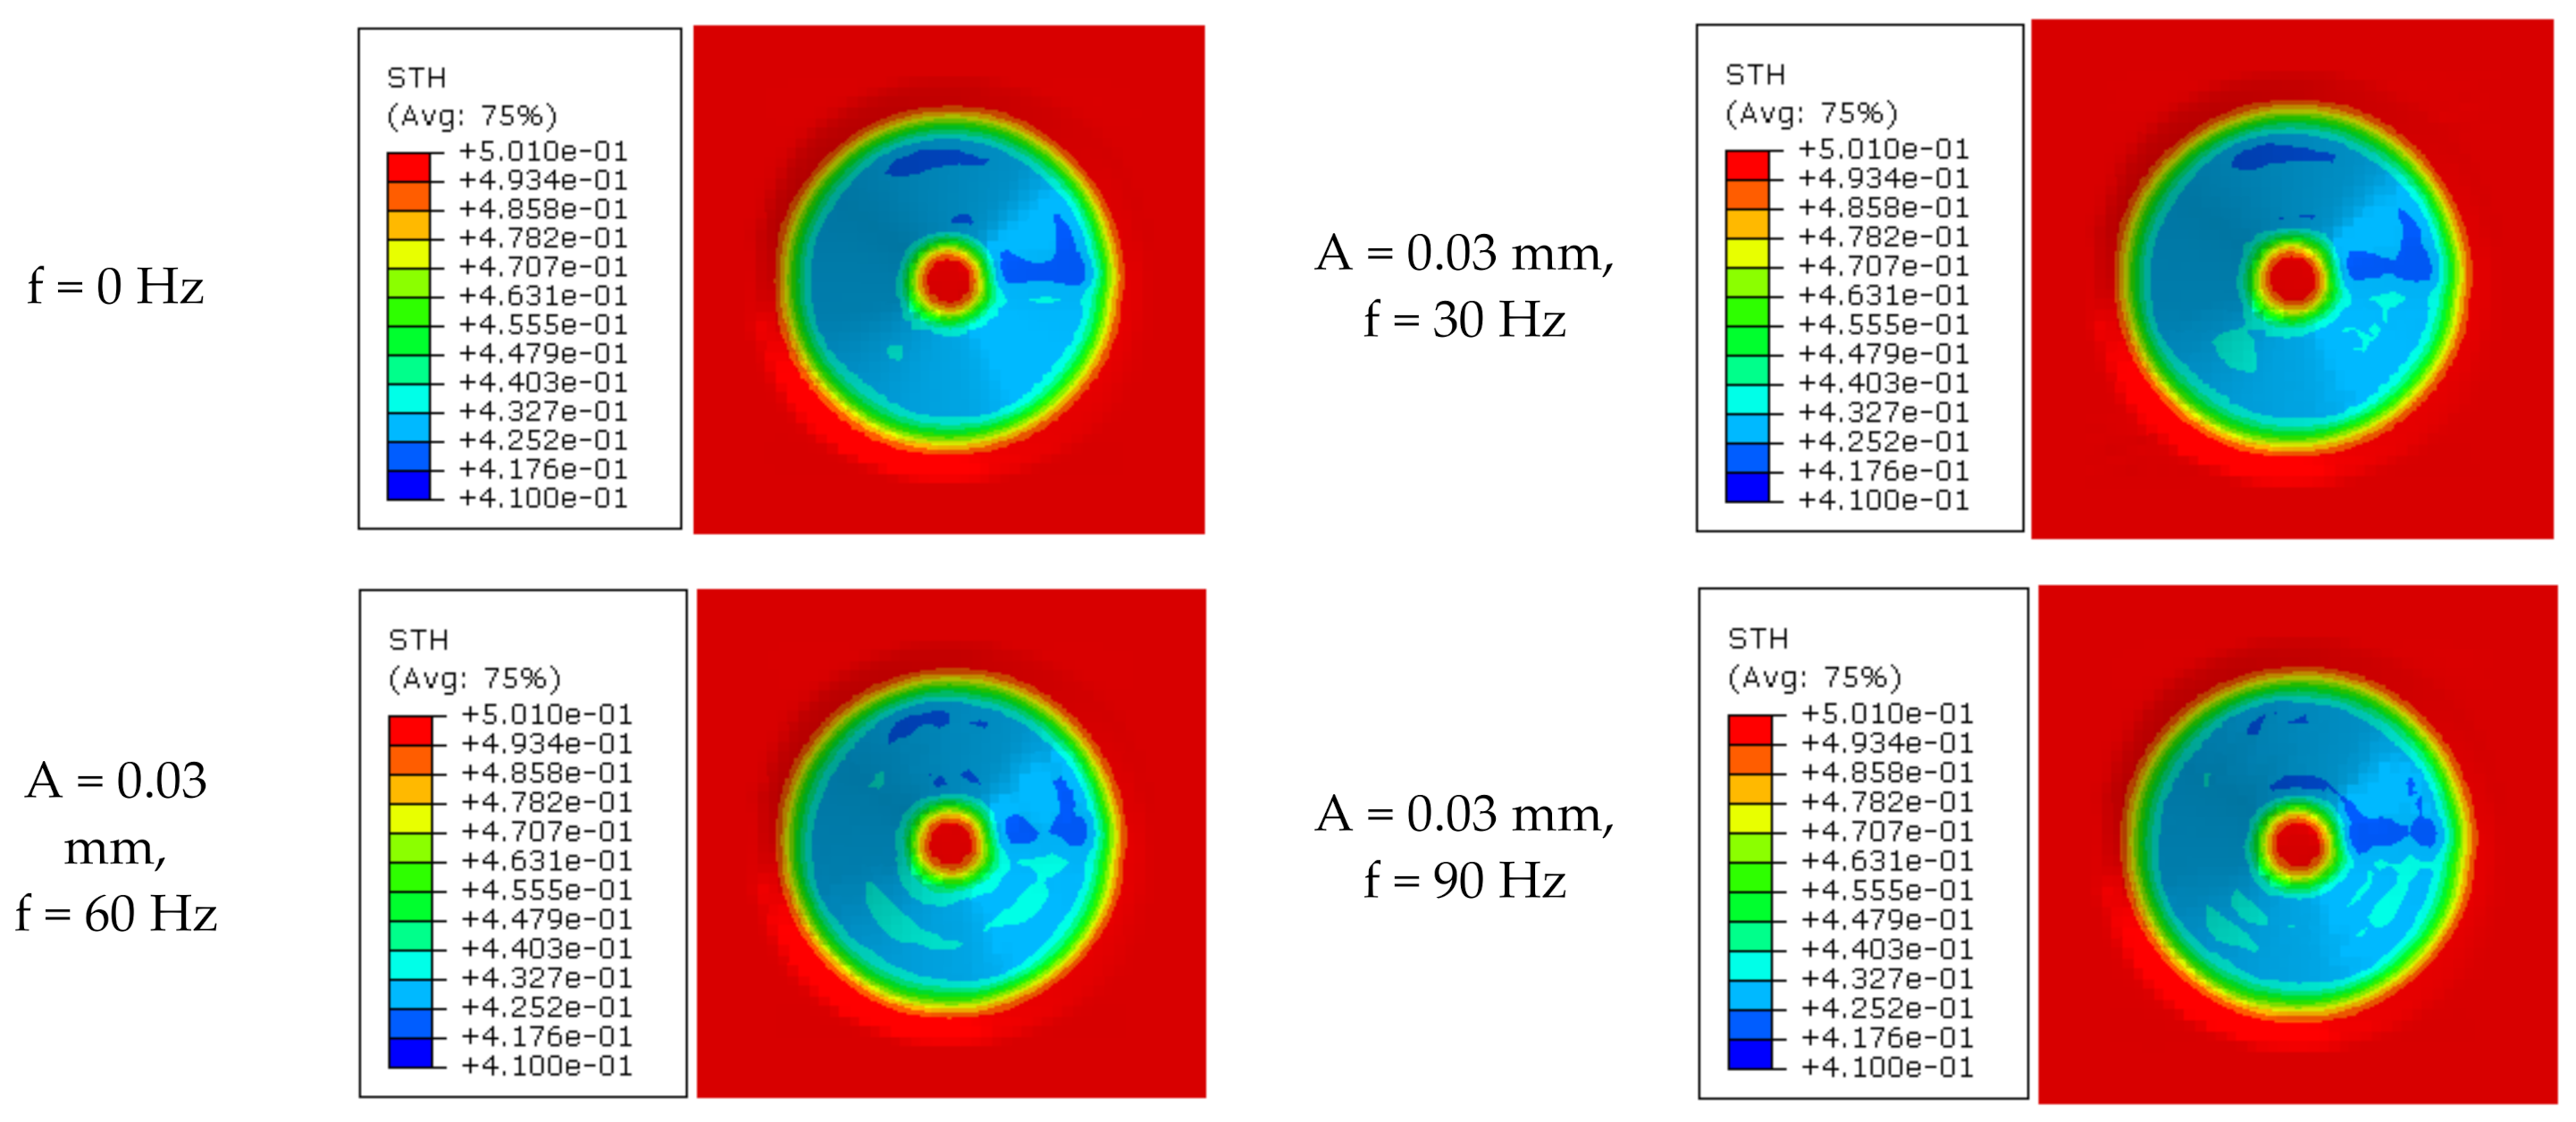
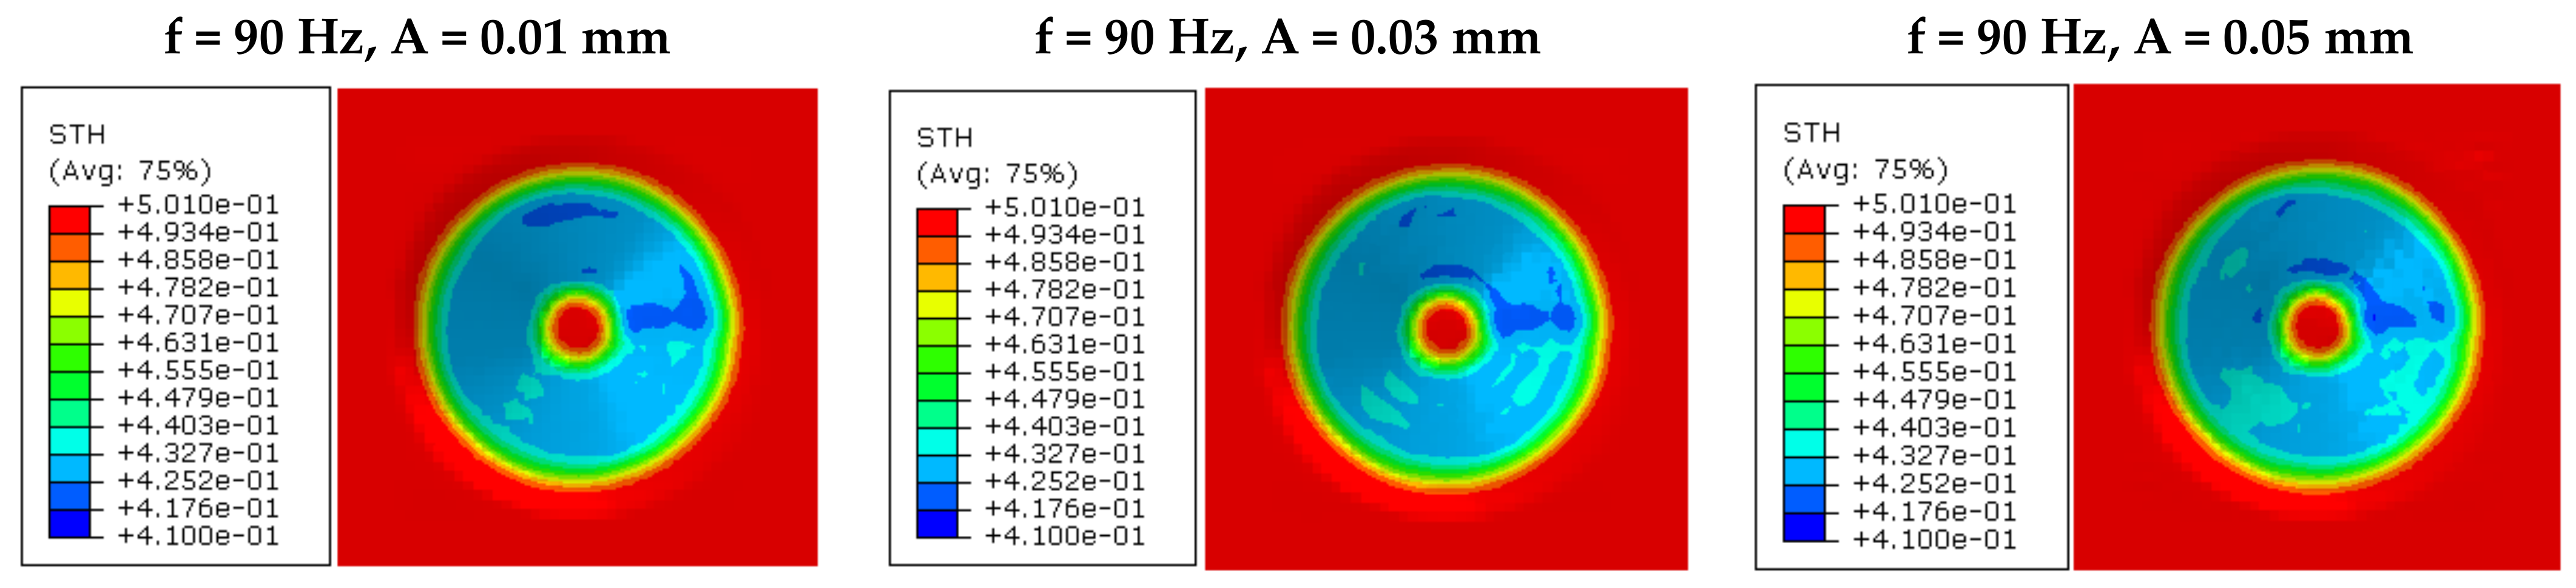
4.3.2. The Effect of Low-Frequency Vibrations on Equivalent Strain and Thickness Distribution

As with equivalent stress, the numerical simulation results of equivalent strain of the LFV-SPIF (f = 90 Hz, A = 0.03 mm) and the SPIF processes were compared. Figure 21a shows the equivalent strains cloud diagram of SPIF and LFV-SPIF processes represented by the 10th, 20th, and 30th layers. The equivalent strain values and distributions of the two forming processes are similar in the early stage of the forming process. However, as the forming continues, for LFV-SPIF, a phenomenon of concentrated strain distribution occurs, and the equivalent strain value is large (Figure 21b).
To study the effect of different vibration parameters on equivalent strain, the frequency (f = 90 Hz) or the amplitude (A = 0.03 mm) were maintained unchanged and only the amplitude or frequency were changed. Figure 22 and Figure 23 show the effect of different amplitudes and frequencies on equivalent strain.
From Figure 22 and Figure 23, as the amplitude increases, the equivalent plastic strain increases. Compared with other cases, when A = 0.01 mm, the equivalent strain limit is lower, and the uniformity of material deformation is higher. Vibrating tools can promote a more uniform deformation of the sheet. When the A > 0.03 mm or f > 60 Hz, the instantaneous depression of the vibrating tool increases, the material’s strain rate and deformation energy increases, and the equivalent strain extreme value increases accordingly. Simultaneously, high frequency causes a more uneven local contact between the sheet and tool per unit time, resulting in uneven strain distribution and local strain concentration.
Comparable results can be found from the sheet’s thickness distribution after forming. Figure 24 and Figure 25 show the thickness distribution of the formed part under different vibration parameters. As the forming angle is constant for all the cases, depending on the sine law, the difference in the thickness distribution of the formed parts is not obvious. However, as the frequency and amplitude increases, the sheet’s thickness distribution becomes more uneven. During the LFV-SPIF process, local springback continues. As the frequency and amplitude increase, the contact area between the tool and sheet metal and the deformation rate increase, causing concentrated stress and uneven deformation. In particular, when the amplitude increases, its influence is more significant.

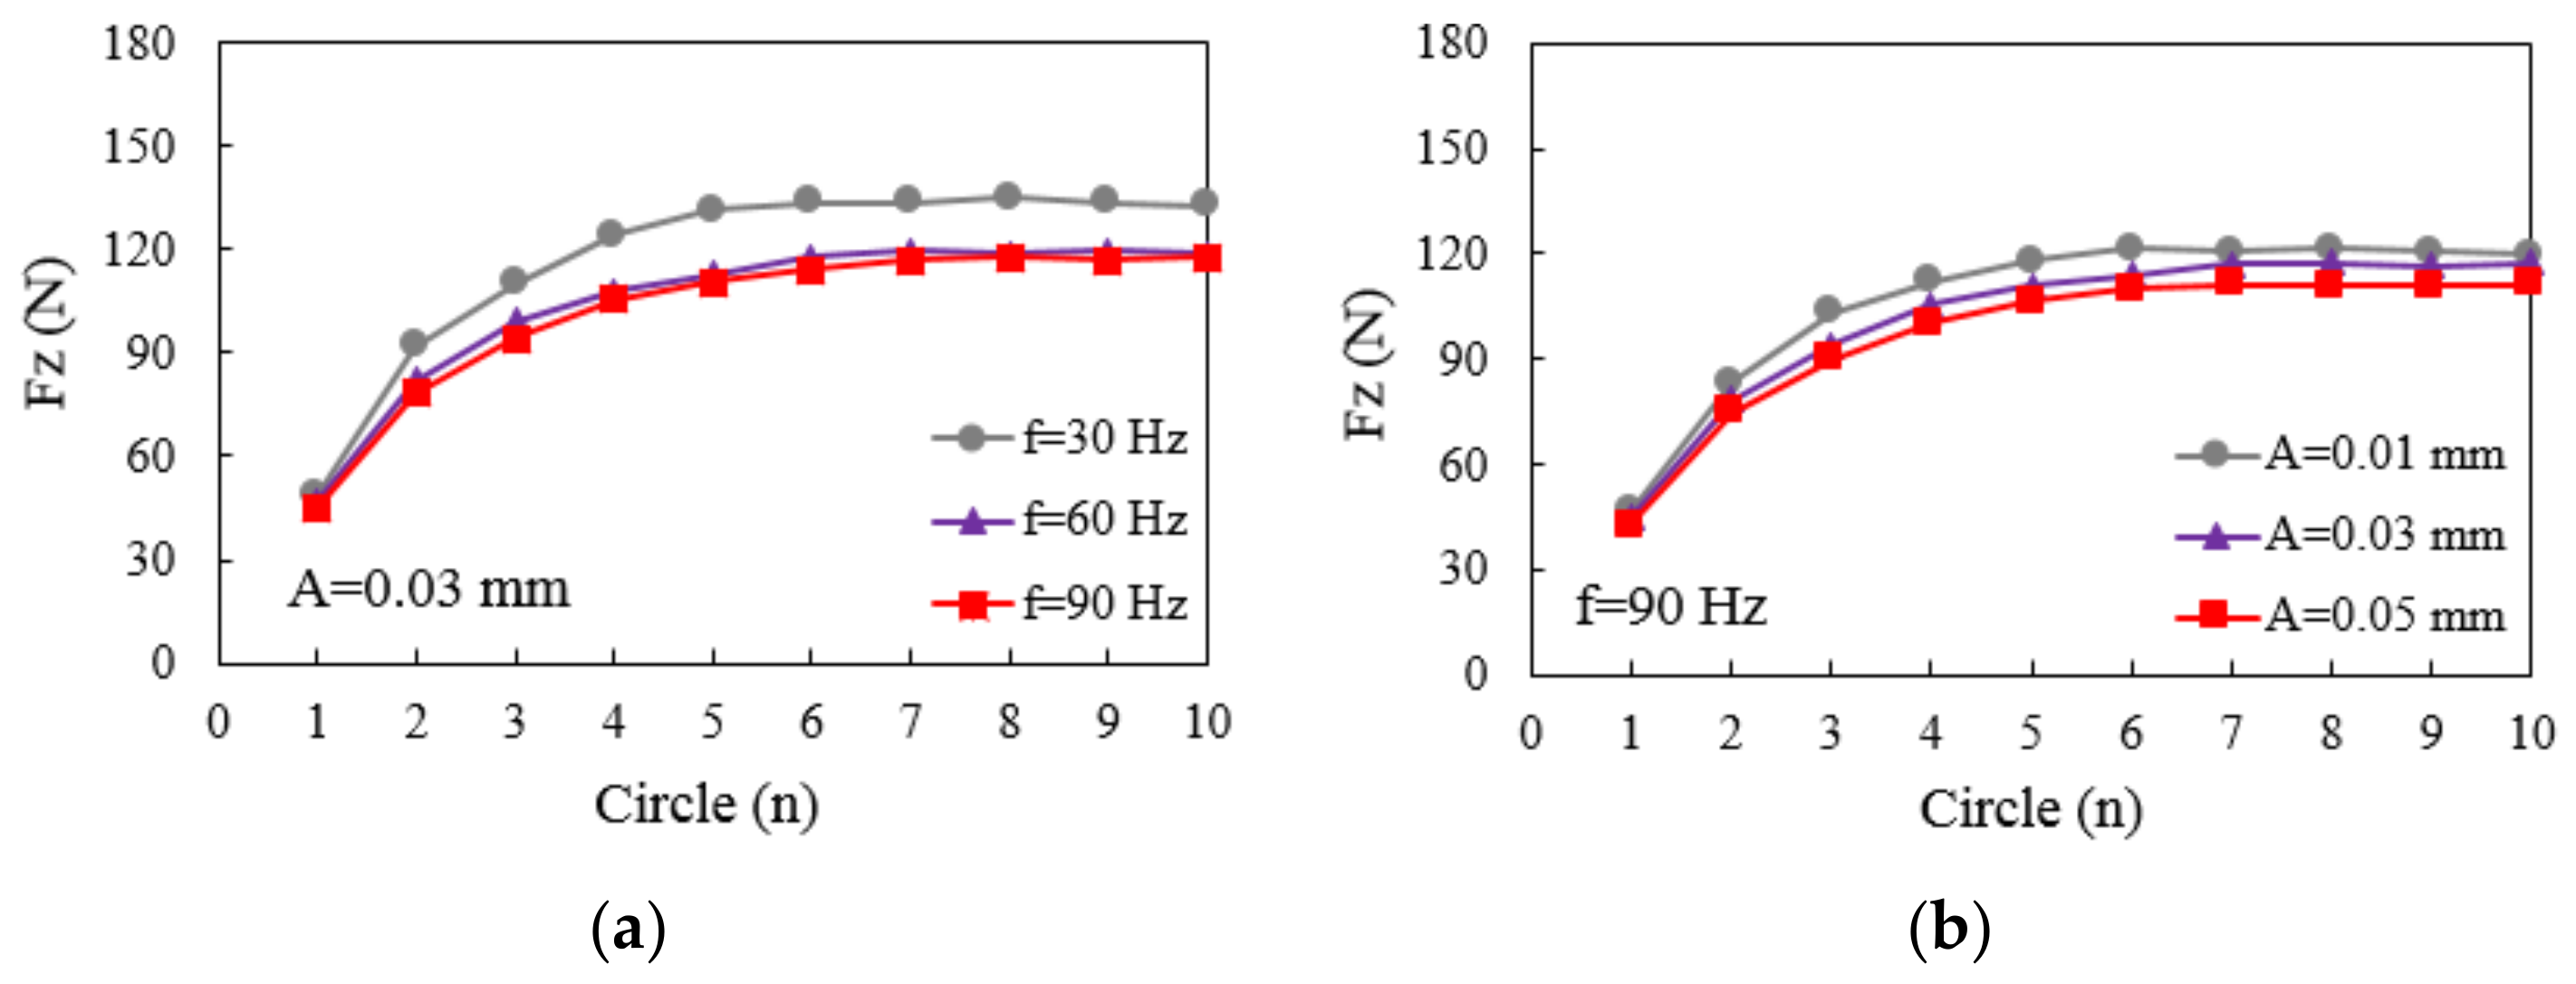
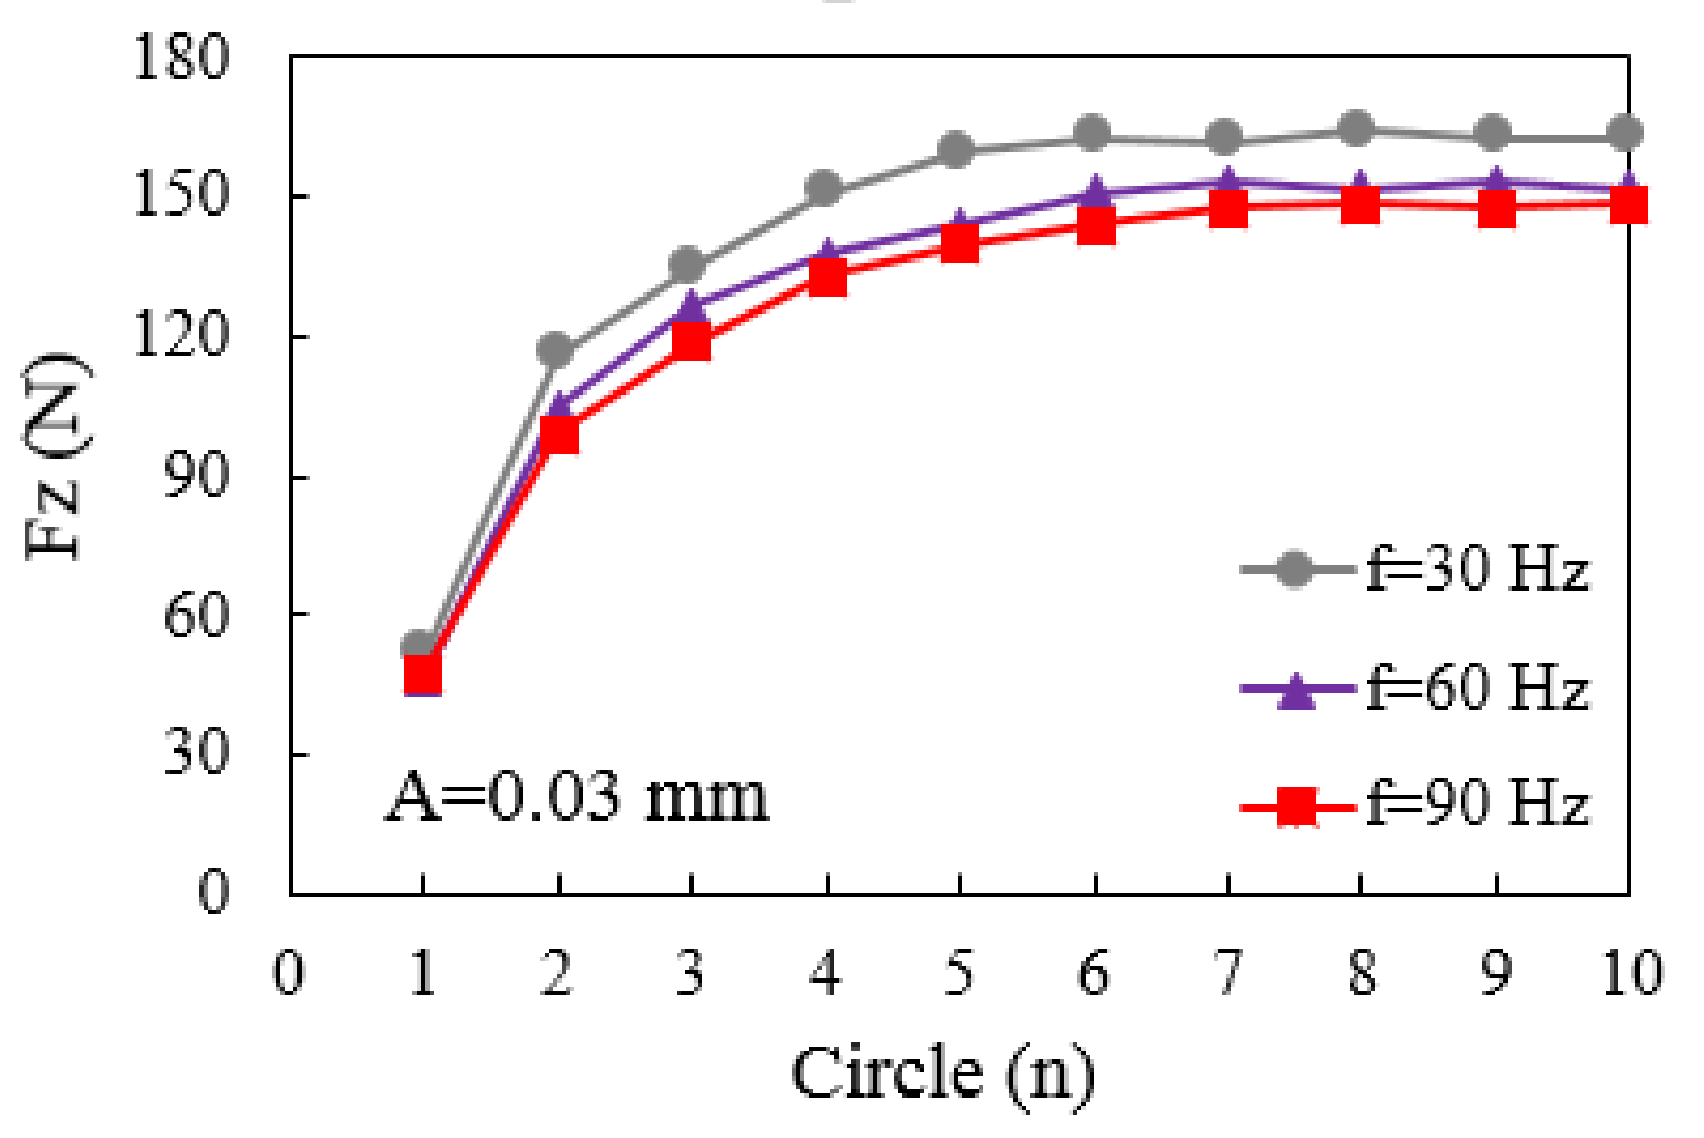
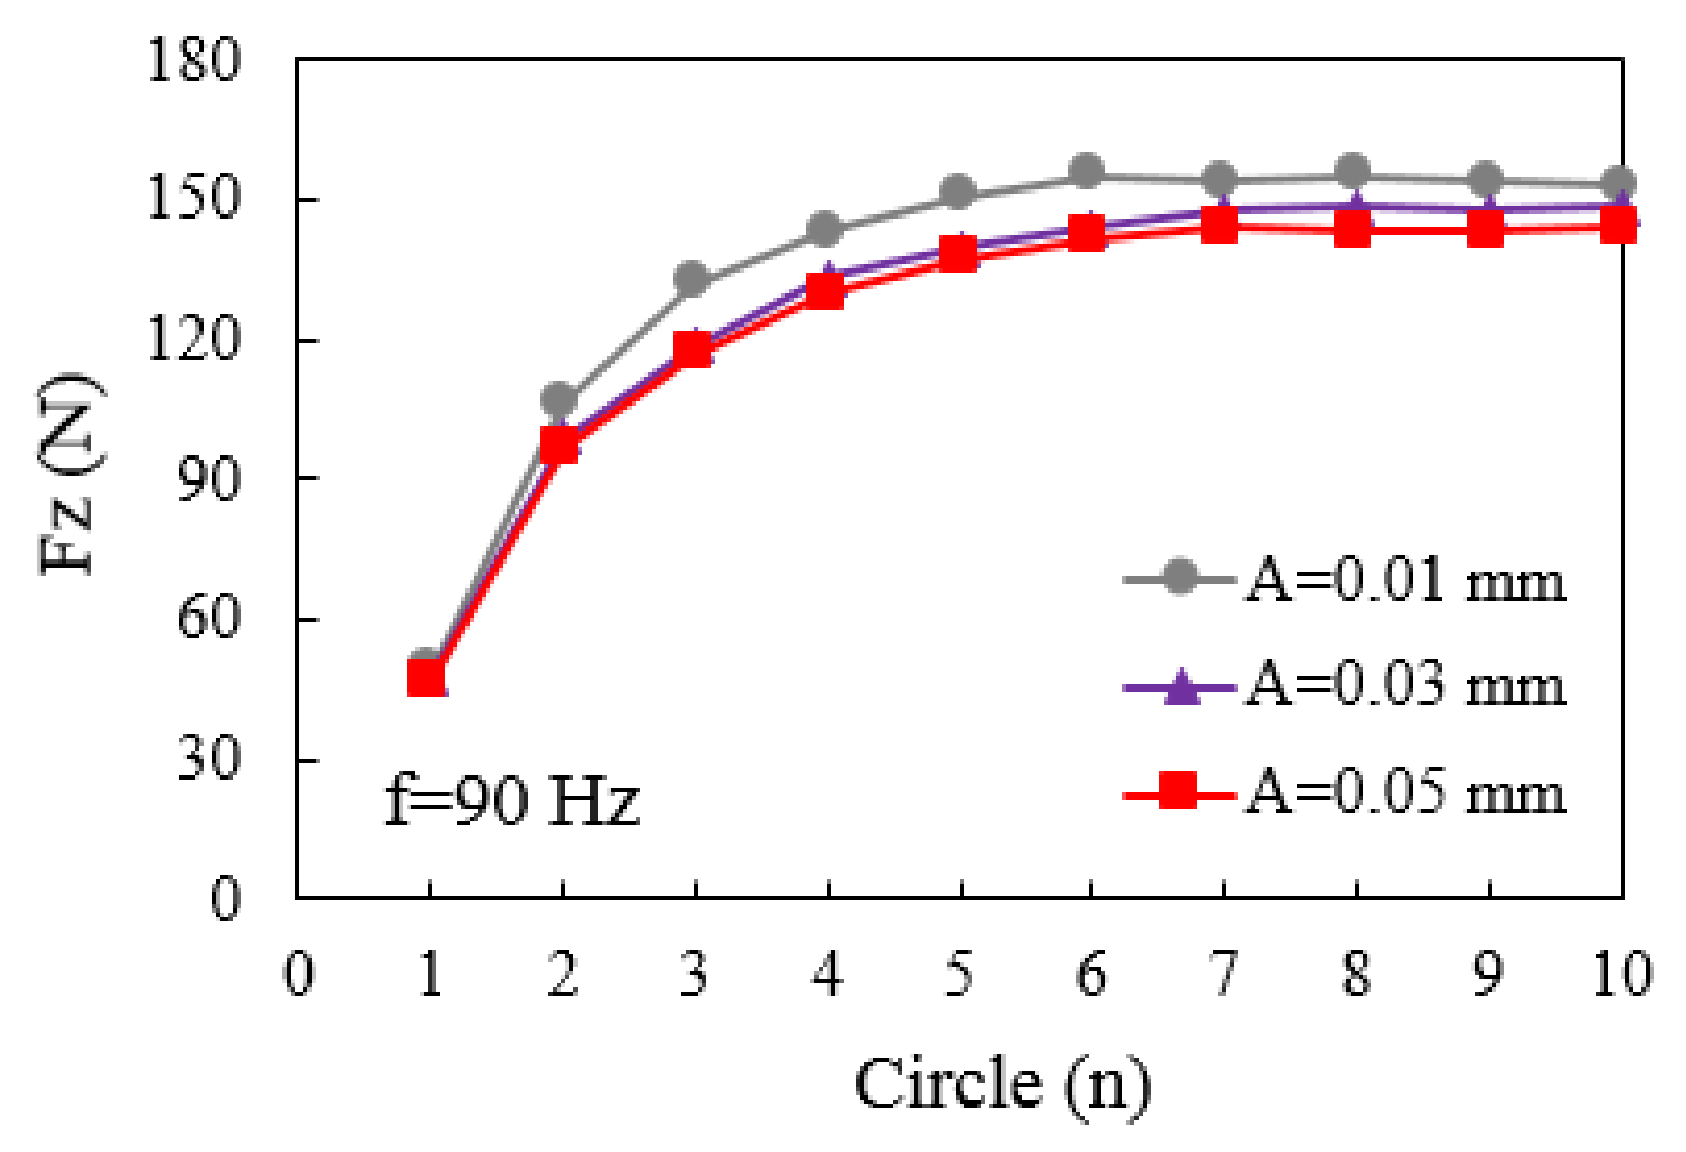
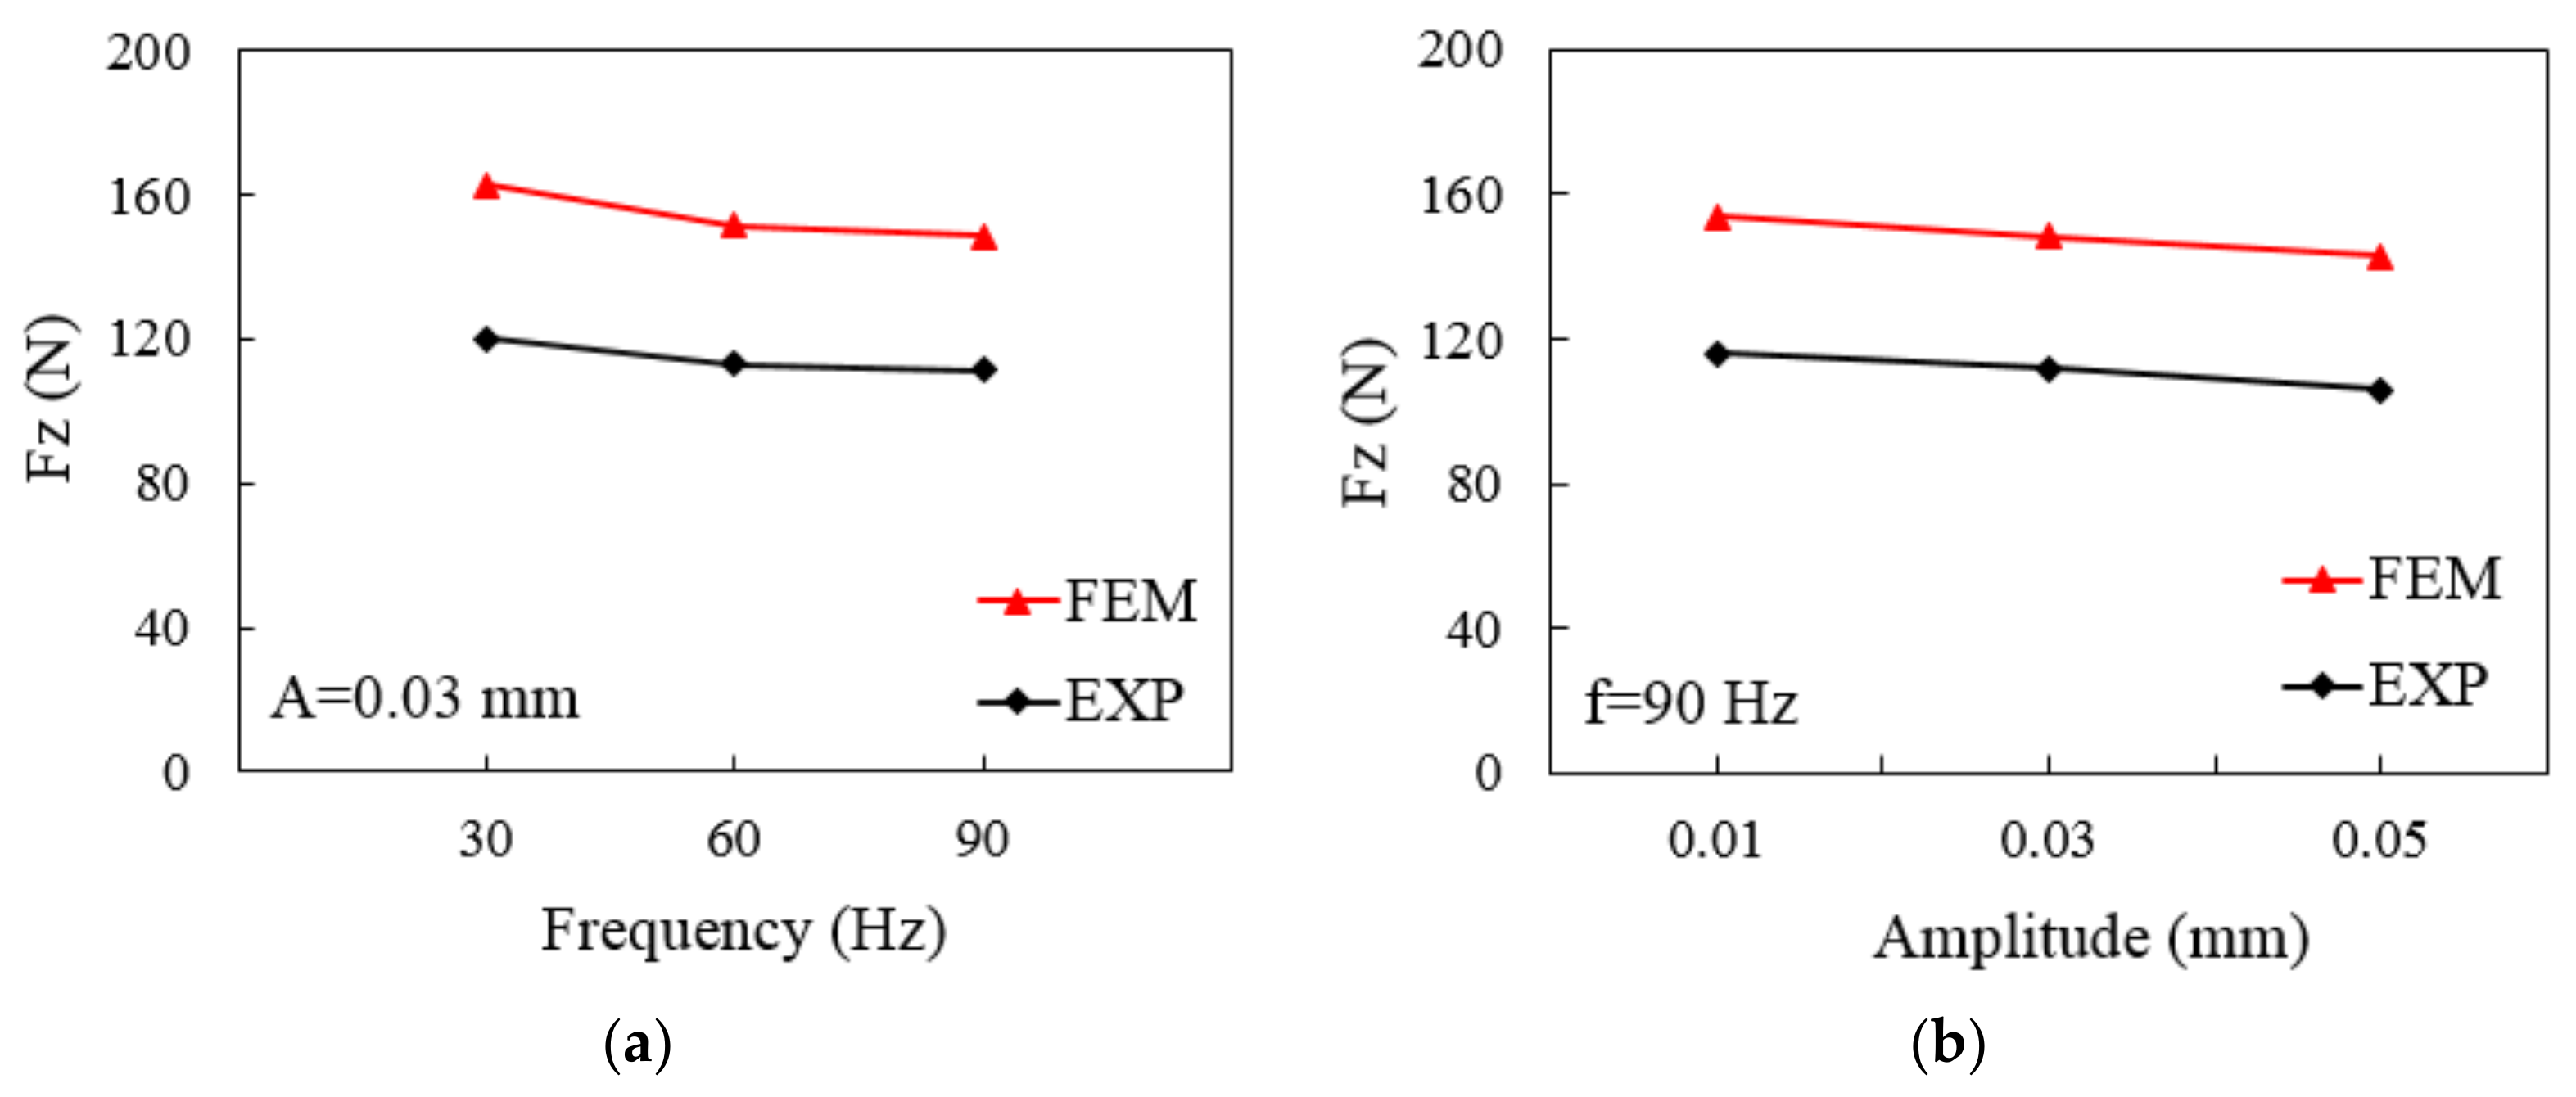
4.3.3. The Effect of Low-Frequency Vibrations on the Forming Force

The ABAQUS/Explicit algorithm was used to obtain the X-Y result curve of the SPIF forming force in all directions (Figure 26a and Figure 27a). Among them, the axial forming force F z shows a gradual and increasing law of change equivalent to the experiment results. As shown in Figure 26b and Figure 27b, F x and F y show a sinusoidal interleaved periodic fluctuation change law, and the amplitude of the sinusoidal change gradually increases and stabilizes near the 10th circle. In addition, the mathematical smoothed forming force F z of the two processes were compared. As the frequency increases to 90 Hz, the axial forming force F z of the AA1050 is reduced by 26.9% (Figure 28).
Because the forming force in the LFV-SPIF process is stable around 10 circles, the analysis efficiency is improved by extracting the forming forces of the first 10 circles for comparative analysis (Figure 29). From Figure 29, the changing trends of F z under the three amplitude groups are similar in which the average value of force during each circle is used to obtain the changing trend of F z for the different amplitudes. The amplitude positively correlates with F z when it is greater than 0.01 mm. When the amplitude is less than 0.01 mm, the vibrating tool’s force on the sheet is small. According to the Mises yield criterion, the sheet has more elastic than plastic deformation, and the material has not completely plastically yielded. When the vibrating tool moves to the second half in each sine cycle, theoretically, the vibrating tool should be separated from the sheet material instantaneously. However, the sheet material’s elastic energy is released, and the springback keeps the sheet material and vibrating tool in continuous contact, increasing the average value of F z . When the amplitude is greater than 0.03 mm, the vibrating tool’s direct impact exceeds the material’s yield strength. The deformation of the sheet is mostly plastic, which inhibits the springback due to elastic deformation. The vibration tool realizes the actual separation from the sheet metal in the second half of the cycle, decreasing the average of F z .
Figure 30 shows the results of the axial force F z at different frequencies. Consistent with the research method for the amplitude part, the forming forces of the first 10 circles were extracted for comparative analysis. The changing trends of F z under the three frequency groups were similar. When the frequency is greater than 30 Hz, it positively correlates with F z . As the frequency increases, the vibration energy absorbed by the material increases. When it propagates near the dislocation grain boundary, the material’s lattice dislocation density and rate will significantly increase, and the crystal grains will increase. It will be more refined, and the material will become softer macroscopically; therefore, the F z will decrease as the frequency increases.
In the LFV-SPIF process, the most important reason for reducing the axial forming force is the superposition of stress and material softening caused by low-frequency vibrations. Similar to ultrasonic vibrations, low-frequency vibrations are mechanical energy where dislocations in the metal structure absorb vibrational energy, promoting the movement of the dislocations and making plastic deformation easier [31].
Figure 31 compares the experimental and simulation results of the axial force in the steady state under different frequencies and amplitudes. Note that, compared with the experimental results, a 20% error exists in the simulation because FEM can only reflect the stress superposition effect of low-frequency vibrations. The acoustic softening effect related to the material’s internal structure is challenging to simulate using finite elements. Therefore, the correct material constitutive relationship should reflect the acoustic softening effect of low-frequency vibrations on the material.

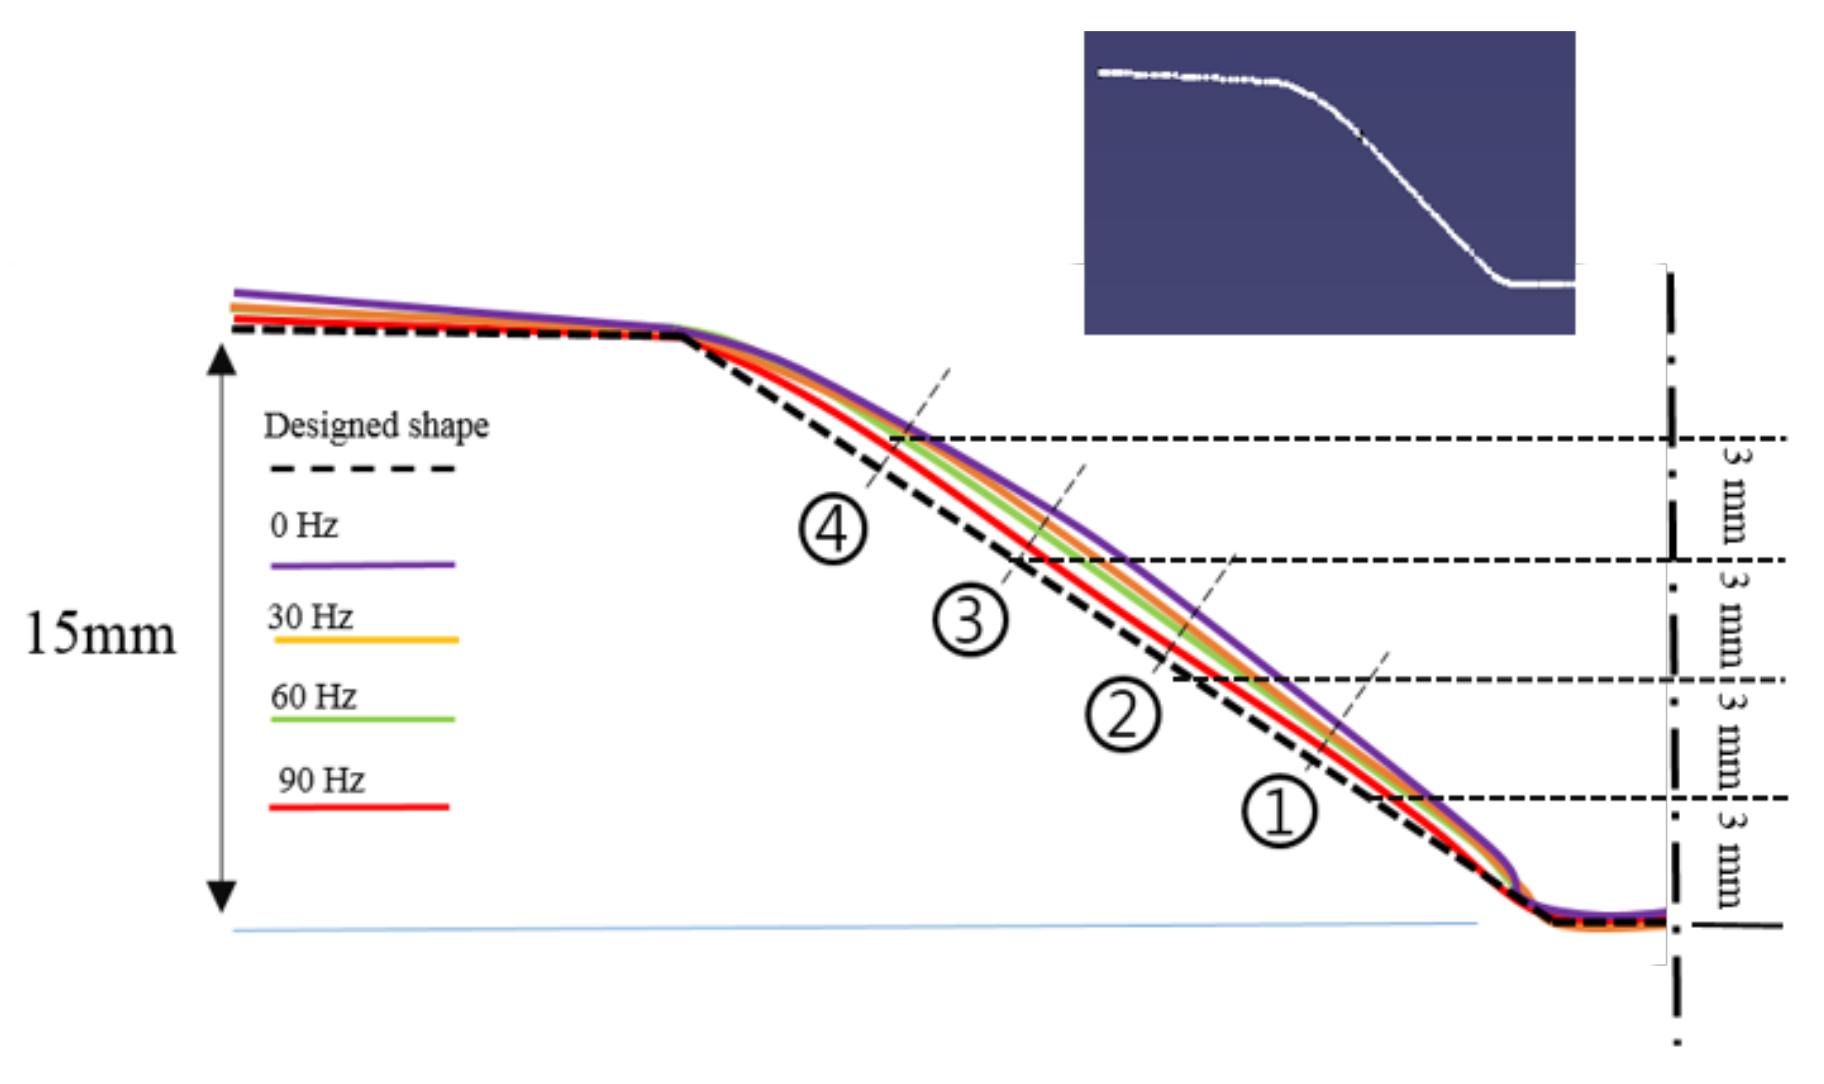
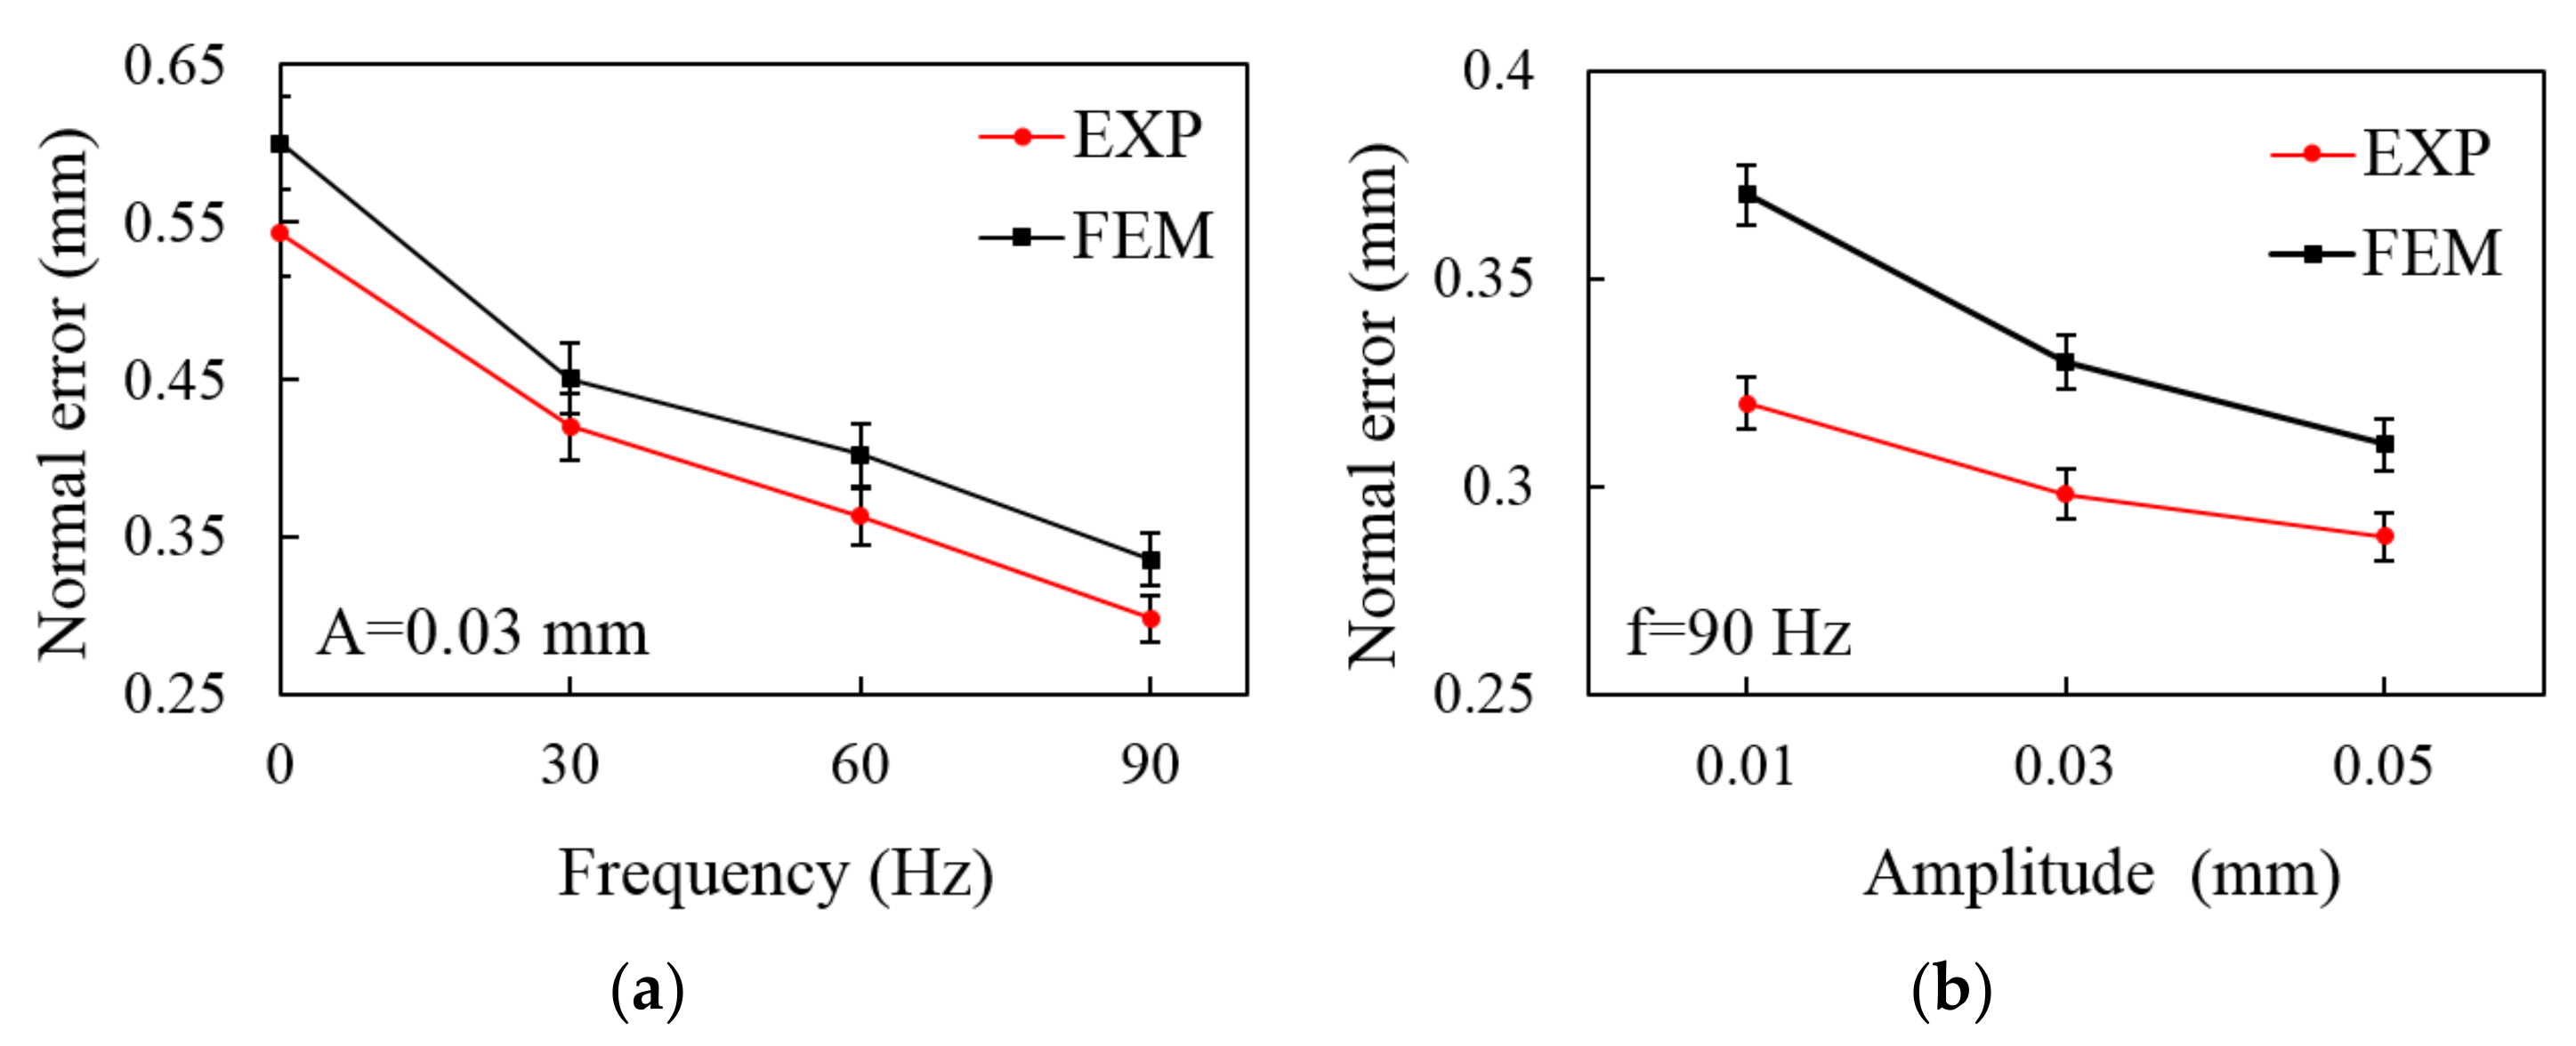
4.3.4. The Effect of Low-Frequency Vibrations on Forming Accuracy

During the SPIF forming process, when the tool is unloaded, due to its local dynamic loading characteristics, some uneven deformation and elastoplastic layering are caused, causing the part to release a certain springback after the forming is completed. The incompletely released deformation exists partially in residual stress to temporarily maintain a balance. This balance is easily broken when the part is removed, reducing forming accuracy. Based on the ABAQUS/Standard implicit analysis, the residual stress and springback in the forming process were numerically simulated, and the influence of low-frequency vibrations on the forming accuracy is discussed.
As shown in Figure 32a, the workpiece can be divided into a bending transition zone a, inclined plane deformation zone b, and bottom stabilization zone c, along the deformation path. At the same time, the unit body of the side wall is extracted and the residual stresses in three directions (1, 2, and 3) are defined (Figure 32b). Among them, direction 1 ( σ x ) represents the wall direction parallel to the generatrix of the truncated cone, direction 2 ( σ y ) represents the circumferential direction tangent to the circumferential direction of the truncated cone, and direction 3 ( σ z ) represents the normal direction perpendicular to the plate. The wall residual stress σ x , circumferential residual stress σ y , and normal residual stress σ z correspond to S 11 , S 22 , and S 33 in the ABAQUS simulation results, respectively. Because the shell elements are used, and S 33 does not change much, no comparative study was conducted on S 33 . Therefore, this study focuses on the principal stresses σ x and σ y . The positive value represents the tensile stress, and the negative value represents the compressive stress.
When low-frequency vibration technology is introduced into SPIF, the material’s rheological mechanism and deformation uniformity will change considerably when the sheet is deformed, and the residual stress changes accordingly. The definition of the residual stress direction of the low-frequency vibration single-point incremental sheet-forming part is consistent with the definition of the direction in Figure 32. Figure 33 shows removing the holder and die, modifying boundary conditions, and importing the dynamic simulation part as the initial state into the static analysis step for springback simulation of the LFV-SPIF process. After that, the wall and circumferential residual stress distribution cloud diagram of the part after springback is released and compared with the SPIF. Low-frequency vibrations can effectively reduce the parts’ residual stress
In Figure 33 a,c, the sheet’s wall direction residual stress is shown as tensile-compressive-tensile stress from left to right. The tensile stress is concentrated in the inclined plane deformation area b. Only slight tensile or compressive stresses exist in transition zone a, and bottom stabilization zone c. Simultaneously, the sheet’s circumferential residual stress distribution is almost symmetrical to the wall direction (Figure 33b,d). Figure 34 compares the residual stresses of SPIF and LFV-SPIF (f = 90 Hz and A = 0.03 mm) part in the wall ( S 11 ) and circumferential directions ( S 22 ). After applying vibration, the maximum value of the wall tensile residual stress is reduced by 36.9 MPa, and 30.2 MPa reduces the maximum value of the circumferential residual tensile stress. Moreover, the maximum values of the residual compressive stress in the wall side and the circumferential residual compressive stress are reduced by 42.1 MPa and 47.8 MPa, respectively (Table 8).
Figure 35 and Figure 36 show the comparison results of the residual stress at different frequencies and amplitudes. The residual stress values in both directions decrease with increase in frequency and amplitude.
The reduction in residual stress caused by low-frequency vibrations can effectively improve the springback in the sidewall. As in the experiment, four measurement positions were selected on the wall area at intervals of 3 mm from the bottom surface for each formed part, and the gap between each position with the target shape was measured. Finally, the average value of these four measurements was used to characterize the normal error value of the parts (Figure 37).
Figure 38 shows the amount of springback at different frequencies and amplitudes compared with the experiment results. As the frequency and amplitude increase, the springback decreases, and the error can be reduced by 43.9% (f = 90 Hz and A = 0.05 mm) in the FEM simulation.
When the frequency is too small, its normal accuracy is weak. Once the frequency exceeds 30 Hz, the vibration energy absorbed by the material transitions the kinetic and potential energies of the atoms, which is then transformed into the material’s plastic deformation performance, reducing Young’s modulus and causing the material to have a softening effect [36]. The residual stress in the sheet after unloading is reduced, sharply reducing the part’s normal geometric error. It is worth noting that the trend of the simulation results is the same as the experimental results, and the average error is only 3%, which verifies the accuracy and feasibility of the FE model in this study.

5. Conclusions

This study investigated the effect of low-frequency vibrations on the performance of the SPIF process. First, an FE model considering low-frequency vibrations was established. The influence of low-frequency vibrations on the forming process was analyzed, revealing the material’s deformation mechanism. Experiments were conducted to verify the simulation results using the developed LFV-SPIF system. The following conclusions can be drawn.
Low-frequency vibrations can effectively reduce the equivalent stress and axial forming force in sheet forming. Equivalent stress and axial forming force reduction correlate positively with frequency and amplitude. The larger the frequency and amplitude, the smaller the equivalent stress and axial forming force. As the vibration energy increases, the stress superposition effect is significant. The vibration energy causes dislocation to slip and rheological effects of the material, softening the material. When the frequency is increased to 90 Hz, the axial forming force can be reduced by 45.6%.
The LFV-SPIF equivalent strain values and distributions are similar to the SPIF process in the early forming stage. However, as the forming continues, for LFV-SPIF, a phenomenon of concentrated strain distribution occurs, and the equivalent strain value is large. When A > 0.03 mm or F > 60 Hz, the vibrating tool’s instantaneous press amount increases, the material’s strain rate and deformation energy increase, and the equivalent strain extreme value increases accordingly. The high frequency leads to more contact between the sheet and the tool per unit time, resulting in an uneven strain distribution and local strain concentration, decreasing the uniformity of the thickness distribution after the material is formed.
Implicit analysis revealed the sheet’s residual stress distribution after unloading during the LFV-SPIF process. Through comparison, it was found that the axial and normal residual stresses are effectively reduced with increase in amplitude and frequency. Furthermore, the residual stress reduction improves the normal forming accuracy of the formed products. As the frequency increases to 90 Hz, the average accuracy of the formed product can be increased by 46.9%.
The use of LFV assistance in the SPIF process can effectively reduce the use of lubricants and reduce environmental pollution as LFV can effectively change the friction conditions. Therefore, the LFV-SPIF process can be regarded as a clean production technology.

6. Future Work

The acoustic softening effect and the vibration plastic softening effect refer to applying vibration to change the processed material’s plastic mechanical properties, affecting the material’s deformation mechanism and producing a softening phenomenon, reducing the limit shear force during the forming process [37]. The acoustic softening effect related to the material’s internal structure is challenging to simulate using finite elements. Therefore, the material’s constitutive relationship must be modified to reflect the acoustic softening effect of vibrations on the material. In subsequent research, constitutive model parameters will be determined through experiments and applied to improve the simulation results.

Author Contributions

Conceptualization, Y.-S.K.; methodology, Y.-S.K.; investigation, X.X. and S.-H.K.; formal analysis, S.-H.O. and X.X.; data curation, S.-H.K.; writing—original draft preparation, X.X.; writing—review and editing, X.X. and S.-H.O.; project administration, Y.-S.K. All authors have read and agreed to the published version of the manuscript.

Funding

This work was supported by the Ministry of Education of the Republic of Korea and the National Research Foundation of Korea (NRF-2019R1A2C1011224).

Conflicts of Interest

The authors declare no conflict of interest.

References

  1. Iseki, H.; Kato, K.; Sakamoto, S. Flexible and Incremental Sheet Metal Bulging Using a Path-Controlled Spherical Roller. Trans. Jpn. Soc. Mech. Eng. 1992, 58, 3147–3155. [Google Scholar] [CrossRef] [Green Version]
  2. Ham, M.; Jeswiet, J. Single Point Incremental Forming and Forming Criteria for AA3003. CIRP Ann. Manuf. Technol. 2006, 55, 241–244. [Google Scholar] [CrossRef]
  3. Minutolo, F.C.; Durante, M.; Formisan, A.; Langella, A. Evaluation of the Maximum Slope Angle of Simple Geometries Carried Out by Incremental Forming Process. J. Mater. Process. Technol. 2007, 2, 365–376. [Google Scholar] [CrossRef]
  4. Jeswiet, J.; Szekeres, A. Forces in single point incremental forming. Trans. N. Am. Manuf. Res. Inst. 2005, 33, 399–403. [Google Scholar]
  5. Duflou, J.; Tunckol, Y.; Szekeres, A.; Vanherck, P. Experimental study on force measurements for single point incremental forming. J. Mater. Process. Technol. 2007, 189, 65–72. [Google Scholar] [CrossRef]
  6. Filice, L.; Ambrogio, G.; Micari, F. On-line control of single point incremental forming operations through punch force monitoring. CIRP Ann-Manuf. Technol. 2006, 55, 245–248. [Google Scholar] [CrossRef]
  7. Ambrogio, G.; Cozza, V.; Filice, L. An analytical model for improving precision in single point incremental forming. J. Mater. Process. Technol. 2007, 191, 92–95. [Google Scholar] [CrossRef]
  8. Durante, M.; Formisano, A.; Langella, A. Comparison between analytical and experimental roughness values of components created by incremental forming. J. Mater. Process. Technol. 2010, 210, 1934–1941. [Google Scholar] [CrossRef]
  9. Fiorentino, A.; Feriti, G.C.; Giardini, C.; Ceretti, E. Part precision improvement in incremental sheet forming of not axisymmetric parts using an artificial cognitive system. J. Manuf. Syst. 2015, 35, 215–222. [Google Scholar] [CrossRef]
  10. Hamilton, K.; Jeswiet, J. Single point incremental forming at high feed rates and rotational speeds: Surface and structural consequences. CIRP Ann.-Manuf. Technol. 2010, 59, 311–314. [Google Scholar] [CrossRef]
  11. Park, J.G.; Kim, J.H.; Park, N.W.; Kim, Y.S. Study of Forming Limit for Rotational Incremental Sheet Forming of Magnesium Alloy Sheet. Metall. Mater. Trans. A 2009, 41, 97–105. [Google Scholar] [CrossRef]
  12. Otsu, M.; Matsuo, H.; Matsuda, M.; Takashima, K. Friction stir incremental forming of aluminum alloy sheets. Steel Res. Int. 2010, 81, 942–945. [Google Scholar]
  13. Malhotra, R.; Cao, J.; Beltran, M.; Xu, D.; Magargee, J.; Kiridena, V.; Xia, Z.C. Accumulative-DSIF Strategy for Enhancing Process Capabilities in Incremental Forming. CIRP Ann. Manuf. Technol. 2012, 61, 251–254. [Google Scholar] [CrossRef]
  14. Xiao, X.; Kim, C.I.; Lv, X.D.; Hwang, T.S.; Kim, Y.S. Formability and forming force in incremental sheet forming of AA7075-T6 at different temperatures. J. Mech. Sci. Technol. 2019, 33, 3795–3802. [Google Scholar] [CrossRef]
  15. Xiao, X.; Kim, J.J.; Oh, S.H.; Kim, Y.S. Study on the incremental sheet forming of CFRP sheet. Compos.-A Appl. Sci. Manuf. 2021, 141, 106209. [Google Scholar] [CrossRef]
  16. Liu, R.; Lu, B.; Xu, D.; Chen, J.; Chen, F.; Ou, H.; Long, H. Development of novel tools for electricity-assisted incremental sheet forming of titanium alloy. Int. J. Adv. Manuf. Technol. 2016, 85, 1137–1144. [Google Scholar] [CrossRef]
  17. Mohammadi, A.; Vanhove, H.; Van Bael, A.; Duflou, J.R. Towards accuracy improvement in single point incremental forming of shallow parts formed under laser assisted conditions. Int. J. Mater. Form. 2016, 9, 339–351. [Google Scholar] [CrossRef]
  18. Jimma, T.; Kasuga, Y.; Iwaki, N.; Miyazawa, O.; Mori, E.; Ito, K.; Hatano, H. An application of ultrasonic vibration to the deep drawing process. J. Mater. Process. Technol. 1998, 98, 80–81. [Google Scholar] [CrossRef]
  19. Suh, C.M.; Song, G.H.; Suh, M.S.; Pyoun, Y.S. Fatigue and mechanical characteristics of nano-structured tool steel by ultrasonic cold forging technology. Mater. Sci. Eng. A 2007, 443, 101–106. [Google Scholar] [CrossRef]
  20. Mousavi, S.A.A.A.; Feizi, H.; Madoliat, R. Investigations on the effects of ultrasonic vibrations in the extrusion process. J. Mater. Process. Technol. 2007, 187, 657–661. [Google Scholar] [CrossRef]
  21. Mahmoud, A.; Behrouz, B.; Farzaneh, S. Simulation and experimental study of dynamic recrystallization process during friction stir vibration welding of magnesium alloys. Trans. Nonferrous Met. Soc. China 2021, 31, 2626–2650. [Google Scholar] [CrossRef]
  22. Amini, S.; Gollo, A.H.; Paktinat, H. An investigation of conventional and ultrasonic-assisted incremental forming of annealed AA1050 sheet. Int. J. Adv. Manuf. Technol. 2017, 90, 1569–1578. [Google Scholar] [CrossRef]
  23. Li, P.Y.; He, J.; Liu, Q.; Yang, M.S.; Wang, Q.D.; Yuan, Q.L.; Li, Y. Evaluation of forming forces in ultrasonic incremental sheet metal forming. Aerosp. Sci. Technol. 2017, 63, 132–139. [Google Scholar] [CrossRef] [Green Version]
  24. Long, Y.; Li, Y.; Sun, J.; Ille, I.; Li, J.; Twiefel, J. Effects of process parameters on force reduction and temperature variation during ultrasonic assisted incremental sheet forming process. Int. J. Adv. Manuf. Technol. 2018, 97, 13–24. [Google Scholar] [CrossRef]
  25. Maeno, T.; Osakada, K.; Mori, K. Reduction of friction in compression of plates by load pulsation. Int. J. Mach. Tools Manuf. 2011, 51, 612–617. [Google Scholar] [CrossRef]
  26. Ali, S.; Hinduja, S.; Atkinson, J.; Bolt, P.; Werkhoven, R. The effect of ultra-low frequency pulsations on tearing during deep drawing of cylindrical cups. Int. J. Mach. Tools Manuf. 2008, 48, 558–564. [Google Scholar] [CrossRef]
  27. Matsumoto, R.; Kou, J.K.; Utsunomiya, H. Reduction in axial forging load by low-frequency torsional oscillation in cold upsetting. Int. J. Adv. Manuf. Technol. 2017, 93, 933–943. [Google Scholar] [CrossRef]
  28. Meng, D.A.; Zhu, C.C.; Zhao, X.Z.; Zhao, S.D. Applying Low-Frequency Vibration for the Experimental Investigation of Clutch Hub Forming. Materials 2018, 11, 928. [Google Scholar] [CrossRef] [Green Version]
  29. Halicioglu, R.; Dulger, L.C.; Bozdana, A.T. Improvement of metal forming quality by motion design. Robot. Comput.-Integr. Manuf. 2018, 51, 112–120. [Google Scholar] [CrossRef]
  30. Wang, Z.H.; Zhan, W.T.; Hong, X.X. Characteristics of metal flow in cold extrusion under electric-hydraulic chattering. J. Iron Steel Res. Int. 2017, 24, 138–146. [Google Scholar] [CrossRef]
  31. Meng, D.A.; Zhao, X.Z.; Zhao, S.D.; Han, Q.Y. Effects of vibration direction on the mechanical behavior and microstructure of a metal sheet undergoing vibration-assisted uniaxial tension. Mater. Sci. Eng. A 2019, 743, 472–481. [Google Scholar] [CrossRef]
  32. Pham, Q.T.; Lee, B.H.; Park, K.C.; Kim, Y.S. Influence of the post-necking prediction of hardening law on the theoretical forming limit curve of aluminum sheets. Int. J. Mech. Sci. 2018, 140, 521–536. [Google Scholar] [CrossRef]
  33. Xiao, X.; Kim, J.J.; Hong, M.P.; Yang., S.; Kim, Y.S. RSM and BPNN Modeling in Incremental Sheet Forming Process for AA5052 Sheet: Multi-Objective Optimization Using Genetic Algorithm. Metals 2020, 10, 1003. [Google Scholar] [CrossRef]
  34. Kumar, V.C.; Hutchings, I.M. Reduction of the sliding friction of metals by the application of longitudinal or transverse ultrasonic vibration. Tribol. Int. 2004, 37, 833–840. [Google Scholar] [CrossRef]
  35. Do, V.C.; Pham, Q.T.; Kim, Y.S. Identification of forming limit curve at fracture in incremental sheet forming. Int. J. Adv. Manuf. Technol. 2017, 92, 4445–4455. [Google Scholar] [CrossRef]
  36. Li, Y.L.; Wang, Z.J.; Zhai, W.D.; Cheng, Z.N.; Li, F.Y.; Li, X.Q. The influence of ultrasonic vibration on parts properties during incremental sheet forming. Adv. Manuf. 2021, 9, 250–261. [Google Scholar] [CrossRef]
  37. Sedaghat, H.; Xu, W.; Zhang, L.C. Ultrasonic vibration-assisted metal forming: Constitutive modelling of acoustoplasticity and applications. J. Mater. Process. Technol. 2019, 265, 122–129. [Google Scholar] [CrossRef]
Figure 1. Single-point incremental sheet forming (SPIF) for truncated cone.
Metals 12 00346 g001
Figure 2. (a) Forming principle of the LFV-SPIF process, (b) assembly drawing of the tool system, and (c) exploded view of the tool system.
Metals 12 00346 g002
Figure 3. (a) True stress–strain curves of AA1050, (b) Curve fitting by the Kim–Tuan equation.
Metals 12 00346 g003
Figure 4. Microstructural features of the as-received AA1050-O sheet. (a) Inverse pole figure (IPF), (b) Grain boundaries, (c) Grain size distribution, (d) Misorientation angle distribution.
Metals 12 00346 g004
Figure 5. (a) Photograph of the designed LFV-SPIF system and (b) load cell.
Metals 12 00346 g005
Figure 6. (a) VWACF model, (b) Experiment results of AA1050 sheets under different forming conditions.
Metals 12 00346 g006
Figure 7. (a) Cone shape, (b) Profile toolpath.
Metals 12 00346 g007
Figure 8. (a) Measured axial forming force Fz of AA1050 during SPIF process, and (b) the detail forming force behaviors at one forming circle.
Metals 12 00346 g008
Figure 9. (a) Measured axial forming force Fz of AA1050 during the LFV-SPIF process, and (b) the detail forming force behaviors at one forming circle.
Metals 12 00346 g009
Figure 10. Comparison of axial forming force Fz for AA1050.
Metals 12 00346 g010
Figure 11. Axial forming force of each circle under (a) different frequencies, and (b) amplitudes.
Metals 12 00346 g011
Figure 12. Definition of the accuracy error.
Metals 12 00346 g012
Figure 13. Comparison of the measured section for formed shapes of the AA1050 sheet at different frequencies.
Metals 12 00346 g013
Figure 14. Normal accuracy error at different (a) frequencies and (b) amplitudes.
Metals 12 00346 g014
Figure 15. Geometry model of LFAV-SPIF.
Metals 12 00346 g015
Figure 16. Sinusoidal motion of the forming tool.
Metals 12 00346 g016
Figure 17. Time-displacement curves of the forming tool.
Metals 12 00346 g017
Figure 18. (a) Equivalent stress of SPIF and LFV-SPIF. (b) Comparison of the equivalent stress between the SPIF and LFV-SPIF part.
Metals 12 00346 g018aMetals 12 00346 g018b
Figure 19. Influence of different amplitudes on equivalent stress.
Metals 12 00346 g019
Figure 20. Influence of different frequencies on equivalent stress.
Metals 12 00346 g020
Figure 21. (a) Equivalent strain of SPIF and LFV-SPIF. (b) Comparison of the equivalent strain between the SPIF and LFV-SPIF part.
Metals 12 00346 g021
Figure 22. Influence of different amplitudes on equivalent strain.
Metals 12 00346 g022
Figure 23. Influence of different frequencies on equivalent strain.
Metals 12 00346 g023
Figure 24. Thickness distribution under different frequencies.
Metals 12 00346 g024
Figure 25. Thickness distribution under different amplitudes.
Metals 12 00346 g025
Figure 26. (a) Simulated forming force during the SPIF process and (b) the detail forming force behaviors at one forming circle.
Metals 12 00346 g026
Figure 27. (a) Simulated forming force during the LFV-SPIF process and (b) the detail forming force behaviors at one forming circle.
Metals 12 00346 g027
Figure 28. Comparison of the axial forming force Fz of two forming processes.
Metals 12 00346 g028
Figure 29. Axial forming forces Fz at different amplitudes.
Metals 12 00346 g029
Figure 30. Axial forming forces Fz at different frequencies.
Metals 12 00346 g030
Figure 31. Comparison of experimental and simulated results of axial force under (a) different frequencies and (b) amplitudes.
Metals 12 00346 g031
Figure 32. (a) Location division of residual stress of parts, (b) Definition of residual stress direction.
Metals 12 00346 g032
Figure 33. Residual stress distribution of simulation parts. (a) SPIF ( S 11 ). (b) SPIF ( S 22 ). (c) LFV-SPIF: 90 Hz, 0.03 mm ( S 11 ). (d) LFV-SPIF: 90 Hz, 0.03 mm ( S 22 ).
Metals 12 00346 g033
Figure 34. Residual stress distribution of the formed part (a) S 11 , and (b) S 22 .
Metals 12 00346 g034
Figure 35. Residual stress distribution under different frequencies, (a) S 11 , and (b)   S 22 .
Metals 12 00346 g035
Figure 36. Residual stress distribution under different amplitudes, (a) S 11 , and (b)   S 22 .
Metals 12 00346 g036
Figure 37. Method for measuring the normal accuracy error of parts.
Metals 12 00346 g037
Figure 38. Normal accuracy error at different (a) amplitudes and (b) frequencies.
Metals 12 00346 g038
Table 1. Material properties of AA1050.
AA1050 0 ° 45 ° 90 °
Young’s modulus (GPa)6869.468.8
Yield stress (MPa)148.7145.2157.7
Tensile strength (MPa)163.1157.4168.9
Elongation (%)6.35.24.9
Table 2. Calibrated parameters of Kim-Tuan hardening model for AA1050 sheet.
AA1050 0 ° 45 ° 90 °
K T   (MPa)20.8837.5120.85
h 0.1210.2420.149
c 443.66680.12557.37
Table 3. Experiment plan for formability evaluation.
Exp.VibrationLubrication Forming   Angle   ( ° )
1NoNo74.2
2HaveNo78.4
3NoHave78.4
4HaveHave78.4
Table 4. Process and vibration parameters.
Parameter Value
Vibration
parameters
Frequency
(f/Hz)
0306090
Amplitude
(A/mm)
00.010.030.05
Process
parameters
Initial
thickness
(mm)
Forming angle
(°)
Tool
diameter (mm)
Feed rate (mm/min)Step depth (mm)Spindle speed
(rpm)
0.530104000.50
Table 5. Measured normal error at different frequencies (A = 0.03 mm).
FrequencyError 1
(mm)
Error 2
(mm)
Error 3
(mm)
Error 4
(mm)
Average Error
(mm)
0 Hz0.4660.5590.5750.5710.543
30 Hz0.3070.4530.6160.6040.495
60 Hz0.2090.3420.4620.4410.364
90 Hz0.1680.2660.3670.3920.298
Table 6. Measured normal error at different amplitudes (f = 90 Hz).
AmplitudeError 1
(mm)
Error 2
(mm)
Error 3
(mm)
Error 4
(mm)
Average Error
(mm)
0.01 mm0.1960.3450.3750.3510.32
0.03 mm0.1680.2660.3670.3920.298
0.05 mm0.1620.2740.3650.3510.288
Table 7. Simulation conditions.
MeshingSheetS4R
Tool, Holder, DieAnalytical Rigid
Material modelSheetMaterial: AA1050
Elastic modulus = 69 GPa
Density = 2700   kg / m 3
Poisson’s ratio = 0.33
Tool-sheet
Contact conditionHolder-sheetSurface-to-surface
Die-sheet
BoundaryTool3 degrees of freedom (DOF) constraint with the displacement in the X, Y, Z-direction
Holder1 degree of freedom (DOF) constraint with a load force in the Z-direction
DieFixed
Friction coefficientTool-sheet0.05 (SPIF), 0.02 (LFV-SPIF)
Holder-sheet0.15
Die-sheet0.15
Table 8. Comparison of maximum residual stresses between SPIF and LFV-SPIF process (f = 90 Hz and A = 0.03 mm).
SPIFLFV-SPIF (90 Hz, 0.03 mm)
S 11 S 22 S 11 S 22
Maximum tensile stress (MPa)131.6123.594.793.3
Maximum compressive stress (MPa)−161.6−162.5−119.5−114.7
Publisher’s Note: MDPI stays neutral with regard to jurisdictional claims in published maps and institutional affiliations.

