Article

Microstructure and Corrosion Behavior of AISI 316 Steel Layers Deposited on AISI 347 Steel Substrate by Laser Metal Deposition

by
Isabela A. Ligabo
1,2,
Vagner Braga
1,2,
Caroline C. A. Ferreira
1,2,
Rafael H. M. Siqueira
2,
Julio C. Lourenço
3,
Antonio J. Abdalla
1,2 and
Milton S. F. Lima
1,2,*
1
Space Science and Technology Graduate Program, Technological Institute of Aeronautics, Sao Jose dos Campos, Sao Paulo 12228-900, Brazil
2
Photonics Division, Institute for Advanced Studies, Sao Jose dos Campos, Sao Paulo 12228-001, Brazil
3
Department of Materials Engineering, University of Sao Paulo, Lorena, Sao Paulo 12612-550, Brazil
*
Author to whom correspondence should be addressed.
Metals 2022, 12(12), 2161; https://doi.org/10.3390/met12122161
Submission received: 21 October 2022 / Revised: 6 December 2022 / Accepted: 12 December 2022 / Published: 15 December 2022
(This article belongs to the Special Issue Laser Surface Treatment of Metals and Alloys)

Abstract

:
The aim of this work was to evaluate the porosity, microstructure, hardness, and electrochemical behavior of AISI 316 steel layers deposited on an AISI 347 steel substrate using the LMD process. Depositions of two, four, and six layers with a 0.5 mm height for each layer were performed at a speed of 375 mm/min, a power of 250 W, a focal distance of 5 mm, and without overlapping laser tracks. The results showed epitaxial growth of the deposited layers in relation to the substrate and a predominantly austenitic microstructure with ferrite as the substrate. The deposited layers presented a dendritic microstructure with a mean porosity of 4.5%. The porosity decreased as the number of deposited layers increased, affecting the pitting corrosion resistance. The sample with six deposited layers showed greater pitting corrosion resistance, whereas the corrosion current speeds were similar for the studied samples. Vickers hardness tests showed that the hardness decreased as the distance from the substrate increased, and the hardness decreased close to the remelted regions.

1. Introduction

Additive manufacturing (AM) has attracted much attention from industry and researchers owing to its evident advantages, such as the production of parts with complex geometries and short delivery times [1,2] in addition to providing an attractive and effective cost to repair and produce high value-added engineering components [3,4] because it is not necessary to change tools during the manufacture of the component because it is manufactured in a single piece of equipment from start to finish [4,5].
In contrast to conventional subtractive manufacturing methods, laser additive manufacturing (LAM) is based on layer-by-layer manufacturing using heating provided by a laser source [6,7]. The starting point for the manufacturing of the part is a CAD solid model that is created on a computer, generated by an image method, or obtained by reverse engineering [3,8].
Laser metal deposition (LMD) is a laser additive manufacturing process in which the part is built by melting the surface and simultaneously applying a metallic powder or wire [8,9] so that the laser melts the sequential layers of a previously deposited layer on a given substrate [7]. The metal powder is delivered by coaxial, single, or multiple nozzles within an inert atmosphere [4,10,11], directly in the region of the focused laser beam [9]. Depending on the alignment of the focal point of the nozzle versus that of the laser, the powder is then melted either midstream or as it enters the melting pool. The molten material quickly solidifies due to heat dissipation mainly from the substrate and forms a strong metallurgical bond with the surface [4]. Among the LAM processes, LMD is one of the primary LAM technologies for the production of complex-shaped parts with a high strength-to-weight ratio and minimum material wastage [11].
Laser additive manufacturing (LAM) induces repeated heat treatments at high cooling rates, leading to microstructures that are possibly different from those obtained in conventionally manufactured materials [1,8]. The main interactions among the process parameters lead to a complicated thermal history; consequently, various microstructures and mechanical properties can be achieved. For example, high local energy and high scanning speed result in a large thermal gradient and high cooling rates that generate complicated and strong hydrodynamic fluid flows, which has a marked influence on crystal growth and orientation, material spattering, and microstructural defects such as pores and partially melted particles [11,12]. As the layers are deposited, metallurgical problems occur owing to intermittent heat extraction [7], which is generally less along the construction structure of the part than close to the substrate, resulting in a coarsening microstructure as the distance from the substrate increases [13,14]. Thus, the microstructure of parts manufactured by laser additive manufacturing is anisotropic in relation to the construction direction and often exhibits a pronounced texture. Consequently, the properties of the solid are anisotropic and can depend heavily on its orientation [15,16].
Allied to these metallurgical challenges presented by laser additive manufacturing, residual stresses, surface roughness, unmelted particles, and pores are inherent defects in the process which affect the mechanical and fatigue properties of the parts. However, the elimination of these defects results in improved mechanical properties and values comparable to those of molded or forged materials [17,18], which, together with the advantages presented, make the additive manufacturing process even more promising if combined with subtractive technologies for the manufacture of parts with improved finish [5].
Austenitic stainless steels, such as AISI 316 and 347, are particularly interesting for LAM because they are relatively expensive to machine, and near-net shaped structures can be manufactured without appreciable material losses, decreasing the waste of expensive metals such as Ni, Cr, and Mo [7,11]. Austenitic stainless steels are well known for their excellent corrosion resistance owing to their high contents of chromium and nickel, which stimulate the formation of stable and passive oxide layers (Cr2O3) on the surface [19]. For engineering applications, AISI 316 steel presents outstanding intergranular corrosion resistance and good grain corrosion resistance to most chemicals, salts, and acids, and Mo content helps increase the resistance to marine environments [7]. Because austenitic stainless steels have relatively high mechanical properties and better high-temperature performance [4] and are the most metallic materials suitable for laser additive manufacturing [4,19] because there is no martensitic phase transformation and no precipitation during the rapid-solidification process [19], it is necessary to conduct studies on laser additive manufacturing of these stainless steels [4]. In addition, austenitic steels are widely used in various industrial applications, and the manufacture of product from them through laser powder melting is a promising direction [20].
The application of a corrosion protection layer of AISI 316 stainless steel over AISI 347 steel components is an efficient way to increase the lifetime of the components at high temperatures. According to Swaminathan et al. [21], AISI 347 steel tubes suffer from sensitivity corrosion during their years of use. To mitigate this problem, Gnanamuthu et al. [22] proposed the deposition of a Zn-Ni alloy on the surface of a piece of AISI 347 steel with satisfactory results. The present study advances the state of the art by deposition via LMD of a highly corrosion-resistant steel layer (AISI 316) which presents more physical-chemical compatibility than the system proposed by Gnanamuthu.
The aim of this study was to evaluate the porosity, microstructural evolution, hardness, and corrosion behavior of AISI 316 steel layers deposited on an AISI 347 steel substrate using the LMD process. This is a preliminary study, belonging to a theme that aims to apply LMD in repairs and preventive maintenance of stainless steel tubes of aircraft pneumatic systems in order to control the material fatigue life.

2. Materials and Methods

2.1. AISI 347 Stainless Steel Substrate and AISI 316 Stainless Steel Powder

Circular AISI 347 steel substrates and AISI 316 steel powders were used (Gerdau Co., São Paulo, Brazil). The substrate sample was 38 mm in diameter and 5 mm in thickness. Table 1 shows the chemical composition of both the AISI 347 steel substrate and AISI 316 steel powder, with as-received gas-atomized powder sizes ranging from 44 to 106μm in diameter. The chemical composition of the substrate was in agreement with the ASTM A182/A479—UNS S34700 standard, and the chemical composition of the powder was in agreement with the ASTM A240/A240 M—18 standard.

2.2. Laser Metal Deposition (LMD) Process

The LMD process was performed in a DCM 620 5X 5-axis machining center with a working volume of 0.62 × 0.52 × 0.46 m3 belonging to Romi company (Santa Bárbara d’Oeste, São Paulo, Brazil). The laser head was incorporated into the tool magazine, together with a powder sprayer coaxial nozzle, and supplied by the Hybrid Manufacturing Technologies Company [www.hybridmanutech.com, accessed on 14 October 2022], model Ambit (McKinney, TX, USA). A fiber laser doped with ytterbium developed by IPG Photonics (Oxford, MA, USA) was used. The flux rate of the carrier, shielding, and nozzle gases was 3 L/min, laser head speed was 375 mm/min, and power was 250 W. The focal length was fixed at 5 mm, which yielded a spot diameter of 1 mm. Three samples were produced in such a way that two layers were deposited on the first substrate, four layers on the second substrate, and six layers on the third. Each layer was produced with 0.5 mm height, with a laser scan rotation of 90° from one to the other. The aim of creating this 90° rotation between the layers was to reduce the anisotropy along the construction direction of the part and promote better filling between each laser scanning path, resulting in less porosity [5]. This process was performed without overlapping the laser-scanning paths.

2.3. Metallography Procedures

After LMD, the samples were cut transversely using an electrodischarge machine AgieCharmilles (GF Machining Solutions SA, Biel, Switzerland) model FW2U for microstructural and electrochemical analysis. Metallographic preparation included cold mounting, grinding to paper SiC 1200, and polishing with diamond solutions of 6, 3, and 1 µm, followed by final polishing with 0.3 and 0.05 µm alumina suspension. Electrolytic etching was performed by immersion in a solution of 10% oxalic acid and applying a 6 V potential for a period of 1 min, as indicated by the ASTM E407-99 standard. Electrolytic etching was also tested by immersion in a water solution of 40% NaOH, applying a 6 V potential for a period of 20 s, as indicated by ASTM E407-99. Microstructural characterization was performed using optical and scanning electron microscopy, and the porosity was analyzed before etching by optical microscopy. The optical microscope was a ZEISS (Jena, Germany) model Axio Imager.A2m and the scanning electron microscope was a Tescan (Brno, Czech Republic) model Vega3 XM using an Oxford (High Wycombe, UK) EDS (energy-dispersive X-ray spectroscopy) for the chemical analyses.

2.4. Hardness Test

For Vickers hardness testing, indentations were carried out from the last deposited layer towards the substrate, applying a load of 200 gf and 10 s dwell time. The equipment was a FM-800 model from Future-Tech Corp. (Fujisaki, Kawasaki-ku, Japan). The measurements were made by moving the indentator in a zigzag, moving 0.1 mm horizontally and 0.025 mm vertically, as shown in Figure 1. One measurement line was carried out in each processing condition.

2.5. Corrosion Tests

For the electrochemical tests, one sample of the cross-section was taken from each of the following conditions: substrate, two deposited layers, four deposited layers, and six deposited layers to evaluate the behavior of the material in relation to corrosion resistance along the deposited layers. The exposed surface area is approximately 0.56 cm2. The samples were cold molted, ground with SiC paper, cleaned with distilled water, dried, and quickly transferred to a corrosive solution. Electrochemical experiments were performed in a 3.5% NaCl aqueous solution at 25 °C. The resulting solution was not aerated.
Electrochemical corrosion was investigated by monitoring the open-circuit potential over 3 h, followed by electrochemical impedance spectroscopy (EIS) at the OCP, and lastly the potentiodynamic measurements were carried on each sample (Solartron Analytical, Farnborough, UK). The measurements were performed using a three-electrode system, where the test specimen was employed as the working electrode (WE), the reference electrode (RE) was a saturated calomel electrode (SCE, Hg/Hg2Cl2/ESCE = +0.242 V/SHE, Standard Hydrogen Electrode), and the counter electrode (CE) was a platinum foil with 12 cm² of area, which gave a CE:RE ratio of approximately 24. The measurements were performed in triplicate for each condition. Additionally, in each triplicate, EIS measurements were carried out three times.
For the EIS measurements, the potentiostatic mode was used, acquiring at the OCP the EIS data in the range of 0.01–10 kHz, applying an AC sinusoidal perturbation of 10 mV (rms), and collecting 10 data points per decade.
Potentiodynamic polarization was conducted with low potential sweep rate (0.001 V/s) from Ecorr—0.5 VSCE to 2 VSCE to test the passive film stability under anodic polarization. The corrosion potential (Ecorr) was deduced from the open-circuit potential vs. time (potential value after 3 h), and the corrosion current density (icorr) was estimated from the Tafel plot (potentiodynamic polarization) by extrapolation of both cathodic and anodic curves until E (i = 0). The devices used were an electrochemical interface, SOLARTRON mod. 1287 A, and frequency response analyzer SOLARTRON mod. 1260 A, controlled by the Ecorr/Z plot SOLARTRON mod. 125587S software (Farnborough, UK). Data acquisition and analyses were performed using CorrView v.10 and Zview v.7.1 software (SOLARTRON, Farnborough, UK) and presented using Origin 2020 software (Origin Lab, Northampton, MA, USA).

3. Results and Discussion

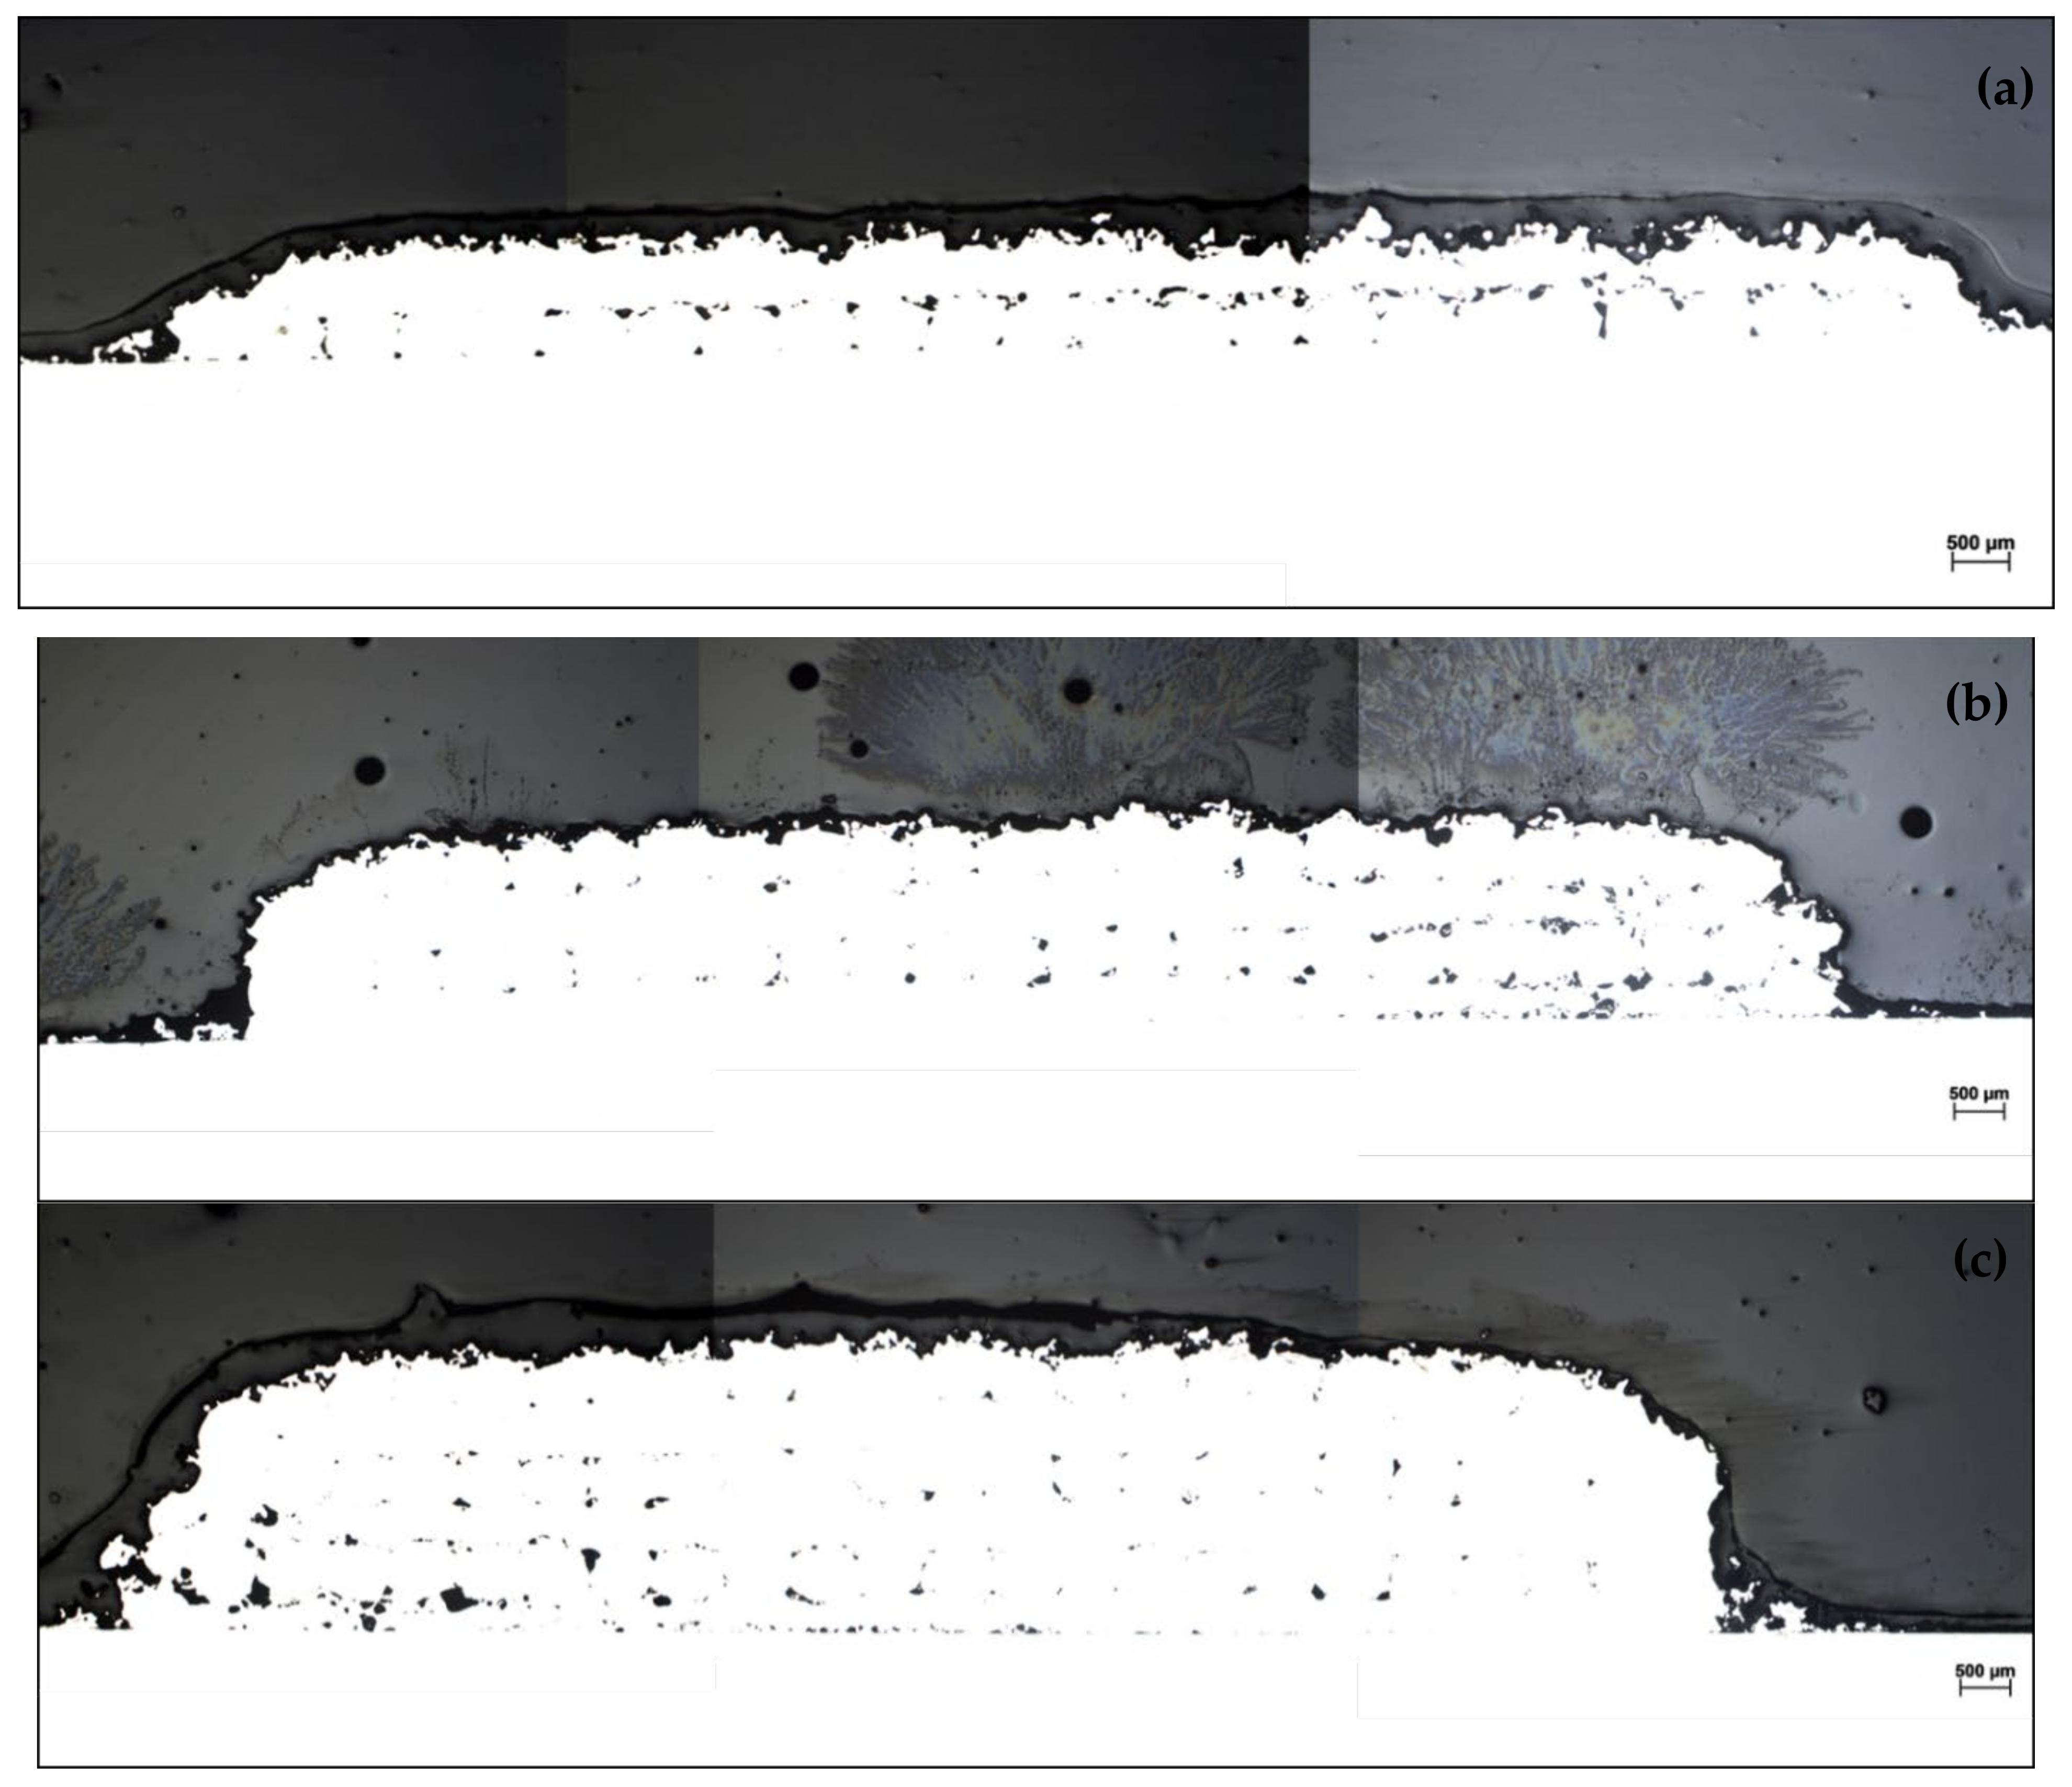
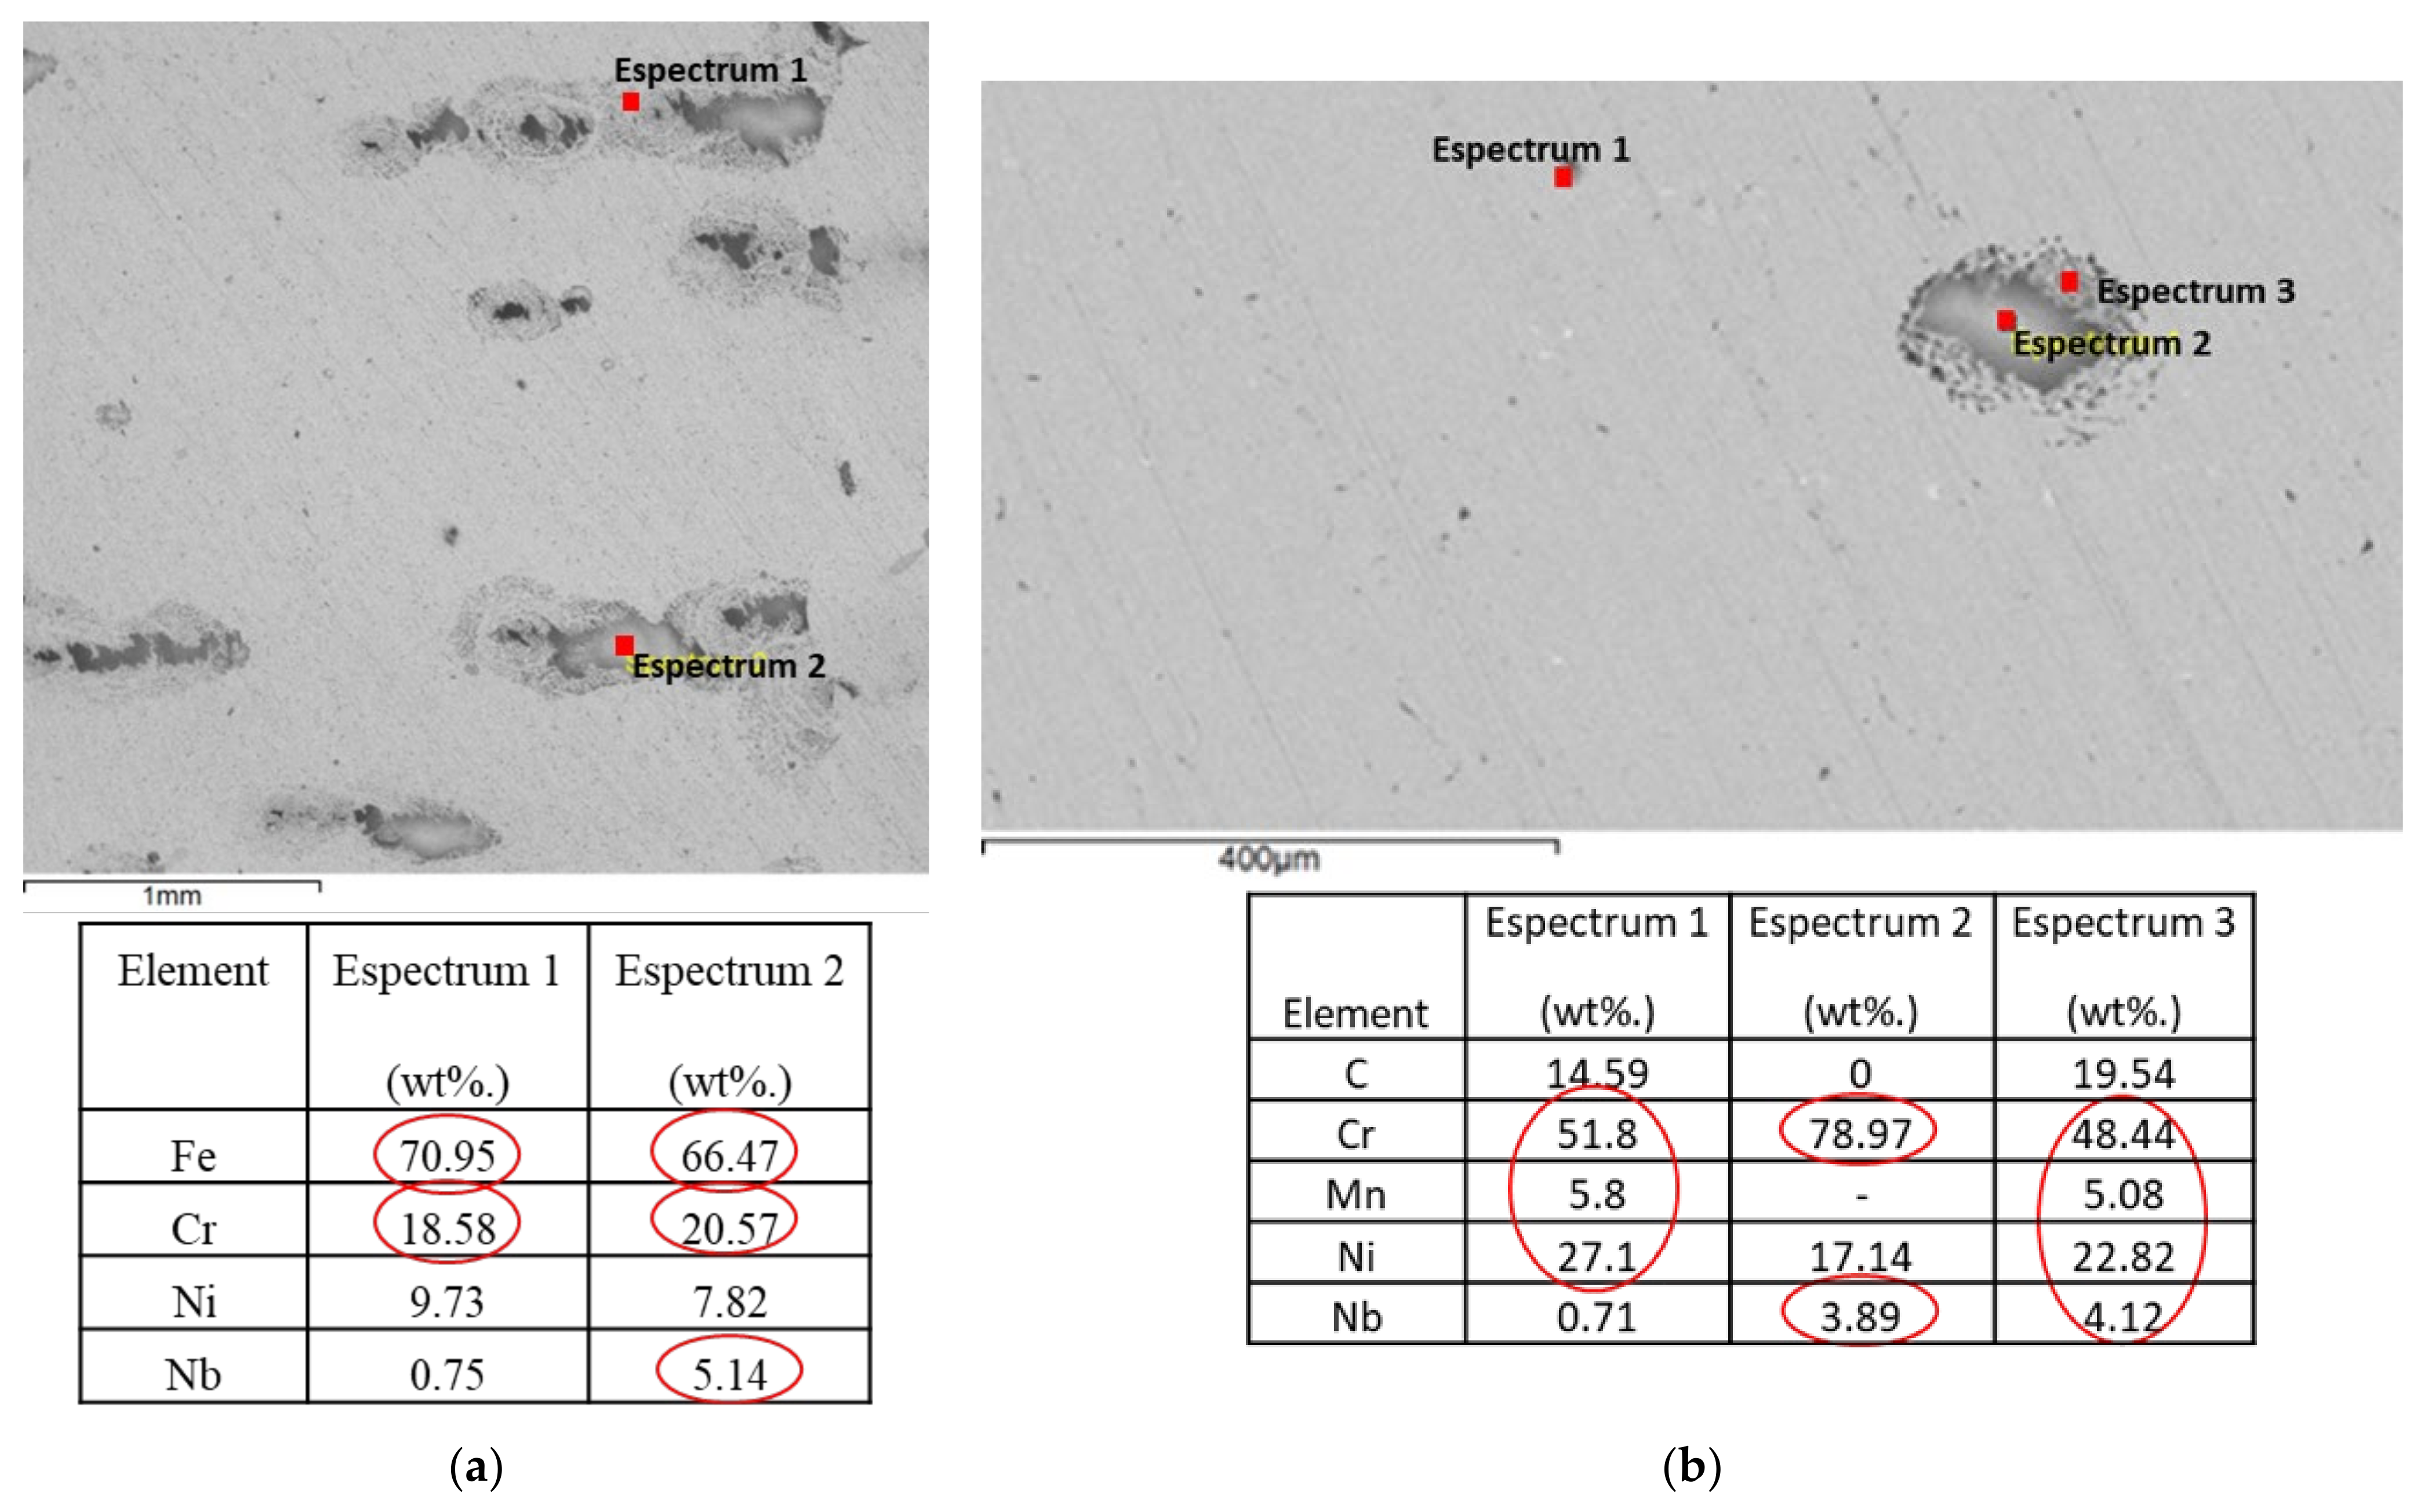
3.1. Microstructural Analyses

Figure 2 presents the image compositions obtained by optical microscopy for porosity analysis. The average layer porosity, measured by the IMAGE J v.1.15a (National Institutes of Health, Bethesda, MD, USA) tool, was 4.5% (4.65 ± 0.05% for the two-deposited-layer sample, 4.44 ± 0.04% for the four-deposited-layer sample, and 4.32 ± 0.08% for the six-deposited-layer sample), indicating that new depositions with overlapping laser paths must be performed to reduce the porosity. When the hatch spacing is reduced, remelting of the solidified region is a strategy to maintain the density despite the high scan speed. In LAM, pore formation can also be controlled by optimizing the process parameters, that is, laser scan speed or laser power. Pores can also be created between unmelted or incompletely melted powder particles owing to the lack of melting [23]. The porosity works like a stress concentrator, affecting the mechanical properties and fatigue performance of the material.
The microstructure revealed by 10% oxalic acid electrolytic etching (Figure 3a–c) showed a predominance of austenitic grains and small portions of the ferrite phase (white regions) for the substrate. The heat-affected zone (HAZ) was approximately 60 μm in size for all three samples. In LMD, the cooling rates tend to be high because the area where the laser beam heats is relatively small. Consequently, smaller heat-affected zones and finer microstructures can be obtained in comparison with conventionally cast samples [23]. The dilution was measured as the total depth of the first deposited layer in the base material in accordance with Lima and Sankaré [7]. The dilutions for the two-layer and four-layer samples were 0.07 ± 0.02 mm and 0.05 ± 0.01 mm, respectively. For the six-layer sample, there was practically no dilution, as can be seen in Figure 3b, and consequently, this could not be measured.
The microstructure revealed by 40% NaOH electrolytic etching (Figure 3d,e) shows austenite (bright areas) and delta ferrite (dark areas) for the deposited layers. This etching is indicated by the ASTM E407-99 standard to reveal the delta ferrite. Because AISI 316 is an austenitic stainless steel, austenite forms extensively and is the primary phase formed during the solidification process. Subsequently, the rejection of solute at the solidifying interface enriches the intercellular regions with chromium and molybdenum [14], which are stabilizing elements of delta ferrite [11]. Therefore, the boundaries outline the austenite cells by etching darker than the interior of the cells owing to the compositional variations caused by microsegregation [14]. A high cooling rate and temperature gradient in the LAM process cause the formation of columnar grains and delta-ferrite [24] The presence of ferrite in the deposit is due to the high cooling rate, which leads to an incomplete delta-ferrite-to-austenite transformation when fully solidified [25,26].
Table 2 shows the EDS analysis of the composition of the AISI 316 steel-deposited layers. Compared to the original composition of the powder (Table 1), it could be seen that the C, Si, Mn, and Mo contents did not change appreciably. The Cr and Ni contents also did not undergo considerable alteration, which is an essential factor for the corrosion resistance and austenite stabilization. However, as a concern remains regarding the detrimental effects of delta ferrite on corrosion properties, a Schaeffler diagram can be used to analyze the tendency toward a duplex structure [7]. For this, the equivalent contents of Cr and Ni were calculated using the formulas reported in the x- and y-axis in Figure 4. Figure 4 presents the Schaeffler diagram, together with the chemical compositions of the powder (P), substrate (S), and deposited layers (C), as listed in Table 1 and Table 2. The composition of the powder and deposited layers is situated inside the ferrite + austenite range in the 0–5% ferrite zone, indicating a delta ferrite formation in the regions revealed by electrolytic etching with NaOH solution (Figure 3d,e). The chemical composition of the AISI 347 steel is also situated in the ferrite + austenite range in the 0–5% ferrite zone, consistent with what is shown in Figure 3a).
As shown in Figure 3, the AISI 316 steel layers exhibited a dendritic microstructure. The transition from one layer to another is easily detected. Because each layer was deposited with a 90° rotation relative to the previous layer, some of the layers presented a melt pool with curved edges, a behavior induced by the laser’s Gaussian energy distribution, whereas in the posterior layer, the melt pool presented flat edges [11]. Figure 3c shows epitaxial growth, characterized by the continuity of the substrate crystalline structure of the deposited material [5]. This indicates metallurgical bonding of the deposited layer on the substrate, which depends on the thermal gradient and growth speed [7,27]. The concentric lines noted in Figure 3c,d are typical of the solidification front, which advances in waves instead of a constant pattern owing to the solidification enthalpy [7].
In laser processing, high thermal gradients induce columnar rather than equiaxial grain growth [7]. As can be seen in Figure 3, along the directions orthogonal to the curved melt pool, the temperature gradients were intense and clearly oriented. This results in directional growth of the dendrites (i.e., mushy zone) from the melt pool borders and convergence towards the center of the melt pool. In contrast, at such locations, the heat transfer is not preferentially oriented, and equiaxed dendrites are more likely to form [11].
Figure 5 shows an SEM image of the deposited layers, reinforcing what was observed using optical microscopy. In general, a dendritic microstructure with columnar growth morphology predominates near the interface of the molten pool, growing towards the center of the melt pool, which is clearly shown in Figure 5. Around the center, there is also a small fine equiaxed structure zone, which is the cross-section of columnar dendrites parallel to the laser travel direction [14,28].

3.2. Hardness Testing

Figure 6 shows the variation in hardness along the layers for each sample, starting with the base material (BM) and passing through the heat-affected zone (HAZ). The hardness of the deposited layers decreases as their distance from the substrate increases, owing to heat accumulation and mass build-up during deposition. In addition, the higher temperature of previously deposited layers decreases the cooling rate by decreasing the thermal gradient between the melt pool and surrounding solid [14]. Consequently, the heat extraction is lower along the construction structure of the part than near the substrate [13]. The samples with four and six depositions showed a hardness decrease in the layer transition near the remelting zones because the cooling rates in these zones are rather slow [4].

3.3. Corrosion Tests

3.3.1. Open Circuit Potential (OCP) and Potentiodynamic Polarization

The OCP vs. exposure time curves in 3.5% NaCl water solution at 25 °C (Figure 7) showed a similar behavior for all the samples, with increasing potential values as a function of time, indicating the formation of a protective oxide layer, except for the two- and four-deposited-layer samples, which showed a breakdown of this protective layer followed by repassivation.
The final OCP values for all samples (Table 3) presented values of approximately −0. 13 V/SCE, with less than 30 mV of difference between each sample, indicating similar values in terms of nobility. For the six-layer condition, the beginning of the OCP presented more positive values compared to other samples, which occurred possibly due to differences in the coating composition, due to less dilution in the surface of this sample, which increased the amounts of nobler elements, such as Cr and Ni, meaning that this sample presented a higher nobility than the other two in lower OCP time. After 3 h, however, samples presented similar OCP values, meaning that no difference in the nobility was observed.
Figure 8 shows the potentiodynamic polarization curves for the samples in a 3.5% NaCl water solution at 25 °C. In the cathodic region of these curves, the reactions are controlled by oxygen reduction, according to reaction (1):
O2 + 2H2O + 4e  4OH
The anodic region of the curves presents a similar behavior in the range (−0.10 ~ −0.25) V/SCE, with passive current values like those of the substrate. In the region close to +0.10 V/SCE, there is a pronounced layer break for the two- and four-deposited-layer samples, as evidenced by the fast increase in currents as the potential increased. For the six-deposited-layer samples, this break is not very evident, which suggests that for this condition at potentials higher than +0.10 V/SCE, the breakdown of the passive layer is not sudden, suggesting that the layer is still trying to repassivate [28,29].
Table 4 shows the values extracted from the potentiodynamic polarization curves for the different studied samples, where icorr is the corrosion current density obtained by extrapolating the Tafel cathodic straight line, Eb is the anodic curve breakdown potential, Ecorr is the corrosion potential, βc is the slope of the Tafel line cathodic region, and βα is the slope of the Tafel line anodic region. In general, all samples showed low corrosion current densities, indicating low corrosion rates. The corrosion potential was very close for the deposition samples, presenting an average Ecorr of −131 ± 7 mV, which can be explained by the fact that the deposition samples have similar chemical compositions [26], which differs from the substrate sample. For the samples with depositions, the six-layer sample showed the lowest icorr, the highest Eb, and the highest passive behavior (Eb − Ecorr), indicating a better corrosion performance for its protective layer. However, the higher βα value for the substrate indicates that a greater amount of material was removed after the breakdown potential [29] during anodic polarization, which is consistent with its higher corrosion density.

3.3.2. Electrochemical Impedance Spectroscopy (EIS)

The impedance spectra reflect the dielectric behavior, oxidation–reduction reactions, and mass transfer at the electrochemical interface (EI). Each corrosive solutionelectrode material system had a specified EI. The fitting of the impedance data is performed through an equivalent electrical circuit that describes EI [30]. Figure 9 shows the electrical equivalent circuit model that best fits the experimental impedance data obtained in this study. This equivalent circuit chosen for this study was based on the literature review. It is known that stainless steel usually suffers from pitting corrosion in NaCl medium, and, according to Hou et al. [31], who studied pitting corrosion in Cl-containing medium at different temperatures for the pitting in 316 L stainless steels, the proposed equivalent circuit describes a system for non-coated steels with resistance against pitting corrosion due to passive-formed layers. The equivalent circuit elements are Re, which represents the electrolite resistance; Rf, which represents the material’s oxide film resistance, which is strongly dependent on the properties of the passivating layer; and Rpit, which represents the charge transfer resistance on the surface, which is normally associated with the formation of pits [31]. Because Rpit occurs at lower frequency values, this value has a stronger influence on the total system impedance; therefore, the higher the Rpit value, the lower the corrosion rate and the better the corrosion resistance. CPEf is the capacitance related to the passive film and CPEpit is the capacitance related to the charge transfer in the pits formed in this system. Constant phase elements (CPEs) are used instead of capacitors because these elements have the flexibility to adjust to non-homogeneous electrochemical systems with the dispersion of chemical properties over the surface of the sample, which is normally observed in pores, cracks, grain boundaries [30], precipitates, and different phases. The n values in the CPEs are obtained by adjusting the constant phase elements, which vary from −1 to 1, where −1 indicates inductive layer behavior, 0 indicates resistive behavior, and 1 indicates capacitive layer behavior. For the layer that governs the polarization of the material, Rf, CPEf, and nf exhibit capacitive behavior (n close to 1).
The electrochemical impedance spectroscopy (EIS) measurements (Figure 10) are shown in the Bode plots diagrams for the substrate and deposited-layer samples. Table 5 lists the electrical parameters calculated using the equivalent electrical circuit model. The fitting curve for the parameters shown in Table 5 is also shown in Figure 9. The χ² is a value that represents the quality of the adjustment, which shows that for this study the fitting quality is good, in the range of 10−4.
The analysis of the fitting results obtained in Table 5 shows that the electrolyte resistance is fairly similar for all studied samples, around 5–6 Ω cm2, which is a typical value for non-resistive electrolytes, such as NaCl. For the CPEf and nf, similar values for all samples are observed, around 40–50 µ Ω cm−2·sn, meaning that the capacitance of the film is very similar and fairly capacitive, presenting an n of 0.92~0.93. The resistance of the film is interesting, however, showing that the four-layer sample has a much higher value (164.65 Ω cm2) than the other samples, meaning that this condition has a greater resistance capacitive layer.
When observing the pitting resistance elements, it is observed that CPEpit and npit also presented similar values, with CPEpit in the range of 15–20 µ Ω cm−2 sn and npit in the range of 0.59–0.67, with exception of the four-layer sample, which presented lower CPEpit, which means that this condition led to a more interesting condition in terms of corrosion resistance. The n values also indicate fairly capacitive conditions for the pitting charge-transfer process.
The values of Rpit, however, are very important in this analysis. It is observed that the Rpit is much higher for the substrate, which indicates a high resistance against corrosion compared to other studied conditions. This agrees with the potentiodynamic polarization, and hence the Eb value for the substrate is much higher than for the other samples. The sample with four deposited layers showed higher Rpit values compared to the samples with two and six deposited layers.
The four-deposited-layer samples also showed the highest value of resistance, Rf, and the substrate showed the lowest value, followed by the six-deposited-layer samples.
The porosities and lack of adhesion between the layers can generate electrolyte stagnation sites, which can lead to a stabilized pit with a local increase in chloride ions and acidification located at the bottom of these sites, which leads to this possible explanation for the observed differences. Schaller et al. [32] showed that the pores from the lack of melting acted as preferred passivation breakdown sites in 304 L stainless steel samples processed by selective laser melting because the geometry of the pores is similar to that of the crevices.
The impedance module |z| at a low frequency (0.01 Hz) is an indirect indication of the corrosion resistance of the samples, and this value is quite accurate because the measurement implies small disturbances (10 mV) around the sample equilibrium. Electrochemical impedance spectroscopy showed values for the impedance modulus |z| similar to the corrosion current densities (icorr) for all the samples, indicating that the corrosion resistance is similar for all the samples.
It is possible to observe similar phase angle behaviors for the samples (Figure 10b). In most cases, there are two maxima for the phase angles, which normally represent a corrosion process governed by polarization and charge transfer processes. The substrate sample showed the highest phase angle at a low frequency (0.01 Hz), which increased the total impedance of the system, which was explained by a more stable protective layer. The samples with two and four deposited layers showed a slightly higher phase angle in the range of (10−1–10) Hz, which indicates that, in this frequency range, there is some resistance to the current passage greater than the six-deposited-layer and the substrate samples. The sample with two deposited layers exhibited the lowest phase angle at a low frequency (0.01 Hz).

3.3.3. Morphological Analysis after Electrochemical Tests

Figure 11 shows the micrographs obtained by SEM after the EIS measurements. For the deposited layers of AISI 316 steel, small pitting points or relatively larger pits were observed, which spread superficially around the pores. Research has considered porosity as the main influence on the material corrosion behavior [33,34,35], and, in general, layers of 316 L stainless steel obtained by additive manufacturing show morphological surface corrosion [29]. For the AISI 347 steel substrate, parallel bands of pits were observed at regular intervals, as reported by Ganesh et al. [36] for 316 L steel. The pits formed along the substrate showed a deep attack, as observed by Revilla et al. [29] for wrought 316 L steel.
Energy-dispersive spectroscopy (EDS) analyses of the substrate were performed to understand the regular distribution of pits on the substrate. The EDS analysis in Figure 12 shows an appreciable amount of Nb and C in spectrum 2, indicating that this phase is probably NbC. The addition of Nb to AISI 347 steel leads to the formation of NbC in annealed and aged materials [37]. There was no history of the AISI 347 steel received for this study, which was used as a substrate. The technical data sheet shows that the material melted without further heat treatment. However, according to the microstructure revealed for the substrate (Figure 3a) and the average hardness values obtained (minimum of 214 HV and maximum of 224 HV), whose minimum and maximum limits specified by ASTM A240 are 185 and 210 HV, respectively, the values obtained by Ganesh et al. [36] ranged from 210 to 225 HV for wrought and annealed samples, and it is assumed that the material received for the substrate was annealed. For spectra 3, 4, and 6, there was an appreciable amount of Fe and a certain concentration of Nb (greater than twice that indicated in the chemical composition of the substrate; see Table 2, which may indicate the formation of the Laves phase (Fe2Nb), an intermetallic phase, reported in AISI 347 steels aged at high temperatures or at temperatures between 650 and 800 °C after 1000 h [37]. Spectrum 5 indicates a high concentration of C, which may have come, for example, from the manipulation of the specimens or due to contamination from the pumping equipment.
Figure 13 shows the EDS analyses performed on a substrate sample after the EIS measurements. The analyses covered regions located in pits and clusters of smaller pits around the larger pits. According to the EDS analysis in Figure 13a, an appreciable concentration of Fe and an increase in the concentration of Cr are observed in spectrum 1 compared to Table 1, which may indicate σ-phase (FeCr) formation. The addition of Nb to AISI 347 steel can also generate the formation of the σ phase, an intermetallic phase formed after exposing the steel to high working temperatures for a long period of time or to a high temperature during welding processes [37] and laser additive manufacturing. The cyclic reheating generated by the LMD process can affect the microstructure of the processed part. In the case of austenitic stainless steels, if local temperatures are maintained between 600 and 950 °C for long periods, the formation of the σ phase and carbides can occur, which, if formed in excess, can reduce ductility and corrosion resistance [38]. Spectrum 2 also reveals high levels of Fe and Nb and an increase in the Cr content, which may indicate the presence of the σ or Laves phase. The EDS analysis in Figure 13b shows high levels of Cr, Ni, and Mn for spectrum 1, referring to a pit point; high levels of Cr and Nb for spectrum 2, referring to a pit; and high levels of Cr, Nb, Ni, and Mn for spectrum 3, referring to a cluster of smaller pits around a large pit. The high contents of Cr and Ni in these regions indicate the presence of the σ phase, and the high content of Nb indicates the presence of the Laves phase. The Laves phase is known to be nobler than the matrix, which can lead to localized corrosion in the samples, generating a possible site for the initiation of pitting around these phases.
As discussed earlier, the microstructure (Figure 3a) and Schaeffler diagram (Figure 4) revealed a predominantly austenitic microstructure with ferrite as the substrate. During annealing or aging of steels, the grain boundaries are enriched with chromium and other ferrite-forming elements. For stainless steels stabilized with Ti or Nb, as in the case of AISI 321 and AISI 347 steels, the austenite region close to the grain boundaries contains a high concentration of ferrite-forming elements, which can form ferrite, as occurs for steel used as a substrate. In the subsequent aging stage, this ferrite can transform into the σ-phase at the grain boundaries [37].
The morphology and regular distribution of corrosion pits in the substrate indicate that they started at the interface between the ferrite and austenite phases, as observed by Ganesh et al. [36], and they may have started in the NbC distributed along the substrate and in the possible presence of σ and Laves phases [37].

4. Conclusions

AISI 316 powder was successfully deposited on an AISI 347 substrate via LMD. Based on the results of this study, the following conclusions were drawn.
  • The metallographic analyses performed in this preliminary study revealed a predominantly austenitic microstructure in the presence of ferrite for the AISI 347 steel substrate and a dendritic microstructure for the deposited AISI 316 steel layers, whose chemical composition belongs to the austenite + ferrite region of the Schaeffler diagram, with the possible formation of delta ferrite, as revealed in the electrolytic attack with NaOH.
  • The hardness analysis of the deposited layers showed that, owing to the accumulation of heat and mass during the deposition, the hardness values decreased with distance from the substrate, and the samples with four and six depositions showed a hardness reduction in the layer transition close to the remelting regions.
  • The electrochemical tests showed that the four-layer sample presented a higher resistance in relation to the two- and six-layer samples in terms of active sites for localized corrosion.
  • In general terms of corrosion current speed, it can be said that they are similar for the deposited-layer samples since they presented similar values of icorr and impedance modulus at a low frequency (0.01 Hz). The AISI 347 steel exhibits good corrosion and pitting resistance, which explains the electrochemical responses of the substrate.
  • The deposited layers of AISI 316 steel showed a superficial corrosion morphology characterized by small pitting points or relatively larger pits spread superficially around the pores. The AISI 347 steel substrate showed parallel bands of pits at regular intervals, which must have started at the ferrite and austenite phase interfaces, as well as in the NbC distributed along the substrate and in the possible presence of the σ and Laves phases.

Author Contributions

Conceptualization, methodology, validation, formal analysis investigation, I.A.L., V.B., C.C.A.F. and R.H.M.S.; writing—original draft preparation, M.S.F.L.; writing—review and editing, M.S.F.L.; visualization, J.C.L.; supervision, A.J.A.; project administration, A.J.A.; J.C.L.; funding acquisition, M.S.F.L. All authors have read and agreed to the published version of the manuscript.

Funding

This research was funded by São Paulo Research Foundation grant number [2016/11309-0] and Coordenação de Aperfeiçoamento de Pessoal de Nível Superior—Brasil (CAPES)—Finance Code 001.

Data Availability Statement

The study did not report any data.

Acknowledgments

Thanks are due to the ROMI company for technical support.

Conflicts of Interest

The authors declare no conflict of interest.

References

  1. Baufeld, B.; Van der Biest, O.; Gault, R. Additive manufacturing of Ti–6Al–4V components by shaped metal deposition: Microstructure and mechanical properties. Mater. Des. 2010, 31, S106–S111. [Google Scholar] [CrossRef]
  2. Kranz, J.; Herzog, D.; Emmelmann, C. Design guidelines for laser additive manufacturing of lightweight structures in TiAl6V4. J. Laser Appl. 2015, 27, S14001. [Google Scholar] [CrossRef]
  3. Wilson, J.M.; Piya, C.; Shin, Y.C.; Zhao, F.; Ramani, K. Remanufacturing of turbine blades by laser direct deposition with its energy and environmental impact analysis. J. Clean. Prod. 2014, 80, 170–178. [Google Scholar] [CrossRef]
  4. Zhang, K.; Wang, S.; Liu, W.; Shang, X. Characterization of stainless steel parts by Laser Metal Deposition Shaping. Mater. Des. 2014, 55, 104–119. [Google Scholar] [CrossRef]
  5. Volpato, N.; Munhoz, A.L.J.; Costa, C.A.; Ahrens, C.H.; de Carvalho, J.; dos Santos, J.R.L.; da Silva, J.V.L.; Foggiatto, J.A.; Lima, M.S.F. Manufatura Aditiva–Tecnologias e Aplicações da Impressão 3D, 1st ed.; Blucher: Sao Paolo, SP, Brazil, 2017; 400p. [Google Scholar]
  6. Emmelmann, C.; Kranz, J.; Herzog, D.; Wycisk, E. Laser additive manufacturing of metals. In Laser Technology in Biomimetics; Schmidt, V., Ed.; Springer: Berlin/Heidelberg, Germany, 2013; pp. 143–161. [Google Scholar]
  7. Lima MS, F.; Sankaré, S. Microstructure and mechanical behavior of laser additive manufactured AISI 316 stainless steel stringers. Mater. Des. 2014, 55, 526–532. [Google Scholar] [CrossRef]
  8. Herzog, D.; Seyda, V.; Wycisk, E.; Emmelmann, C. Additive manufacturing of metals. Acta Mater. 2016, 117, 371–392. [Google Scholar] [CrossRef]
  9. Durejko, T.; Ziętala, M.; Polkowski, W.; Czujko, T. Thin wall tubes with Fe3Al/SS316L graded structure obtained by using laser engineered net shaping technology. Mater. Des. 2014, 63, 766–774. [Google Scholar] [CrossRef]
  10. Frazier, W.E. Metal Additive Manufacturing: A Review. J. Mater. Eng. Perform. 2014, 23, 1917–1928. [Google Scholar] [CrossRef]
  11. Saboori, A.; Aversa, A.; Bosio, F.; Bassini, E.; Librera, E.; De Chirico, M.; Biamino, S.; Ugues, D.; Fino, P.; Lombardi, M. An investigation on the effect of powder recycling on the microstructure and mechanical properties of AISI 316L produced by Directed Energy Deposition. Mater. Sci. Eng. A 2019, 766, 138360. [Google Scholar] [CrossRef]
  12. Khairallah, S.A.; Anderson, A.T.; Rubenchik, A.; King, W.E. Laser powder-bed fusion additive manufacturing: Physics of complex melt flow and formation mechanisms of pores, spatter, and denudation zones. Acta Mater. 2016, 108, 36–45. [Google Scholar] [CrossRef]
  13. Majumdar, J.D.; Pinkerton, A.; Liu, Z.; Manna, I.; Li, L. Microstructure characterisation and process optimization of laser assisted rapid fabrication of 316L stainless steel. Appl. Surf. Sci. 2005, 247, 320–327. [Google Scholar] [CrossRef]
  14. Zheng, B.; Zhou, Y.; Smugeresky, J.; Schoenung, J.; Lavernia, E. Thermal Behavior and Microstructure Evolution during Laser Deposition with Laser-Engineered Net Shaping: Part II. Experimental Investigation and Discussion. Met. Mater. Trans. A 2008, 39, 2237–2245. [Google Scholar] [CrossRef]
  15. Carroll, B.E.; Palmer, T.A.; Beese, A.M. Anisotropic tensile behavior of Ti–6Al–4V components fabricated with directed energy deposition additive manufacturing. Acta Mater. 2015, 87, 309–320. [Google Scholar] [CrossRef]
  16. Thijs, L.; Sistiaga, M.L.M.; Wauthle, R.; Xie, Q.; Kruth, J.-P.; Van Humbeeck, J. Strong morphological and crystallographic texture and resulting yield strength anisotropy in selective laser melted tantalum. Acta Mater. 2013, 61, 4657–4668. [Google Scholar] [CrossRef] [Green Version]
  17. Brandl, E. Microstructural and Mechanical Properties of Additive Manufactured Titanium (Ti-6Al-4V) Using Wire. Ph.D. Thesis, TU Cottbus, Cottbus, Germany, 2010. [Google Scholar]
  18. Leuders, S.; Thöne, M.; Riemer, A.; Niendorf, T.; Tröster, T.; Richard, H.A.; Maier, H.J. On the mechanical behaviour of titanium alloy TiAl6V4 manufactured by selective laser melting: Fatigue resistance and crack growth performance. Int. J. Fatigue 2013, 48, 300–307. [Google Scholar] [CrossRef]
  19. Godec, M.; Donik, C.; Kocijan, A.; Podgornik, B.; Balantič, D.S. Effect of post-treated low-temperature plasma nitriding on the wear and corrosion resistance of 316L stainless steel manufactured by laser powder-bed fusion. Addit. Manuf. 2019, 32, 101000. [Google Scholar] [CrossRef]
  20. Zhukov, A.; Deev, A.; Kuznetsov, P. Effect of Alloying on the 316L and 321 Steels Samples Obtained by Selective Laser Melting. Phys. Procedia 2017, 89, 172–178. [Google Scholar] [CrossRef]
  21. Swaminathan, J.; Singh, R.; Gunjan, M.K.; Mahato, B. Sensitization induced stress corrosion failure of AISI 347 stainless steel fractionator furnace tubes. Eng. Fail. Anal. 2011, 18, 2211–2221. [Google Scholar] [CrossRef]
  22. Gnanamuthu, R.M.; Mohan, S.; Saravanan, G.; Lee, C.W. Comparative study on structure, corrosion and hardness of Zn–Ni alloy deposition on AISI 347 steel aircraft material. J. Alloy. Compd. 2012, 513, 449–454. [Google Scholar] [CrossRef]
  23. Fayazfar, H.; Salarian, M.; Rogalsky, A.; Sarker, D.; Russo, P.; Paserin, V.; Toyserkani, E. A critical review of powder-based additive manufacturing of ferrous alloys: Process parameters, microstructure and mechanical properties. Mater. Des. 2018, 144, 98–128. [Google Scholar] [CrossRef]
  24. Moskvina, V.; Astafurova, E.; Astafurov, S.; Reunova, K.; Panchenko, M.; Melnikov, E.; Kolubaev, E. Effect of Ion-Plasma Nitriding on Phase Composition and Tensile Properties of AISI 321-Type Stainless Steel Produced by Wire-Feed Electron-Beam Additive Manufacturing. Metals 2022, 12, 176. [Google Scholar] [CrossRef]
  25. Wang, X.; Hu, Q.; Liu, W.; Yuan, W.; Shen, X.; Gao, F.; Tang, D.; Hu, Z. Microstructure and Corrosion Properties of Wire Arc Additively Manufactured Multi-Trace and Multilayer Stainless Steel 321. Metals 2022, 12, 1039. [Google Scholar] [CrossRef]
  26. Duraisamy, R.; Kumar, S.M.; Kannan, A.R.; Shanmugam, N.S.; Sankaranarayanasamy, K. Reliability and sustainability of wire arc additive manufactured plates using ER 347 wire-mechanical and metallurgical perspectives. Proc. Inst. Mech. Eng. Part C J. Mech. Eng. Sci. 2019, 235, 1860–1871. [Google Scholar] [CrossRef]
  27. David, S.A.; Vitek, J.M.; Reed, R.W.; Hebble, T.L. Effect of Rapid Solidification on Stainless Steel Weld Metal Microstructures and Its Implications on the Schaeffler Diagram (No. ORNL/TM-10487); Oak Ridge National Lab.: Oak Ridge, TN, USA, 1987. [Google Scholar] [CrossRef] [Green Version]
  28. Gäumann, M.; Henry, S.; Cleton, F.; Wagniere, J.D.; Kurz, W. Epitaxial laser metal forming: Analysis of micro-structure formation. Mat. Sci. Eng. 1999, 271, 232–241. [Google Scholar] [CrossRef]
  29. Revilla, R.I.; Van Calster, M.; Raes, M.; Arroud, G.; Andreatta, F.; Pyl, L.; Guillaume, P.; De Graeve, I. Microstructure and corrosion behavior of 316L stainless steel prepared using different additive manufacturing methods: A comparative study bringing insights into the impact of microstructure on their passivity. Corros. Sci. 2020, 176, 108914. [Google Scholar] [CrossRef]
  30. Oliveira, V.; Aguiar, C.; Vazquez, A.; Robin, A.; Barboza, M. Improving corrosion resistance of Ti–6Al–4V alloy through plasma-assisted PVD deposited nitride coatings. Corros. Sci. 2014, 88, 317–327. [Google Scholar] [CrossRef]
  31. Hou, X.; Ren, Q.; Yang, Y.; Cao, X.; Hu, J.; Zhang, C.; Deng, H.; Yu, D.; Li, K.; Lan, W. Effect of temperature on the electrochemical pitting corrosion behavior of 316L stainless steel in chloride-containing MDEA solution. J. Nat. Gas Sci. Eng. 2020, 86, 103718. [Google Scholar] [CrossRef]
  32. Schaller, R.F.; Mishra, A.; Rodelas, J.M.; Taylor, J.M.; Schindelholz, E.J. The Role of Microstructure and Surface Finish on the Corrosion of Selective Laser Melted 304L. J. Electrochem. Soc. 2018, 165, C234–C242. [Google Scholar] [CrossRef]
  33. Geenen, K.; Röttger, A.; Theisen, W. Corrosion behavior of 316L austenitic steel processed by selective laser melting, hot-isostatic pressing, and casting. Mater. Corros. 2017, 68, 764–775. [Google Scholar] [CrossRef]
  34. Lin, K.; Gu, D.; Xi, L.; Yuan, L.; Niu, S.; Lv, P.; Ge, Q. Selective laser melting processing of 316L stainless steel: Effect of microstructural differences along building direction on corrosion behavior. Int. J. Adv. Manuf. Technol. 2019, 104, 2669–2679. [Google Scholar] [CrossRef]
  35. Sander, G.; Thomas, S.; Cruz, V.; Jurg, M.; Birbilis, N.; Gao, X.; Brameld, M.; Hutchinson, C.R. On the corrosion and metastable pitting characteristics of 316L stainless steel produced by selective laser melting. J. Electrochem. Soc. 2017, 164, C250–C257. [Google Scholar] [CrossRef]
  36. Ganesh, P.; Giri, R.; Kaul, R.; Sankar, P.R.; Tiwari, P.; Atulkar, A.; Porwal, R.; Dayal, R.; Kukreja, L. Studies on pitting corrosion and sensitization in laser rapid manufactured specimens of type 316L stainless steel. Mater. Des. 2012, 39, 509–521. [Google Scholar] [CrossRef]
  37. Chandra, K.; Kain, V.; Tewari, R. Microstructural and electrochemical characterisation on heat-treated 347 stainless steel with diferente phases. Corros. Sci. 2013, 63, 118–129. [Google Scholar] [CrossRef]
  38. Feenstra, D.; Cruz, V.; Gao, X.; Molotnikov, A.; Birbilis, N. Effect of build height on the properties of large format stainless steel 316L fabricated via directed energy deposition. Addit. Manuf. 2020, 34, 101205. [Google Scholar] [CrossRef]
Figure 1. Methodology adopted for hardness measurements along the sample.
Metals 12 02161 g001
Figure 2. Porosity analysis of the layers deposited by LMD: (a) 2 layers, (b) 4 layers, (c) 6 layers.
Metals 12 02161 g002
Figure 3. Microstructural analysis of the layers deposited by LMD: (a) substrate, (b) deposited-layer microstructure revealed by 10% oxalic acid electrolytic etching, (c) deposition/substrate interface highlighting the epitaxy, (d) deposited-layer microstructure revealed by 40% NaOH water solution electrolytic etching, and (e) deposited layer with higher magnification highlighting dendritic growth. Yellow boxes belong to discrete regions of analyses (see text).
Metals 12 02161 g003aMetals 12 02161 g003b
Figure 4. Schaeffler constitution diagram [27] showing the location of the AISI 316 powder (P), AISI 347 substrate (S), and AISI-316-steel-deposited layer (C) compositions.
Metals 12 02161 g004
Figure 5. (ac) SEM metallography showing laser track cross-sectional microstructures of deposited AISI 316 steel layers.
Metals 12 02161 g005
Figure 6. Variation in hardness along the deposited layers.
Metals 12 02161 g006
Figure 7. Open-circuit potential vs. time after 3 h in 3.5% NaCl water solution at 25 °C.
Metals 12 02161 g007
Figure 8. Potential dynamic polarization curves in 3.5% NaCl water solution at 25 °C.
Metals 12 02161 g008
Figure 9. Electrical equivalent circuit proposed for the substrate and deposited-layer samples in NaCl water solution.
Metals 12 02161 g009
Figure 10. Bode diagrams: (a) impedance module vs. frequency; (b) phase angle vs. frequency.
Metals 12 02161 g010
Figure 11. Analysis of micrographs after EIS measurements: (a) substrate; (b) 2-layer sample; (c) 4-layer sample; (d) 6-layer sample.
Metals 12 02161 g011
Figure 12. EDS analysis of phases found in the substrate. The more important elements were indicated by red circles.
Metals 12 02161 g012
Figure 13. EDS analysis of phases found in substrate pits after EIS measurements: (a) region 1; (b) region 2. The more important elements were indicated by red circles.
Metals 12 02161 g013
Table 1. Chemical composition (weight %) of the substrate and powder.
MaterialCMnNiSSiPCrNbMo
AISI 347 susbstrate0.0451.299.950.00180.420.02117.430.73-
AISI 316 powder0.0181.4612.780.0040.600.00817.78-2.20
Table 2. EDS-analyzed composition (% weight) of the AISI 316 deposited layer and its corresponding Cr and Ni equivalent.
Composition% Weight
Carbon, C0.02
Silicon, Si0.6
Manganese, Mn1.4
Chrome, Cr16.5
Molybdenum, Mo2.2
Nickel, Ni11.1
Niobim, Nb0
Nitrogen, N0.4
Chrome equivalent, Creq19.6
Nickel equivalent, Nieq24.4
Table 3. OCP measurements after 3 h in 3.5% NaCl water solution immersion at 25 °C.
Technique2 Layers4 Layers6 LayersSubstrate
OCP (V/SCE)−0.1355−0.1354−0.1226−0.1092
Table 4. Electrochemical parameters of the potentiodynamic polarization curves for substrate and deposited layers samples.
SampleEcorr
(mV/SCE)
Eb
(mV/SCE)
Eb−Ecorr
(mV/SCE)
β c
(mV/dec)
β a
(mV/dec)
icorr (µA/cm2)
2 layers−13515929448.4644.50.116
4 layers−13511925454.88138.40.149
6 layers−123300423430169.580.096
Substrate−10933344268.96169.170.214
Table 5. Impedance modulus and electrical parameters calculated using the equivalent electrical circuit.
Sample Z × 105Re
(Ω cm2)
CPEf
(µ Ω cm−2 sn)
nfRf
(kΩ cm2)
CPEpit
(µ Ω cm−2 sn)
npitRpit
(kΩ cm2)
χ² × 10−4
2 layers1.495.651.70.9368.4015.60.59274.01.4
4 layers2.195.442.50.93164.658.90.61395.52.2
6 layers1.186.356.10.9314.2519.00.62327.20.6
Substrate1.735.541.20.9211.8516.10.6712610.3
Publisher’s Note: MDPI stays neutral with regard to jurisdictional claims in published maps and institutional affiliations.

