Article

Comparative Study and Multi-Objective Crashworthiness Optimization Design of Foam and Honeycomb-Filled Novel Aluminum Thin-Walled Tubes

1
Marine Design & Research Institute of China, Shanghai 200011, China
2
School of Mechanical Engineering, Jiangsu University of Science and Technology, Zhenjiang 212000, China
*
Author to whom correspondence should be addressed.
Metals 2022, 12(12), 2163; https://doi.org/10.3390/met12122163
Submission received: 15 November 2022 / Revised: 11 December 2022 / Accepted: 14 December 2022 / Published: 16 December 2022
(This article belongs to the Special Issue Aluminum Alloys and Aluminum-Based Matrix Composites)

Abstract

:
Due to their lightweight, porous and excellent energy absorption characteristics, foam and honeycomb materials have been widely used for filling energy absorbing devices. For further improving the energy absorption performance of the novel tube proposed in our recent work, the nonlinear dynamics software Abaqus was firstly used to establish and verify the simulation model of aluminum-filled tube. Then, the crashworthiness of honeycomb-filled tubes, foam-filled tubes and empty tube under axial load was systematically compared and analyzed. Furthermore, a comparative analysis of the mechanical behavior of filled tubes subjected to bending load was carried out based on the study of dynamic response curve, specific energy absorption and deformation mechanism, the difference in energy absorption performance between them was also revealed. Finally, the most promising filling structure with excellent crashworthiness under lateral load was optimized. The research results show that the novel thin-walled structures filled with foam or honeycomb both show better energy absorption characteristics, with an increase of at least 8.8% in total absorbed energy. At the same time, the mechanical properties of this kind of filled structure are closely related to the filling styles. Foam filling will greatly damage the weight efficiency of the novel thin-walled tube. However, honeycomb filling is beneficial to the improvement of SEA, which can be improved by up to 18.2%.

1. Introduction

Thin-walled structures have been widely used in automobiles, aviation and other industrial fields, due to their excellent mechanical properties. Therefore, the research on their mechanical properties has always been a hot topic for scholars [1,2,3,4,5]. Galib et al. [6] conducted a comprehensive experimental and numerical study on circular tubes subjected to dynamic load. Zhang et al. [7,8] pointed out that multi-cell square tubes showed better mechanical properties. Alavi Nia et al. [9] conducted axial impact tests on structures with different polygonal cross-sections, and proposed that the multi-cell cross-section was conducive to the improvement of energy absorption performance.
Considering that the traditional thin-walled structure has limited room to improve energy absorption efficiency and stability, it can no longer meet current requirements. Researchers have found that applying biological structural features to structural design can effectively enhance its energy absorption performance [10,11,12,13]. Song et al. [14] designed a novel bionic tube with grooves and studied its crashworthiness under lateral impact. The study demonstrated that the innovative design is conducive to improving the energy absorption efficiency of regular structures. Based on the structural characteristics of bamboo, Zou et al. [15] designed a bionic tube and solved its numerical examples under axial/transverse impact. Palombini et al. [16] mechanically explored the special geometry of a single vascular bundle in bamboo, and the new design proposed has a better improvement in its strength and crashworthiness under dynamic loads. Ferdynus et al. [17] proposed a new type of trigger for the square tube and focused on its effect on the energy absorption indicators achieved (triggering effect).
Metal matrix syntactic foams are high-performance foams consisting of a light-weight matrix and a set of porous fillers. Orbulov and Szlancsik et al. [18,19,20] carried out a lot of experimental work to characterize its structure–mechanical property relationship. Fiedler et al. [21] analyzed the mechanical properties of the foam with gradient characteristics. Rabiei et al. [22,23] manufactured steel composite metal foam core sandwich panels and studied their quasi-static mechanical properties. These studies show that metal foam has superior mechanical properties and can be used as energy absorption materials.
In order to further enhance the crashworthiness, some scholars fill the regular tubes with lightweight porous materials such as metal foam and honeycomb [24,25,26,27,28]. Li et al. [29,30] conducted bending experiments on foam-filled tubes with different structures. Qi et al. [31] conducted a numerical analyzed mechanical behavior investigation of empty and foam-filled hybrid beams, and optimized their design. Pandarkar et al. [32] elaborated on foam-filled pipes, and the main conclusion was that filling thin-walled structures can improve the stability of the structure. Cakıroglu [33] focused on the quasi-static mechanical properties of honeycomb-filled round pipes and optimized their crashworthiness design. Inspired by biology, Nian et al. [34] proposed a new type of gradient honeycomb-filled round tube and systematically studied its crashworthiness under lateral load. Yao et al. [35] mainly analyzed the dynamic responses of honeycomb-filled structure under various conditions.
In summary, the novel thin-walled tube obtained by filling with foam and honeycomb material has better crashworthiness. Although there are a large number of studies on the foam or honeycomb filling structures, comparative studies of these two filling methods are rarely reported. Therefore, it is important to conduct in-depth research of the mechanical behavior of the novel thin-walled tubes filled with foam and honeycomb, and then to understand the collision behavior and energy absorption characteristics between them more thoroughly. The difference in the dynamic response of the foam and honeycomb-filled novel thin-walled tubes under different filling styles is systematically studied, specifically involving the energy absorption characteristics, peak impact force, deformation mode and load displacement characteristics. The optimization design of the most promising filling structure with excellent crashworthiness is further conducted to maximize the specific energy absorption and minimize the peak collision force.

2. Numerical Model

2.1. Geometric Model of the Filling Structure

Figure 1 gives the geometric model of the filling structure. Rinner, Router and T are the radius and wall thickness of the inner and outer round tubes, respectively. The dotted line in the picture is the angle bisector of the angle α, and the intersection of two adjacent oblique lines falls on the intersection of the angle bisector and the section line of the outer tube. The sizes of Rinner, Router, T and α are, respectively, 15 mm, 30 mm, 1 mm and 90°. Figure 2b exhibits the different filling methods of these novel thin-walled structures. Among these seven filling styles, G is a full filling style and A–F are partial filling styles. The filling structure adopts the following naming rules: F and H indicate foam and honeycomb, and the second letter indicates the filling style. For example: FA means using foam to fill in A style of filling, HA uses honeycomb to fill in style A.

2.2. Finite Element Model

To study the impact behavior of the infill structure under impact load, a model of the infill structure was constructed by the nonlinear dynamic finite element method for simulation. Figure 2 is the numerical simulation model of infill structure. Part a in Figure 2 is the calculation model of the axial compression of the filling structure. The tube wall and honeycomb are treated as shell, the foam is treated as solid. The impact block and rigid wall are set as rigid bodies. When the impact block impacts the thin-walled tube axially at a speed of 20 m/s, the rigid wall at the bottom is fixed. The contact settings in the dynamic compression process are as follows: the thin-walled tube adopts automatic single-surface contact and the contact between thin-walled tube and the rigid wall is set as surface-to-surface contact. The sensitivity analysis of the mesh shows that the mesh size of the element of 1.5 mm × 1.5 mm is sufficient to produce reliable results. In these contacts, the dynamic and static friction coefficients are set to 0.2 and 0.3. The right side of part a in Figure 2 is the model of the filling structure under different filling methods, with a length of 150 mm.
Part b is the finite element model of the filling structure under lateral load. The indenter and the supports are treated as rigid bodies. The indenter impacts the thin-walled structure vertically downward at 4.4 m/s and the supports are fixed during the impact. The settings of contact properties, mesh size and thin-walled tube length are the same as part a.

2.3. Material Properties

The material of the new thin-walled tube and honeycomb filler is aluminum alloy AlMgSi0.5F22 with density ρ = 2.7 × 10³ kg/m3, elastic modulus E = 68.566 GPa, Poisson’s ratio ν = 0.29, yield stress σy = 231 Mpa and ultimate stress σult = 254 Mpa. Considering that aluminum is not sensitive to strain rate, material strain-rate effect can be ignored during simulation analysis [36]. The foam filling is made of foamed aluminum. In order to save calculation cost and ensure sufficient calculation accuracy, crushable foam is used for modeling. The platform stress of lightweight porous materials is very important for its energy absorption. The calculation formula of foam aluminum platform stress σp [31,37] is as follows:
σ p = C p o w ( ρ f ρ 0 ) n
In the formula, ρf and ρ0 are the density of the foam and foam substrate, respectively. The density of aluminum is ρ0 = 2.7 × 10³ kg/m3. Cpow and n are constants. According to the test results in literature [38], Cpow = 526 Mpa and n = 2.17. The simplified functional relationship of the foam stress–strain curve is used for simulation, as shown in Table 1 [39]. The Young’s modulus of the foam is E = 64.8 GPa, the tensile stress cut-off value is 1.11, the rate-sensitive damping is 0.05 and the Poisson’s ratio is 0.01 [31].

2.4. Evaluation Index

Generally, energy absorption (EA), average crushing force (MCF), maximum collision force (MIF), specific energy absorption (SEA) and crushing force efficiency (CLE) are commonly used evaluation indicators. As a key indicator, specific energy absorption (SEA) is often used to evaluate the mechanical performance of thin-walled structures. A larger SEA means better crashworthiness. The calculation formula is as follows:
S E A = E A M  
Among them, M is the total mass and EA indicates the total absorbed energy of the structure. The calculation formula of EA is as follows:
E A = 0 s F ( x ) d x
In the formula, S indicates the displacement of impact force and F(x) represents the instantaneous collision force.
CLE is an index for evaluating the uniformity and consistency of the collision force. It is another very important evaluation index for crashworthiness. It can be calculated as:
C L E = M C F P C F × 100 %
Among them, MCF is the average crushing force, PCF is the maximum collision load and the calculation formula of MCF is as follows:
M C F = 1 s 0 s F ( x ) d x

2.5. Validation of the FE Model

To verify the effectiveness of the numerical model, the results of the axial compression simulation of foam-filled multi-cell square tube (F01, F40) are compared with the reference results in literature [40]. Figure 3 shows that the simulation values in this paper are consistent with the results in reference [40], which have been verified by the theoretical results. Subsequently, the bending behavior of foam-filled square tube in reference [41] was simulated. Figure 4 shows the comparison between the test results and the numerical results. Both the force–displacement curve and the deformation mode show a high consistency feature. In summary, the finite element model of axial and lateral impact is sufficiently reliable.

3. Numerical Results

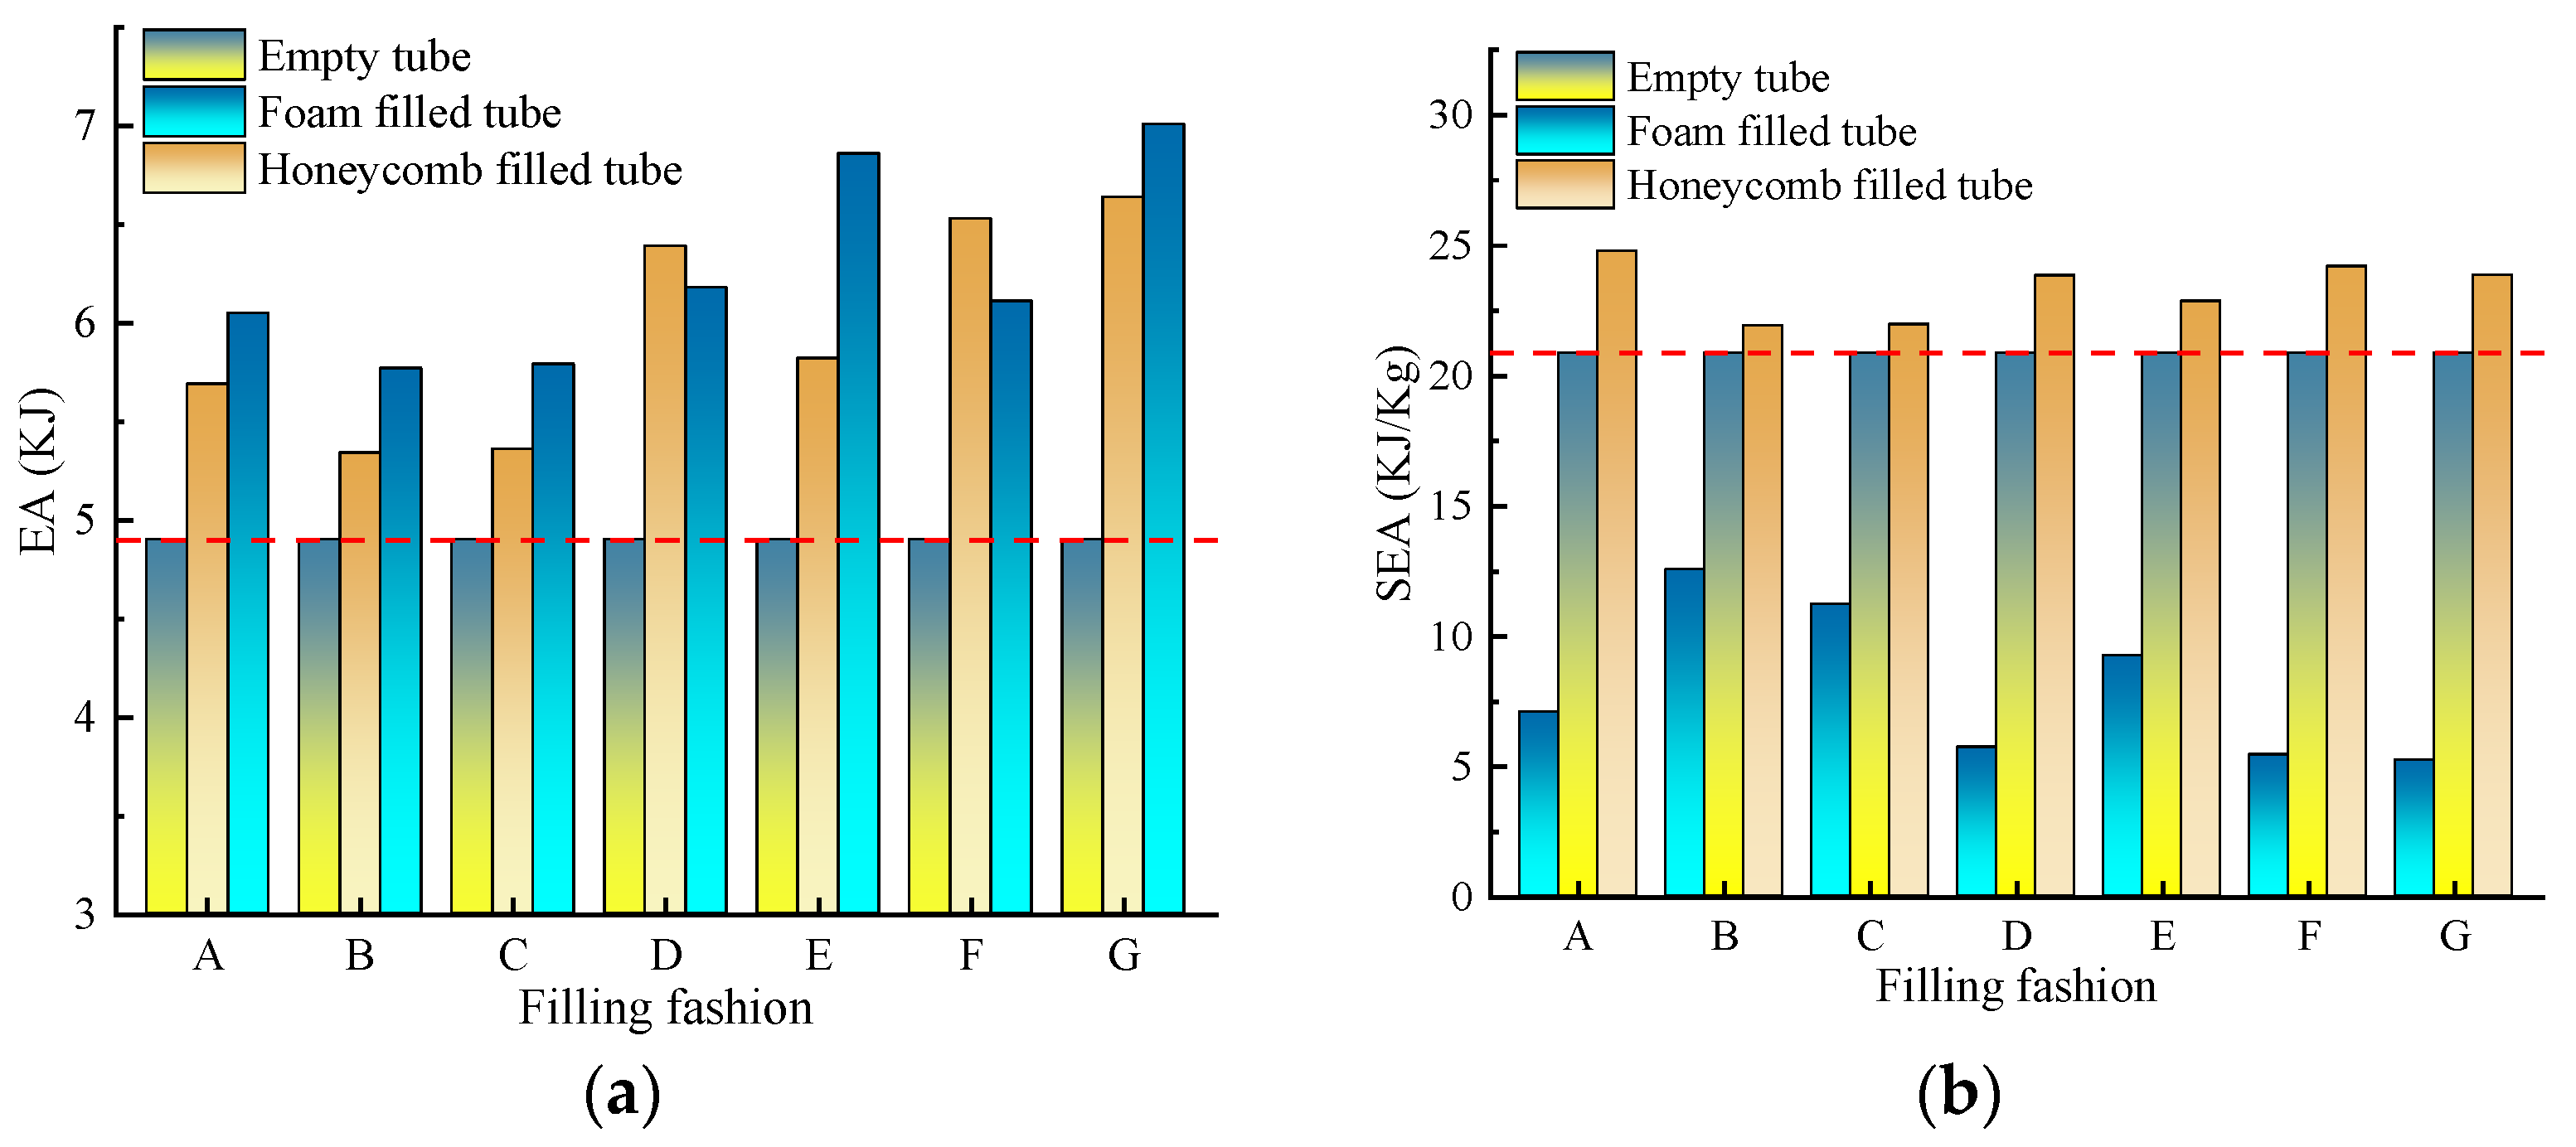
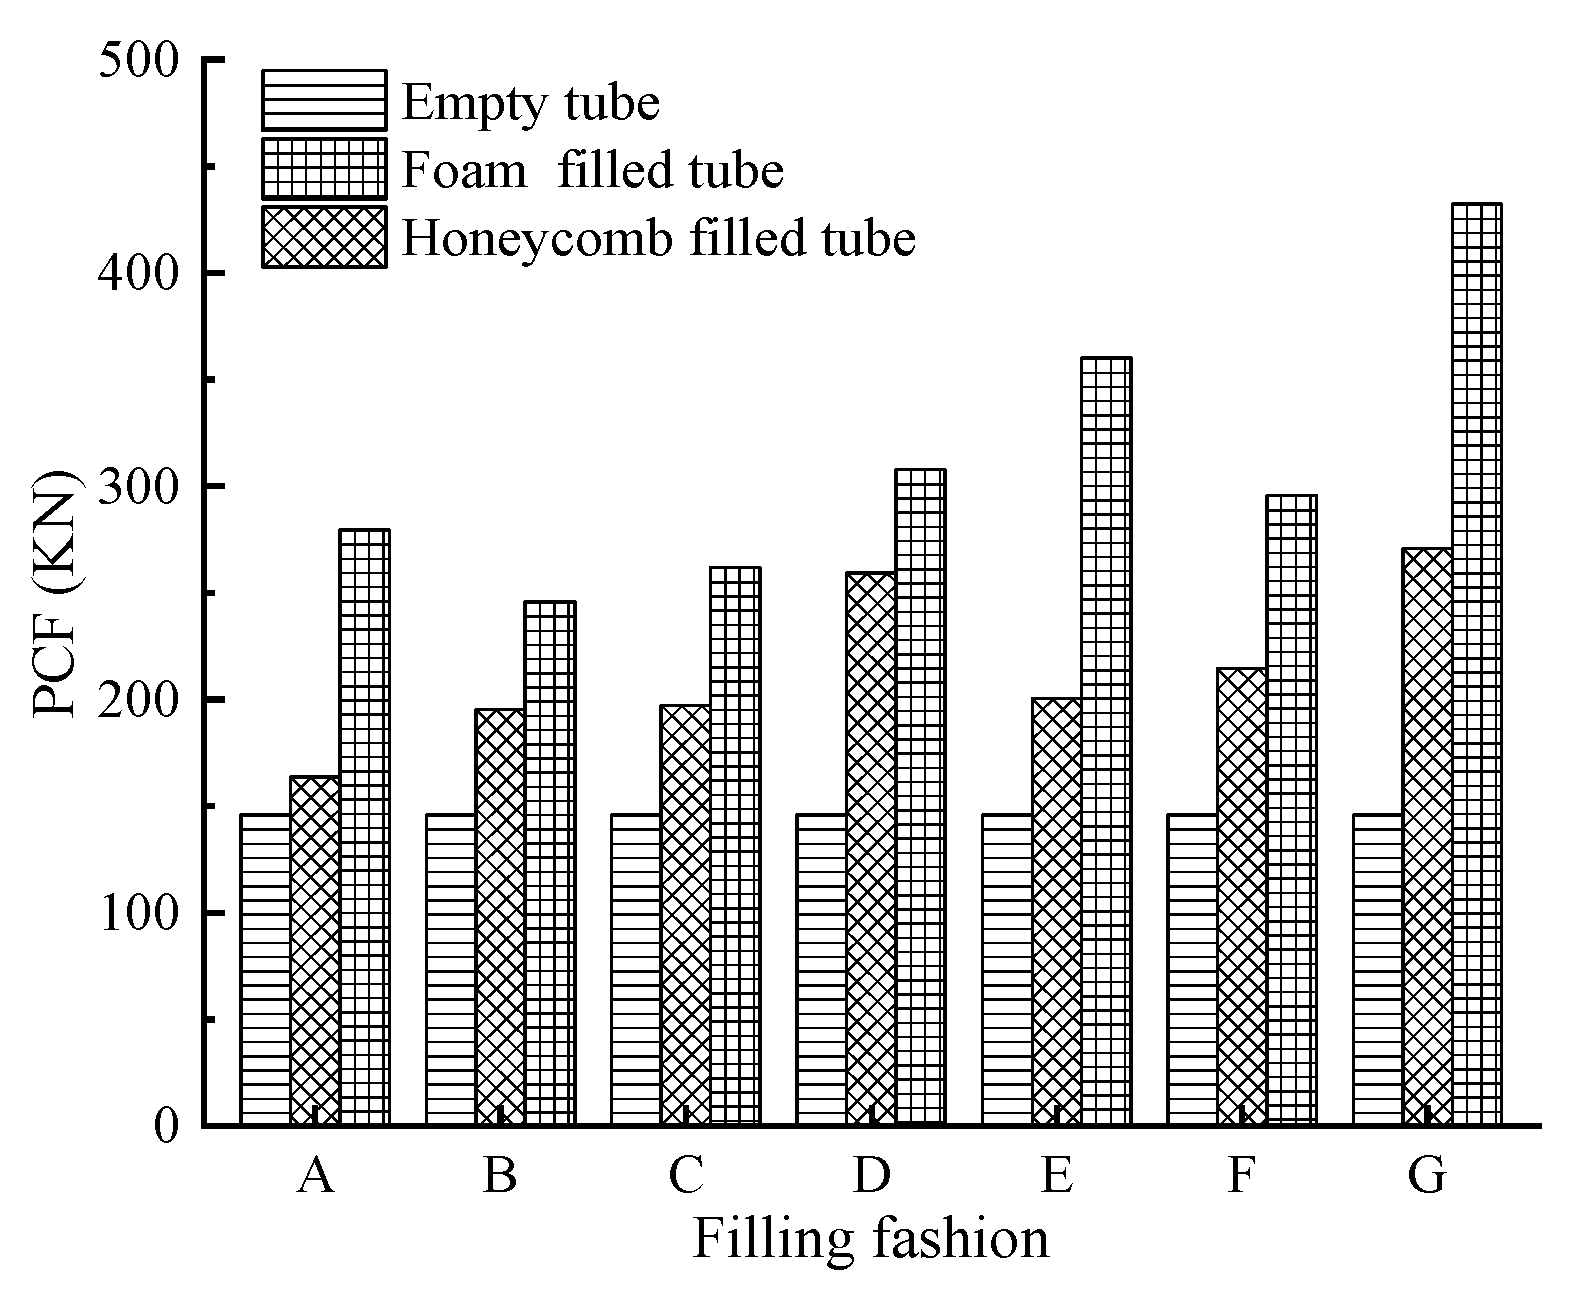
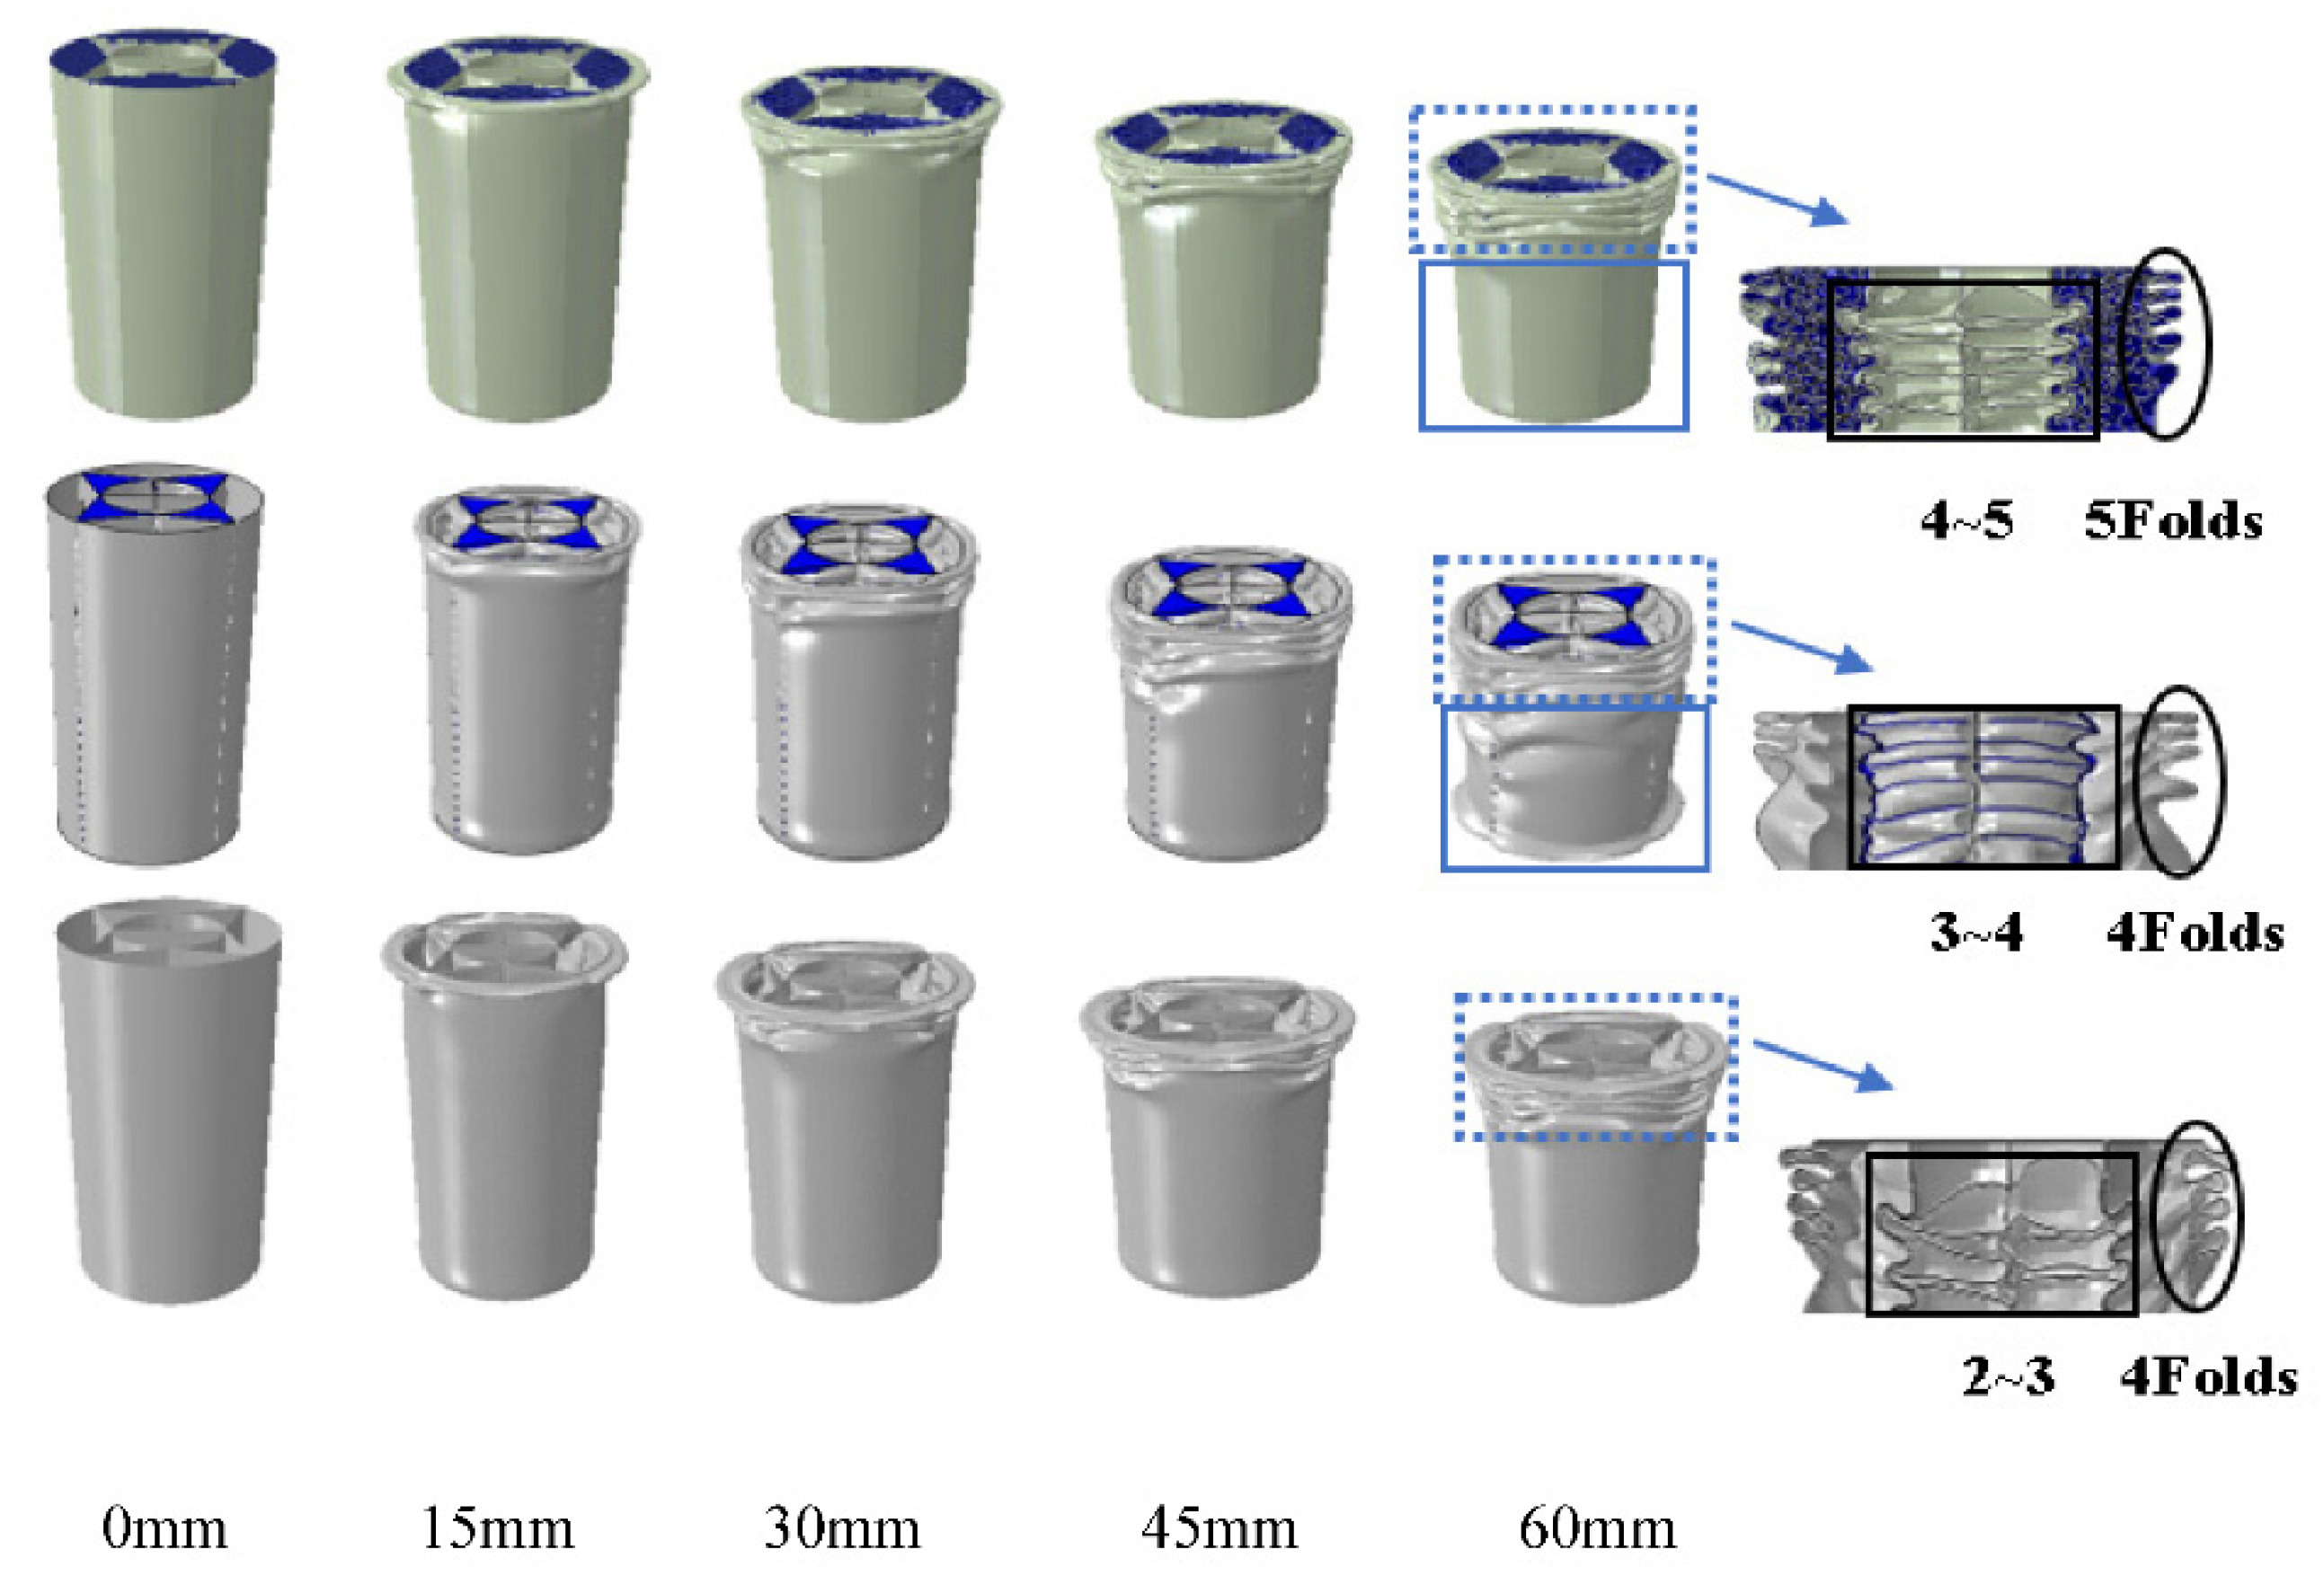
3.1. Axial Compression Analysis

In this section, the mechanical behavior of filled structures subjected to axial impact will be studied. The unfilled novel thin-walled tube is also introduced for comparison. Figure 5 shows the EA and SEA of the filling structure in different filling styles. The EA values of the honeycomb- and foam-filled tubes under different filling styles are higher than that of empty tubes (red dotted line) in Figure 5a. In addition, the EA of honeycomb/foam-filled tubes shows obvious differences between different filling styles. Partially filled HB/FB has the smallest EA, which is, respectively, 8.8% and 17.6% higher than that of empty tube. This shows that whether it is honeycomb or foam filling, the different filling methods of novel thin-walled tube are all conducive to total energy absorption. Additionally, the foam-filling method has better enhancement effect.
Considering that foam and honeycomb filling may compromise the weight efficiency of the novel structures, Figure 5b compares the SEA of the filling structures. As shown in the picture, the SEA of the foam-filled tube is relatively low, regardless of the filling method. By contrast, the honeycomb filling method increases the SEA. Among the foam/honeycomb-filled tubes, partially filled FB/HA has the largest SEA, which is 40.4% lower and 18.2% higher than that of the empty 20.86 KJ tube. Although foam filling plays a positive role in improving mechanical properties, it greatly impairs the weight efficiency. It is worth noting that honeycomb filling just compensates for this defect. Figure 6 shows the peak impact force of the filling structure with different filling methods. The foam-filled structure has the greatest peak force, while the empty tube has the least. This shows that honeycomb is more conducive to reducing peak force than foam filling. Among foam/honeycomb-filled tubes, fully-filled FG/HG has the largest PCF, followed by partially filled FE/HD, and partially filled FB/HA is the smallest.
From the above analysis, we can see that FB/HA has the best crashworthiness among these novel thin-walled tubes. To have a better understand, Figure 7 exhibits deformation modes of FB, HA and the unfilled thin-walled structure. These three thin-walled structures have all undergone orderly and progressive folding. However, they have different folding characteristics. As shown in the partial enlarged cross-sectional view on the right, the honeycomb-filled tube outside (black solid line ellipse) and the number of internal folds (black solid line box) are larger than foam-filled and empty tubes. Although the number of folds on the outside of the foam-filled tube is the same as that of empty tube, there are more folds on the inside of the foam-filled tube. Meanwhile, the whole structure of the foam-filled structure has a certain degree of plastic deformation (such as the blue solid line box) when the compression displacement is 60 mm, while more plastic deformation means that more impact energy is absorbed, which explains why the EA of FB is greater than that of HA.

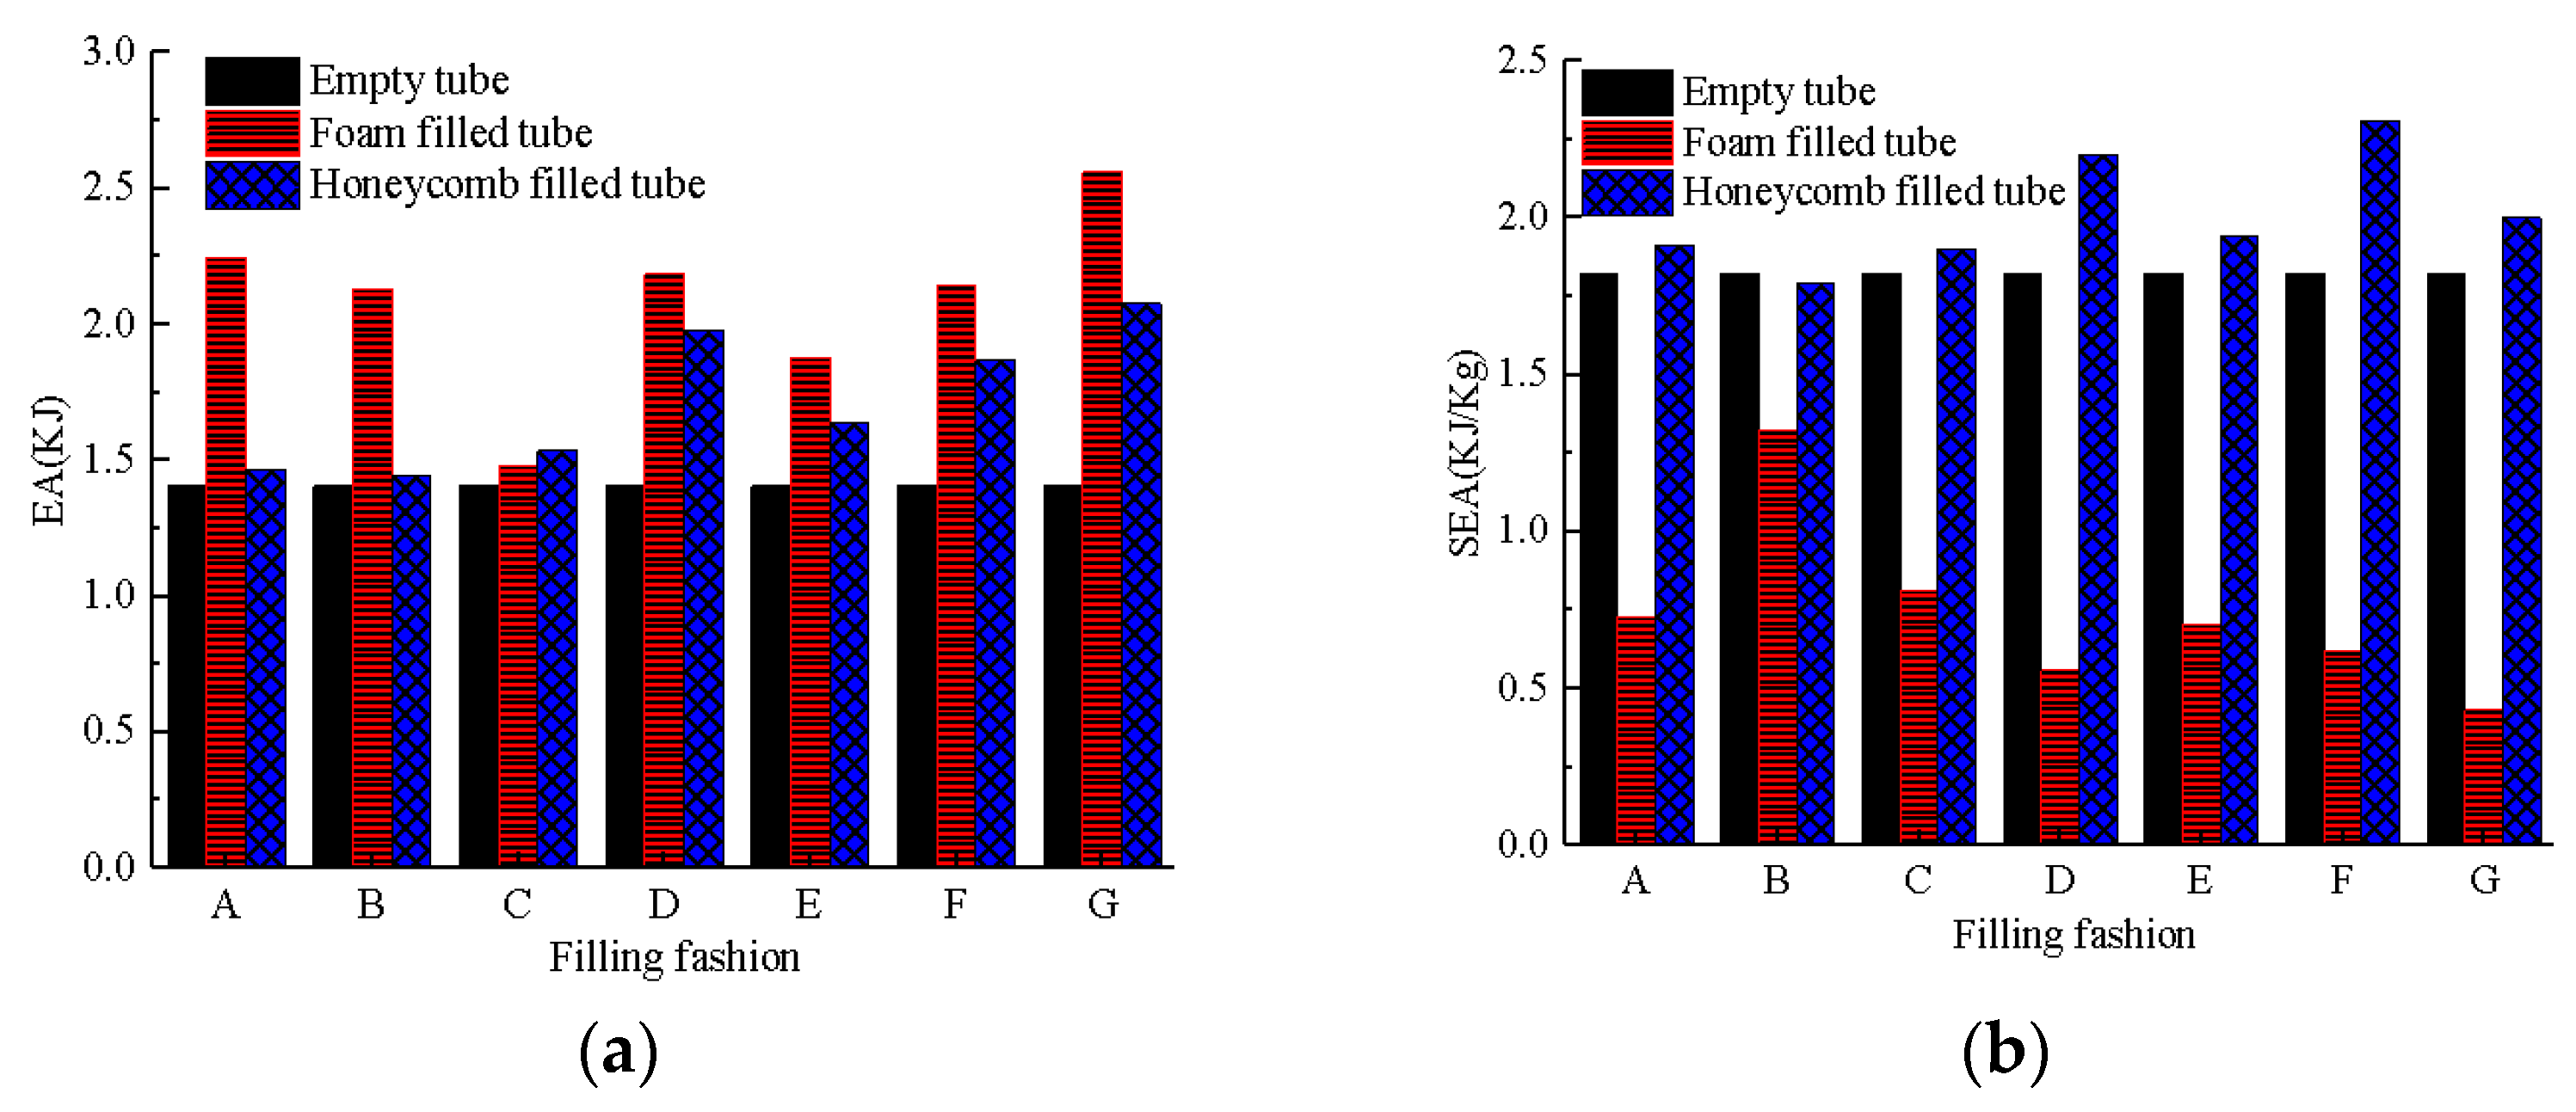
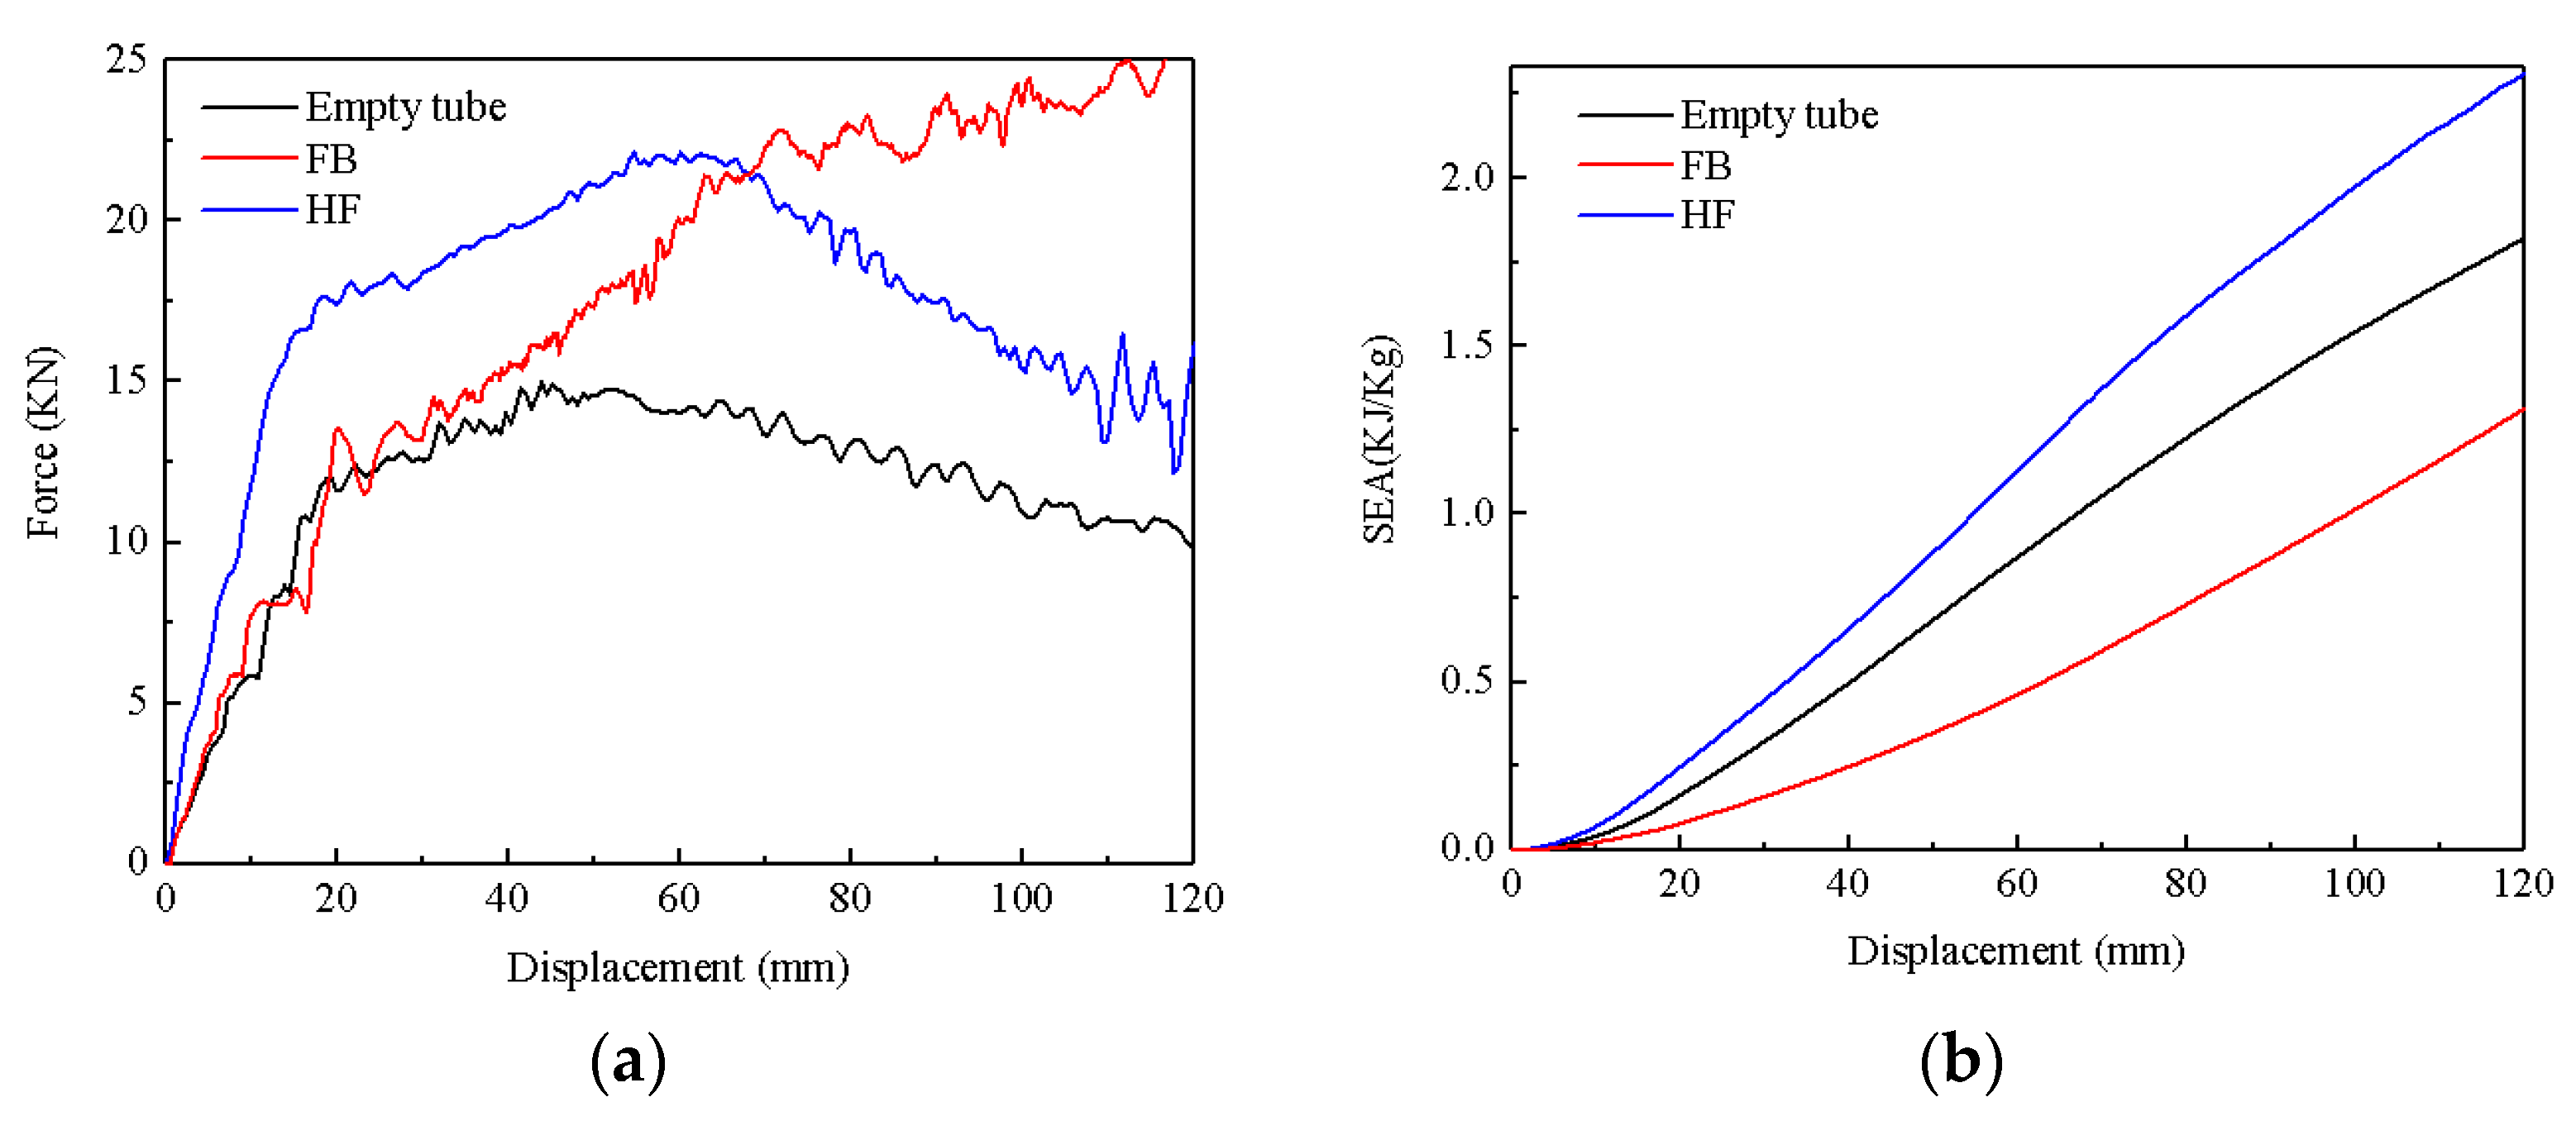
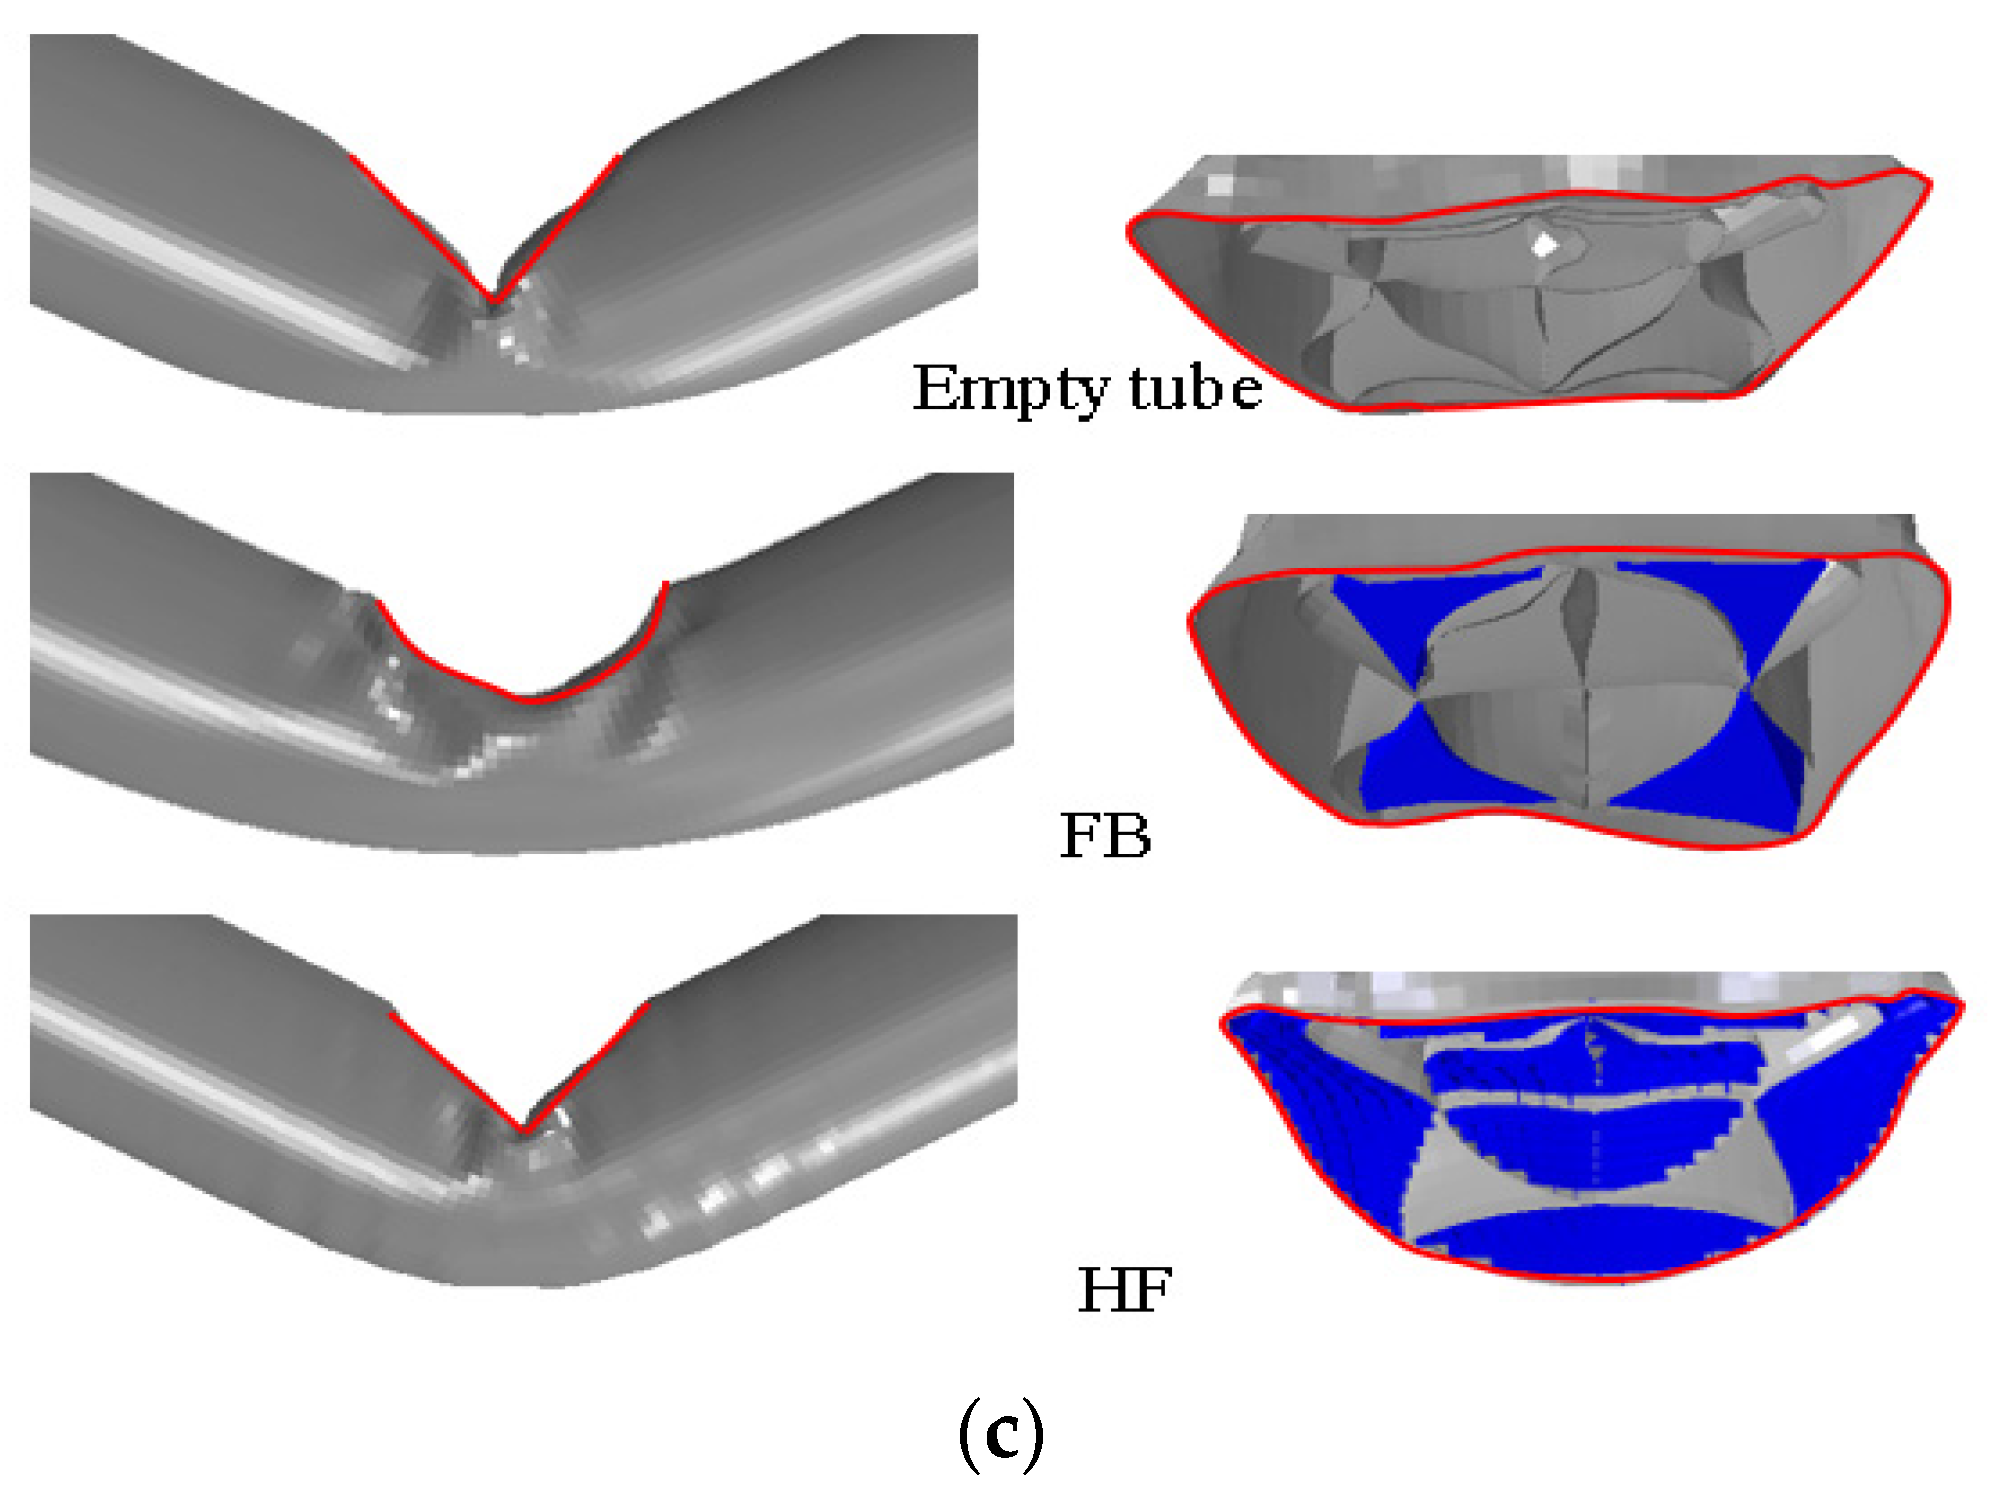
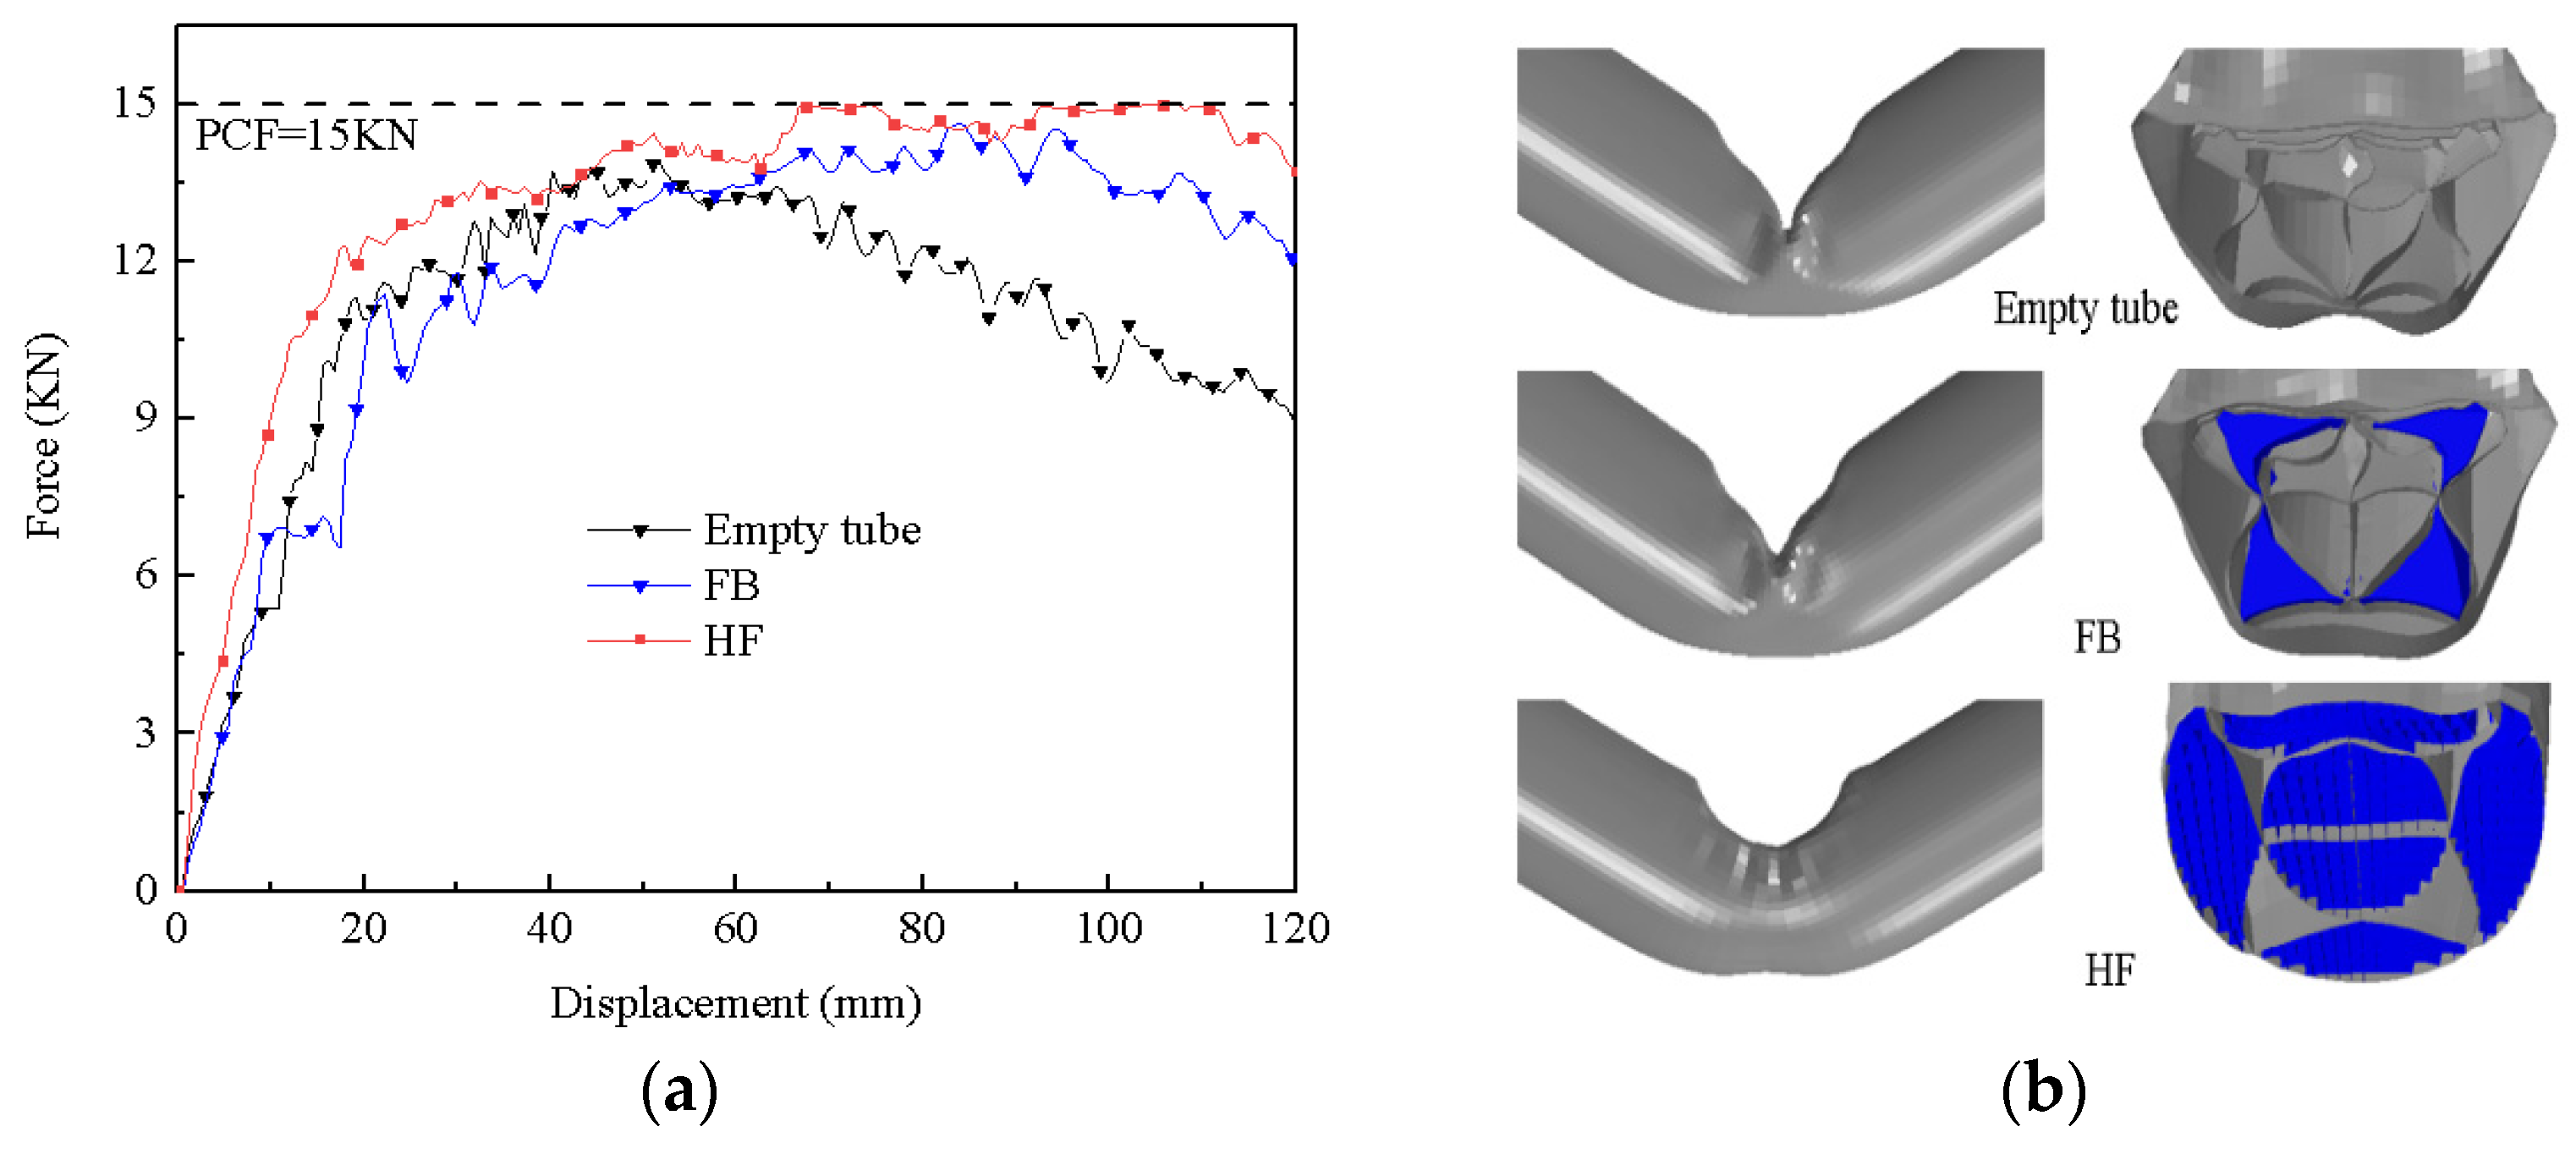
3.2. Three-Point Bending Analysis

The thin-walled structures will also be subjected to lateral loads in actual use. Thin-walled structures are not only impacted by axial loads, but are sometimes also impacted by lateral loads. Therefore, the bending performance of the structure is very important for its application. Figure 8 shows the EA, SEA, PCF and CLE of the filling structure under different filling styles. As shown in Figure 8a, the EA of foam- and honeycomb-filled structures are both larger than that of empty tube. Fully filled FG and HG have the largest EA, followed by partially filled FA and HD. In particular, under the same filling style, just the EA of the honeycomb-filled tube in the filling style C exceeds that of foam-filled tube. This shows that both foam and honeycomb filling will cause the increase in total absorbed energy, and foam filling is more conducive to the growth of EA than honeycomb filling. However, it does not represent an increase in its energy absorption efficiency. The SEA of honeycomb-filled tube is higher than that of empty tube. The SEA of foam/honeycomb-filled pipes showed significant differences. The partially filled FB/HF has the largest SEA, which is 27.4%/26.8% lower/higher than the empty tube. The results indicate that the honeycomb filling is an extremely effective means to enhance energy-absorption capacity, and the F filling method may be the best choice.
The PCF of the filling structures is also compared in Figure 8c. The PCF of foam and honeycomb filling is greater than that of empty tube, and PCF of the foam filling tube is the highest. At the same time, the PCF of foam and honeycomb tubes are affected by filling method. In Figure 8d, filling techniques do not make CLE of the empty tube change too much and the CLE did not change significantly with the change of the filling method.
Based on the above, FB/HF has the best energy absorption characteristics among foam/honeycomb-filled tubes. For further understanding the difference in bending performance, the force–displacement curves, specific energy absorption–displacement curves and deformation modes are selected for comparative analysis, as shown in Figure 9. The impact force for the honeycomb filling tube and the empty tube presents the same trend. It first increases sharply and then slowly decreases, while the collision force of the foam-filled tube shows a monotonous increasing trend. The collision force of foam- and honeycomb-filled structures is bigger, and when the loading displacement is equal to 120 mm, the collision force of foam-filled pipes is the largest. This means that foam and honeycomb-filled tubes can withstand a higher level of lateral impact and transmit greater bending moments. In order to better illustrate this point, Figure 9c shows their deformation modes. It can be seen from the map that the partially recessed area of the foam-filled tube is arc-shaped. The effective contact area is larger than that of the honeycomb-filled and empty tube. Although honeycomb filling and empty tube both have the phenomenon of concentrated deformation area, the local recessed area is V-shaped. However, the cross-sectional deformation of the partially recessed area of the honeycomb-filled tube is more obvious than that of empty tube. As shown in the SEA-displacement curve in Figure 9b, the SEA of honeycomb-filled tube is the largest. This is just the opposite for foam-filled tube. Therefore, foam-filled tubes are not the best choice for crashworthiness.

4. Multi-Objective Optimization Design

4.1. Optimization Problem Set-Up

It is often required that thin-walled structures can absorb the most energy in a certain range of peak stress. Therefore, SEA and PCF are selected as two objectives of this optimal design. Crashworthiness optimization aims to maximize SEA and minimize PCF. However, SEA and PCF are in conflict with each other. Therefore, a multi-objective optimization design is selected to solve this contradictory objective problem [42,43,44,45]. From the analysis in Section 3.2, FB and HF have better crash resistance. Moreover, the crashworthiness of HF is better than that of FB. However, the optimal crashworthiness of these structures still depends on different structure and material parameters. Therefore, in this section, the novel thin-walled tube wall thickness T, honeycomb wall thickness t and foam density ρ f are used as design variables. The crashworthiness optimization problem is described as follows:
The optimized expression of FB is as follows:
{ Minimize   [ P C F ( T ,   ρ f ) , S E A ( T ,   ρ f ) ] s . t { 0.5   mm T 1.5   mm 170   Kg / m 3 ρ f 340   Kg / m 3
The optimized expression of HF is as follows:
  { Minimize   [ P C F ( T ,   ρ f ) , S E A ( T ,   ρ f ) ] s . t { 0.5   mm T 1.5   mm 0.01   mm t 0.1   mm
The optimized expression of empty tube is as follows:
{ Minimize   [ P C F ( T ,   ρ f ) , S E A ( T ,   ρ f ) ] s . t { 0.5   mm T 1.5   mm

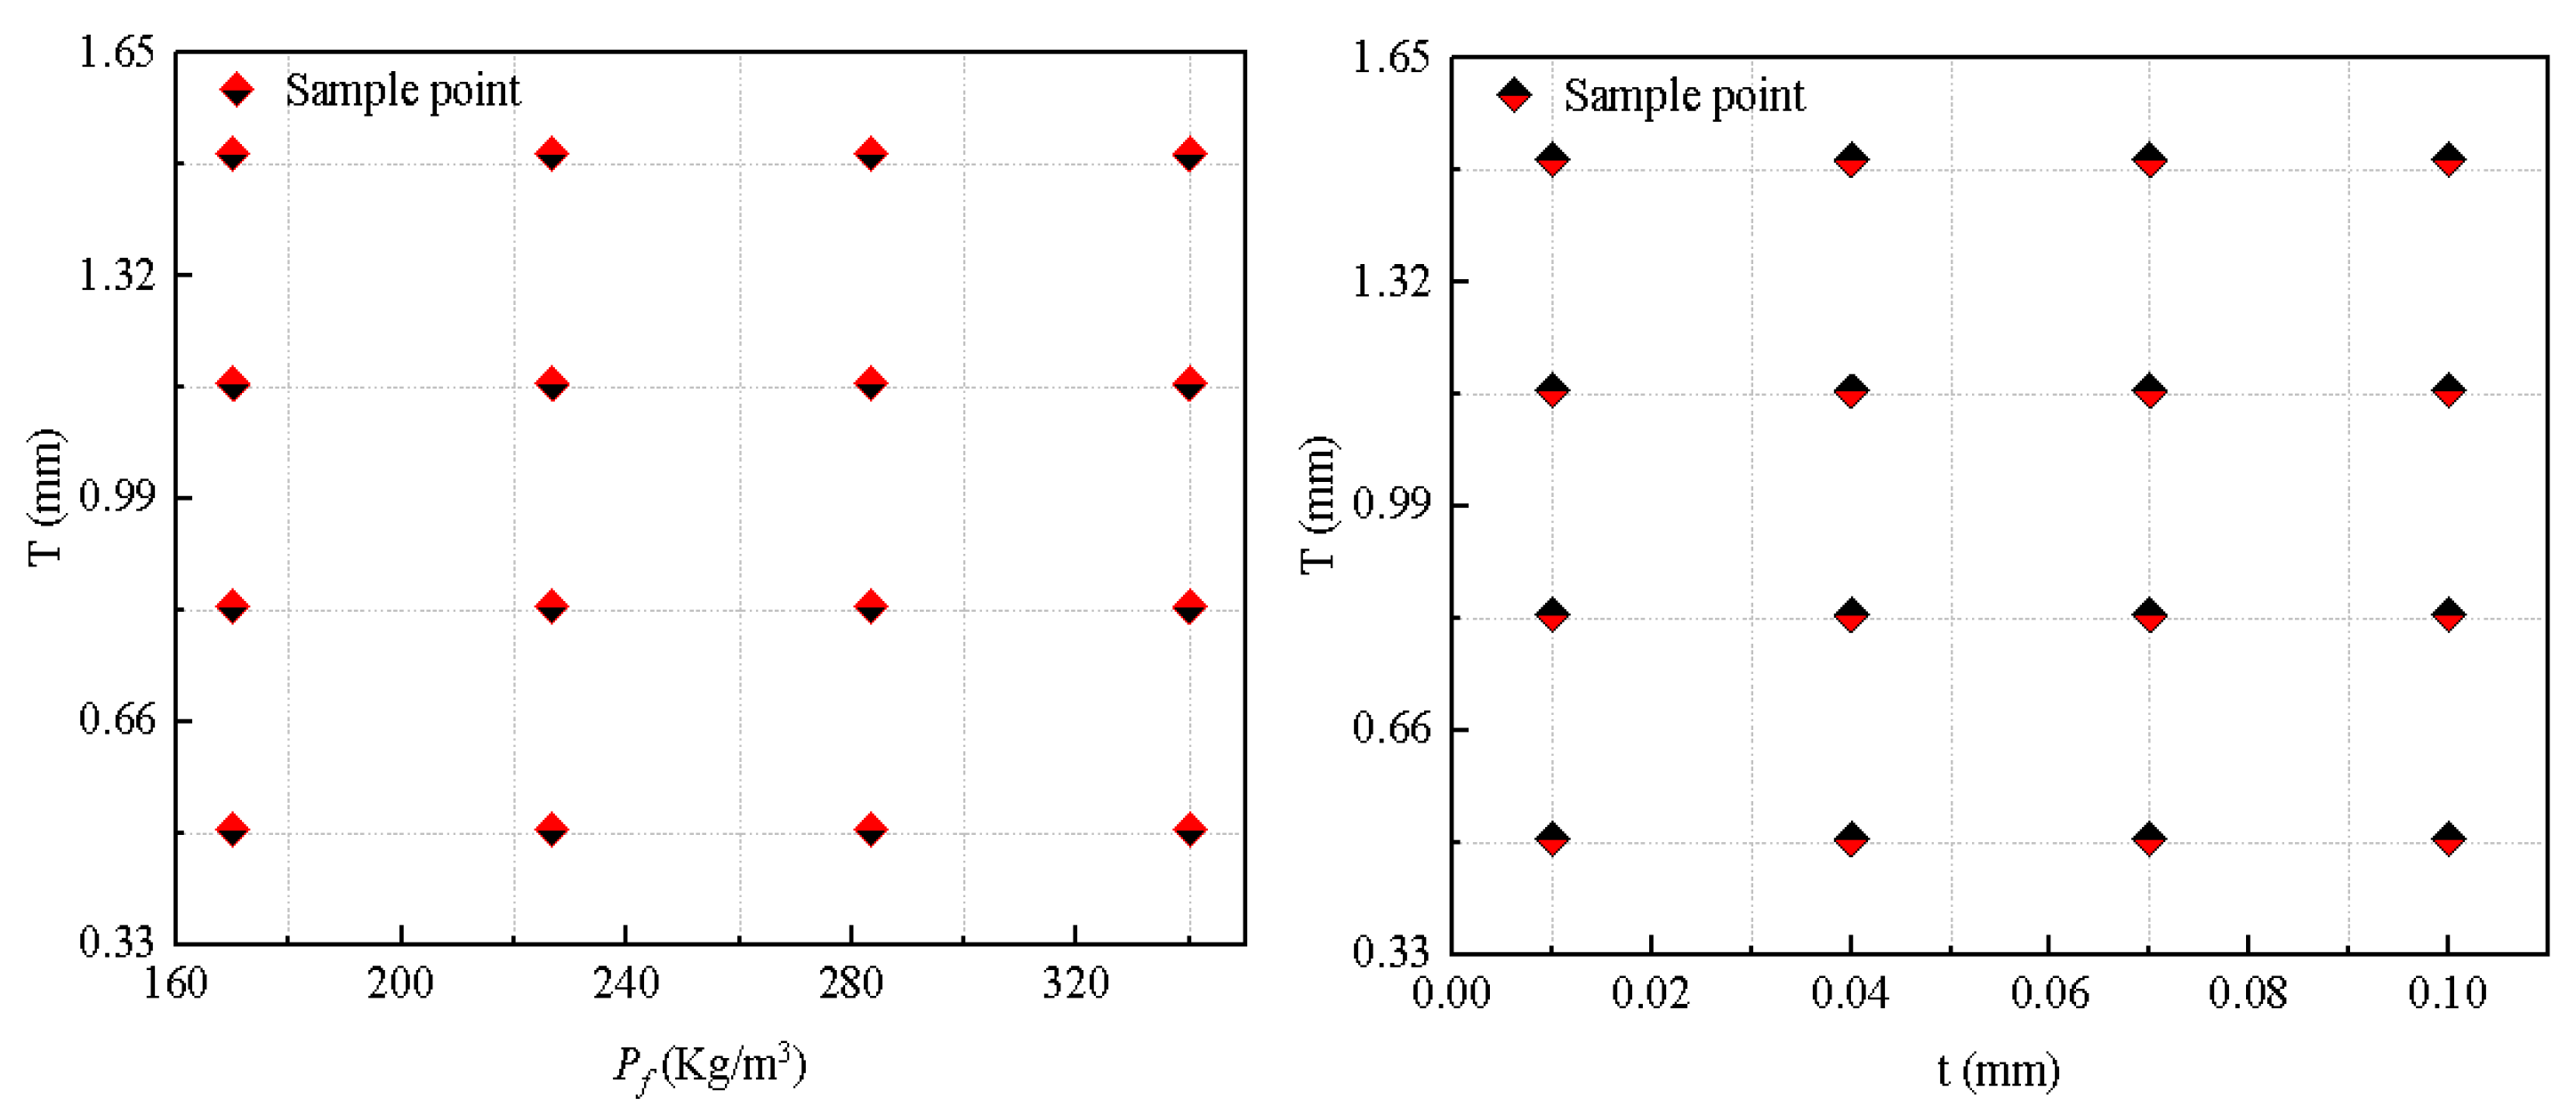
4.2. Experimental Design

The main experimental design methods include central composite design, Taguchi orthogonal experiment method [45], Latin hypercube design and full-factor experiment. Because the full-factor experiment has good uniformity [10,39], this paper uses the full-factor design to generate 16 sample points (four levels for design variables T, t, ρf), as shown in Figure 10. Subsequently, numerical simulation on these sample points is carried out and corresponding response values are obtained.

4.3. Predictive Model

Since the construction of SEA and PCF forecasting models is important for the crashworthiness optimization, the accuracy of forecasting models needs to be verified. Firstly, through polynomial regression analysis (PR), the functional relationship between the optimization objective and design parameters is established, and the corresponding prediction model is obtained. Then, the square value of index R (R2), adjusted R2 ( R a d j 2 ), root mean square error (RMSE) and maximum relative error (MARE) are used to evaluate the accuracy of this prediction model. The corresponding expression is as follows:
R 2 = 1 i = 1 n ( y i y ^ i ) 2 i = 1 n ( y i y ^ ) 2
R a d j 2 = 1 ( 1 R 2 ) n 1 n k 1
R M S E = i = 1 n ( y i y ^ i ) 2 n
M A R E = ( | y i y ^ i | | y i | ) i = 1 , 2 , n m a x
Among them, y i   represents the value of the design points obtained by experiment and numerical analysis, y ^ i   is the predicted value of prediction model, n is the number of experimental sample points, y   ¯ represents the average value of   y i and k is the number of non-constant items. Normally, the closer R2 is to 1, the higher the degree of fit; the smaller the RSME and MARE, the more accurate the prediction model. Table 2 gives the accuracy index of the forecasting model of FB, HF and empty tube. From Table 2, we can see that all R2 values are close to 1, and all MARE values are less than 6%. Therefore, it can be considered that these PR mathematical models are accurate enough to be used in crashworthiness optimization.

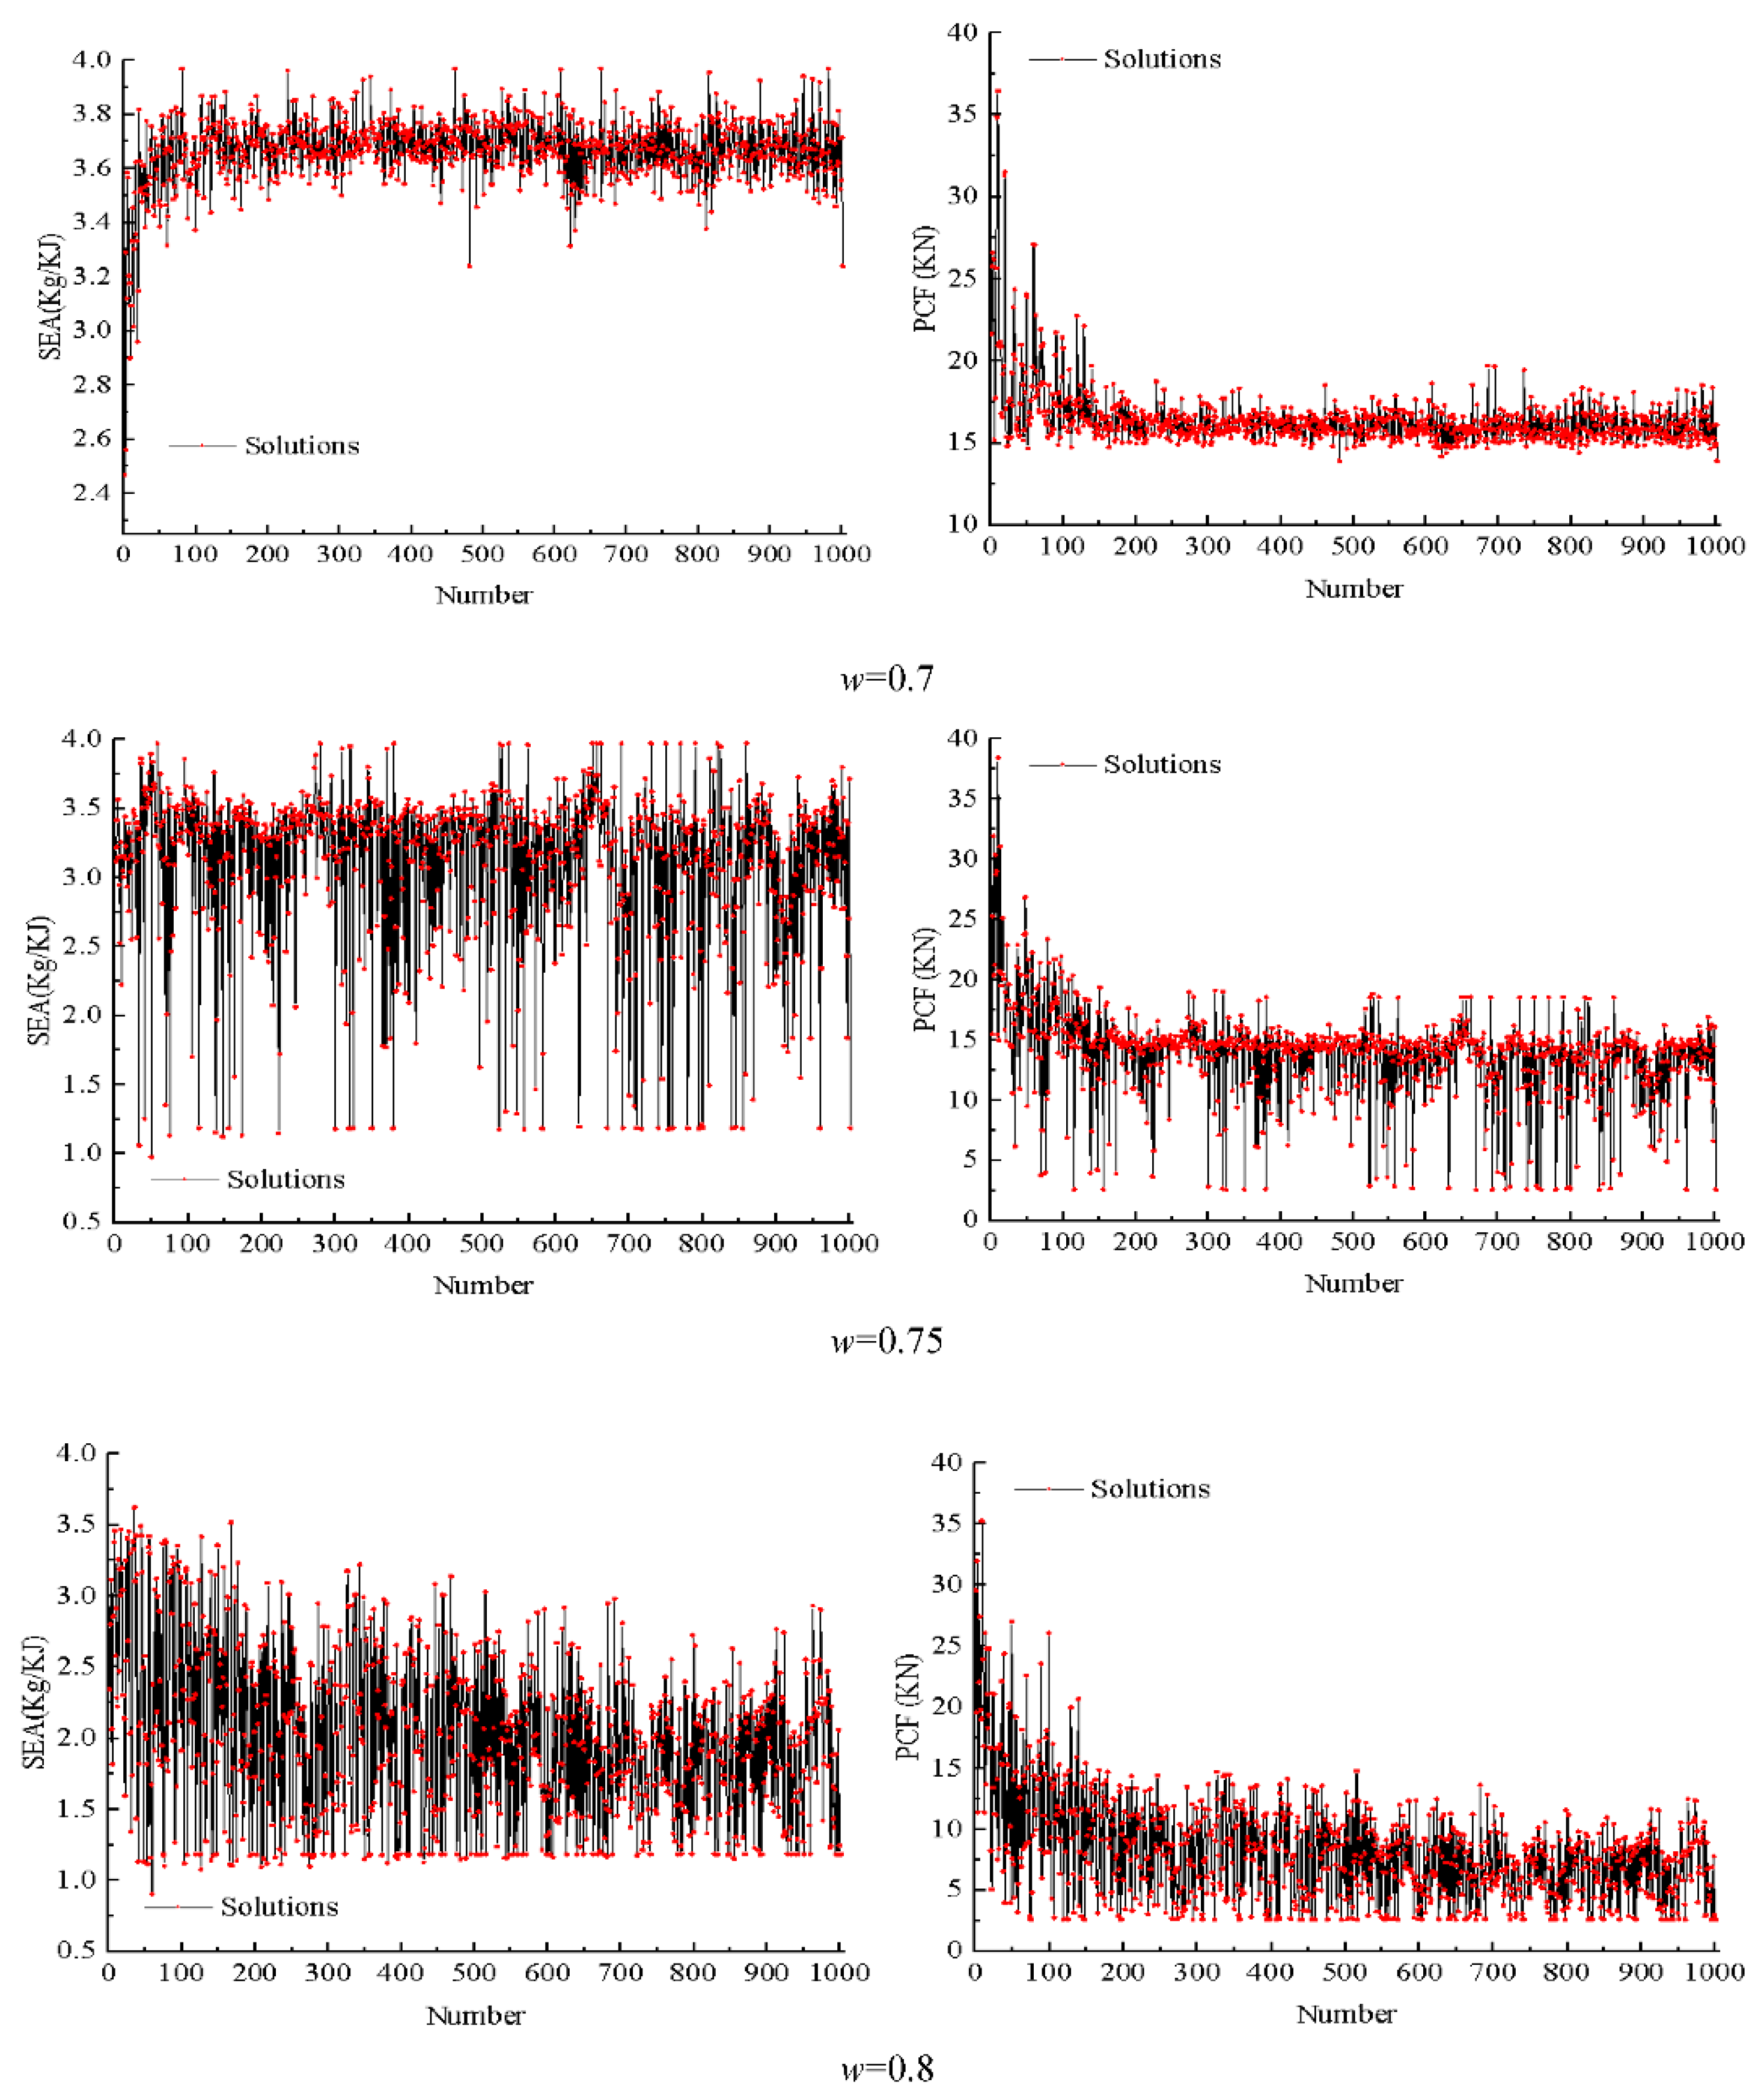
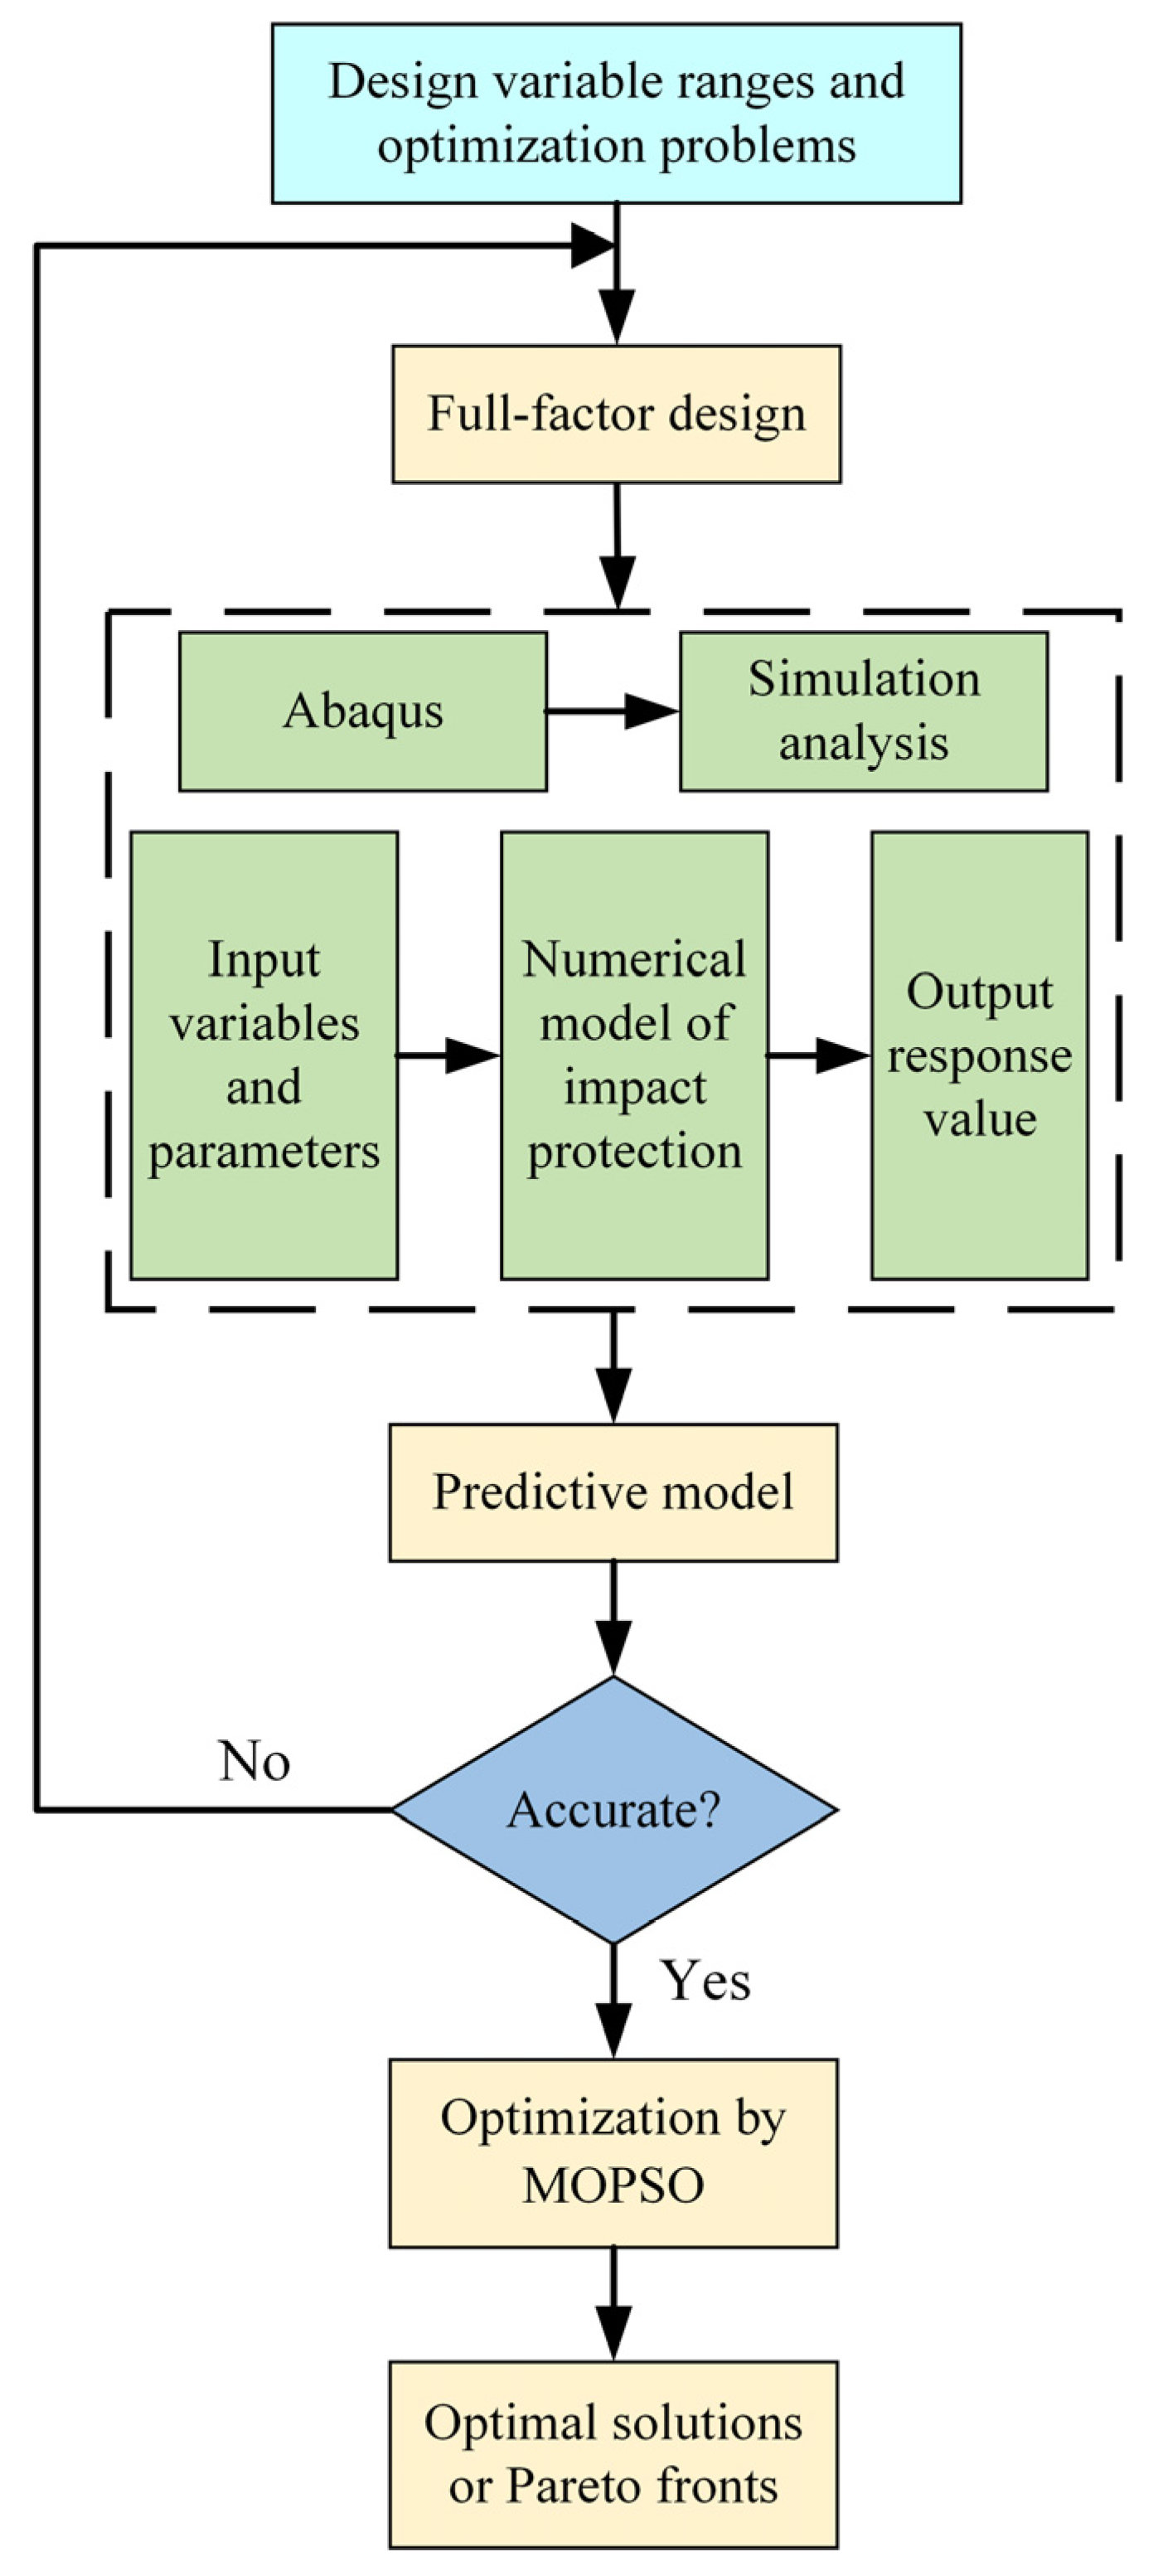
4.4. Particle Swarm Algorithm and Optimization Process

Since the particle swarm algorithm has the advantages of easy implementation, high accuracy and fast convergence [46,47], this paper uses the particle swarm algorithm to obtain a Pareto relatively optimal solution of the prediction model. Ten particles are set for tracking and each particle moves 100 times in the constrained space for accuracy. The inertia weight w is an important parameter that affects the pros and cons of the particle swarm algorithm. The solution of the HF prediction model obtained by the particle swarm algorithm under different inertia weights is shown in Figure 11. It can be seen from the picture that when the inertia weight is equal to 0.7, the solutions of the SEA and PCF prediction models have undergone large oscillations at first, and then stabilized in a certain area. Therefore, when the inertia weight is equal to 0.7, the convergence is best. The specific parameters of the particle swarm algorithm are shown in Table 3. Figure 12 is the flow chart of the optimized design. First, the full-factor experimental design is carried out on the problem of clear optimized design. Further, perform simulation analysis on the sample points to obtain the target response value. Then, the prediction models of SEA and PCF were constructed through polynomial regression analysis. Finally, the Pareto optimal solution set is given after the calculation of the prediction model by the optimized algorithm.

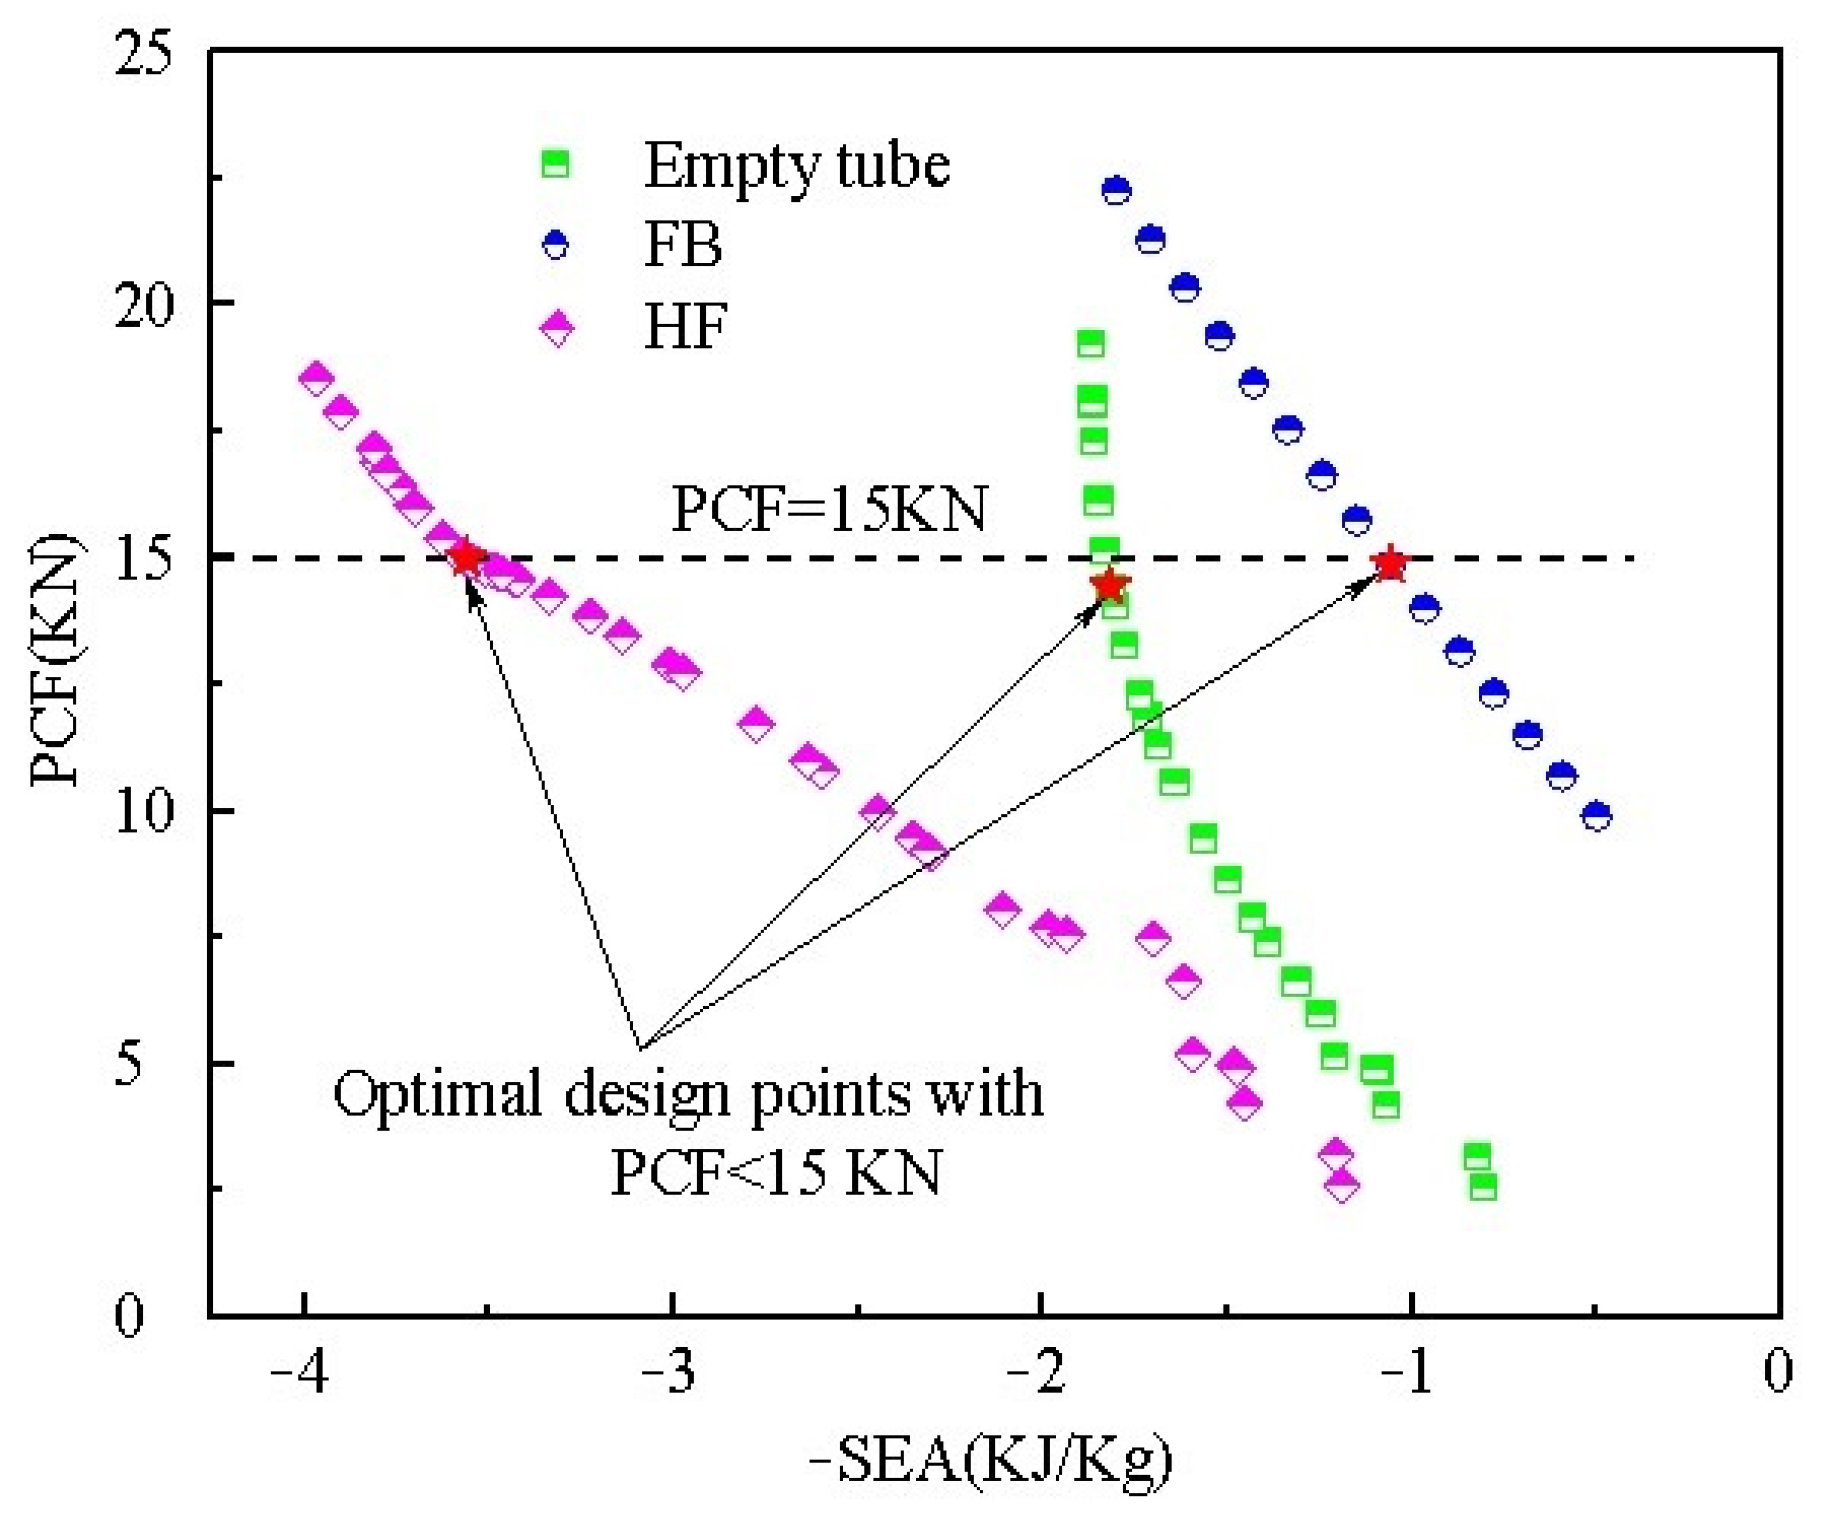
4.5. Multi-Objective Optimization Results

To comprehensively analyze the crashworthiness difference between FB, HF and empty tube more, the Pareto boundary obtained after particle swarm optimization is compared and shown in Figure 13. It can be found from the figure that when the PCF is constant, the closer the Pareto boundary is to the left, the greater the specific energy absorption (SEA). The Pareto optimal solution set of HF is closest to the left, followed by the empty tube. Therefore, the crashworthiness of HF is better than that of FB and empty tube, and the crashworthiness of FB is the worst. In engineering applications, designers can choose based on requirements of PCF. When the PCF is less than or equal to 15 KN, the red five-pointed star in the map is the optimal design point of each structure. Figure 14 shows the force–displacement diagrams and deformation modes of these three optimal structures. The PCF of the three structures in Figure 14a is less than 15 KN, and HF has the largest PCF. In Figure 14b, local recessed area of the HF optimal structure presents an arc shape, while both FB and empty tube present V shapes.

5. Conclusions

To further enhance the crashworthiness of the novel thin-walled structure, foam and honeycomb are used to fill it. The numerical simulation model of the filled structure was first built and verified using the nonlinear dynamic Abaqus software. Then, the impact resistance of honeycomb-filled tubes, foam-filled tubes and empty tube under axial load was systematically compared and analyzed. Furthermore, based on the force–displacement curve, specific energy absorption and deformation model, a comparative analysis of the mechanical behavior of filled tubes subjected to lateral impact was carried out. The optimization design of the most promising filling structure with excellent crashworthiness was finally conducted to maximize the specific energy absorption and minimize the peak collision force. The results of this study show that:
(1) The introduction of honeycomb filling and foam filling enabled the thin-walled structures to absorb more energy. The total absorbed energy increases at least 8.8% compared with the empty tube. At the same time, the crashworthiness of the filling structure was closely related to the filling styles. The foam filling will greatly impair the weight efficiency of the novel thin-walled tube. However, honeycomb filling was beneficial to the improvement of SEA, which can be improved by up to 18.2%.
(2) Honeycomb filling was more conducive to the reduction of PCF than foam filling under axial load. Among foam/honeycomb-filled tubes, fully filled FG/HG had the largest PCF, followed by partially filled FE/HD and FB/HA was the smallest.
(3) Under the action of lateral load, foam- and honeycomb-filled tubes could withstand a higher level of lateral impact and transmit greater bending moments than empty tube. Among foam/honeycomb-filled tubes, FB/HF was the most promising structure with excellent crashworthiness.
(4) The particle swarm algorithm was further used for crashworthiness optimization design of FB and HF, and the Pareto boundaries were obtained and compared. By way of contrast, the optimal structure of HF showed the best crashworthiness. In practical engineering applications, the use of honeycomb-filled novel thin-walled tube may be the best choice.

Author Contributions

Conceptualization, Y.T.; resources, L.L.; software, Y.W.; writing—review and editing, Y.W. and D.X.; methodology, Q.H. All authors have read and agreed to the published version of the manuscript.

Funding

This research is supported by The National Natural Science Foundation of China (No. 51705215), The Chinese Postdoctoral Science Foundation (2022M712932) and the Natural Science Fundamental Research Project of Jiangsu Universities (No. 22KJA460003).

Institutional Review Board Statement

Not applicable.

Informed Consent Statement

Not applicable.

Data Availability Statement

Not applicable.

Conflicts of Interest

The authors declare there is no conflict of interest regarding the publication of this work.

References

  1. Abramowicz, W.; Jones, N. Dynamic axial crushing of circular tubes. Int. J. Impact Eng. 1984, 2, 263–281. [Google Scholar] [CrossRef]
  2. Kim, H.S. New extruded multi-cell aluminum profile for maximum crash energy absorption and weight efficiency. Thin-Walled Struct. 2002, 40, 311–327. [Google Scholar] [CrossRef]
  3. Najafi, A.; Rais-Rohani, M. Mechanics of axial plastic collapse in multi-cell, multi-corner crush tubes. Thin-Walled Struct. 2011, 49, 1–12. [Google Scholar] [CrossRef]
  4. He, Q.; Wang, Y.; Gu, H.; Feng, J.; Zhou, H. The dynamic behavior of fractal-like tubes with Sierpinski hierarchy under axial loading. Eng. Comput. 2022, 38, 1285–1298. [Google Scholar] [CrossRef]
  5. Zhang, X.; Zhang, H. Axial crushing of circular multi-cell columns. Int. J. Impact Eng. 2014, 65, 110–125. [Google Scholar] [CrossRef]
  6. Galib, D.A.; Limam, A. Experimental and numerical investigation of static and dynamic axial crushing of circular aluminum tubes. Thin-Walled Struct. 2004, 42, 1103–1137. [Google Scholar] [CrossRef]
  7. Zhang, X.; Cheng, G.; Zhang, H. Theoretical prediction and numerical simulation of multi-cell square thin-walled structures. Thin-Walled Struct. 2006, 44, 1185–1191. [Google Scholar] [CrossRef]
  8. Zhang, X.; Zhang, H. Energy absorption of multi-cell stub columns under axial compression. Thin-Walled Struct. 2013, 68, 156–163. [Google Scholar] [CrossRef]
  9. Nia, A.A.; Parsapour, M. Comparative analysis of energy absorption capacity of simple and multi-cell thin-walled tubes with triangular, square, hexagonal and octagonal sections. Thin-Walled Struct. 2014, 74, 155–165. [Google Scholar]
  10. Yin, H.; Xiao, Y.; Wen, G.; Qing, Q.; Wu, X. Crushing analysis and multi-objective optimization design for bionic thin-walled structure. Mater. Des. 2015, 87, 825–834. [Google Scholar] [CrossRef]
  11. Zhu, B.; Zhang, M.; Zhao, J. Micro structure and mechanical properties of sheep horn. Microsc. Res. Tech. 2016, 79, 664–674. [Google Scholar] [CrossRef] [PubMed]
  12. Song, J.F.; Xu, S.C.; Wang, H.X.; Wu, X.Q.; Zou, M. Bionic design and multi-objective optimization for variable wall thickness tube inspired bamboo structures. Thin-Walled Struct. 2018, 125, 76–88. [Google Scholar] [CrossRef]
  13. Jiang, H.; Ren, Y.; Jin, Q.; Zhu, G.; Hu, Y.; Cheng, F. Crashworthiness of novel concentric auxetic reentrant honeycomb with negative Poisson’s ratio biologically inspired by coconut palm. Thin-Walled Struct. 2020, 154, 106911. [Google Scholar] [CrossRef]
  14. Song, J.; Xu, S.; Liu, S.; Huang, H.; Zou, M. Design and numerical study on bionic columns with grooves under lateral impact. Thin-Walled Struct. 2020, 148, 106546. [Google Scholar] [CrossRef]
  15. Zou, M.; Xu, S.; Wei, C.; Wang, H.; Liu, Z. A bionic method for the crashworthiness design of thin-walled structures inspired by bamboo. Thin-Walled Struct. 2016, 101, 222–230. [Google Scholar] [CrossRef]
  16. Palombini, F.L.; Mariathb, J.E.A.; Oliveiraa, B.F. Bionic design of thin-walled structure based on the geometry of the vascular bundles of bamboo. Thin-Walled Struct. 2020, 155, 106936. [Google Scholar] [CrossRef]
  17. Ferdynus, M.; Rozylo, P.; Rogala, M. Energy Absorption Capability of Thin-Walled Prismatic Aluminum Tubes with Spherical Indentations. Materials 2020, 13, 4304. [Google Scholar] [CrossRef]
  18. Orbulov, I.N.; Májlinger, K. Characteristic compressive properties of hybrid metal matrix syntactic foams. Mater. Sci. Eng. A 2014, 606, 248–256. [Google Scholar]
  19. Orbulov, I.N.; Szlancsik, A.; Kemény, A.; Kincses, D. Compressive mechanical properties of low-cost, aluminium matrix syntactic foams. Compos. A Appl. Sci. Manuf. 2020, 135, 105923. [Google Scholar] [CrossRef]
  20. Szlancsik, A.; Orbulov, I.N. Compressive properties of metal matrix syntactic foams in uni- and triaxial compression. Mater. Sci. Eng. A 2021, 827, 142081. [Google Scholar] [CrossRef]
  21. Movahedi, N.; Vesenjak, M.; Krstulovi-Opara, L.; Belova, I.V.; Murch, G.E.; Fiedler, T. Dynamic compression of functionally-graded metal syntactic foams. Compos. Struct. 2021, 261, 113308. [Google Scholar] [CrossRef]
  22. Marx, J.; Rabiei, A. Study on the Microstructure and Compression of Composite Metal Foam Core Sandwich Panels. Metall. Mater. Trans. A 2020, 51, 5187–5197. [Google Scholar] [CrossRef]
  23. Marx, J.; Rabiei, A. Tensile properties of composite metal foam and composite metal foam core sandwich panels. J. Sandw. Struct. Mater. 2021, 23, 3773–3793. [Google Scholar] [CrossRef]
  24. Sahil, G.; Anand, C.S.; Sunil, K.S.; Rakesh, C.S. Crashworthiness analysis of foam filled star shape polygon of thin-walled structure. Thin-Walled Struct. 2019, 144, 106312. [Google Scholar]
  25. Zhang, Y.; Sun, G.; Li, G.; Luo, Z.; Li, Q. Optimization of foam-filled bitubal structures for crashworthiness criteria. Mater. Des. 2012, 38, 99–109. [Google Scholar] [CrossRef]
  26. Gao, Q.; Wang, L.; Wang, Y.; Wang, C. Crushing analysis and multiobjective crashworthiness optimization of foam-filled ellipse tubes under oblique impact loading. Thin-Walled Struct. 2016, 100, 105–112. [Google Scholar] [CrossRef]
  27. Hanssen, A.; Langseth, M.; Hopperstad, O. Optimum design for energy absorption of square aluminium columns with aluminium foam filler. Int. J. Mech. Sci. 2001, 43, 153–176. [Google Scholar] [CrossRef]
  28. Yin, H.; Wen, G.; Wu, X.; Qing, Q.; Hou, S. Crashworthiness design of functionally graded foam-filled multi-cell thin-walled structures. Thin-Walled Struct. 2014, 85, 142–155. [Google Scholar] [CrossRef]
  29. Li, Z.B.; Zheng, Z.J.; Yu, J.L.; Guo, L.W. Crashworthiness of foam-filled thin-walled circular tubes under dynamic bending. Mater. Des. 2013, 52, 1058–1064. [Google Scholar] [CrossRef]
  30. Li, Z.B.; Lu, F.Y. Bending resistance and energy-absorbing effectiveness of empty and foam-filled thin-walled tubes. J. Reinf. Plast. Compos. 2015, 34, 761–768. [Google Scholar] [CrossRef]
  31. Qi, C.; Sun, Y.; Yang, S. A comparative study on empty and foam-filled hybrid material double-hat beams under lateral impact. Thin-Walled Struct. 2018, 129, 327–341. [Google Scholar]
  32. Pandarkar, A.; Goel, M.D.; Hora, M.S. Axial crushing of hollow and foam filled tubes: An overview. Sadhana Acad. Proc. Eng. Sci. 2016, 41, 909–921. [Google Scholar] [CrossRef] [Green Version]
  33. Cakıroglu, C. Quasi-Static Crushing Behavior of Nomex Honeycomb Filled Thin-Walled Aluminum Tubes. Ph.D. Thesis, Izmir Institute of Technology, Izmir, Turkey, 2011; pp. 184–193. [Google Scholar]
  34. Nian, Y.Z.; Wan, S.; Lia, X.Y. How does bio-inspired graded honeycomb filler affect energy absorption characteristics. Thin-Walled Struct. 2019, 144, 106269. [Google Scholar] [CrossRef]
  35. Yao, S.; Xiao, X.; Xu, P.; Qu, Q.; Che, Q. The impact performance of honeycomb-filled structures under eccentric loading for subway vehicles. Thin-Walled Struct. 2018, 123, 360–370. [Google Scholar] [CrossRef]
  36. Chen, W. Experimental and numerical study on bending collapse of aluminum foam-filled hat profiles. Int. J. Solids Struct. 2001, 38, 7919–7944. [Google Scholar] [CrossRef]
  37. Yang, S.; Qi, C. Multiobjective optimization for empty and foam-filled square columns under oblique impact loading. Int. J. Impact Eng. 2013, 54, 177–191. [Google Scholar] [CrossRef]
  38. Hanssen, A.G.; Hopperstad, O.S.; Langseth, M.; Ilstad, H. Validation of constitutive models applicable to aluminium foams. Int. J. Mech. Sci. 2002, 44, 359–406. [Google Scholar] [CrossRef]
  39. Hou, S.; Li, Q.; Long, S.; Yang, X.; Li, W. Crashworthiness design for foam filled thin-wall structures. Mater. Des. 2009, 30, 2024–2032. [Google Scholar] [CrossRef]
  40. Zhang, Y.; Ge, P.Z.; Lu, M.H.; Lai, X.G. Crashworthiness study for multi-cell composite filling structures. Int. J. Crashworthiness 2018, 23, 32–46. [Google Scholar] [CrossRef]
  41. Zarei, H.R.; Kroger, M. Bending behavior of empty and foam-filled beams: Structural optimization. Int. J. Impact Eng. 2008, 35, 521–529. [Google Scholar] [CrossRef]
  42. Pirmohammad, S.; Esmaeili-Marzdashti, S. Multi-objective crashworthiness optimization of square and octagonal bitubal structures including different hole shapes. Thin-Walled Struct. 2019, 139, 126–138. [Google Scholar] [CrossRef]
  43. Ying, L.; Dai, M.H.; Zhang, S.Z.; Ma, H.L.; Hu, P. Multiobjective crashworthiness optimization of thin-walled structures with functionally graded strength under oblique impact loading. Thin-Walled Struct. 2017, 117, 165–177. [Google Scholar] [CrossRef]
  44. Deng, X.L.; Liu, W.Y. Multi-objective optimization of thin-walled sandwich tubes with lateral corrugated tubes in the middle for energy absorption. Thin-Walled Struct. 2019, 137, 303–317. [Google Scholar] [CrossRef]
  45. Fang, H.; Rais-Rohani, M.; Liu, Z.; Horstemeyer, M.F. A comparative study of metamodeling methods for multiobjective crashworthiness optimization. Comput. Struct. 2005, 83, 2121–2136. [Google Scholar] [CrossRef]
  46. Wang, T.; Li, Z.; Wang, L.; Hulbert, G.M. Crashworthiness analysis and collaborative optimization design for a novel crash-box with re-entrant auxetic core. Struct. Multidiscip. Optim. 2020, 62, 2167–2179. [Google Scholar] [CrossRef]
  47. Su, L.W.; Zhang, Y.J.; Sun, B.B. Multi-objective optimization of deployable composite cylindrical thin-walled hinges with progressive damage. Struct. Multidiscip. Optim. 2019, 61, 803–817. [Google Scholar] [CrossRef]
Figure 1. Geometric configuration of the filling structure: (a) novel thin-walled structure; (b) filling styles.
Metals 12 02163 g001
Figure 2. Finite element model of the filled structure. (a) the calculation model of the axial compression; (b) the calculation model of the axial compression; (c) Finite element mesh model of thin-walled tube.
Metals 12 02163 g002
Figure 3. The present FE and reference.
Metals 12 02163 g003
Figure 4. Comparison of test results and numerical results.
Metals 12 02163 g004
Figure 5. EA and SEA of the filling structure under different filling styles. (a) EA of filling structure. (b) SEA of filling structure.
Metals 12 02163 g005
Figure 6. PCF of filling structure under different filling styles.
Metals 12 02163 g006
Figure 7. Deformation mode of filling structure.
Metals 12 02163 g007
Figure 8. The performance indicatorsof the filling structures under different filling methods: (a) EA; (b) SEA; (c) PCF; (d) CLE.
Metals 12 02163 g008aMetals 12 02163 g008b
Figure 9. Comparison of filled structures: (a) force–displacement diagram; (b) SEA-displacement diagram; (c) deformation mode.
Metals 12 02163 g009aMetals 12 02163 g009b
Figure 10. Design sample points of FB and HF.
Metals 12 02163 g010
Figure 11. The solutions of SEA and PCF under different inertia weights.
Metals 12 02163 g011
Figure 12. Optimization design flow chart.
Metals 12 02163 g012
Figure 13. Comparison of the Pareto boundary of FB, HF and empty tube.
Metals 12 02163 g013
Figure 14. Comparison of the optimal structure: (a) force–displacement diagram; (b) deformation mode.
Metals 12 02163 g014
Table 1. Simplified stress–strain relationship of aluminum foam.
Strain0σp/E0.60.70.750.8
Stress0σpσp1.35 σp5 σp0.05 E
Table 2. Accuracy of the prediction model.
ObjectivesSEAPCF
EstimatorsR2R2adjMARERMSER2R2adjMARERMSE
FB0.98910.982.39%0.0260.99490.99072.18%1.291
HF0.97840.96042.61%0.03070.95580.93525.08%0.3869
Empty tube0.99870.99770.89%0.01150.99810.99651.32%1.1887
Table 3. Parameters of particle swarm algorithm.
ParametersValue
Number of particles10
Maximum number of iterations100
Inertia weight0.7
Personal learning coefficient1.5
Global learning coefficient1.5
Publisher’s Note: MDPI stays neutral with regard to jurisdictional claims in published maps and institutional affiliations.

