1. Introduction
Currently, the production of metals, including aluminum, is focused on ensuring high metallurgical purity of alloys. This is related to the use of a two-stage production technology. In the first stage, a metal bath is produced from raw materials, and in the second stage, the required metallurgical purity of the alloys is obtained [
1,
2]. In the case of aluminum, refining takes place in a crucible or ladle using gas-permeable fittings or a rotor through which fine refining gas bubbles are introduced into the liquid metal in order to remove harmful impurities such as hydrogen or sodium, calcium, oxides, borides, and carbides [
3,
4].
The process of blowing inert gases into liquid metal is characterized by an extraordinary complexity of hydrodynamic conditions. The speed and efficiency of the process is determined by the appropriate comminution and dispersion of gas bubbles in the liquid metal [
5,
6,
7].
Two types of rotors are used in the industry: a propeller, in which gas flows through small holes in the impeller axis, and a pump type, in which gas is introduced into the metal in an open head chamber [
8,
9,
10]. The latter type of rotor can introduce more refining gas into the liquid metal and thus provide a more efficient process. The rotor design itself is of great importance for the distribution of gas bubbles throughout the volume of the liquid metal in the crucible or ladle. It was found that 60% of the energy supplied by the rotor in the stirred reactor is dissipated in the area of the rotor [
11,
12]. The trajectory of gas bubble flow in the areas between the rotor and the refining reactor wall was investigated [
13,
14,
15,
16,
17,
18]. Experimental studies of the gas dispersion behavior and properties of various refining reactors have shown that the local bubble size distribution can vary significantly in different areas of the reactor [
14]. Smaller bubbles are located in the area of high turbulence near the rotor, while the larger bubbles, due to bubble coalescence and incomplete gas dispersion, are concentrated in the area of the mass above the rotor [
15,
16]. It was also observed that the highest kinetic energy is observed on the metal surface, which indicates the formation of small metal geysers on the surface, which is not favorable from the point of view of the process due to the risk of reintroducing hydrogen into aluminum [
17,
18].
Physical modelling and numerical simulations have been used in many scientific articles related to the optimization of the refining process, i.e., the selection of process parameters, such as gas flow rate and rotor speed, in order to ensure the best possible degassing efficiency, i.e., hydrogen removal [
19,
20,
21,
22,
23,
24,
25]. In the case of the rotor design, the simulation results take into account the influence of the angle of rotation of the rotor blades on the nature of the flow [
19] or the structure of the vortices formed in liquid aluminum [
26]. In the work [
19], based on the results of the averaged time pressure on the rotor surface, it was found that increasing the torsion angle reduces the efficiency of dispersion. Moreover, it was found that the obtained vortex structure influences the control of gas bubble dispersion in a liquid and consequently improves the efficiency of metal refining [
20,
21].
One of the most frequently studied issues is the influence of gas flow on the degree of dispersion [
27,
28,
29,
30,
31,
32,
33,
34]. The tests are performed with different rotors for different process parameters and with various methods using water models [
35,
36,
37,
38] or numerical simulations [
39,
40,
41,
42]. The model predicts the spatial distribution of gas holdup, the average local bubble size and the flow structure [
41,
42]. In the case of numerical studies, the behavior of gas mixing and dispersion in reaction chambers was investigated, where the authors used one bubble number distribution equation to predict the bubble size distribution in a cell, which was also not confirmed experimentally, and thus may lead to inaccurate prediction of flow phenomena [
14,
39]. The use of the computational fluid dynamics (CFD)—a population balance model (PBM) to simulate the bubble size distribution in the reaction chamber showed that the bubble size distribution had a significant effect on the predicted flotation rate constant. The authors noticed that higher values of the flotation rate constants are observed taking into account the full range of the bubble size distribution than assuming that the bubbles are one size [
42]. The optimal flotation rate constant is necessary not only to maximize the effectiveness of encountering bubble-particles but also to minimize detachment of bubble-particles. Moreover, the cell turbulence leads to a slight increase in the flotation rate constant of fine and intermediate sizes of dense particles, and hence to an increase in particle–bubble collision frequency and production of smaller bubbles by breakup.
Based on experimental studies carried out on physical water models, it is possible to assign a specific type of dispersion for specific process parameters (gas flow and rotor speed, column flow or no dispersion, minimum dispersion, fine dispersion, intimate dispersion, chain flow) [
32,
33,
34]. It should be noted, however, that practically for each new rotor design, separate model tests should be carried out, because the degree of dispersion may differ significantly from the degree of dispersion given for other rotors, e.g., Alpur [
13]. The design of some rotors, especially the pump type, requires a high rotor speed (above 500 rpm), while propeller type rotors do not require such high rotational speeds, usually in the range of 300–500 rpm [
20]. That is why it is so important to conduct model tests in order to select the optimal operating range of the rotor, and only in this respect to test it in industrial conditions, which saves both time and material.
One of the most interesting issues is rotor lifetime, but there is little scientific research on this. Usually, foundries try to select the rotors’ material themselves, which usually means choosing a different type of graphite. Therefore, we decided to take a closer look at the problem of rotor wear in relation to various rotor designs and correlate it with the effectiveness of removing hydrogen and other impurities from aluminum.
2. Materials and Methodology
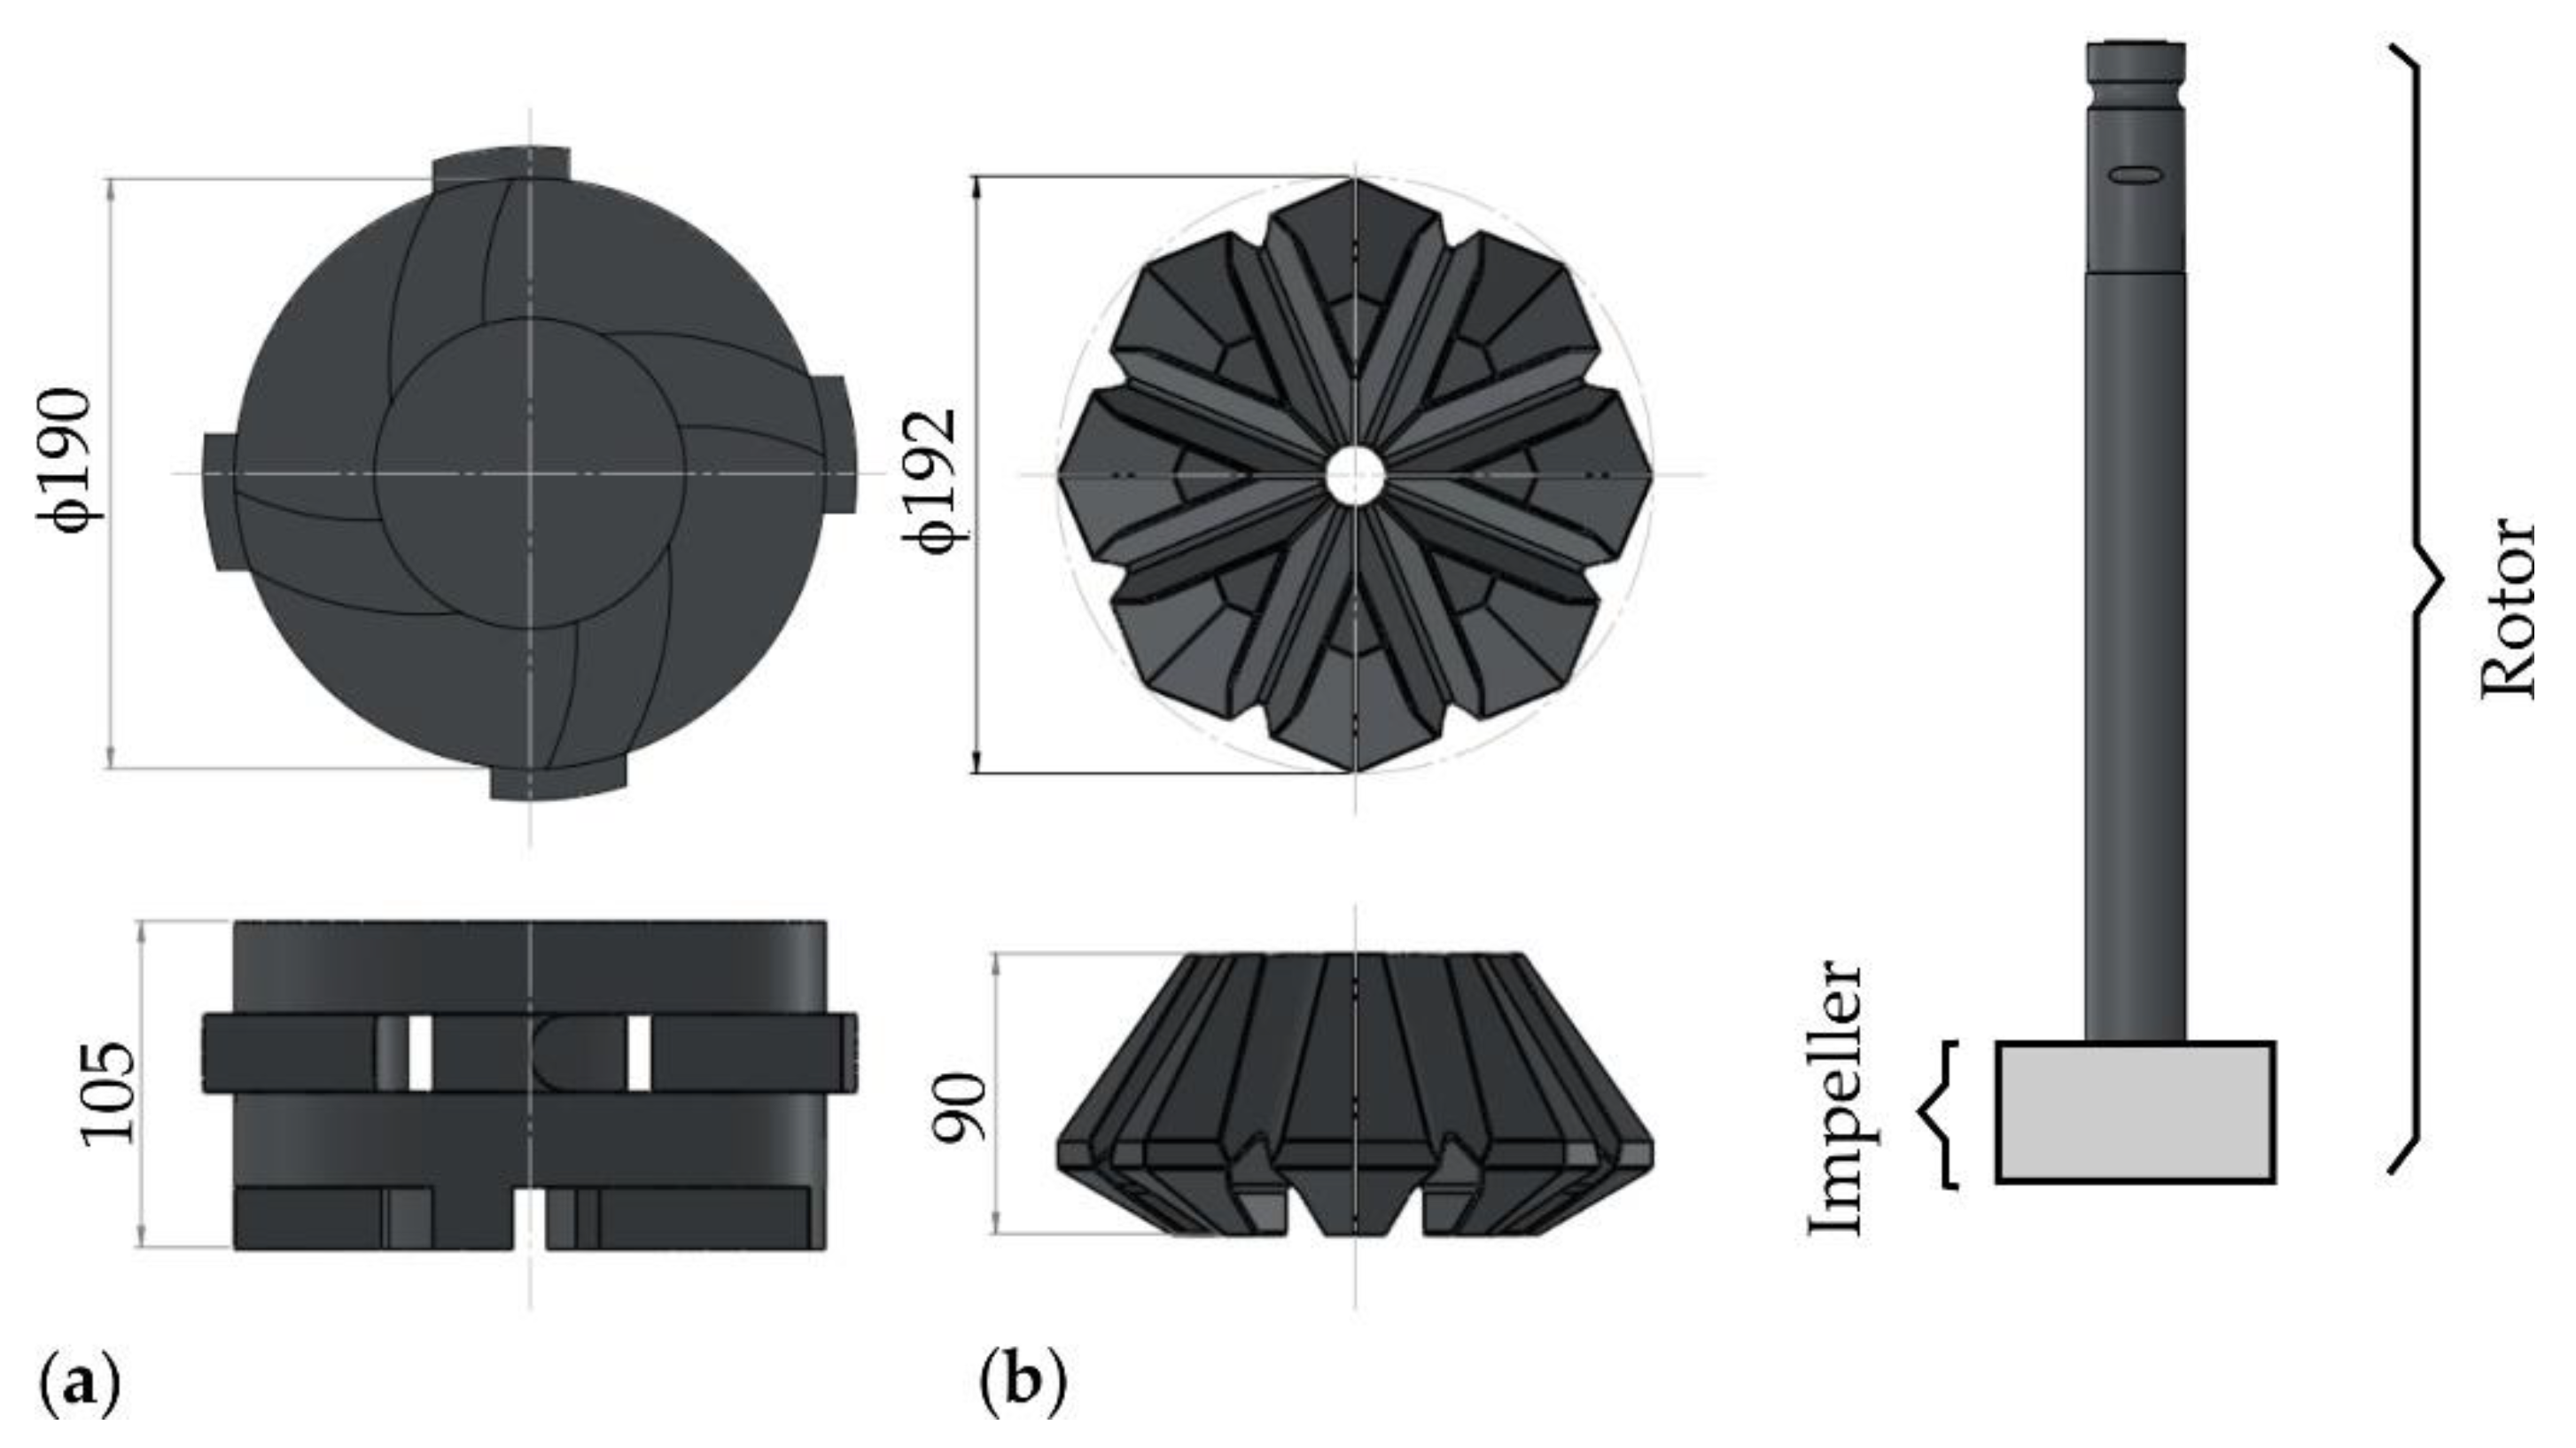
The refining process was carried out on the AlSi9Cu3(Fe) alloy with the use of a foundry degassing unit (FDU). This device consists of a crucible for the aluminum melt and a drive with a shaft ending with an impeller, i.e., a rotor. The refining process takes 180 s. The study investigated the impact of the impeller geometry on its wear and the efficiency of the aluminum refining process.
Figure 1 shows the impellers used in the tests with their basic dimensions.
The refining process was carried out with variable process parameters, such as gas flow rate, rotary impeller speed and working height (rotor height from the bottom of the crucible).
Table 1 presents the process parameters of tests carried out in industrial conditions for two types of impellers. Both impellers were made of graphite.
In order to determine impeller wear, the maximum number of refining cycles for each impeller was determined (based on consultation with the foundry). The number of cycles for the I impeller was 1112 and for the II impeller 1103 refining cycles. This number of refining cycles was assumed to be 100% of the impeller wear and the number of cycles was converted to 25%, 50%, 75% of the impeller wear to compare the rotor wear rate and its effect on the refining process. The number of cycles depending on the degree of impeller wear is shown in
Table 2. The tests were carried out for five cases of rotor wear: 0%, 25%, 50%, 75%, and 100%. Several samples were taken for each variant to determine the efficiency of the refining process.
The research also included a 3D scan of the worn components using the ROMER Absolute Arm 7525SI measuring arm. The worn components were then compared with the original geometries of impellers I and II. Based on this comparison, the material loss at the end of impellers life was estimated.
To determine the efficiency of refining, the double-weighting method was used to calculate the Dichte Index (DI). The method consists in comparing the density of an alloy sample which solidifies under atmospheric pressure with a sample which solidifies under reduced pressure:
where:
DI—Dichte Index, %;
rs,atm—density of the sample solidified under atmospheric pressure, kg·m
−3;
rs,vac—density of the sample solidified in a vacuum, kg·m
−3.
The measuring device consists of a vacuum chamber with precise pressure regulation (usually works at a pressure of 8 kPa) and a balance (accuracy of 0.01 g required), with a water container and a hinge for the sample.
A sample of the alloy is taken from the melting furnace and poured into two test crucibles of approximately 40–80 mL. One sample solidifies at atmospheric pressure, and the other one solidifies under a defined vacuum in a vacuum chamber. The sample density is calculated from the formula:
where:
rs—sample density, kg/m
3;
Vs—sample volume, m
3;
ms,H2O—weight of the sample immersed in water, kg;
ms—sample weight in the air, kg;
rH2O—water density, kg·m
−3.
Additionally, visual tests were performed in accordance with the Dross Test. A sample of the melt weighing 250–300 g is poured into a metal or ceramic crucible and allowed to solidify at a pressure lower than 0.5 kPa. The amount of hydrogen released in a vacuum is much greater than solidification at atmospheric pressure, so the test is much more sensitive. A constant vacuum and a comparable solidification time (with approximately a constant amount of metal) are required to compare the results. Therefore, with the same hydrogen content in pure metal, fewer bubbles are formed. The result obtained from this type of test is therefore a comprehensive assessment of gasification and the content of inclusions. Semi-quantitative evaluation of the vacuum solidification tests can be performed by visually comparing the upper surfaces of the samples.
3. Results of the Research
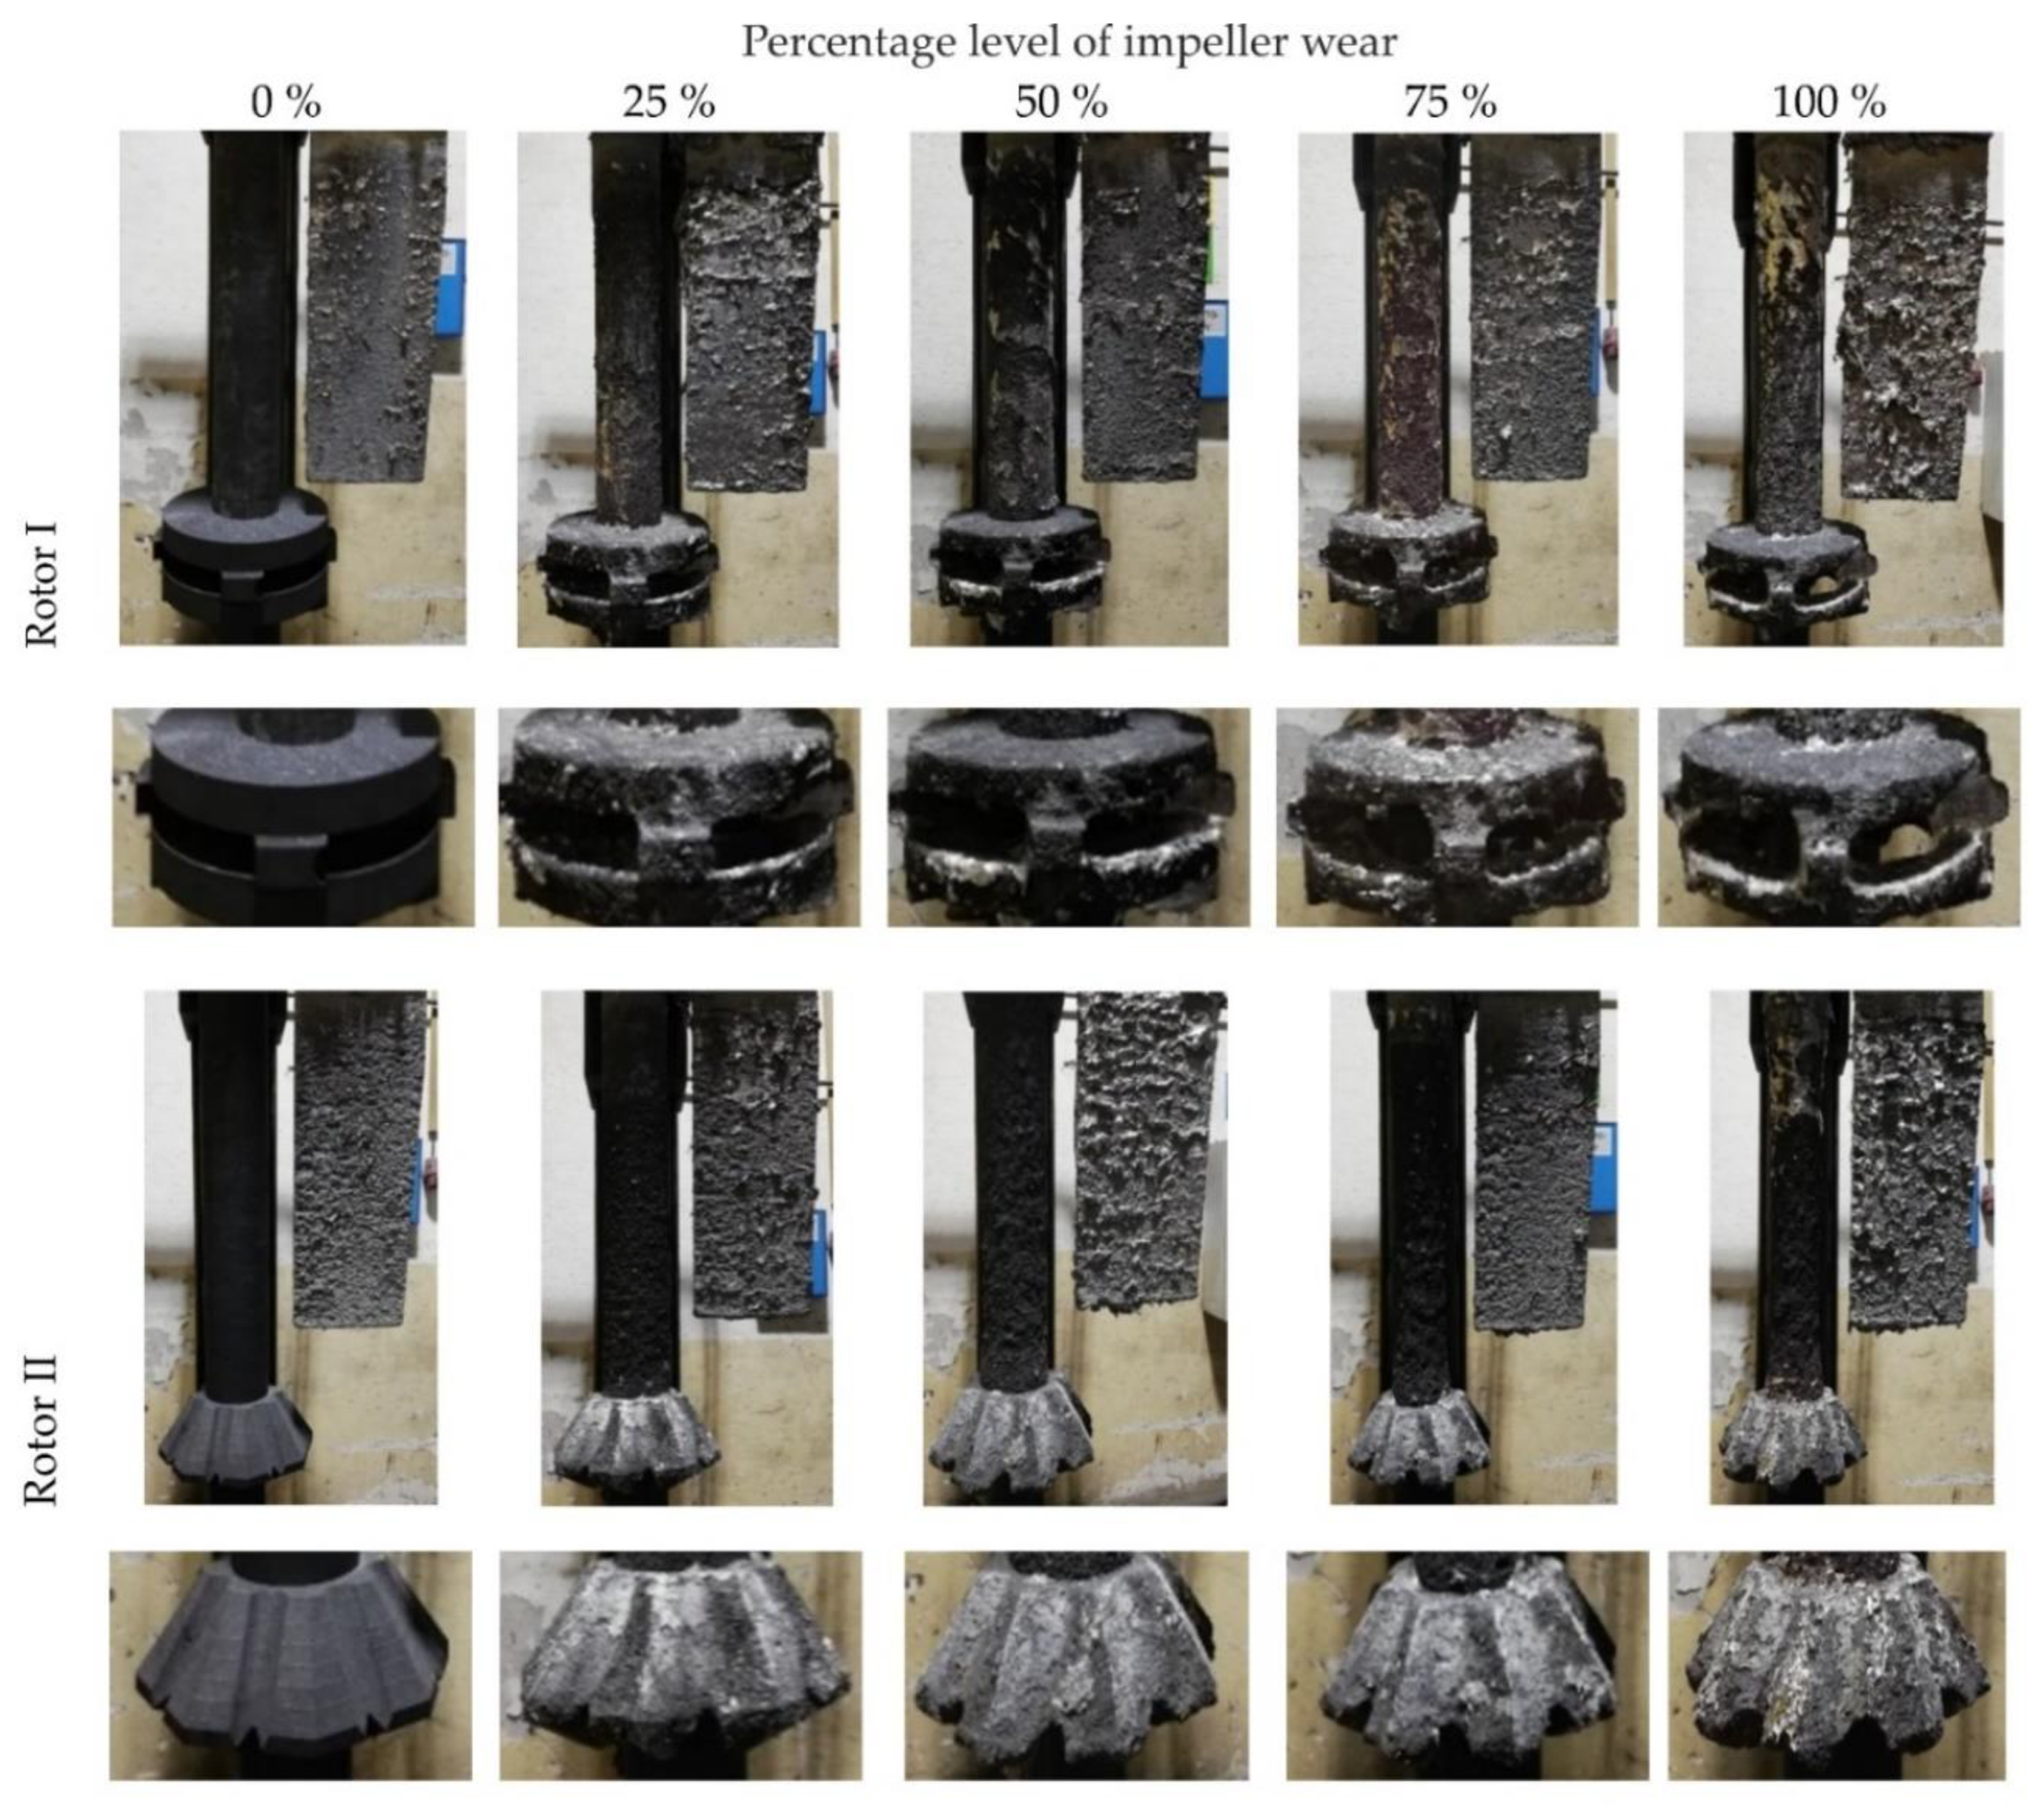
Figure 2 shows the degree of wear of the rotors for a different number of refining cycles. It can be seen that for impeller I, after 25% wear, metal remains begin to appear on the impeller. The edges of the impeller are no longer sharp but rounded. No major losses of graphite were observed. At 50% wear, the lower edge of the impeller is slightly thinned, there are deposits of metal on the impeller, but it is still fully operational. After 75% wear, significant metal deposits are visible on the impeller, and the lower edge of the impeller is much smaller than at the beginning of the process. After 1112 refining cycles, the impeller has significant metal deposits, and the lower edge of the impeller is smaller than the new impeller, which can cause it to break at any time. In the case of the rotor shaft, an increasing amount of silver metal infiltration is observed after successive refining cycles.
In the case of rotor II, with 25% rotor wear, it can be seen that the condition of the impeller has not deteriorated significantly. It is covered with silver metal drips, but shows no loss of graphite and no signs of wear. After 623 refining cycles (50% rotor wear) the shape of the impeller has slightly changed, and significant metal infiltration is also visible. At 75% rotor wear, the metal drips on the impeller are significant, but visually the impeller looks no worse than for the 623 refining cycles. After 1103 refining cycles, significant metal infiltration on the impeller can be observed, the impeller edges have become irregular, and it can be seen that the impeller needs to be replaced. For the rotor shaft, slight metal dripping can be observed during all refining cycles, but compared to rotor II, the condition of the shaft is much better.
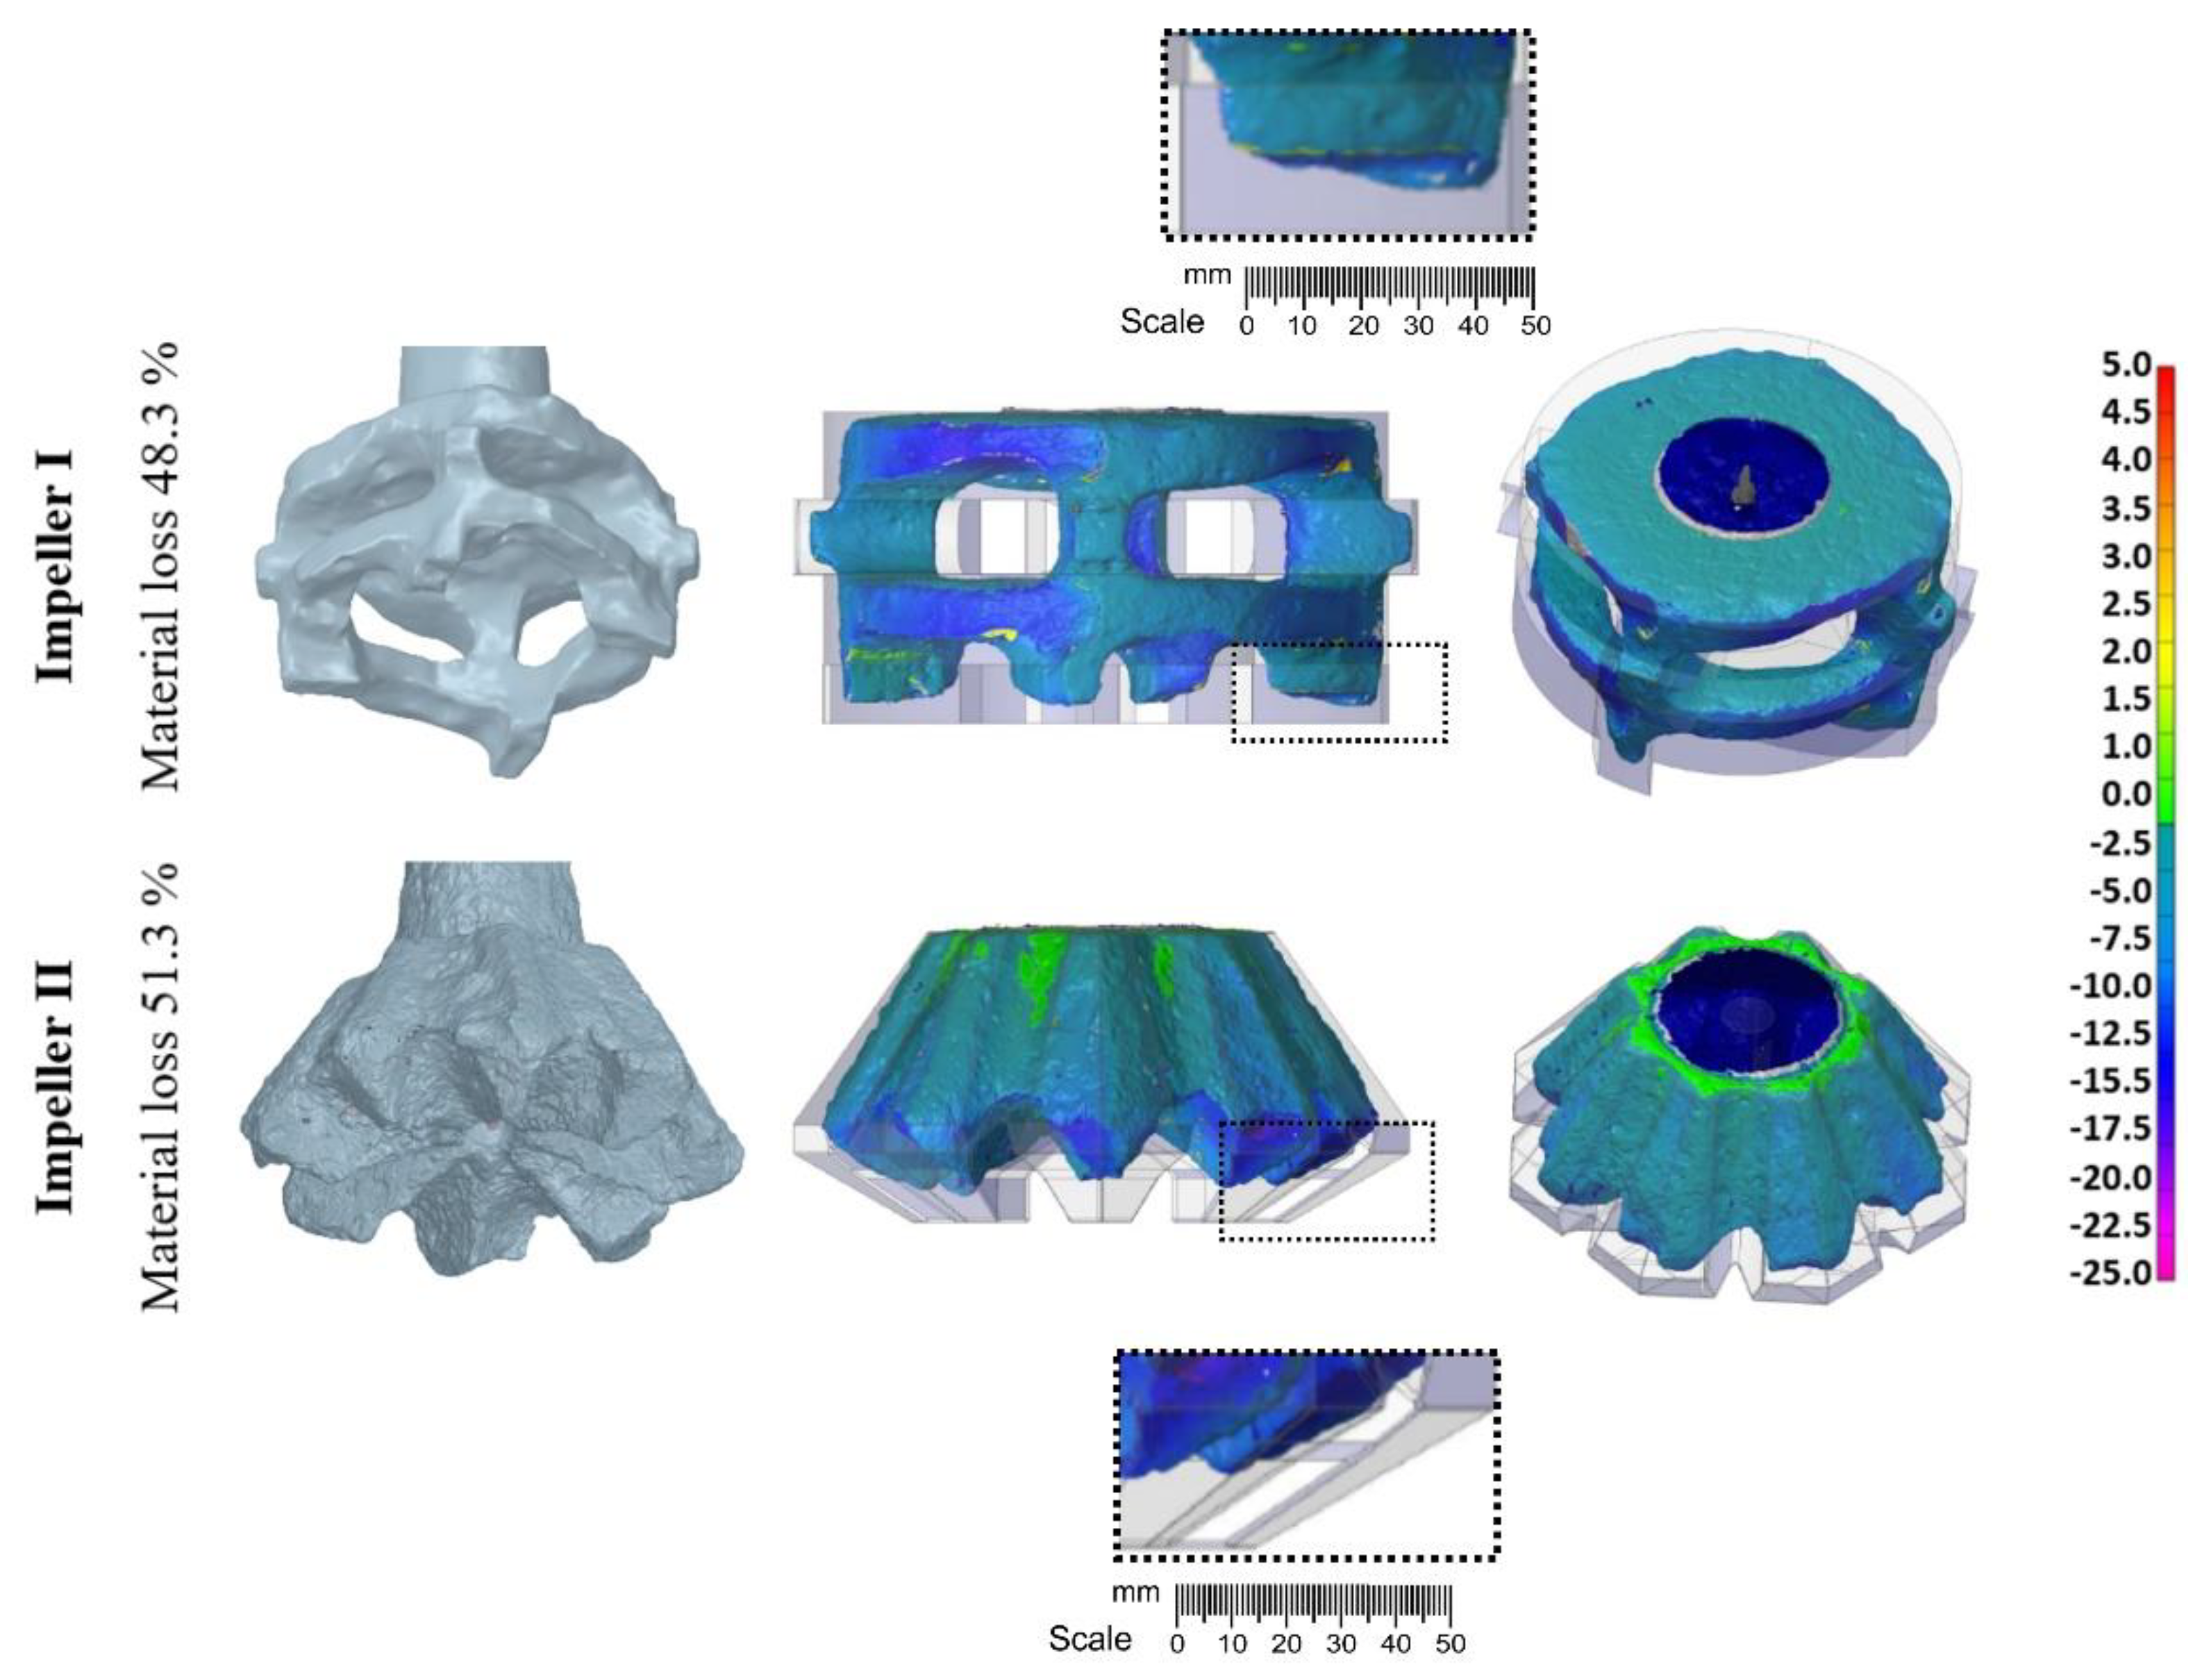
Figure 3 shows the data obtained from 3D scanning. It is clear from the figure that the wear of the impellers concerned mainly their underside. There were also maximum deviations from the original shape at this point. In the case of impeller I, the maximum deviation was about 10 mm, and about 13 mm in the case of impeller II.
Table 3 shows the rotor wear parameters read after the 3D scan. It can be seen that higher material consumption was observed for rotor II (51.3%), despite the lower number of cycles. The difference in the consumption of rotor materials I and II is not large and amounts to 3%.
Table 4 and
Table 5 show the Dichte Index results for the rotor variants tested at the beginning of the refining process (FDU
start) and the end of the refining process (FDU
end) after 180 s. The tests took into account the degree of rotor wear. In each case, a different number of samples is taken for testing, due to the specifications of the tests conducted in industrial conditions.
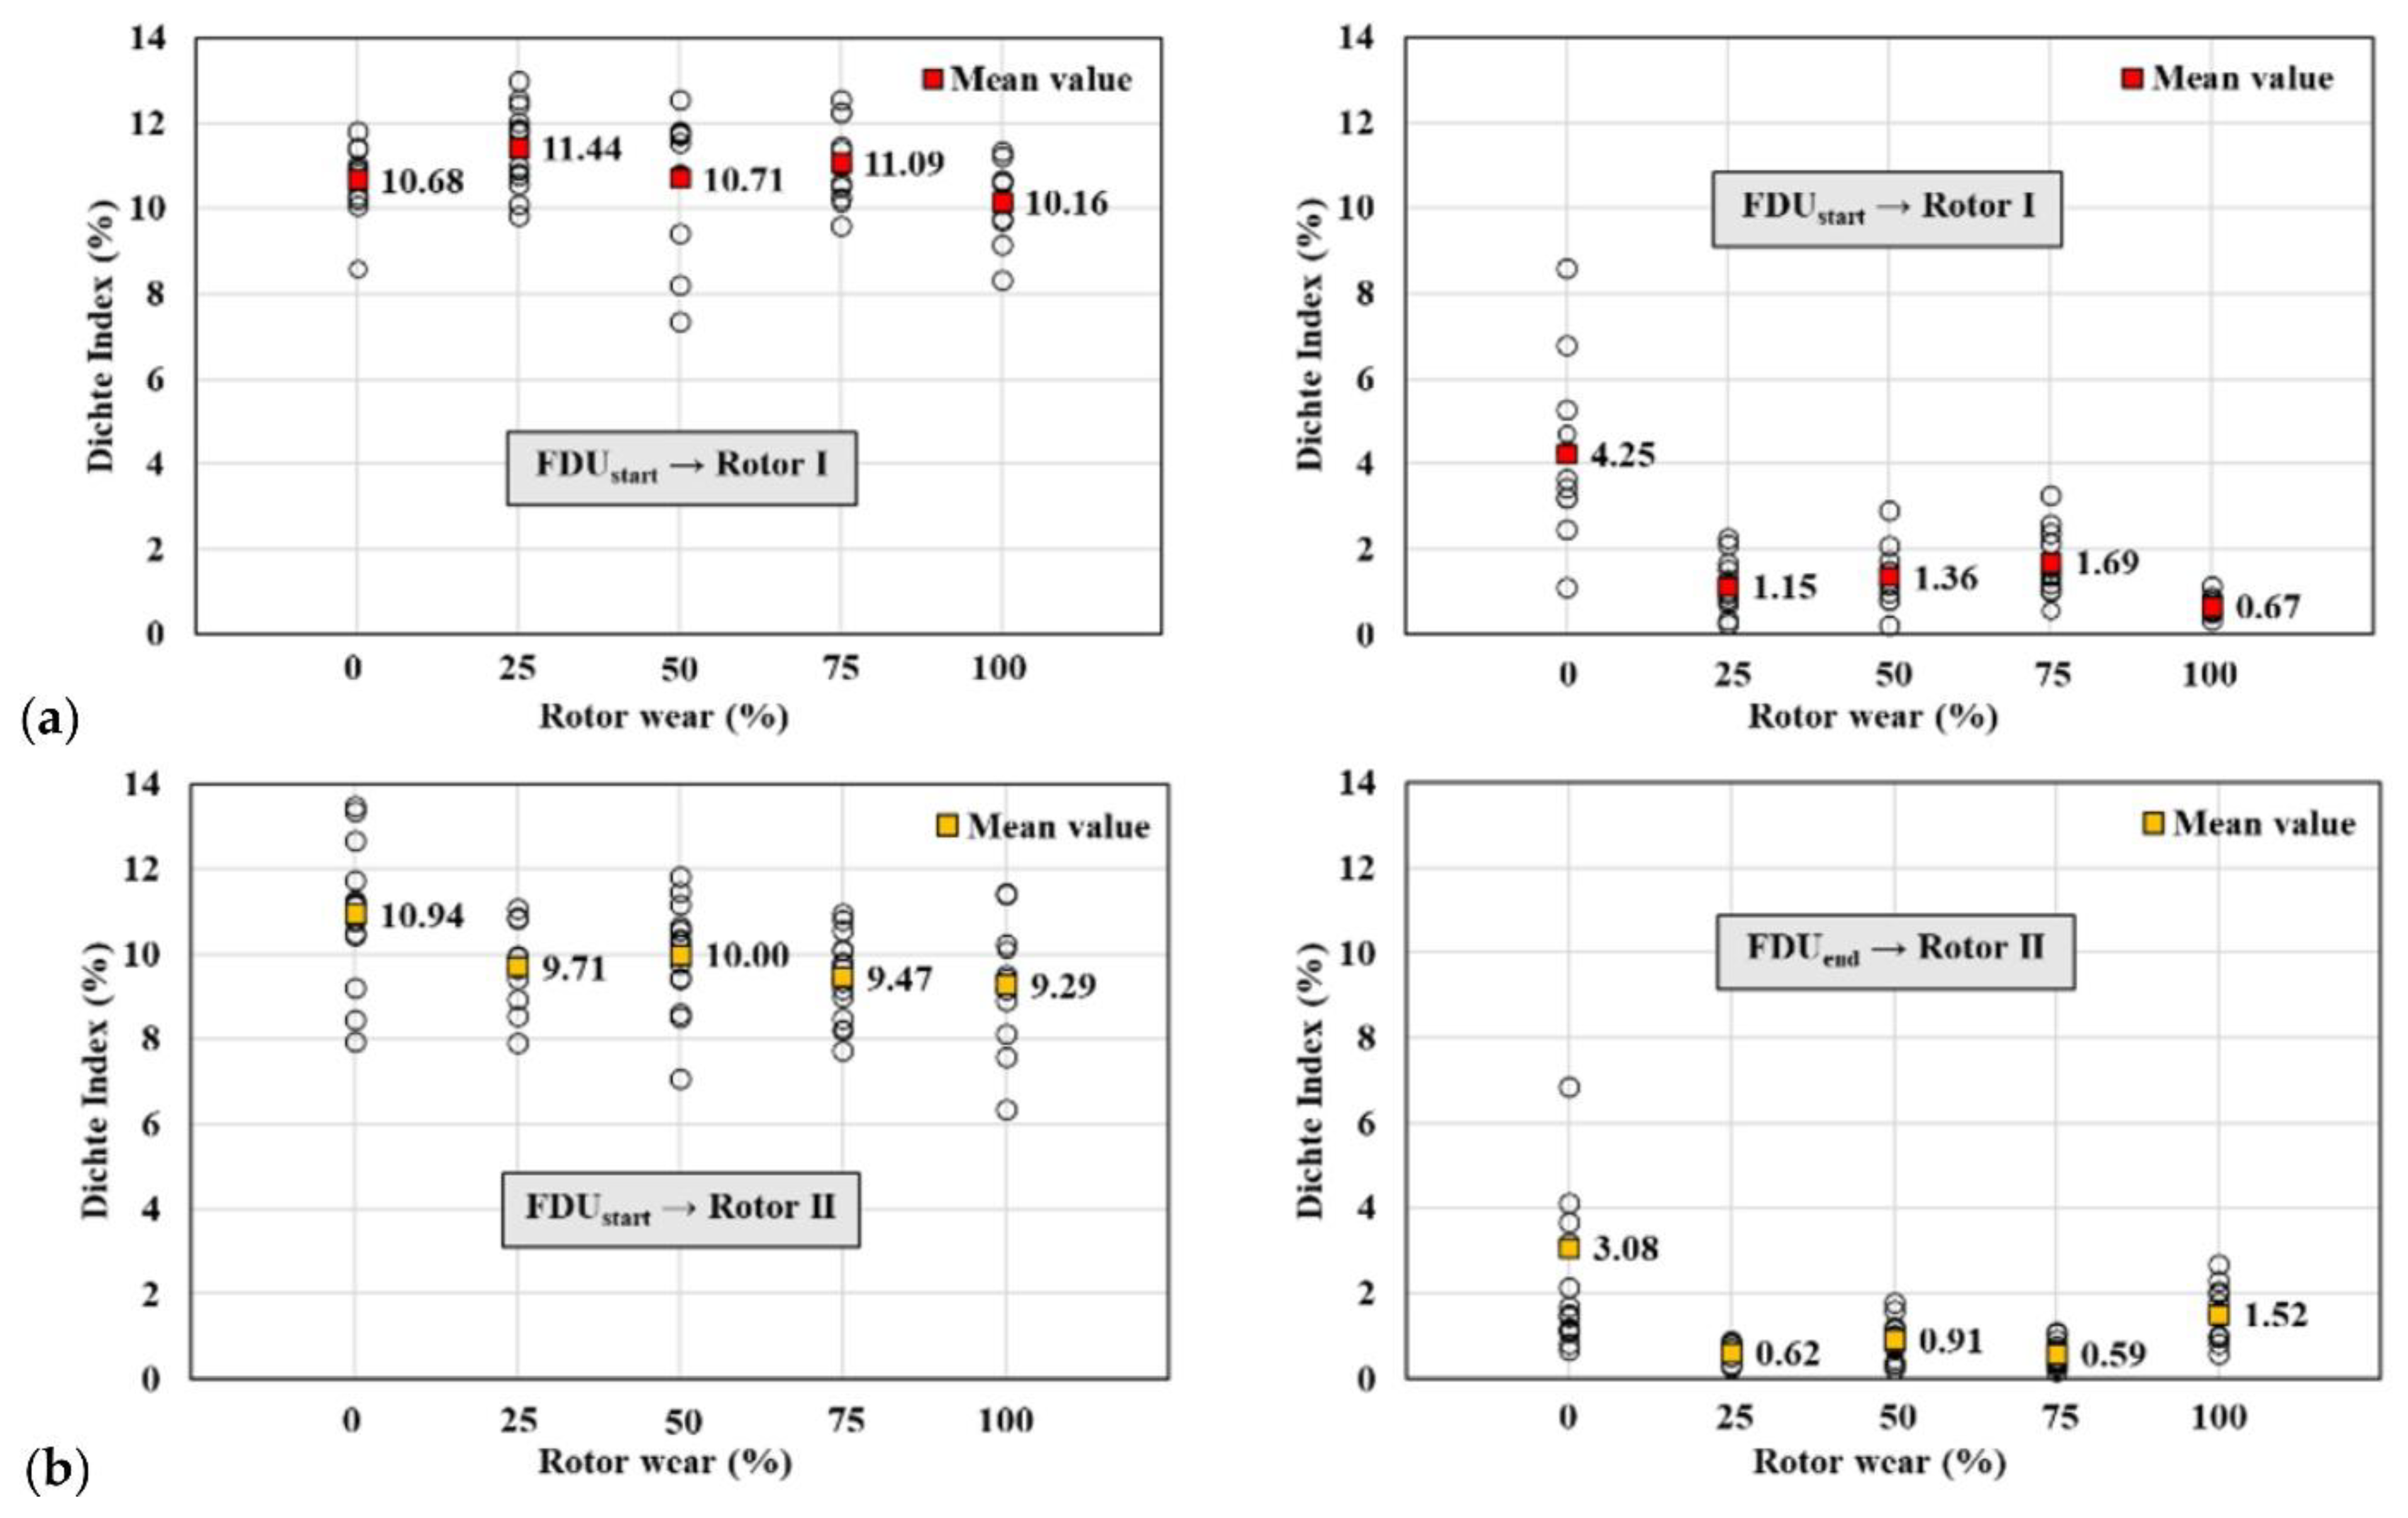
The average values for the samples taken at the beginning and at the end of the aluminum alloy refining process for rotors I and II are compared in
Figure 4.
It can be seen that for the beginning of the refining for both rotor I and II, the lowest Dichte Index (DI) was recorded for the number of refining cycles corresponding to 100% rotor wear. After refining, the average values of the Dichte Index for rotor I for the new rotor (0% wear) indicate quite high DI results (DI0 = 4.25%). This may be because the new rotor contains a certain amount of moisture which is only removed during operation. After 25% wear and subsequently 50% and 75% wear, much better results of hydrogen removal can be observed (DI25 = 1.15%, DI50 = 1.36% and DI75 = 1.69%, respectively). The best DI values, i.e., the best removal of hydrogen from the aluminum alloy, were obtained for rotor I with 100% wear (DI100 = 0.67%). After the refining process, the average DI values for the new rotor II were relatively high compared to those obtained for this rotor at other stages of wear, as was rotor I. However, these values were lower than that of rotor I and amounted to DI0 = 3.08%. DI values for the subsequent refining cycles corresponding to 25%, 50% and 75% wear were at a similar level (DI25 = 0.62%, DI50 = 0.91% and DI75 = 0.59, respectively). On the other hand, a significant increase in the DI index can be seen at 100% wear of rotor II (DI100 = 1.52%), which means that the hydrogen removal properties of rotor II have deteriorated significantly. This indicates that the rotor should be operated up to approximately 950 refining cycles without degrading the hydrogen removal efficiency of the liquid alloy (melt).
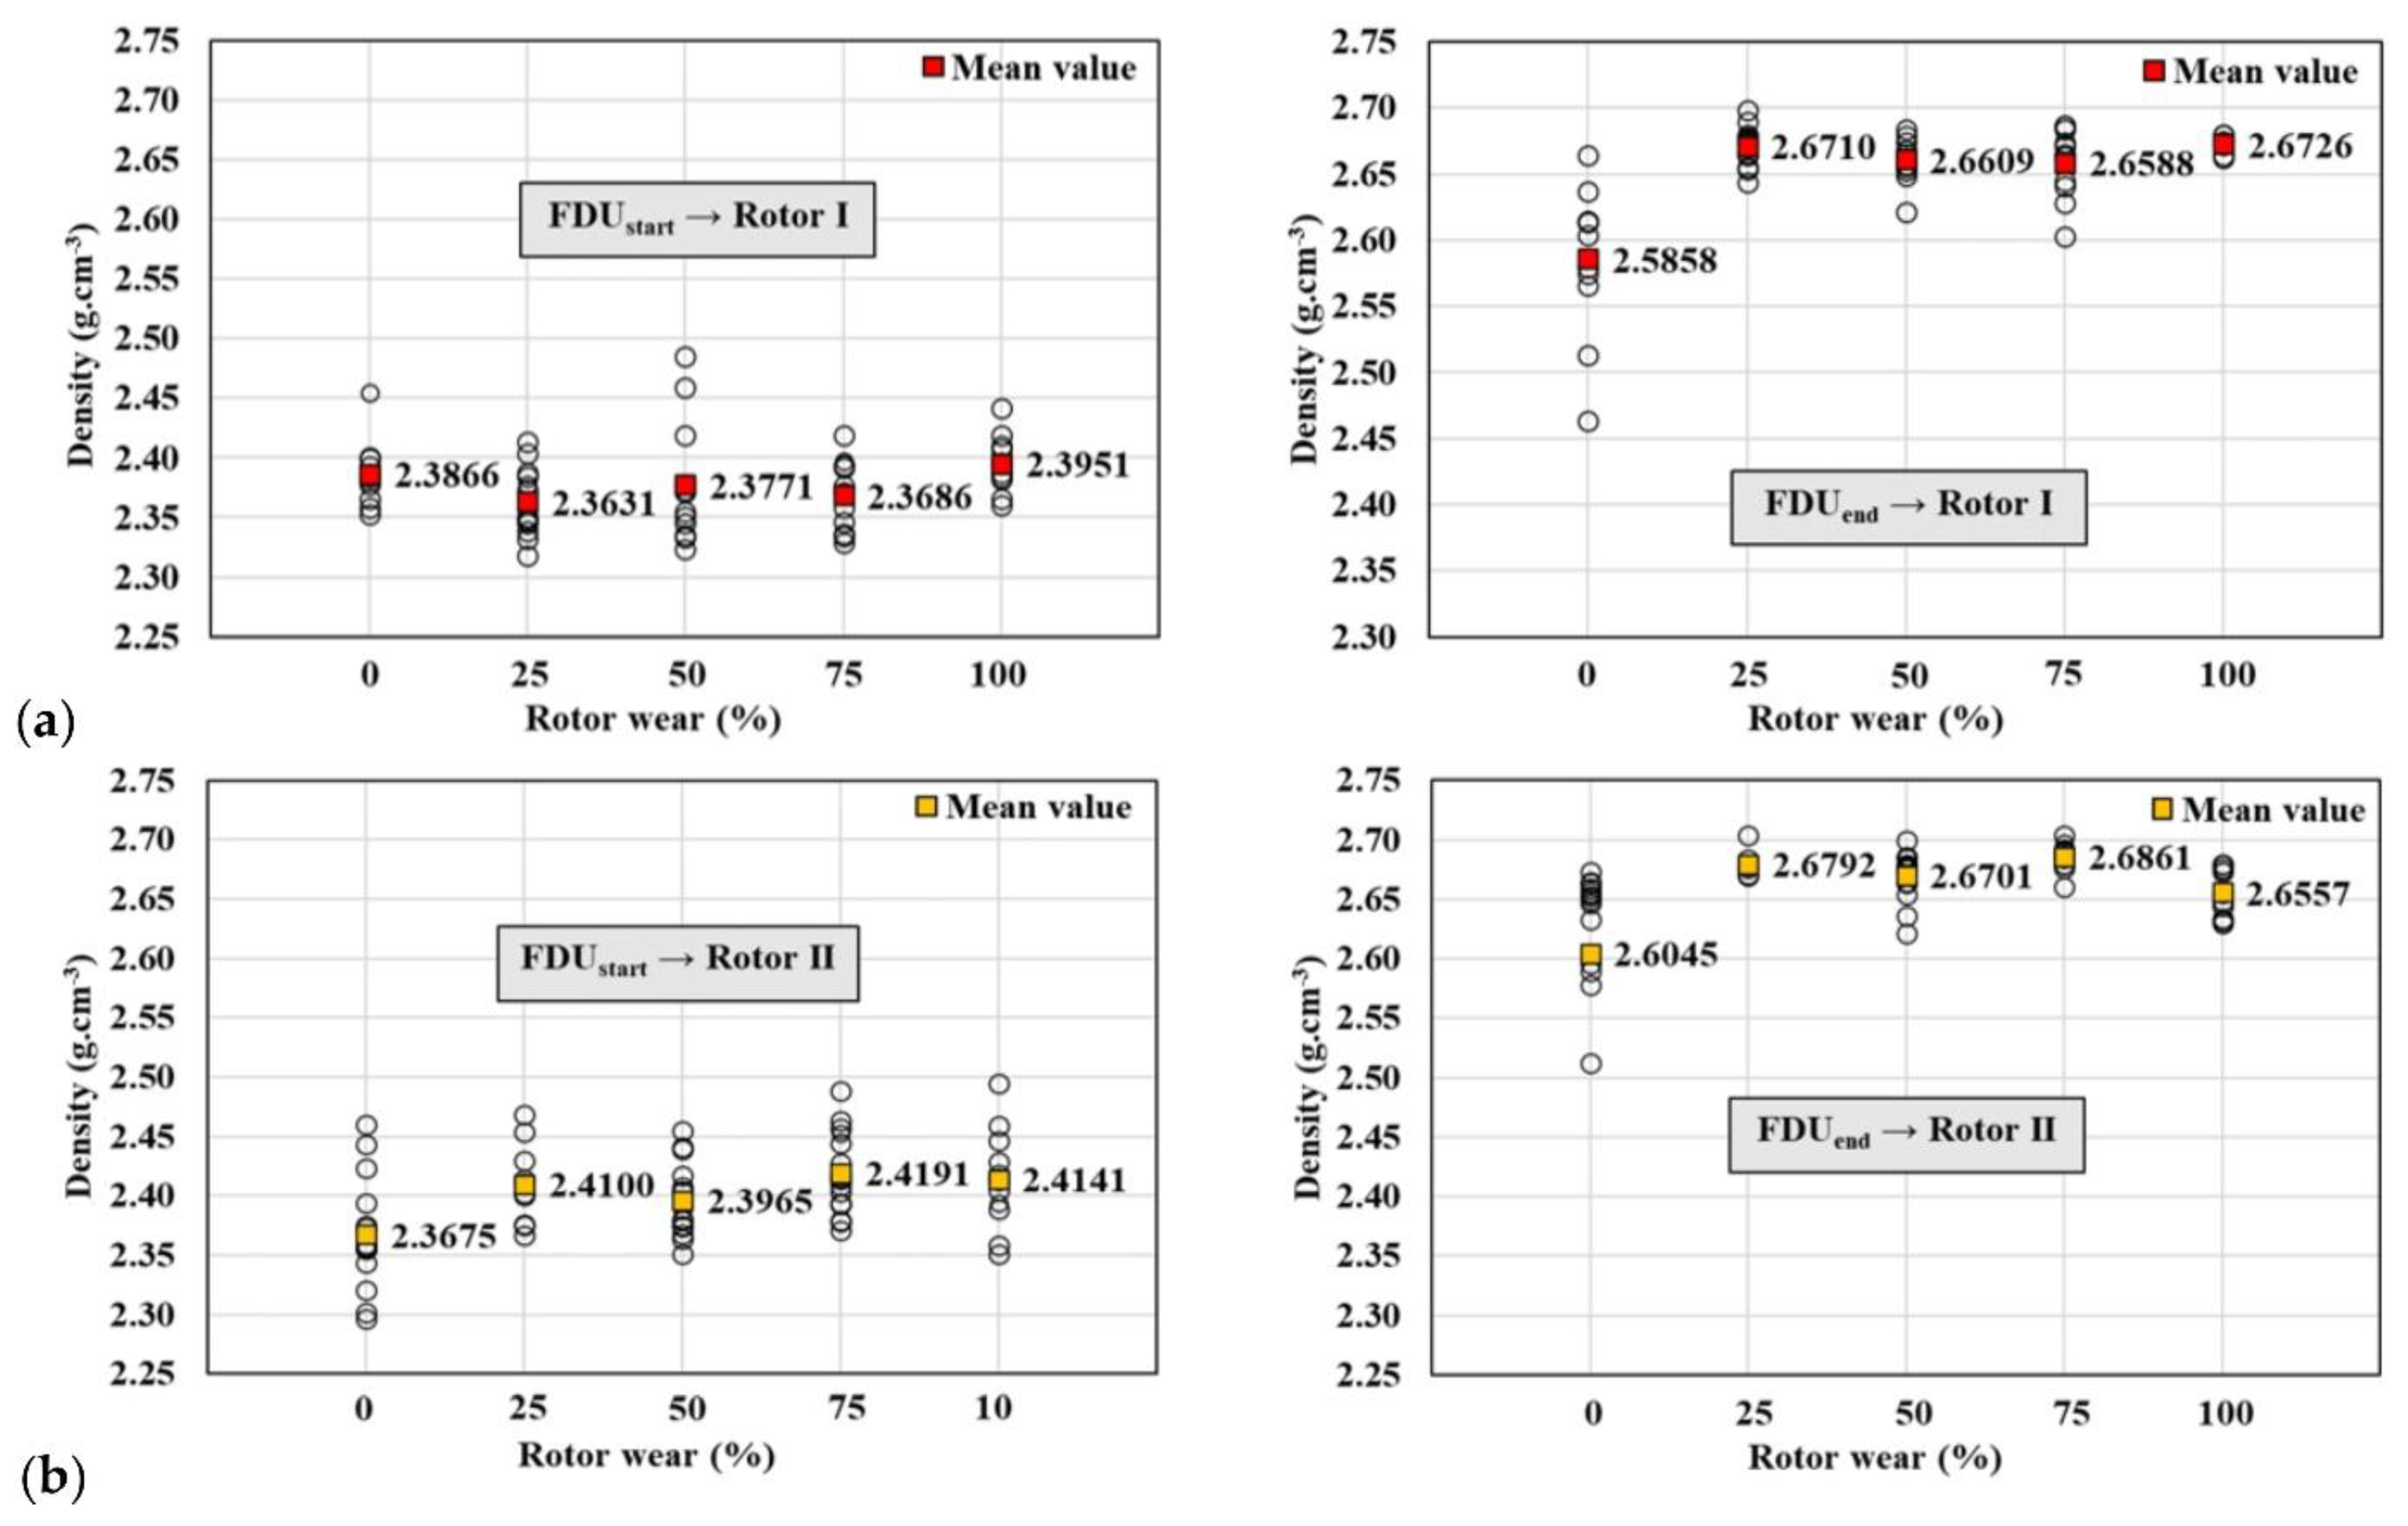
Based on the Dichte Index, the density values for rotors I and II were also calculated and summarized for the beginning (FDU
start) and end (FDU
end) of the refining process for individual stages of rotor wear.
Table 6 and
Table 7 show the density values for individual melts for the beginning and end of the refining process for rotors I and II.
Figure 5 shows the averaged results of the melts for each stage of rotor wear. The largest changes in densities were recorded for the new rotors, both I and II, just at the beginning of refining for the new rotor (0% wear). In other cases, the differences in the densities for rotor I were not significant: from 2.3866 to 2.395 g·cm
−3 at the start of refining for the rotor wear stages from 25% to 100% (standard deviation lower than 0.05) and from 2.5858 to 2.6726 g·cm
−3 at the end of the refining process (standard deviation lower than 0.06). For rotor II, the melt density was 2.3675 to 2.4141 g·cm
−3 at the start of refining for the rotor wear stages from 25% to 100%—standard deviation was lower than 0.05. After the refining process, for the same wear cases, the average value of the alloy density was 2.6045 g·cm
−3 for 25% rotor wear (standard deviation—0.11) and 2.6557 g·cm
−3 for 100% rotor wear (standard deviation—0.03).
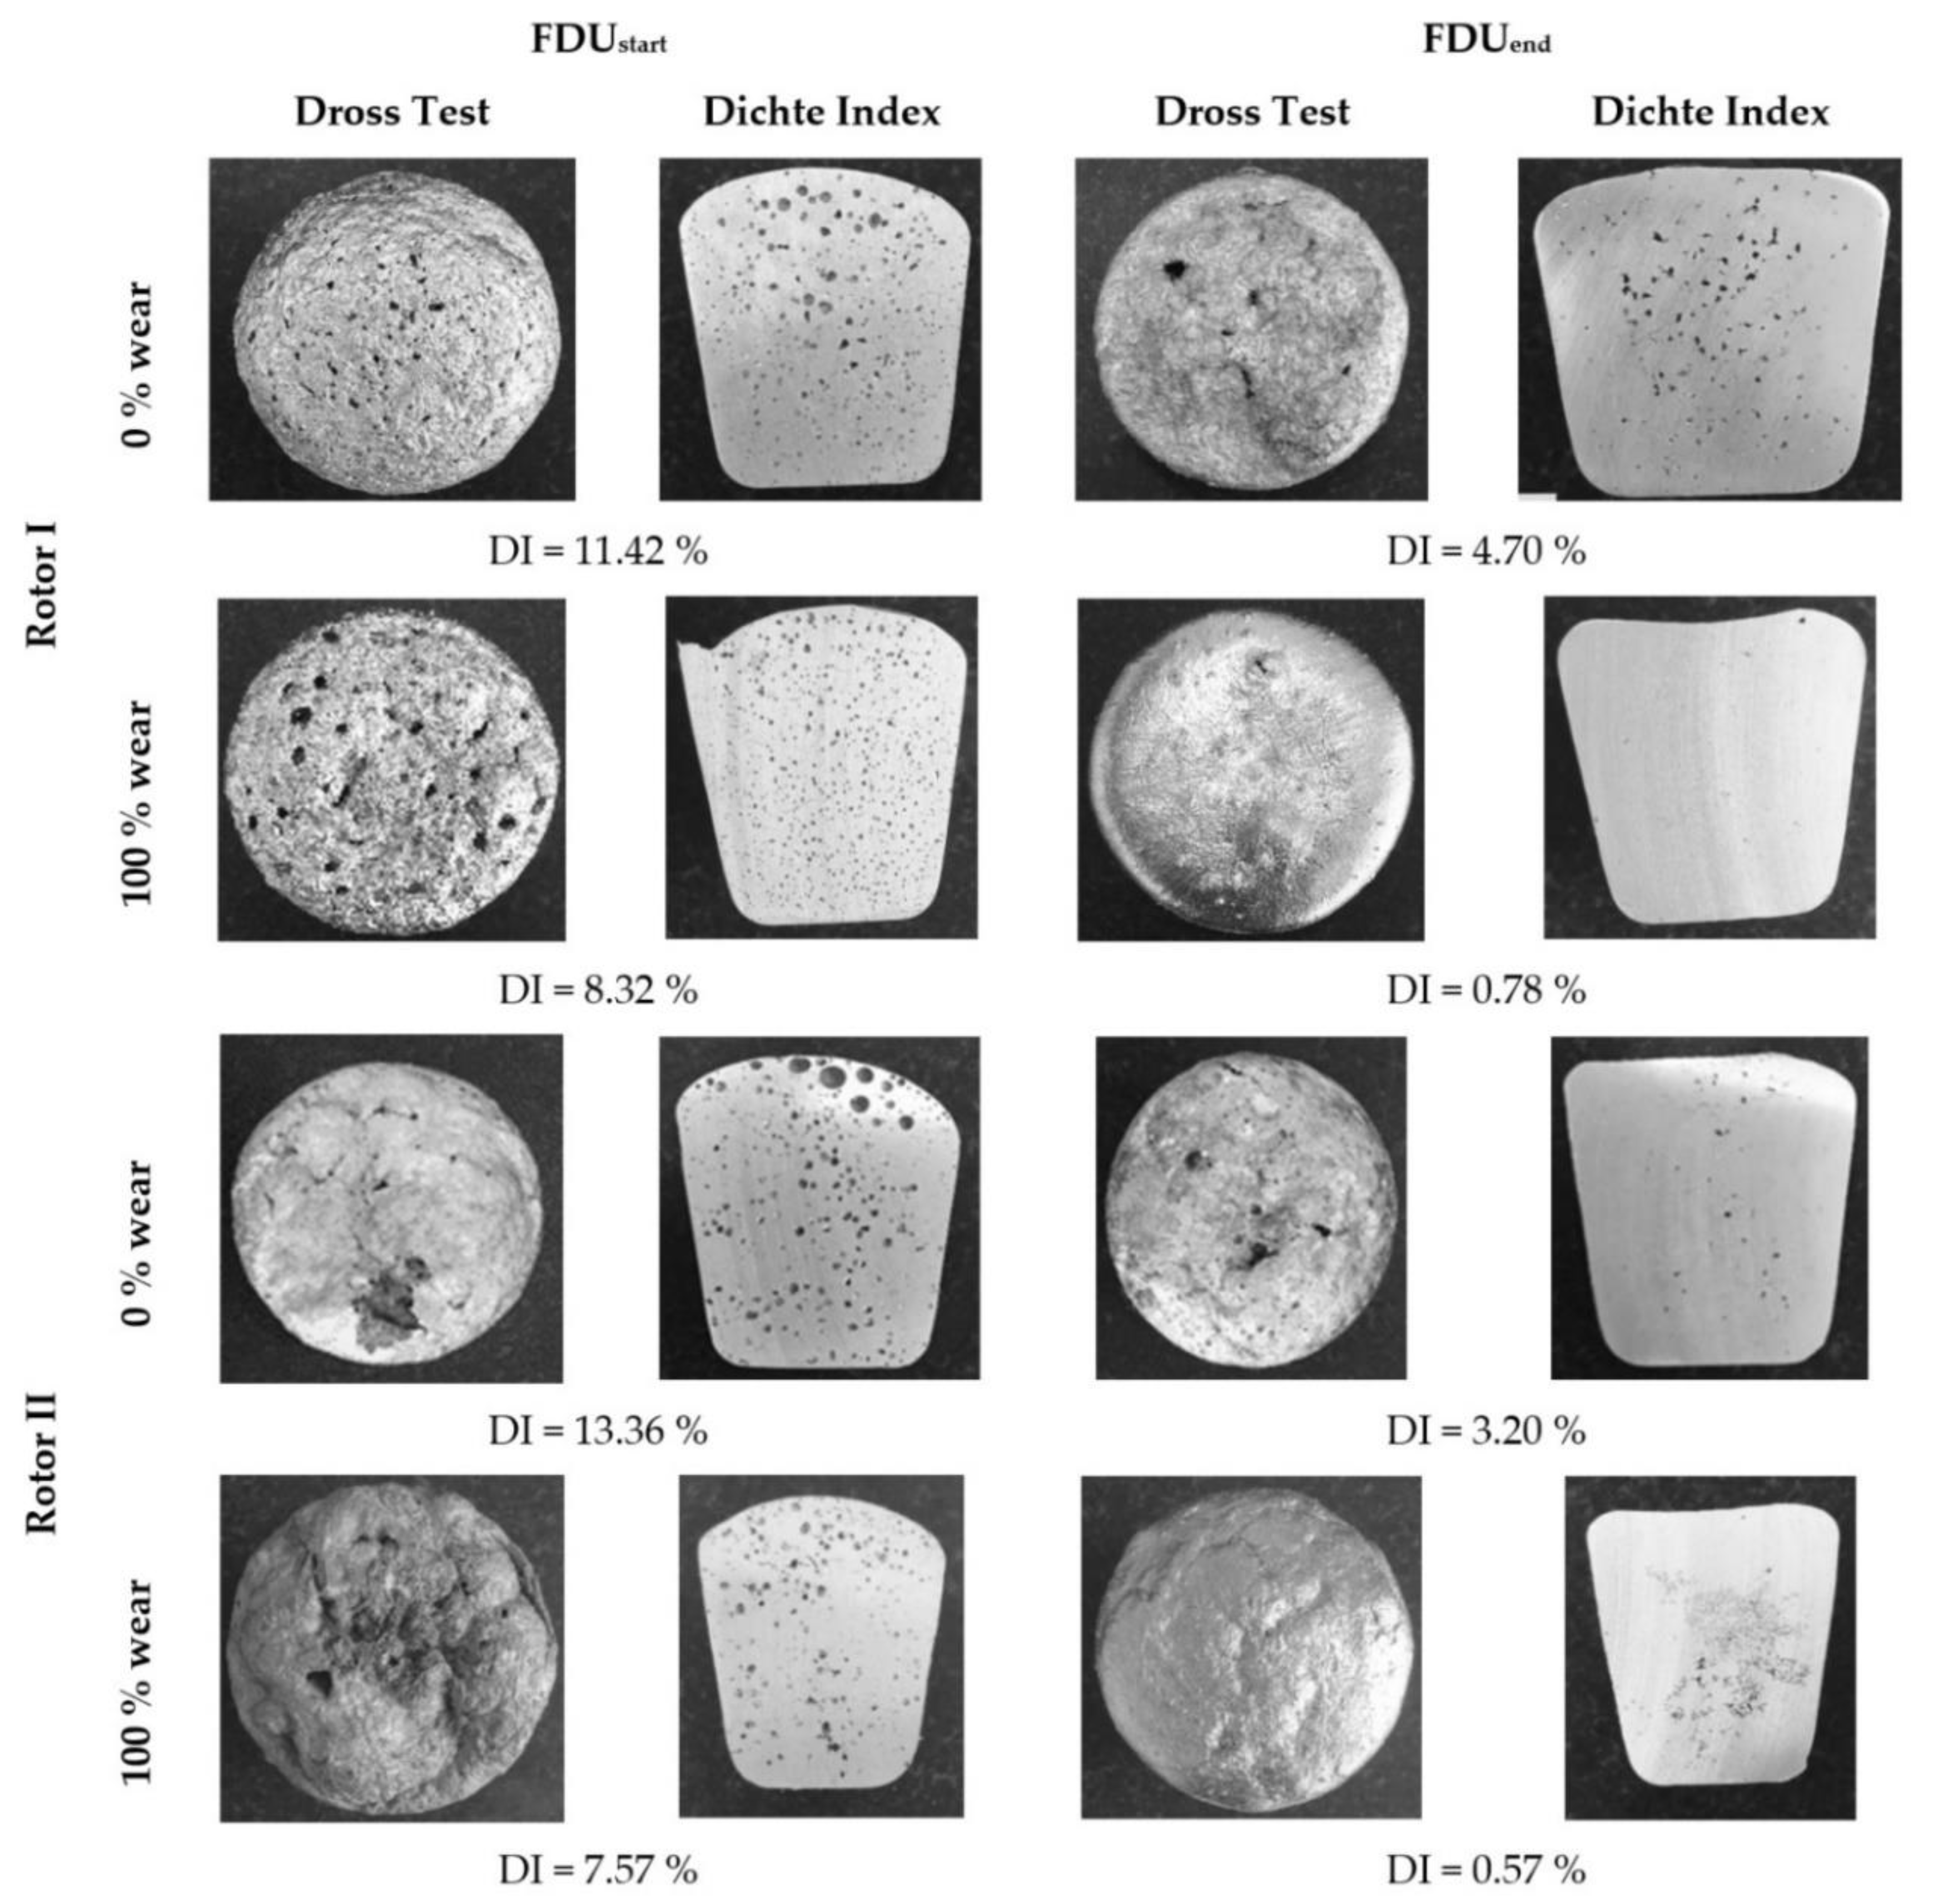
Figure 6 shows the cross-sections of samples taken during the Dross Test to determine non-metallic impurities and a comparison of the size and number of cavities for rotor I and cases of rotor wear 0% and 100%. At the beginning of the refining process, the surface of the sample is porous and uneven, especially in the case of a 100% wear rotor. After refining, it can be seen that the surface of the sample is uniform and has a metallic sheen. Before the refining process, a large number of holes and porosity are visible in the cross-section of the sample, while after refining the number of cavities is much smaller. In some cases, they have practically disappeared.
Figure 6 also shows the cross-sections of samples taken during the Dross Test to determine non-metallic impurities for rotor II in the same cases as rotor I (rotor wear 0% and 100%). Similar results were obtained for rotor I refining. After refining, the samples show fewer cavities and non-metallic inclusions. The surface of the sample is also shinier and more uniform than the sample taken before refining.
Author Contributions
Conceptualization, L.S. and K.G.; methodology, L.S. and K.G.; formal analysis, J.S.; investigation, M.G. and J.S.; writing—original draft preparation, M.S., T.M. and J.P.; writing—review and editing, J.S.; visualization, M.S., T.M. and J.P.; supervision, L.S. and T.P.; project administration, L.S.; funding acquisition, T.P., L.S. and K.G. All authors have read and agreed to the published version of the manuscript.
Funding
This research was created under the support of the Technology Agency of the Czech Republic within the frame of the program EPSILON in the solution of the projects reg. No. TH04010449 “Research and development of refining technologies for increasing of quality of aluminum alloys for high-performance quality castings”. The work was also supported by Grant 11/020/RGJ22/0089 (Silesian University of Technology) and Grant 11/020/BK_22/0088 (BK-208/RM2/2022)—Silesian University of Technology.
Institutional Review Board Statement
Not applicable.
Informed Consent Statement
Not applicable.
Data Availability Statement
Not applicable.
Conflicts of Interest
The authors declare no conflict of interest.
References
- Engh, T.A. Principles of Metal Refining; Oxford University Press: Oxford, UK, 1992. [Google Scholar]
- Zhang, L.; Lv, X.; Torgeson, A.T.; Long, M. Removal of impurity elements from molten aluminum: A review. Miner. Process. Extr. Metall. Rev. 2011, 32, 150–228. [Google Scholar] [CrossRef]
- Kato, S. Hydrogen in aluminium and aluminium alloys. Sumitomo Light Met. Technol. Rep. 1993, 34, 59–77. [Google Scholar]
- Chateau, J.M. Latest trends in molten metal in-line treatment. Alum. Times 2003, 04/05, 34–35. [Google Scholar]
- Terai, S.; Yosida, M. Developments in Treatment of Aluminium Melts. In Proceedings of the 8th Internationale Leichmetalltagung, Leoben-Wien, Austria, 22–26 June 1987; pp. 236–243. [Google Scholar]
- Gomez, E.R.; Zenit, R.; Rivera, C.G.; Trapaga, G.; Ramirez-Argazez, M.A. Physical modelling of fluid flow in ladles of aluminium equipped with impeller and gas purging for degassing. Metall. Mater. Trans. B 2013, 44, 974–983. [Google Scholar] [CrossRef]
- Johansen, S.; Graadahl, S.; Tetlie, P.; Rasch, B.; Myrbostad, E. Can Rotor-Based Refining Units Be Developed and Optimized Based on Water Model Experiments? In Light Metals; TMS: Warrendale, PA, USA, 1998; pp. 805–810. [Google Scholar]
- Bonderek, Z.; Smorawski, Z. Kierunki rozwoju rafinacji barbotażowej aluminium i jego stopów za pomocą urządzeń z wirujacą dyszą typu pompa. Przegląd Odlew. 2007, 7–8, 346–353. [Google Scholar]
- Solsvik, J.; Jakobsen, H.A. Single drop breakup experiments in stirred liquid–liquid tank. Chem. Eng. Sci. 2015, 131, 219–234. [Google Scholar] [CrossRef]
- Zhou, H.; Yu, X.; Wang, B.; Jing, S.; Lan, W.; Li, S. Breakup model of oscillating drops in turbulent flow field. Chem. Eng. Sci. 2022, 247, 117036. [Google Scholar] [CrossRef]
- Hasan, B.O. Experimental study on the bubble breakage in a stirred tank Part 2: Local dependence of breakage events. Exp. Therm. Fluid Sci. 2018, 96, 48–62. [Google Scholar] [CrossRef]
- Nambiar, D.; Kumar, R.; Gandhi, K.S. Breakage and coalescence of drops in turbulent stirred dispersions. Sadhana 1990, 15, 73–103. [Google Scholar] [CrossRef] [Green Version]
- Laakkonen, M.; Alopaeus, V.; Aittamaa, J. Validation of bubble breakage. coalescence and mass transfer models for gas–liquid dispersion in agitated vessel. Chem. Eng. Sci. 2006, 61, 218–228. [Google Scholar] [CrossRef]
- Laakkonen, M.; Moilanen, P.; Alopaeus, V.; Aittamaa, J. Modeling local bubble size distribution in agitated vessels. Chem. Eng. Sci. 2007, 62, 721–740. [Google Scholar] [CrossRef]
- Liao, Y.; Lucas, D. A literature review of theoretical models for drop and bubble breakup in turbulent dispersions. Chem. Eng. Sci. 2009, 64, 3389–3406. [Google Scholar] [CrossRef]
- Hasan, B.O. Experimental study on the bubble breakage in a stirred tank. Part 1. Mechanism and effect of operating parameters. Int. J. Multiph. Flow 2017, 97, 94–108. [Google Scholar] [CrossRef]
- Andersson, R.; Andersson, B. Modeling the breakup of fluid particles in turbulent flows. AIChE 2006, 52, 2031–2038. [Google Scholar] [CrossRef]
- Martin, M.; Montes, F.; Galan, M. Influence of impeller type on the bubble breakup process in stirred tanks. Ind. Eng. Chem. Res. 2008, 47, 6251–6263. [Google Scholar] [CrossRef]
- Yamamoto, T.; Suzuki, A.; Komarova, S.V.; Ishiwata, Y. Investigation of impeller design and flow structures in mechanical stirring of molten aluminum. J. Mater. Process. Technol. 2018, 261, 164–172. [Google Scholar] [CrossRef]
- Saternus, M.; Merder, T. Physical modelling of aluminum refining process conducted in batch reactor with rotary impeller. Metals 2018, 8, 726. [Google Scholar] [CrossRef] [Green Version]
- Abreu-López, D.; Amaro-Villeda, A.; Acosta-González, F.A.; González-Rivera, C.; Ramírez-Argáez, M.A. Effect of the impeller design on degasification kinetics using the impeller injector technique assisted by mathematical modelling. Metals 2017, 7, 132. [Google Scholar] [CrossRef] [Green Version]
- Warke, V.S.; Tryggvason, G.; Makhlouf, M.M. Mathematical modeling and computer simulation of molten metal cleansing by the rotating impeller degasser Part I. Fluid flow. J. Mater. Process. Technol. 2005, 168, 112–118. [Google Scholar] [CrossRef]
- Wan, B.; Chen, W.; Mao, M.; Fu, Z.; Zhu, D. Numerical simulation of a stirring purifying technology for aluminum melt. J. Mater. Process. Technol. 2018, 251, 330–342. [Google Scholar] [CrossRef]
- Yamamoto, T.; Kato, K.; Komarov, S.V.; Ueno, Y.; Hayashi, M. Investigation of melt stirring in aluminium melting furnace through water model. J. Mater. Process. Technol. 2018, 259, 409–415. [Google Scholar] [CrossRef]
- Ramos Gomez, E.; Zenit, R.; González Rivera, C.; Trápaga, G.; Ramírez-Argáez, M.A. Mathematical modeling of fluid flow in a water physical model of an aluminum degassing ladle equipped with an impeller-injector. Metall. Mater. Trans. B 2013, 44, 423–435. [Google Scholar] [CrossRef]
- Hernández-Hernández, M.; Camacho-Martínez, J.L.; González-Rivera, C.; Ramírez-Argáez, M.A. Impeller design assisted by physical modeling and pilot plant trials. J. Mater. Process. Technol. 2016, 236, 1–8. [Google Scholar] [CrossRef]
- Sigworth, G.K.; Williams, E.M.; Chesonis, D.C. Gas fluxing of molten aluminum: An overview. In Light Metals; TMS: Warrendale, PA, USA, 2008; pp. 581–586. [Google Scholar]
- Taylor, M.B.; Gilles Belanger, M.C.; Adams, E.D. Recent Experience with the Alcan Compact Degasser in two plants. In Light Metals; TMS: Warrendale, PA, USA, 2000; pp. 779–784. [Google Scholar]
- Ohno, Y.; Hampton, D.T.; Moores, A.W. The GBF rotary system for total aluminium refining. In Light Metals; TMS: Warrendale, PA, USA, 1993; pp. 915–921. [Google Scholar]
- Clumpner, J.A.; Hershey, R.E.; Hoffman, W.L. MINT—An in-line melt purification system: Predicting commercial performance with aluminium alloys. In Light Metals; TMS: Warrendale, PA, USA, 1986; pp. 815–819. [Google Scholar]
- Waz, E.; Carre, J.; Le Brun, P.; Jardy, A.; Xuereb, C.; Ablitzer, D. Physical modelling of the aluminium degassing process: Experimental and mathematical approaches. In Light Metals; TMS: Warrendale, PA, USA, 2003; pp. 901–907. [Google Scholar]
- Saternus, M. Determination of RTD curves for aluminium refining process conducted in batch reactor—Physical modelling. Arch. Metall. Mater. 2018, 63, 1907–1912. [Google Scholar] [CrossRef]
- Saternus, M.; Merder, T. Physical Modeling of the Impeller Construction Impact on the Aluminum Refining Process. Materials 2022, 15, 575. [Google Scholar] [CrossRef]
- Chen, J.; Zhao, J.C.; Lacey, P.V.; Gray, T.N.H. Flow pattern in a melt treatment water model based on shaft power measurements. In Light Metals; TMS: Warrendale, PA, USA, 2001; pp. 1021–1025. [Google Scholar]
- Camacho-Martinez, J.L.; Ramirez-Argaez, M.A.; Zenit-Camacho, R.; Juarez-Hernandez, A.; Barceinas-Sanchez, J.O.; Trapaga-Martinez, G. Physical modelling of an aluminium degassing operation with rotating impellers a comparative hydrodynamic analysis. Mater. Manuf. Process. 2010, 25, 581–591. [Google Scholar] [CrossRef]
- Camacho-Martinez, J.L.; Ramirez-Argaez, M.A.; Juarez-Hernandez, A.; Gonzalez-Rivera, C.; Trapaga-Martinez, G. Novel degasification design for aluminium using an impeller degasification water physical model. Mater. Manuf. Process. 2012, 27, 556–560. [Google Scholar] [CrossRef]
- Kang, Y.Y.; Lin, Y.; Liu, X.D.; Sun, C.; Yuan, S.S.; Zuo, Y.B.; Cui, J.Z. Study on the High Shear Degassing Process with Water Simulation. Adv. Mater. Res. 2015, 1120–1121, 1214–1219. [Google Scholar] [CrossRef]
- Zuo, Y.B.; Lin, Y.; Kang, Y.Y.; Cui, J.Z. Effects of Rotor Rotation Speed and Gas Flow Rate on the Degassing Efficiency of 2524 Aluminum Alloy in Rotary Degassing Process. J. Northeast Univ. Nat. Sci. 2016, 37, 653–657. [Google Scholar]
- Lazaro-Nebreda, J.; Patel, J.B.; Fan, Z. Improved degassing efficiency and mechanical properties of A356 aluminium alloy castings by high shear melt conditioning (HSMC) technology. J. Mater. Process. Technol. 2021, 294, 117146. [Google Scholar] [CrossRef]
- Flores, S.; Juárez Martínez, A.A.; Flores Valdés, R.; Torres, A.; Ochoa Palacios, J.T.; Li, Y. Mathematical Modelling for Furnace Design Refining Molten Aluminum. Metals 2021, 11, 1798. [Google Scholar] [CrossRef]
- Sviželová, J.; Tkadlečková, M.; Michalek, K.; Walek, J.; Saternus, M.; Pieprzyca, J.; Merder, T. Numerical Modelling Of Metal Melt Refining Process In Ladle With Rotating Impeller And Breakwaters. Arch. Metall. Mater. 2019, 64, 659–664. [Google Scholar]
- Zhou, B.; Qiu, Z.; Chen, K.; Xu, C.; Wang, Z. Microstructure, Properties, and Numerical Simulation of Semi-Solid Aluminum Alloy under Planetary Stirring Process. Materials 2022, 15, 3009. [Google Scholar] [CrossRef]
| Publisher’s Note: MDPI stays neutral with regard to jurisdictional claims in published maps and institutional affiliations. |
© 2022 by the authors. Licensee MDPI, Basel, Switzerland. This article is an open access article distributed under the terms and conditions of the Creative Commons Attribution (CC BY) license (https://creativecommons.org/licenses/by/4.0/).

 ,
, 


