Article

Micro-Scale Flow Excitation under Imposition of Uniform Magnetic Field and Electrical Current

Faculty of Engineering, Hokkaido University, Kita 13 Nishi 8 Kita-ku, Sapporo 060-8628, Hokkaido, Japan
*
Author to whom correspondence should be addressed.
Metals 2022, 12(12), 2034; https://doi.org/10.3390/met12122034
Submission received: 17 October 2022 / Revised: 21 November 2022 / Accepted: 23 November 2022 / Published: 26 November 2022
(This article belongs to the Special Issue Advances in Molten Metal Refining Process)

Abstract

:
Mass transfer is often the rate-determining step for solid-liquid chemical reactions. Decreasing the concentration boundary layer thickness is essential to intensify the chemical reaction. Because the concentration boundary layer exists in the velocity boundary layer, forcing imposition on the concentration boundary layer by superimposing an electrical current and a magnetic field was proposed. Through this, flow can be directly excited in the concentration boundary layer. The previous results indicate that by superimposing a direct current and a gradient magnetic field, the development of the concentration boundary layer was suppressed because of a macro-scale flow excitation in the whole vessel. By superimposing the gradient magnetic field with a modulated current, the development of the concentration boundary layer was further suppressed. This is because of the macro-scale flow enhancement and the excitation of a micro-scale flow near the solid-liquid interface. However, the mechanism of the micro-scale flow excitation has not been clarified. To clarify this, a uniform magnetic field was superimposed with the direct current or the modulated current. By this means, only the micro-scale flow was excited near the anode surface. The results found that the non-uniform electromagnetic force distribution is the main reason for the micro-scale flow excitation.

1. Introduction

Enhancing the solid-liquid chemical reaction is important for time and energy savings in industry. For solid-liquid chemical reactions, mass transfer is often the rate determining step. For instance, a refining process is used in the metallurgical industry, and an electroplating process is used in the surface treatment industry [1,2,3,4]. To enhance the solid-liquid chemical reaction when mass transfer is the rate-determining step, the enhancement of mass transfer in a concentration boundary layer formed near the solid-liquid interface is essential.
The mass transfer in the liquid depends on diffusion and convection [5,6]. According to Fick’s first law, the mass transfer due to diffusion positively relates to a diffusion coefficient and a concentration gradient [7]. However, diffusion coefficient control is difficult because it is one of the liquid physical properties. Thus, increasing the concentration gradient near the solid-liquid interface is effective for the enhancement of mass transfer. Because convection contributes to decreasing the concentration boundary layer thickness, it increases the concentration gradient near the solid-liquid interface [6]. Thus, traditional methods, such as mechanical agitation, excite a flow in a bulk region to enhance the solid-liquid chemical reaction [8,9,10].
By exciting the flow in the bulk region, a velocity boundary layer forms in the vicinity of the solid-liquid interface [11,12]. The relative thickness between the velocity boundary layer and the concentration boundary layer is a function of Schmidt number (Sc), defined by the following equation [13]:
S c = υ D
Here, υ is the kinematic viscosity and D is the diffusion coefficient.
Because the Schmidt number for liquids is usually much larger than unity [14], the concentration boundary layer exists in the inner part of the velocity boundary layer. The weaker flow in the velocity boundary layer than that in the bulk region should affect the decrease in the concentration boundary layer thickness in the traditional methods, and thus, a strong agitation in the bulk region is required. The excessive agitation in the bulk region also results in some problems. For instance, the injury to the vessel.
A direct flow excitation in the concentration boundary layer is a promising method to enhance mass transfer. Based on this concept, a new method of exciting flow in the concentration boundary layer by imposing an electromagnetic force was proposed [15,16,17]. Because the force is imposed by superimposing an electrical current with a magnetic field, applications of this method are expected in industrial processes treating a conductive liquid, such as the electroplating process in the surface treatment industry [18,19]. In this method, flow is directly excited in the concentration boundary layer without physical contact. Therefore, the problems caused by excessive bulk liquid agitation and contamination of the liquid phase due to the wear or corrosion of an agitator can be prevented. In addition, because the electromagnetic force can be controlled by controlling the current and the magnetic field, flow control in the concentration boundary layer is expected.
Relating to the newly proposed method, Yokota et al. evaluated the Cu2+ concentration boundary layer development by dissolving a Cu anodic electrode into a Cu2+ electrolyte solution [16]. They found that the concentration boundary layer development was suppressed by superimposing a direct current (DC current) with a gradient magnetic field compared to that with only the DC current imposition. In addition, the development of the concentration boundary layer was further suppressed by superimposing the gradient magnetic field with a modulated current composed of the DC current and an alternating current (AC current). To clarify the mechanisms of these phenomena, Xu et al. investigated the flow pattern under the superimposition of the gradient magnetic field with the DC current or the modulated current [17]. They found that by superimposing the gradient magnetic field with the DC current, a macro-scale flow was excited in the whole vessel. By this means, the fresh liquid flowed from the bulk region to the vicinity of the anode surface, which contributed to suppressing the concentration boundary layer development compared to that with only the DC current imposition. Furthermore, by superimposing the gradient magnetic field with the modulated current, the development of the macro-scale flow was enhanced compared to that under the superimposition of the gradient magnetic field with the DC current. A micro-scale flow was excited in the vicinity of the anode surface. These are the reasons for the further suppression of the concentration boundary layer development by superimposing the gradient magnetic field with the modulated current compared to that under the superimposition of the gradient magnetic field with the DC current. However, the reason why the micro-scale flow was excited is still unknown. Therefore, experimental work has been done for the clarification of the micro-scale flow excitation mechanism in this study.

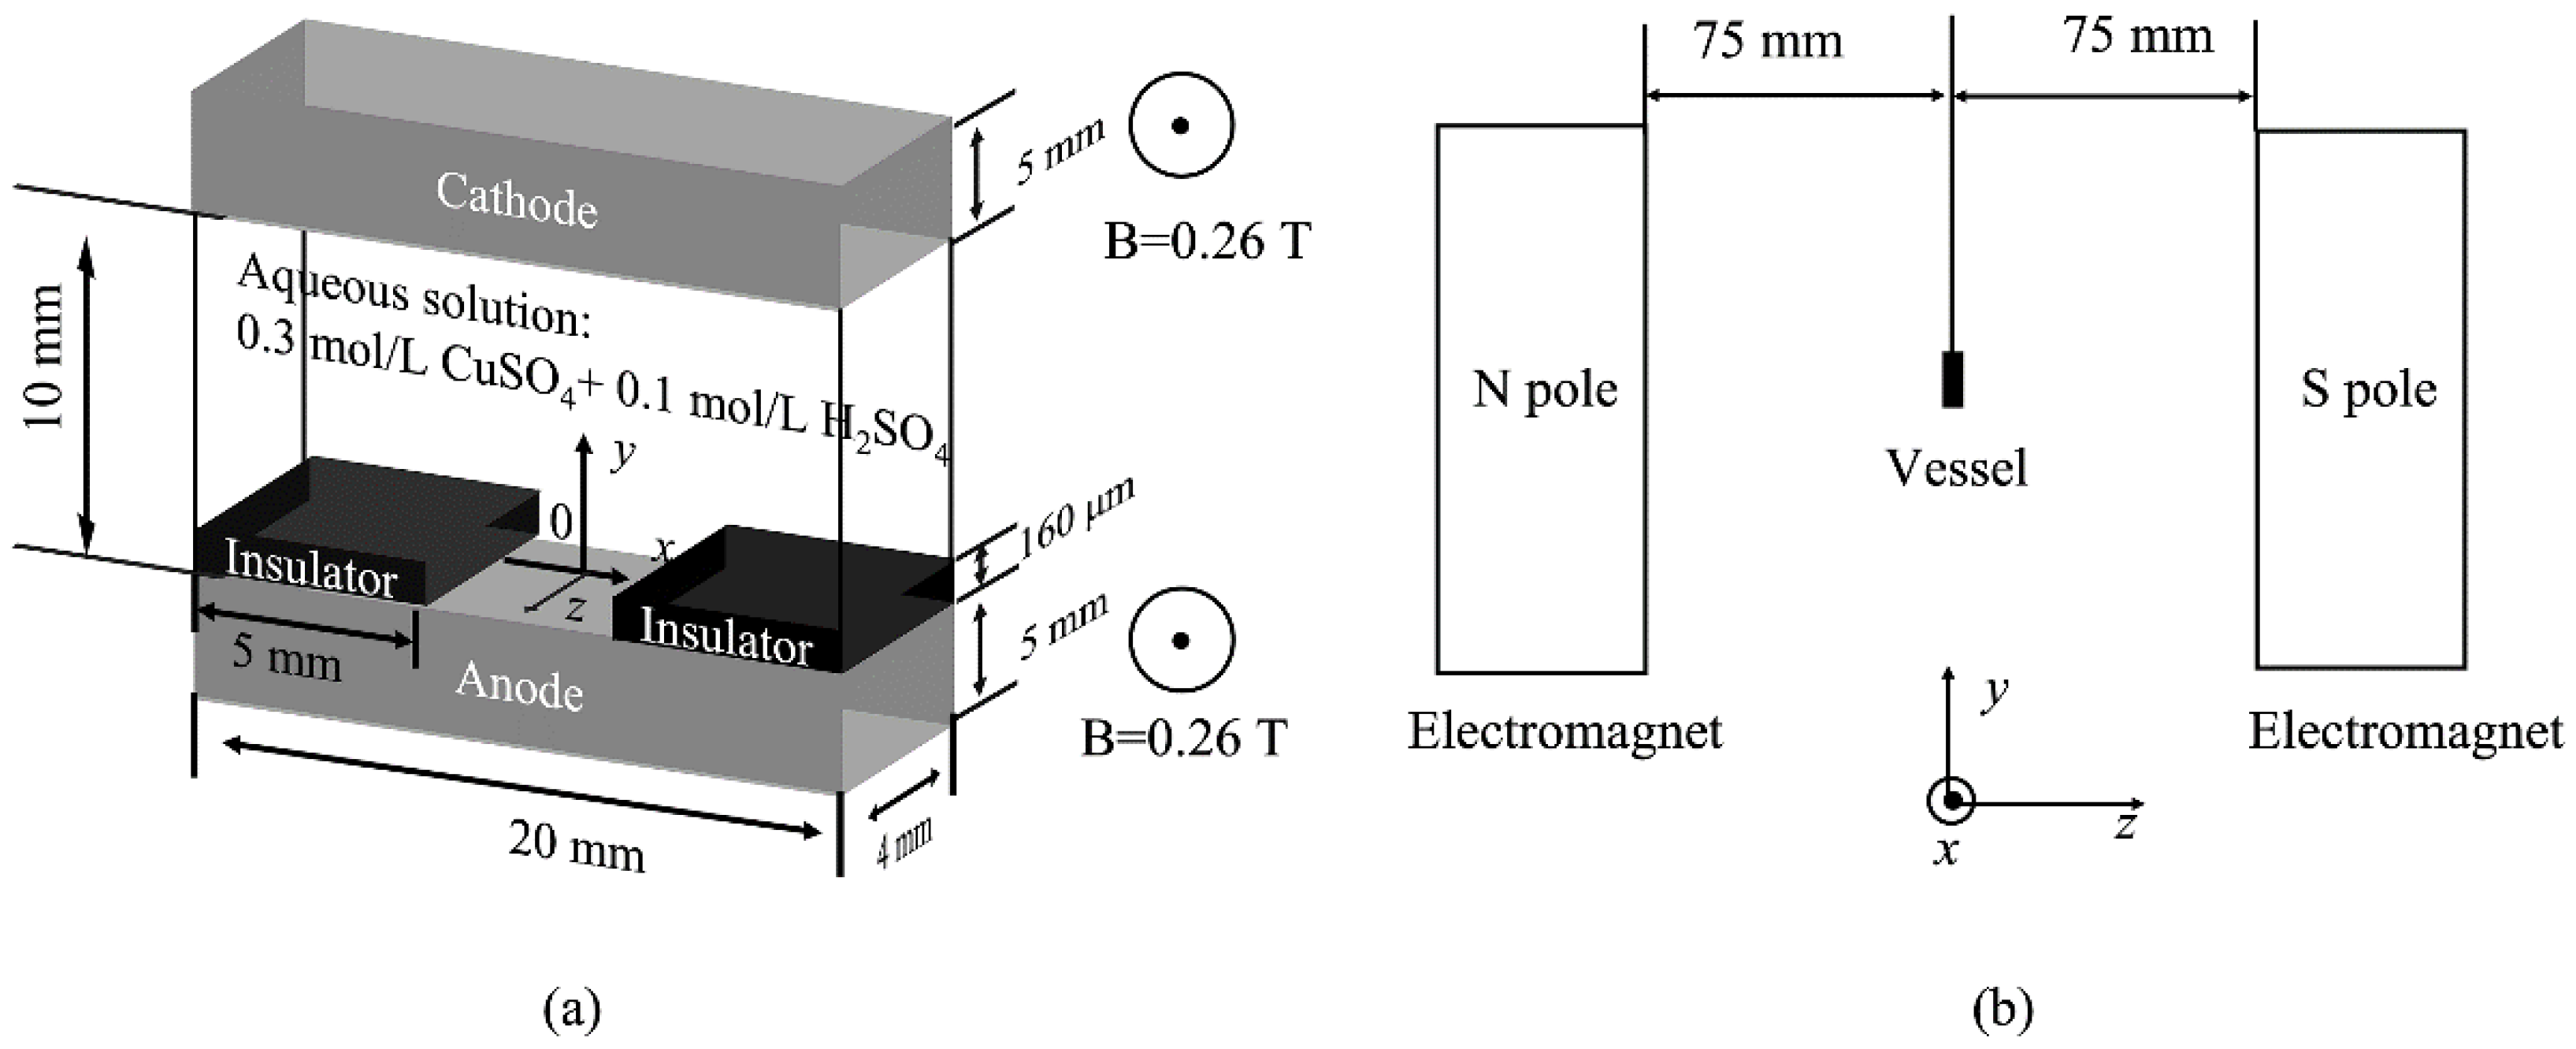
2. Experimental Methods

Figure 1a indicates the bird’s-eye view of the experimental apparatus. A transparent vessel was filled with a 0.3 mol/L CuSO4 + 0.1 mol/L H2SO4 aqueous solution. The inner length and the inner depth of the vessel were 20 mm and 4 mm, respectively. A Cu anodic electrode and a Cu cathodic electrode with heights of 5 mm were set in the lower and upper parts of the vessel, respectively. The left and right sides of the lower electrode were covered by 5 mm length and 160 μm height insulators. Figure 1a also shows the definition of the coordinate system in this study. Its origin was defined as the center of the anode. The horizontal, vertical, and depth directions were indicated by the x-axis, y-axis and z-axis, respectively. Figure 1b shows the side view of the relative position between the vessel and the electromagnet. The vessel was set between the north pole (N pole) and the south pole (S pole) of an electromagnet. The distance between the center of the vessel in the z-direction and each pole was 75 mm. The N pole and the S pole were on the back side and the front side of the vessel, respectively.
The five experimental conditions with their abbreviations are shown in Table 1. Four current conditions were adopted in this study. One was a 25 mA DC current. The others were modulated currents of the superimposition of the 25 mA DC current and a 2 Hz, 30 mAp-p AC current; the superimposition of the 25 mA DC current and a 6 Hz, 30 mAp-p AC current; and the superimposition of the 25 mA DC current and a 2 Hz, 50 mAp-p AC current. The average current intensities of these four current conditions were 25 mA. The experimental condition of only the 25 mA DC current imposition was expressed as the “DC condition”. The experimental condition of the superimposition of the DC current and a uniform magnetic field was expressed as the “DC + MF condition”. The experimental conditions of the simultaneous imposition of the uniform magnetic field and the 2 Hz, 30 mAp-p, the 6 Hz, 30 mAp-p or the 2 Hz, 50 mAp-p modulated current were expressed as the “2 Hz, 30 mA condition”, the “6 Hz, 30 mA condition”, or the “2 Hz, 50 mA condition”, respectively. The uniform magnetic field of 0.26 T was in the positive z-direction. The reason for adopting a uniform magnetic field in this study was to conduct the experiments without a macro-scale flow excitation.
Because of the current imposition, the Cu anodic electrode dissolved into the Cu2+ aqueous solution. By this means, a Cu2+ concentration boundary layer with a higher Cu2+ concentration compared to that of the bulk liquid formed near the anode surface. Based on Lambert–Beer’s law [20,21], the brightness of the Cu2+ aqueous solution decreases with an increase in Cu2+ concentration. The Cu2+ concentration can be evaluated by measuring the liquid brightness based on the following equation:
c = log 10 ( I 1 I 2 ) ϵ l + A
where A is a constant, c is the Cu2+ concentration, I1 is the brightness of the objective liquid, I2 is the brightness of a standard liquid, l is the optical path length, and ϵ is the molar absorption coefficient, respectively.
The brightness of the aqueous solution was recorded by a video recorder set in front of the vessel with a pixel size of 40 μm × 40 μm. Because the shape of the vessel was symmetric, the brightness was measured in the x-range of −1 mm to 5 mm and the y-range of 160 μm to 200 μm (one pixel in the vertical direction). The time variation and the non-uniform distribution of natural light intensity might lead to experimental errors in the brightness measurement results. To exclude these experimental errors, the experiments were conducted behind a dark curtain, with a flat light source set at the back of the vessel for a uniform light incident. In addition, the electrode surfaces were polished by water, including a 1 μm Al2O3 polishing agent, to avoid irregular light reflection on the electrode surface.
The liquid velocity was measured by using polystyrene particles with a diameter of 80 μm and the video recorder. The velocity measuring range was from −4 mm to 4 mm in the x-direction and 120 μm to 280 μm in the y-direction. The experimental time was 20 s because the aqueous solution near the anode surface gradually became darker.

3. Results and Discussion

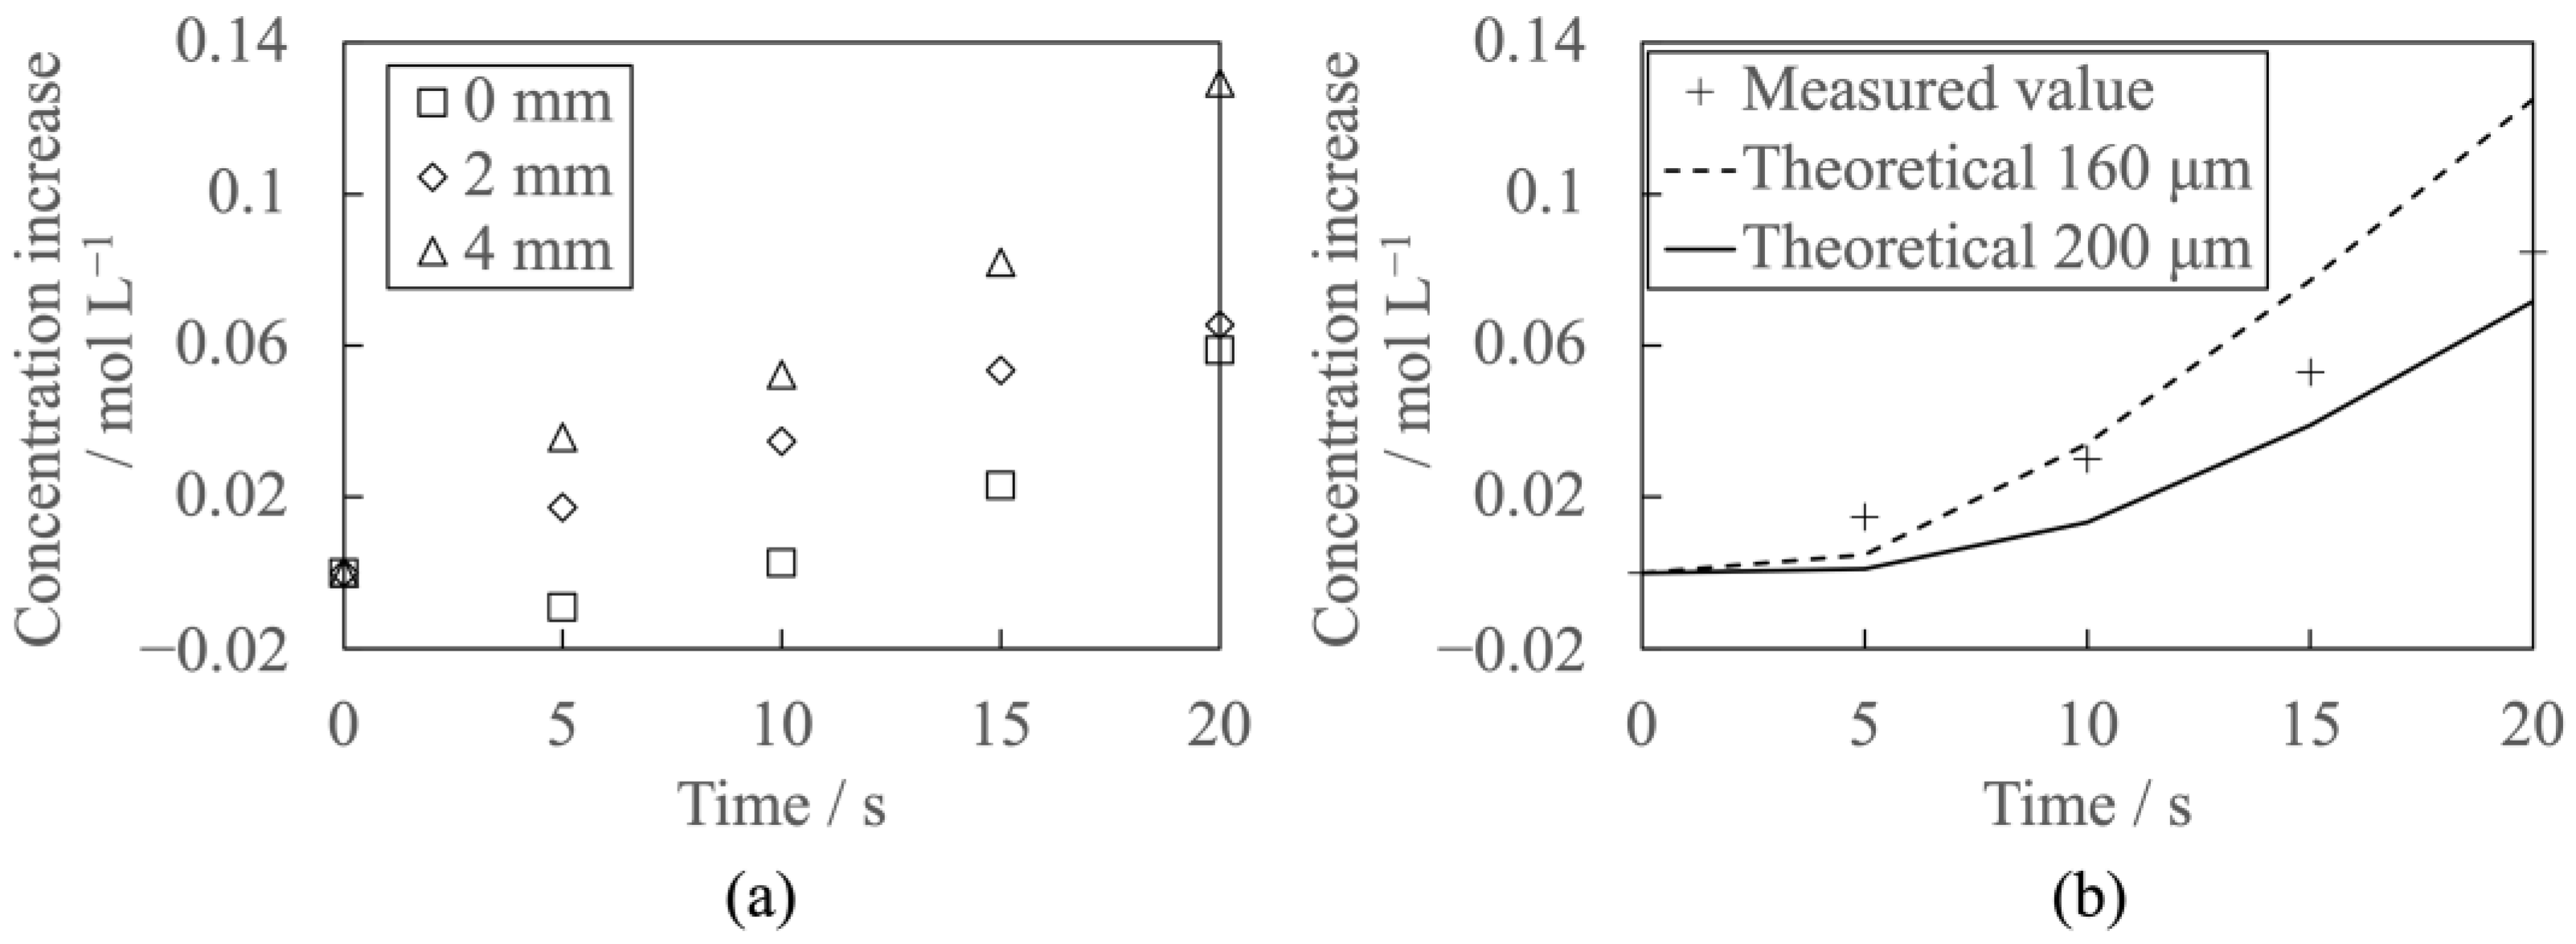
3.1. Concentration Measurement Results

Figure 2a shows the measured Cu2+ concentration distribution results under the DC condition. The average Cu2+ concentration in the x-ranges of −1 mm to 1 mm, 1 mm to 3 mm, and 3 mm to 5 mm was measured. For expression convenience, these x-ranges were named the x-positions of 0 mm, 2 mm, and 4 mm, respectively. The Cu2+ concentration increased with increasing the x-position. This corresponds to the previous results [17]. Because of the surface area difference between the cathode and the anode, the current concentration occurred near the right end of the anode surface [22]. That is, the current density near the right part was higher than that near the middle part. In addition, the concentration difference between 4 mm and 2 mm and between 4 mm and 0 mm increased with time. Because of the positive relationship between the electrical conductivity and the Cu2+ concentration [23,24], the non-uniform current density distribution in the x-direction was enhanced. The Cu2+ concentration at 5 s was the minus value at 0 mm. The reason might be a slight irregular light reflection on the anode surface, even though the anode was polished. Figure 2b shows the comparison between the average Cu2+ concentration measurement results in the x-range of −1 mm to 5 mm and the theoretical Cu2+ concentration under the DC condition. The theoretical Cu2+ concentration was calculated at the y-positions of 160 μm and 200 μm. For the theoretical Cu2+ concentration calculation, the diffusion phenomenon was simplified as a one-dimensional model in the positive y-direction. The boundary condition and the dissolved Cu2+ concentration near the anode surface when imposing a current from 0 s are shown in the following equations [25]:
c ( y = 0 , t = 0 ) = c 0
c ( y = , t = t ) = c 0
2 F D ( c y ) y = 0 = J
c y ,   t c y ,   0 = J 2 F D × [ 2 D t π e x p ( y 2 4 D t ) y e r f c ( y 2 D t ) ]
Here, c0 is the initial concentration, D = 5.5 × 10 10 m2/s [26,27] is the Cu2+ diffusion coefficient, F is the Faraday’s constant, J is the current density, t is the time, and y is the vertical position, respectively.
The measured average concentration at 5 s was higher than the theoretical value at 160 μm and 200 μm. The reason might be the experimental error mentioned above. The theoretical and measured concentrations agreed from 10 s to 20 s because the measured average concentration was between the theoretical concentration calculation results at 160 μm and 200 μm. The concentration difference between the measured value and the theoretical value at 160 μm increased, and the difference between the measured value and the theoretical value at 200 μm decreased from 10 s to 20 s. This is attributed to the fact that the Cu2+ concentration is inversely related to the Cu2+ diffusion coefficient [23,24], while the diffusion coefficient was constant in the theoretical calculation.

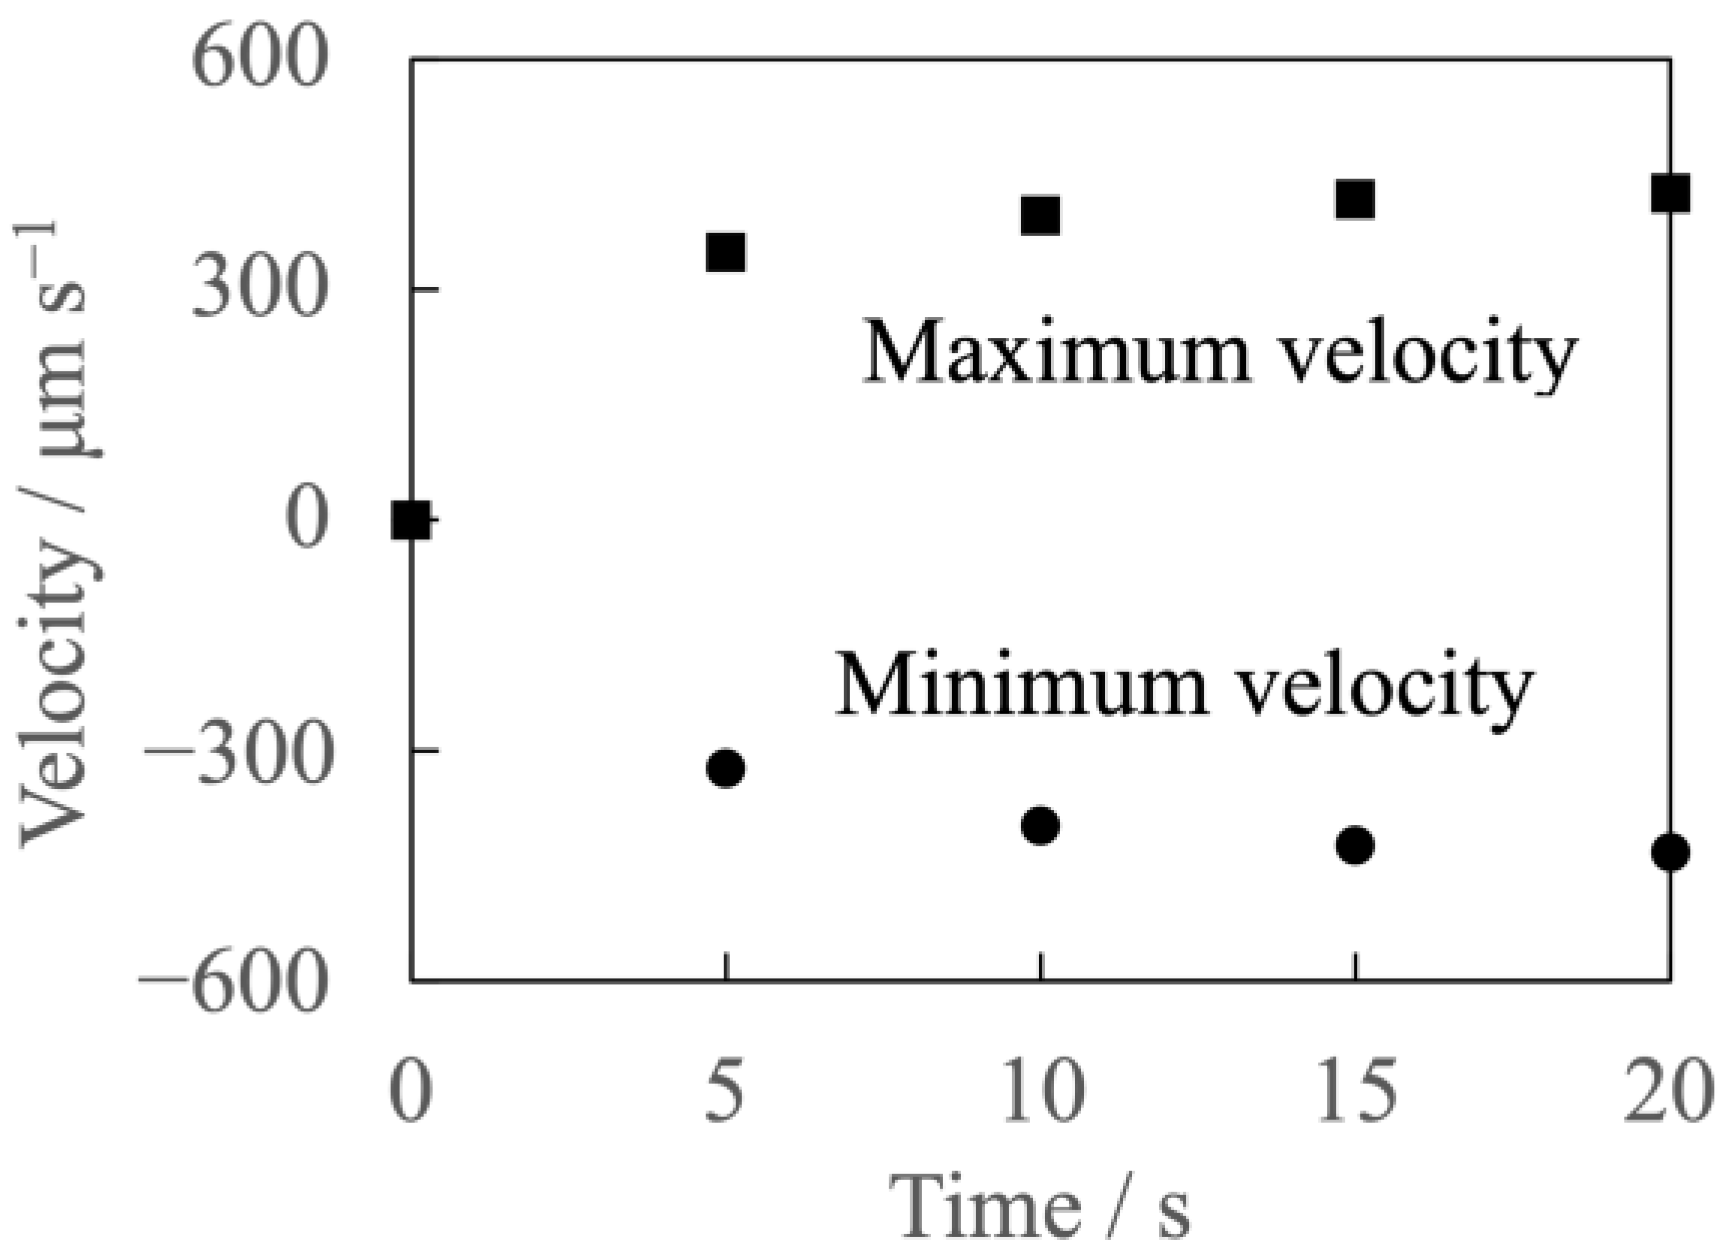
3.2. Velocity Measurement Results and Liquid Flow Pattern Observation Results

A micro-scale flow was excited near the anode surface, and the macro-scale flow in the whole vessel was not excited except for the DC condition. Figure 3 shows the maximum velocity and the minimum velocity measurement results under the DC + MF condition. The maximum velocity and the absolute value of the minimum velocity were very close. Both of the velocities increased with time, while the increase rate became smaller. These indicate that the flow developed with time, and gradually approached the steady state.
Because the magnitudes of the two velocities were essentially the same under the experimental conditions with the uniform magnetic field imposition, only the maximum velocity measurement results under these experimental conditions are shown in Figure 4. The maximum velocity under the experimental conditions with the modulated current imposition was larger than that under the DC + MF condition. This means that by superimposing the modulated current with the uniform magnetic field, the micro-scale flow excitation was enhanced compared to that under the DC + MF condition. Similar to that under the DC + MF condition, the flow gradually approached the steady state under the experimental conditions with the modulated current imposition. The higher maximum velocity under the 2 Hz, 30 mA condition compared to that under the 6 Hz, 30 mA condition indicates that by decreasing the modulated current frequency, the micro-scale flow excitation was enhanced. On the other hand, the maximum velocity under the 2 Hz, 50 mA condition was larger than that under the 2 Hz, 30 mA condition. This means that by increasing the modulated current amplitude, the micro-scale flow excitation was enhanced.
The liquid flow pattern under the DC+MF condition is shown in Figure 5. The micro-scale flow was essentially parallel to the anode surface and was observed just above the anode surface. The flow in the center of the z-direction was in the positive x-direction, while it was in the negative x-direction near the front and back walls.
Figure 6 shows the liquid flow patterns under the 2 Hz, 30 mA condition and the 6 Hz, 30 mA condition. The liquid flow patterns under these two conditions were essentially the same within 20 s, and the flow region expanded with time. The micro-scale flow was observed above the anode surface at the initial stage, as shown in Figure 6a. It first expanded to above the upper part of the left-side insulator, as shown in Figure 6b, and it expanded to above the upper part of the right-side insulator at around 20 s, as shown in Figure 6c. The reason for the essentially same flow region under these two conditions, while the maximum velocities were different might be the limitation of the experimental time. The flow regions under these two conditions were larger than those under the DC + MF condition shown in Figure 5. This corresponds to the results that the maximum velocities under the 2 Hz, 30 mA condition and the 6 Hz, 30 mA condition were larger than those under the DC + MF condition.
The liquid flow pattern under the 2 Hz, 50 mA condition was different from those under the DC + MF condition, the 2 Hz, 30 mA condition, and the 6 Hz, 30 mA condition, as shown in Figure 7. The micro-scale flow was observed not only just above the anode surface but also above the left and right sides’ insulators from the initial stage. The largest flow region under the 2 Hz, 50 mA condition corresponds to its largest maximum velocity among all the experimental conditions with the uniform magnetic field imposition, as shown in Figure 4.
Figure 8 shows the mechanism of the micro-scale flow excitation. Because the surface area of the cathode was two times larger than that of the anode, the current concentration took place near the left and right parts of the anode’s surface [22]. The current directions near the left and right parts of the anode surface were not perpendicular to the anode surface, as shown by the dashed arrows in Figure 8a. Thus, the electromagnetic force directions were oblique upward, parallel, and oblique downward to the anode surface near the left, middle, and right parts, respectively. Near the left part of the anode surface, the upward component of the electromagnetic force led to an upward motion of liquid with a large Cu2+ concentration around the center in the z-direction because the upward liquid motion near the front and back walls was suppressed due to the friction, as shown in Figure 8b. Therefore, the non-uniform Cu2+ concentration distribution took place in the z-direction, in which the Cu2+ concentration near the front and back walls was lower than that around the center in the z-direction, as shown in Figure 8c. Because of the positive relationship between the Cu2+ concentration and the electrical conductivity [23,24], the horizontal component of the electromagnetic force around the center in the z-direction was larger than that near the front and back walls, as shown in Figure 8d, and this force difference increased with time. The electromagnetic force difference in the z-direction was the driving force for the micro-scale flow excitation. The time increase of this force difference was the reason for the development of the micro-scale flow, as shown in Figure 4. Because of the larger horizontal component of the electromagnetic force around the center in the z-direction, the micro-scale flow direction around the center in the z-direction was the positive x-direction, and its direction near the front and back walls was the negative x-direction, as shown in Figure 5, Figure 6 and Figure 7. On the other hand, because the micro-scale flow originated from the left part of the anode surface, the flow region expanded towards the left at first, and then it expanded towards the right, as shown in Figure 6.
During the large current half-period of the modulated current, the non-uniform Cu2+ concentration distribution in the z-direction, as shown in Figure 8c, was enhanced under the experimental conditions with the modulated current imposition than that under the DC + MF condition. Furthermore, the positive relationship between the Cu2+ concentration and the electrical conductivity accelerated a further non-uniformity of the Cu2+ concentration distribution in the z-direction. During the small current half-period under the experimental conditions with the modulated current imposition, the larger Cu2+ concentration around the center in the z-direction remained because of the large electrical conductivity difference around the center and near the walls. Therefore, the driving force for the micro-scale flow excitation under the experimental conditions with the modulated current imposition was enhanced compared to that under the DC + MF condition. Thus, the expansion of the micro-scale flow region and the larger maximum velocity were observed under these experimental conditions in comparison with those under the DC + MF condition, even though the average current intensities were the same, as shown in Figure 4, Figure 5, Figure 6 and Figure 7. The reason for the increase in modulated current frequency leading to the decrease in maximum velocity was not clarified. This will be investigated in future work. In addition, by increasing the modulated current amplitude, the driving force for the micro-scale flow excitation was further enhanced. Thus, the largest flow region and the largest maximum velocity were observed under the 2 Hz, 50 mA condition from the initial stage among all the experimental conditions with the uniform magnetic field imposition.

4. Conclusions

To investigate the mechanism of a micro-scale flow excitation, the liquid flow pattern observation and its velocity measurement near the anode surface were conducted under the superimposition of a uniform magnetic field with a DC current or a modulated current. The following conclusions were obtained:
  • Only the micro-scale flow was observed near the anode surface under the experimental conditions with the current and the uniform magnetic field superimposition.
  • By superimposing the modulated current with the uniform magnetic field, the micro-scale flow excitation was enhanced compared to that under the superimposition of the DC current and the uniform magnetic field.
  • The decrease in modulated current frequency or the increase in modulated current amplitude enhanced the micro-scale flow excitation.
  • The mechanism of micro-scale flow excitation was clarified. That is, the driving force for the micro-scale flow excitation was the non-uniform electromagnetic force distribution in the z-direction caused by the non-uniform current distribution and the positive relationship between the Cu2+ concentration and the electrical conductivity.

Author Contributions

Conceptualization, K.I.; methodology, G.X.; validation, G.X. and K.I.; formal analysis, G.X. and K.I.; investigation, G.X.; resources, K.I.; data curation, G.X.; writing—original draft preparation, G.X.; writing—review and editing, K.I.; visualization, G.X. and K.I.; supervision, K.I.; project administration, K.I.; funding acquisition, K.I. All authors have read and agreed to the published version of the manuscript.

Funding

This research was funded by Hokkaido University operating expenses grant. And The APC was funded by Hokkaido University.

Data Availability Statement

The data used to support the findings of this study are available from the corresponding author upon request.

Acknowledgments

The first author gratefully acknowledges the financial support from China Scholarship Council (No. 201806060147), which has sponsored his study at Hokkaido University in Japan.

Conflicts of Interest

The authors declare no conflict of interest.

Nomenclatures

Aconstant (mol/m3 or mol/L)
Bmagnetic field intensity (T)
c0initial concentration (mol/m3 or mol/L)
cconcentration (mol/m3 or mol/L)
Ddiffusion coefficient (m2/s)
FFaraday’s constant (A·s/mol)
I1brightness of the objective liquid (-)
I2brightness of a standard liquid (-)
Jcurrent density (A/m2)
loptical path length (m)
ScSchmidt number (-)
ttime (s)
x, y, zcartesian coordinates (m)
ϵ molar absorption coefficient [(m2/mol or L/(mol·m)]
vkinematic viscosity (m2/s)

References

  1. Wen, C.Y. Noncatalytic heterogeneous solid-fluid reaction models. J. Ind. Eng. Chem. 1968, 60, 34–54. [Google Scholar] [CrossRef]
  2. Iwai, K.; Yokota, T.; Maruyama, A.; Yamada, T. Oscillating Electromagnetic Force Effect on Concentration Distribution near Liquid Solid Interface. IOP Conf. Ser. Mater. Sci. Eng. 2018, 424, 012051. [Google Scholar] [CrossRef] [Green Version]
  3. Frank, C.W. The Kinetics of Electrode Reactions: Part II—Mass transfer and mixed control. J. Ind. Eng. Chem. 1992, 70, 95–99. [Google Scholar]
  4. Madden, J.D.; Hunter, I.W. Three-dimensional microfabrication by localized electrochemical deposition. J. Microelectromech. Sys. 1996, 5, 24–32. [Google Scholar] [CrossRef]
  5. Jaiswal, D.K.; Kumar, A.; Yadav, R.R. Analytical Solution to the One-Dimensional Advection-Diffusion Equation with Temporally Dependent Coefficients. J. Water Resour. Prot. 2011, 3, 76–84. [Google Scholar] [CrossRef] [Green Version]
  6. Stocker, T. Introduction to Climate Modelling, 1st ed.; Springer: Berlin, Germany, 2011; p. 57. [Google Scholar]
  7. Bird, R.B.; Stewart, W.E.; Lightfoot, E.N. Transport Phenomena, 2nd ed.; John Wiley and Sons: New York, NY, USA, 2007; p. 621. [Google Scholar]
  8. Umezawa, K.; Matsunaga, H.; Tonomura, R.; Furugaki, I. The influence of operating condition on dephosphorization and desulphurization reactions of hot metal with lime-based flux. Tetsu-to-Hagane 1983, 15, 1810–1817. [Google Scholar] [CrossRef] [PubMed] [Green Version]
  9. Panneerselvam, R.; Savithri, S.; Surender, G.D. CFD modeling of gas–liquid–solid mechanically agitated contactor. Chem. Eng. Res. Des. 2008, 86, 1331–1344. [Google Scholar] [CrossRef]
  10. Ilegbusi, O.J. The role of gas plumes in agitation and mass transfer in metallurgical systems. Steel Res. 1994, 65, 534–540. [Google Scholar] [CrossRef]
  11. Rohsenow, W.M.; Choi, H.Y. Heat, Mass and Momentum Transfer, 1st ed.; Prentice-Hall, Inc.: Englewood Cliffs, NJ, USA, 1963; p. 25. [Google Scholar]
  12. Streeter, V.L. Fluid Mechanics, 2nd ed.; McGRAW-Hill Book Company, Inc.: New York, NY, USA, 1958; p. 3. [Google Scholar]
  13. Welty, J.R.; Wicks, C.E.; Wilson, R.E.; Rorrer, G.L. Fundamentals of Momentum, Heat, and Mass Transfer, 5th ed.; John Wiley & Sons, Inc.: Hoboken, NJ, USA, 2000; p. 519. [Google Scholar]
  14. Gualtieri, C.; Angeloudis, A.; Bombardelli, F.; Jha, S.; Stoesser, T. On the Values for the Turbulent Schmidt Number in Environmental Flows. Fluids 2017, 2, 17. [Google Scholar] [CrossRef] [Green Version]
  15. Yokota, T.; Maruyama, A.; Yamada, T.; Iwai, K. Direct observation of concentration boundary layer formed in the vicinity of anode electrode under imposition of vibrating electromagnetic force. Tetsu-to-Hagane 2016, 102, 119–126. [Google Scholar] [CrossRef] [Green Version]
  16. Yokota, T.; Maruyama, A.; Yamada, T.; Iwai, K. Decrease of concentration boundary layer thickness by using vibrating electromagnetic force. J. Japan. Inst. Met. Mater. 2017, 81, 516–521. [Google Scholar] [CrossRef]
  17. Xu, G.; Iwai, K. Solute concentration distribution in the vicinity of solid-liquid interface under the imposition of a time-varying force. ISIJ Int. 2022, 62, 1389–1395. [Google Scholar] [CrossRef]
  18. Moon, K.H.; Shin, H.K.; Kin, B.J.; Chung, J.Y.; Hwang, Y.S.; Yoon, J.K. Flow control of molten steel by electromagnetic brake in the continuous casting mold. ISIJ Int. 1996, 36, S201–S203. [Google Scholar] [CrossRef] [PubMed]
  19. Moffatt, H.K. Electromagnetic stirring. Phys. Fluids A 1991, 3, 1336–1343. [Google Scholar] [CrossRef]
  20. Swinehart, D.F. The Beer-Lambert law. J. Chem. Educ. 1962, 39, 333. [Google Scholar] [CrossRef]
  21. Mayerhöfer, T.G.; Mutschke, H.; Popp, J. Employing theories far beyond their limits—The case of the (Boguer-) beer–lambert law. Chem. Phys. Chem. 2016, 17, 1948–1955. [Google Scholar] [CrossRef] [PubMed]
  22. Kanani, N. Electroplating-Basic Principles, Processes and Practice, 1st ed.; Elsevier: Amsterdam, The Netherlands, 2005; pp. 99–105. [Google Scholar]
  23. Price, D.C.; Davenport, W.G. Densities, electrical conductivities and viscosities of CuSO4/H2SO4 solutions in the range of modern electrorefining and electrowinning electrolytes. Metall. Mater. Trans. B 1980, 11, 159–163. [Google Scholar] [CrossRef]
  24. The Chemical Society of Japan. Handbook of Chemistry, Basics II, 3rd ed.; Maruzen: Tokyo, Japan, 1984; p. 453. [Google Scholar]
  25. Fueki, K. Handbook of Electrochemistry, 4th ed.; Maruzen: Tokyo, Japan, 1985; p. 158. [Google Scholar]
  26. Emanuel, A.; Olander, D.R. Diffusion Coefficients of Copper Sulfate in Water and Water in n-Butyl Alcohol. J. Chem. Eng. Data 1963, 8, 31–32. [Google Scholar] [CrossRef]
  27. Eversole, W.G.; Kindsvater, H.M.; Peterson, J.D. The Diffusion Coefficient of Cupric Sulfate from 0.0 to 0.35 Molar at 25 °C. J. Phys. Chem. 1942, 3, 370–375. [Google Scholar] [CrossRef]
Figure 1. (a) Bird’s-eye view of experimental apparatus and (b) side view of relative position between the vessel and electromagnet.
Metals 12 02034 g001
Figure 2. (a) Concentration distribution and (b) comparison between the theoretical Cu2+ concentration at 160 μm, 200 μm, and measured Cu2+ concentration under DC condition in y-range of 160 μm-200 μm.
Metals 12 02034 g002
Figure 3. Velocity measurement results under DC + MF condition in x-range of −4 mm to 4 mm and y-range of 120 μm to 280 μm.
Metals 12 02034 g003
Figure 4. Maximum velocity measurement results in x-range of −4 mm to 4 mm and y-range of 120 μm to 280 μm.
Metals 12 02034 g004
Figure 5. Liquid flow pattern under DC + MF condition from 5 s to 20 s in y-range of 120 μm to 280 μm.
Metals 12 02034 g005
Figure 6. Liquid flow pattern under 2 Hz, 30 mA and 6 Hz, 30 mA conditions (a) at initial stage, and (b) and (c) with time development in the y-range of 120 μm to 280 μm.
Metals 12 02034 g006
Figure 7. Liquid flow pattern under 2 Hz, 50 mA condition from 5 s to 20 s in the y-range of 120 μm to 280 μm.
Metals 12 02034 g007
Figure 8. Schematics of (a) current and electromagnetic force distributions, (b) right side view of upward liquid motion near the left part of the anode surface, (c) concentration distribution in the z-direction and (d) electromagnetic force horizontal component distribution near the left part of the anode surface.
Metals 12 02034 g008
Table 1. Experimental conditions.
Experimental Condition AbbreviationDC Current Intensity (mA)AC Current Amplitude (mA)AC Current Frequency (Hz)Magnetic Field Intensity near Anode (T)Magnetic Field Intensity near Cathode (T)
1DC condition250none00
2DC + MF condition250none0.260.26
32 Hz, 30 mA condition253020.260.26
46 Hz, 30 mA condition253060.260.26
52 Hz, 50 mA condition255020.260.26
Publisher’s Note: MDPI stays neutral with regard to jurisdictional claims in published maps and institutional affiliations.

