
The Effect of Heat Accumulation on the Local Grain Structure in Laser-Directed Energy Deposition of Aluminium

 , , and
Abstract
:
1. Introduction
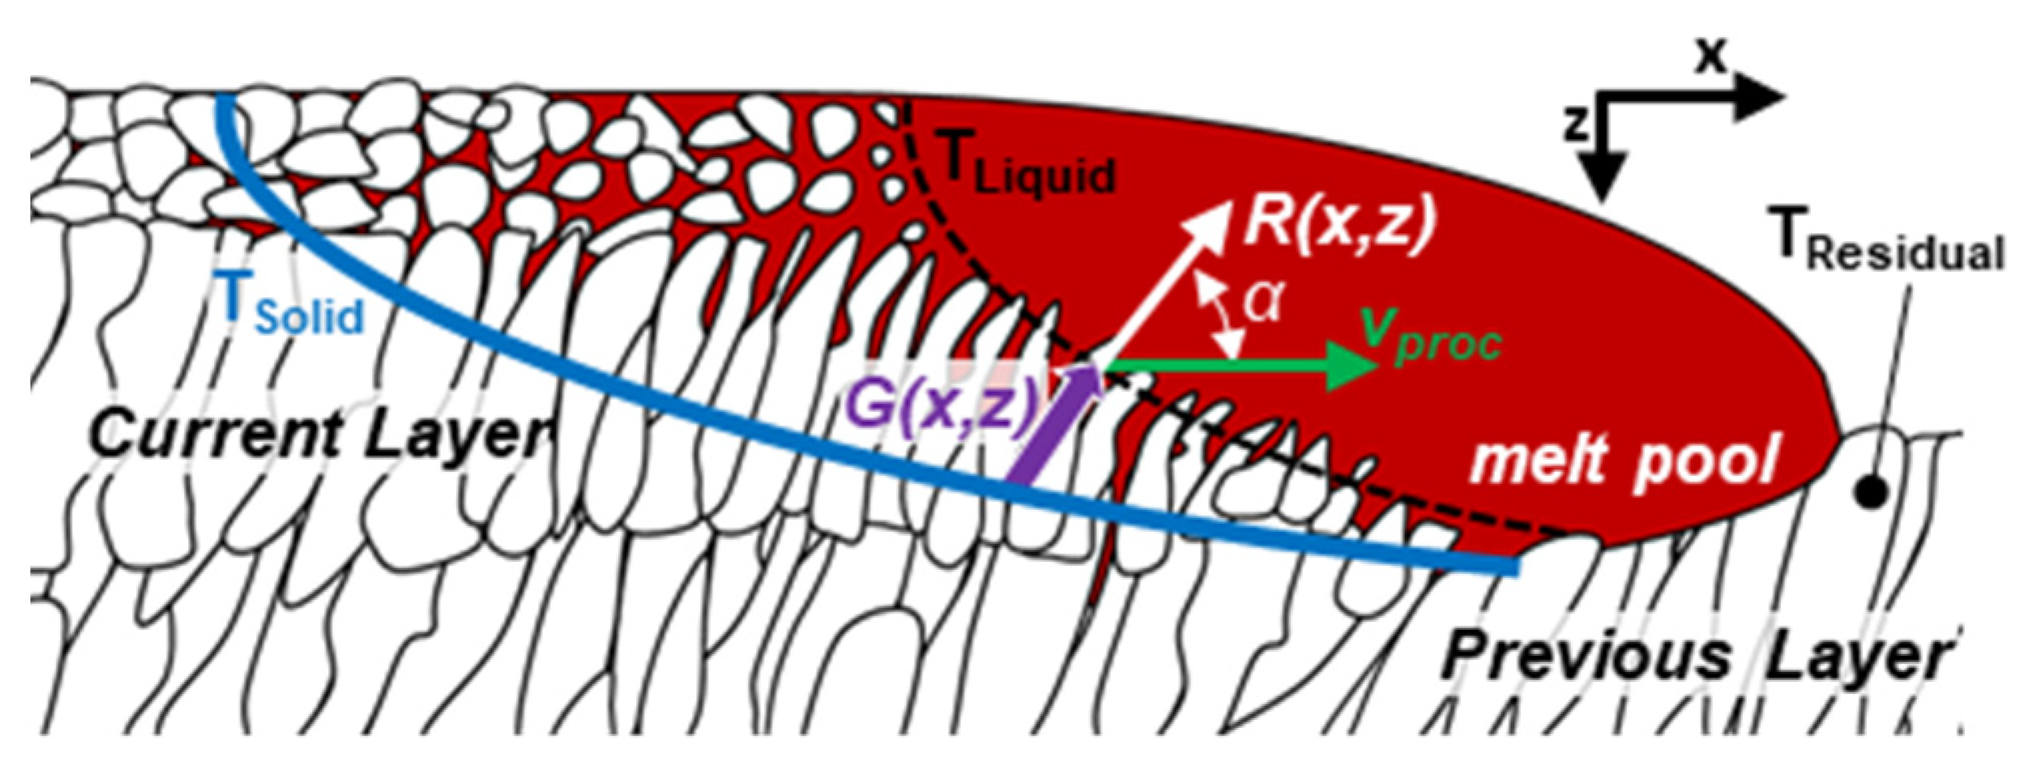
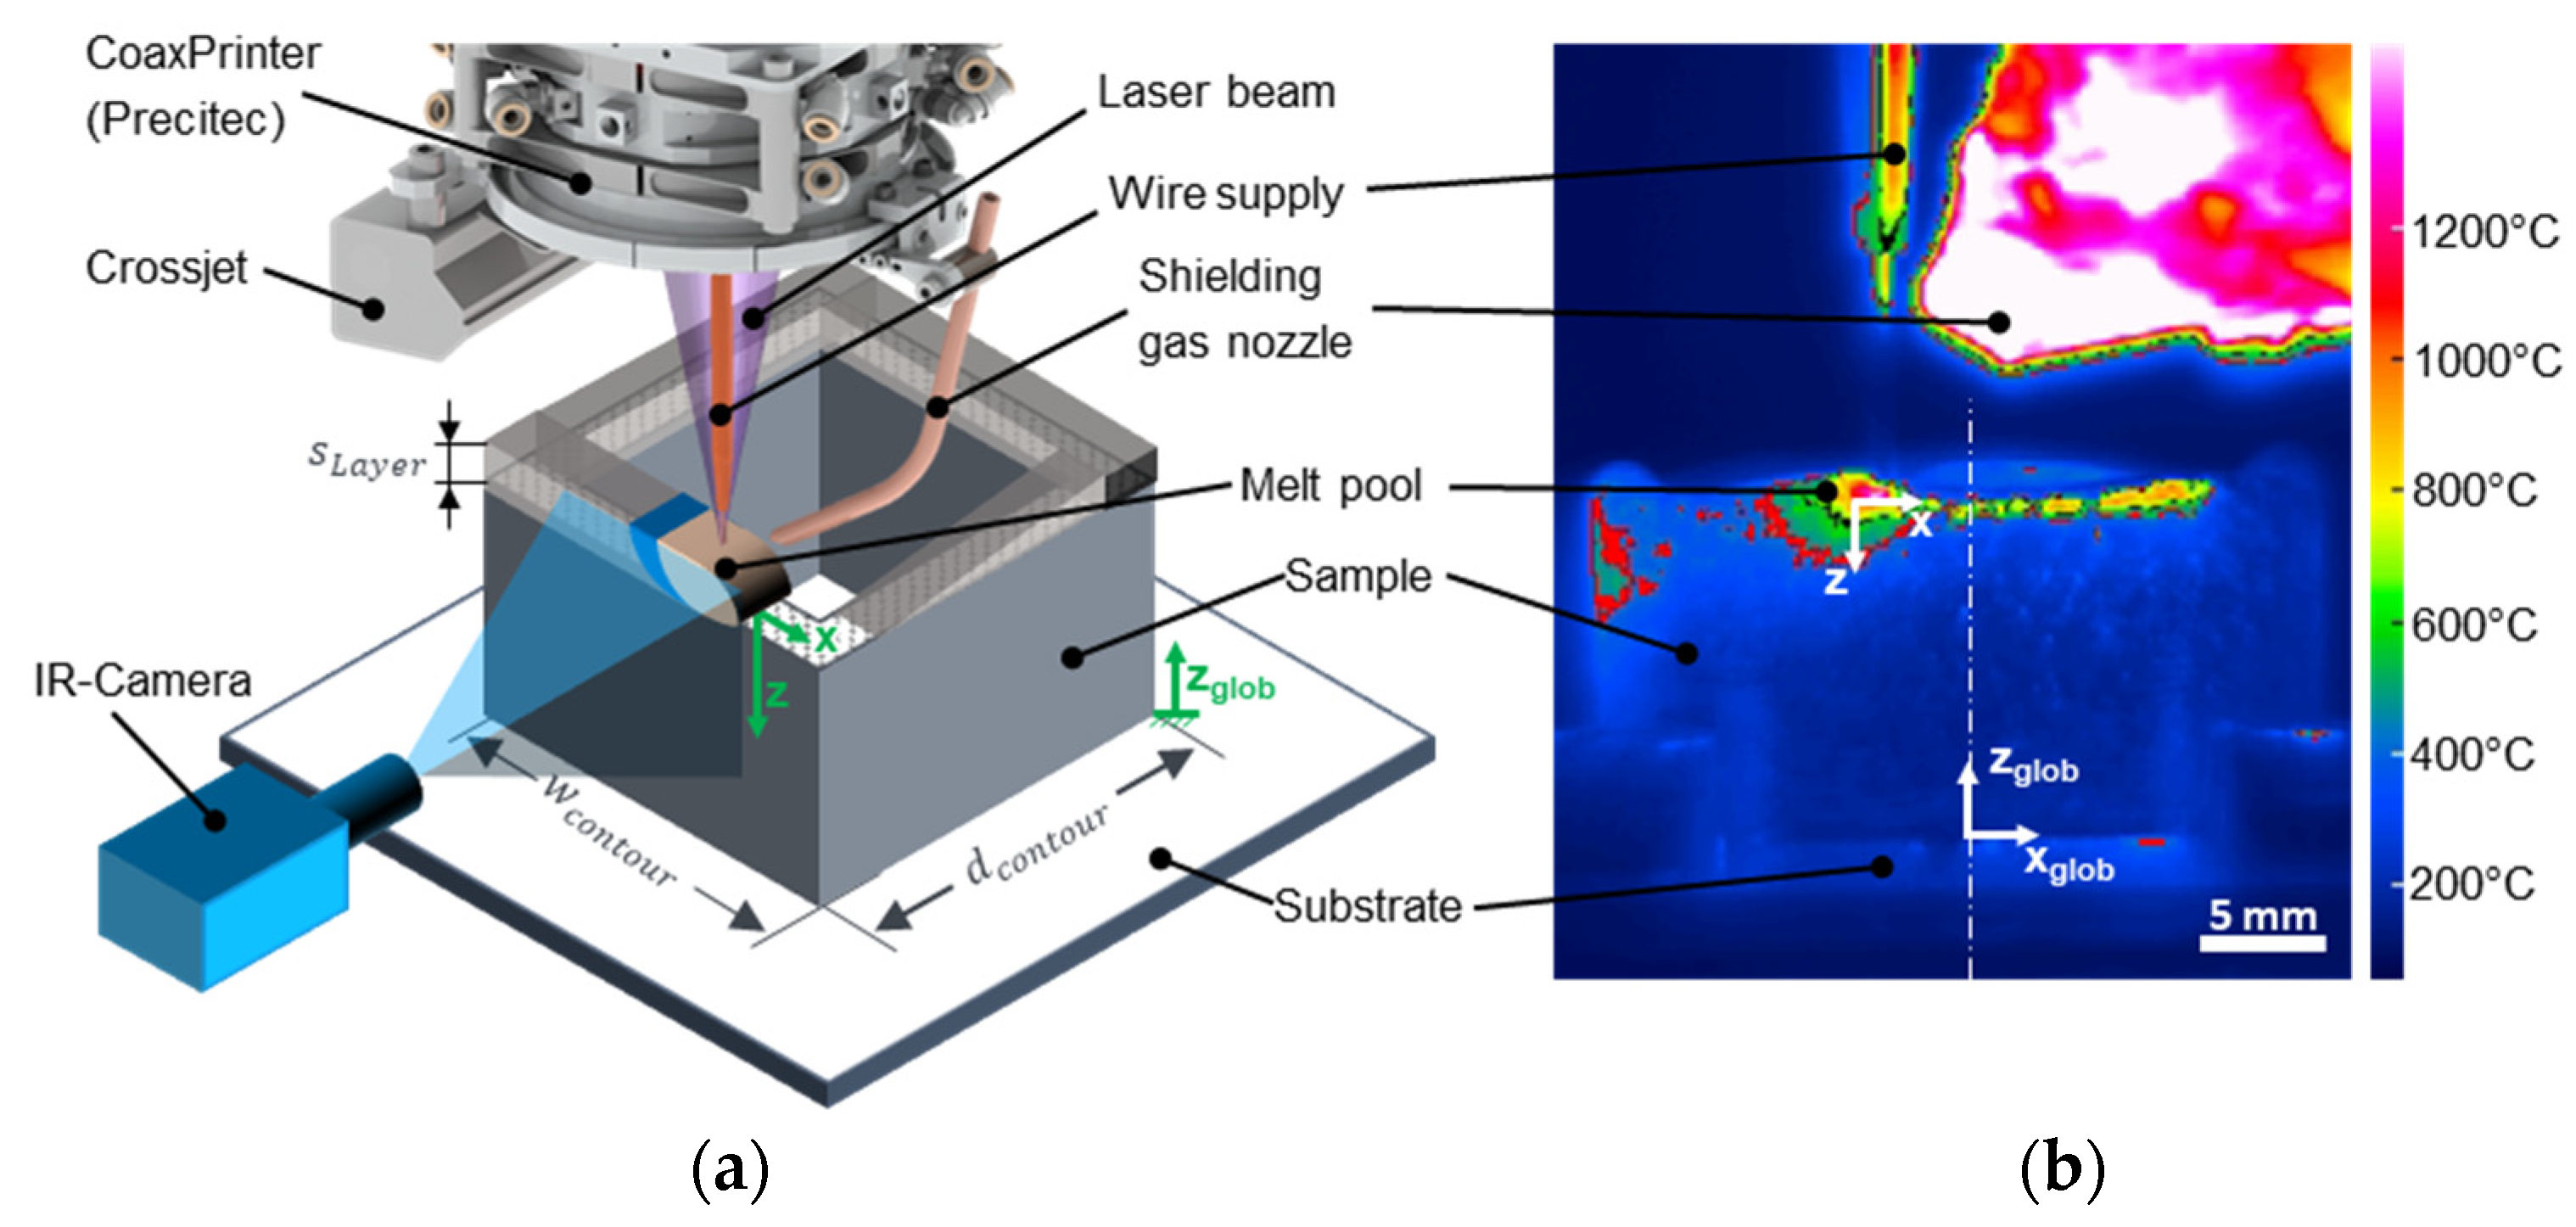
2. Experimental
3. Results
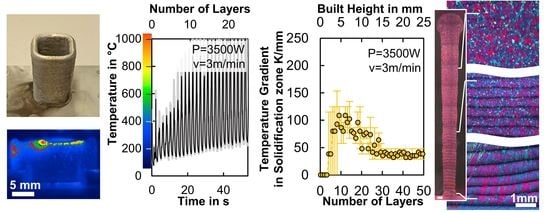
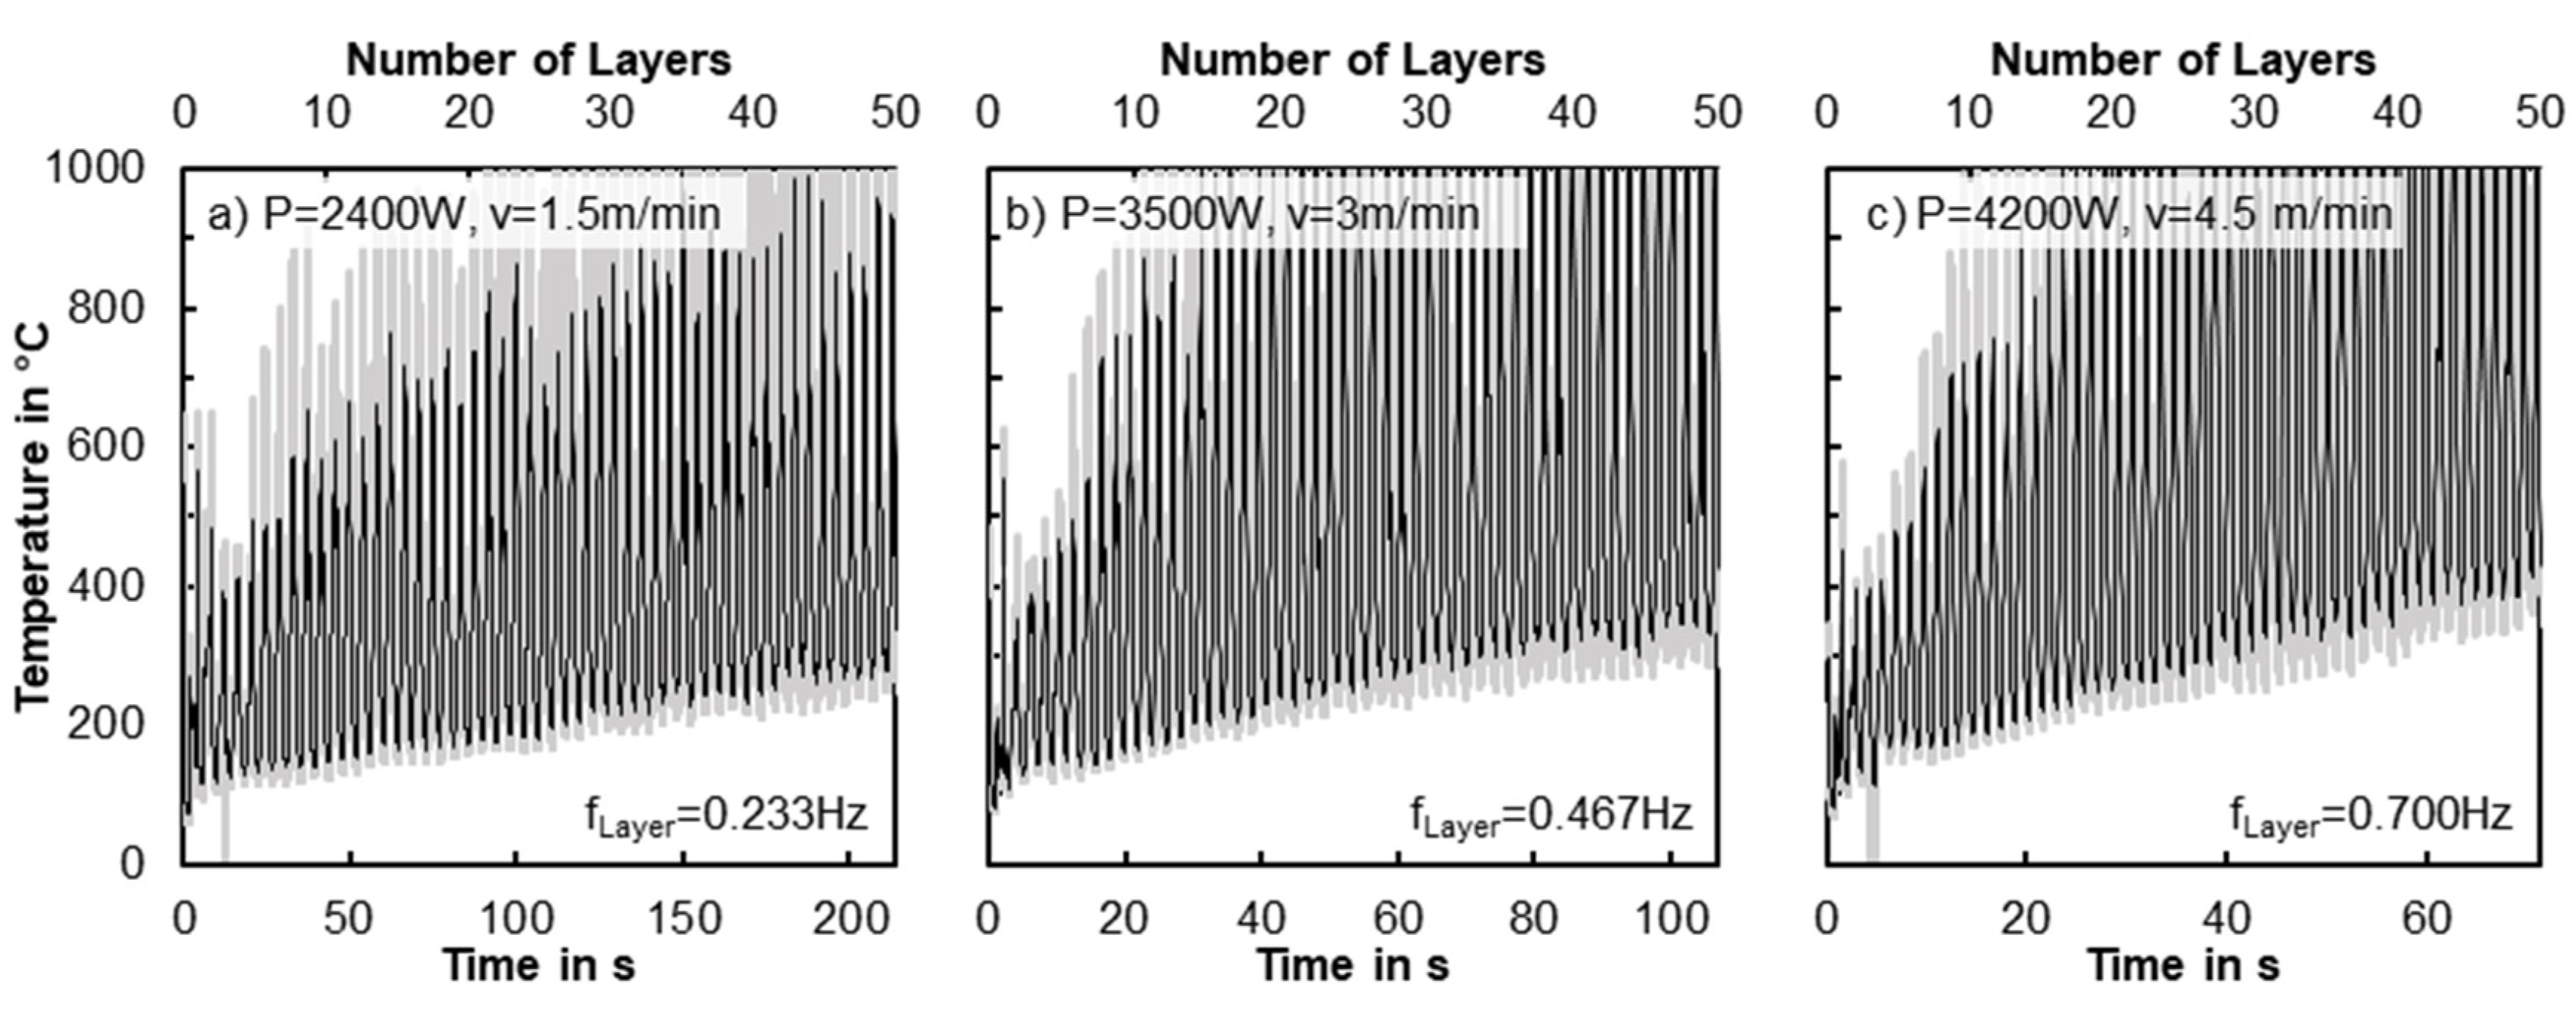
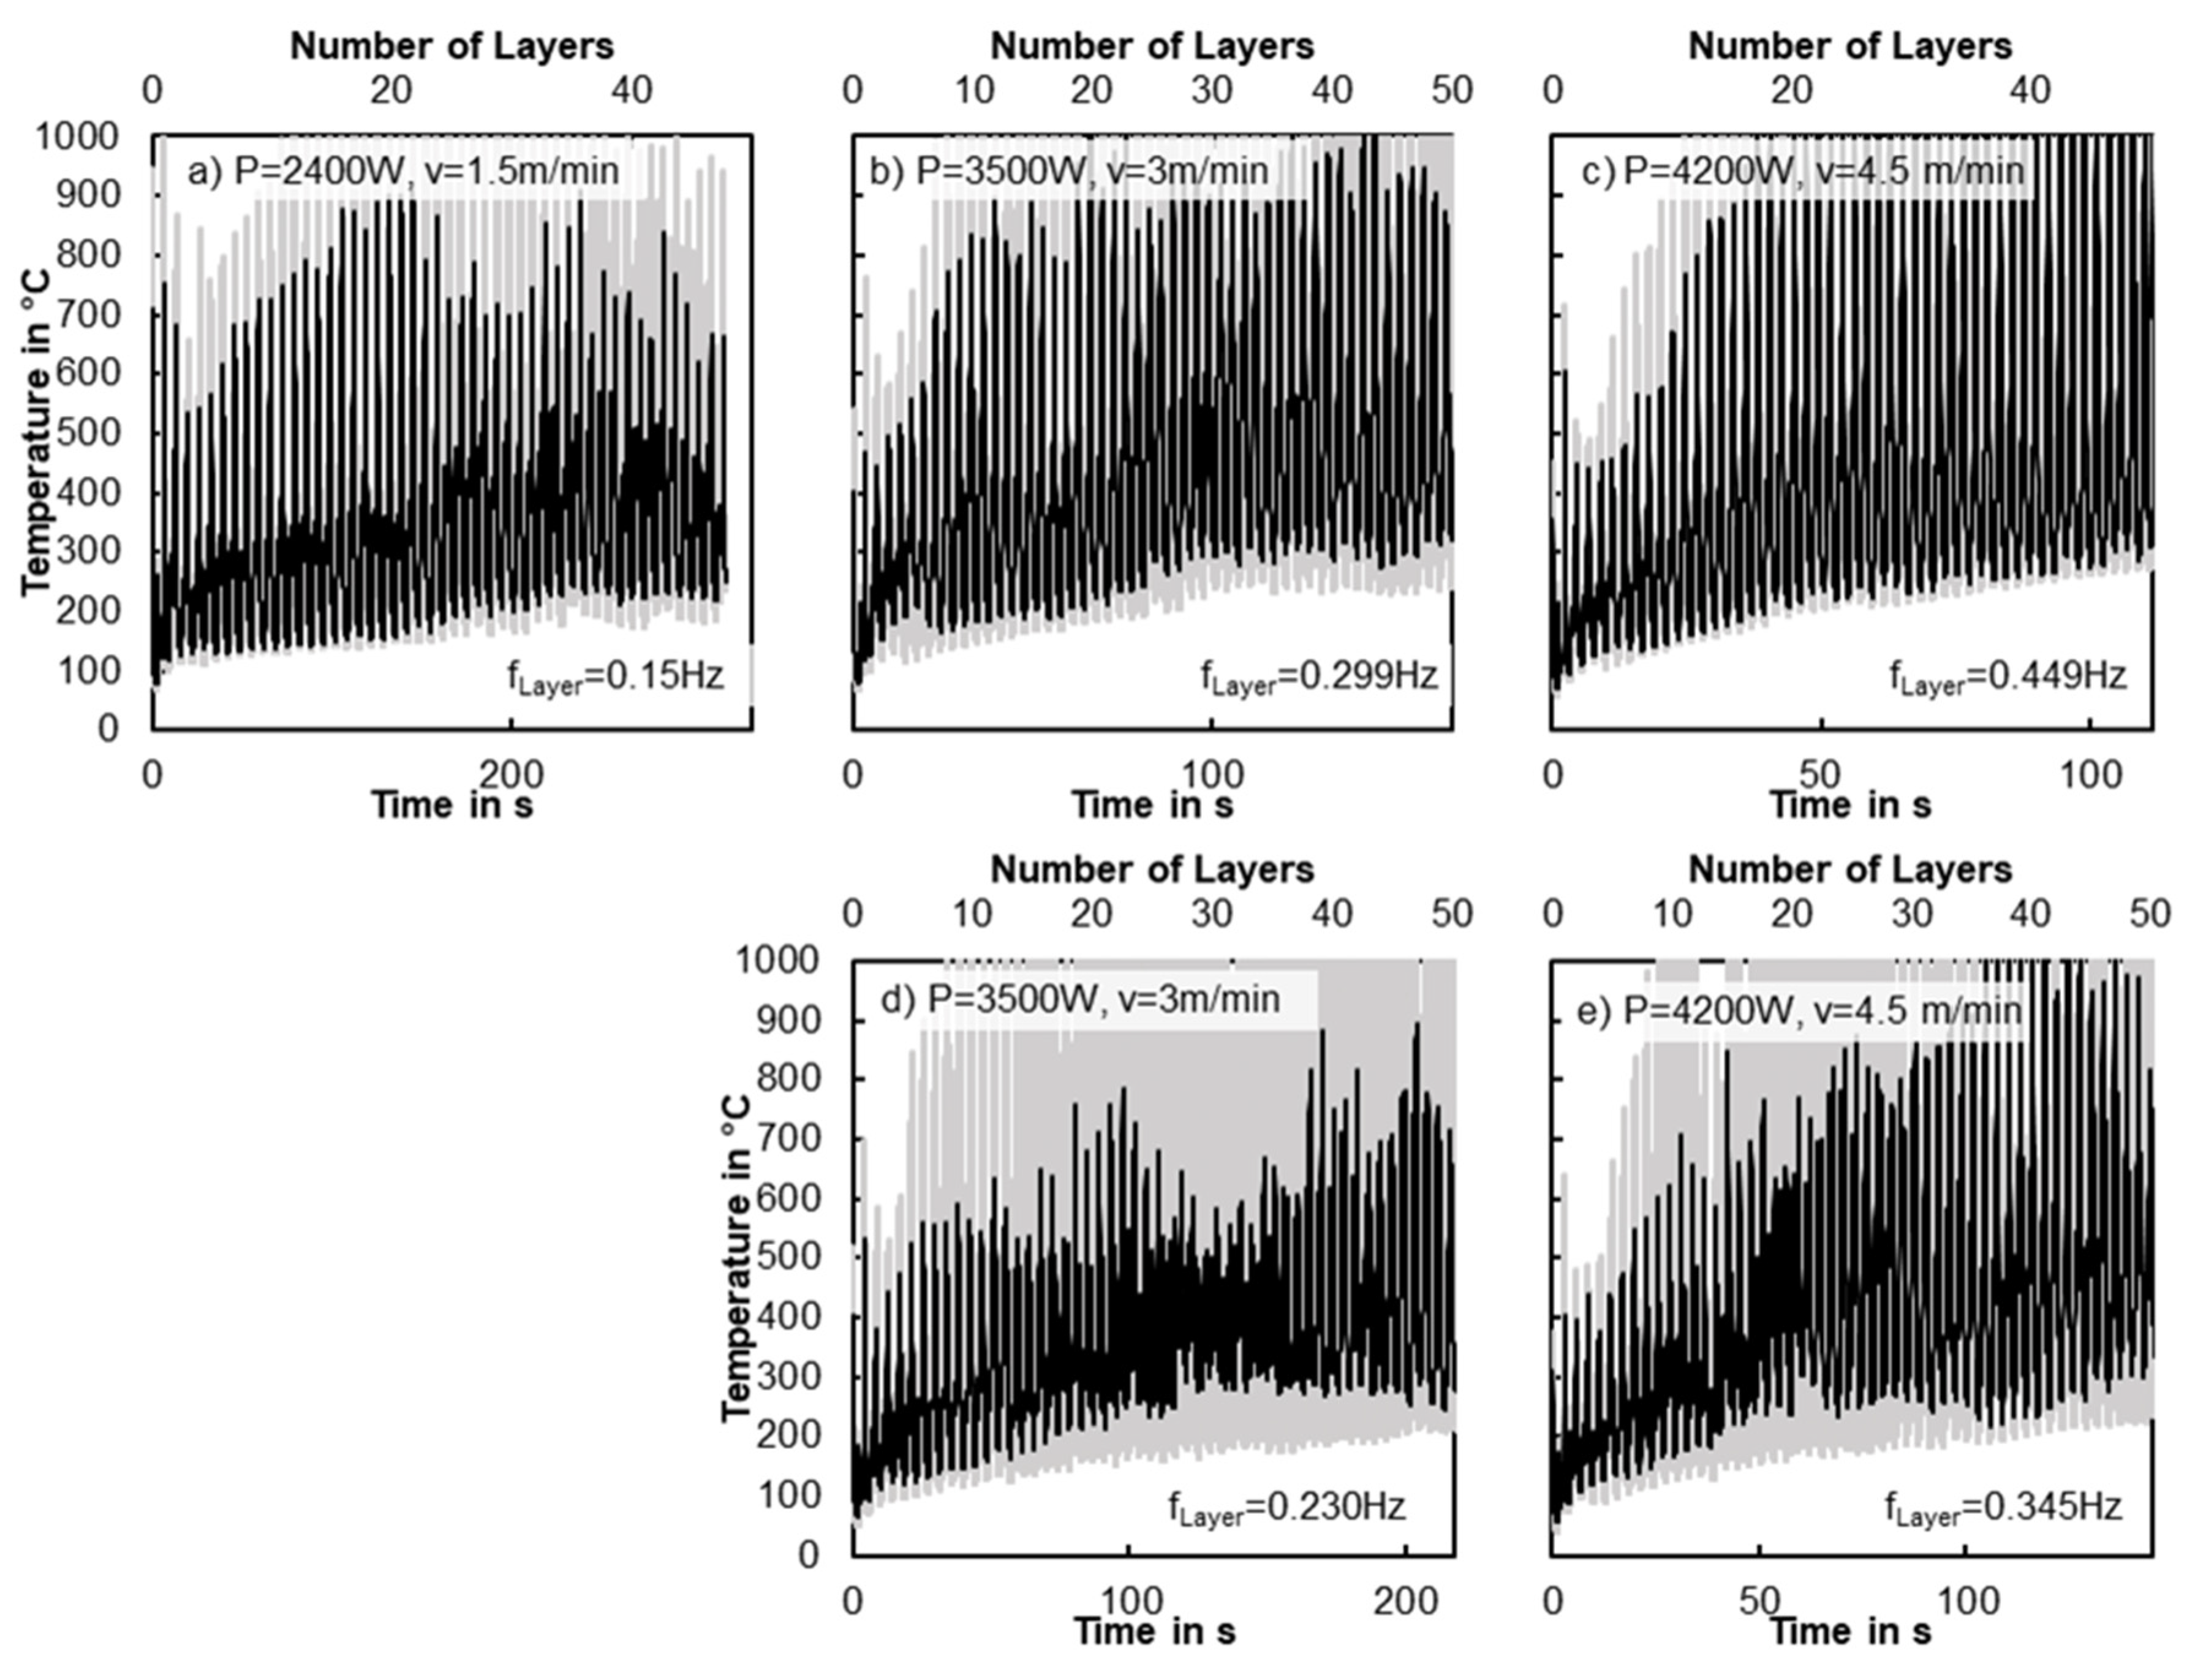
3.1. Temporal Evolution of the Residual Temperature
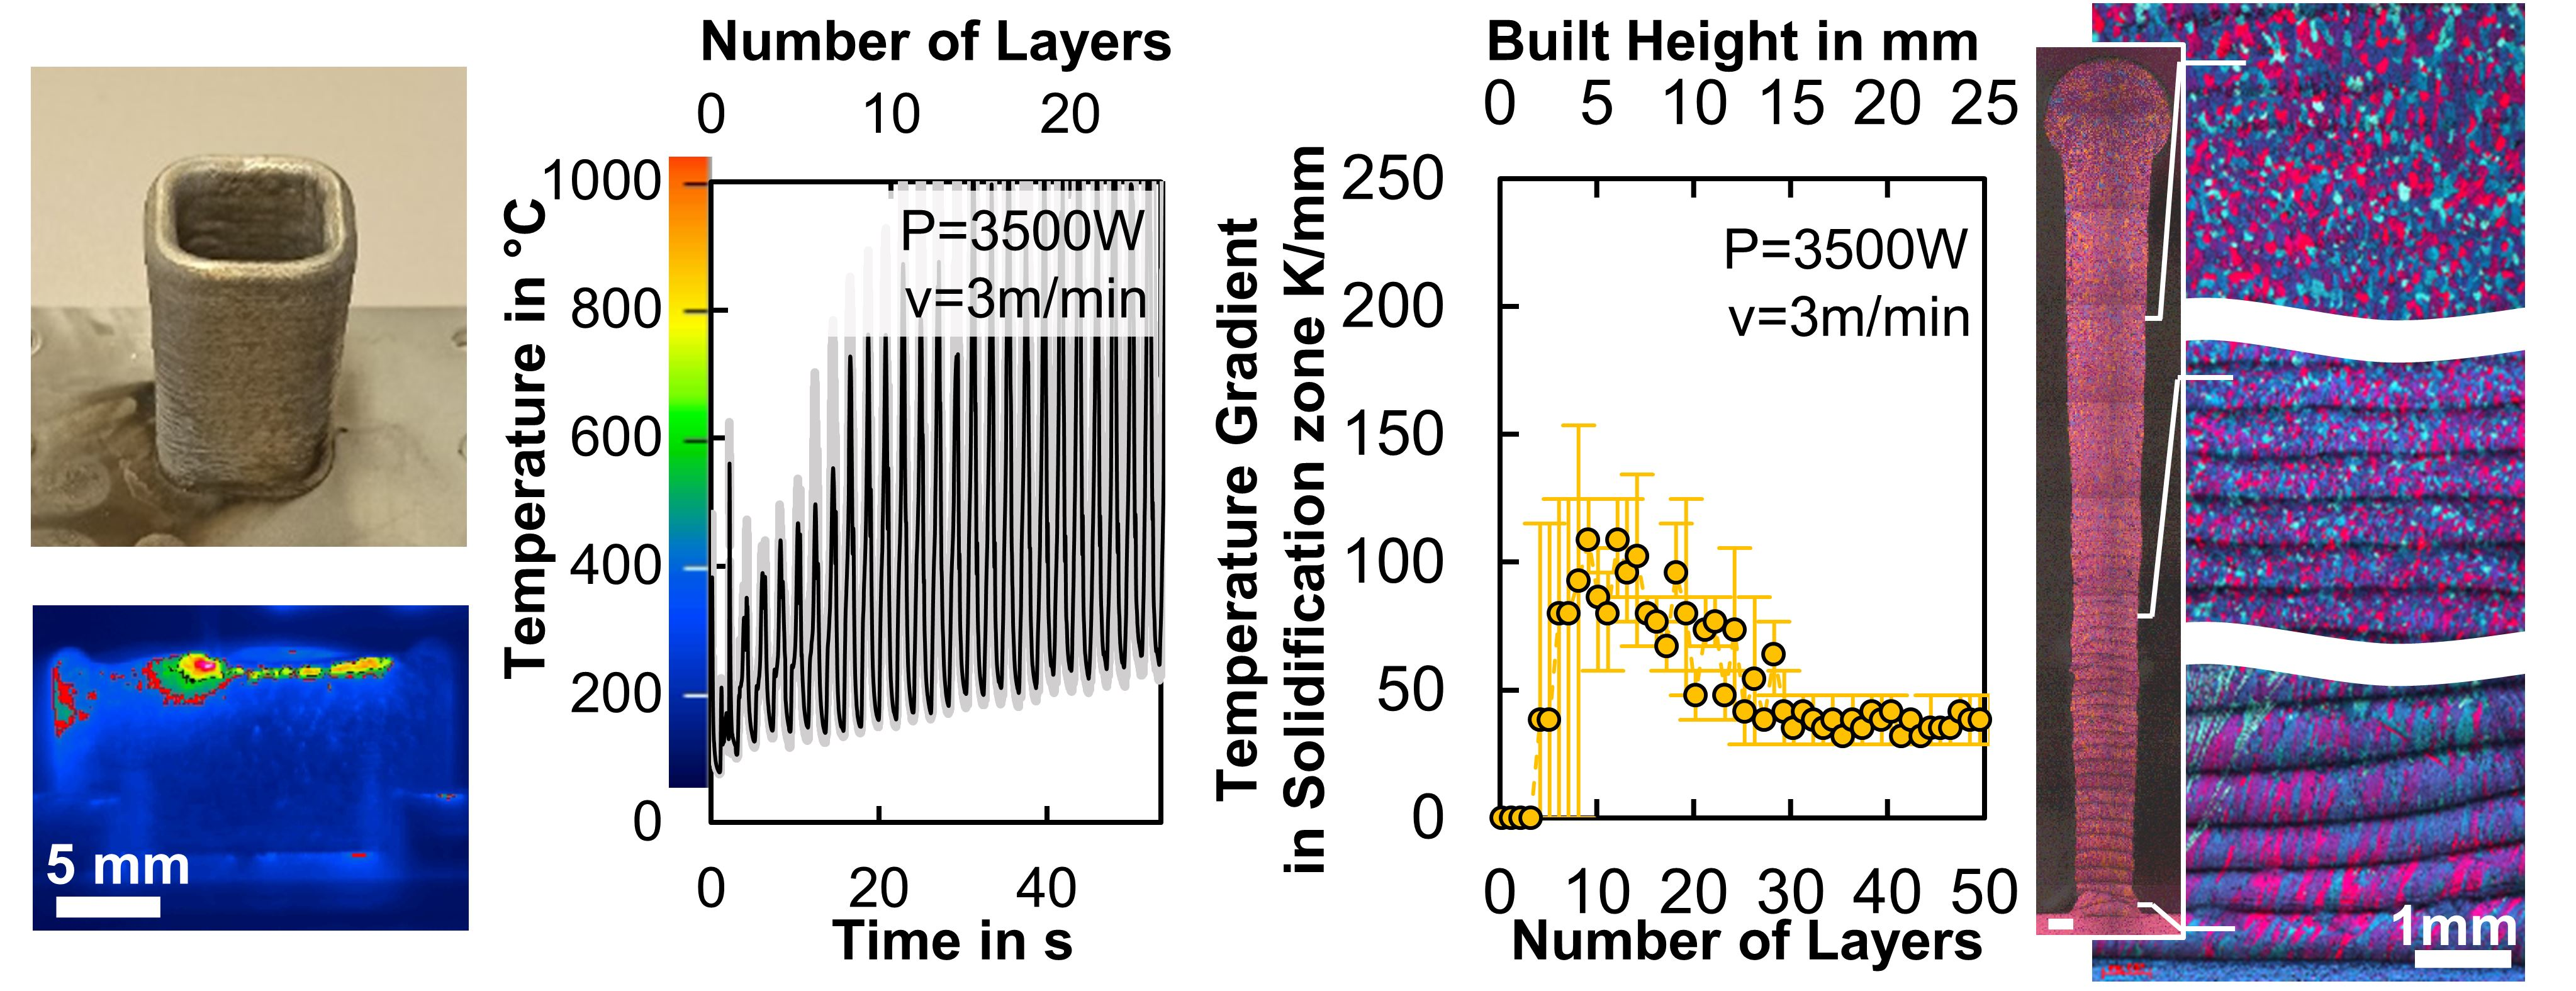
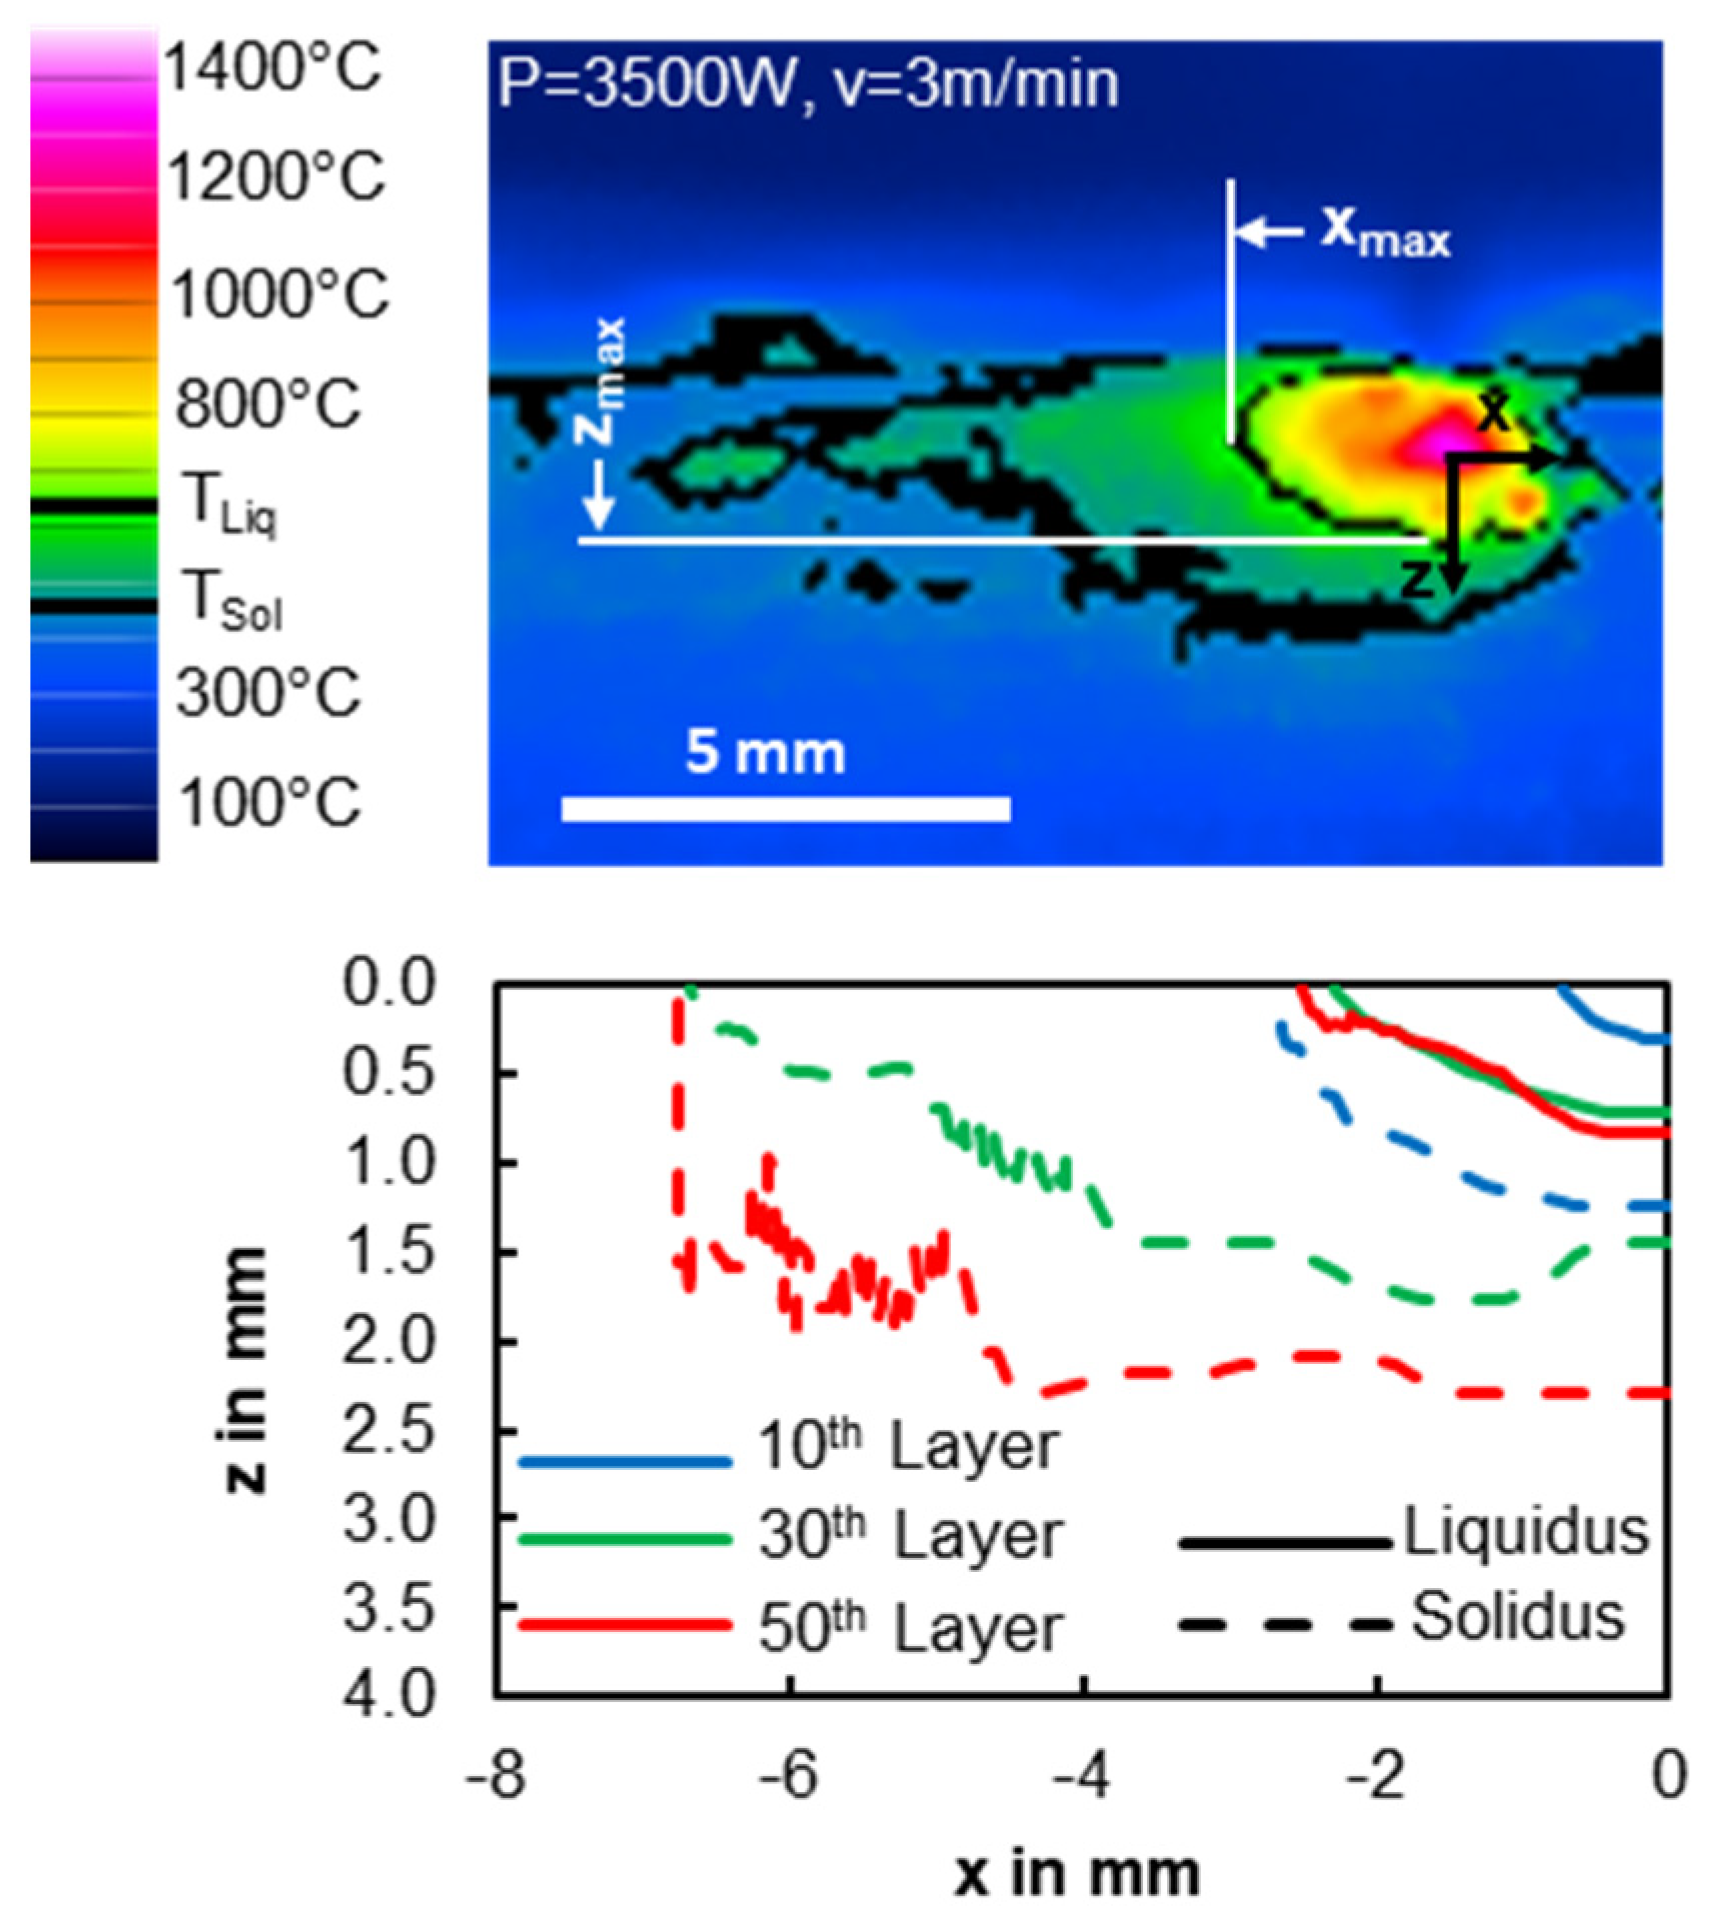
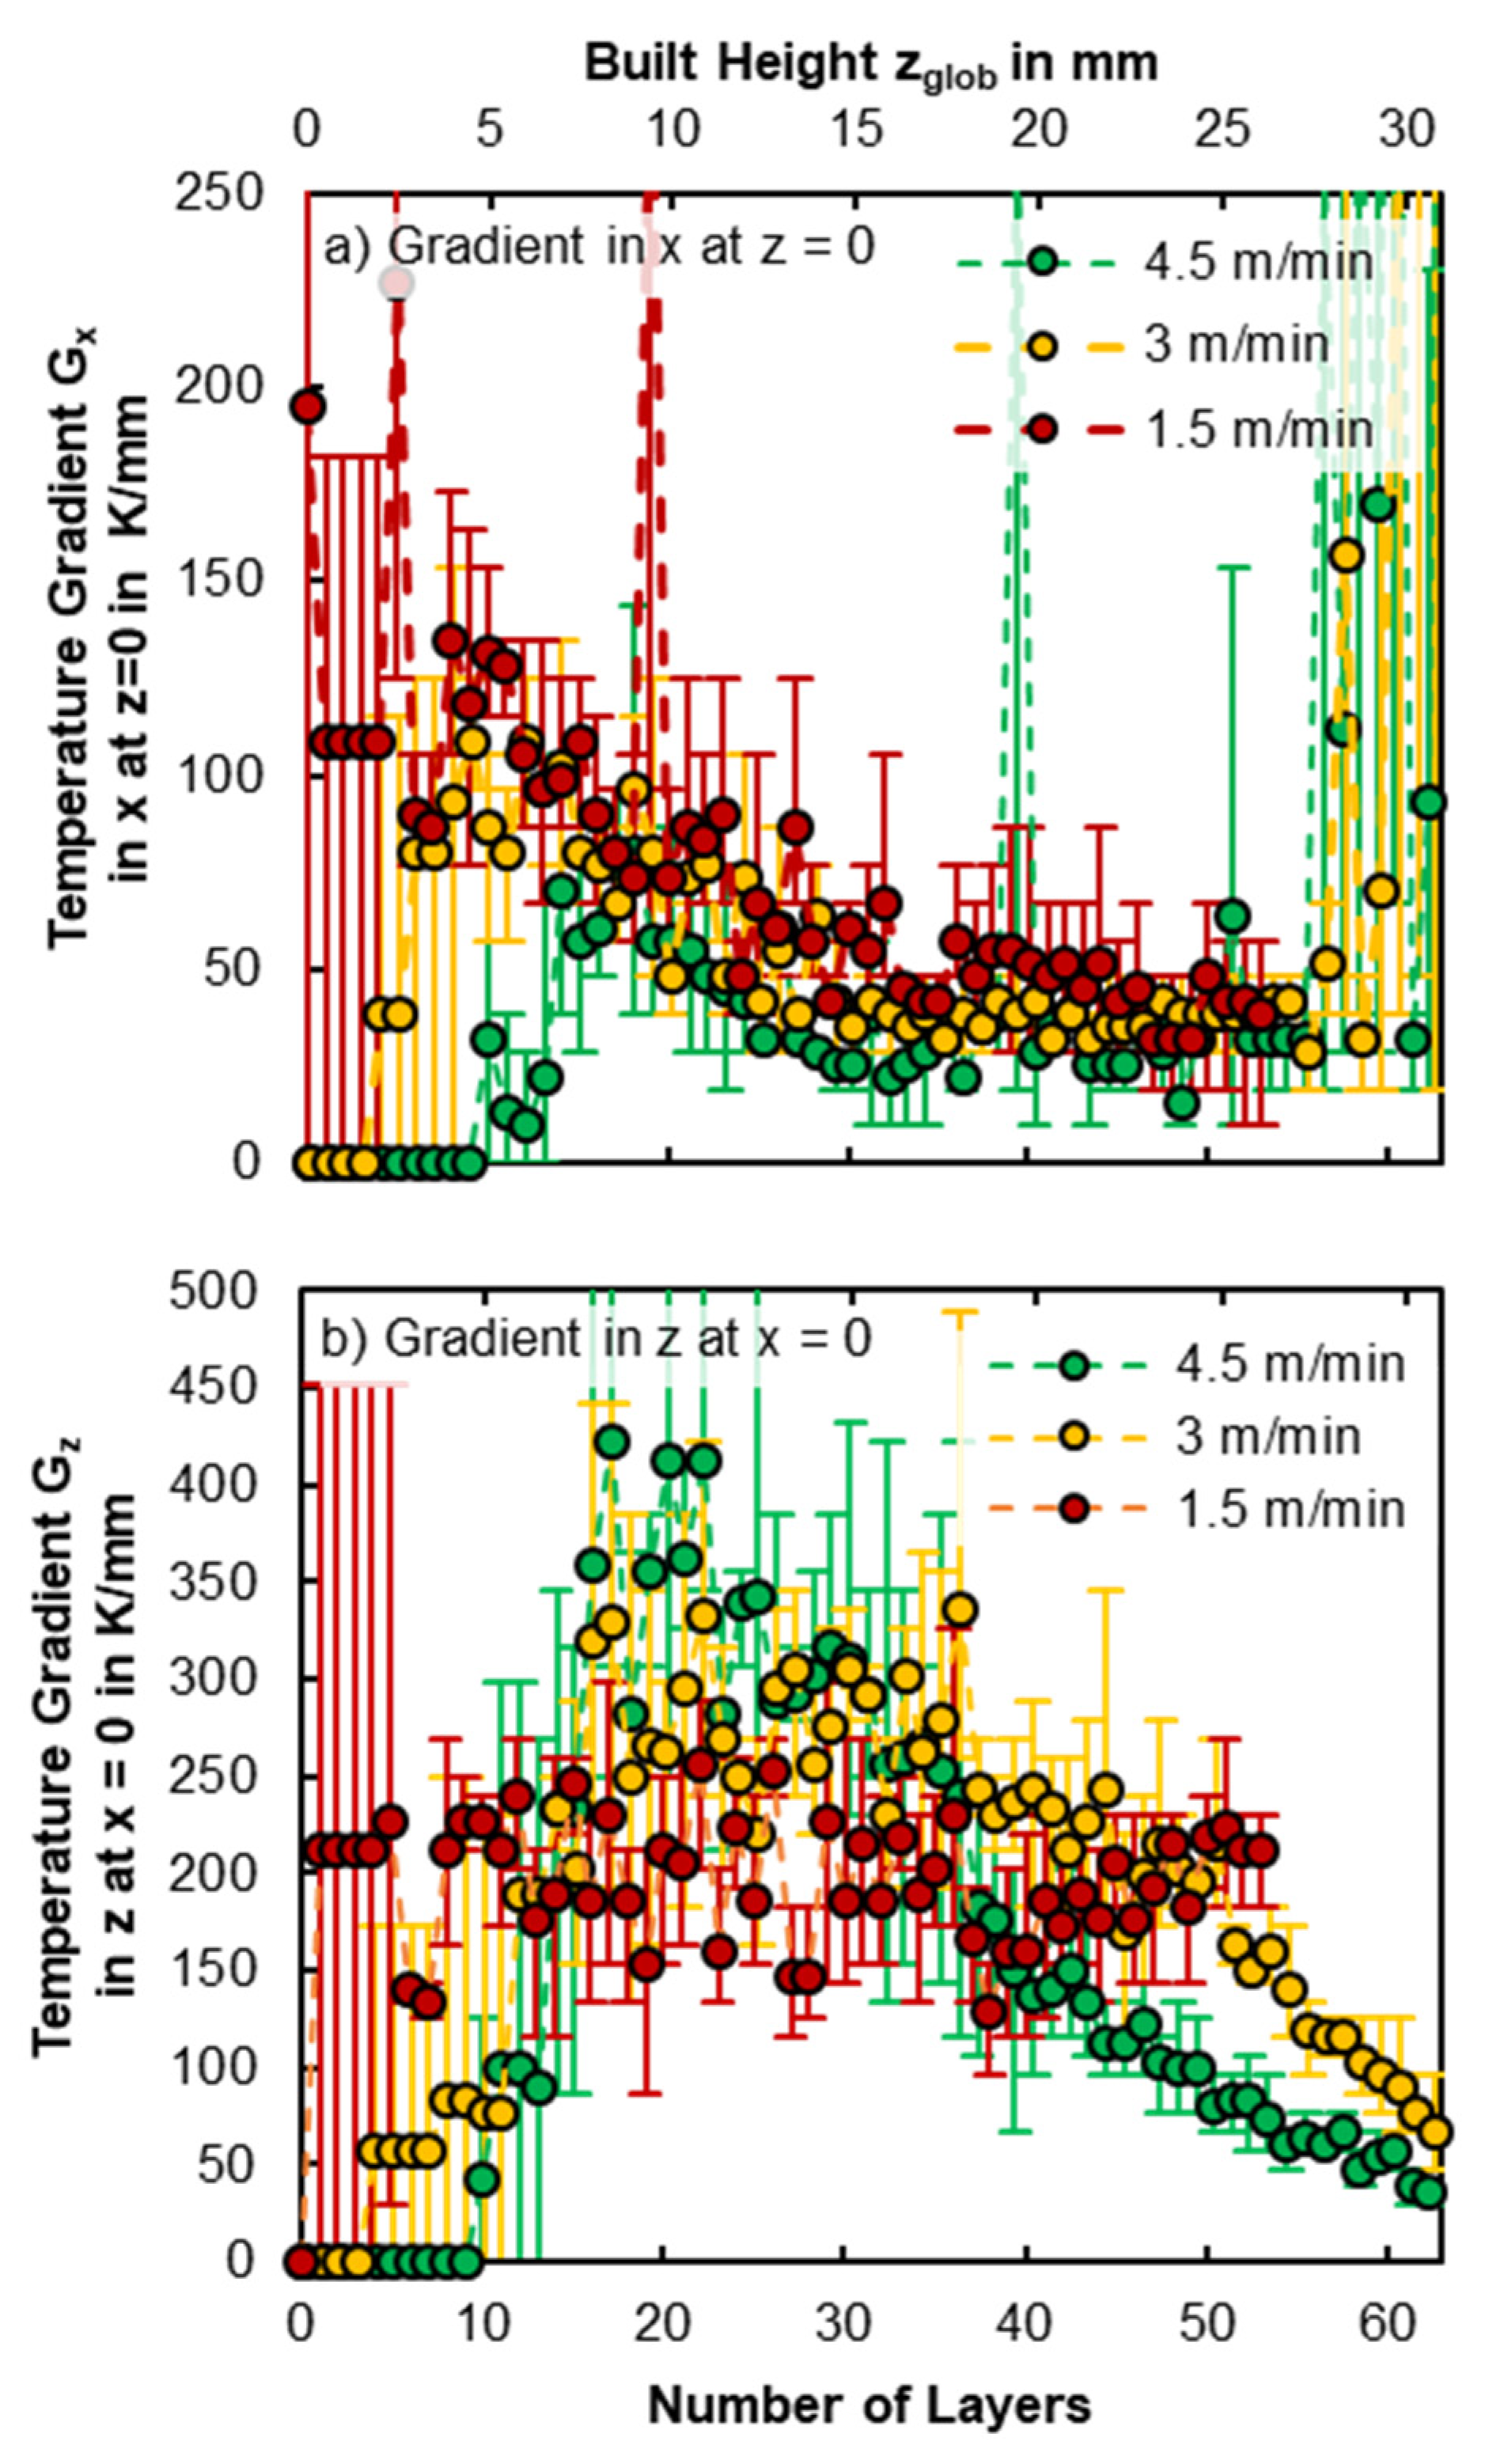
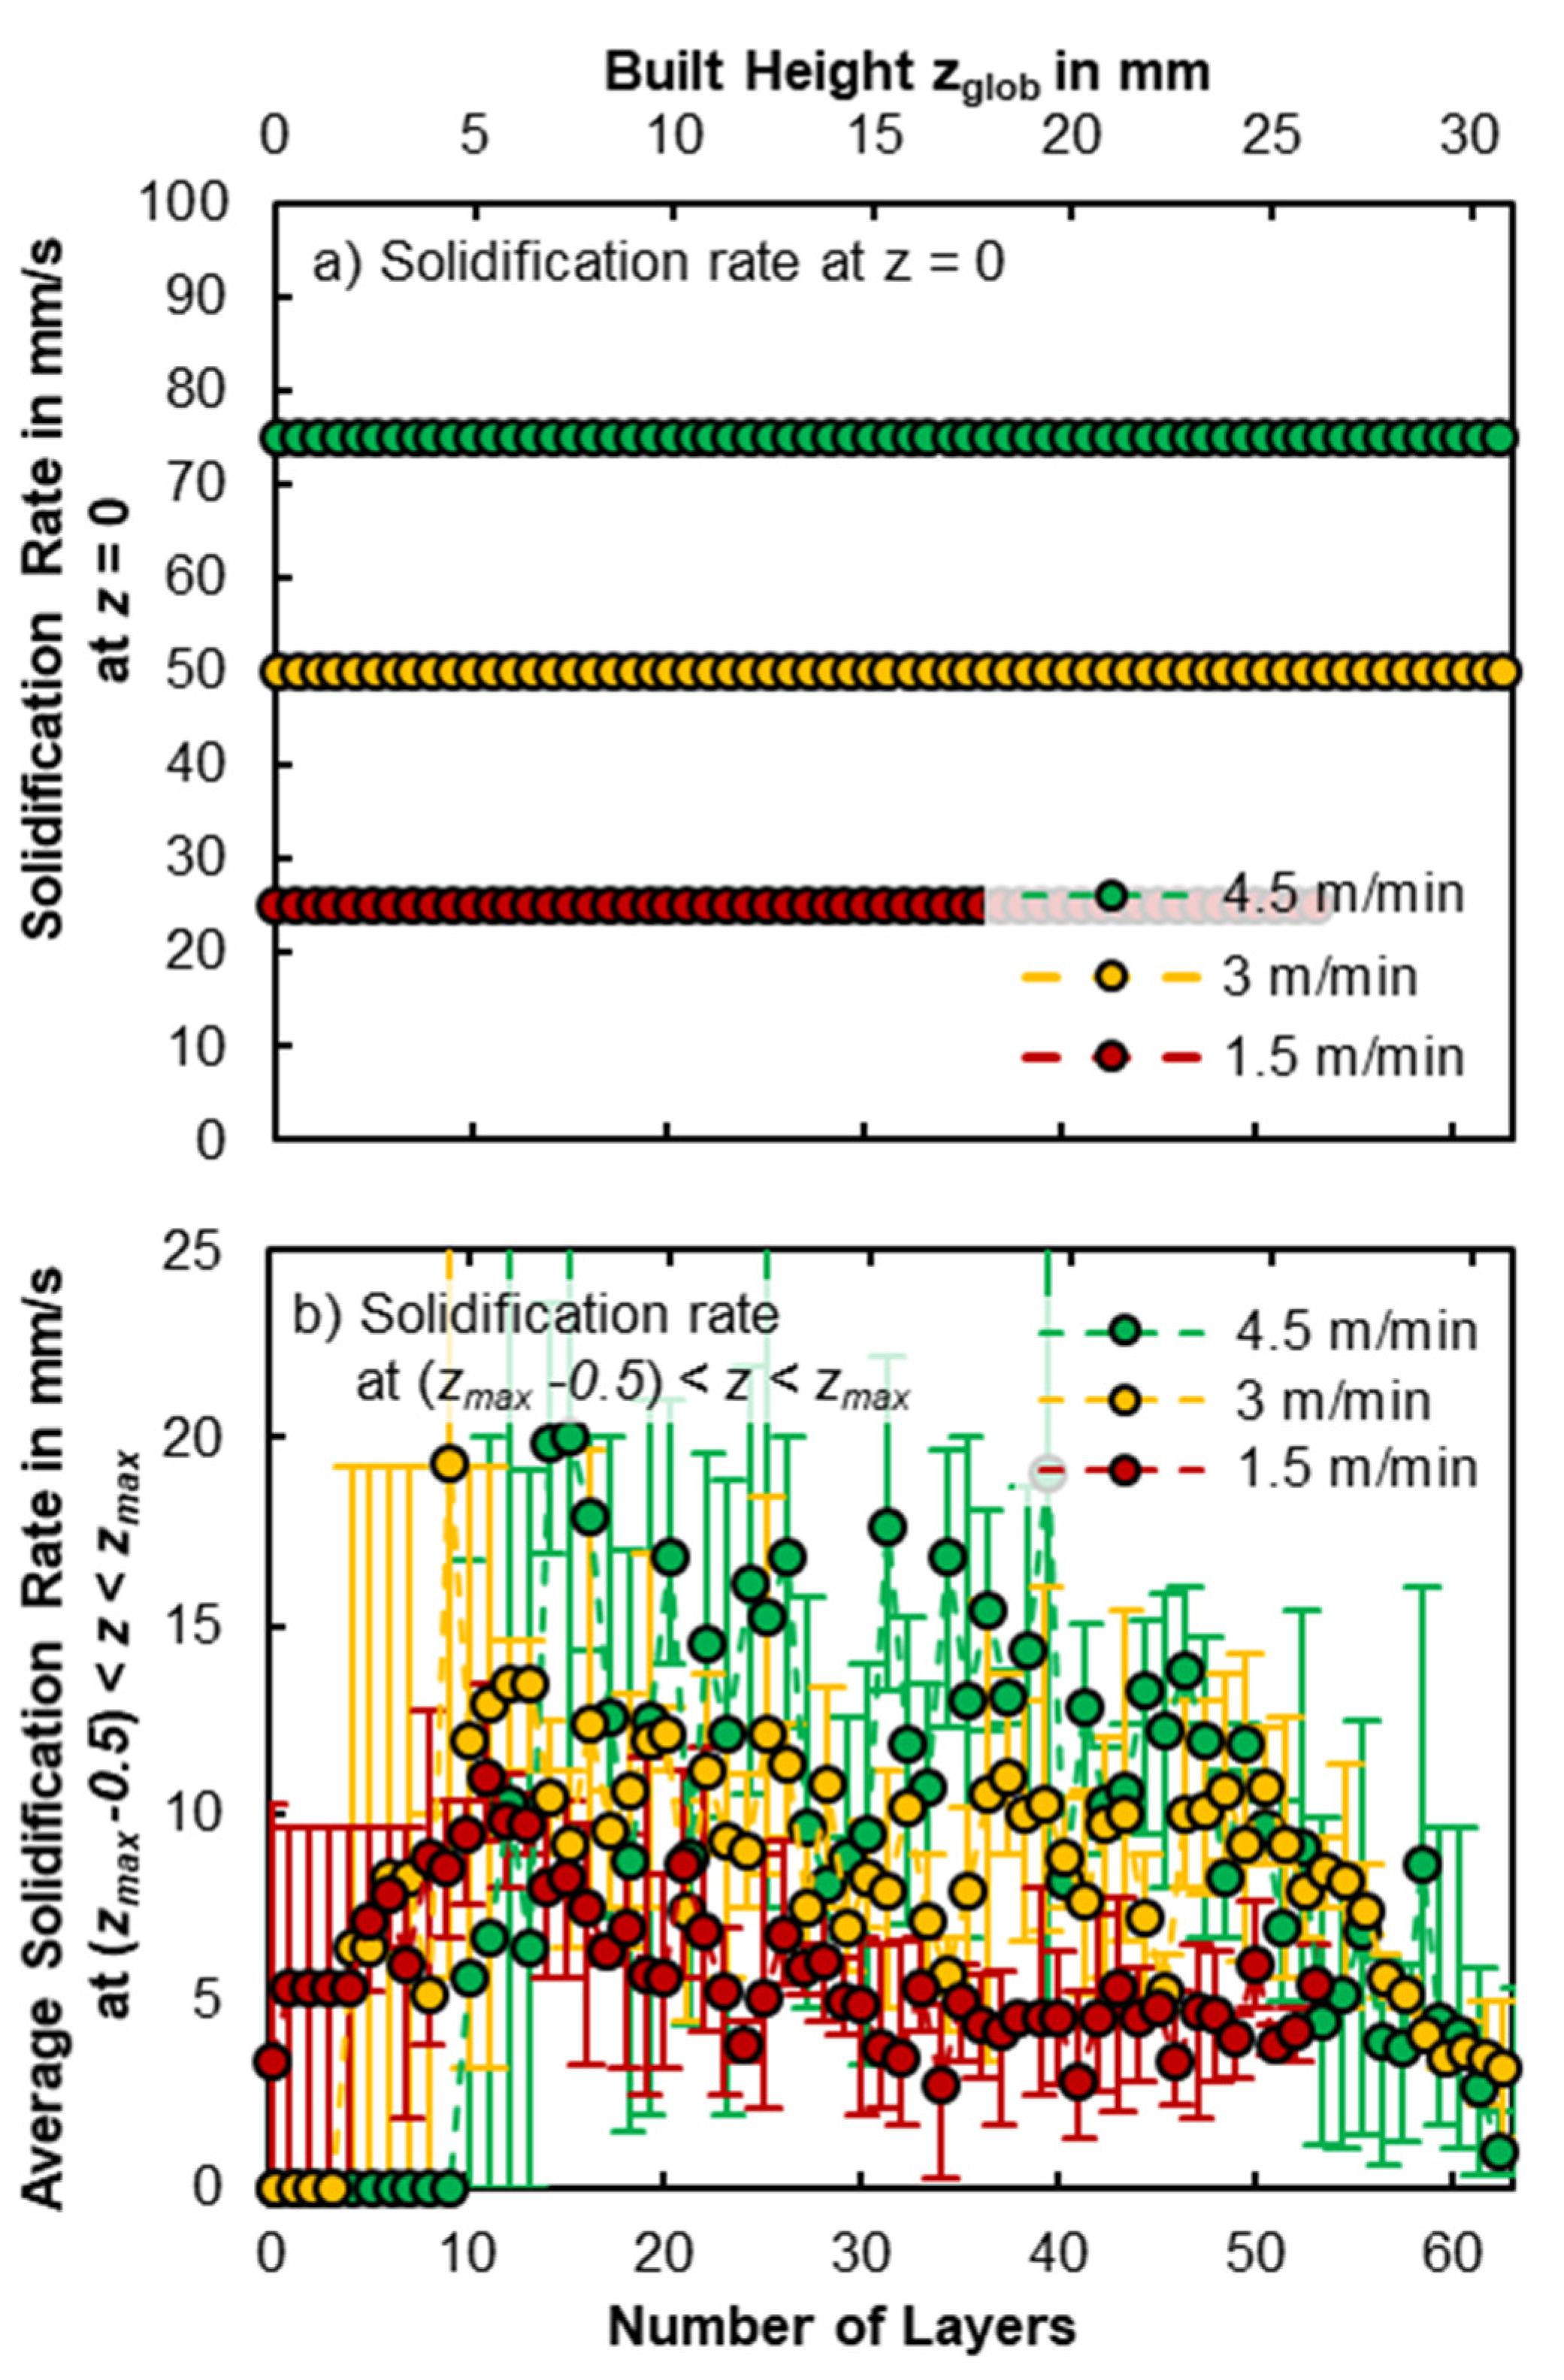
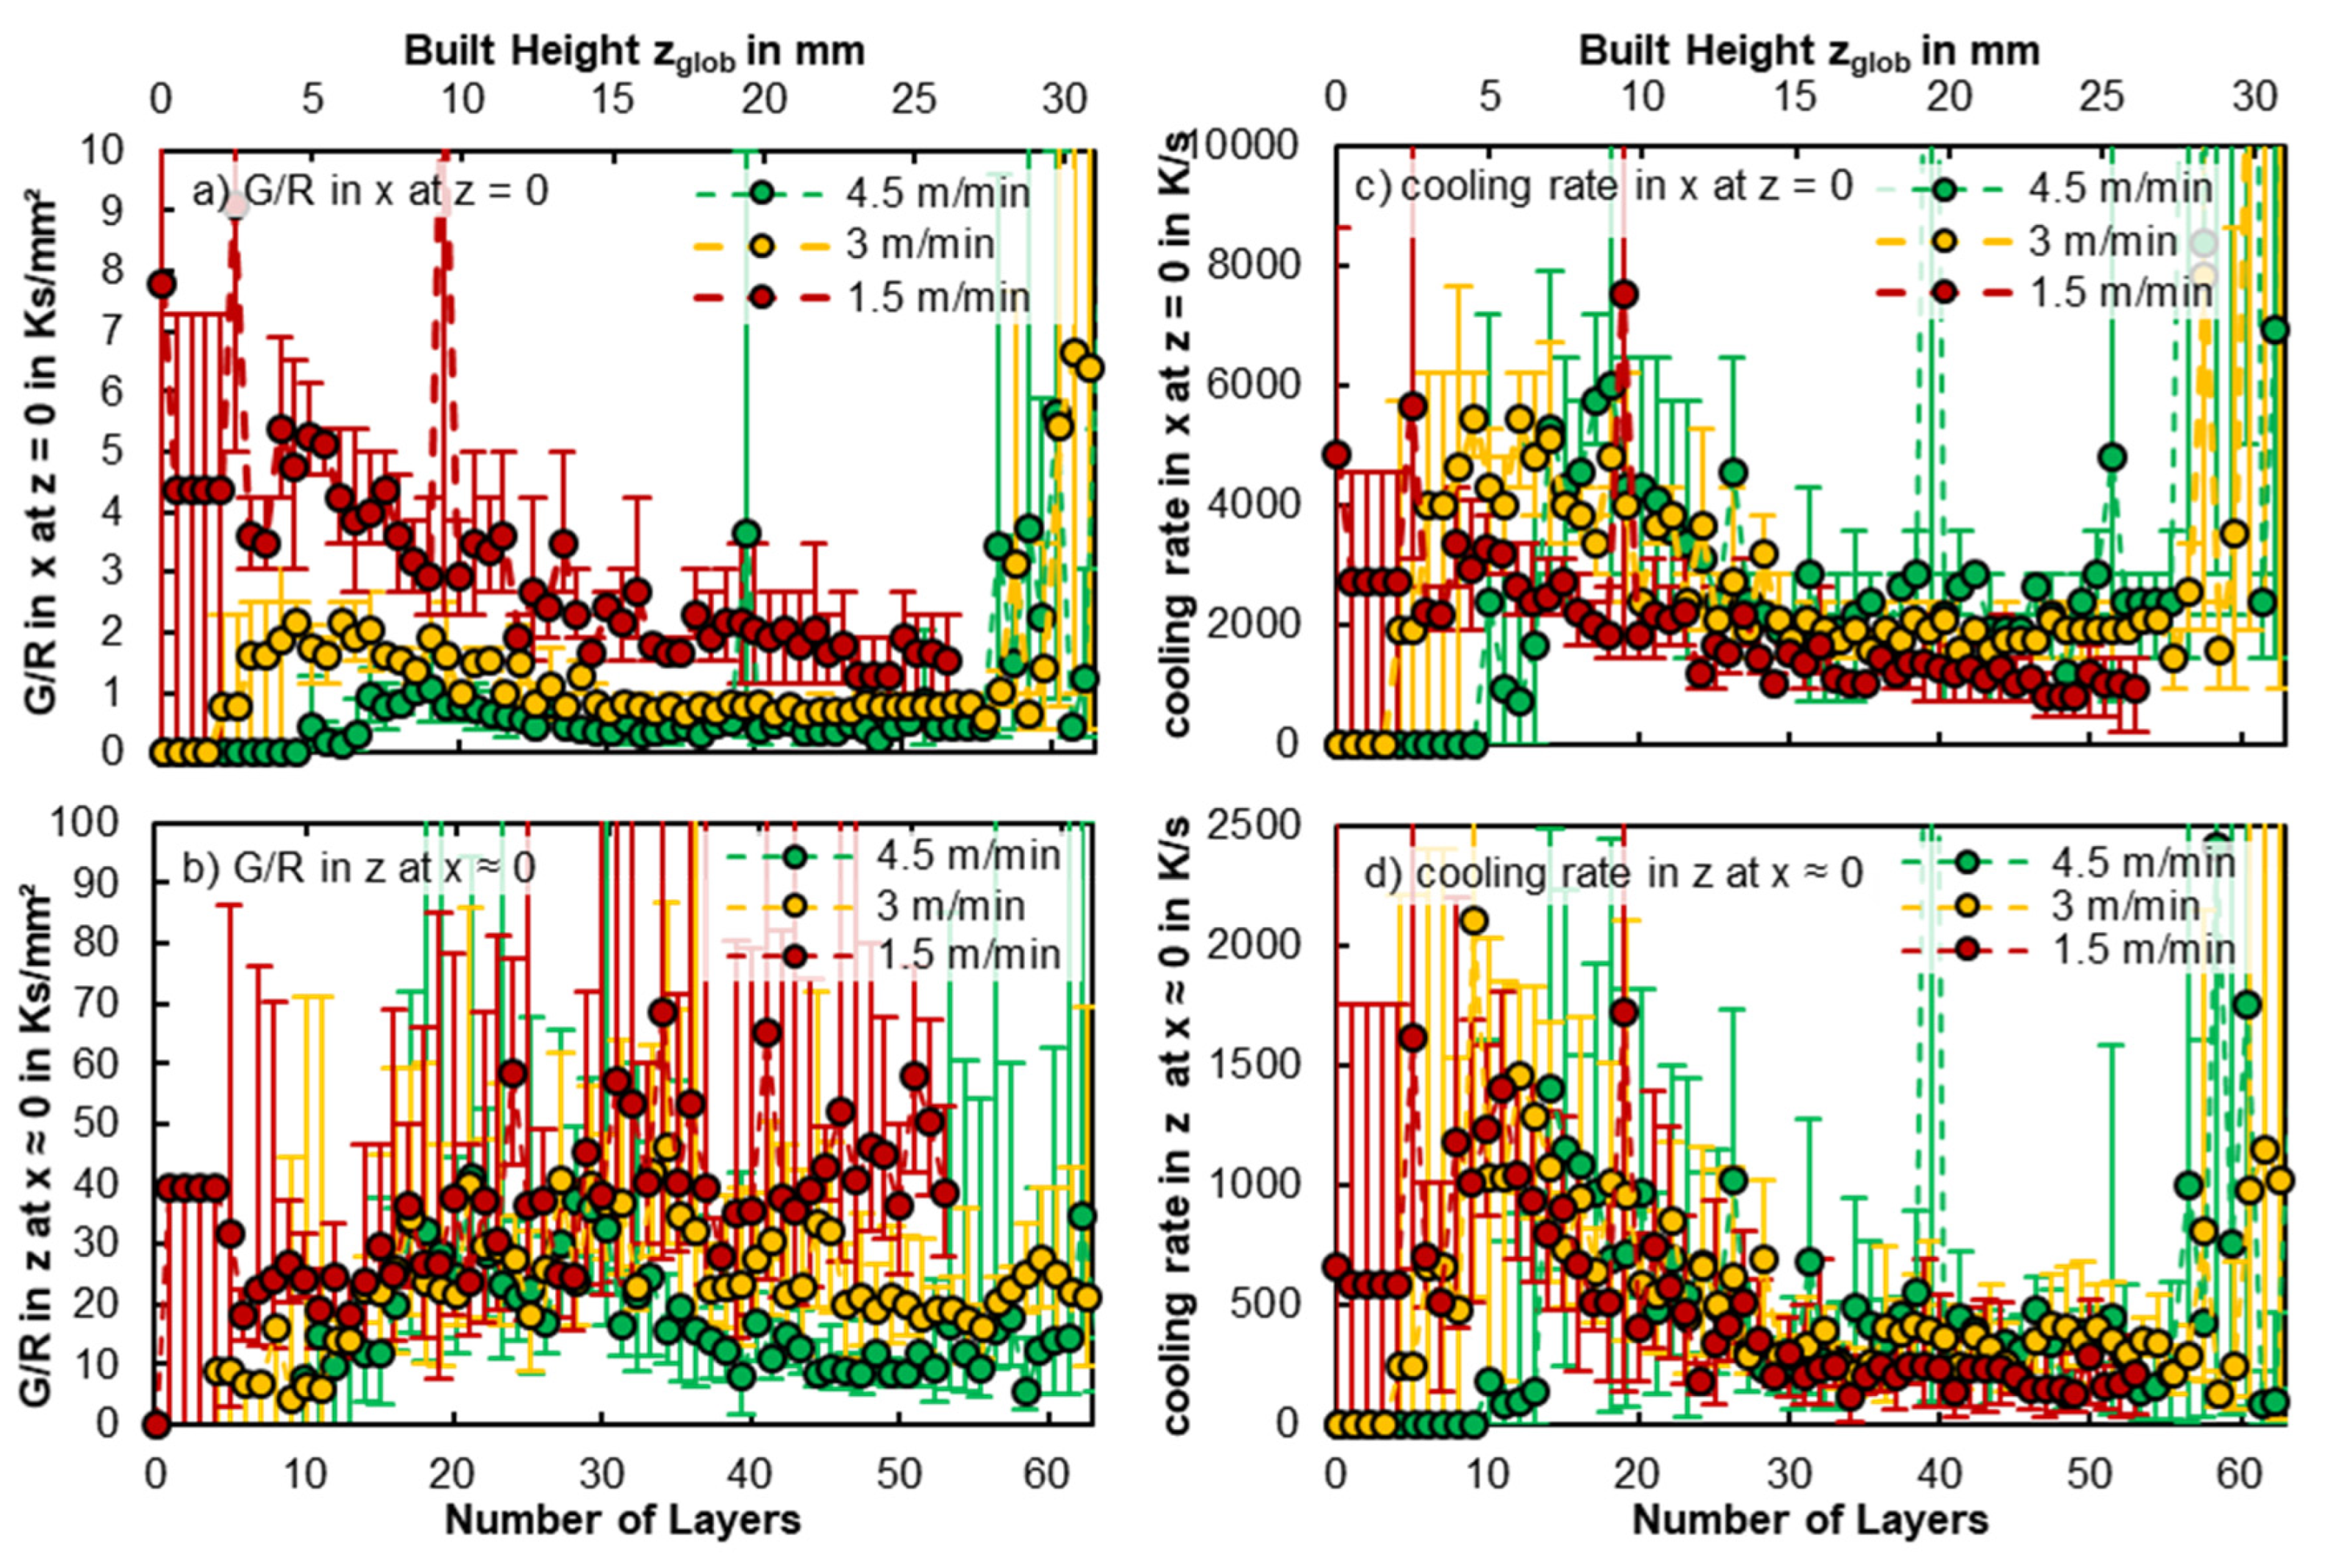
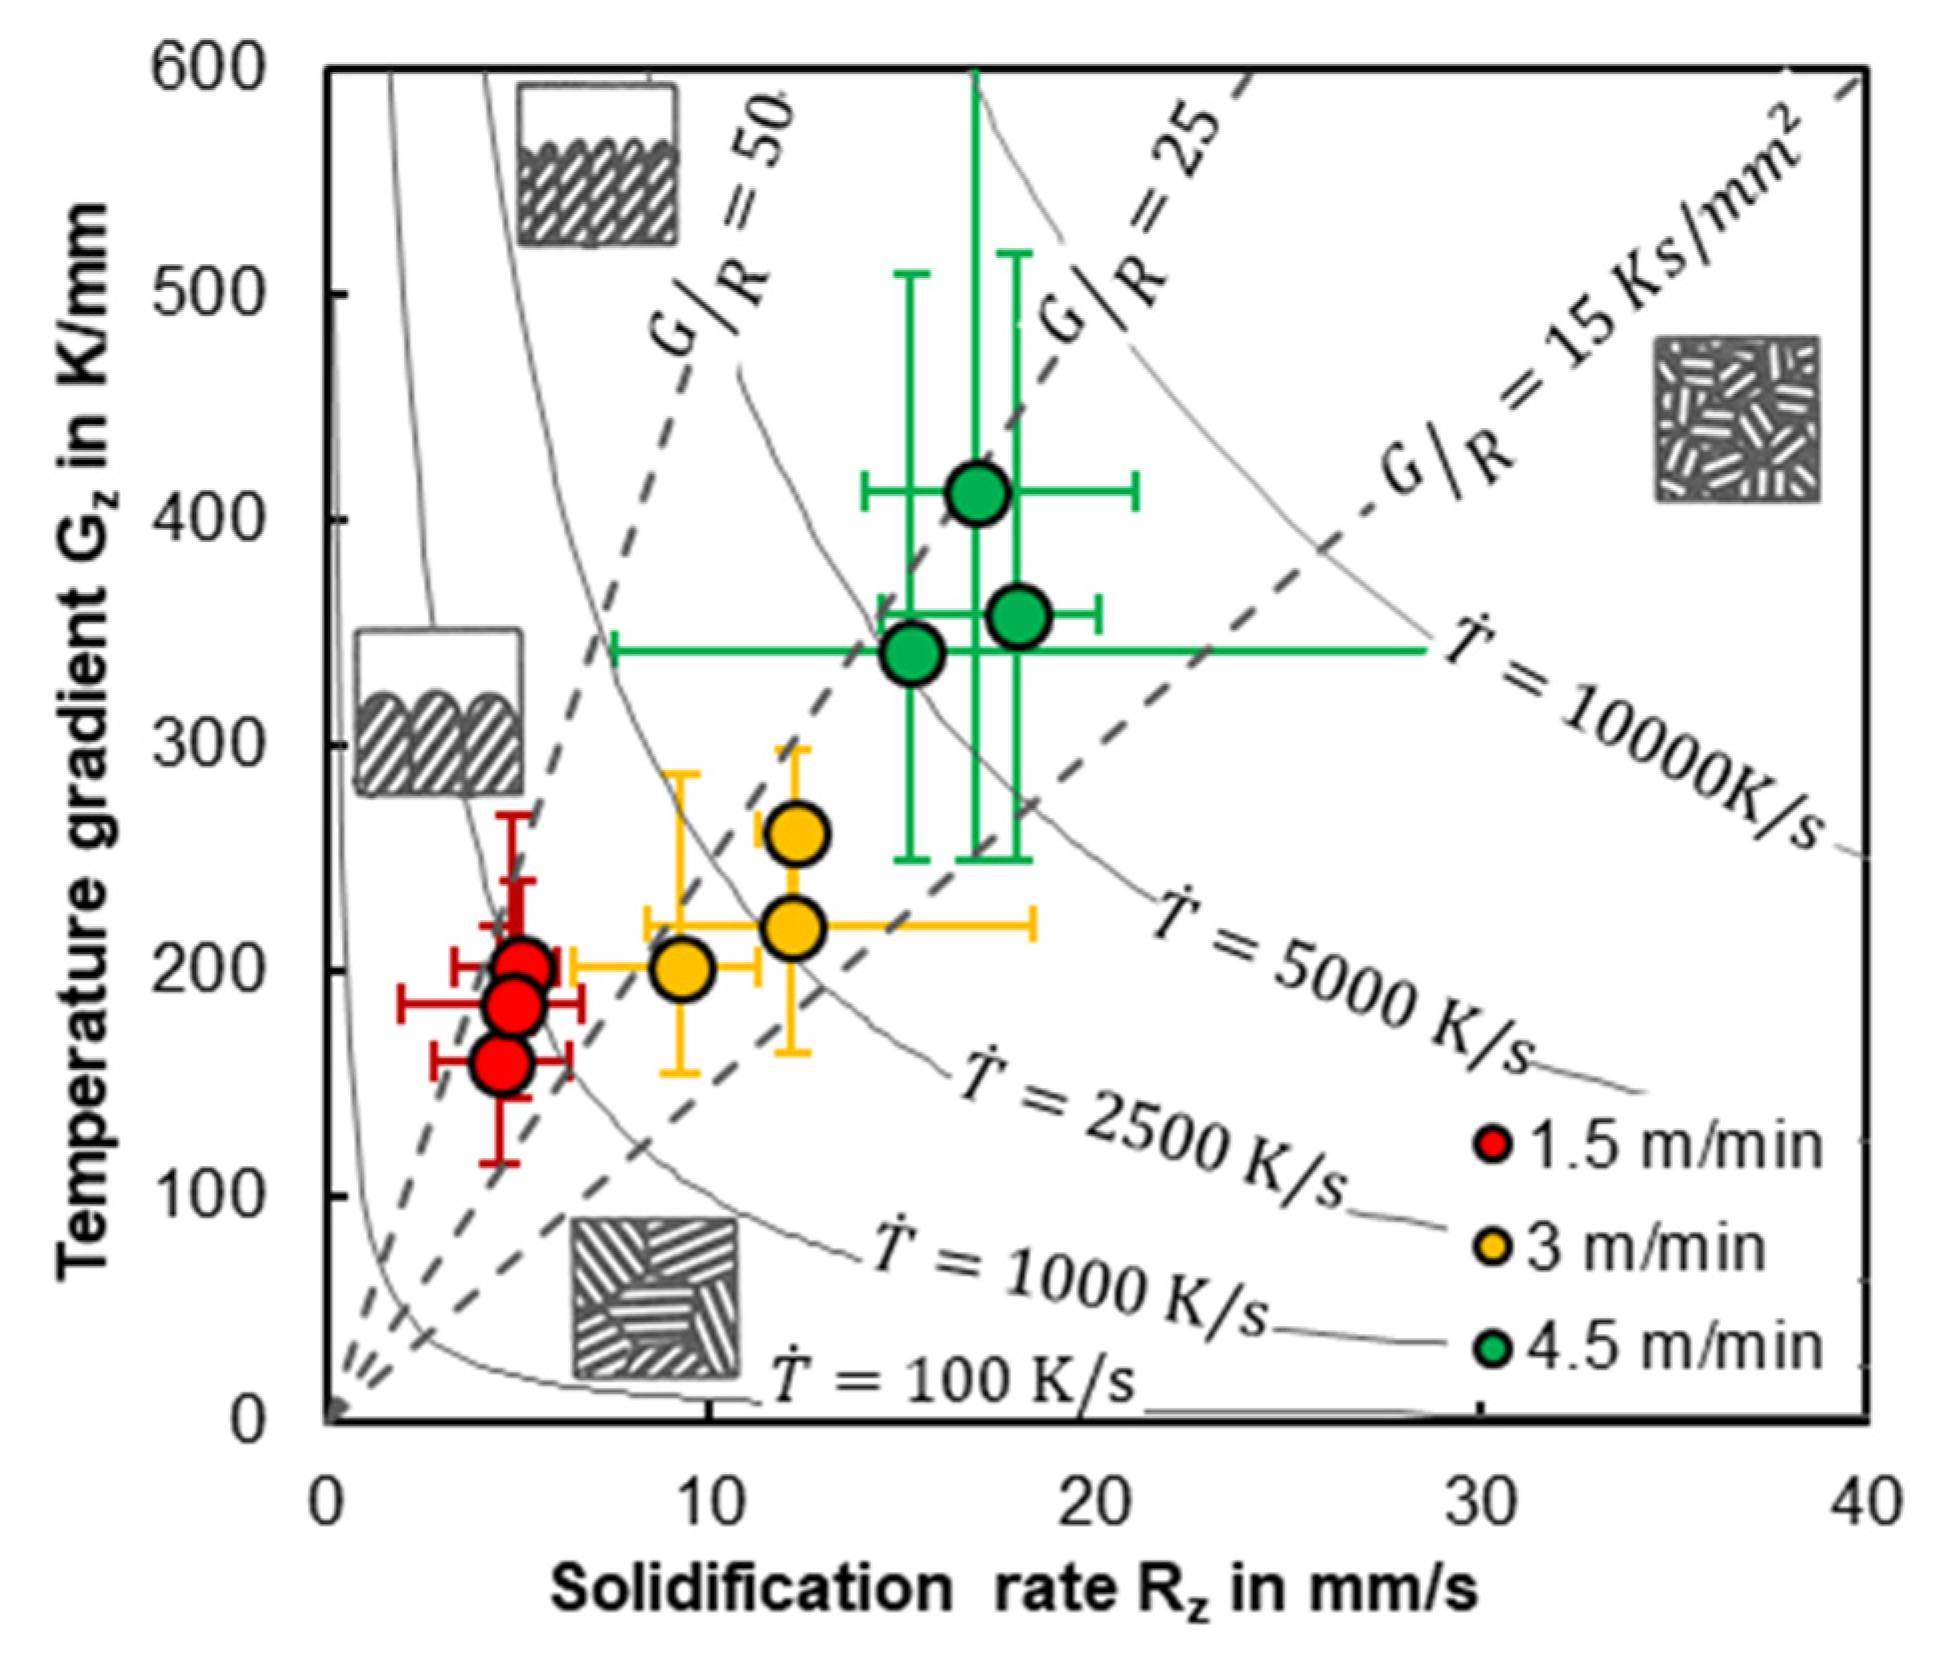
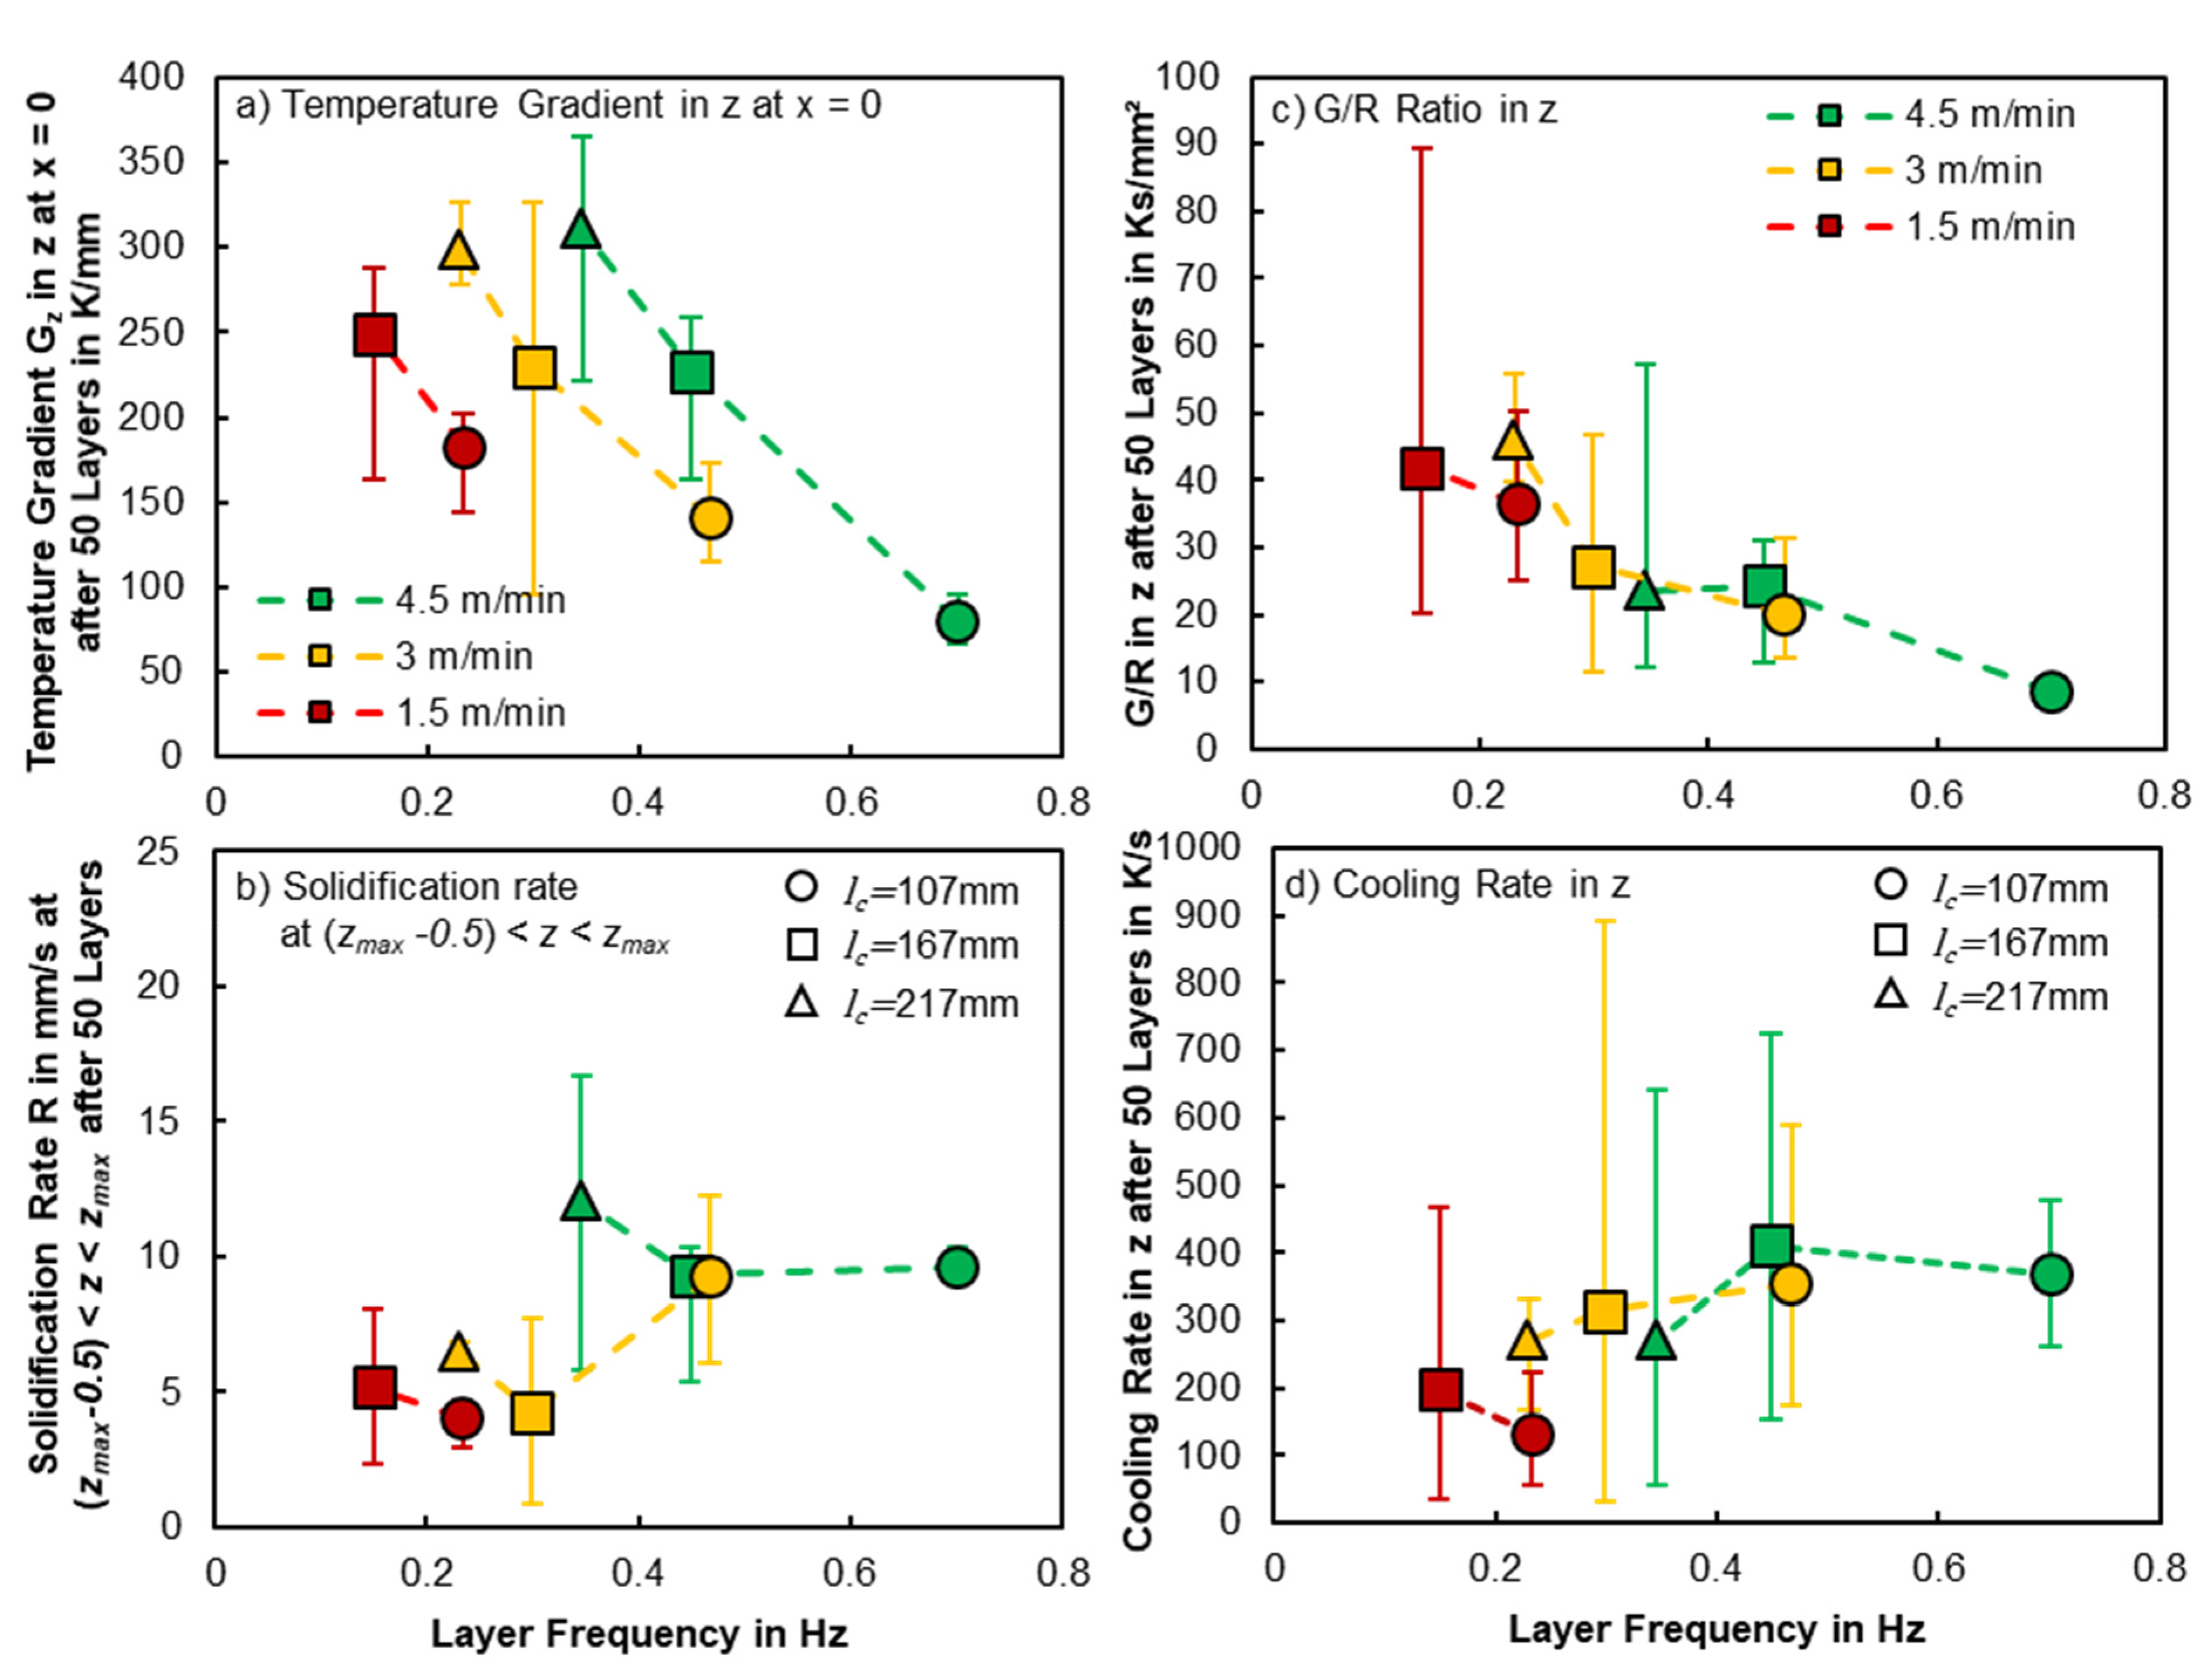
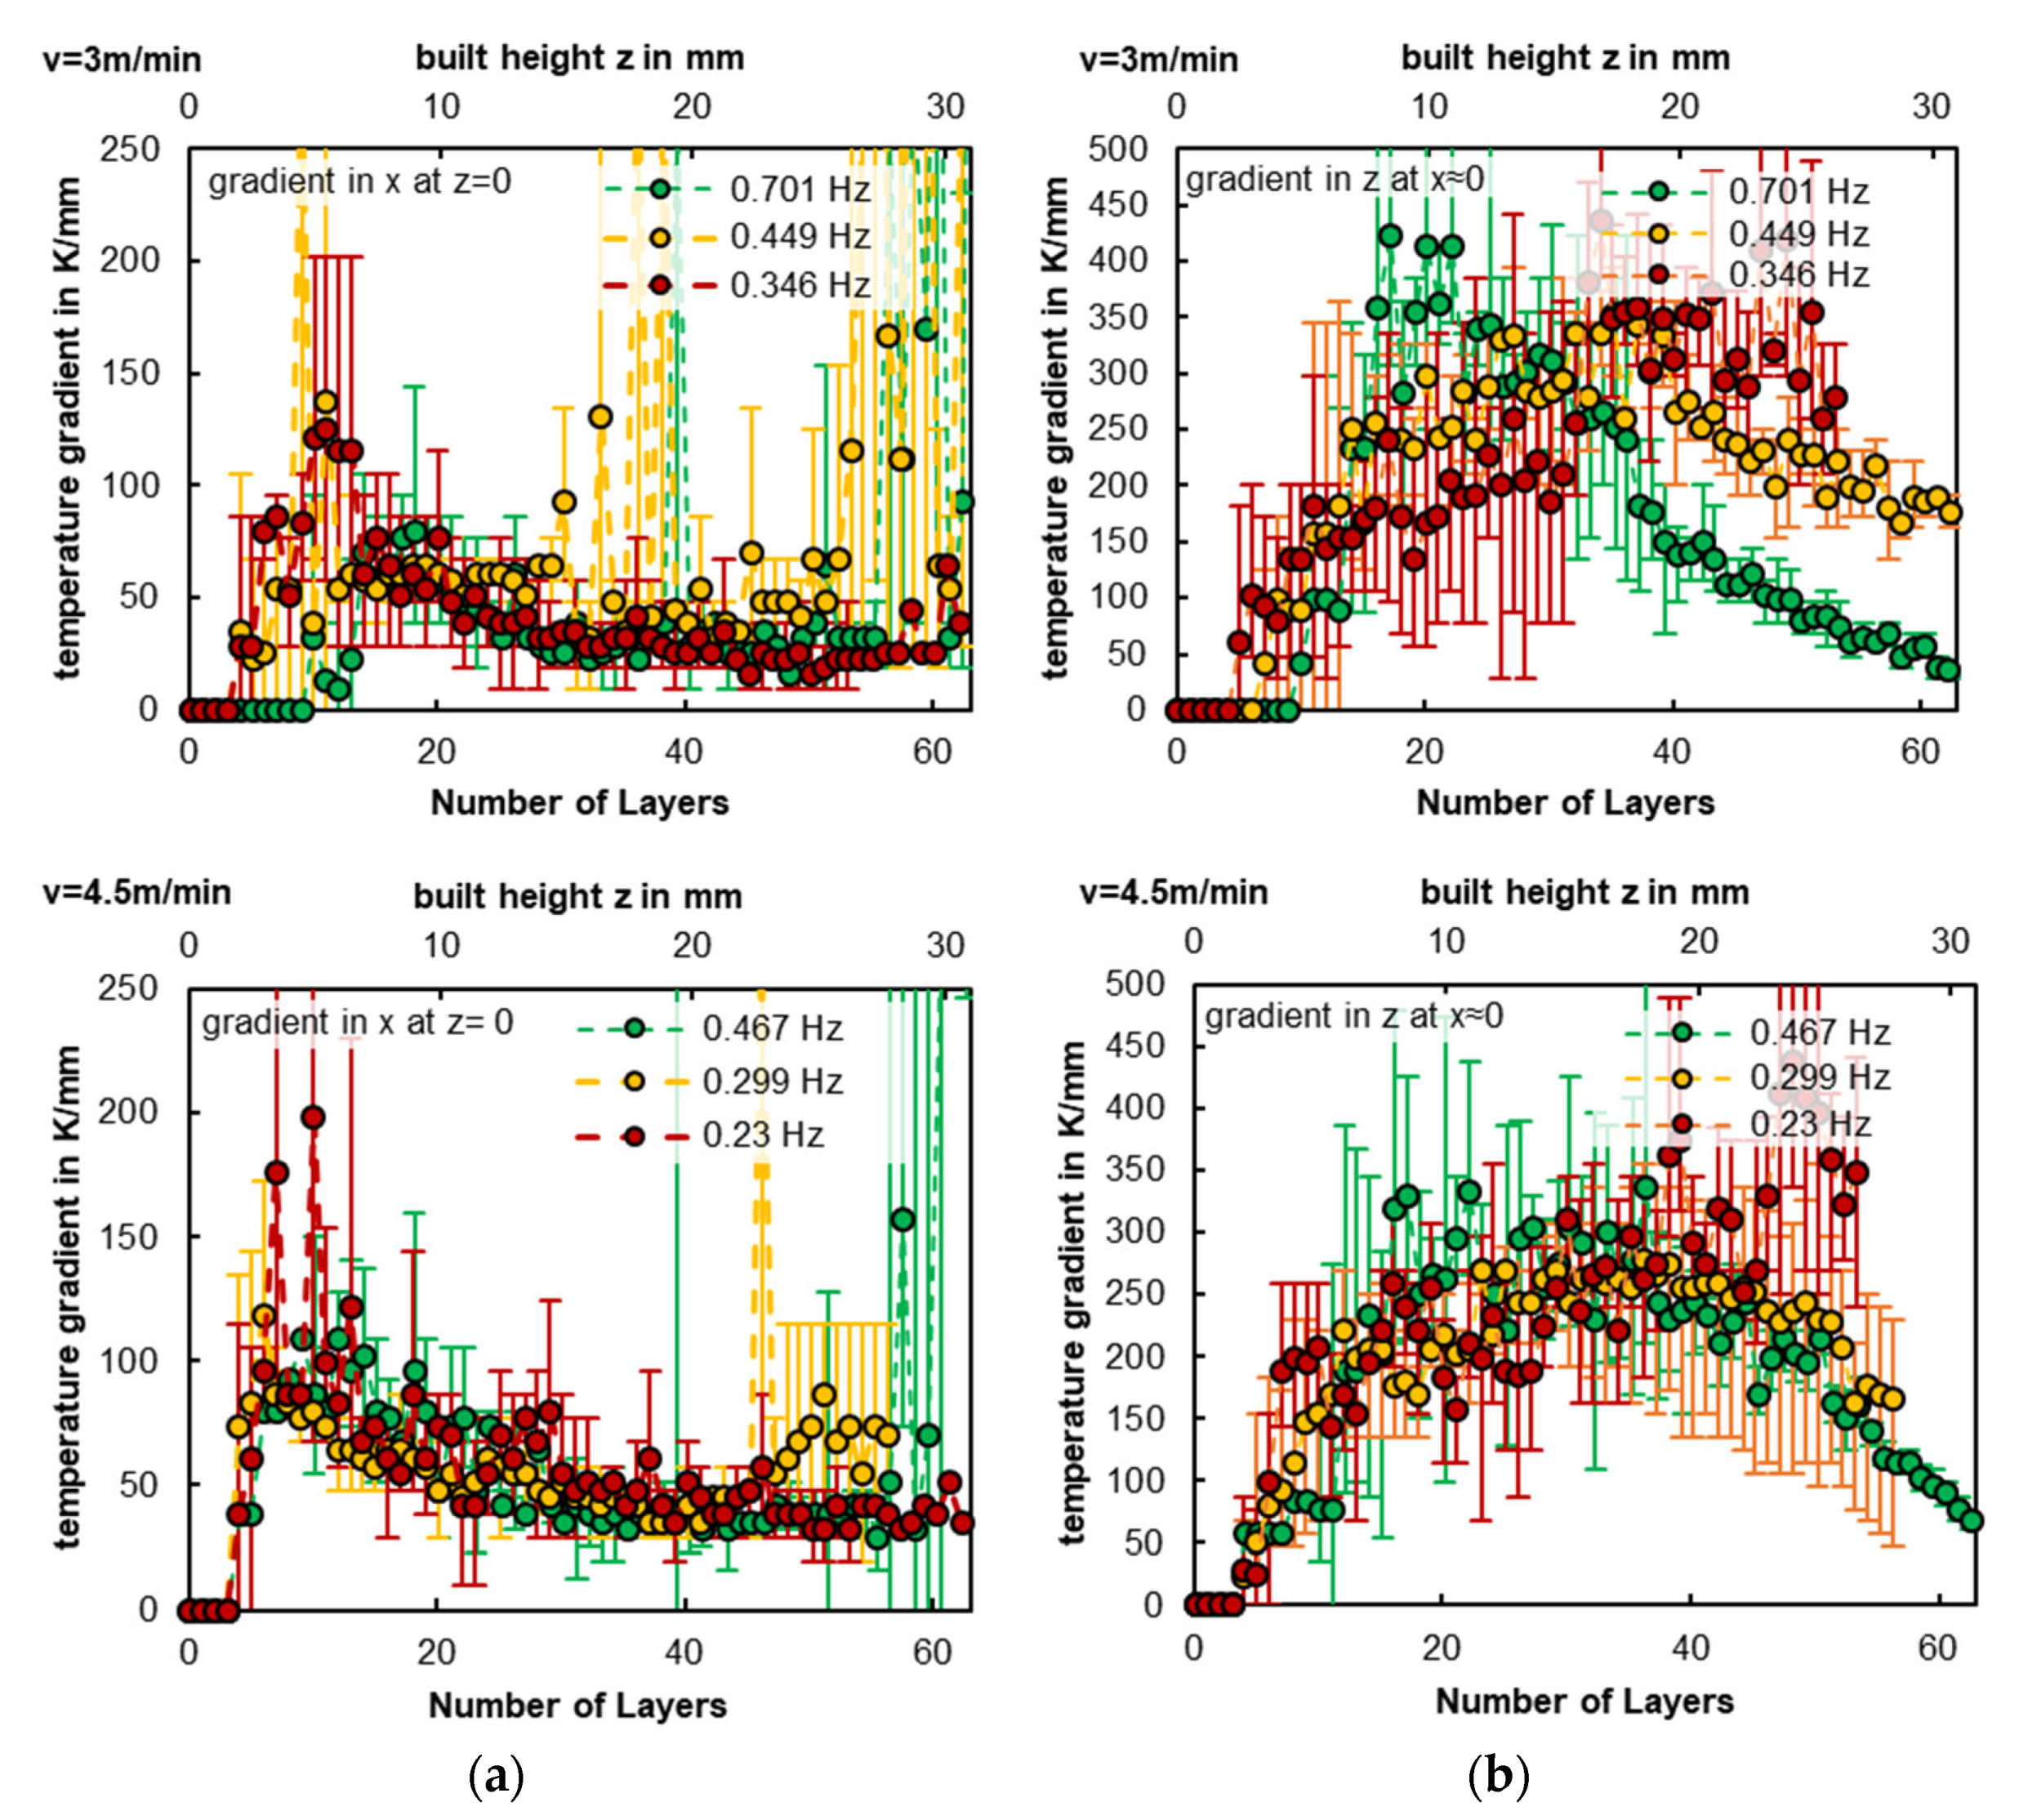
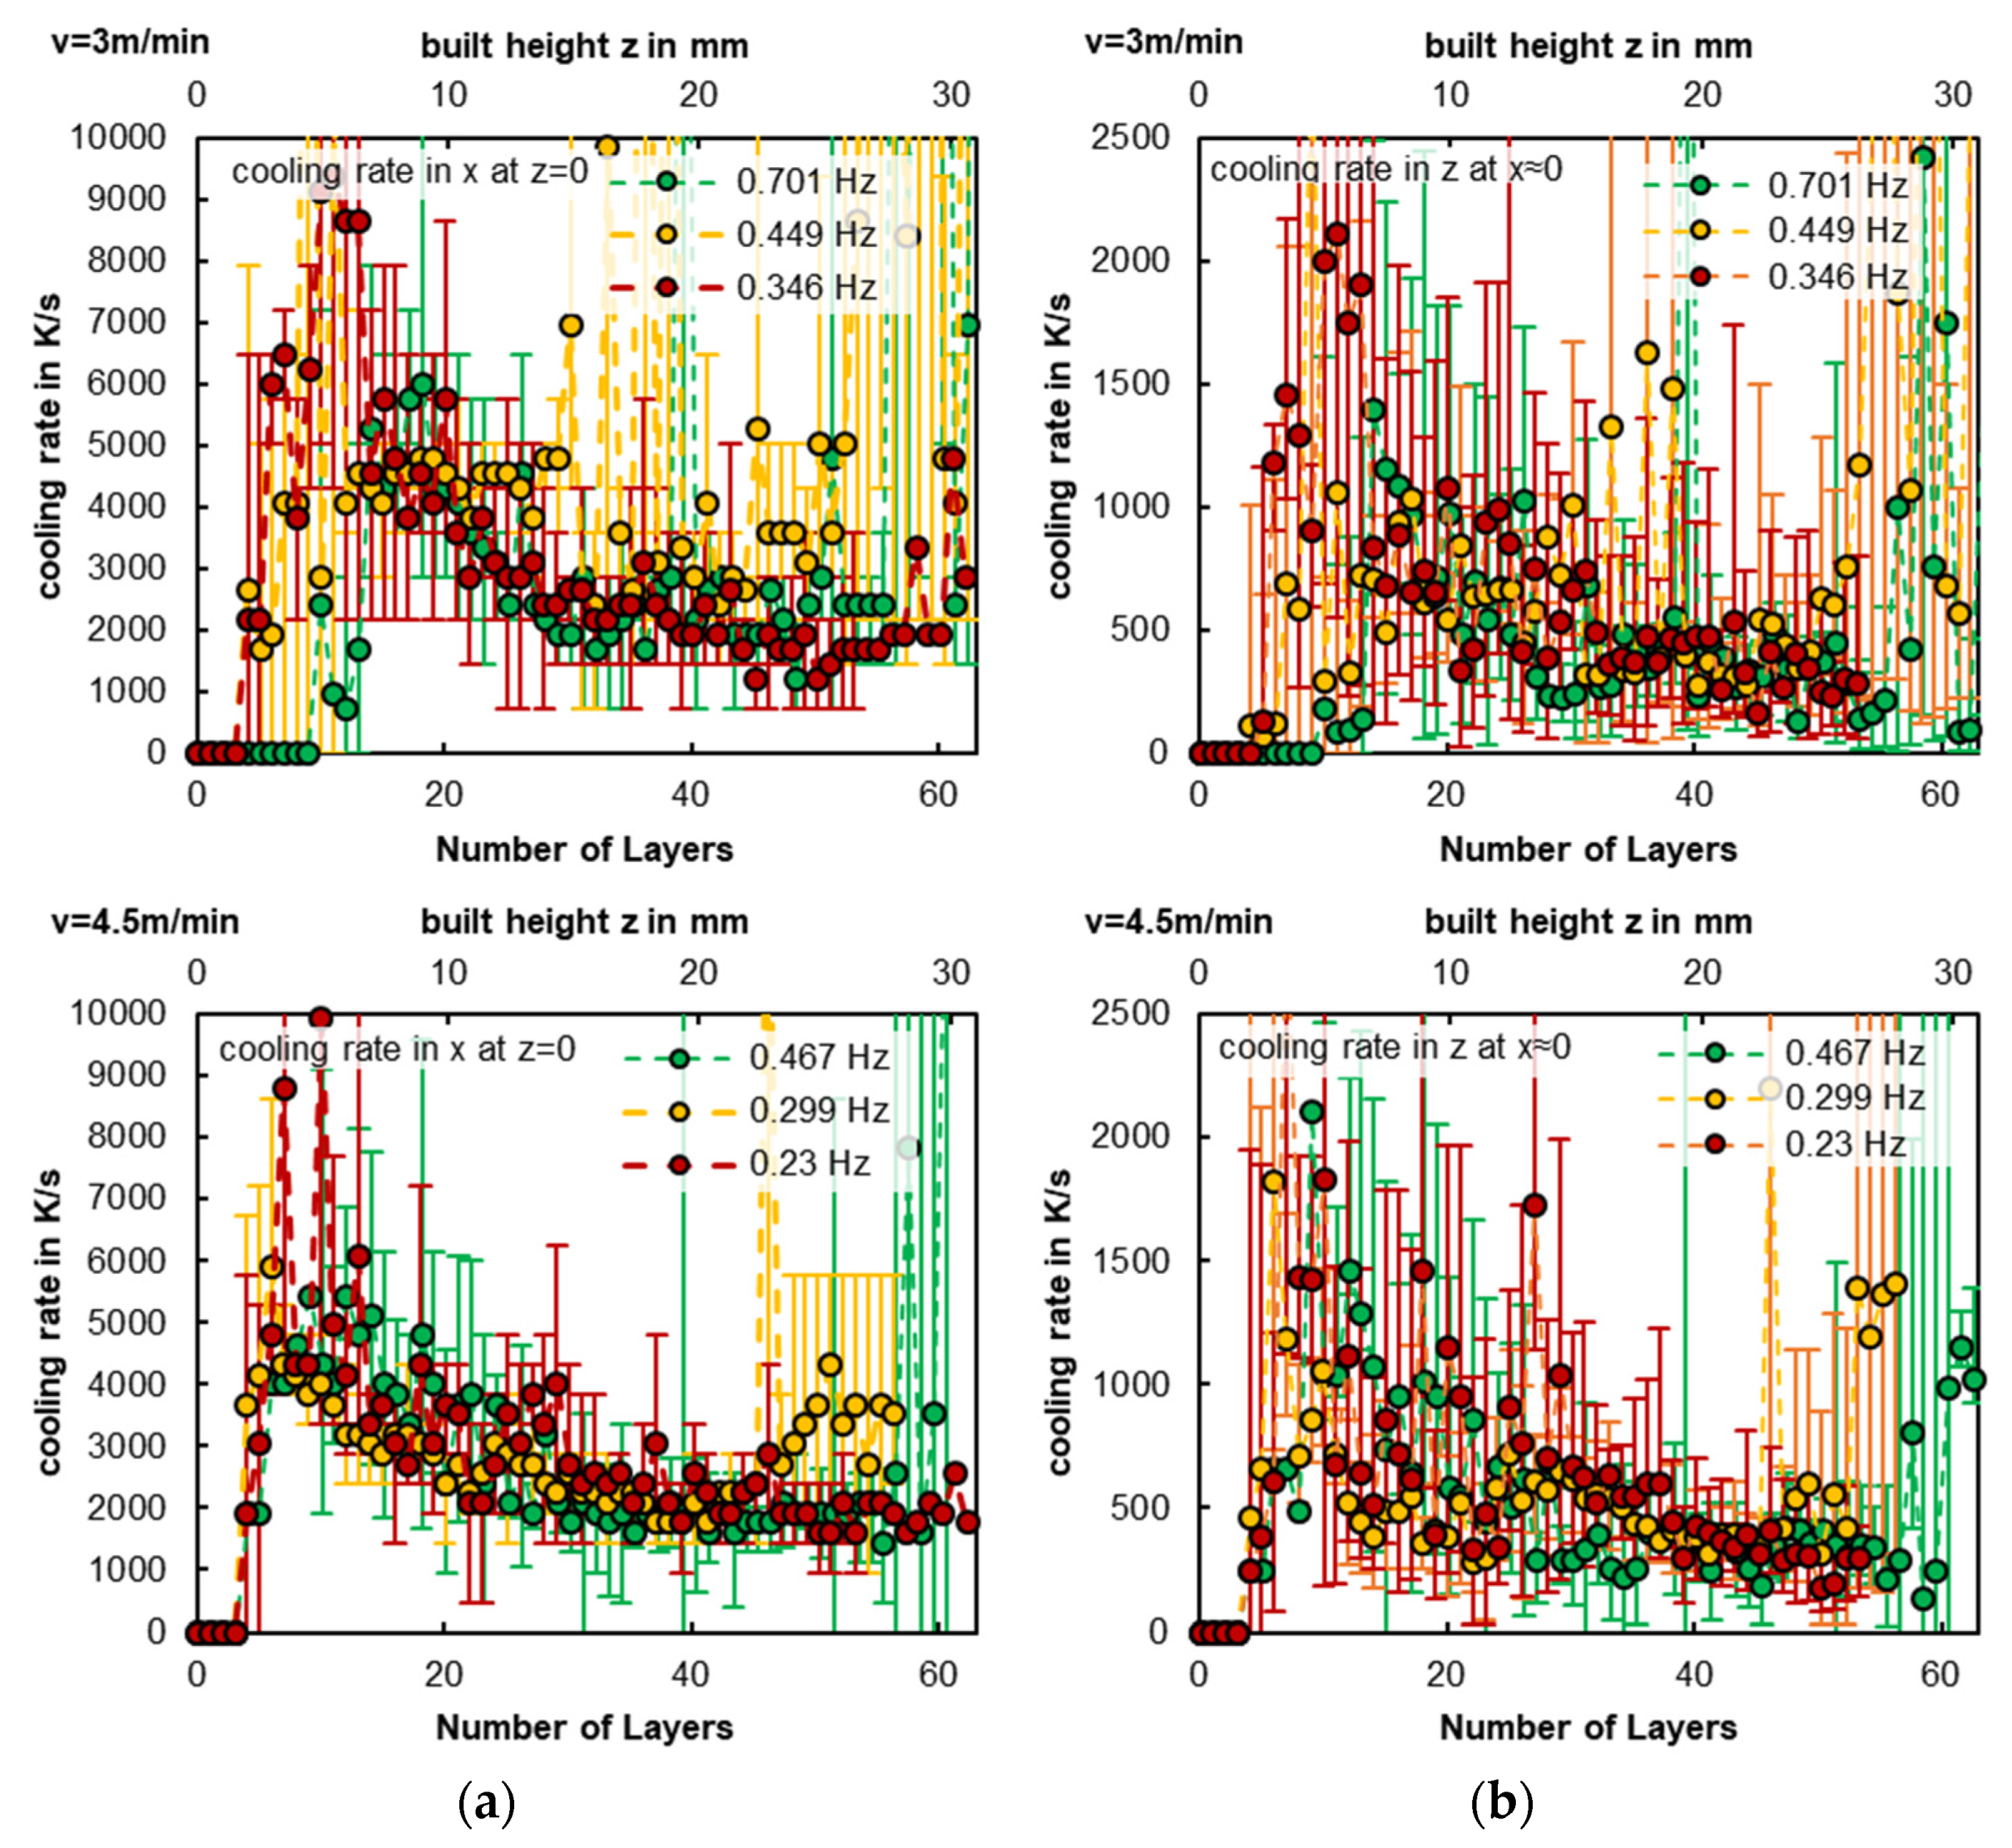
3.2. Temporal Evolution of Solidification Conditions
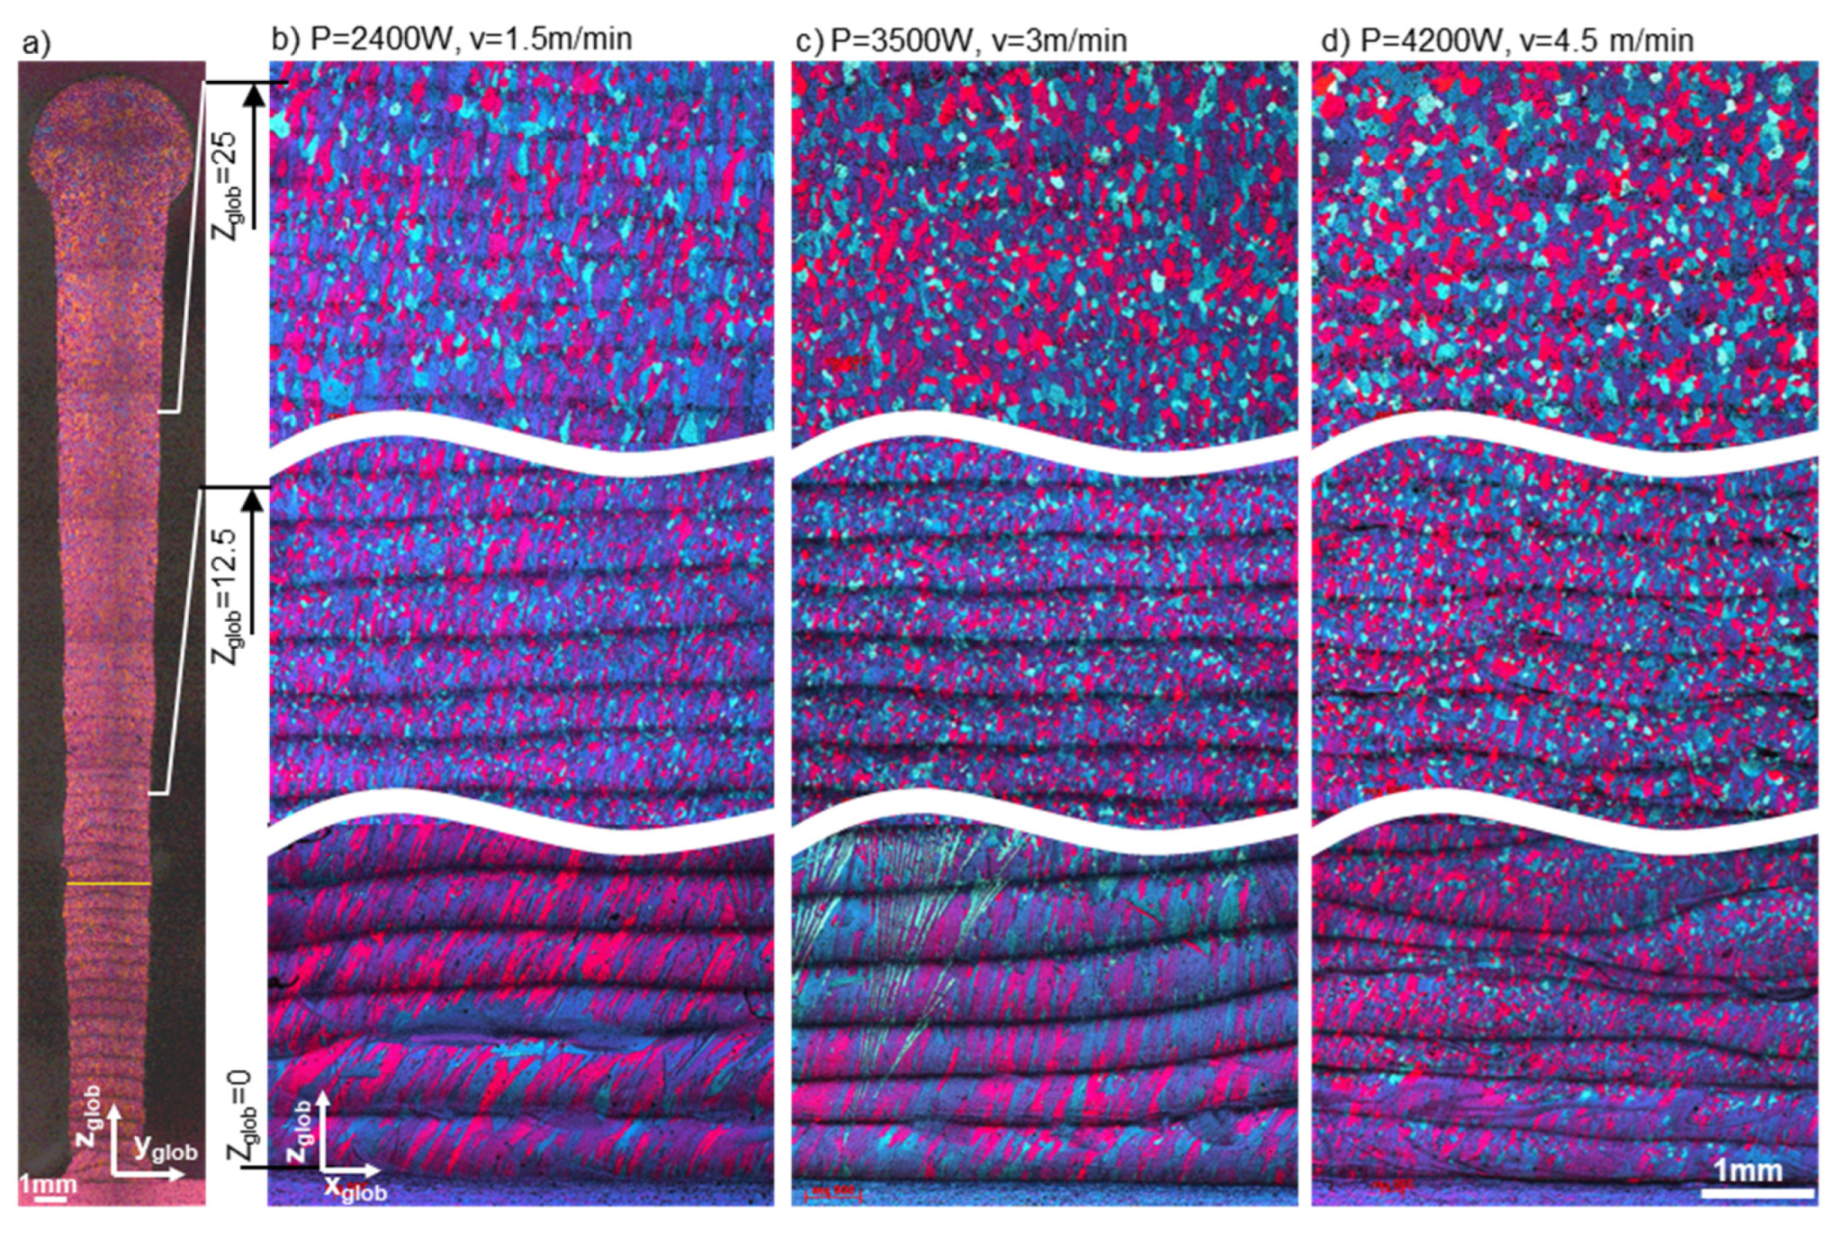
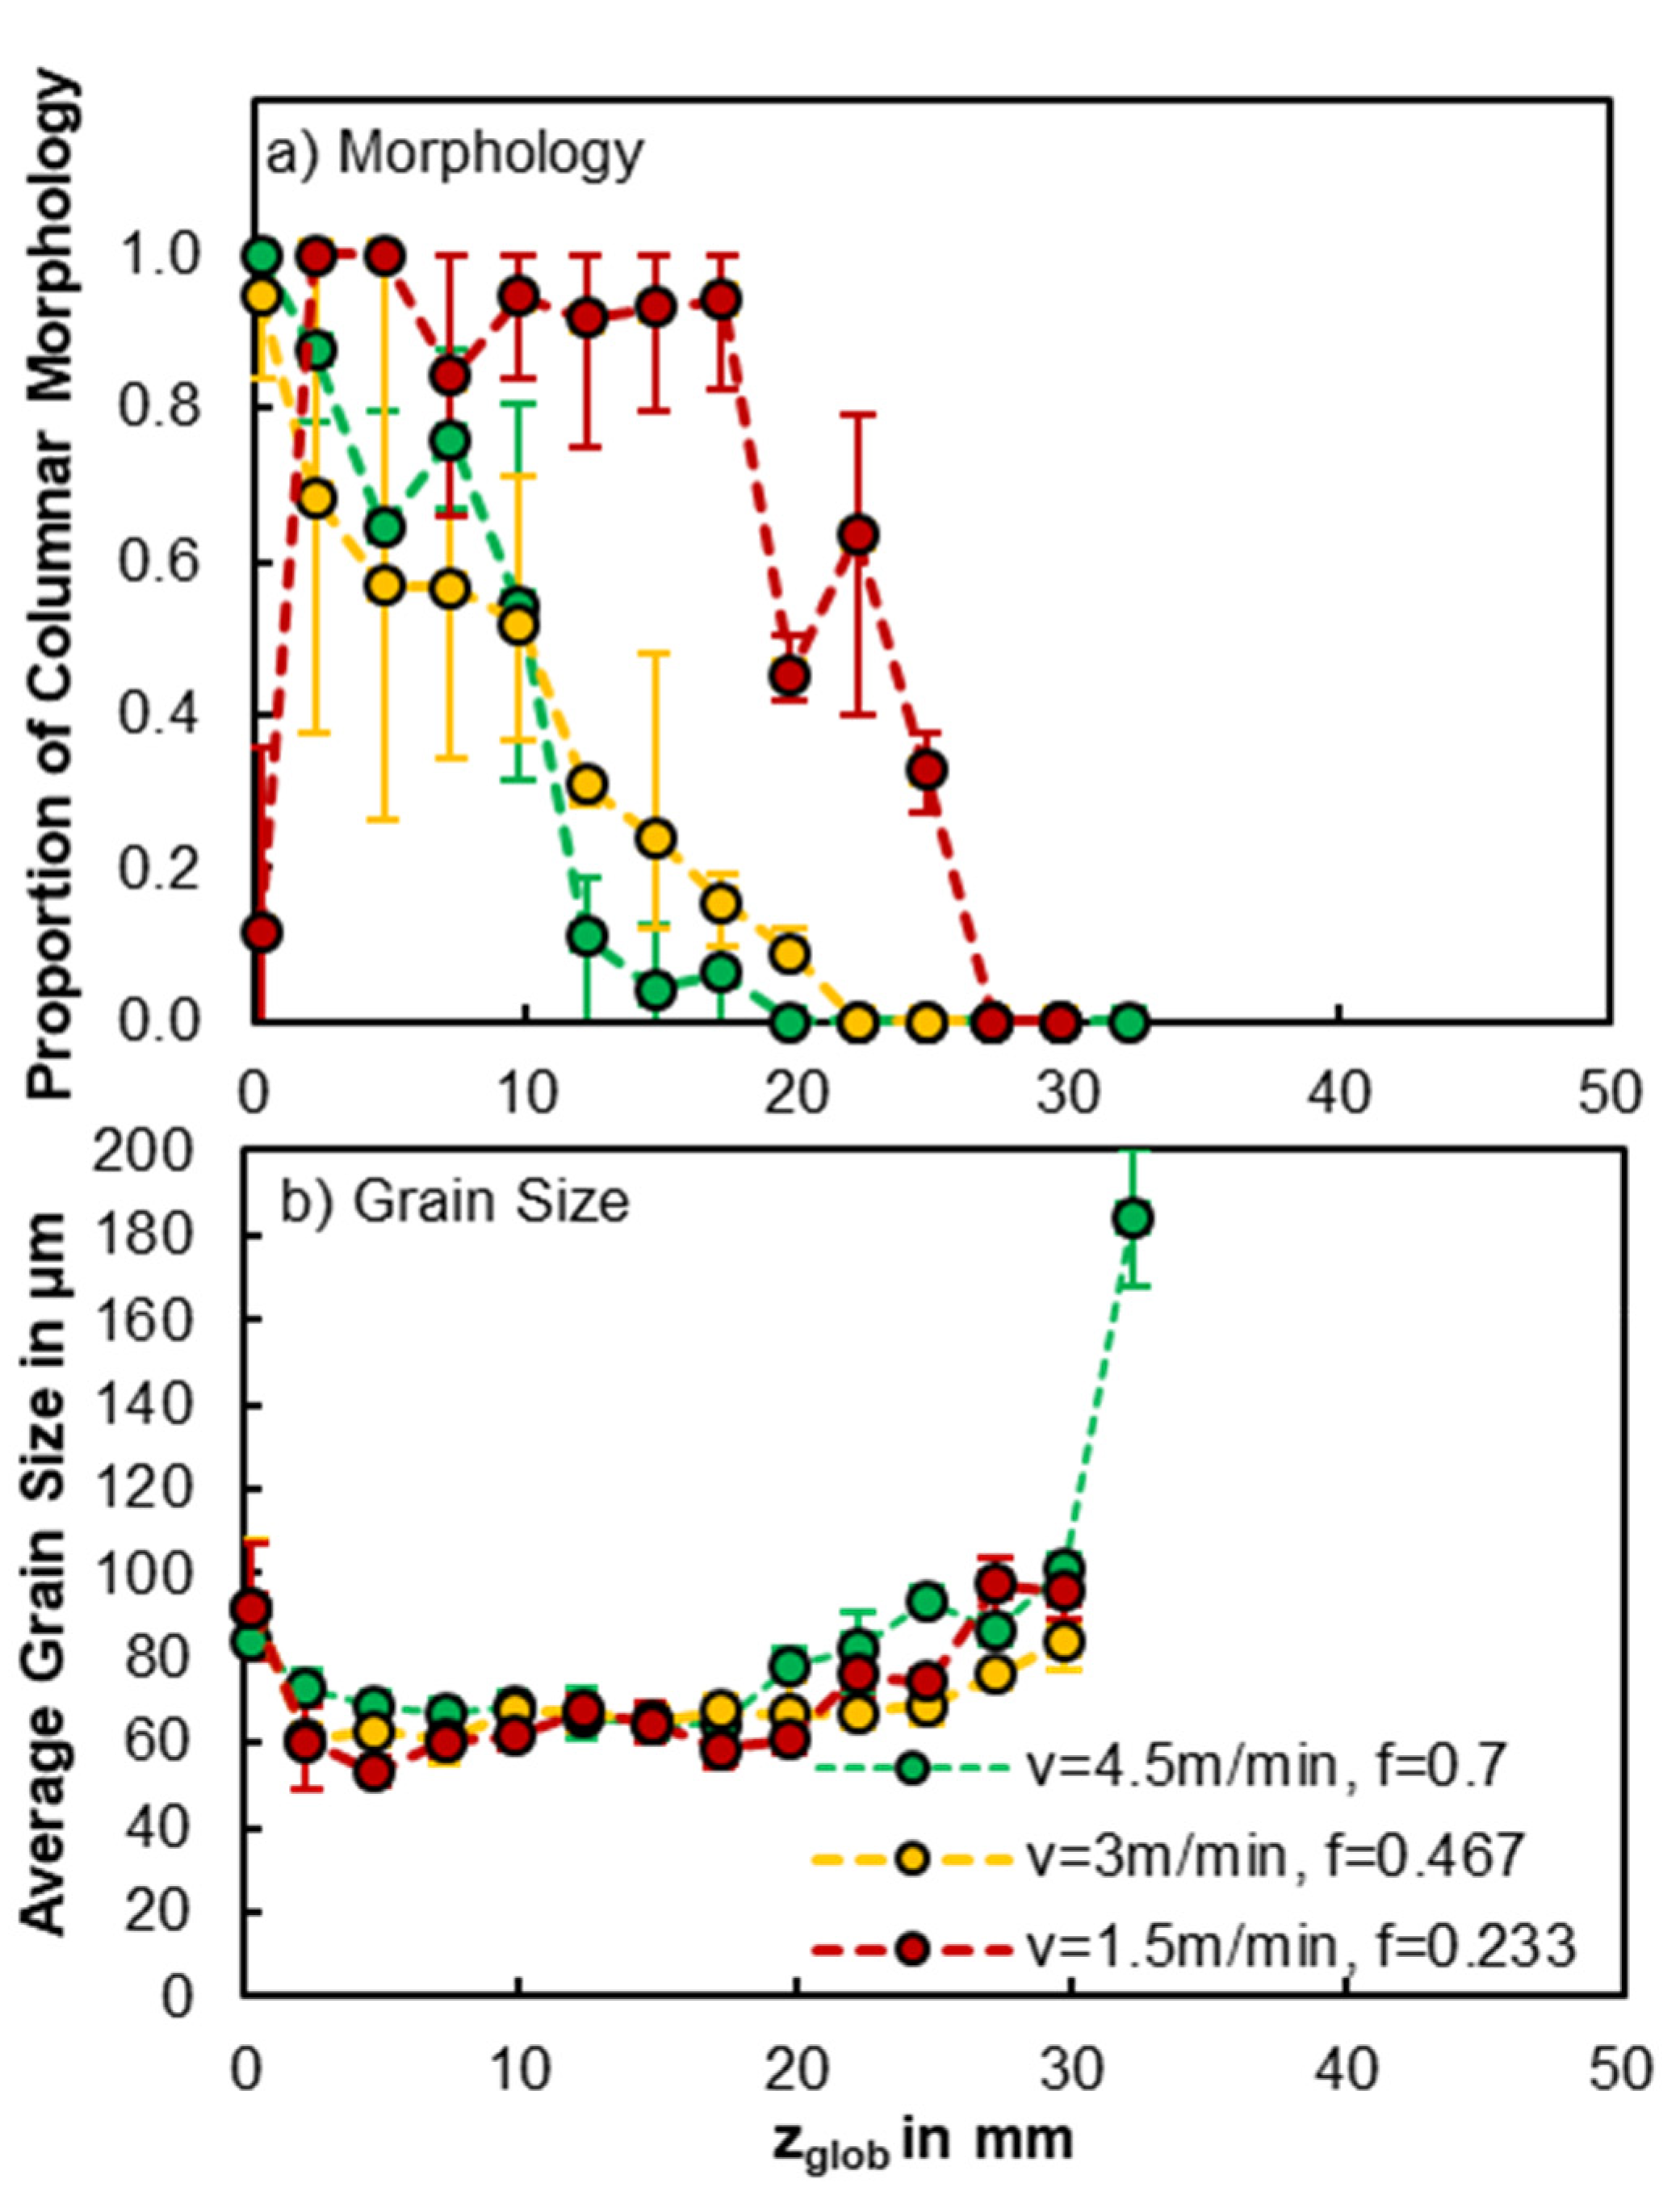
3.3. Change in Grain Structure
4. Discussion
5. Conclusions
Supplementary Materials
Author Contributions
Funding
Data Availability Statement
Conflicts of Interest
Appendix A


References
- Fujita, H.; Tabata, T. The effect of grain size and deformation sub-structure on mechanical properties of polycrystalline aluminum. Acta Metall. 1973, 21, 355–365. [Google Scholar] [CrossRef]
- Wyrzykowski, J.W.; Grabski, M.W. The Hall-Petch relation in aluminium and its dependence on the grain boundary structure. Philos. Mag. A 1986, 53, 505–520. [Google Scholar] [CrossRef]
- Kempf, A.; Hilgenberg, K. Influence of sub-cell structure on the mechanical properties of AlSi10Mg manufactured by laser powder bed fusion. Mater. Sci. Eng. A 2020, 776, 138976. [Google Scholar] [CrossRef]
- Froend, M.; Ventzke, V.; Dorn, F.; Kashaev, N.; Klusemann, B.; Enz, J. Microstructure by design: An approach of grain refinement and isotropy improvement in multi-layer wire-based laser metal deposition. Mater. Sci. Eng. A 2020, 772, 138635. [Google Scholar] [CrossRef]
- Froend, M.; Ventzke, V.; Riekehr, S.; Kashaev, N.; Klusemann, B.; Enz, J. Microstructure and microhardness of wire-based laser metal deposited AA5087 using an Ytterbium fibre laser. Mater. Charact. 2018, 143, 59–67. [Google Scholar] [CrossRef]
- Chen, R.; Wang, H.; He, B.; Tu, Y.; Tang, H. Effect of thermal cycling on microstructure and mechanical properties of 2A97 Al-Li alloy fabricated by direct laser deposition. Vacuum 2021, 190, 110299. [Google Scholar] [CrossRef]
- Thompson, S.M.; Bian, L.; Shamsaei, N.; Yadollahi, A. An overview of Direct Laser Deposition for additive manufacturing; Part I: Transport phenomena, modeling and diagnostics. Addit. Manuf. 2015, 8, 36–62. [Google Scholar] [CrossRef]
- Zhao, X.; Lv, Y.; Dong, S.; Yan, S.; He, P.; Liu, X.; Liu, Y.; Lin, T.; Xu, B. The effect of thermal cycling on direct laser-deposited gradient H13 tool steel: Microstructure evolution, nanoprecipitation behaviour, and mechanical properties. Mater. Today Commun. 2020, 25, 101390. [Google Scholar] [CrossRef]
- Yan, F.; Xiong, W.; Faierson, E.J. Grain structure control of additively manufactured metallic materials. Materials 2017, 10, 1260. [Google Scholar] [CrossRef]
- Shamsaei, N.; Yadollahi, A.; Bian, L.; Thompson, S.M. An overview of Direct Laser Deposition for additive manufacturing; Part II: Mechanical behavior, process parameter optimization and control. Addit. Manuf. 2015, 8, 12–35. [Google Scholar] [CrossRef]
- Foster, B.K.; Am Beese Keist, J.S.; McHale, E.T.; Palmer, T.A. Impact of interlayer dwell time on microstructure and mechanical properties of nickel and titanium alloys. Metall. Mater. Trans. A 2017, 48, 4411–4422. [Google Scholar] [CrossRef]
- Kou, S. Welding Metallurgy, 2nd ed.; John Wiley & Sons: Hoboken, NJ, USA, 2003. [Google Scholar]
- Hagenlocher, C.; O’Toole, P.; Xu, W.; Brandt, M.; Easton, M.A.; Molotnikov, A. In process monitoring of the thermal profile during solidification in laser directed energy deposition of aluminium. Addit. Manuf. Lett. 2022, 3, 100084. [Google Scholar] [CrossRef]
- Patel, M.N.; Qiu, D.; Wang, G.; Gibson, M.A.; Prasad, A.; StJohn, D.H.; Easton, M.A. Understanding the refinement of grains in laser surface remelted Al-Cu alloys. Scr. Mater. 2020, 178, 447–451. [Google Scholar] [CrossRef]
- Prasad, A.; Yuan, L.; Lee, P.; Patel, M.; Qiu, D.; Easton, M.; StJohn, D. Towards understanding grain nucleation under Additive Manufacturing solidification conditions. Acta Mater. 2020, 195, 392–403. [Google Scholar] [CrossRef]
- Kurz, W.; Fisher, D.J.D. Fundamentals of Solidification; Trans Tech Publications: Zurich-Durnten, Switzerland, 1986. [Google Scholar]
- Schempp, P.; Rethmeier, M. Understanding grain refinement in aluminium welding. Weld. World 2015, 59, 767–784. [Google Scholar] [CrossRef]
- Zhang, K.; Tian, X.; Bermingham, M.; Rao, J.; Jia, Q.; Zhu, Y.; Wu, X.; Cao, S.; Huang, A. Effects of boron addition on microstructures and mechanical properties of Ti-6Al-4V manufactured by direct laser deposition. Mater. Des. 2019, 184, 108191. [Google Scholar] [CrossRef]
- Zhang, H.; Zhu, H.; Nie, X.; Yin, J.; Hu, Z.; Zeng, X. Effect of Zirconium addition on crack, microstructure and mechanical behavior of selective laser melted Al-Cu-Mg alloy. Scr. Mater. 2017, 134, 6–10. [Google Scholar] [CrossRef]
- Wu, D.; Huang, Y.; Niu, F.; Ma, G.; Yan, S.; Li, C.; Ding, J. Effects of TiO2 doping on microstructure and properties of directed laser deposition alumina/aluminum titanate composites. Virtual Phys. Prototyp. 2019, 14, 371–381. [Google Scholar] [CrossRef]
- Martin, J.H.; Yahata, B.; Mayer, J.; Mone, R.; Stonkevitch, E.; Miller, J.; Mark, R.O.; Schaedler, T.; Hundley, J.; Callahan, P.; et al. Grain refinement mechanisms in additively manufactured nano-functionalized aluminum. Acta Materialia 2020, 200, 1022–1037. [Google Scholar] [CrossRef]
- Bolzoni, L.; Xia, M.; Babu, N.H. Formation of equiaxed crystal structures in directionally solidified Al-Si alloys using Nb-based heterogeneous nuclei. Sci. Rep. 2016, 6, 39554. [Google Scholar] [CrossRef] [Green Version]
- Zhang, D.; Prasad, A.; Bermingham, M.J.; Todaro, C.J.; Benoit, M.J.; Patel, M.N.; Qiu, D.; StJohn, D.H.; Qian, M.; Easton, M.A. Grain refinement of alloys in fusion-based additive manufacturing processes. Metall. Mater. Trans. A 2020, 51, 4341–4359. [Google Scholar] [CrossRef]
- Rykalin, N.N. Calculations of Thermal Processes in Welding; Mashgiz: Moscow, Russia, 1960. [Google Scholar]
- Cline, H.E.; Anthony, T.R. Heat treating and melting material with a scanning laser or electron beam. J. Appl. Phys. 1977, 48, 3895. [Google Scholar] [CrossRef]
- Hagenlocher, C.; Fetzer, F.; Weller, D.; Weber, R.; Graf, T. Explicit analytical expressions for the influence of welding parameters on the grain structure of laser beam welds in aluminium alloys. Mater. Des. 2019, 174, 107791. [Google Scholar] [CrossRef]
- Hagenlocher, C.; Seibold, M.; Weber, R.; Graf, T. Modulation of the local grain structure in laser beam welds to inhibit the propagation of centerline hot cracks. Procedia CIRP 2018, 74, 434–437. [Google Scholar] [CrossRef]
- Zhou, Y.; Chen, S.; Chen, X.; Liang, J.; Liu, C.; Wang, M. The effect of laser scanning speed on microstructural evolution during direct laser deposition 12CrNi2 alloy steel. Opt. Laser Technol. 2020, 125, 106041. [Google Scholar] [CrossRef]
- Froend, M.; Ventzke, V.; Kashaev, N.; Klusemann, B.; Enz, J. Thermal analysis of wire-based direct energy deposition of Al-Mg using different laser irradiances. Addit. Manuf. 2019, 29, 100800. [Google Scholar] [CrossRef]
- Wang, T.; Zhu, Y.Y.; Zhang, S.Q.; Tang, H.B.; Wang, H.M. Grain morphology evolution behavior of titanium alloy components during laser melting deposition additive manufacturing. J. Alloy. Compd. 2015, 632, 505–513. [Google Scholar] [CrossRef]
- Chiumenti, M.; Lin, X.; Cervera, M.; Lei, W.; Zheng, Y.; Huang, W. Numerical simulation and experimental calibration of additive manufacturing by blown powder technology. Part I: Thermal analysis. Rapid Prototyp. J. 2017, 23, 448–463. [Google Scholar] [CrossRef]
- Denlinger, E.R.; Heigel, J.C.; Michaleris, P.; Palmer, T.A. Effect of inter-layer dwell time on distortion and residual stress in additive manufacturing of titanium and nickel alloys. J. Mater. Processing Technol. 2015, 215, 123–131. [Google Scholar] [CrossRef]
- Haley, J.; Leach, C.; Jordan, B.; Dehoff, R.; Paquit, V. In-situ digital image correlation and thermal monitoring in directed energy deposition additive manufacturing. Opt. Express 2021, 29, 9927–9941. [Google Scholar] [CrossRef]
- Promoppatum, P.; Yao, S.-C.; Pistorius, P.C.; Rollett, A.D.; Coutts, P.J.; Lia, F.; Martukanitz, R. Numerical modeling and experimental validation of thermal history and microstructure for additive manufacturing of an Inconel 718 product. Prog. Addit. Manuf. 2018, 3, 15–32. [Google Scholar] [CrossRef]
- Becker, D.; Boley, S.; Eisseler, R.; Stehle, T.; Möhring, H.-C.; Onuseit, V.; Hoßfeld, M.; Graf, T. Influence of a closed-loop controlled laser metal wire deposition process of S Al 5356 on the quality of manufactured parts before and after subsequent machining. Prod. Eng. 2021, 15, 489–507. [Google Scholar] [CrossRef]
- Zhang, K.; Yu, K.; Liu, Y.; Zhao, Y. Effect of surface oxidation on emissivity properties of pure aluminum in the near infrared region. Mater. Res. Express 2017, 4, 86501. [Google Scholar] [CrossRef]
- Wen, C.-D.; Mudawar, I. Emissivity characteristics of roughened aluminum alloy surfaces and assessment of multispectral radiation thermometry (MRT) emissivity models. Int. J. Heat Mass Transf. 2004, 47, 3591–3605. [Google Scholar] [CrossRef]
- Touloukian, Y.S.; DeWitt, D.P. Thermophysical properties of matter-the tprc data series. In Thermal Radiative Properties-Metallic Elements and Alloys; Purdue University: West Lafayette, IN, USA, 1970; Volume 7. [Google Scholar]
- Hagenlocher, C.; Boley, S. Infrared Imaging of Laser Based Direct Energy Deposition of AlMg5 Wire. 2021. Available online: https://doi.org/10.18419/darus-2242 (accessed on 1 April 2021).
- Barker, L.J. Revealing the grain structure of common aluminum alloy metallographic specimens. Trans. ASM 1950, 42, 347. [Google Scholar]
- Stahl-Mikrophotographische Bestimmung der Erkennbaren Korngröße(DIN EN ISO 643: 2019, Korrigierte Fassung 2020-03): Steels—Micrographic Determination of the Apparent Grain Size (ISO 643:2019, Corrected Version 2020-03), Beuth Verlag GmbH, 2017. Available online: https://www.beuth.de/de/norm-entwurf/din-en-iso-643/276478455 (accessed on 1 April 2021).


| Process Velocity in m/min | Laser Power in W | Wire Feed Rate in m/min | Contour Width in mm | Contour Depth in mm | Total Perimeter in mm | Layer Frequency in Hz |
|---|---|---|---|---|---|---|
| 1.5 | 2400 | 2.5 | 30 | 30 | 107.124 | 0.233 |
| 3 | 3500 | 5 | 0.467 | |||
| 4.5 | 4200 | 7.5 | 0.700 | |||
| 1.5 | 2400 | 2.5 | 50 | 40 | 167.124 | 0.15 |
| 3 | 3500 | 5 | 0.299 | |||
| 4.5 | 4200 | 7.5 | 0.449 | |||
| 3 | 3500 | 5 | 70 | 45 | 217.124 | 0.230 |
| 4.5 | 4200 | 7.5 | 0.345 |
Publisher’s Note: MDPI stays neutral with regard to jurisdictional claims in published maps and institutional affiliations. |
© 2022 by the authors. Licensee MDPI, Basel, Switzerland. This article is an open access article distributed under the terms and conditions of the Creative Commons Attribution (CC BY) license (https://creativecommons.org/licenses/by/4.0/).
Share and Cite
Hagenlocher, C.; O’Toole, P.; Xu, W.; Brandt, M.; Easton, M.; Molotnikov, A. The Effect of Heat Accumulation on the Local Grain Structure in Laser-Directed Energy Deposition of Aluminium. Metals 2022, 12, 1601. https://doi.org/10.3390/met12101601
Hagenlocher C, O’Toole P, Xu W, Brandt M, Easton M, Molotnikov A. The Effect of Heat Accumulation on the Local Grain Structure in Laser-Directed Energy Deposition of Aluminium. Metals. 2022; 12(10):1601. https://doi.org/10.3390/met12101601
Chicago/Turabian StyleHagenlocher, Christian, Patrick O’Toole, Wei Xu, Milan Brandt, Mark Easton, and Andrey Molotnikov. 2022. "The Effect of Heat Accumulation on the Local Grain Structure in Laser-Directed Energy Deposition of Aluminium" Metals 12, no. 10: 1601. https://doi.org/10.3390/met12101601