Article

LPBF-Formed 2024Al Alloys: Process, Microstructure, Properties, and Thermal Cracking Behavior

1
State Key Laboratory of Manufacturing System Engineering, Xi’an Jiaotong University, Xi’an 710049, China
2
State Key Laboratory for Mechanical Behaviour of Materials, Xi’an Jiaotong University, Xi’an 710049, China
3
School of Mechanical Engineering, Xi’an University of Science and Technology, Xi’an 710054, China
4
School of Material Science and Engineering, Chang’an University, Xi’an 710064, China
*
Author to whom correspondence should be addressed.
Metals 2023, 13(2), 268; https://doi.org/10.3390/met13020268
Submission received: 12 January 2023 / Revised: 27 January 2023 / Accepted: 27 January 2023 / Published: 29 January 2023
(This article belongs to the Special Issue Additive Manufacturing of Al- and Mg-Based Light Metal Alloys)

Abstract

:
2024Al is an Al-Cu-Mg series heat-treatable aluminum alloy with high strength and excellent damage resistance. To obtain a high-performance target component of LPBF-formed 2024Al, the effect of process parameters on density, microstructure, and performance is systematically investigated and the thermal cracking phenomenon is analyzed in detail. The results reveal that the optimization of process parameters can suppress the cracks generated during the LPBF forming of 2024Al to a certain extent. When the laser energy density is 741 J/mm3, the maximum density reaches 99.77%, whereas the tensile strength and elongation reach 330 ± 7 MPa and 9 ± 0.6%, respectively. Owing to the high Cu and Mg contents in 2024Al, the transverse strain rate of columnar grains during LPBF forming is easily higher than the sum of the transverse expansion rate of grains and the liquid phase filling rate at grain boundaries, resulting in strong thermal crack sensitivity. In addition, an extremely high cooling rate (−108 K/s) and heat input during LPBF forming reduce the liquid phase filling rate at grain boundaries to further aggravate the thermal cracking tendency. The current study provides experimental guidance for the preparation of high-quality, crack-less, or even crack-free 2024Al alloys.

Graphical Abstract

1. Introduction

Aluminum (Al) alloys render unique advantages such as low density, high specific strength, high specific rigidity and good plasticity, and are widely used in aerospace, military, and other fields. The laser powder bed fusion (LPBF) process can be used to achieve the innovative design of material–structure–function integration of complex precision metal components in aerospace [1,2]. Currently, the research on LPBF-formed Al alloys is mainly focused on medium-strength Al alloys, such as the Al-Si series. When formed using LPBF technology, these Al alloys demonstrate excellent adaptability and stable formability. Though this type of Al alloys can effectively reduce the product weight, the strength and toughness do not meet the application requirements of the aerospace field.
However, high-strength Al-Cu and Al-Cu-Mg alloys exhibit a wide solidification temperature range due to the higher proportion of alloying elements, leading to severe hot cracking tendency during LPBF forming. Therefore, the preparation of high-performance Al-Cu and Al-Cu-Mg alloys using LPBF technology is a challenging task [3].
Currently, there are mainly two types of high-strength Al alloys used in LPBF, i.e., 7xxx series and 2xxx series, and the research is mainly focused on process and material optimization [4]. From the viewpoint of process, Nie et al. [5] utilized the single-pass, single-layer and bulk process optimization pathways to investigate LPBF-formed 2024Al and attained a crack-free 2024Al alloy with a density of 99.91%, which confirms the feasibility of eliminating forming hot cracks through process optimization. Zhang et al. [6] prepared a 2024Al alloy with a tensile strength of 402 MPa by optimizing the process parameters, which exceeded the casting performance. From the viewpoint of compositional design, Mair et al. [7] added CaB6 nanoparticles into the 2024Al alloy to obtain a fine equiaxed crystal structure using LPBF. After heat treatment, the tensile strength, yield, and elongation of the sample reach 391 ± 22 MPa, 348 ± 16 MPa, and 12 ± 0.6%, respectively. To solve the problem of severe thermal cracking in LPBF-formed 2024Al alloy at high scanning speeds, Tan et al. [8] successfully prepared a crack-free alloy with fine equiaxed grains by adding Ti nanoparticles into 2024Al. Though these studies have achieved relatively good compactness and performance and reduced the occurrence of thermal cracks to a certain extent, the current research does not elaborate on the formation mechanism of thermal cracks and the effect of process parameters on thermal cracks.
Herein, 2024Al was used as a research object and LPBF technology was used to study the effect of process parameters on density, defects, microstructure, and performance. The formation mechanism and sensitivity of thermal cracks, as well as the influence of process parameters on thermal cracks, are analyzed in detail to further understand the thermal cracking behavior during LPBF forming of high-strength Al alloys.

2. Experimental Section

The 2024Al powder used in this study was prepared by vacuum atomization. The chemical composition is shown in Table 1. The SEM image and particle size distribution of the powder are shown in Figure 1. The particle size ranged from 15 to 53 μ m and the average particle size was 28   μ m . The sphericity of the powder was good and only a few powder particles showed an irregular shape.
LPBF forming was carried out using the LPBF-100N2 laser printing equipment, developed by Xi’an Jiaotong University (Xi’an, China), which is equipped with a 500 W single-mode fiber laser with a wavelength of 1070 ± 10 nm. The maximum forming size was 120 mm (X) × 120 mm (Y) × 150 mm (Z), and the maximum preheating temperature was 200 °C. The forming process was carried out under the protection of argon gas and the oxygen content in the forming cavity was controlled in the range of 100 ppm. The experimental process parameters are shown in Table 2.
The size of the as-formed block sample was 10 mm × 10 mm × 10 mm, which was used for the density and microstructural characterization. The dimensions of tensile specimens were in accordance with the national standard GB/T 16865-2013, as shown in Figure 2, and the thickness was 2 mm. For each set of parameters, three blocks and three stretched components were formed. After forming, the sample was cut from the substrate using a wire cutter and the surface oxide layer was removed by mechanical grinding. An ultrasonic cleaner was used to clean for 15 min. The density of the block was measured using the Archimedes drainage method. First, the sample mass was measured in anhydrous ethanol with a purity of 99.5% and air, and the test density of the sample was obtained using the following formula [9]:
ρ t e s t = m a i r · ( ρ a l c o h o l     0.0012 ) 0.999836 · ( m a i r     m a l c o h o l ) + 0.0012
where m a i r refers to the mass of the sample in air/g; m a l c o h o l represents the sample mass in alcohol/g; 0.0012 is the Archimedean density in air/g·cm−3; and ρ refers to the sample density/g·cm−3.
Thus, the density of the block can be given as:
η = ρ t e s t ρ t h e o r y
where ρtheory is the theoretical calculated density (~2.79 g/mm3) and η is the relative density.
The block specimens were polished and etched, and the Keller reagent was used to etch for 15 s. The metallographic structure of specimens was observed using an optical metallurgical microscope (OM, Model BX53MRF, Olympus Corporation, Tokyo, Japan). SEM imaging and EBSD analysis were performed using a scanning electron microscope (SU3500, HTTACHI, Tokyo, Japan) equipped with an EBSD analyzer. A universal tensile testing machine (CMT5105, MTS, Eden Prairie, MN, USA) was used for mechanical characterization.

3. Results

3.1. Density and Defects
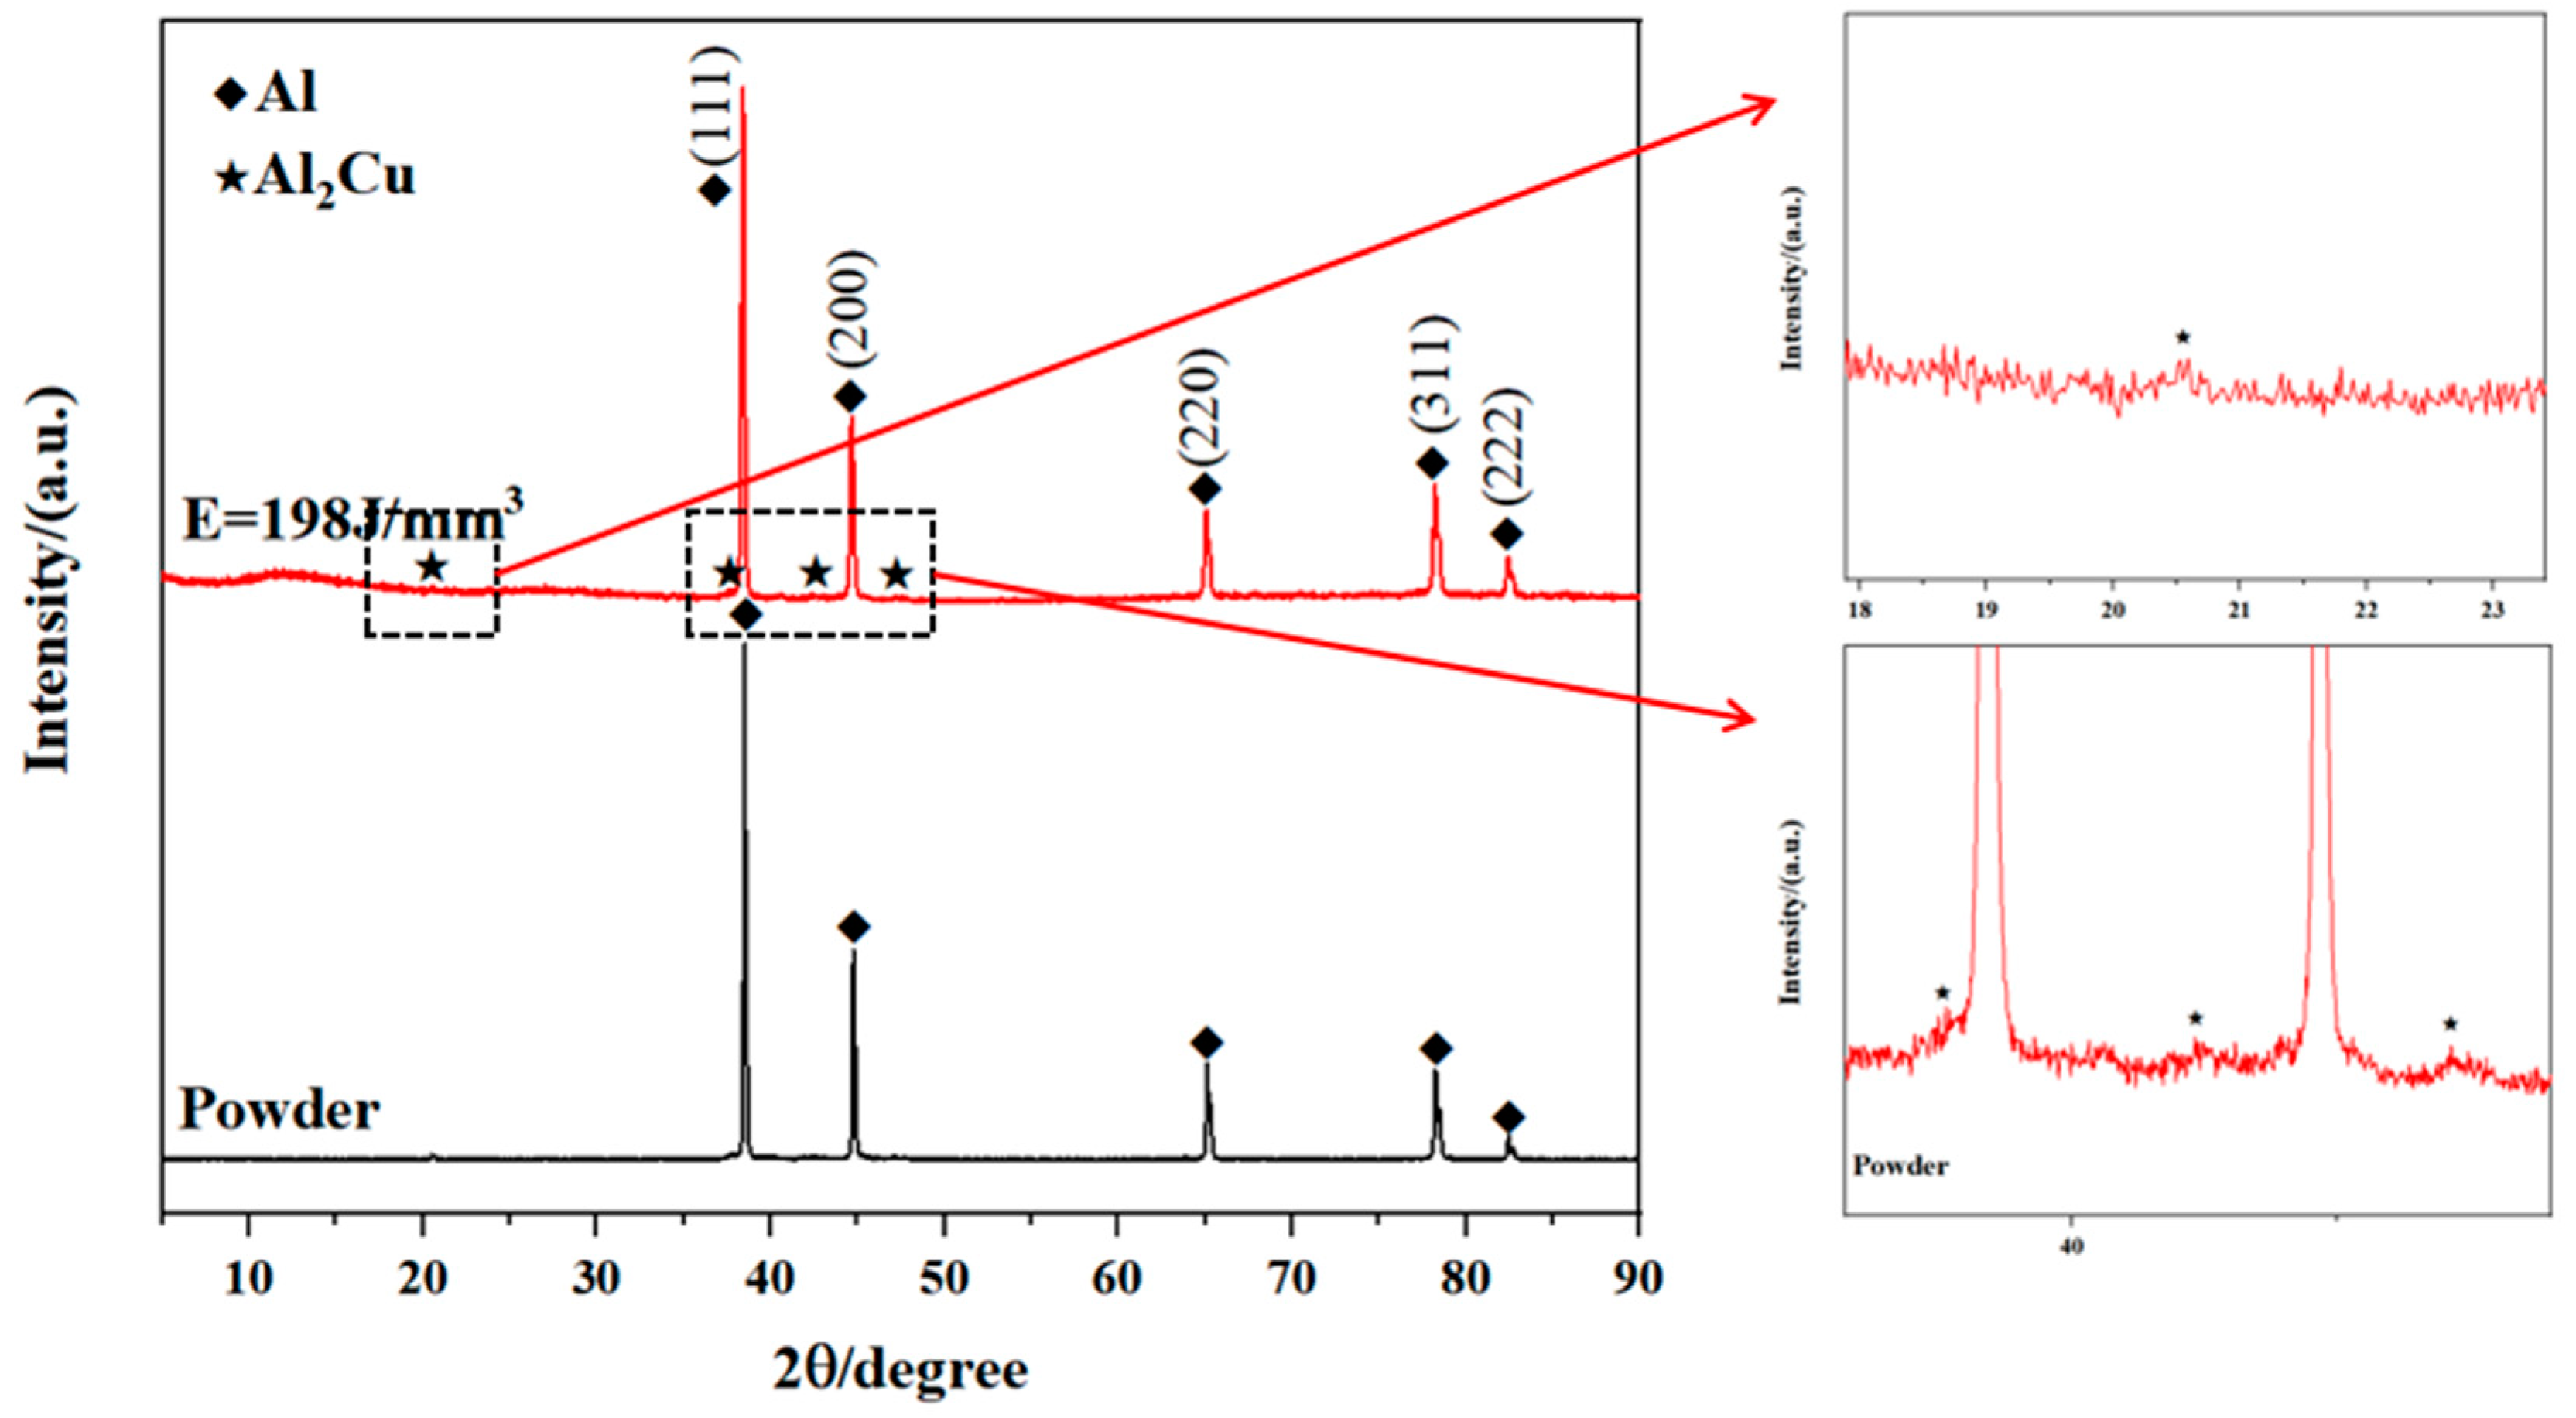
The process parameters determine the laser energy input during LPBF manufacturing and the laser volume energy density (VED) can be used to comprehensively evaluate the impact of different process parameters. The energy density of the laser volume is defined as the energy provided by the laser beam per unit of volume, as given below [10]:
E = P/hvt
where P refers to the laser power (W), v represents the scanning speed (mm/s), h denotes the scanning interval (mm), and t corresponds to layer thickness (mm).
The relationship between VED- and LPBF-processed alloy density is shown in Figure 3. It can be seen that the density of the sample initially increased with the increase in VED, followed by a gradual decrease. Combined with longitudinal cross-sectional metallographic diagrams of samples under different VEDs in Figure 4, it can be seen that the change in density is closely related to the change in defect concentration. When E ≤ 500 J/mm3, the insufficient fusion of powder and insufficient overlap between scanning channels exist due to insufficient laser energy. Hence, many cracks and unfused pore defects occur in the sample. The cracks mainly exist in the form of short cracks with a length of 20–200 μm, where the growth direction is parallel to the forming direction, which is consistent with the results of LPBF-formed 6xxx and 7xxx series Al alloys [11]. When 500 J/mm3E ≤ 950 J/mm3, the laser input energy is relatively moderate and the powder is fully melted, improving the fluidity and stability of the molten pool. The defects in the sample are also eliminated and only a small number of pores are present. At E = 741 J/mm3, the sample density reaches the highest value of 99.77%. With a further increase in VED (E ≥ 950 J/mm3), the defect concentration increases under the action of different factors, i.e., a decrease in molten pool stability and evaporation of alloying elements and water due to excessive input energy [12,13]. The defect types are mainly cracks, pores, and keyholes. The length of cracks is larger than the crack generated under insufficient VED, reading around 1000 μm, and the growth direction is still parallel to the forming direction.
Hence, under the influence of process parameters, cracks, unfused pores, pores, and keyhole defects appear in LPBF-formed 2024Al alloys. Moreover, unfused pores appear when VED is insufficient, and pores and keyholes also appear under excessive VED. Moreover, cracks appear when VED is insufficient or too large, but the number and characteristics of the cracks are different. The formation mechanism of unfused pores [14], pores [13], and keyholes [15] during LPBF forming has been discussed in previous studies, therefore, the current paper shall only focus on the formation mechanism of cracks.

3.2. Phase Analysis

Figure 5 shows the XRD patterns of the 2024Al powder and sample under E = 198 J/mm3. It can be found from the XRD pattern that the LPBF-formed alloy contains five obvious α-Al diffraction peaks, as well as Al2Cu peaks, indicating that LPBF samples contain both α-Al and Al2Cu phases. However, Al2MgCu and other phases are not detected because the Mg content is low and XRD cannot detect the phase with a low volume concentration (usually 5 vol.%). In addition, the extremely high cooling rate of LPBF increases the solid solution limit of alloying elements in α-Al and inhibits phase precipitation [6].
In addition, it can be observed that the intensity of the Al(200) diffraction peak in the LPBF-formed alloy is much stronger than the original powder, while the intensity of the Al(111) diffraction peak is lower than the original powder. This indicates that the (200) plane is the preferred orientation of α-Al during solidification, which is caused by the direction of the temperature gradient during solidification of LPBF along the forming direction. The same texture is also found in LPBF-formed AlSi10Mg [16] and Al-12Si [17] alloys.

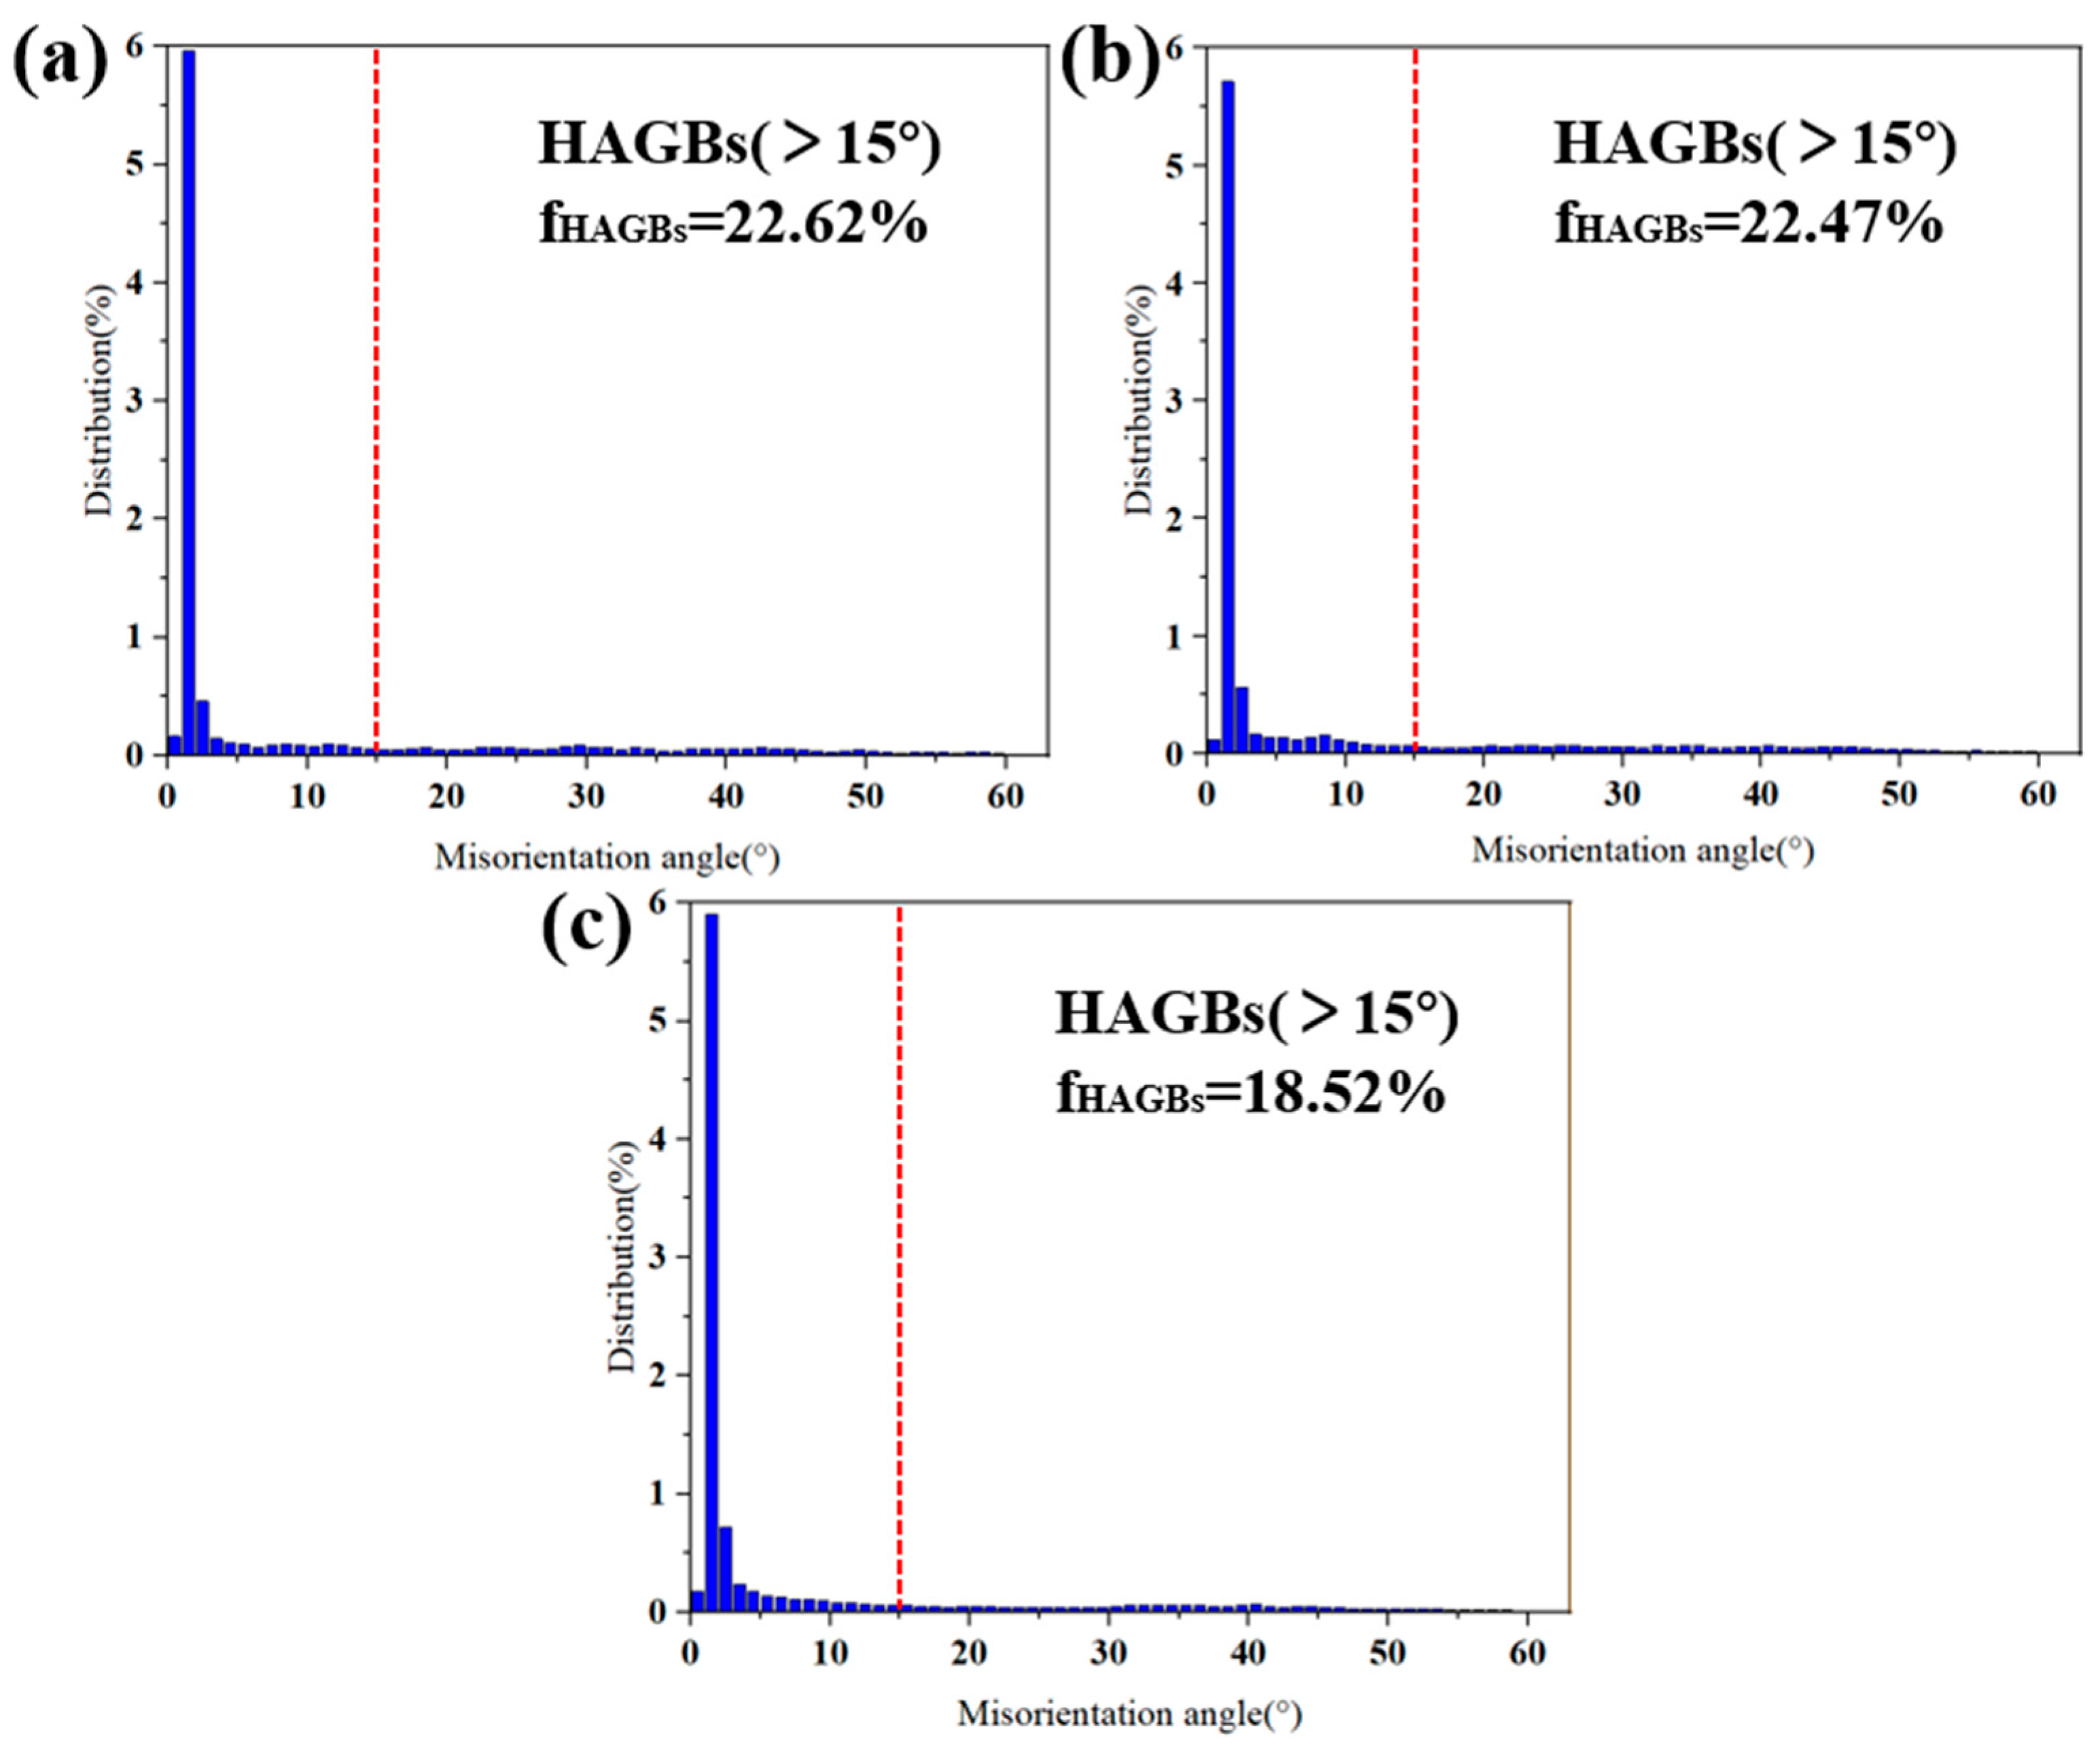
3.3. Microstructural Characterization

Figure 6 shows the SEM image of LPBF-formed alloy (E = 198 J/mm3) and corresponding EDS maps. It can be observed that there is a large amount of Cu segregation near the grain boundary and crack due to a large amount of Cu-containing compounds, as reported elsewhere [18]. This is also consistent with XRD results, indicating that Cu was pushed out to the grain boundaries during the solidification process and finally precipitated. The presence of large amounts of segregated Cu near cracks indicates that cracks are generated near the grain boundaries, as detailed in Section 4.1. As mentioned in Section 3.2, Mg segregation was not detected because the extremely high cooling rate of LPBF increases the solid solution limit of Mg in α-Al and inhibits phase precipitation [6].
Figure 7a–c present EBSD inverse pole diagrams, showing significant differences in grain orientation, morphology, and size on the longitudinal cross-section of different VED samples. The microstructure of the deposited sample is composed of columnar and equiaxed crystals, where columnar crystals constitute the main grain structure. The percentage of red-colored grains in Figure 7 is relatively high, indicating that the samples under three VED conditions possess a strong (001) texture. Moreover, the grain orientation is further analyzed in Figure 8. When VED increases from 198 J/mm3 to 741 J/mm3, the textural strength of the sample along the forming direction <001> increases from 4.06 to 5.84, respectively. When VED increases from 741 J/mm3 to 1111 J/mm3, the textural strength increases from 5.84 to 10.19. One should note that this increase is much higher than the former, indicating that the sensitivity of the sample texture is significantly increased and sample anisotropy is significantly enhanced with the increase in laser energy input.
Figure 7d shows the curves of average grain size and grain percentage of samples with a grain size of less than 5 μm. At E = 741 J/mm3, the average grain size becomes the minimum and reaches 8.369 μm, whereas the percentage of grains with a size smaller than 5 μm becomes the maximum (38.893%). This indicates that the moderate energy input is not only conducive to eliminating defects in the sample but also conducive to grain refinement.
The grain boundary angle of grains is also an important feature of a material’s microstructure [19]. In general, the grain boundaries with an angle of less than 15° are called small-angle grain boundaries (LAGBs), whereas the grain boundaries with an angle of greater than 15° are called high-angle grain boundaries (HAGBs). As shown in Figure 9, the as-deposited samples with different VEDs are all dominated by small-angle grain boundaries. When the VED is in small and moderate states, the relative fractions of both high-angle and low-angle grain boundaries are almost similar but, with the further increase in VED, the content of high-angle grain boundaries in the sample decreases significantly. It can be seen that the content of high-angle and small-angle grain boundaries is related to the dislocation density. The larger dislocation density corresponds to the higher content of large-angle grain boundaries [20], which decreases the ability to resist cracking.

3.4. Mechanical Characterization

Table 3 shows the mechanical properties of LPBF-formed alloys under different VEDs. At E = 198 J/mm3, the mechanical properties of the specimen were extremely poor and the tensile strength was only 60 MPa. At E = 741 J/mm3, the mechanical properties of the specimen became optimal, i.e., tensile strength was 330 ± 9 MPa, yield strength was 234 ± 6 MPa, and elongation was 9 ± 0.6%. At E = 1111 J/mm3, the performance was slightly decreased, i.e., tensile strength was 300 ± 9 MPa, yield strength was 203 ± 6 MPa, and elongation was 7 ± 0.4%.
Figure 10 shows the fracture morphology of the LPBF-formed alloys under different VEDs. At E = 198 J/mm3, there are a large number of quasi-cleavage tearing edges at the fracture surface of the sample without any dimples, indicating the occurrence of the brittle fracture mode because a large number of cracks grow along the grain boundaries. During stretching, the cracks rapidly propagate along the grain boundaries, resulting in the fracture of the LPBF-formed alloy. At E = 741 J/mm3, a small amount of quasi-cleavage tearing edges and a large number of dimples can be seen on the fracture surface, indicating the occurrence of the ductile fracture mode. Herein, the cracks were not found at the fracture site and only a small number of pore defects were present. At E = 1111 J/mm3, the depth of the dimples at the fracture surface is shallower and the number is smaller than the samples processed at E = 741 J/mm3. Moreover, there are a large number of quasi-cleavage tearing edges. Therefore, it can be determined that the fracture mode is the coexistence of ductile and brittle fractures. At this energy density, a large number of pores can be found at the fracture surface. The pores are weak areas inside the material and large stress concentrations occur at the abrupt structural changes, leading to the specimen fracture.
Based on Table 3 and Figure 10, it can be seen that pores deteriorate the mechanical properties, but the degree of deterioration is much lower than cracks. Therefore, it is necessary to reduce or even eliminate the hot cracking tendency of LPBF-formed 2024Al alloys.

4. Discussion

4.1. Crack Formation Mechanism and Thermal Crack Susceptibility of LPBF-Formed 2024Al

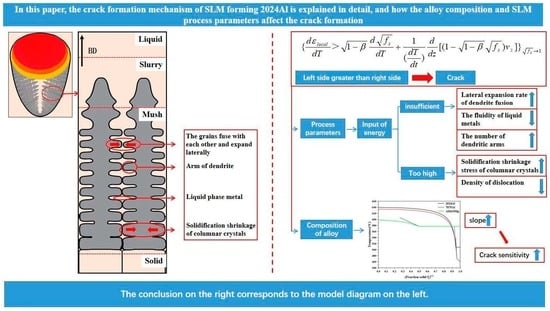
4.1.1. Crack Formation Mechanism

Figure 11 shows the KAM plots of LPBF-formed alloys under three different VEDs. The KAM strength value is closely related to the degree of damage caused by the plastic strain [21]. The highlighted area in Figure 11 indicates that the microscopic residual stress at this location is relatively large. The bright regions are concentrated in the grain boundary and crack regions, indicating that cracks are generated at the grain boundaries and closely related to the stress concentration.
Therefore, by comprehensively reviewing the literature and testing results, we can obtain the mechanism of thermal crack formation during the preparation of LPBF-formed 2024Al. Since the density of the solid phase is higher than the liquid phase, solidification shrinkage occurs during the solidification of the liquid phase. Hence, thermal cracking is caused by solidification shrinkage. According to the morphological characteristics of dendrites and the ability of liquid reflux, the solidification of the alloy can be divided into four stages, i.e., liquid phase zone, suspension zone, mushy zone, and solid phase zone. One should note that cracking usually occurs in the mushy zone. Specifically, the ductility is poor because dendrites begin to overlap and liquid phase metal is blocked by the overlapped dendrites. Moreover, the liquid metal cannot completely fill the gaps caused by the solidification shrinkage of the overlapped dendrites [22], resulting in the formation of cracks. The schematic diagram of thermal crack formation is presented in Figure 12.

4.1.2. Crack Sensitivity

The analysis in Section 4.1.1 shows the basic principle of crack formation during the LPBF forming of 2024Al. However, the crack sensitivity of the LPBF-formed 2024Al is much higher than other aluminum alloys, such as AlSi10Mg, which needs to be further analyzed. Therefore, some models are needed to describe the cracks. In the past, several models were proposed to describe solidification cracks. For instance, the well-known Rappaz–Drezet–Gremaud (RDG) model [22] considers the tensile strain and liquid phase filling, while Kou et al. [23] have proposed a different model based on the RDG model. The following equation can be obtained based on the grain boundary:
{ d ε l o c a l d T > 1 β d f s d T + 1 ( d T d t ) d d z [ ( 1 1 β f s ) v z ] } f s 1
where ε l o c a l refers to the local strain in the mushy zone, t represents the time, β denotes the solidification shrinkage, f s corresponds to the solid fraction during solidification process, T corresponds to temperature, z represents the axial direction of columnar dendrites, and v z corresponds to the filling rate of liquid phase along the grain boundaries.
The left-hand side of Equation (4) represents the transverse strain rate of the columnar dendrites, which is the driving force for crack formation. The first and second terms on the right-hand side refer to the transverse expansion rate of the grain fusion and liquid phase filling at grain boundaries, respectively, where both can promote crack closure. When the value on the left-hand side is greater than the sum of two terms on the right-hand side, a thermal crack is generated. Herein, the cooling rate (dT/dt) is related to the forming method and process parameters. The maximum value of | d T d f s | is called the crack sensitivity index [23,24], which is only related to the material composition. When the cooling rate (dT/dt) remains unchanged, too large | d T d f s | leads to fusion on the right side of the first grain and the lateral extension rate is decreased [25,26], which reduces the crack resistance of a material. In addition, an excessively large | d T d f s | expands the liquid phase channels at grain boundaries, making it difficult to fill the liquid phase and further reducing the crack resistance.
To investigate the relationship between alloy composition and | d T d f s |, the solidification process of the alloy needs to be analyzed. Figure 13a presents the T-(fs)1/2 diagram of 2024Al, 7075Al, and AlSi10Mg alloys based on the Gulliver–Scheil model [27] using the commercial thermodynamic software Thermo-calc and an Al alloy database, i.e., TCAL7. The dotted line (fs)1/2 = 0.99 represents the freezing point of the alloy when it is fully solidified. Beyond this value, the slope increases rapidly but it is not related to the solidification process. The thermal crack sensitivity index of the alloy is the absolute minimum value of the slope in the figure. It can be found that the maximum values of | d T d f s | of three kinds of alloy appear before (fs)1/2 = 0.99, and the thermal crack susceptibility of the 2024Al and 7075Al alloys is much higher than the AlSi10Mg alloy.
Figure 13b presents the solidification path diagram of the 2024Al alloy based on the Gulliver–Scheil model [27] using the commercial thermodynamics software Thermo-calc and the aluminum alloy database TCAL7. The precipitation order of solid phase during the solidification process of LPBF-formed 2024Al alloy is L → α-Al → Al2MgCu and Al2Cu. This result is mutually corroborated with the conclusions in Figure 5 and Figure 6, further indicating that Cu is squeezed out to the grain boundaries during the solidification process and eventually forms a solid phase. According to the Prokhorov thermal crack solidification theory [28], the alloying elements are pushed to the grain boundaries to form a low-melting-point eutectic film during solidification, while high content of alloying elements leads to lower ductility of the low-melting-point eutectic film, which further explains the high crack sensitivity of the 2024Al alloy.

4.2. Influence of Process Parameters on Thermal Cracking

The LPBF forming process involves several complex phenomena. Therefore, it is necessary to analyze the effect of process parameters on thermal cracks.

4.2.1. Effect of Increasing Energy Input on Thermal Cracks within a Certain Range

Figure 3 and Figure 4 show that when VED increases from too small to moderate, the sample density gradually increases and the defect content gradually decreases. The specific reasons can be analyzed from the following aspects:
(1)
The crack sensitivity analysis in Section 4.1 assumes that three alloys experienced the same cooling rate. However, according to Equation (4), changing the cooling rate (dT/dt) can also affect the relationship of the equation. Therefore, when 2024Al is formed using LPBF, though the high thermal crack sensitivity easily increases the left-hand side of Equation (4), it can be changed by reducing the cooling rate (dT/dt) to achieve the effect of eliminating thermal cracks. During LPBF forming, increasing the input laser energy density can reduce the cooling rate. Therefore, if one wants to eliminate thermal cracks, the input energy can be appropriately increased.
(2)
According to Gu et al. [29]:
μ = 16 15 m k B T λ
where m refers to the atomic mass, λ represents the surface tension of the liquid (N/m), k B denotes the Boltzmann constant, and T corresponds to the temperature of molten pool. The analysis reveals that the dynamic viscosity of liquid metal in the molten pool during LPBF forming is inversely proportional to the temperature of the molten pool. Therefore, an appropriate increase in energy input can reduce the viscosity of the liquid phase metal and improve the filling capacity.
(3)
The surface tension distribution of the molten pool is opposite to the temperature distribution. The surface tension is smallest at the center of the light spot and increases toward the edge of the molten pool, thereby forming a surface tension gradient. The surface tension gradient forms a shear force on the molten pool surface, which promotes the flow of melt from the place with low surface tension to a place with high surface tension, forming the Marangoni convection. The intensity of the Marangoni convection can be expressed by the Marangoni convection number (Ma) [30]:
Ma = d σ d T l 0 Δ T μ ε T
where l0 refers to the characteristic length of molten pool, ε T represents thermal diffusivity, and Δ T denotes the temperature gradient. The temperature gradient ( Δ T ) and surface tension gradient ( d σ / d T ) can be increased by increasing the energy input appropriately, enhancing the Marangoni convection. At this time, the fluidity of the liquid phase metal in the molten pool is enhanced and the metallurgical bonding between adjacent layers becomes sufficient. Hence, the filling capacity of the liquid phase metal is also enhanced.
(4)
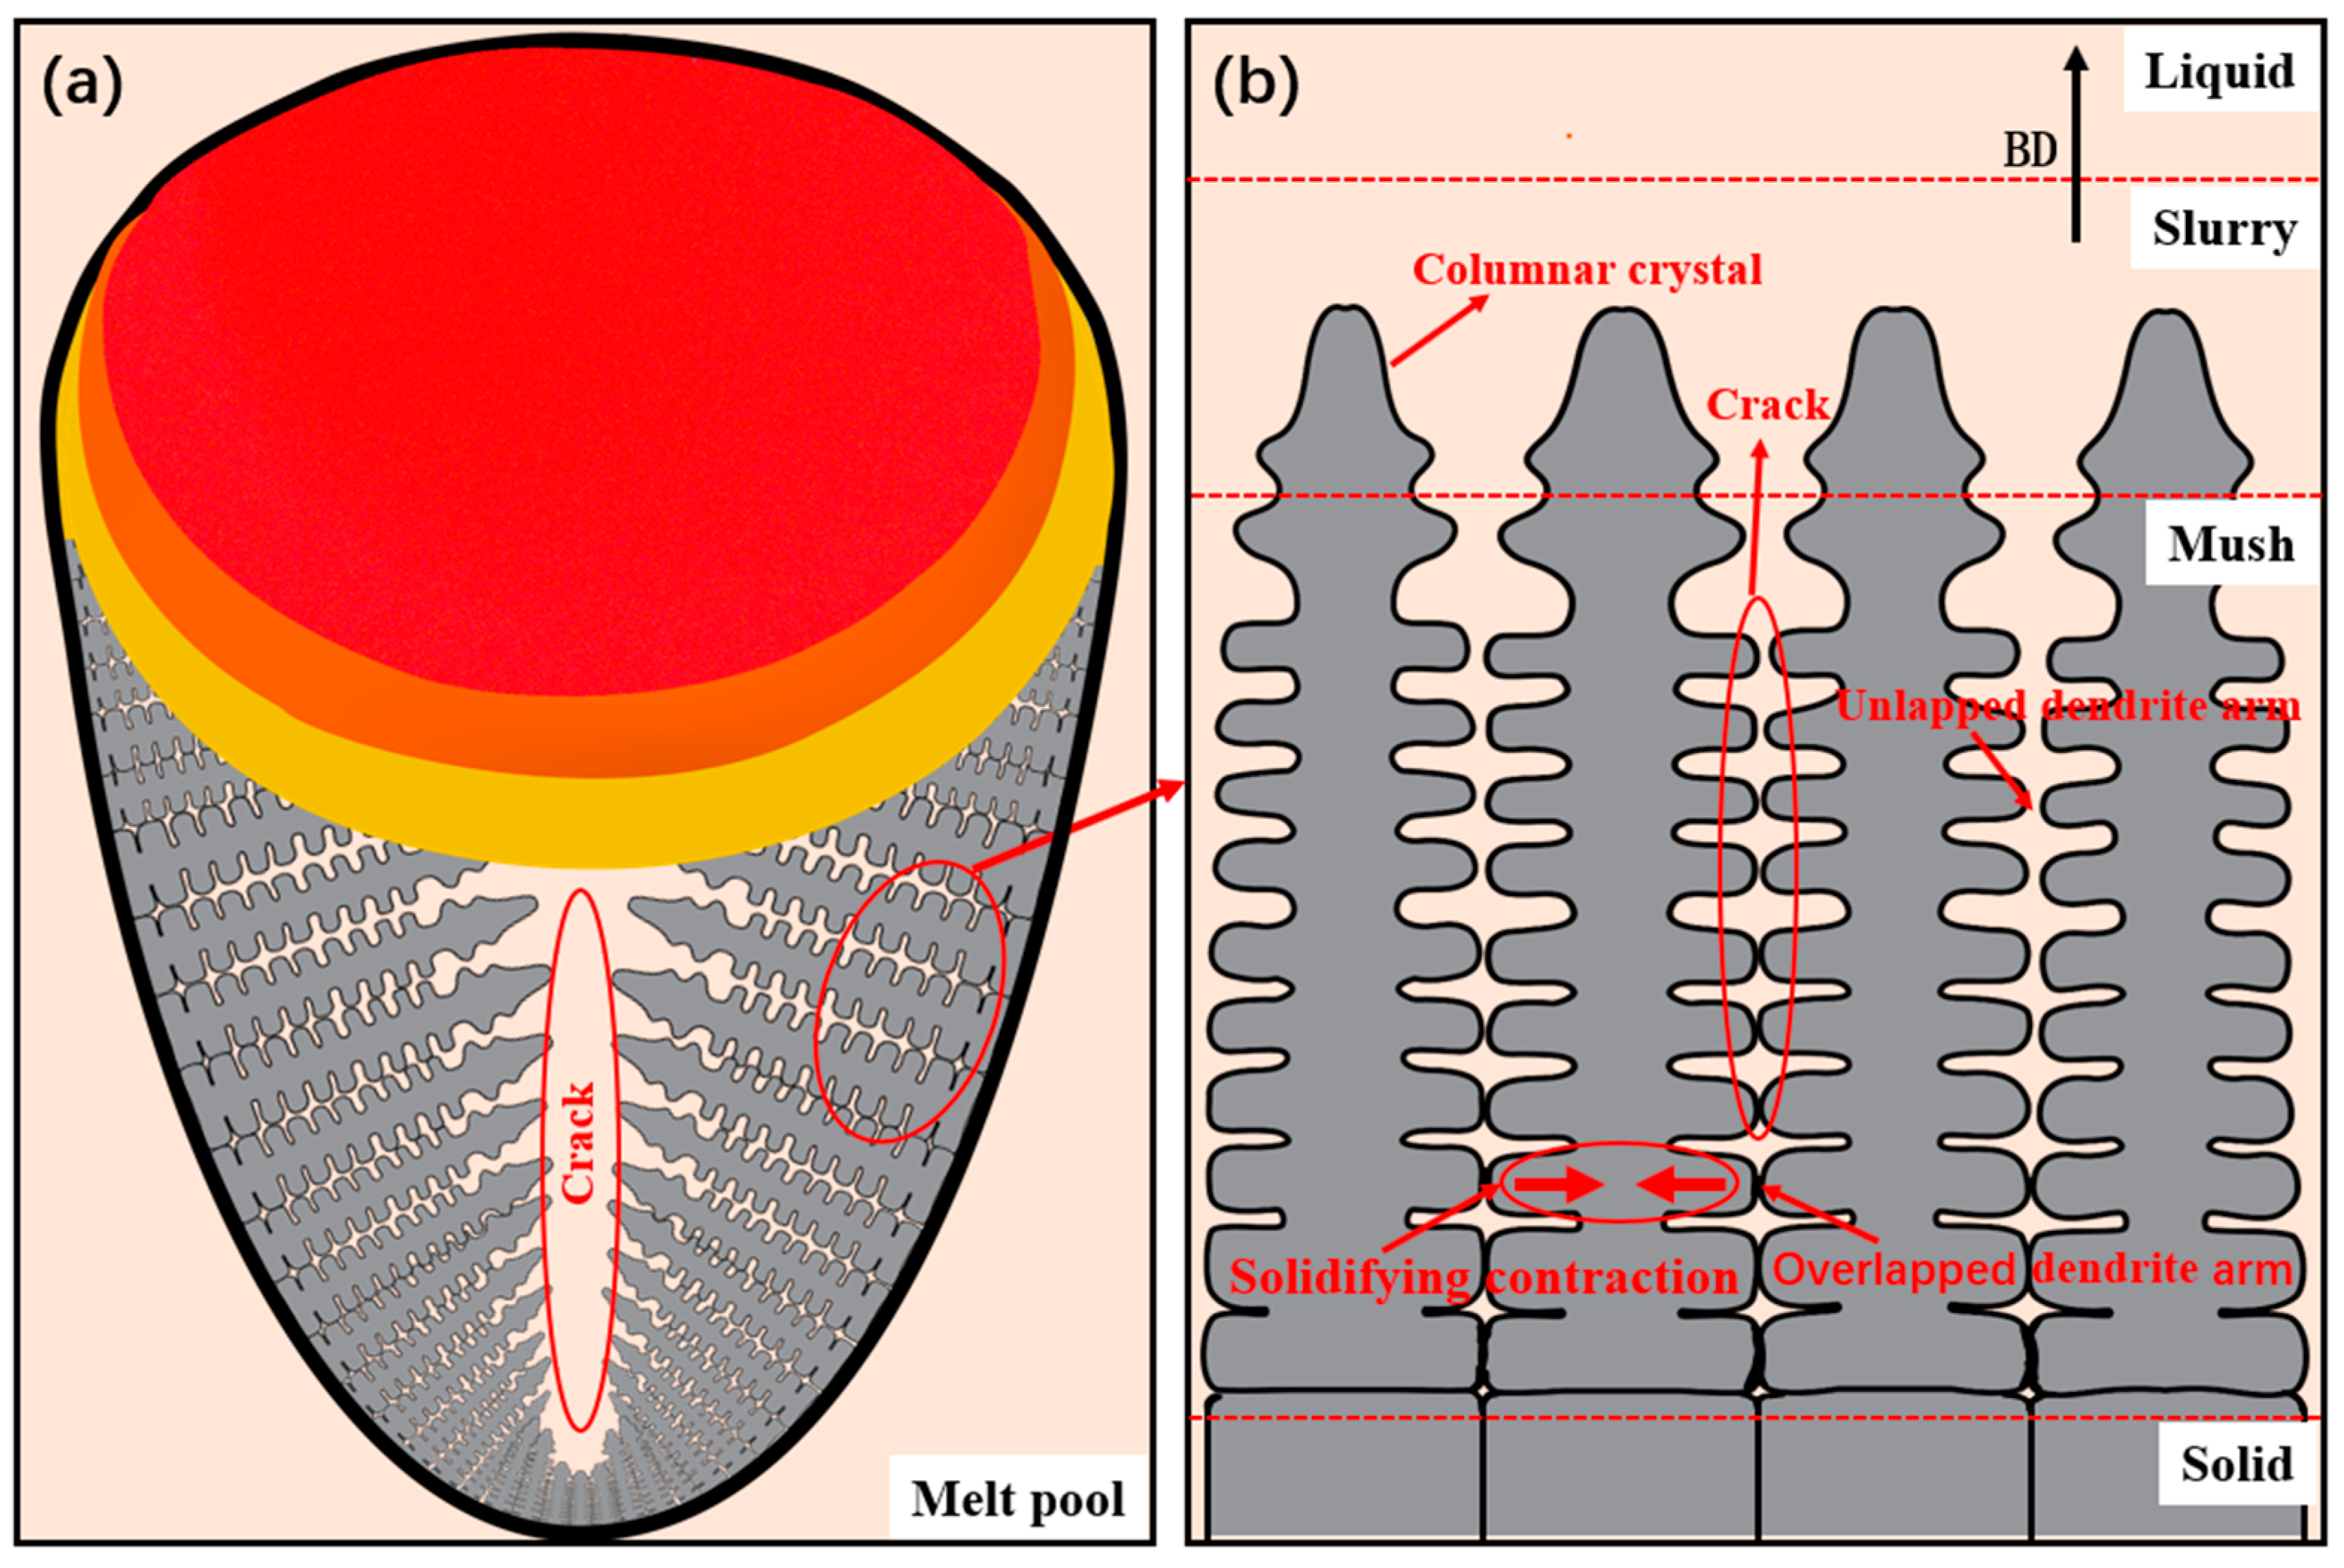
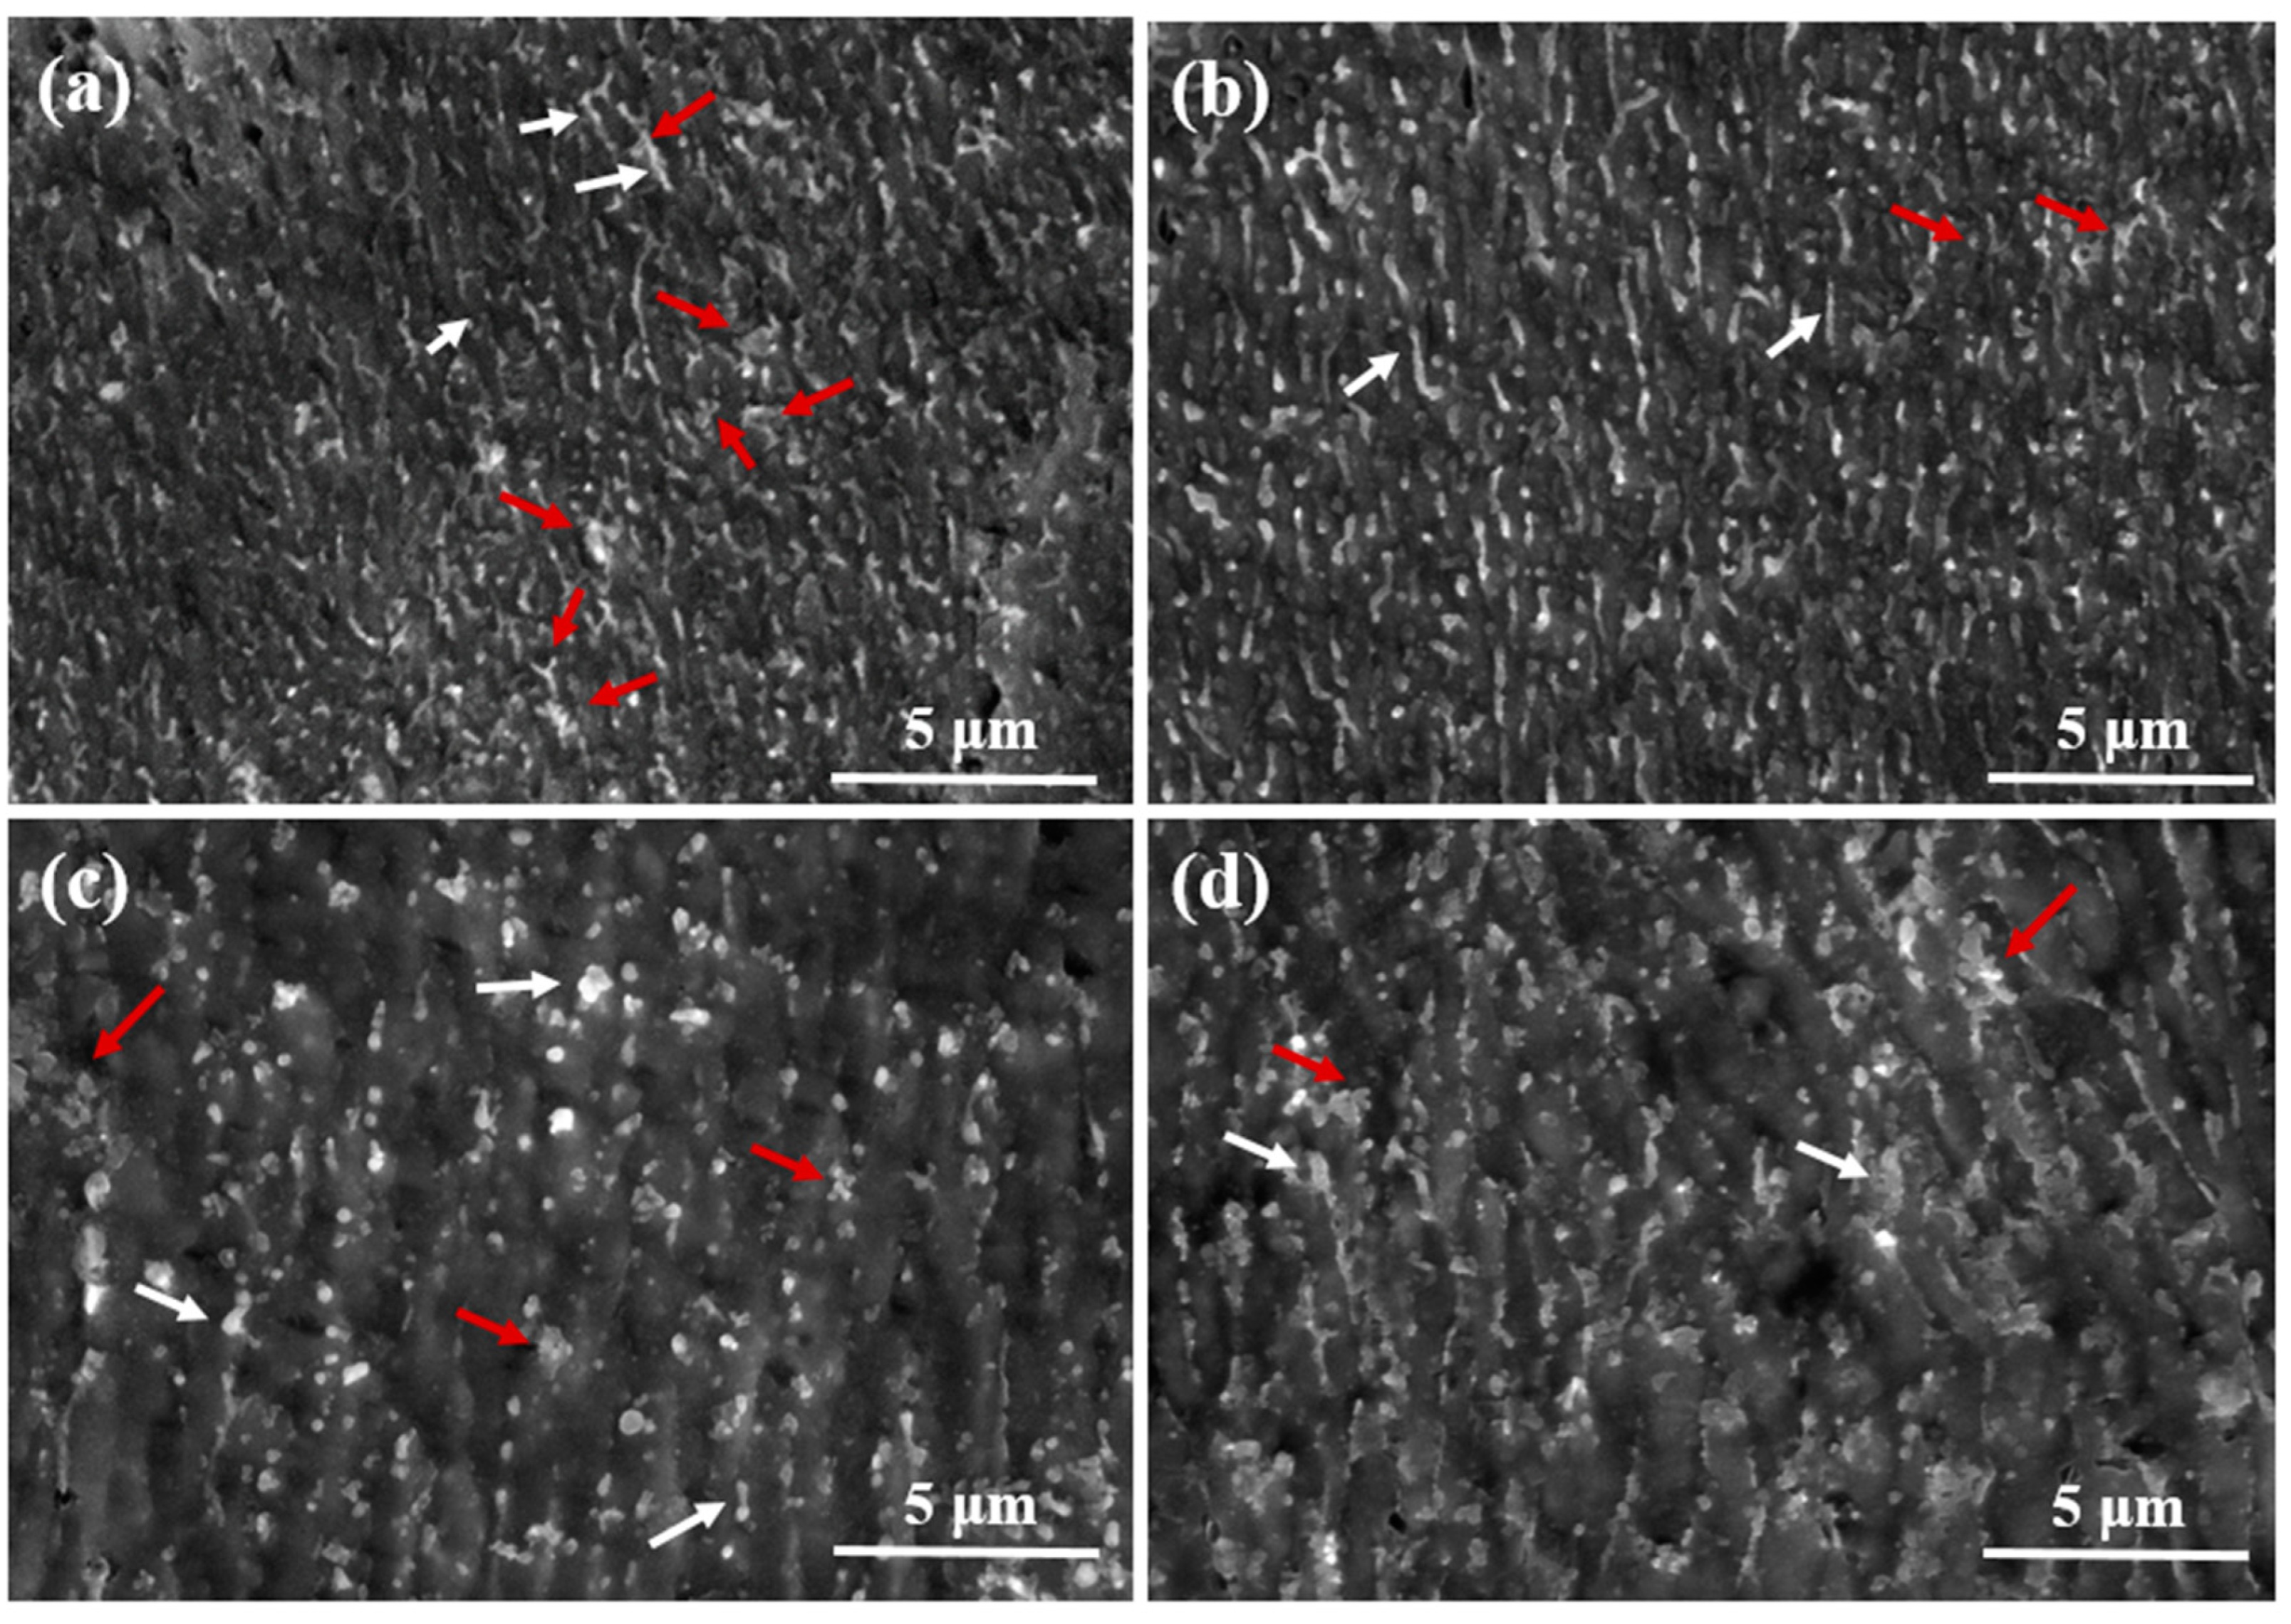
Figure 14 shows SEM images of primary and secondary dendrites at the boundary of the molten pool. With the increase in VED, the number of primary and secondary dendrites in the sample decreases. It can be seen from the crack formation mechanism diagram in Figure 12 that the reduction in the number of primary and secondary dendrites can reduce the number of overlapping dendrites in the mushy zone and reduce the difficulty of filling the liquid metal.

4.2.2. Effect of Excessive Energy Input on Thermal Cracks

Figure 4 shows that when the energy input is too large, the number and length of cracks are different from those when the energy is small, and the effect of energy input on the cracks is also different, which can be summarized as:
(1)
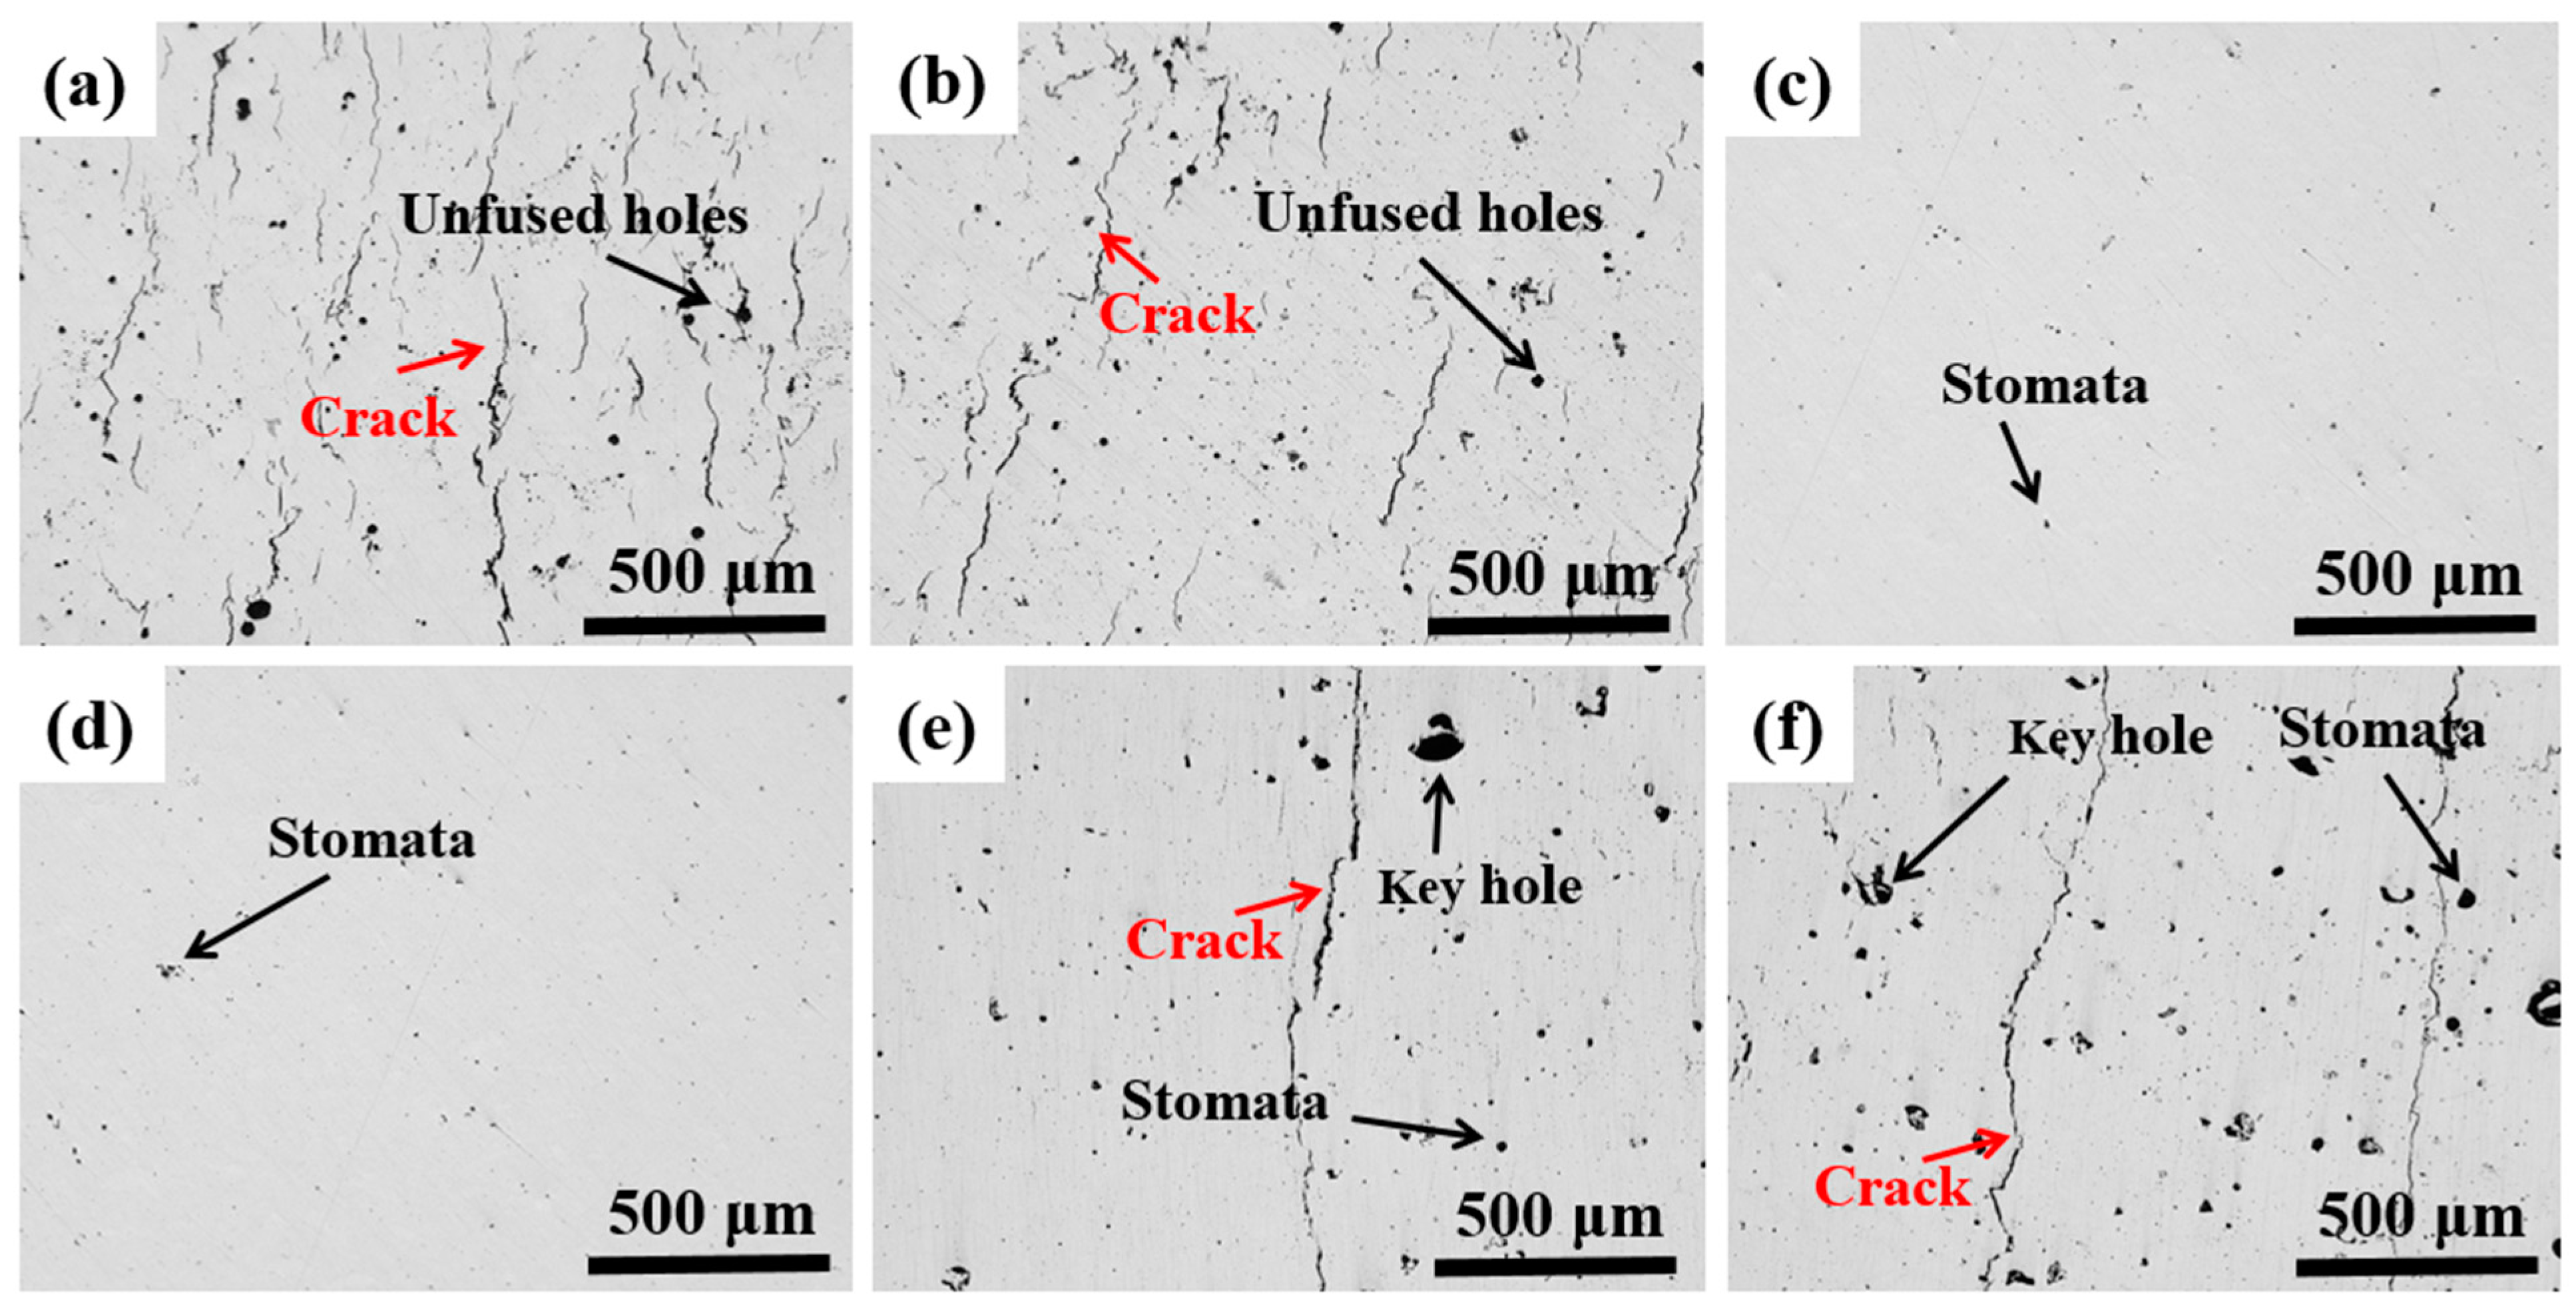
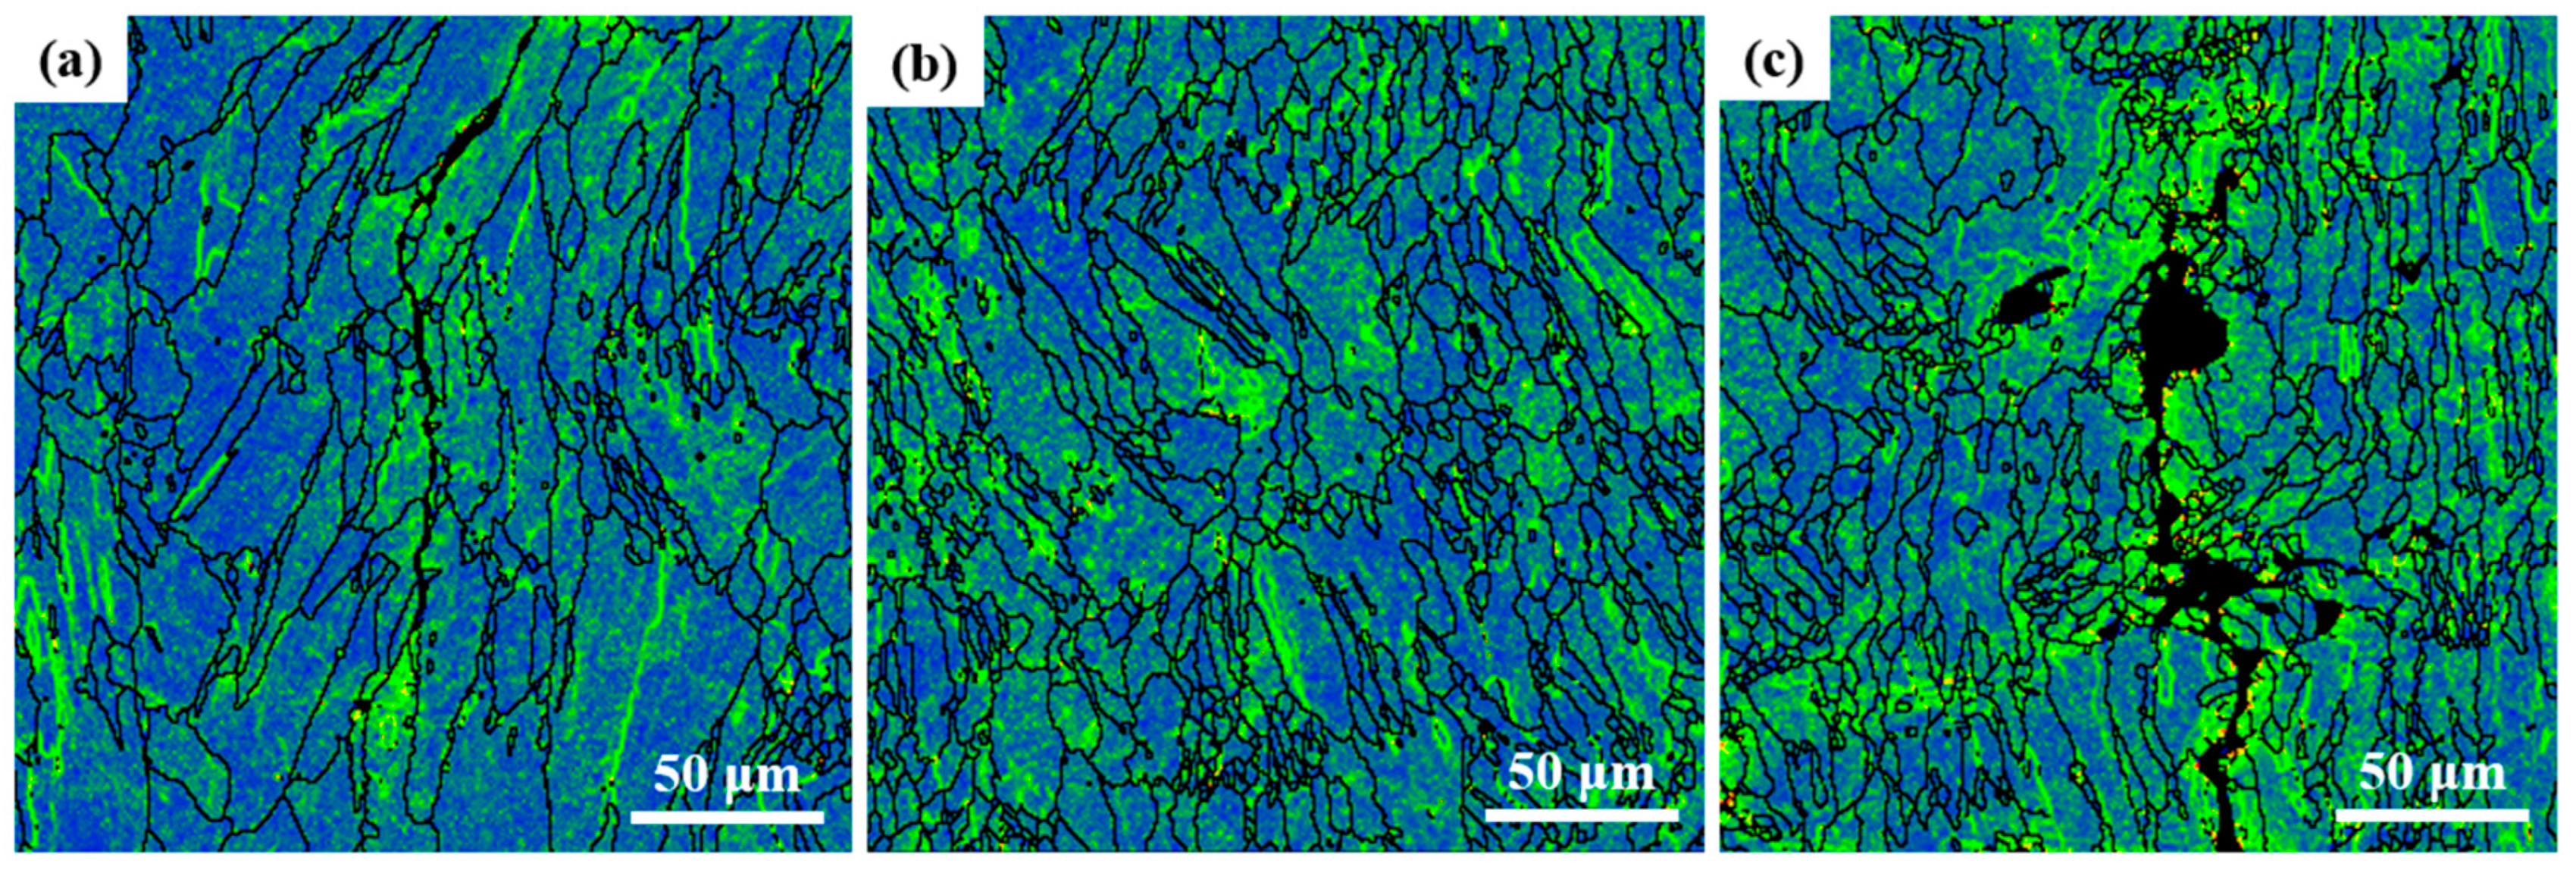
When the VED is too large, the excessively high temperature in the molten pool causes the vaporization of moisture in the powder and metallic elements with a low melting point, and the gas cannot escape under an extremely fast cooling rate of LPBF and form pores in the sample [13]. In addition, a high energy density leads to the formation of keyholes in pores and oxides at the bottom of the molten pool [19]. As shown in Figure 11c, stress concentration points exist near irregular pores, which increase the left-hand side of Equation (4), resulting in the formation of cracks.
(2)
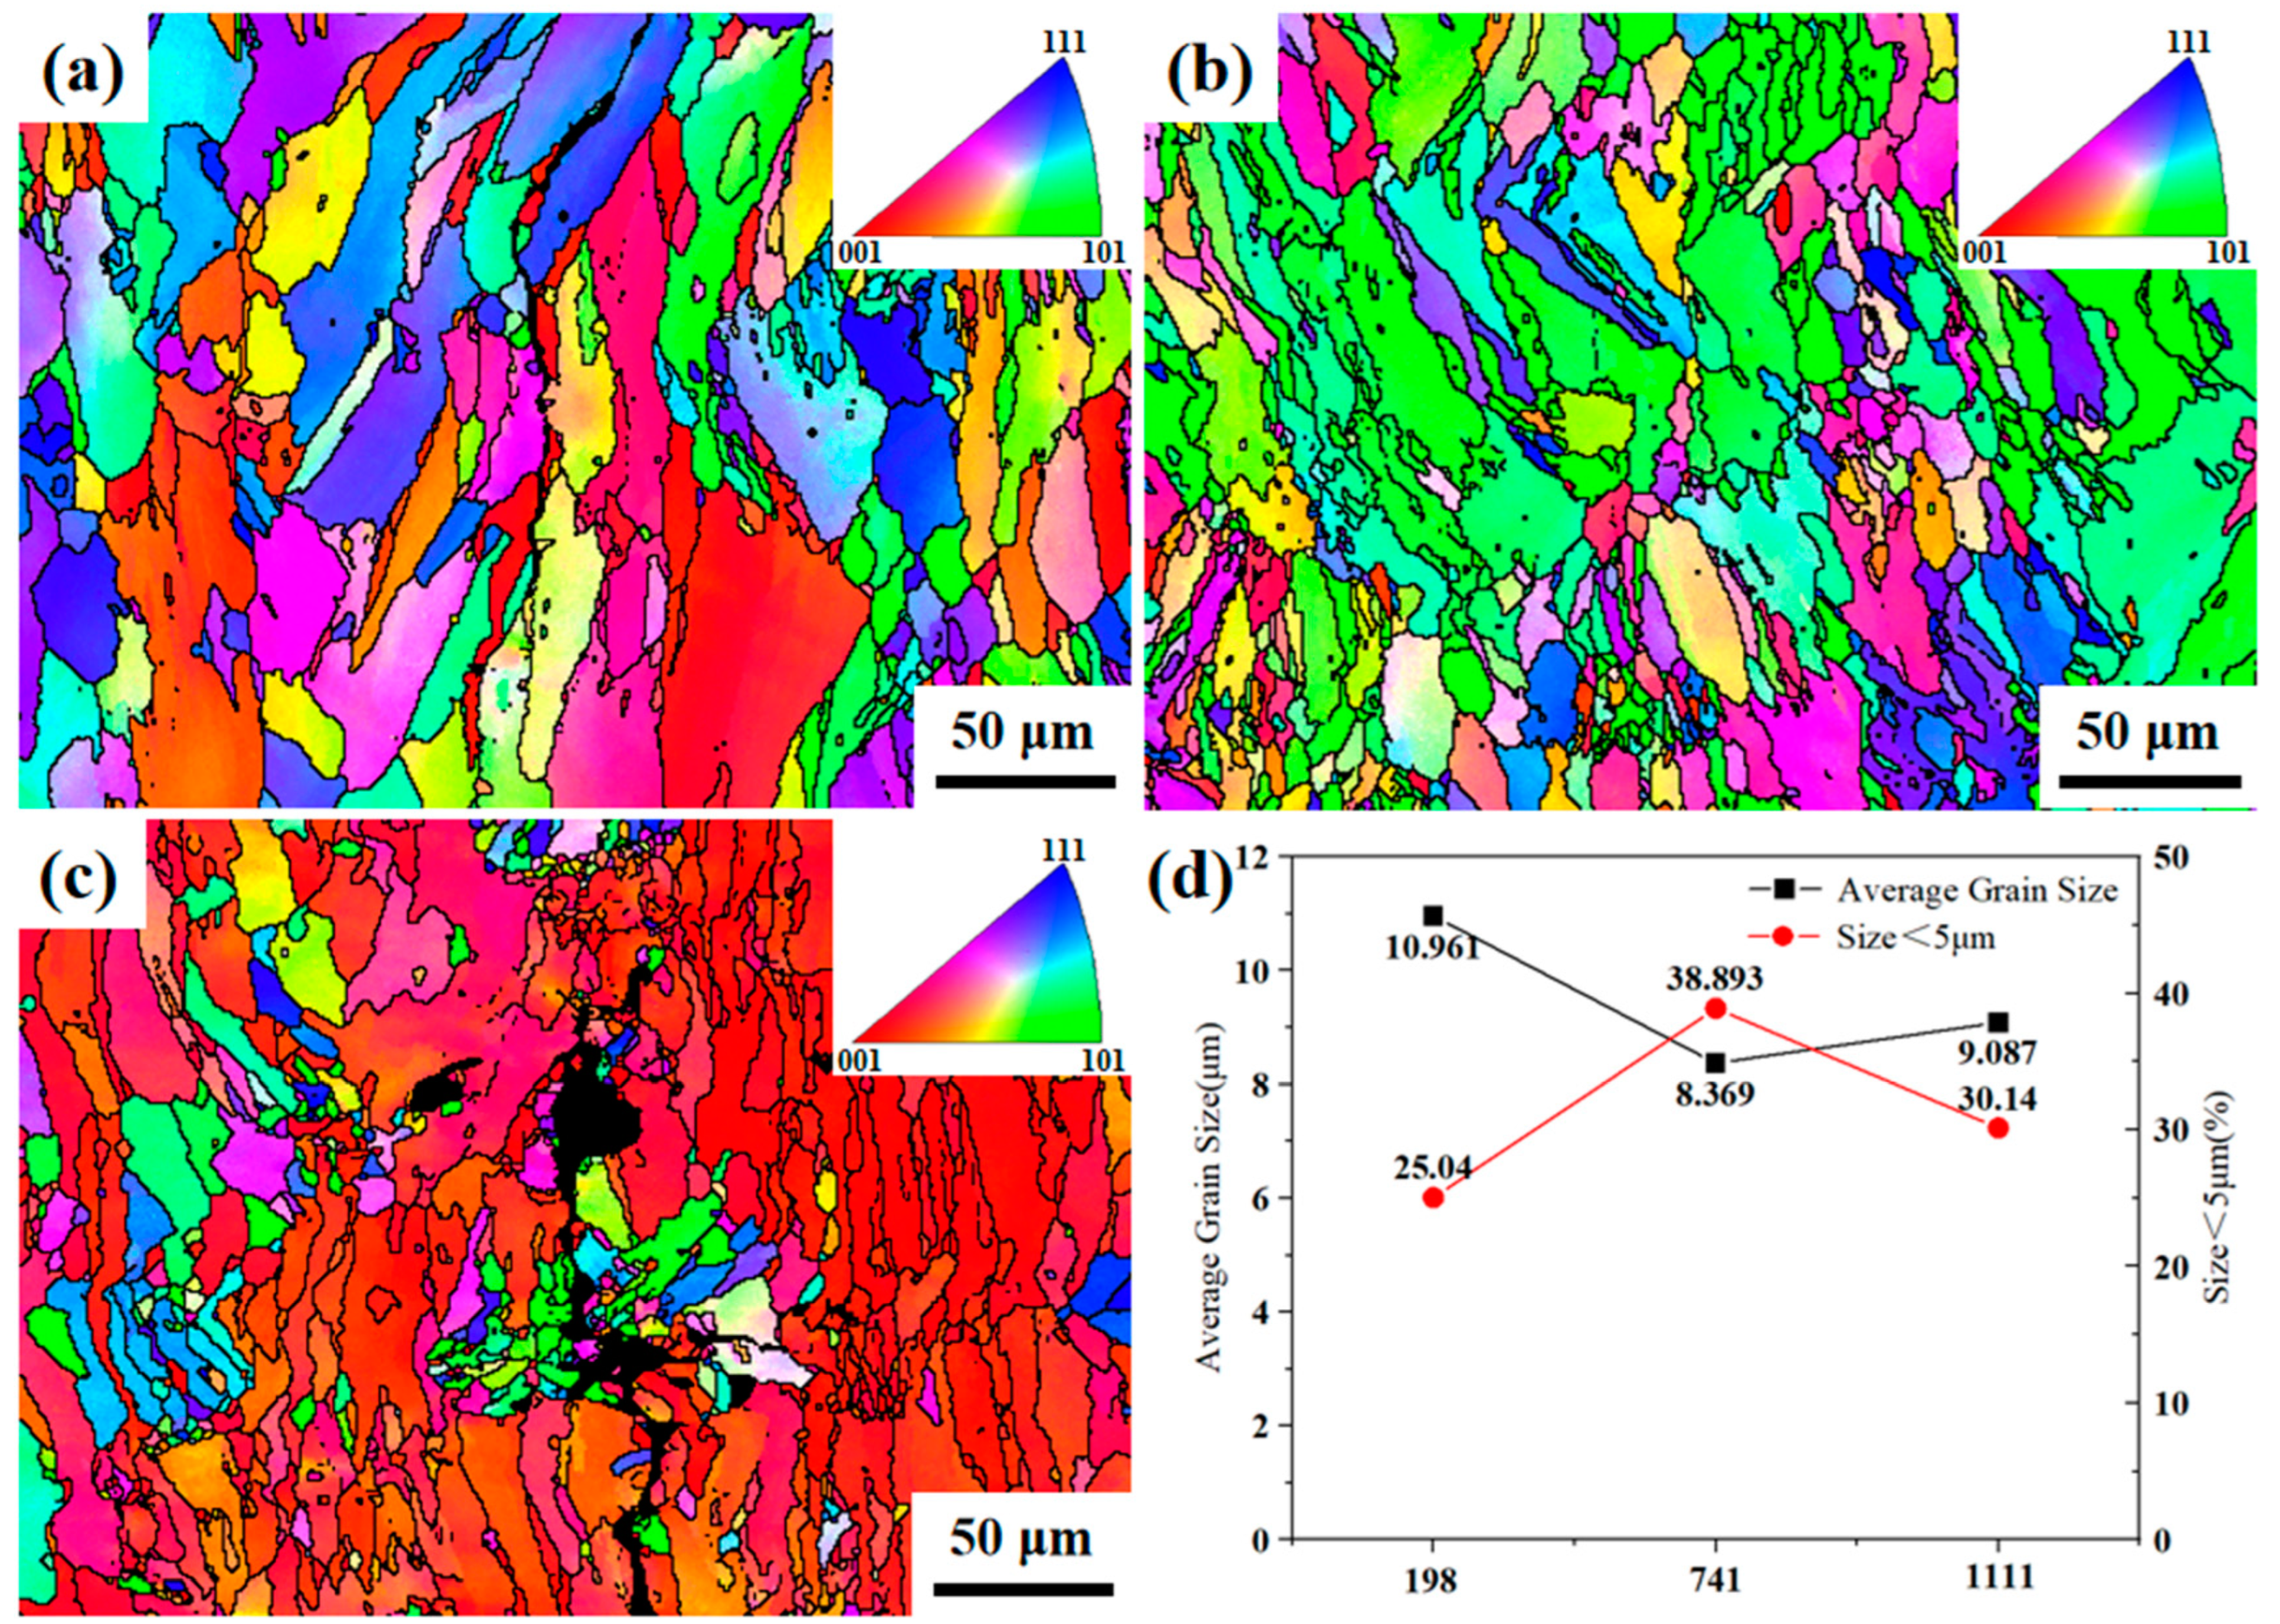
The dislocations can often hinder crack propagation. Based on the analysis in Section 3.3 and Figure 9, it can be seen that the dislocation density of the sample decreases significantly when the VED is too large, which indicates that cracking is more difficult to restrain. Therefore, the crack length increases when the VED is too large.

5. Conclusions

In summary, the influence of process parameters on density, defects, microstructure, and mechanical properties of LPBF-formed 2024Al alloy was studied, and the formation mechanism of hot cracks and sensitivity of hot cracking were analyzed in detail. The key research results can be summarized as follows:
(1)
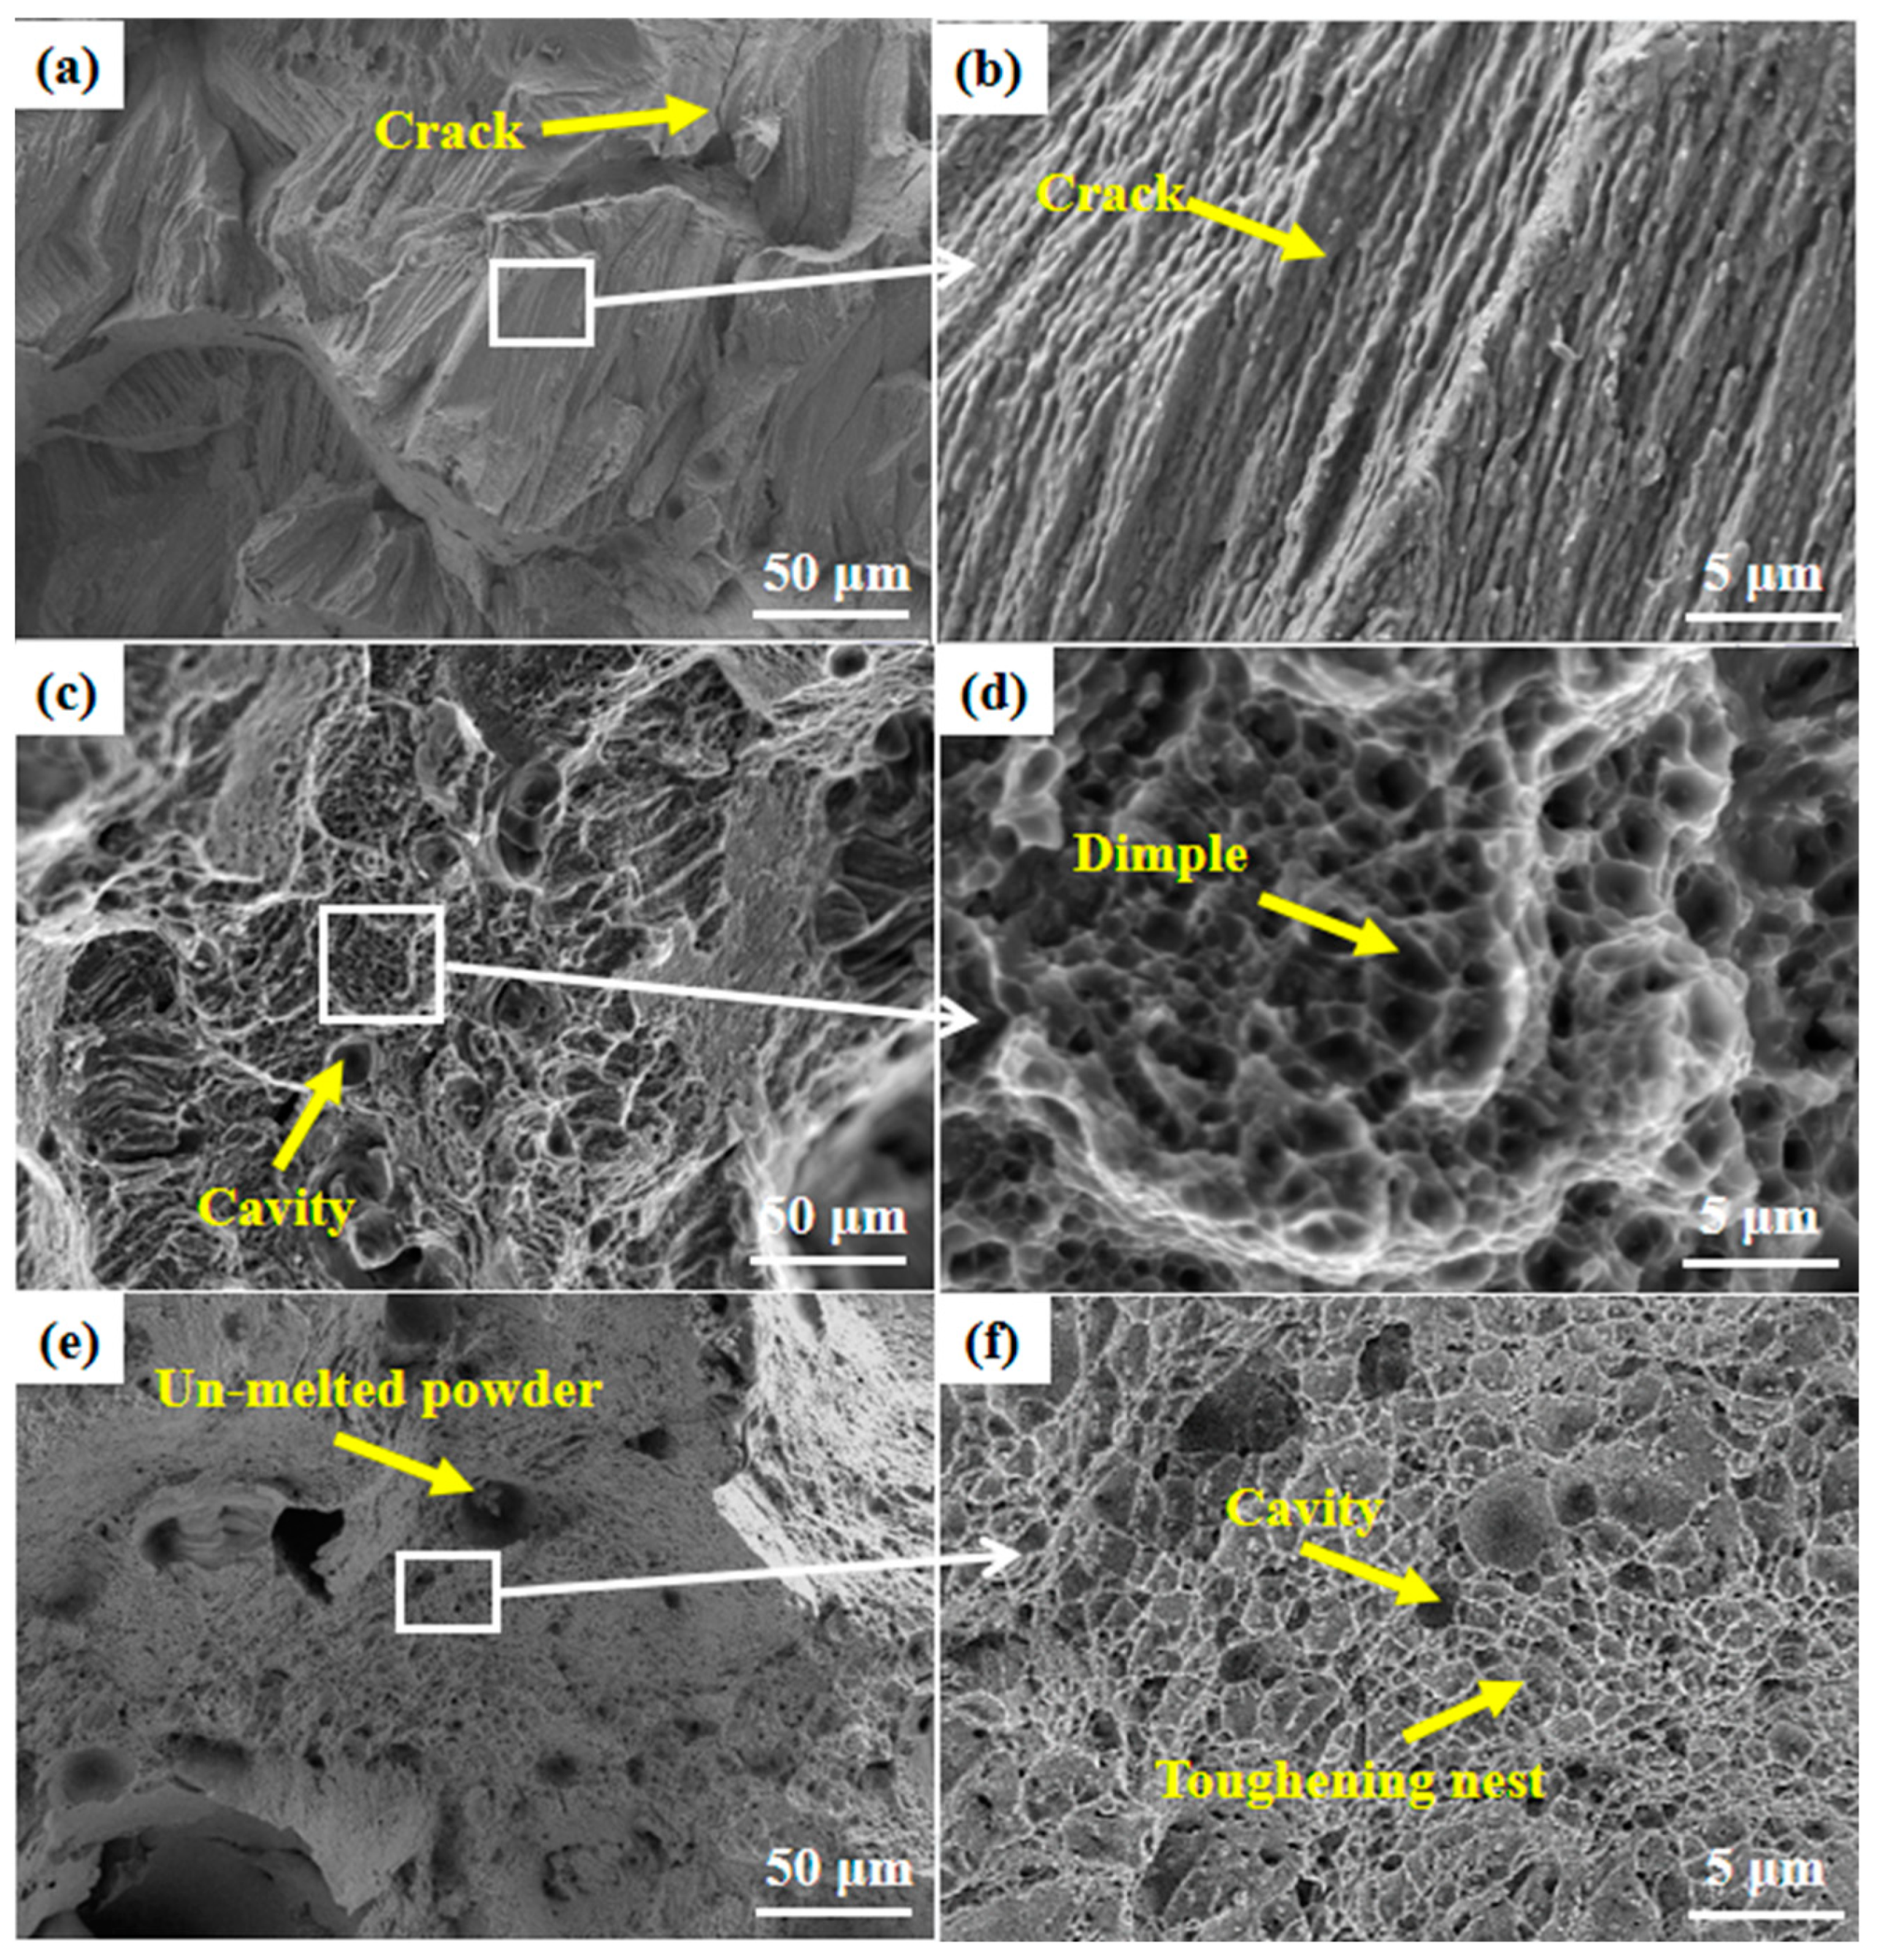
During LPBF formation of 2024Al alloy, the defects mainly include cracks, pores, and unfused pores, and the content of cracks is much higher than pores. The cracks and pores of the specimen can be eliminated through process optimization. At E = 741 J/mm3, the maximum density of the specimen reaches 99.77%.
(2)
The impact of crack defects on the mechanical properties of the specimen is far greater than pore defects. Under the optimal process, the strength was 330 ± 7 MPa, yield strength was 234 ± 6 MPa, and elongation at the breaking point was 9 ± 0.6%.
(3)
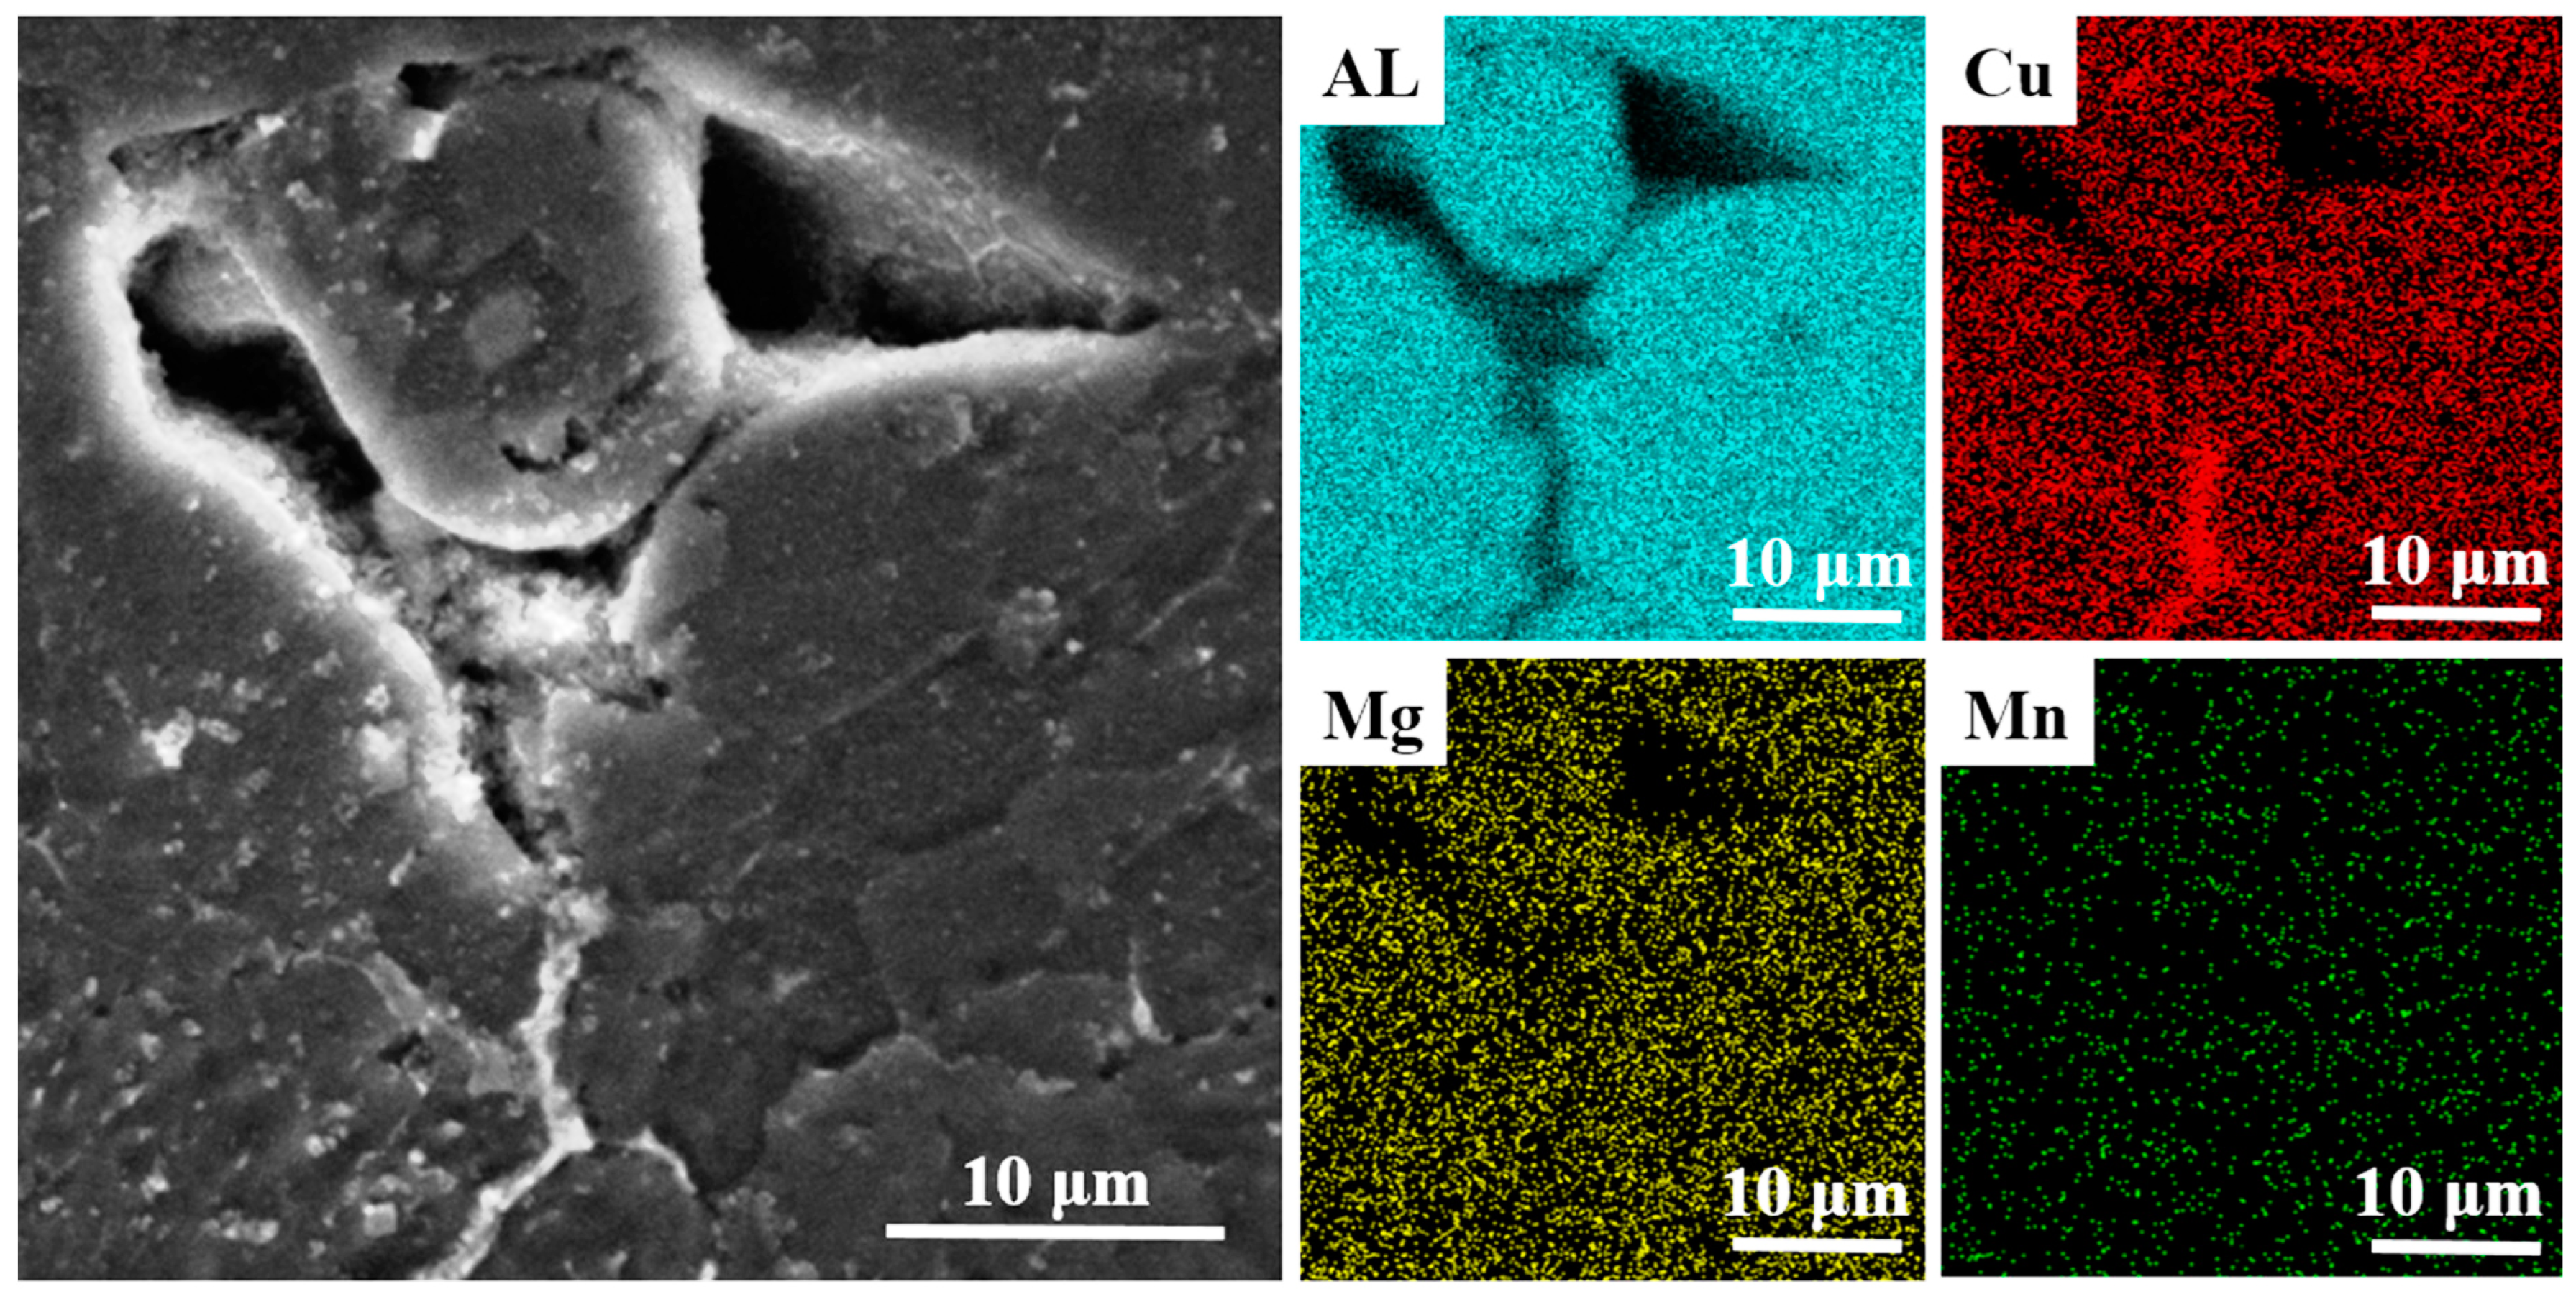
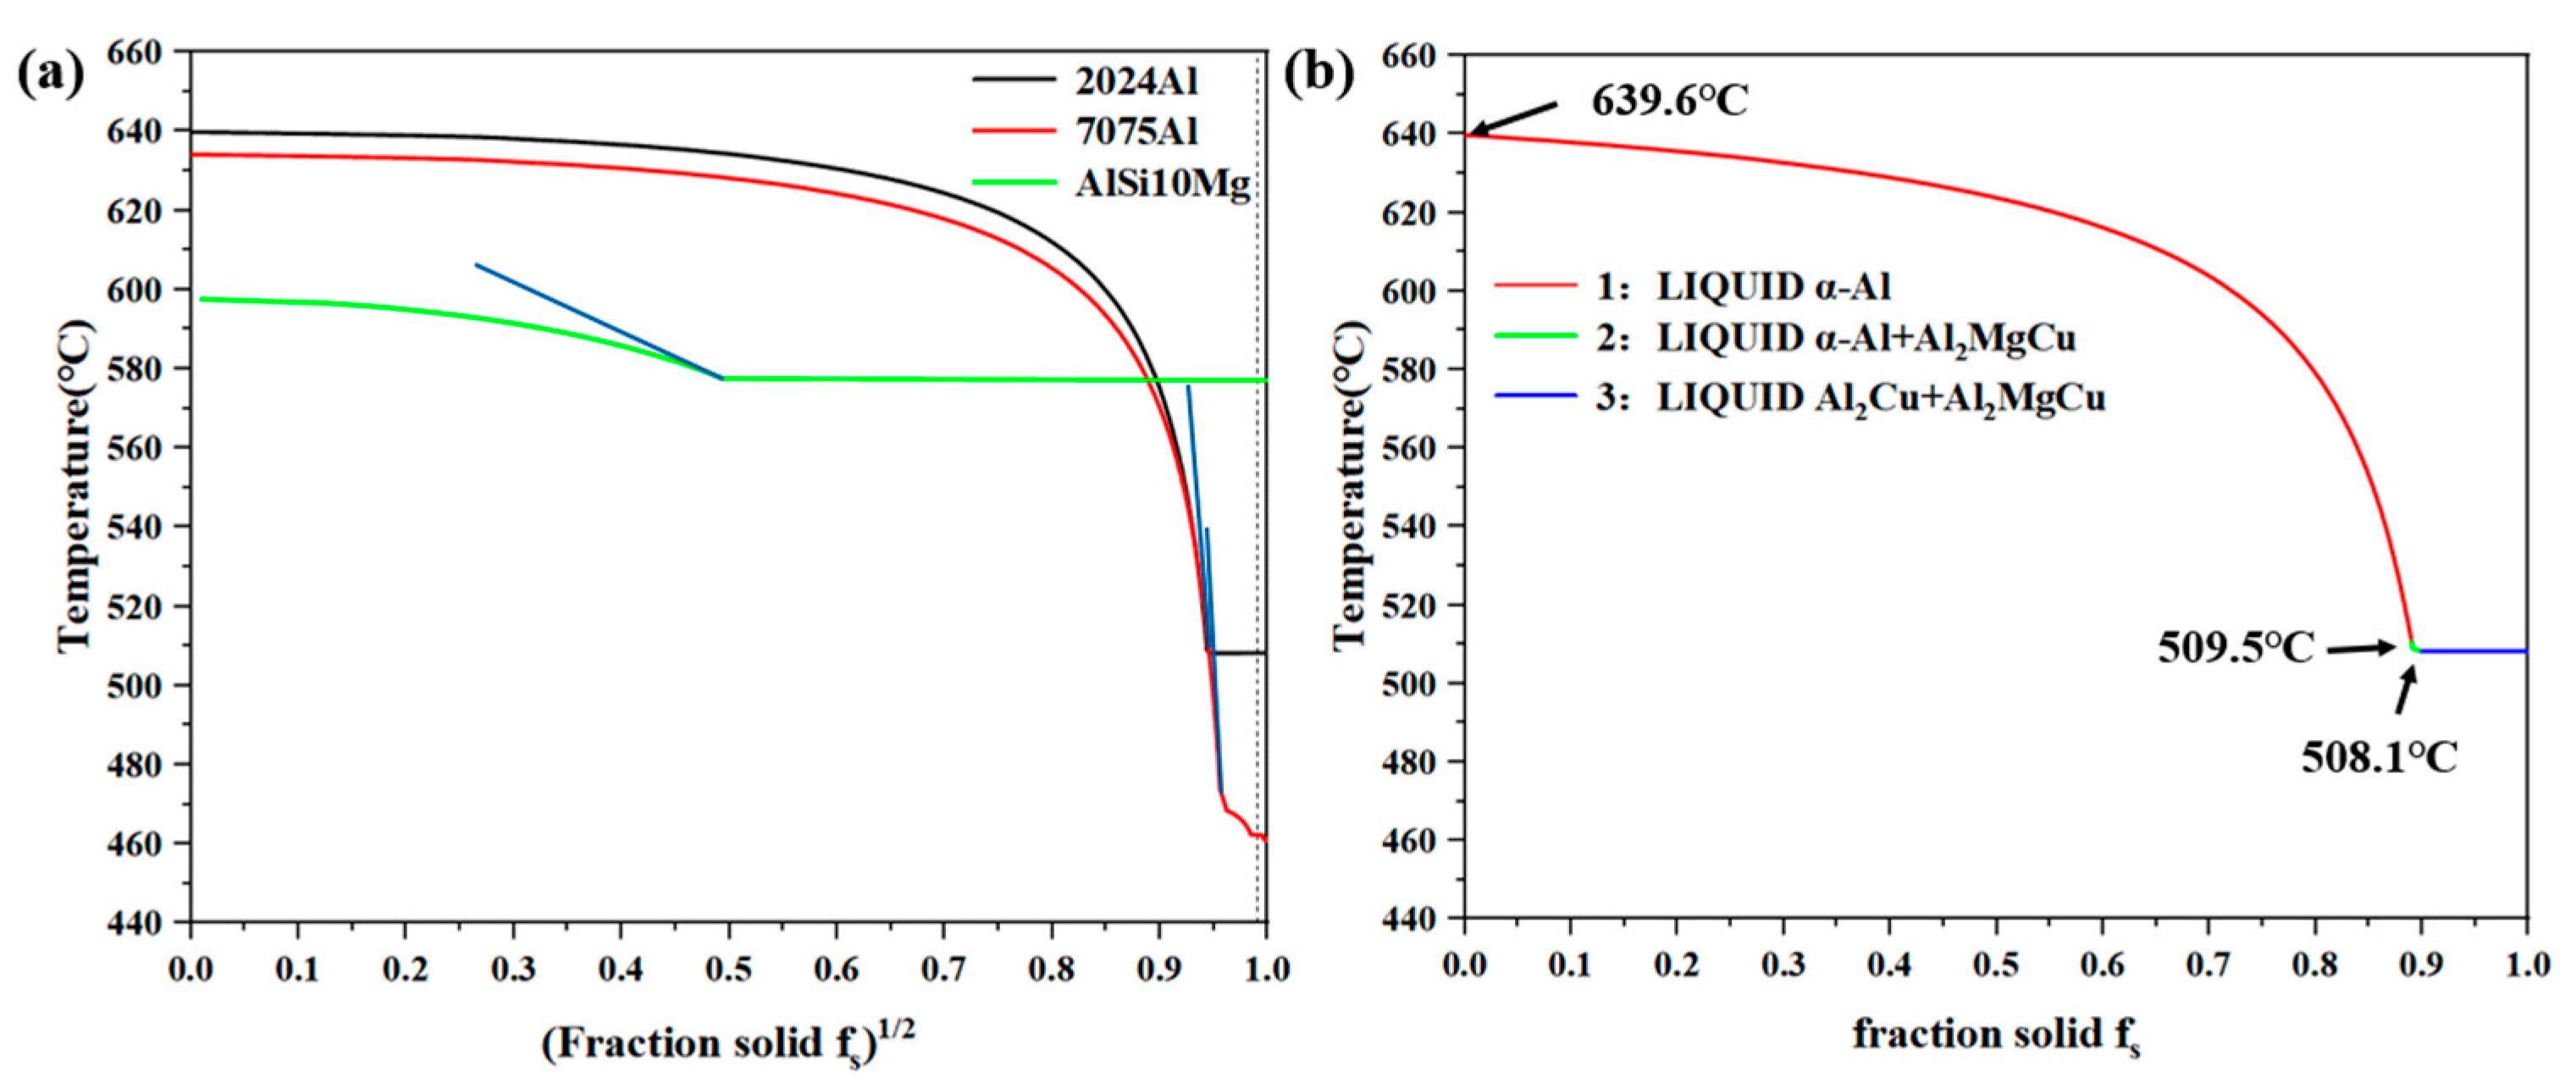
Thermal crack sensitivity of the 2024Al alloy is due to high Cu and Mg contents, which makes the lateral strain rate of columnar dendrites bigger than the sum of the lateral expansion rate of grain fusion and liquid phase filling rate at grain boundaries. In addition, the extremely high cooling rate of LPBF also aggravates the thermal cracking tendency during the LPBF forming of the 2024Al alloy.
(4)
Excessively small energy input leads to an increase in the cooling rate, enhancing the viscosity of the liquid metal, weakening the Marangoni convection strength, and increasing the number of dendrites at the boundary of the molten pool, thereby exacerbating the tendency of thermal cracking. When the energy input is too large, the occurrence of pores leads to a strong stress concentration and causes cracks, and the decrease in dislocation density makes it difficult to suppress crack propagation.

Author Contributions

S.Y.: conceptualization, methodology, investigation, formal analysis, data curation, validation, visualization, and writing—original draft. J.W.: formal analysis, data curation, writing—review and editing. M.L.: conceptualization, project administration, resources, writing—review and editing. Z.C.: conceptualization, formal analysis, project administration, resources, writing—review and editing. B.L.: formal analysis, resources, writing—review and editing. S.S.: conceptualization, formal analysis, project administration, resources, writing—review and editing. Y.L.: conceptualization, formal analysis, project administration, resources, writing—review and editing. All authors have read and agreed to the published version of the manuscript.

Funding

This research was funded by the Youth Science Foundation of The National Natural Science Foundation of China grant number 52005391 And The APC was funded by the Youth Science Foundation of The National Natural Science Foundation of China (No. 52005391).

Data Availability Statement

The required raw and processed data to reproduce these findings can be made available by contacting the corresponding author.

Conflicts of Interest

The authors declare that they have no known competing financial interests or personal relationships that could have appeared to influence the work reported in this paper.

References

  1. Yap, C.Y.; Chua, C.K.; Dong, Z.L.; Liu, Z.H.; Sing, S.L. Review of selective laser melting: Materials and applications. Appl. Phys. Rev. 2015, 2, 041101. [Google Scholar] [CrossRef]
  2. Zhang, J.; Li, F.; Zhang, H. Research progress on preparation of metallic materials by selective laser melting. Laser Optoelectron. Prog. 2019, 56, 100003. [Google Scholar] [CrossRef]
  3. Zhang, J.; Song, B.; Wei, Q.; Bourell, D.; Shi, Y. A review of selective laser melting of aluminum alloys: Processing, microstructure, property and developing trends. J. Mater. Sci. Technol. 2019, 35, 270–284. [Google Scholar] [CrossRef]
  4. Wang, P.; Eckert, J.; Prashanth, K.G.; Wu, M.W.; Scudino, S. A review of particulate-reinforced aluminum matrix composites fabricated by selective laser melting. Trans. Nonferrous Met. Soc. China 2020, 30, 2001–2034. [Google Scholar] [CrossRef]
  5. Nie, X.; Zhang, H.; Zhu, H.; Hu, Z.; Ke, L.; Zeng, X. Analysis of processing parameters and characteristics of selective laser melted high strength al-cu-mg alloys: From single tracks to cubic samples. J. Mater. Process. Technol. 2018, 256, 69–77. [Google Scholar] [CrossRef]
  6. Zhang, H.; Zhu, H.; Qi, T.; Hu, Z.; Zeng, X. Selective laser melting of high strength al–cu–mg alloys: Processing, microstructure and mechanical properties. Mater. Sci. Eng. A 2016, 656, 47–54. [Google Scholar] [CrossRef]
  7. Mair, P.; Goettgens, V.S.; Rainer, T.; Weinberger, N.; Letofsky-Papst, I.; Mitsche, S.; Leichtfried, G. Laser powder bed fusion of nano-cab 6 decorated 2024 aluminum alloy. J. Alloys Compd. 2021, 863, 158714. [Google Scholar] [CrossRef]
  8. Tan, Q.; Zhang, J.; Sun, Q.; Fan, Z.; Li, G.; Yin, Y.; Liu, Y.; Zhang, M.-X. Inoculation treatment of an additively manufactured 2024 aluminium alloy with titanium nanoparticles. Acta Mater. 2020, 196, 1–16. [Google Scholar] [CrossRef]
  9. Debroy, T.; Wei, H.L.; Zuback, J.; Mukherjee, T.; Zhang, W. Additive manufacturing of metallic components—Process, structure and properties. Prog. Mater. Sci. 2018, 92, 112–224. [Google Scholar] [CrossRef]
  10. Niu, P.; Li, R.; Yuan, T.; Zhu, S.; Chen, C.; Wang, M.; Huang, L. Microstructures and properties of an equimolar AlCoCrFeNi high entropy alloy printed by selective laser melting. Intermetallics 2019, 104, 24–32. [Google Scholar] [CrossRef]
  11. Zhang, B.; Li, Y.; Bai, Q. Defect Formation Mechanisms in Selective Laser Melting: A Review. Chin. J. Mech. Eng. 2017, 30, 515–527. [Google Scholar] [CrossRef] [Green Version]
  12. Rao, J.H.; Zhang, Y.; Huang, A.; Wu, X.; Zhang, K. Improving fatigue performances of selective laser melted Al-7Si-0.6Mg alloy via defects control. Int. J. Fatigue 2019, 129, 105215. [Google Scholar] [CrossRef]
  13. Weingarten, C.; Buchbinder, D.; Pirch, N.; Meiners, W.; Wissenbach, K.; Poprawe, R. Formation and reduction of hydrogen porosity during selective laser melting of AlSi10Mg. J. Mater. Process. Technol. 2015, 221, 112–120. [Google Scholar] [CrossRef]
  14. Tang, M.; Pistorius, P.C.; Beuth, J.L. Prediction of lack-of-fusion porosity for powder bed fusion. Addit. Manuf. 2017, 14, 39–48. [Google Scholar] [CrossRef]
  15. Gunenthiram, V.; Peyre, P.; Schneider, M.; Dal, M.; Coste, F.; Koutiri, I.; Fabbro, R. Experimental analysis of spatter generation and melt-pool behavior during the powder bed laser beam melting process. J. Mater. Process. Technol. 2017, 251, 376–386. [Google Scholar] [CrossRef]
  16. Thijs, L.; Kempen, K.; Kruth, J.-P.; Van Humbeeck, J. Fine-structured aluminium products with controllable texture by selective laser melting of pre-alloyed AlSi10Mg powder. Acta Mater. 2013, 61, 1809–1819. [Google Scholar] [CrossRef] [Green Version]
  17. Prashanth, K.; Scudino, S.; Klauss, H.; Surreddi, K.; Löber, L.; Wang, Z.; Chaubey, A.; Kühn, U.; Eckertl, J. Microstructure and mechanical properties of al–12si produced by selective laser melting: Effect of heat treatment. Mater. Sci. Eng. A 2014, 590, 153–160. [Google Scholar] [CrossRef]
  18. Tan, Q.; Liu, Y.; Fan, Z.; Zhang, J.; Yin, Y.; Zhang, M.-X. Effect of processing parameters on the densification of an additively manufactured 2024 Al alloy. J. Mater. Sci. Technol. 2020, 58, 34–45. [Google Scholar] [CrossRef]
  19. Wang, M.; Song, B.; Wei, Q.; Shi, Y. Improved mechanical properties of alsi7mg/nano-sicp composites fabricated by selective laser melting. J. Alloys Compd. 2019, 810, 151926. [Google Scholar] [CrossRef]
  20. Zhao, B.; Cai, Q.; Cheng, J.; Yang, S.; Chen, F. Investigation on recrystallization and precipitation behaviors of al-4.5cu-1.5mg alloy refined by ti-supported tic nanoparticles—Sciencedirect. J. Alloys Compd. 2019, 800, 392–402. [Google Scholar] [CrossRef]
  21. Kamaya, M. A smoothing filter for misorientation mapping obtained by ebsd. Mater. Trans. 2010, 51, 1516–1520. [Google Scholar] [CrossRef] [Green Version]
  22. Rappaz, M.; Drezet, J.M.; Gremaud, M. A new hot-tearing criterion. Metall. Mater. Trans. A 1999, 30, 449–455. [Google Scholar] [CrossRef] [Green Version]
  23. Kou, S. A criterion for cracking during solidification. Acta Mater. 2015, 88, 366–374. [Google Scholar] [CrossRef]
  24. Liu, J.; Duarte, H.P.; Kou, S. Evidence of back diffusion reducing cracking during solidification. Acta Mater. 2017, 122, 47–59. [Google Scholar] [CrossRef] [Green Version]
  25. Liu, J.; Kou, S. Crack susceptibility of binary aluminum alloys during solidification. Acta Mater. 2016, 110, 84–94. [Google Scholar] [CrossRef] [Green Version]
  26. Liu, J.; Kou, S. Susceptibility of ternary aluminum alloys to cracking during solidification. Acta Mater. 2017, 125, 513–523. [Google Scholar] [CrossRef] [Green Version]
  27. Gulliver, G.H. The quantitative effect of rapid cooling upon the constitution of binary alloys. J. Inst. Met. 1909, 9, 120–157. [Google Scholar]
  28. Zang, H. Study on Weldability of 2024 High-Strength Aluminum Alloy by High-Power CO2 Laser. Master’s Thesis, Shanghai Jiao Tong University, Shanghai, China, 2013. [Google Scholar]
  29. Gu, D.; Hagedorn, Y.-C.; Meiners, W.; Meng, G.; Batista, R.J.S.; Wissenbach, K.; Poprawe, R. Densification behavior, microstructure evolution, and wear performance of selective laser melting processed commercially pure titanium. Acta Mater. 2012, 60, 3849–3860. [Google Scholar] [CrossRef]
  30. Zhong, Y.; Zhuo, Y.; Wang, Z.; Sha, Y. Marangoni convection induced by simultaneous mass and heat transfer during evaporation of n-heptane/ether binary liquid mixture. Int. J. Heat Mass Transf. 2017, 108, 812–821. [Google Scholar] [CrossRef]
Figure 1. (a) SEM image and (b) particle size distribution of the 2024Al powder.
Metals 13 00268 g001
Figure 2. Schematic diagram of the drawing parts (mm).
Metals 13 00268 g002
Figure 3. (a) The energy density vs. relative density curve. (b) Crack content/pore content–laser energy density curve.
Metals 13 00268 g003
Figure 4. OM images of samples under different VEDs: (a) E = 198 J/mm3, (b) E = 329 J/mm3, (c) E = 741 J/mm3, (d) E = 846 J/mm3, (e) E = 1018 J/mm3, and (f) E = 1111 J/mm3.
Metals 13 00268 g004
Figure 5. XRD patterns of 2024Al powder and LPBF-formed alloy (E = 198 J/mm3).
Metals 13 00268 g005
Figure 6. SEM images of the LPBF-formed alloy (E = 198 J/mm3) and corresponding EDS maps.
Metals 13 00268 g006
Figure 7. EBSD orientation maps of LPBF-formed alloys with different VEDs: (a) E = 198 J/mm3, (b) E = 741 J/mm3, and (c) E = 1111 J/mm3. (d) The variation curve of the average grain size and percentage of grains with a size of <5 μm.
Metals 13 00268 g007
Figure 8. Pole diagram of LPBF-formed alloys with different VEDs: (a) E = 198 J/mm3, (b) E = 741 J/mm3, and (c) E = 1111 J/mm3.
Metals 13 00268 g008
Figure 9. Grain boundary angle statistics of samples: (a) E = 198 J/mm3, (b) E = 741 J/mm3, and (c) E = 1111 J/mm3.
Metals 13 00268 g009
Figure 10. The fracture morphology of LPBF-formed alloys under different VEDs: (a,b) E = 198 J/mm3, (c,d) E = 741 J/mm3, and (e,f) E = 1111 J/mm3.
Metals 13 00268 g010
Figure 11. KAM diagram of LPBF-formed alloys under different VEDs: (a) E = 198 J/mm3, (b) E = 741 J/mm3, and (c) E = 1111 J/mm3.
Metals 13 00268 g011
Figure 12. (a) Schematic diagram of the solidification of molten pool and (b) directional solidification of columnar crystals.
Metals 13 00268 g012
Figure 13. (a) T-(fs)1/2 of 2024Al, 7075Al, and AlSi10Mg alloys and (b) the solidification curve of the 2024Al alloy.
Metals 13 00268 g013
Figure 14. SEM images of dendrite arms at the boundary of the molten pool: (a) 198 J/mm3, (b) 247 J/mm3, (c) 329 J/mm3, and (d) 741 J/mm3 (White points to primary dendrites and red to secondary dendrites).
Metals 13 00268 g014
Table 1. The chemical composition of the 2024Al alloy (%).
AlMgCuMnTiZnSiCrFePb, Bi
Bal1.624.700.510.030.055////
Table 2. The LPBF forming process parameters.
ParameterValue
Laser power (P, W)140, 160, 180, 200, 240
Scanning speed (V, mm/s)60, 80, 120, 180, 240, 300
Hatching space (HP, μm)90
Layer thickness (T, μm)30
Scanning strategy (θ, °)67
Table 3. The mechanical properties of LPBF-formed alloys under different process parameters.
Laser Energy Density (J/mm3)UTS (MPa) σ 0.2   ( MPa ) EL (%)
19860 ± 4//
741330 ± 7234 ± 69 ± 0.6
1111300 ± 9203 ± 57 ± 0.4
Disclaimer/Publisher’s Note: The statements, opinions and data contained in all publications are solely those of the individual author(s) and contributor(s) and not of MDPI and/or the editor(s). MDPI and/or the editor(s) disclaim responsibility for any injury to people or property resulting from any ideas, methods, instructions or products referred to in the content.

