Article

Mg-Ca0.3 Electrochemical Activity Exposed to Hank’s Physiological Solution and Properties of Ag-Nano-Particles Deposits

by
José Luis González-Murguía
1,
Lucien Veleva
1,*,
Geonel Rodríguez-Gattorno
1,
Mayra Zyzlila Figueroa-Torres
2 and
Sebastián Feliu, Jr.
3
1
Applied Physics Department, Center for Advanced Study (CINVESTAV), Mérida 97310, Mexico
2
Faculty of Civil Engineering, Autonomous University of Nuevo Leon (UANL), San Nicolás de los Garza 66455, Mexico
3
Surface Engineering, Corrosion and Durability Department, Nacional Center for Metallurgical Research (CENIM-CSIC), 28040 Madrid, Spain
*
Author to whom correspondence should be addressed.
Metals 2021, 11(9), 1357; https://doi.org/10.3390/met11091357
Submission received: 6 August 2021 / Revised: 24 August 2021 / Accepted: 25 August 2021 / Published: 29 August 2021

Abstract

:
This work compares the degradation of Mg and Mg-Ca0.3 alloy when they are exposed for 14 days to Hank’s solution at 37 °C. A combination of immersion test, electrochemical techniques (PDP, EIS, EN), and surface characterization methods (SEM-EDS, XRD, and XPS) were carried out. The pH change over time, the lower mass loss (≈20%), and the lower concentration of the released Mg2+ ions (≈3.6 times), as well as the lower level of the surface degradation, allowed to consider the positive effect of Ca, presenting Mg-Ca0.3 alloy with lower electrochemical activity than that of Mg. The positive effect of Ca may be due to the formed layer characteristics on the alloy surface, which impedes the cathodic hydrogen evolution and Mg-ions release. The electroless deposited Ag-nano-particles (Ag-NPs) on Mg-Ca0.3 surface were characterized by SEM-EDS, XRD, UV-Vis, and contact angle. The agar-diffusion test was used to compare the growth of Staphylococcus aureus and Escherichia coli bacteria on Mg-Ca0.3 in the presence of Ag-NPs deposits in different size. Zeta-potential of the bacteria was negative, with respect to pH of the Mueller-Hinton culture broth. The greater antibacterial effect of S. aureus was attributed to its more negative zeta-potential, attracting more released Ag+ ions.

1. Introduction

The magnesium and its alloys have attracted a lot of research interest as biodegradable, resorbable and biocompatible materials, when used as temporary implants in physiological media. As structural materials, they present prevalence over the non-resorbable biomaterials [1,2,3,4,5,6,7]. Mg is the lightest metal with a density of 1.738 g cm−3 which is close to the cortical bone (1.75–2.1 g cm−3), with an elastic modulus of 45 GPa (≈20 GPa of cortical bone), its rapidly cooled alloys can reach a strength/weight ratio of 490 kN m kg−1 [8,9,10,11], hence it is considered as a more suitable material than the biomedical titanium alloy Ti6Al4V (4.47 g cm−3) [12]. The released magnesium ion (Mg2+) is non-toxic and is a fundamental for: the synthesis of proteins, activation of a variety of enzymes, regulation of activities of the central nervous and neuromuscular systems, regulation of blood glucose level, promotion of normal blood pressure, as well as playing an important role in the prevention and treatment of disorders of the hypertension, cardiovascular diseases, and diabetes [13,14,15]. The Mg ion is the second most abundant intracellular divalent cation, which is assimilated by the human body, and the average requirement is of ~375 mg per day for a human body of approximately 70 kg of weight [16]. Unlike calcium, the clinical importance of which is indisputable, that of Mg is often underestimated, as an element necessary for the incorporation of Ca into the bone [17,18]. Magnesium has been applied as a biomaterial for cardiovascular, microsurgeries, orthopedic, and wound closures [4,19,20,21,22].
Most metals, such as iron (Fe), chromium (Cr), titanium (Ti), nickel (Ni), cobalt (Co), tantalum (Ta), tungsten (W), niobium (Nb), and molybdenum (Mo), which are used for the manufacture of implants, present serious problems such as release of ions during the degradation process into the physiological solutions, as well as the formation of corrosion products that are not tolerable (toxic) for the body even in minute quantities [23]. Therefore, because of the many advantages over non-resorbable biomaterials, Mg and its alloys are potential materials for the design of new temporary orthopedic devices, providing mechanical properties like those of human bone, maintaining mechanical integrity on a scale of 12 to 18 weeks, while the bone tissue heals [3,24,25,26]. Moreover, they have stimulating effects on the growth of new bone tissue, because magnesium ions (Mg2+) exhibit a strong affinity to bind with phosphate ions present in the human body, influencing the mineralization of bone tissue through the formation of hydroxyapatite [Ca10(PO4)6(OH)2], or possible similar compounds, which can inhibit the corrosion process [27,28,29,30,31]. Nowadays there is a great demand for orthopedic implants with an increase in 2020 of ~116 billion dollars in the stock market [23,24,31,32,33].
In aqueous media, because of the very negative redox potential of Mg (−2.38 VSHE), its anodic dissolution (Equation (1)) is accompanied by the main cathodic reaction of hydrogen evolution over a wide pH range [25,26,27,28,29,30,31,32,33,34,35,36,37,38,39]. The hydrogen volume measurement is not a reliable method for the corrosion process monitoring, because the oxygen reduction (Equation (2)) and the water reduction (Equation (3)) may also occur as secondary cathodic reactions on the Mg surface [40,41,42]. Different microstructural regions, as intermetallic phases and impurity particles rich in transition metals (Fe, Ni or Cu), are potential cathodic sites for these reduction reactions [39,40].
Mg + 2 H 2 O Mg OH 2 + H 2
O 2 + 2 H 2 O   + 4 e   4 OH
2 H 2 O + 2 e H 2 + 2 OH
In physiological solutions composed of a high content of NaCl (up to 3.5%), the Cl ions penetrate the pores of the poorly soluble (0.009 g L−1) corrosion product of Mg(OH)2, causing its partial transformation to highly soluble MgCl2 (54.3 g L−1) [3,20,43]:
Mg OH 2 + 2 Cl   MgCl 2 + 2 OH Mg 2 + + 2 Cl
On the other hand, the biodegradation mechanism of Mg and its alloys depends strongly on the ionic composition of the surrounding solutions used for testing, whose corrosivity may change the corrosion behavior [44]. A mathematical method has been reported to predict the biodegradable corrosion mechanism and properties of commercially pure Mg-based implants in a simulated environment [45].
The mainly disadvantages that Mg may present in physiological media are: anticipated loss of mechanical integrity (implant failure); H2 gas generated as a byproduct of corrosion (affecting the healing process); alkalinization at the surface interface (Equation (4)), which accelerates the process of Mg(OH)2 corrosion product formation and disorder in the physiological reactions that depend on the pH [46,47,48]. The recent advancement in reducing the rapid degradation of Mg implants is linked with the introduction of alloying elements. The metal Ca (1.55 g cm−3) was chosen as it is the major component in the human bones, as a hydroxyapatite complex [Ca10(PO4)6(OH)2], which provides the rigidity and stability of the bone, as well as, the ions of Ca are essential for the chemical signals of cells [48,49]. In a solid solution its percentage can reach up to 1.34 wt.% according to the binary phase diagrams of Mg-Ca [28,50]. It has been reported that the addition of Ca in Mg alloys improves their mechanical properties and diminishes their corrosion activity [51,52]. Mg-Ca alloys, as a class of novel biodegradable magnesium alloys, have been recommended in the context of medical implants [53], with the advantage of a density like that of human bone [2,54].
The microstructure of Mg-Ca alloys systems includes α-Mg (hexagonal crystalline structure) and Mg2Ca phase, in which crystalline cell presents double parameter values (a = 0.623, c = 0.1012) compared to those of Mg [55,56,57,58]. The standard electrode potential of Ca is more negative (−2.87 VSHE) than that of Mg and it may be assumed that Ca2+ will be released, originating from the Mg2Ca particles, considered as an anodic active [54,59,60,61,62,63]. However, reports suggest that in 1 M Mg(NO3)2 solution these particles present a less negative potential value (−1.54 VSCE) and therefore, they were considered as cathodic active [64,65]. In the literature, there are controversial results for the electrochemical behavior of the Mg2Ca intermetallic particles present in the matrix of Mg-Ca alloys and there is not a clear justification for their biodegradation mechanism [14,24,33,66,67,68]. It has been noted that the electrochemical activity of Mg2Ca particles needs to be investigated with precision to determine their effect on the biodegradation process of Mg-Ca implants [69,70,71]. Reported research concluded that the addition of a small amount of Ca (up to 2 wt.%) reduced the degradation of Mg, but a further increase of the Ca content led to an increased rate [61,70]. An interesting biological characteristic of the Mg-Ca alloys is that to provide a possible cell adhesion (osteoconductivity) and to stimulate the cell growth on the implant surface [70].
One approach for a significant decrease of the corrosion degradation rate has been the modification of the Mg-Ca0.8 surface by wollastonite (CaSiO3) and β-tricalcium phosphate [Ca3(PO4)2] micro-arc coatings [72,73]. Reported studies compare the degradation behavior of Mg-Ca alloys (0.3, 0.6, and 0.9 %Ca) under physiological conditions, such as the culture medium DMEM glutamax + 10% FBS-Fetal serum bovine + 1% penicillin streptomycin) [74,75,76]. The average grain size has been determined by optical microcopy and reported as: 18.6 ± 1.2 μm (Mg-Ca0.3), 17.6 ± 1.9 µm (Mg-Ca0.6), and 20.5 ± 1.2 μm (Mg-Ca0.9). The best corrosion behavior was showed by Mg-0.3Ca with a mean degradation depth (MDD) value of 0.392 ± 0.08 µm. The Ca content increases the amount of the secondary phase Mg2Ca at the grain boundaries, intensifying the degradation rate in Mg-Ca alloys [74]. Other reports indicate that the extruded Mg-Ca0.8 alloy maintained more than 50% of the initial volume after being used for six months as a tibiae implant in rabbits [77].
The new generation of biomaterials combines bioactivity and biodegradability of their surfaces. The increasing fight against bacterial infections during the surgery requires the development of medical devices and materials with antimicrobial properties [78]. The World Health Organization reports that every four years approximately 350 million illnesses and 190,000 deaths are caused by pathogens that proliferate on the surfaces of medical tools [79]. The bacterial proliferation and its surface adhesion on solids are crucial, caused mainly by the interaction between the solid surface potential (electric charge) and the zeta potential charge of the bacteria cellular surface [80], in an addition to other factors, such as pH of the solution and its chemical composition, the hydrophobicity of the solid surface and ionic strength.
Currently there is a consensus that indicates the importance of the zeta potential and the hydrophobicity of the substrate as physicochemical parameters that control bacterial adhesion on the solid surfaces, governed by van der Waals forces and electrostatic interactions through the double layer of substrate-electrolyte [81,82,83,84,85,86,87,88,89,90]. Results demonstrated an antibacterial effect of Mg on three common aerobic bacterial organisms, as a result of the Mg2+ concentration increase accompanied by an increase of pH of the media [91]. Reported studies suggest that porous coatings may have a strong effect on the antibacterial properties of Mg-based alloys used as implants in orthopedics, also slowing their biodegradation rate [92].
Several studies have revealed the antimicrobial efficiency of Ag-nanoparticles (NPs), although the mechanism of their effect is not yet fully understood [93,94,95,96]. It was suggested that Ag-NPs initially bind to the bacteria cell, altering its permeability and respiration, followed by penetration into and the intracellular release of Ag-ions [97]. The silver exhibits a significant antibacterial action in the dark, where there is no light (within the human body), making this metal an attractive material for biomedical applications [98]. The introduced Ag+ ions within bacteria can affect the production of various enzymes, interrupting their respiratory chain, generating stress in the reactive oxygen species (ROS), as also inhibiting cell signaling and protein synthesis [99,100,101]. The antimicrobial mechanism of Ag-NPs has been explained by the formation of Ag-free radicals, induced in the bacteria cells through perforation of its membrane, resulting in their subsequent death [93,95]. Thus, the deposition of Ag-NPs on Mg-alloys surface could be one approach to provide antimicrobial protection for the implantable medical device surface, to combat associated infections.
The aim of this work is to provide more detailed information on the effect of Ca on the electrochemical degradation process of Mg-Ca0.3 alloy, when exposed to Hank´s physiological solution (at 37 °C) for up to 14 days, compared with that of pure Mg. The change of surface morphology and composition was characterized by SEM-EDS and XPS techniques. The pH of the Hank´s solution and concentration of the released Mg-ions were monitored. Mass losses, potentiodynamic polarization (PDP) curves, EIS diagrams, fluctuations of corrosion current and potential (EN), revealed an additional information. Ag-NPs of different size, electroless deposited on Mg-Ca0.3 surface, were characterized by means of the UV-Vis spectroscopy, SEM-EDS, XRD and the contact angle test. The bacteria S. aureus (Staphylococcus aureus) and E. coli (Escherichia coli) were selected as models of Gram-positive and Gram-negative bacteria for testing the antibacterial properties of the Ag-NPs. The ability to prevent bacteria growth was proved by the agar disk diffusion method (Kirby–Bauer test).

2. Materials and Methods

2.1. Samples and Solution Preparation

Mg (99.9 wt.%) and Mg-Ca alloy (Ca 0.3 wt.% and the balance Mg) were manufactured by an extrusion process and supplied by Helmholtz-Zentrum Hereon, Institute of Materials and Process Design (Geesthacht, Germany) as cylindrical bars (diameter = 1 cm). The nominal composition (wt.%) is presented in Table 1, according to the manufacturer. The tested materials were cut into a 3-mm thick discs; some of them were used for the immersion test, while others were prepared as electrodes for electrochemical experiments. All samples were abraded with SiC paper to 4000 grit, using ethanol as a lubricant, and then sonicated in ethanol for 5 min and dried in air at room temperature.
Hank’s physiological solution was prepared with the following analytical grade reagents: NaCl 8.0 g L−1, glucose 1.0 g L−1, NaHCO3 0.35 g L−1, and KCl 0.30 g L−1; in a low content: KH2PO4, MgSO4·7H2O, MgCl2·6H2O, CaCl2, and ultrapure deionized water (18.2 MΩ·cm) [102,103,104]. The initial pH of the newly formed solution was 7.2.

2.2. Immersion Test and Surface Characterization

The Mg and the Mg-Ca0.3 alloy samples (in triplicate) were submerged in 20 mL of Hank’s physiological solution at 37 °C, in independent containers (with a daily renewal of electrolyte) for 14 days, according to the ISO 16428 [102] and ASTM G31-12a [105] standards. The residual solutions were stored to measure their pH by a pH meter and the concentration of the released Mg2+ ions by photometry (HI83200, Hanna Instruments, Woonsocket, RI, USA). At the end of each exposure period, the samples were removed, rinsed with deionized water, and dried in air at room temperature. To evaluate the mass loss and the corrosion damage on the surface after each exposure period, the formed layer of products was chemically removed, according to the standards ASTM G1-03 [106], using the solution of 200 g L−1 CrO3, 10 g L−1 AgNO3, and 20 g L−1 Ba(NO3)2. The values of initial mass w0 and final mass w1 were measured by an analytical balance (VE-204, Velab, CDMX, México) and then the mass loss was calculated (∆m = w1 − w0).
The morphology and composition of the layers formed on the Mg and Mg-Ca0.3 surfaces, before and after exposure to Hank’s physiological solution, were characterized by: SEM-EDS (SEM-EDS, XL-30 ESEM-JEOL JSM-7600F, JEOL Ltd., Tokyo, Japan) and XPS (K-Alpha Surface Analyzer, Thermo Scientific, Waltham, MA, USA), after sputtering the specimens’ surface with a scanning argon-ion during 15 s. The binding energies of all XPS spectra were normalized to the C1s peak at 284.8 eV. The crystalline phases of the formed products were identified by X-ray diffraction technique (Siemens, D-500, Munich, Germany) with Bragg-Brentano geometry, 25° to 40° 2θ angle, radiation Cukα and 34 kV/25 mA.

2.3. Electrochemical Characterization

Several electrochemical methods were carried out to study the corrosion process of Mg and Mg-Ca0.3 in Hank’s solution: registration of the free corrosion potential (open circuit potential, OCP), potentiodynamic polarization curves (PDP), and electrochemical impedance spectroscopy (EIS). Mg and Mg-Ca0.3 samples were elaborated as working electrodes (0.78 cm2) in a typical three-electrode cell configuration, inside a Faraday cage. A Pt mesh (Alfa Aesar, Ward Hill, MA, USA) was used as an auxiliary electrode and a saturated calomel electrode (SCE) as a reference electrode (SCE, Gamry Instruments, Philadelphia, PA, USA). The electrodes were connected to a potentiostat/galvanostat/ZRA Interface-1000E (Gamry Instruments, Philadelphia, PA, USA). The PDP curves (vs. OCP) were recorded at a scanning rate of 10 mV s−1, in a potential range from −1 V to +1 V. The EIS spectra were acquired for 24 h of immersion in Hank’s solution, employing a perturbation amplitude of ±5 mV vs. OCP (1 h to stabilize), in a frequency interval of 100 kHz to 10 mHz. The obtained EIS data were analyzed with the Gamry Echem Analyst® software (Gamry Instruments, version 7.0.1, Philadelphia, PA, USA).
The spontaneous corrosion current fluctuations considered as electrochemical noise (EN) were associated with the corrosion phenomena and were measured according to ASTM G199-09 [107], employing two identical working electrodes and SCE reference electrode, all connected to the potentiostat in zero resistance ammeter mode (ZRA). The data were examined with Electrochemical Signal Analyzer® (Gamry Instruments, V.7.0.1, Philadelphia, PA, USA), then transformed to the frequency domain by fast Fourier transform (FFT) in order to analyze their power spectral density (PSD) [108,109]. The values of the β-slope (an exponent of PSD plots) were used to characterize the dynamics of the corrosion process. All experiments were carried out at room temperature at 21 °C.

2.4. Electroless Deposition of Ag-NPs on Mg-Ca0.3 Surface and Characterization

The Ag-NPs were electroless deposited on Mg-Ca0.3 surface (0.78 cm2), by immersion (t = 1 min, 3 min and 6 min) in solutions of AgNO3 (10−3 M and 10−2 M) and ultrapure deionized water (18.2 MΩ·cm) at 21 °C. Due to the very negative potential of metallic Mg, the silver ions are spontaneously reduced during the typical process known as electroless deposition (ELD) [110,111]. The Ag-NPs were characterized by UV-Vis technique (AVASpec 2048, AVANTES, Eerbeek, The Netherlands), SEM-EDS, XRD, and contact angle test (Drop Shape Analyzer DSA25, KRÜSS, Hamburg, Germany).

2.5. Characterization of Antibacterial Properties of Ag-NPs Deposits on Mg-Ca0.3 Surface

2.5.1. Zeta Potential Measurement of Bacteria

The zeta potential (NANO ZEN 3600, Malvern Instruments Ltd., Worcestershire, UK) of E. coli and S. aureus bacteria in Muller-Hinton culture medium (at 21.5 °C) was measured at different pH values by auto-titration (MPT-2, Malvern Instruments Ltd., Worcestershire, UK), to better understand their interactions with sample surfaces. The titrants were solutions of 0.1 and 0.5 mol L−1 of NaOH or 0.5 mol L−1 of HCl. Zeta potential values are the average of triplicate measurements for each pH value.

2.5.2. Agar Disk Diffusion Antibacterial Test (Kirby–Bauer Method)

The antibacterial effect of Ag-NPs was evaluated with the Gram-positive bacteria S. aureus ATCC 6538 and Gram-negative bacteria E. coli ATCC 25922. Nutrient broth and Mueller-Hinton agar were used as the non-selective medium that promote bacterial growth. The antibacterial agar disk-diffusion method (Kirby–Bauer method) [112,113,114] was carried out, which consists of initial inoculation of a bacteria spread layer (100 μm) on the agar disk. The suspensions with bacteria were adjusted by optical density (spectrophotometry) at 625 nm, in order to match the turbidity equivalent to the 0.5 McFarland standard (1.5 × 10⁸ CFU mL−1) and adjusted to 1.5 × 10⁻⁶ CFU mL−1 by serial dilutions. All samples were sterilized with ethyl alcohol and placed in a box with ultraviolet light for 1 h, as well as all glassware were sterilized in an autoclave at 121 °C and 15 psi (for 20 min). The samples of the Mg-Ca0.3 alloy without and with deposit of Ag-NPs, were placed on the agar disk and incubated at 37 °C for 24 h. The diameter of the inhibition halo around the alloys, where the bacteria did not grow, was then measured and compared. The antimicrobial tests were performed inside an incubator, in the dark, and the results are the average of three separate tests corresponding to different days.

3. Results and Discussion

3.1. Surface Characterization of Mg and Mg-Ca0.3

Figure 1 compares SEM images (2000×) of freshly polished reference surfaces of Mg (Figure 1A) and Mg-Ca0.3 (Figure 1B) samples.
The EDS analysis of sites (labeled as 1, 2, 3, and 4) is presented in Figure 1C, as also the suggested compounds of MgO (site 3) and Mg2Ca particles (site 4), reported by metallurgical studies [61,115,116,117]. The XRD spectra of the Mg-Ca0.3 surface is shown in Figure 1D,E, presenting the α-Mg matrix (HCP Mg-JCPDS #350821) and the intermetallic phase of Mg2Ca [61,62]. MgO was not detected and according to study [118], this phase appears as amorphous under environmental conditions.

3.2. Test Solution Monitoring and Mass Loss Measurement

Figure 2A shows the change in time of the Hank’s solution pH (with renewal every 24 h), during the exposure of Mg and Mg-Ca0.3 samples up to 14 days, as well as the concentration of the released Mg2+ ions and the mass loss Δm of the samples are presented in Figure 2B. The pH of Hank’s solution showed increasing and decreasing tendencies, which were influenced by the formation of OH ions (Equations (2) and (3)) and the evolution of H2 (Equation (1)) during the corrosion process. Consequently, when the pH solution was shifted to more alkaline values, the precipitation of Mg(OH)2 corrosion product was favored. On the other hand, the glucose [CH2OH(CHOH)4CHO], which is a part of Hank’s solution (1.00 g L−1), can be rapidly transformed into gluconic acid [CH2OH(CHOH)4COOH], which acidifies the electrolyte and causes partial destruction of the Mg(OH)2 film [118]. It has been reported that the gluconic acid promotes the growth of the hydroxyapatite layer, due to the chelation reaction with Ca2+ ions [117]. However, the influence of glucose has not yet been clarified. Previous works [119,120] suggested that the lowering in the pH may greatly affect the Mg degradation process under the conditions of physiological environments.
At the end of the experiment (14 days), the pH of Hank´s solution reached alkaline value of ~8.3 for Mg samples, while that of Mg-Ca0.3 the value decreased to pH ~6.3 (Figure 2A). The values of mass loss (Δm) and concentration of the released Mg2+ ions (Figure 2B) were a consequence of the change in pH over time. Therefore, after 14 days of immersion in Hank’s solution, the mass loss of Mg-Ca0.3 (3.76 mg cm−2) was ~20% lower than that of the Mg samples (4.66 mg cm−2). The concentration of released Mg2+ ions was 3.65 times lower for the Mg-Ca0.3 alloy than that for Mg. It can be suggested that a fraction of the mass loss and concentration of released Mg2+ ions are the result of attacks by Cl ions and formation of soluble MgCl2 (Equations (4) and (5)). However, it may also consider the chelating effect of gluconic acid, forming compounds with the Mg2+ ion, contributing to the reduction of MgCl2 generation [121]. The pH change over time, the Δm, and the concentration of the released Mg2+ ions allowed us to consider the positive effect of Ca in the Mg-Ca0.3 alloy, presenting lower electrochemical activity than that of Mg.

3.3. Surface Characterization after Exposure to Hank’s Solution

3.3.1. SEM-EDS Analysis
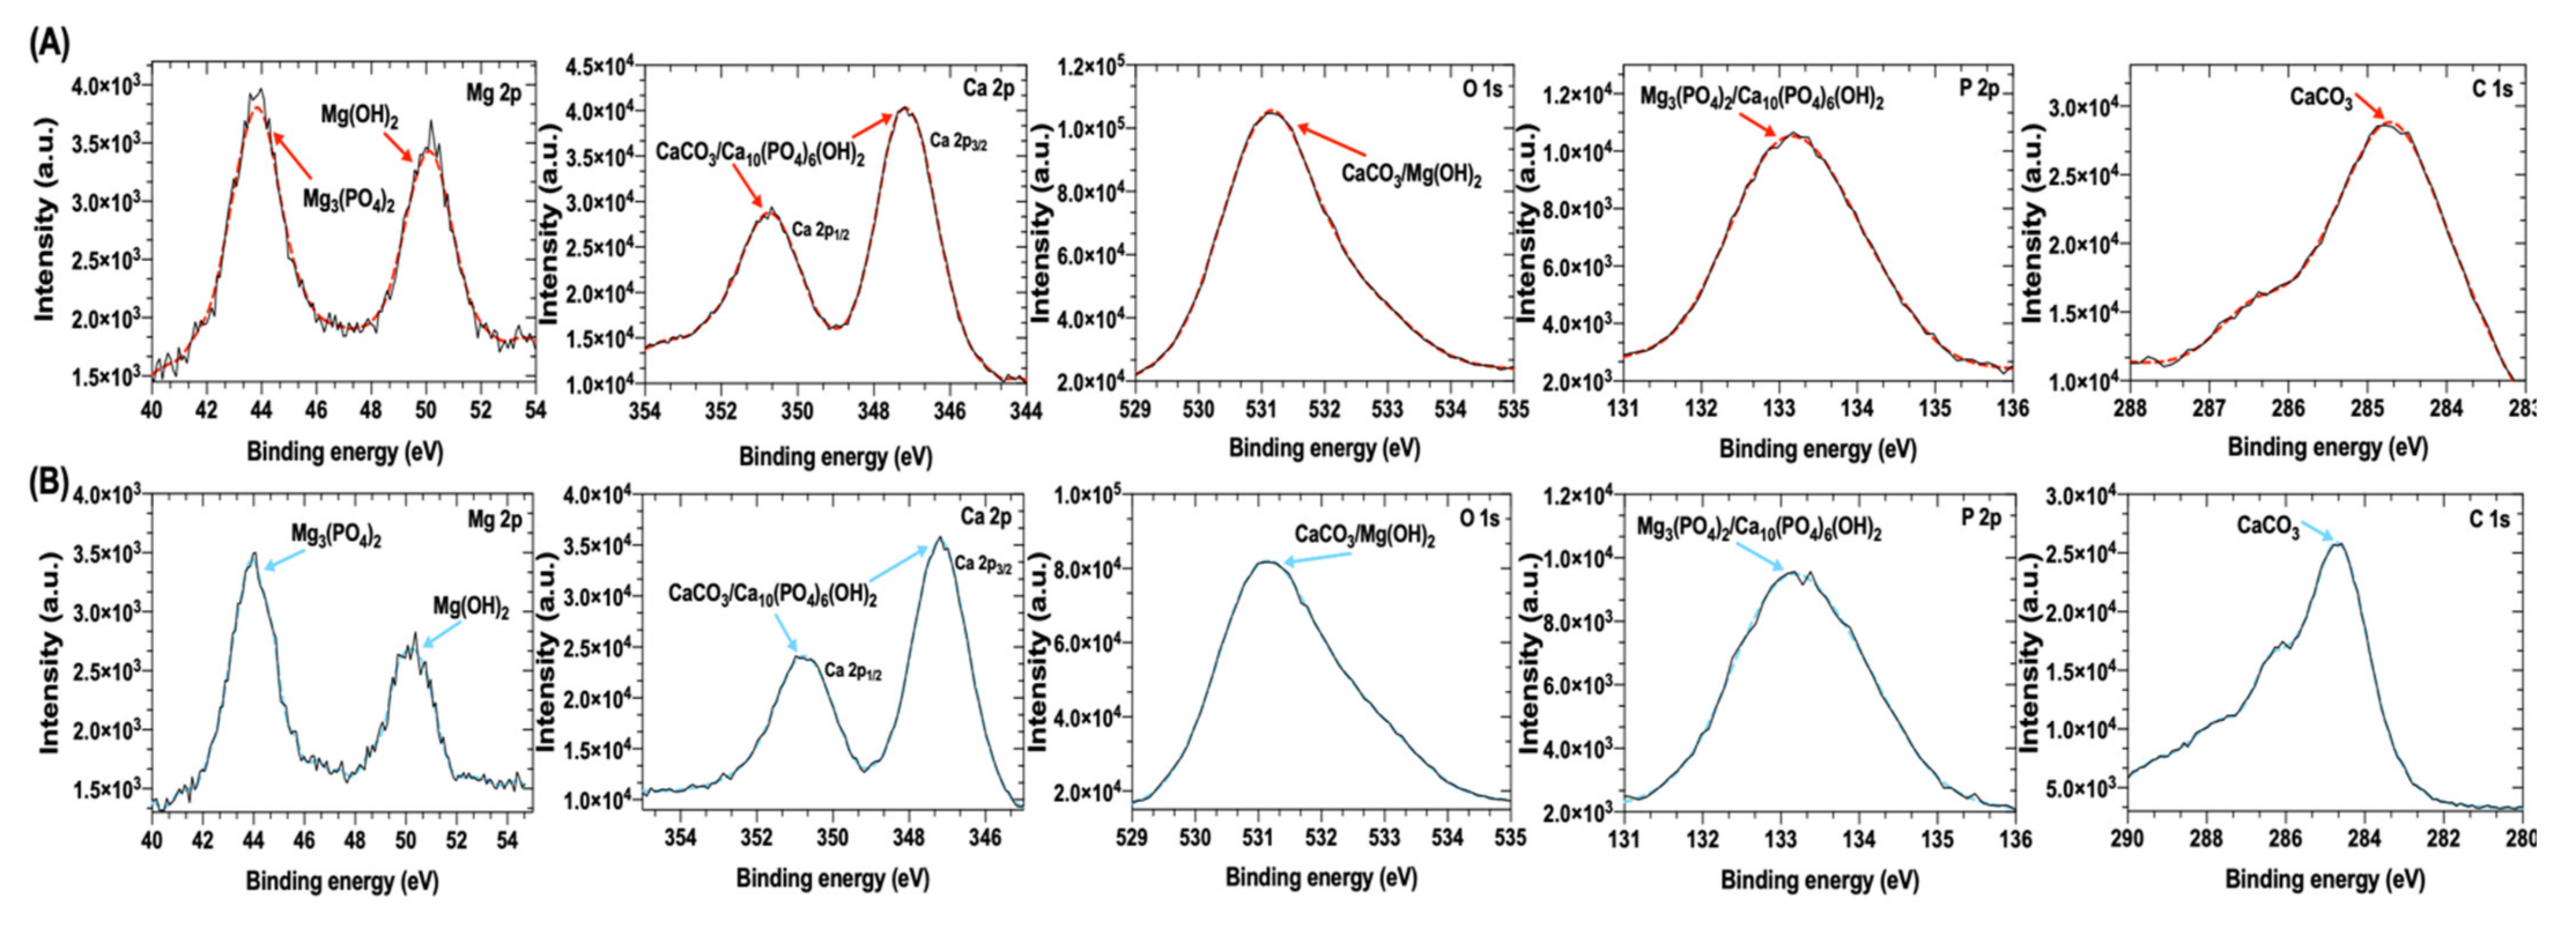
After exposure to Hank’s solution for 14 days, the Mg (Figure 3A) and Mg-Ca0.3 (Figure 3B) surfaces showed cracked layers. These cracks can connect the α-Mg with Hank’s solution, improving the release of Mg2+ ions and the evolution of the H2 bubble. The pressure of H2 bubbles may cause cracks or fractures in the layers.
According to the EDS analysis, the main elements on Mg-Ca0.3 alloy surfaces are Mg, O, and Ca, and Cu, Al, Fe, Ni, and Zn (Table 1) appear in small amounts (below 1% wt.), which may present cathodic activity, being effective sites for hydrogen evolution [122]. After the removal of the formed layers, the cross-sectional images (Figure 3C,D) revealed that the corrosion attacks have been less aggressive in depth, ~5.5 times in Mg-Ca0.3 surface (Figure 3D) than those in Mg (Figure 3C). It is also evident that the localized attacks have been more pronounced on the Mg surface (Figure 3E) than those on the Mg-Ca0.3 surface (Figure 3F). The EDS analysis (Figure 4) indicated that the layers formed after immersion in Hank’s solution for 14 days contained a very low content of Na and Cl. The presence of P element, could be considered as a part of the formed Mg3(PO4)2 and as well as participating in the compound Ca10(PO4)6(OH)2 (hydroxyapatite), originated from the Hank’s solution [119,120].
The intermetallic Mg2Ca particles appeared on the surface of Mg-Ca0.3 (Figure 3F, sites 9 and 10) even after the removal of the formed layers, suggesting their role as local cathodic sites. The obtained results allow concluding the positive effect of Ca, as a part of the Mg-Ca0.3 alloy, which contributed to its lower level of degradation.

3.3.2. XPS Analysis

The XPS spectrum analysis (Figure 5) was performed as a complementary information, in order to correlate with the EDS elemental composition analysis of the layers grown on the Mg and Mg-Ca0.3 surfaces after exposure for 14 days to Hank’s physiological solution. The high-resolution spectra revealed the presence of Mg, Ca, O, C, P, Cl, and Na elements. The main peaks of Mg2p (at 50.28 eV) and O1s (at 531.48 eV) were associated with Mg(OH)2 compound [123,124,125]. The secondary peak of Mg2p (at 44.98 eV), together with the peaks of P2p (at 133.43 eV) and Ca2p (at 347.51 and 351.18 eV) were attributed to Mg3(PO4)2 and calcium phosphate [Ca10(PO4)6(OH)2] compounds. The peaks C1s and O1s were considered as a part of CaCO3, originated from the Hank’s solution [125,126,127,128].
The intensity level of the XPS peaks, presenting the spectra of Mg-Ca0.3 surfaces, was lower than that of the peaks of XPS spectra of the Mg surface, suggesting a difference in the formed layers after exposure for 14 days to Hank´s solution. The decrease in content of the compounds formed on the Mg and Mg-Ca0.3 is as follows: Ca10(PO4)6(OH)2 > Mg3(PO4)2 > Mg(OH)2 > CaCO3. Due to the low solubility of Mg3(PO4)2 (1.64 × 10⁻³ g L−1) and Ca10(PO4)6(OH)2 (4.38 × 10⁻² g L−1). It is considered that these compounds appeared, since they are thermodynamically more stable than other types of phosphates in aqueous solutions; these compounds are suitable for the regeneration of human bone [129].

3.4. Electrochemical Measurements

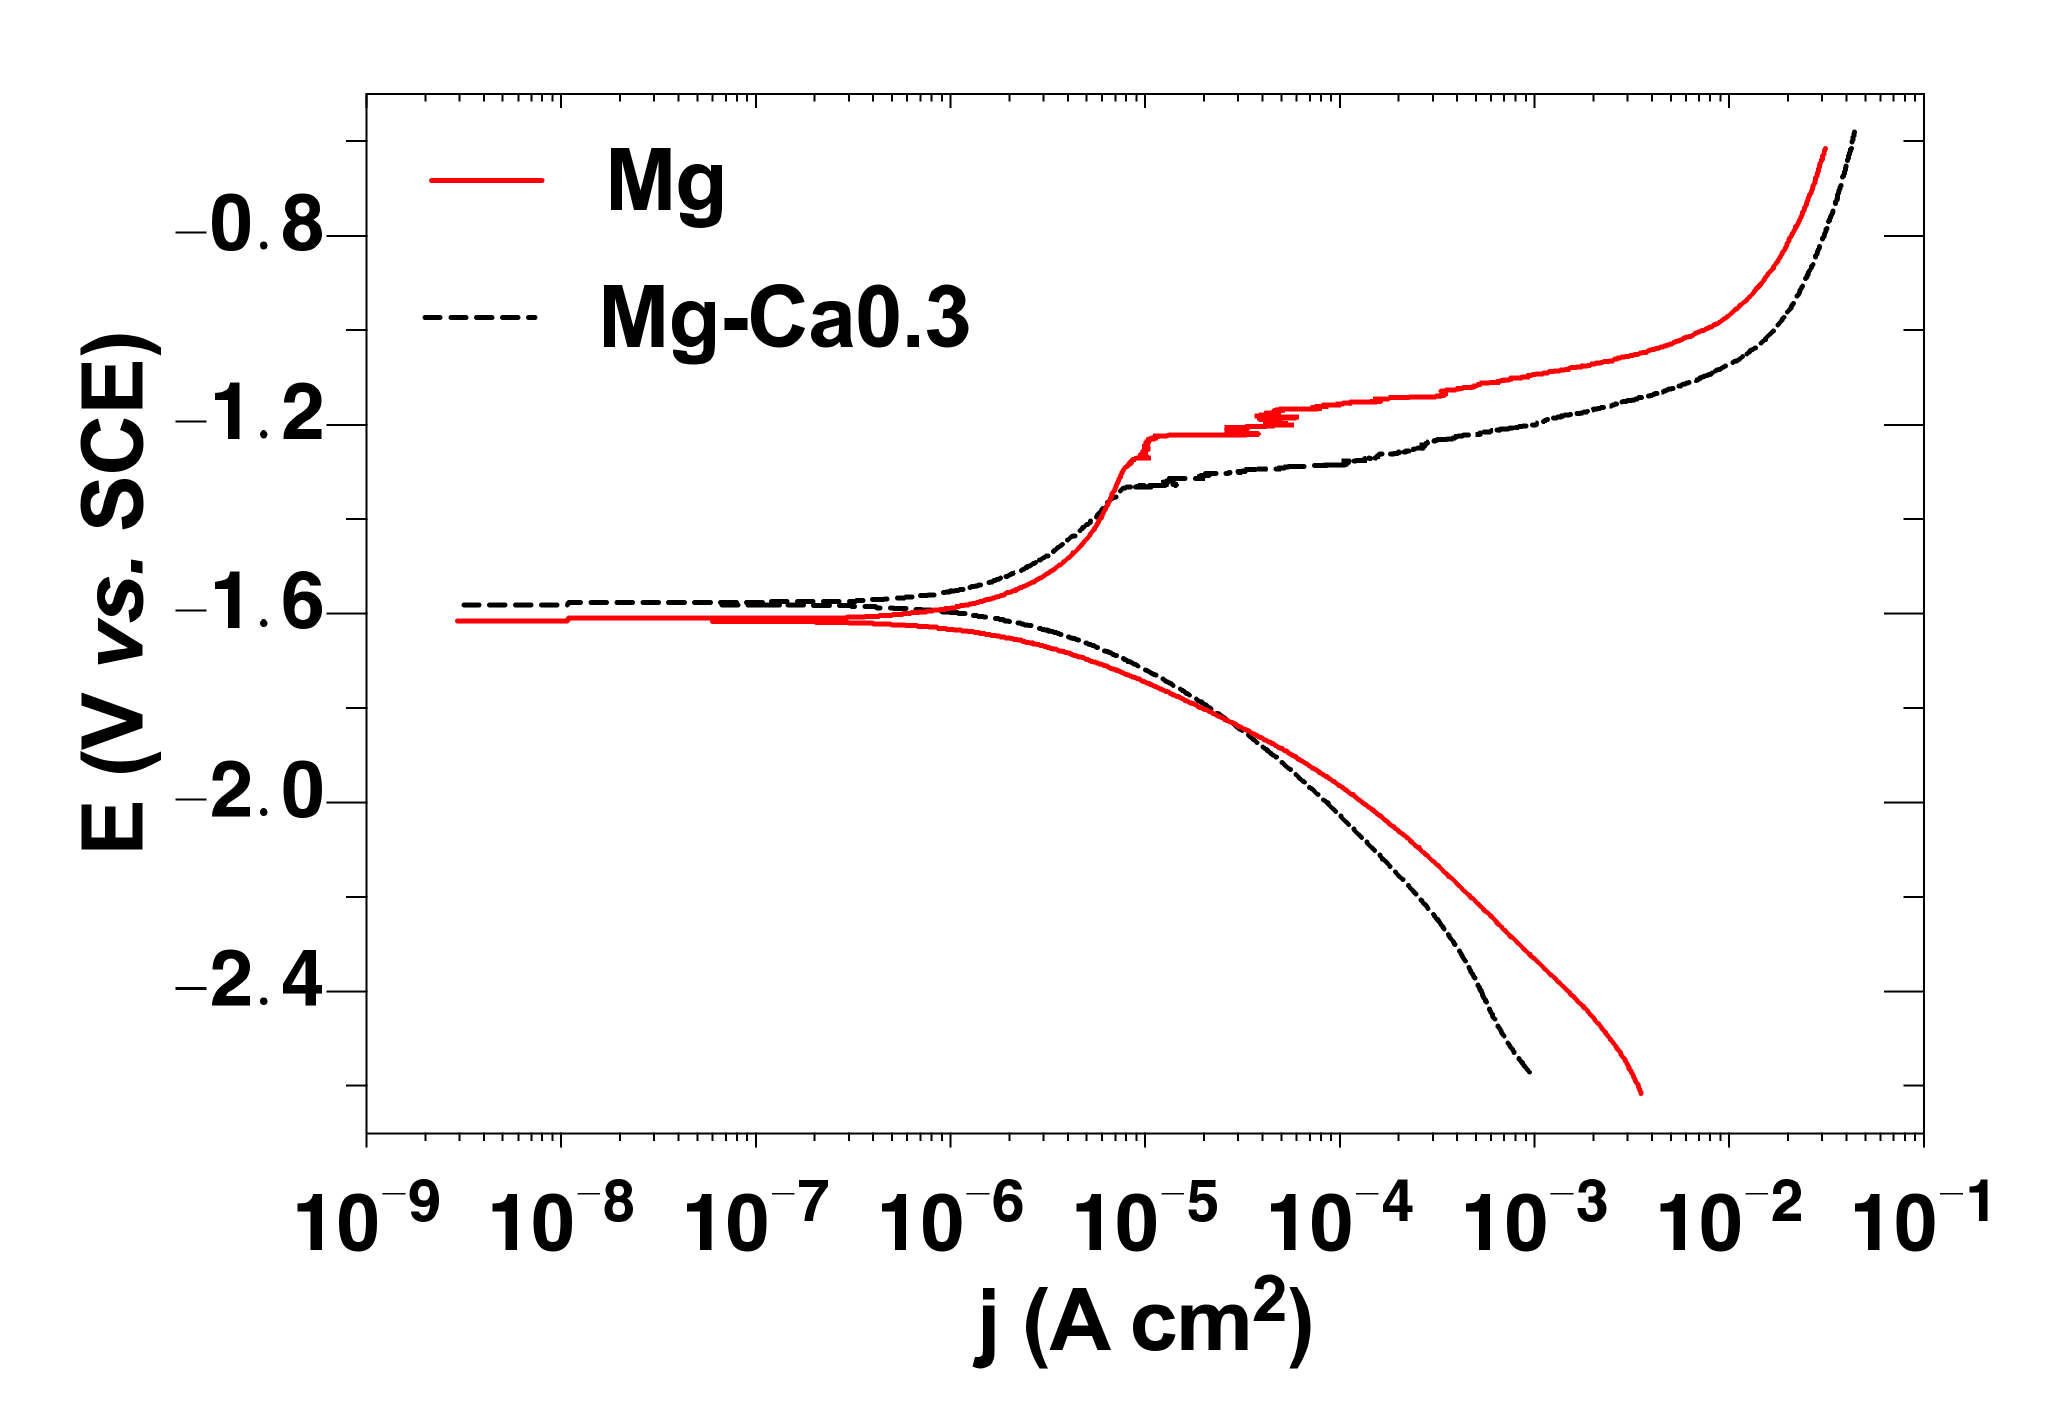
3.4.1. Potentiodynamic Polarization Curves (PDP)

Figure 6 shows the PDP curves after 24 h of immersion in Hank’s solution. The cathodic branches have a kinetics controlled by the activation process, while the anodic branches tended to reach a limiting current value related to a barrier effect of the formed corrosion layers on the Mg and Mg-Ca0.3 surfaces. The followed strong increase in the anodic current was attributed to the chloride ions, which transformed the insoluble compound of Mg(OH)2 to soluble MgCl2. The tendency to the next limiting current (at a higher anodic polarization) could be related to the formation of phosphate and carbonate salts on the surfaces, which may act as protective layers, reducing the speed of the anodic process [130,131,132].
Both limiting anodic current values of Mg-Ca0.3, presenting two surface states, seem to be lower than those of Mg, as well also the cathodic current values. The corrosion potential and current density (jcorr) were not calculated by Tafel extrapolation because the presence of precise linear Tafel regions in the PDP curves was not considered. According to the procedure of ASTM G102-89 [133], the value of the polarization resistance (Rp) was estimated from the anodic branch at a polarization of ±5 mV, as well as the respective value of corrosion current density jcorr (ΔE/ΔI). The “apparent” Tafel constant (B’) was calculated through the Stern–Geary relation:
j c o r r = B R p
Table 2 presents the values of Rp, “apparent” Tafel constant (B’) and the calculated mass loss rate (MR) [133]:
M R = K · j c o r r · E W
where K is a constant (8.954 × 10⁻³), and EW is the approximate equivalent weight of the samples (~11.17 for Mg).
The higher value of Mg-Ca0.3 polarization resistance (Rp) to the corrosion process, compared to that of Mg (Table 2) has led to lower values of jcorr and MR. These facts suggest the positive effect of Ca as a part of the Mg-alloy, although of a very low content (0.3 wt.%).

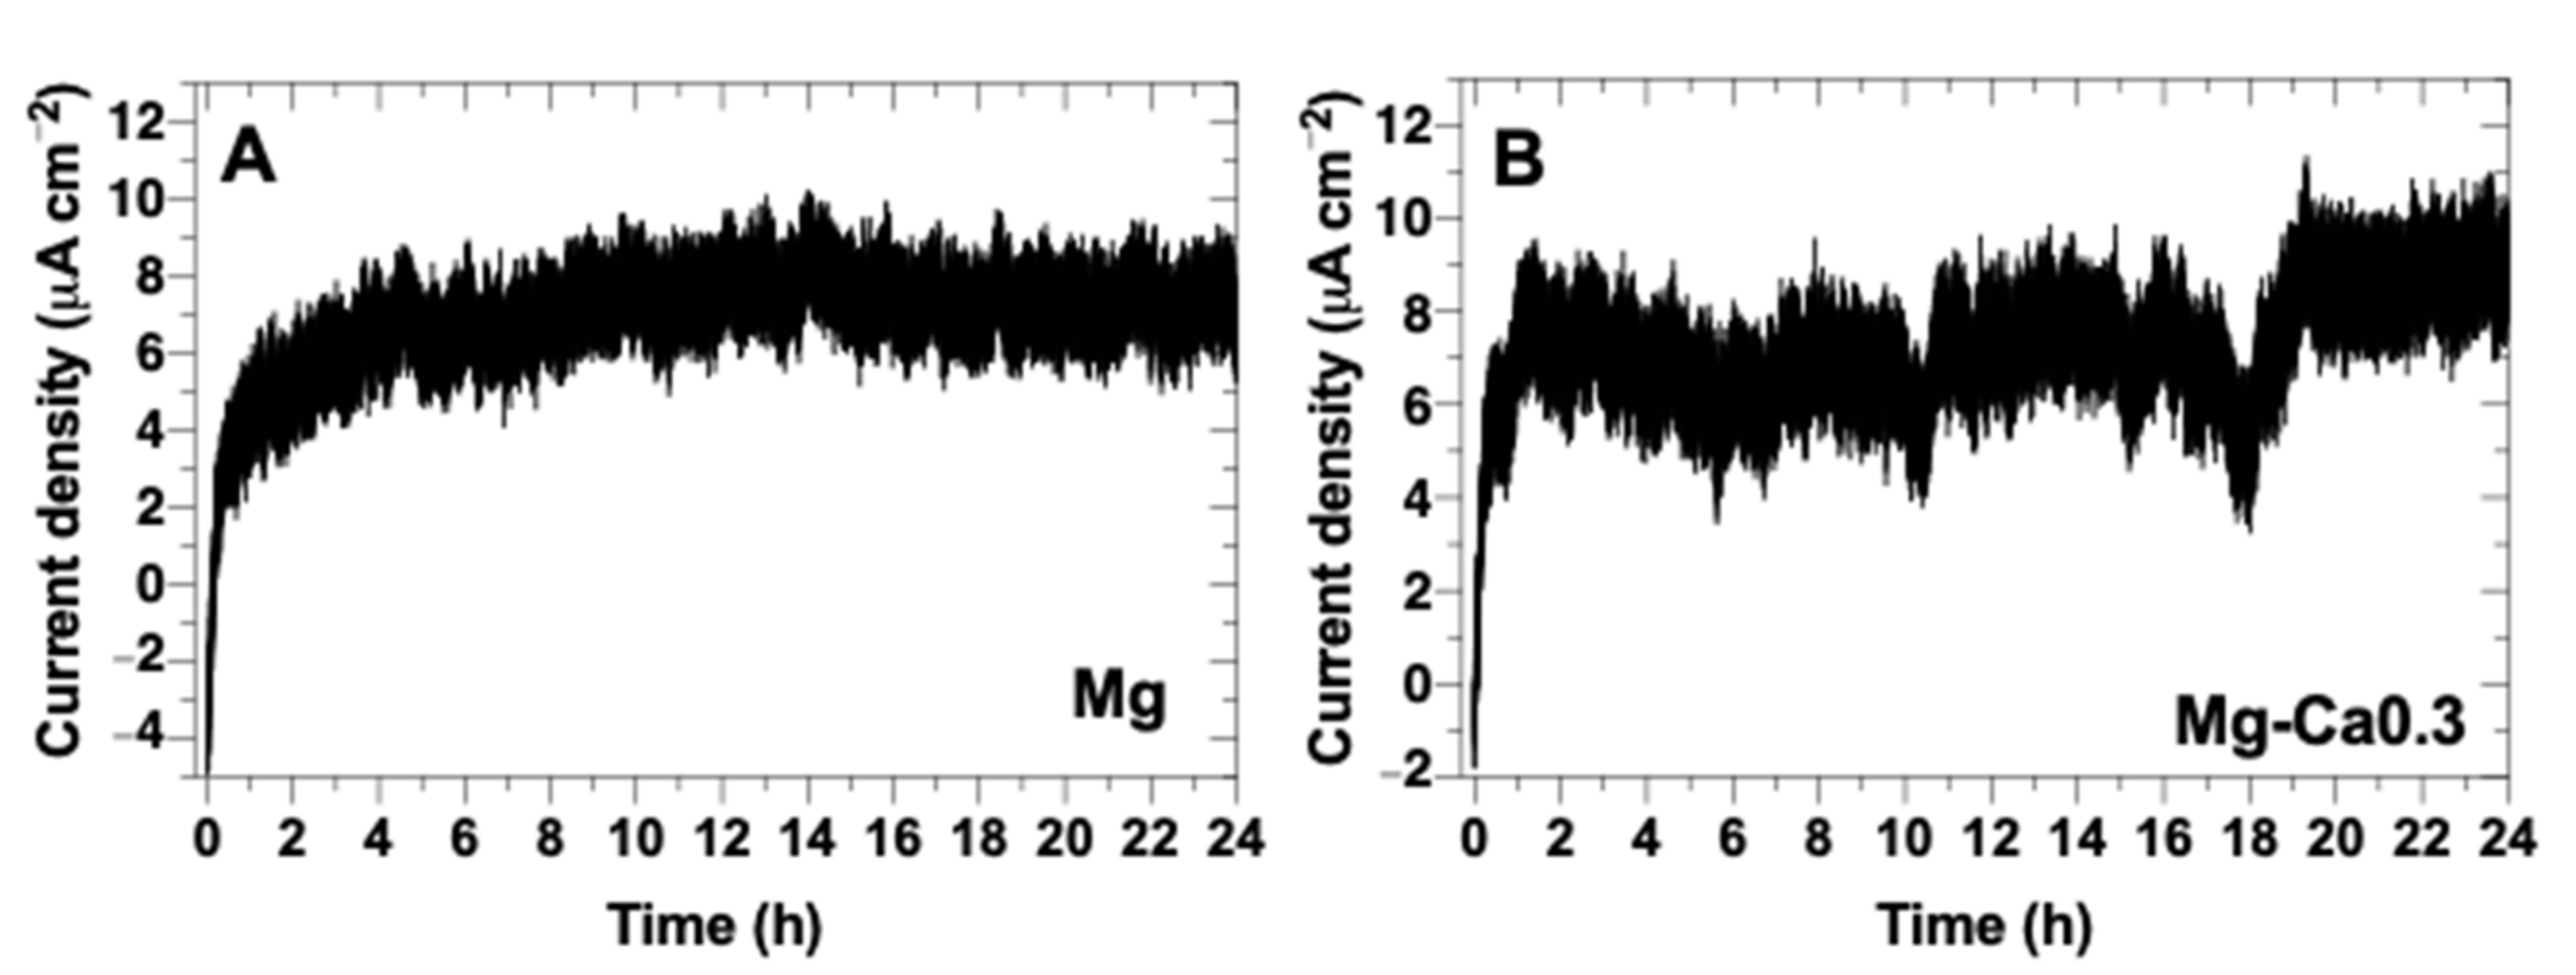
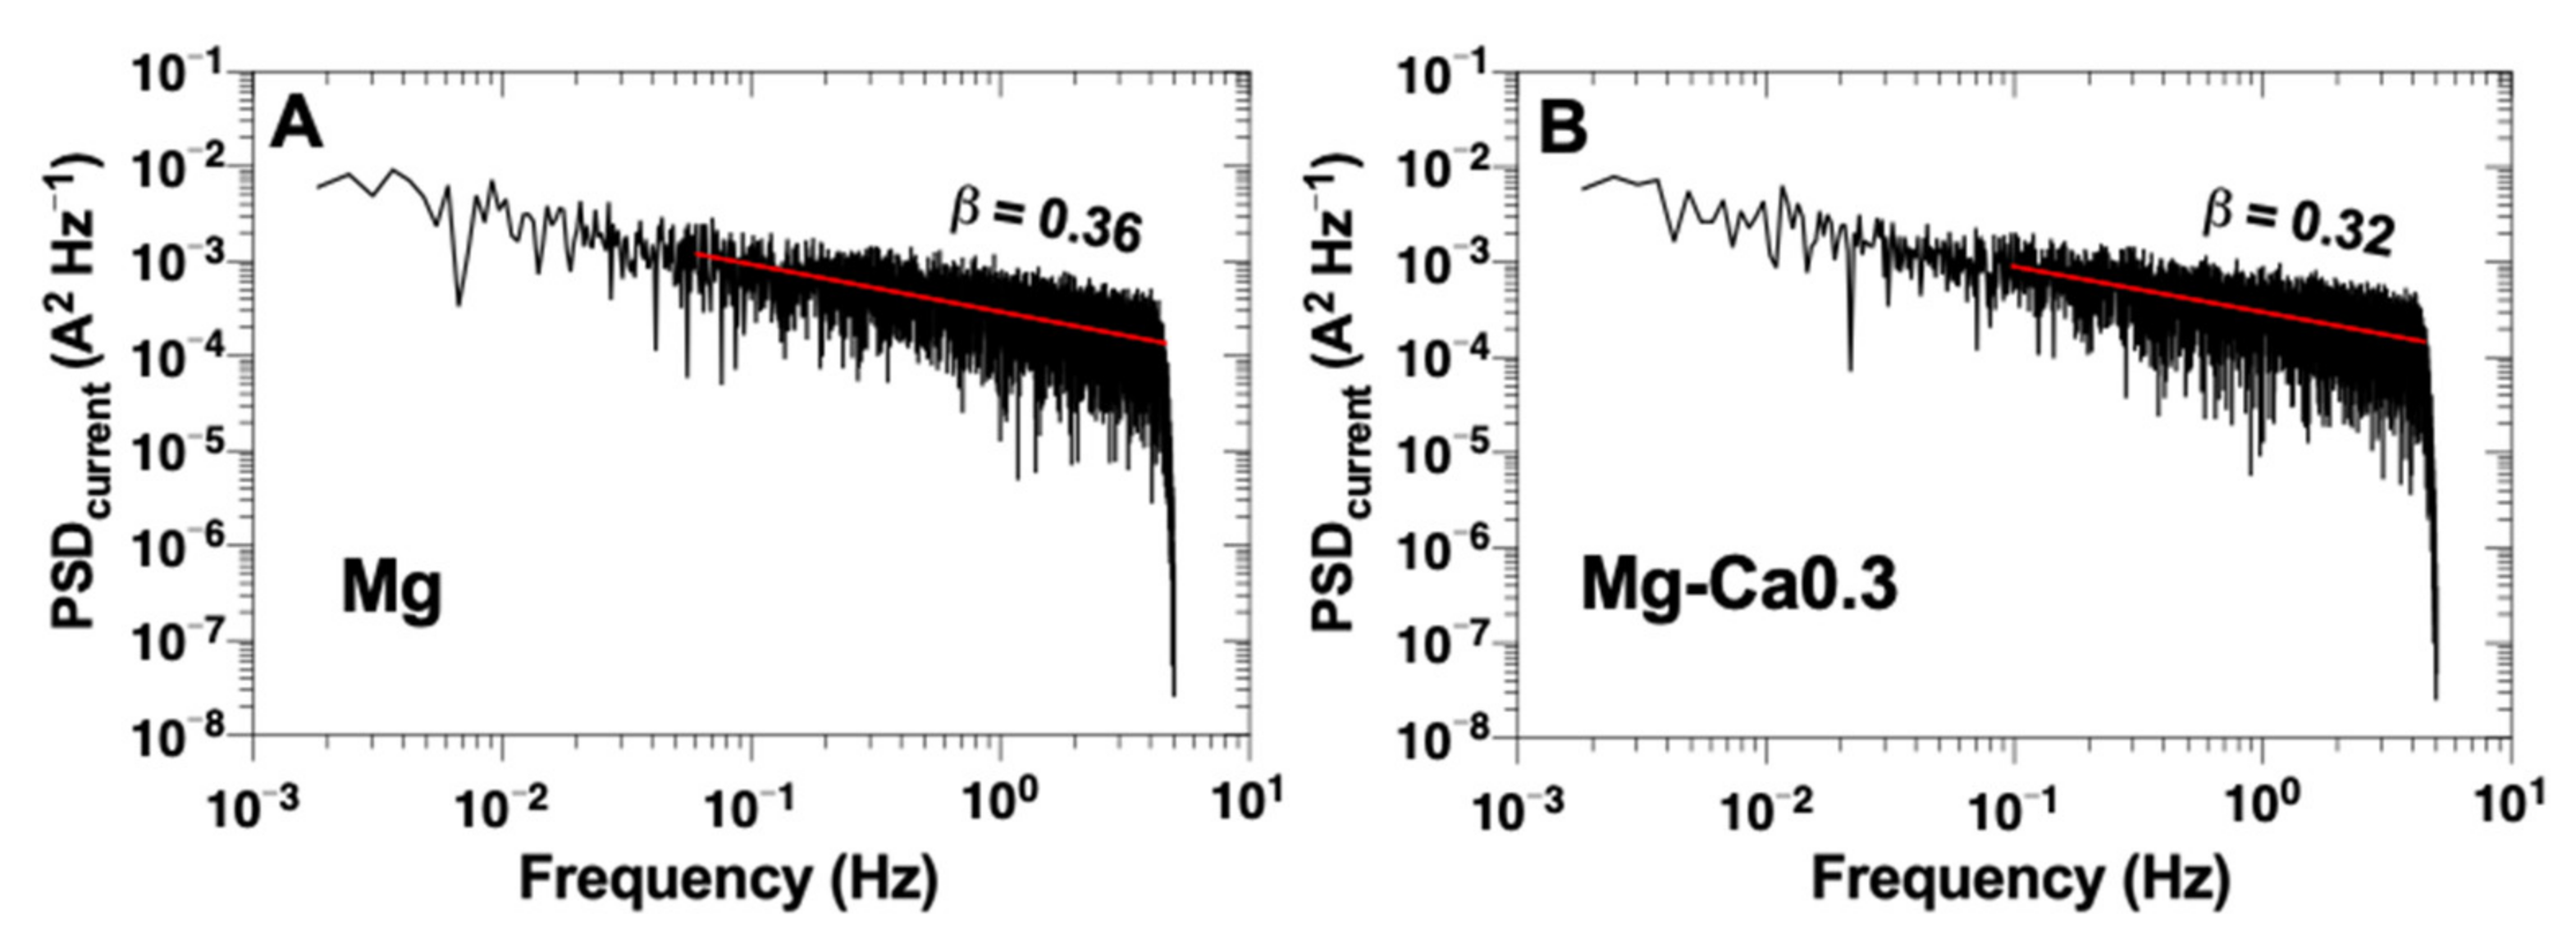
3.4.2. Electrochemical Noise (EN) Analysis

The spontaneous fluctuations of the current density of Mg and Mg-Ca0.3 at low amplidute, during 24 h of exposure to Hank’s solution, are presented in Figure 7. They may be considered as an electrochemical noise (EN), resulting in variations in the kinetics of the electrochemical corrosion process [134,135,136]. The EN resistance (Rn) values were estimated, suggesting as similar to the resistance to polarization (Rp) and inversely proportional to the corrosion rate (controlled by charge transfer) [136,137,138]. The Rn value of Mg-Ca0.3 was 3.42 kΩ cm2, which is 5.5 times greater than that of Mg (0.62 kΩ cm2), indicating that the product layer formed on Mg-Ca0.3 is more protective against corrosion after 24 h explosion in Hank’s physiological solution at 21 °C.
The pitting index (PI) was calculated (Equation (7)) to compare the localized corrosion susceptibility of the samples:
PI = σ i · i R N C 1
where σi and 𝑖RNC are the standard deviation and the root mean square of current noise, respectively.
The PI was 0.06 for Mg-Ca0.3 and 0.11 for Mg, both materials do not present localized corrosion (<0.06), according to ASTM G199-09 [107]. However, the cross-sectional SEM images (Figure 3C,D) and those of the surfaces after the formed layer removal (Figure 3E,F), showed that the corrosion attacks are more localized on the surface of the Mg and more uniform on Mg-Ca0.3. The EN data were analyzed in the domain of time and frequency, in order to characterize the dynamin of the corrosion process. The Figure 8 shows the power spectral density (PDS) of the corrosion current as a function of low frequencies (10−2 Hz–1 Hz), obtained by the fast Fourier transform (FFT) method. The extracted exponent (β slope) values were 0.36 for Mg and 0.32 for Mg-Ca0.3, which correspond to the fractional Gaussian noise (fGn: −1 < β < 1), classifying the corrosion process as persistent processes [139,140,141].

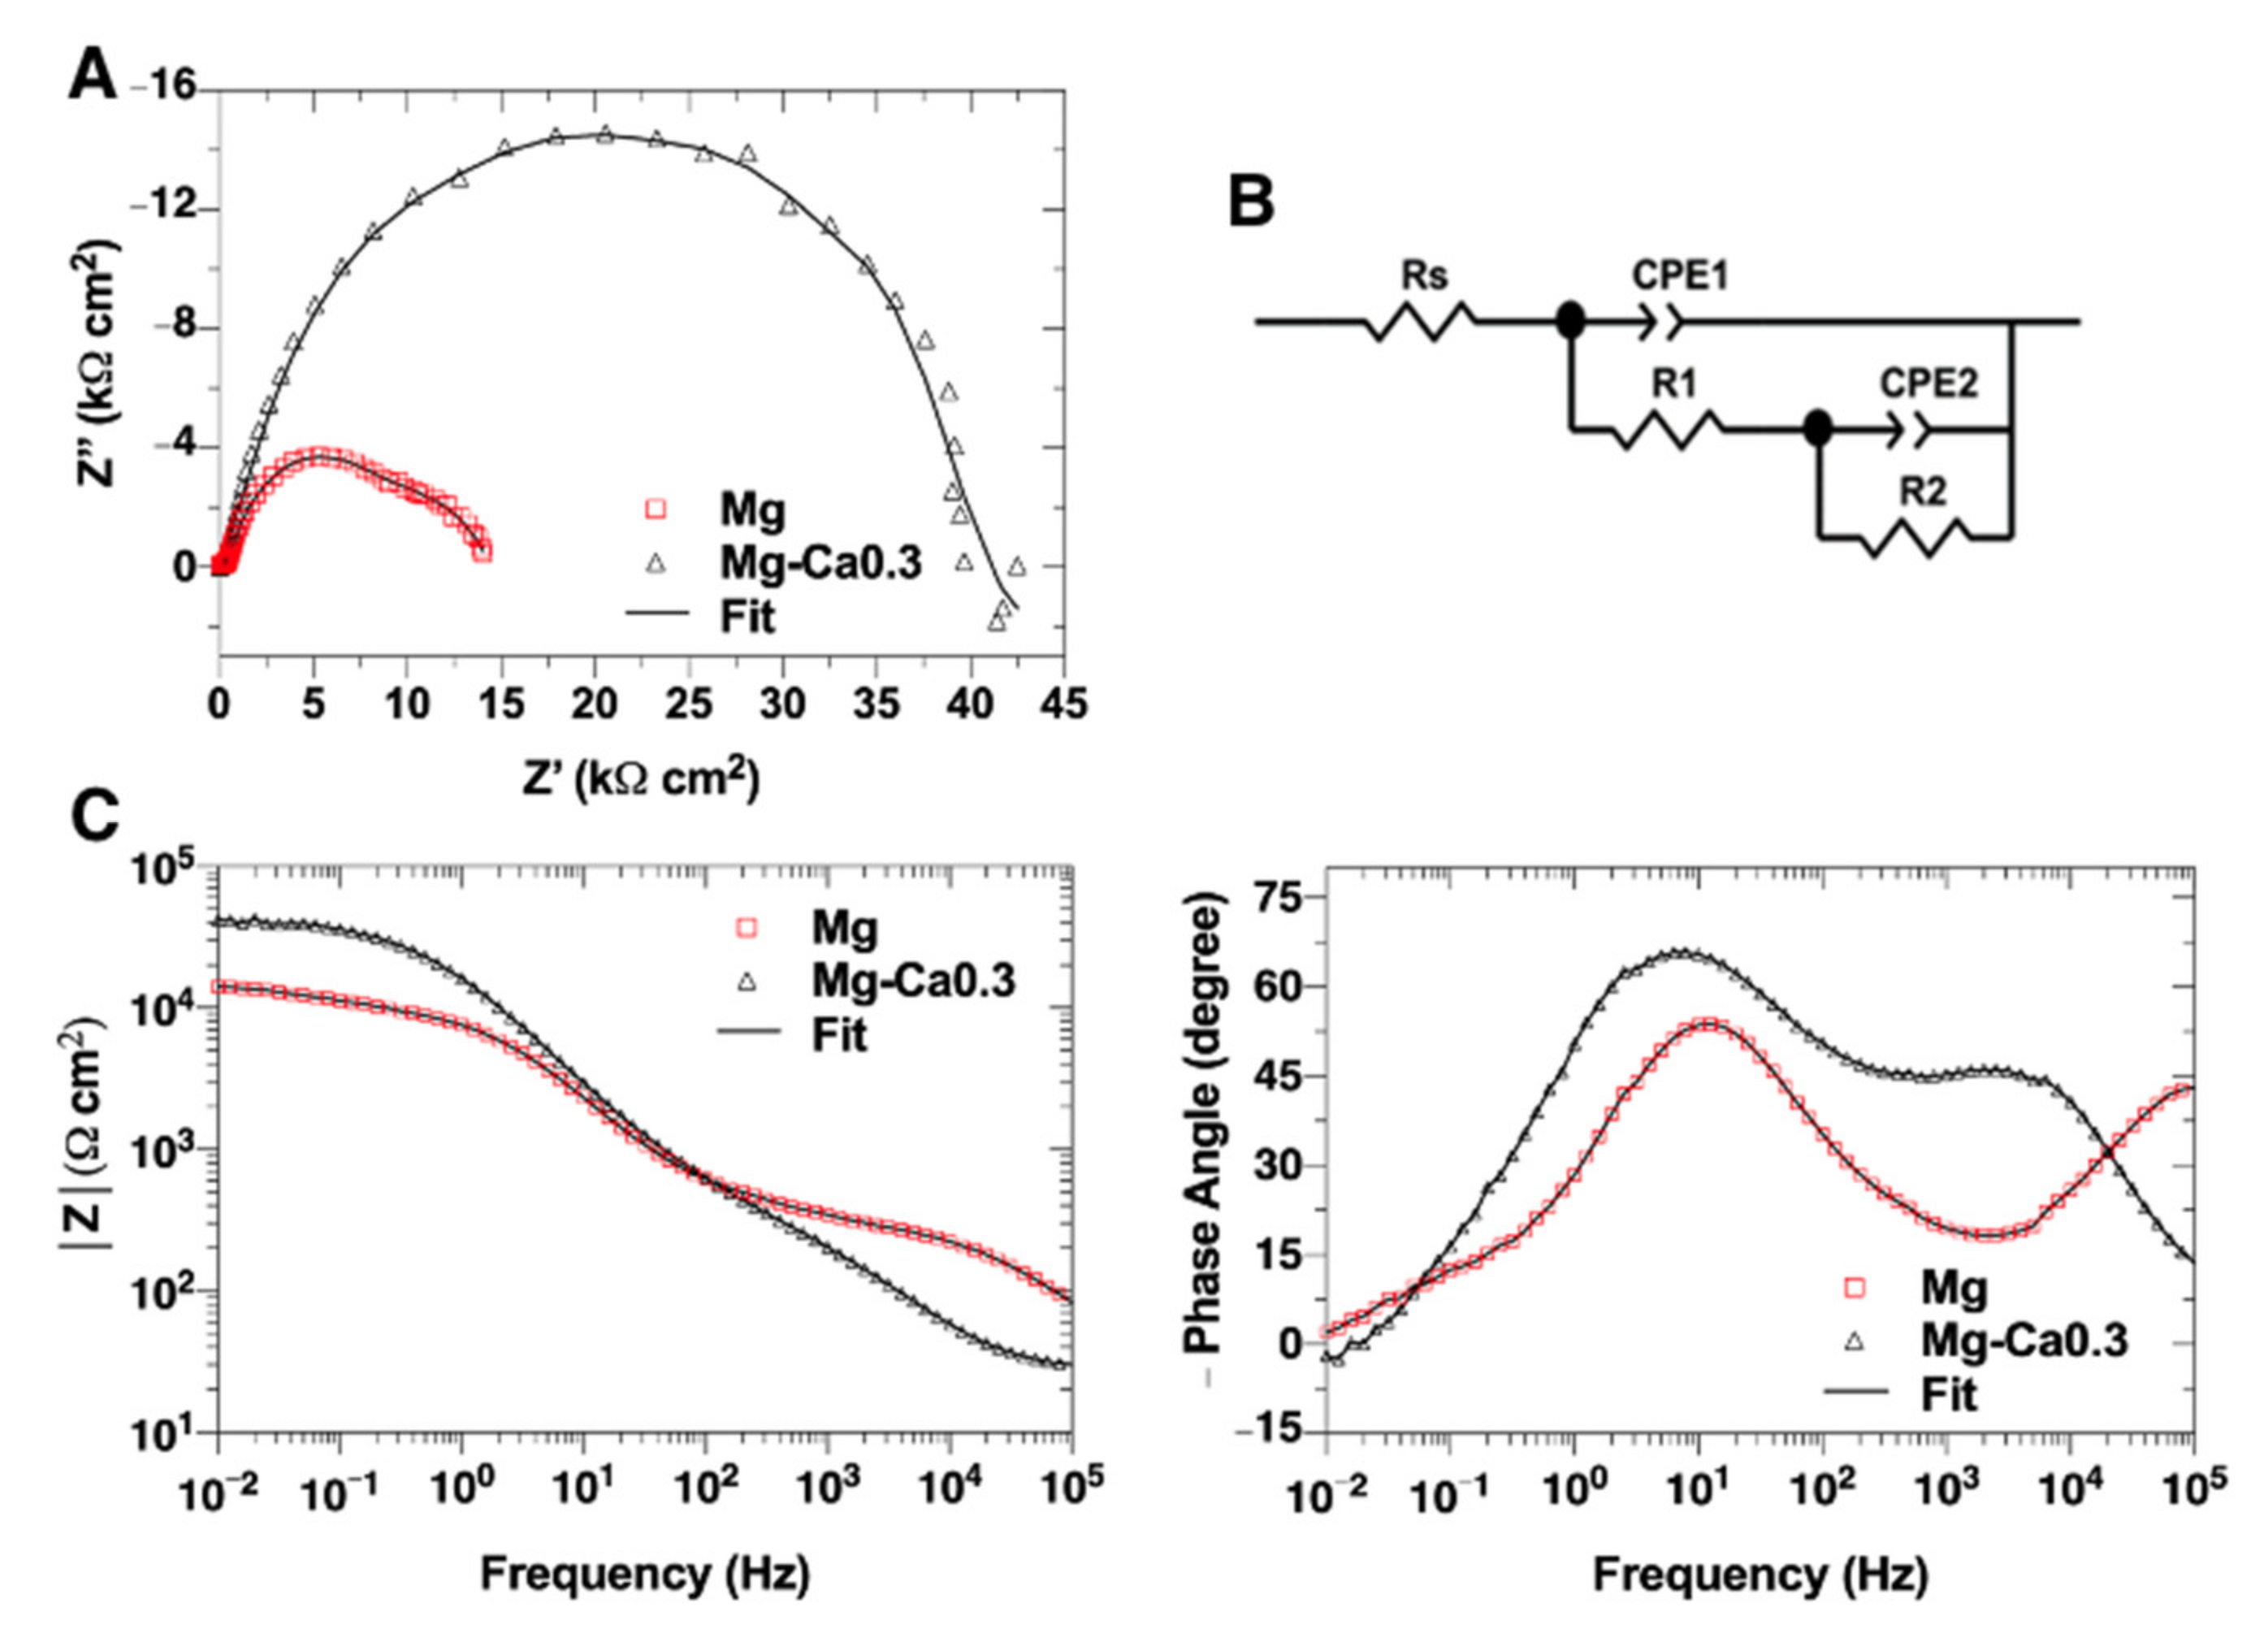
3.4.3. Electrochemical Impedance Spectroscopy (EIS)

Figure 9A shows the Nyquist diagrams for Mg and Mg-Ca0.3 exposed to Hank’s physiological solution for 24 h at 21 °C, as well as the equivalent electrical circuit used to fit the experimental EIS data (Figure 9B) [142]. The Bode diagrams are presented in Figure 9C.
The Mg Nyquist diagram reveals two capacitive loops, representing the two surface states during the anodic process of degradation of Mg in Hank’s solution (see Figure 6); for Mg-Ca0.3 the effect of two loops is not sufficiently observable. According to the literature, the capacitive loop at high frequencies represents the charge transfer resistance (Rt) [143,144,145,146,147,148,149,150], while the second loop at medium frequencies can be associated with the mass transport process, including the Mg2+ release [144,147,148,150]. The Bode diagrams are congruent with the Nyquist diagrams and help to appreciate the existence of two interfaces.
The suggested circuit includes as main components: the solution resistance (Rs), a constant phase element (CPE1) and a resistor (R1), both associated with the double layer and charge transfer resistor (substrate/electrolyte interface). The (CPE2) and the resistance (R2) are characteristic of the corrosion process at the metal surface through the corrosion layer and the release of Mg2+ ions. The constant phase elements (CPE) have been used instead of a capacitance, due to the possible microscopic roughness or the heterogeneities of the Mg and Mg-Ca0.3 surfaces [143,144,145]. Table 3 presents the estimated fitted parameters of the circuit elements from the EIS diagrams, in which fitting is of 10−4.
The values of the total polarization resistance (Rp) were calculated (Equation (8)) and they indicate (Table 3) that the Rp for Mg-Ca0.3 was ~three times higher than that of Mg, suggesting that the formed layer in the presence of Ca was more protective.
R p = R 1 + R 2

3.5. Characterization of Ag-Nanoparticles (NPs) on the Surface of Mg-Ca0.3

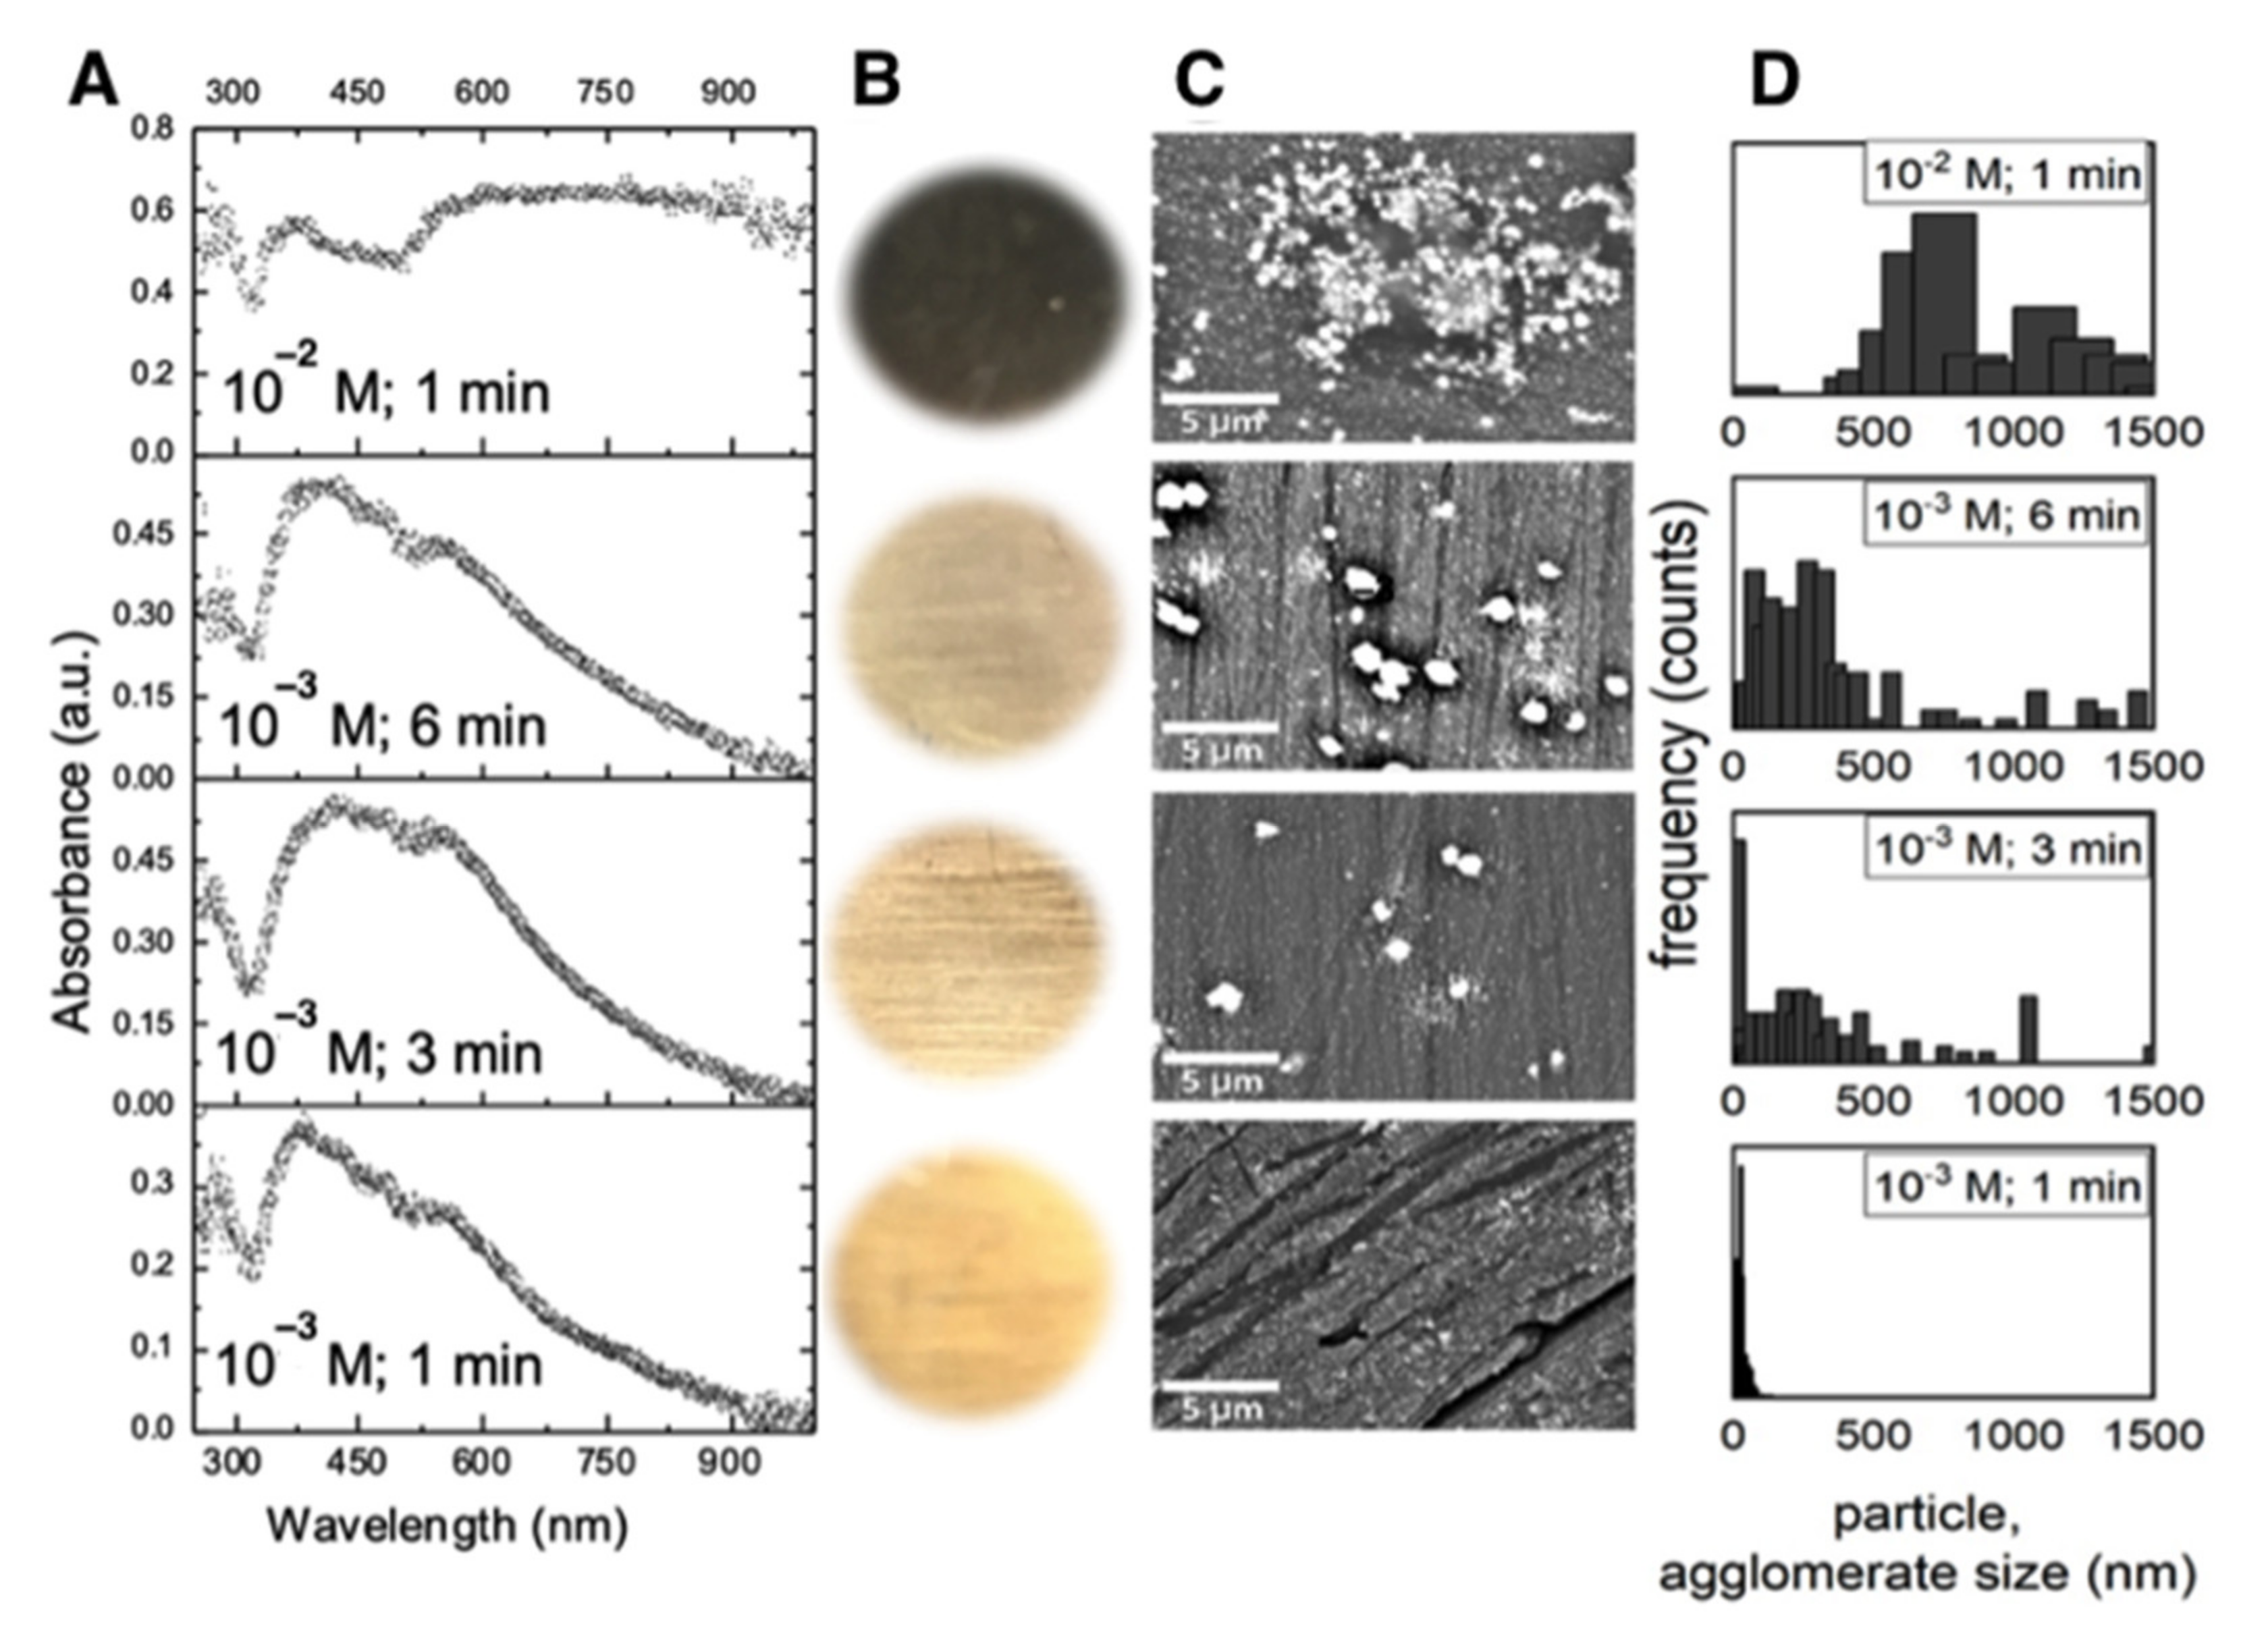
3.5.1. UV-Vis Spectrophotometry and SEM Micrograph

The electroless deposited (ELD) Ag-NPs (zero-valent Ag) on Mg-Ca0.3 were initially characterized by the time evolution of the UV-Vis absorption spectra (Figure 10A) and change in color of the MgCa0.3 surface (Figure 10B).
The absorption band with a maximum at around 290 nm that decreases up to 320 nm (Figure 10A) is attributed to electronic interband transition between electrons in s-orbitals and p-empty orbitals of metallic silver [146,147]. The minimum observed at 320 nm in all samples is related to the well-known decrease of the imaginary part (k) of the refraction index characteristic of metallic silver [148]. This wavelength outlines the limits between interband transition, from 320 nm toward lower wavelengths. A maximum of the adsorbance near to 400 nm is a result of the electron density resonance phenomena (surface plasmon resonant band). The bandwidth, asymmetry, and position depend on the Ag-NPs particle size and size distribution. The interaction of the particles with the substrate also affects the optical response due to the localization of the plasmon fluctuations (localized surface plasmon resonance, LSPR).
According to study [149], the Ag-NPs may exhibit various colors depending on their localized surface plasmon resonance (LSPR) and consequently they can represent different optical states (black, magenta, cyan, yellow, silver mirror, and transparent). The change in color is influenced by the LSPR band, when the Ag-NPs show difference in morphology, size, and shape. The SEM images (Figure 10C) reveal that the Ag-NPs are well-isolated and in a very low size (Figure 10D) by using the electrolyte of low concentration of Ag+ (10−3 M, 1 min), because of the slow growth rate. However, at one order higher concentration of Ag+ (10−2 M, 1 min), the better connection between Ag-particles leads to the formation of agglomerates, as the diffusion of the Ag-ions is more facilitated to the substrate. It is considered that this effect of short-range interaction induces the LSPR band in the long wavelength region [146,147,149], that is why the photograph of the surface becomes darker at higher concentration of Ag-NPS agglomerates. The Ag-NPs and agglomerate size distribution on the Mg-Ca03 surface is presented in Figure 10D.
The Figure 11 presents SEM images (10,000×) and EDS elemental analysis, which compare the surface of Mg-Ca0.3 before (Figure 11A) and after the deposit of Ag-NPs (10−3 M, t = 3 min) (Figure 11B). EDS analysis suggests that the Ag-NPs are deposited in the vicinity of the intermetallic phases of Mg2Ca (Figure 11B).

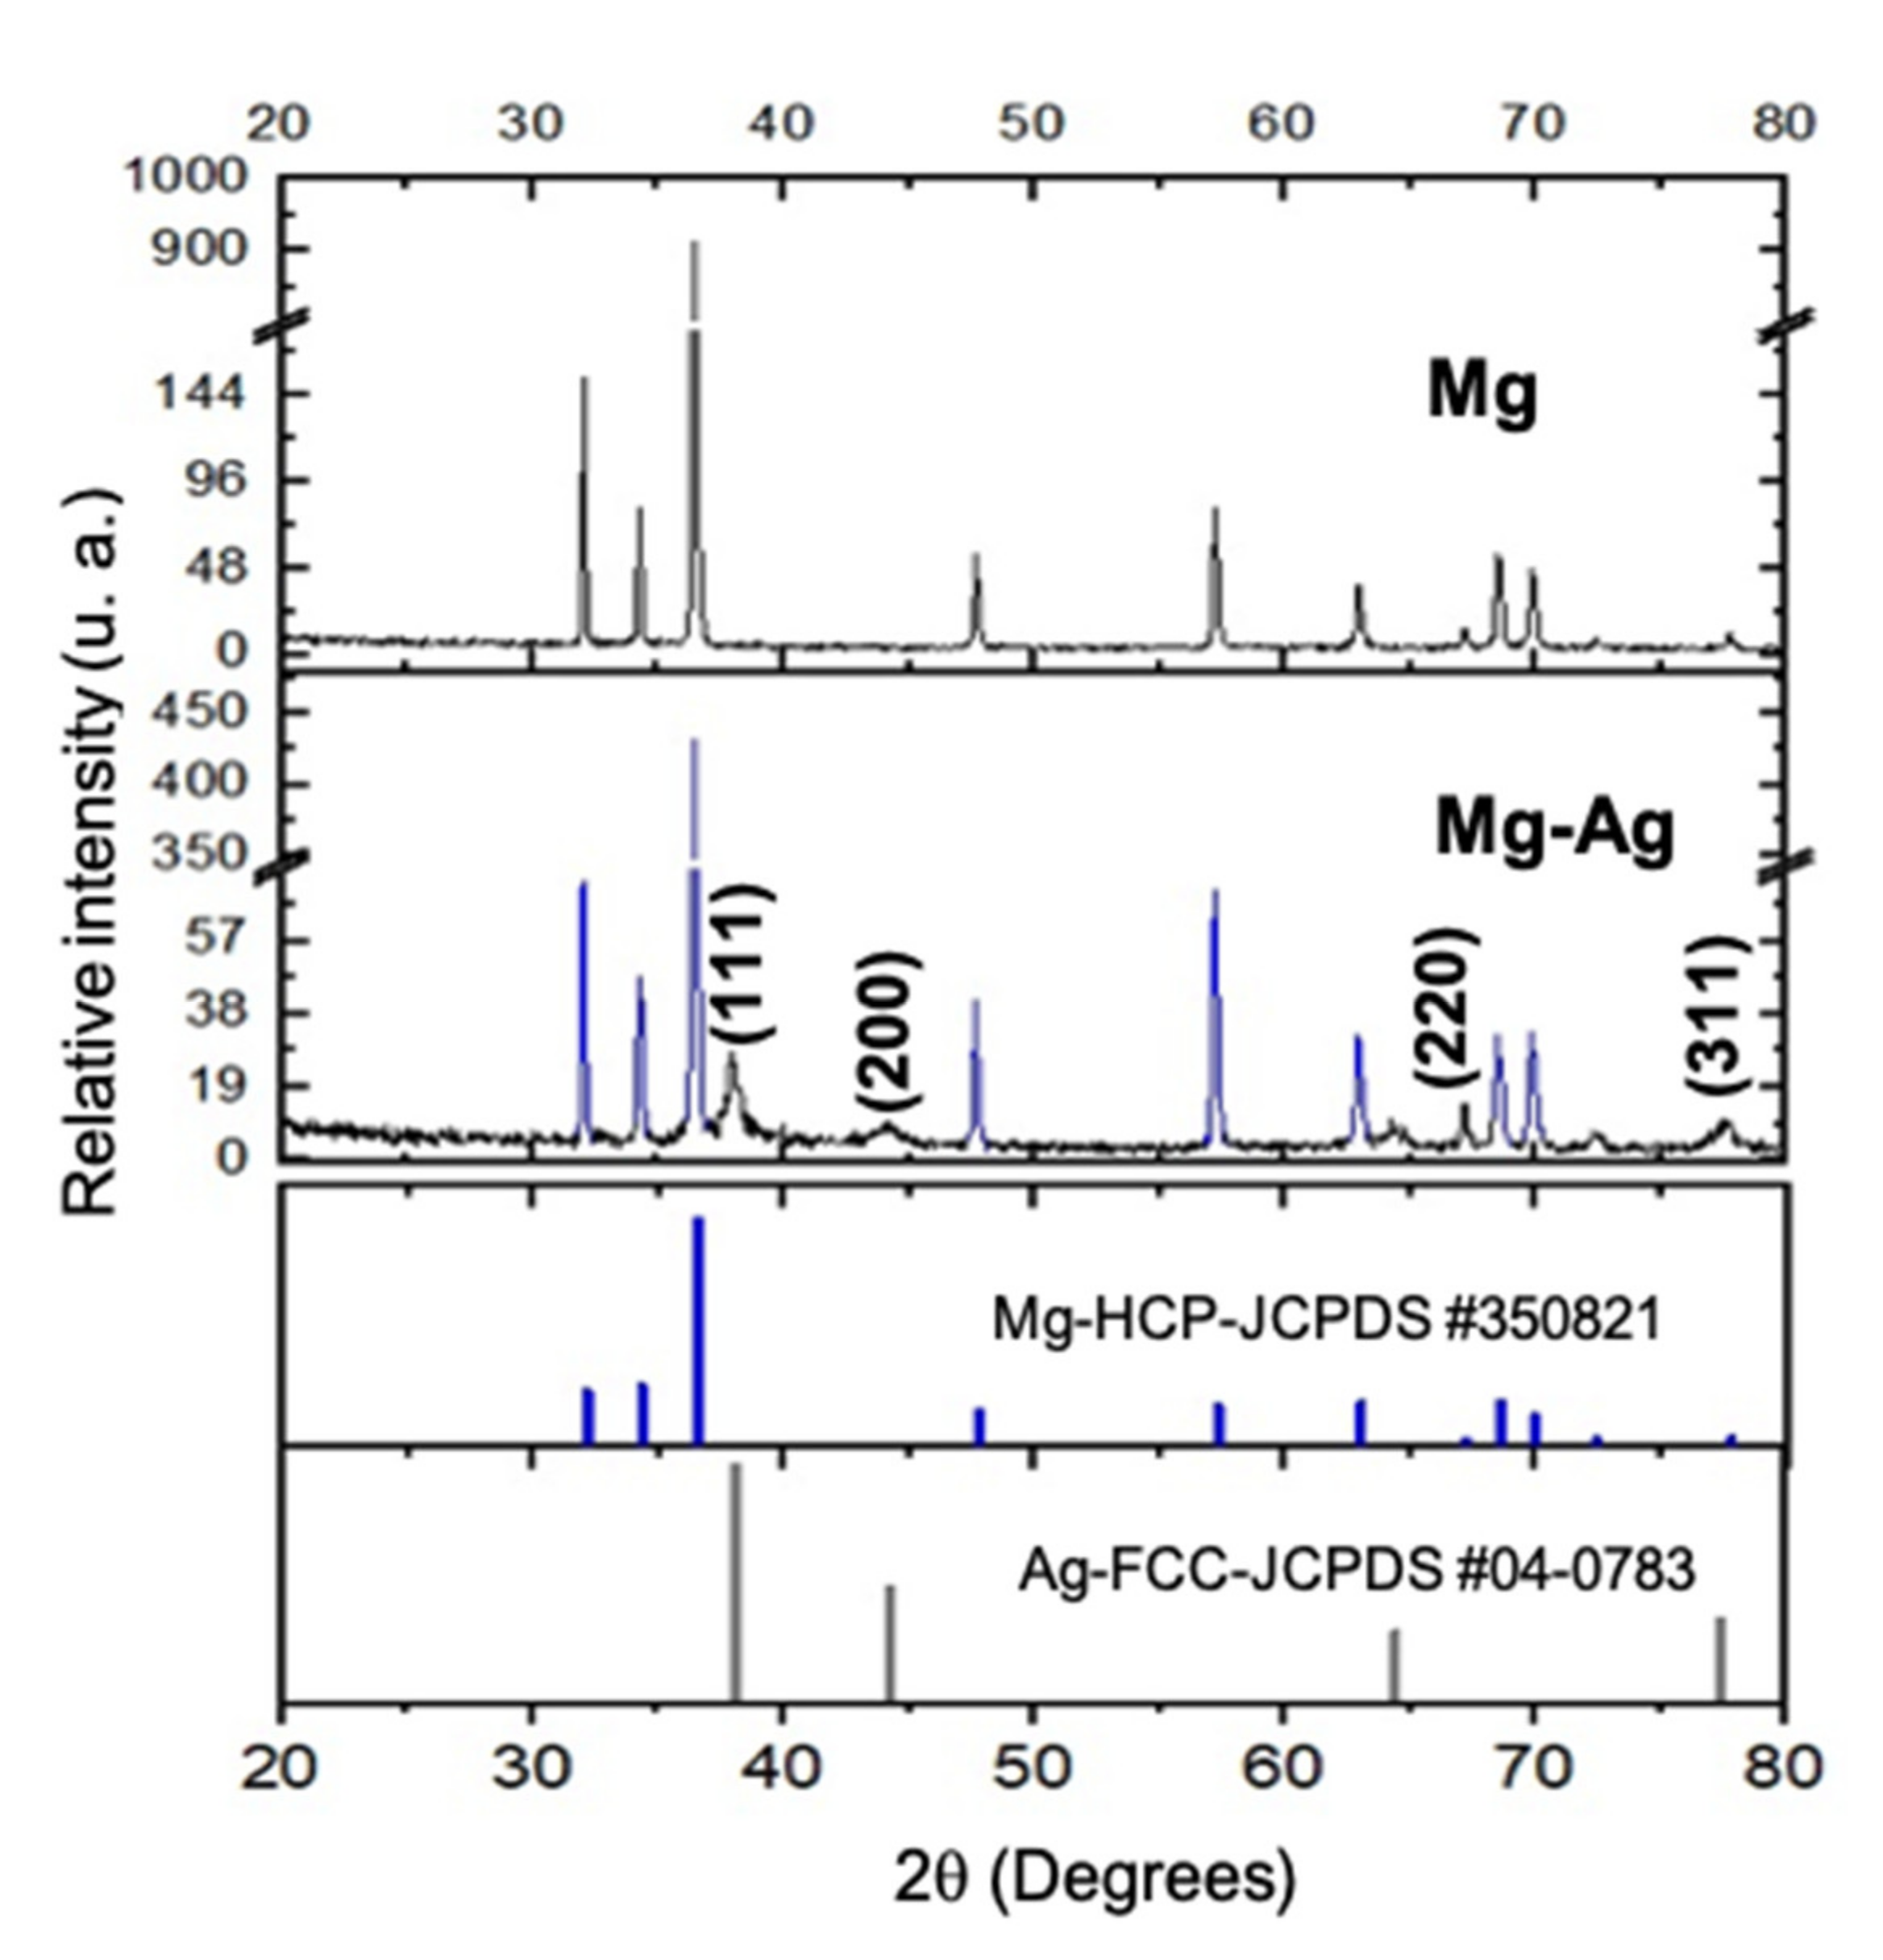
3.5.2. X-ray Diffraction (XRD)

In order to characterize the Ag-NPs a complementary analysis by XRD was carried out (Figure 12). The spectra indicated the pattern of the hexagonal Mg-metal matrix and the presence of nanostructured Ag crystals of FCC cell structure. The calculated average size of Ag (T) nanocrystallites was 10 nm, according to the Debye-Scherrer’s equation [150,151,152]:
T = K · λ B · cos θ B
where K is a dimensionless factor (0.9); λ is the wavelength of the X-rays (1.5406 Å); B is the mean width of the peak at a half of the height (fhwm), considered for the calculation; and θB is the angle corresponding to the maximum of the reflection.

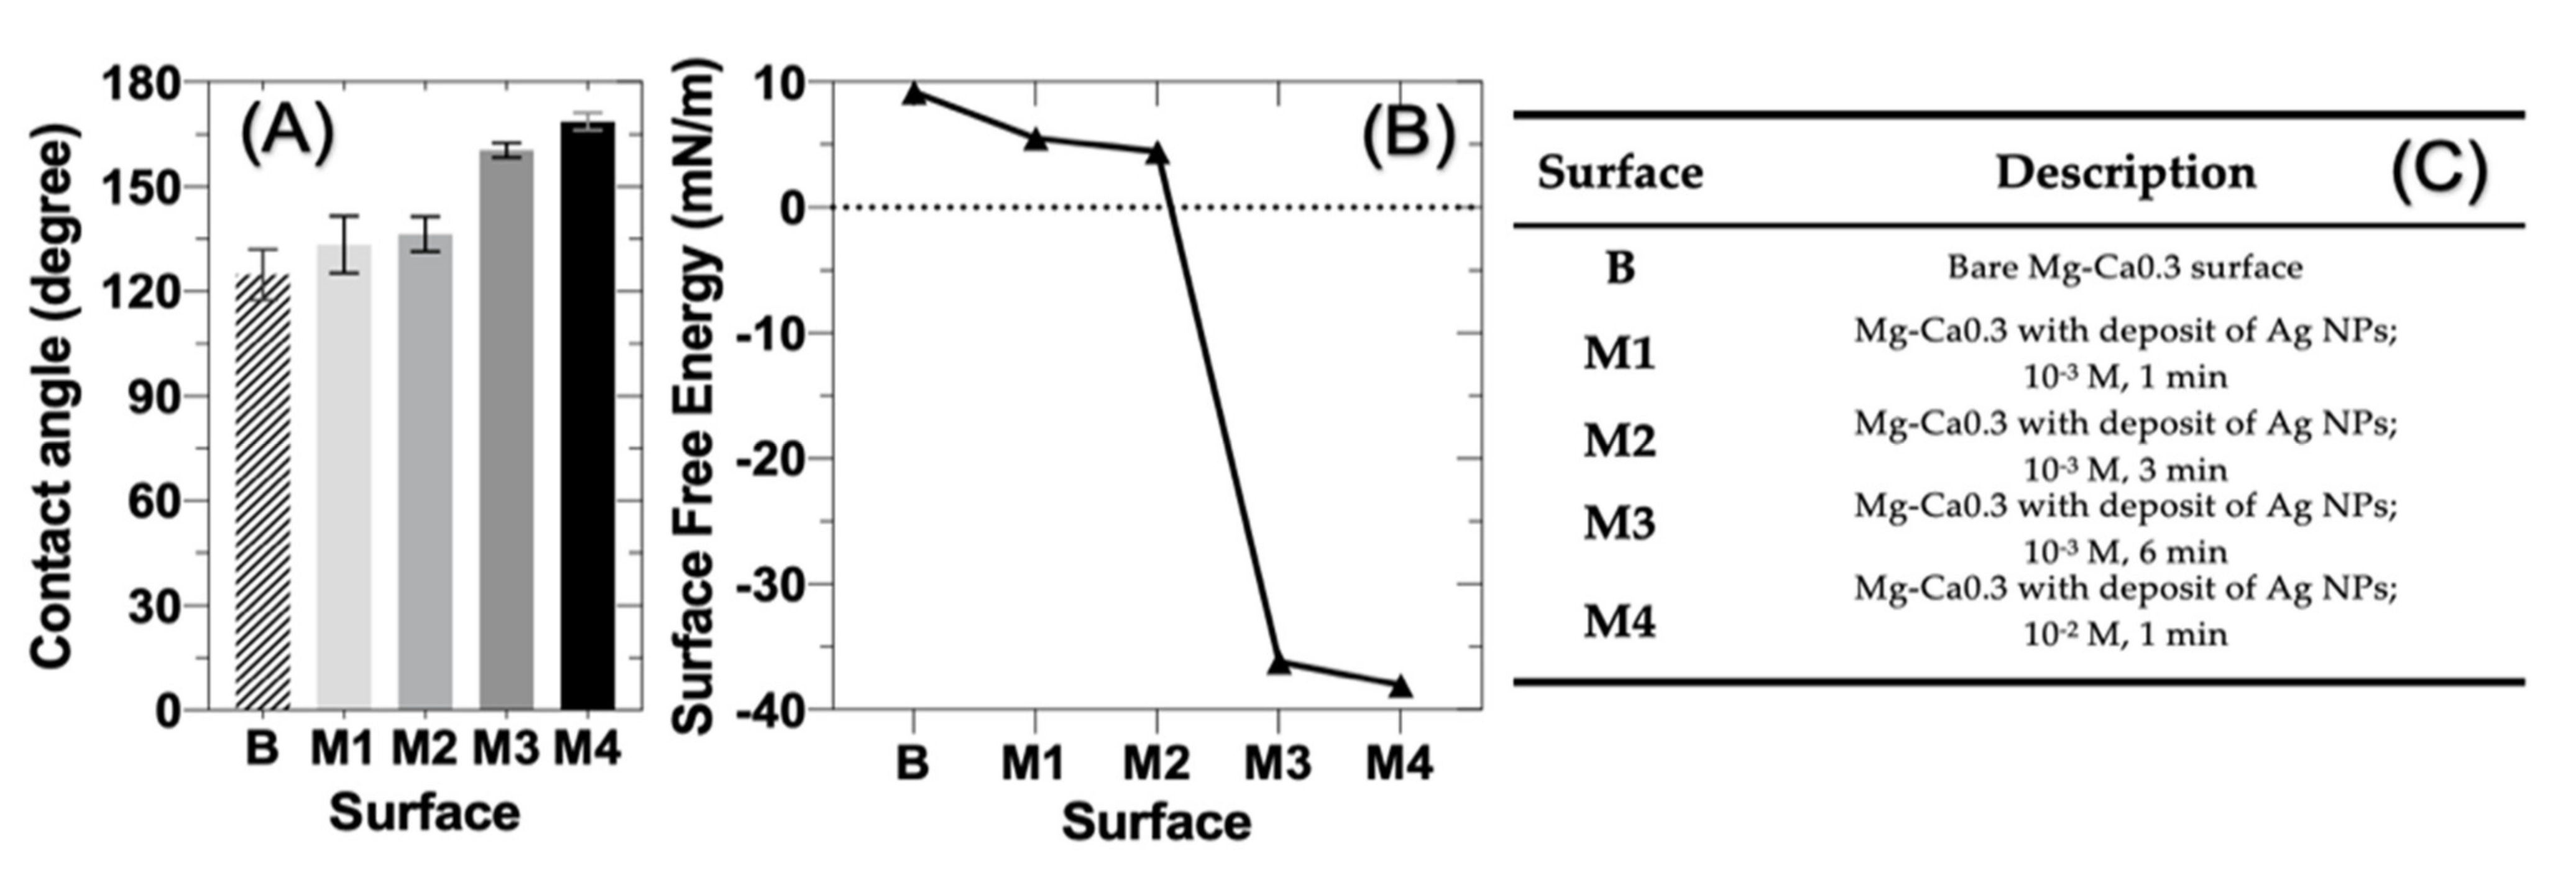
3.5.3. Contact Angle and Surface Free Energy (SFE)

The contact angle (Figure 13A) was measured following the ASTM D 5725-99 methodology for the drop shape analysis [153]. The surface free energy (SFE) was calculated based on the contact angle value (Figure 13B). The results revealed that the contact angle depends on the concentration (molarity) of the solution for Ag-NPs electroless deposition, as well as, on the time for deposition (quantity of Ag-NPs on the Mg-Ca0.3 alloy, Figure 10C). The angle value was greater than 120° on the B surfaces (substrate Mg-Ca0.3), as well as on all Ag-NPs deposits formed by 10−3 M and 10−2 M AgNO3, at different times. Therefore, these surfaces are considered as superhydrophobic [154,155,156,157]. According to studies [158,159,160,161,162,163,164], the superhydrophobic surfaces may exhibit an antibacterial behavior, as also a reduction of a fluidic drag and an anticorrosive protection for metal surfaces.
On the other hand (Figure 13B), the calculated surface free energy (SFE) showed a decrease in the positive values of B, M1, and M2 surfaces, while the M3 y M4 surfaces presented very negative values of the SFE. The last fact suggests that these surfaces will exhibit a poor cell bacterial adhesion, as well as wettability properties [154,155,156,157,158,159,160,161,162].

3.6. Characterization of Antibacterial Properties of Ag-Nanoparticles (NPs) Deposited on Mg-Ca0.3 Surface

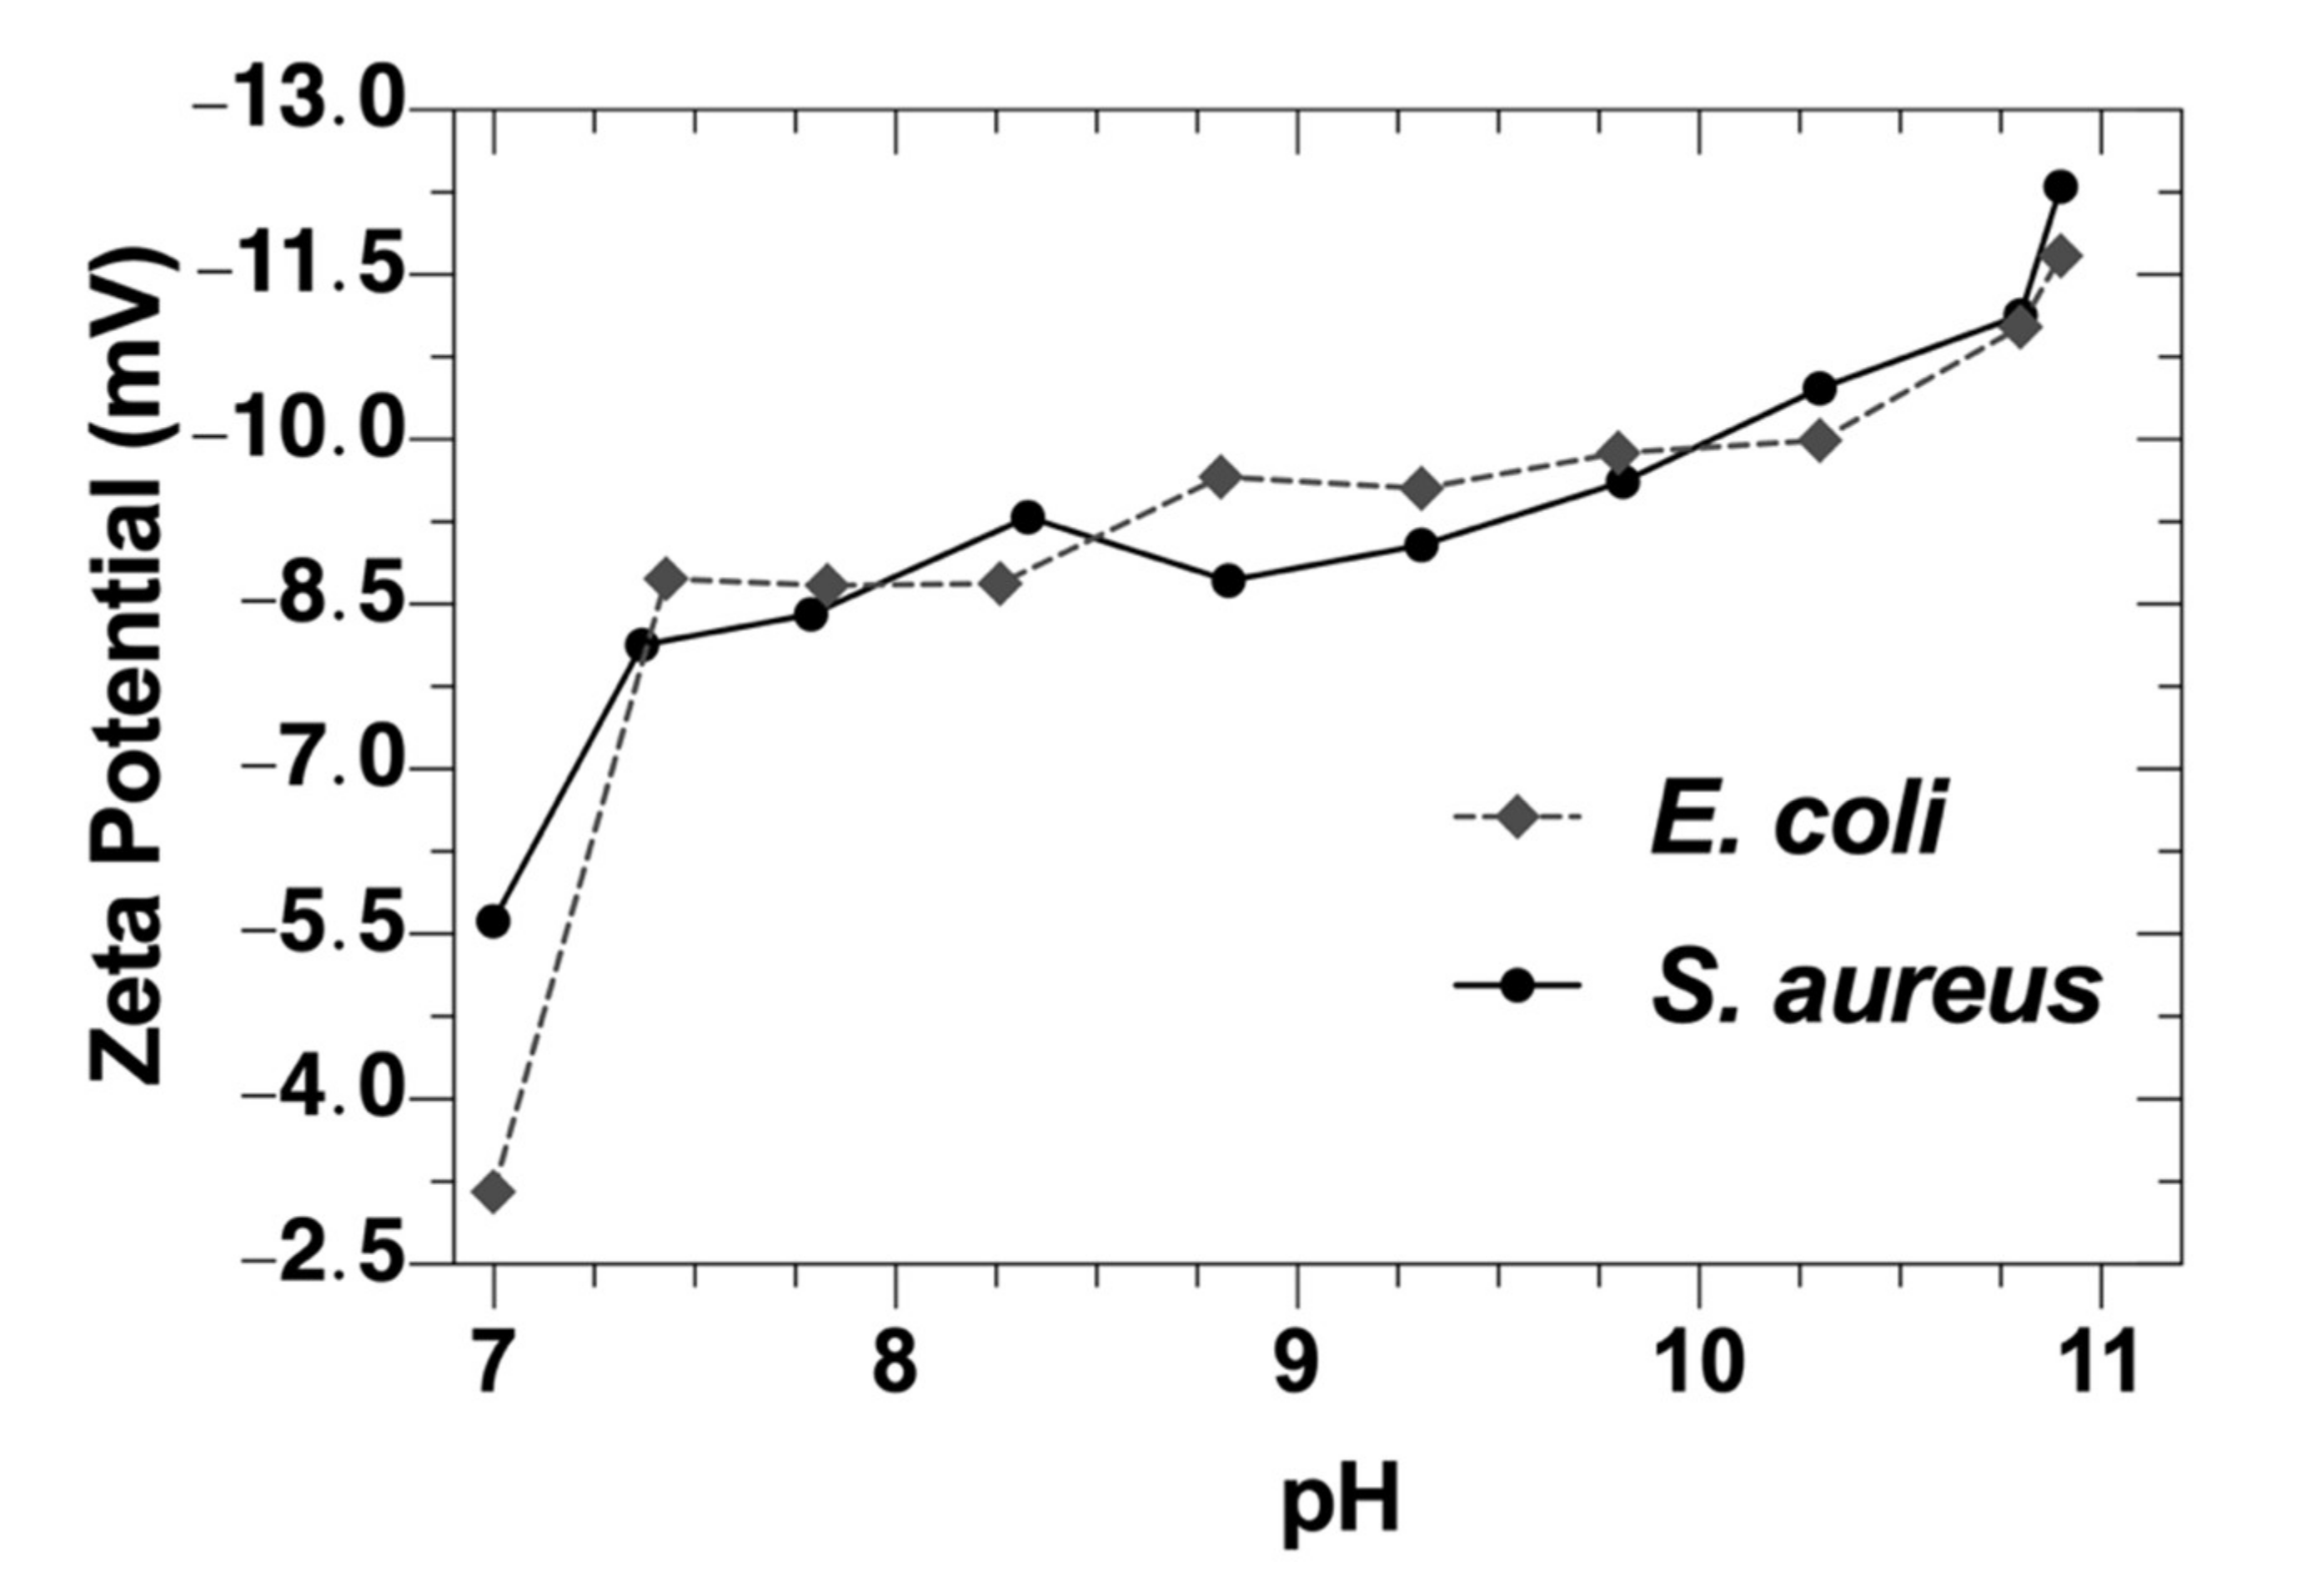
3.6.1. Zeta Potential Measurement of E. coli and S. aureus

To measure the zeta-potential of the bacteria, pH titration was carried out, in order to understand the electrostatic interactions between bacteria and Ag-NPs deposits on the Mg-Ca0.3 surface. The data in Figure 14 showed that zeta potential of E. coli and S. aureus tended to be more negative values with respect to the pH of the Mueller–Hinton culture broth (pH ≈ 7.0 and up to 11), with a bacteria concentration of 108 CFU mL−1. The pH of the culture broth (≈7.0 and up to 11) was chosen to be similar to that of the pH range of change of Hank´s solution during the exposure of Mg-Ca0 (Figure 2A). At the initial pH of 7.0 the zeta potential was more negative for S. aureus (−5.67 mV) than that of E. coli (−3.16 mV), followed by a sudden shift at pH ≈ 7.25 to more negative values close to each other and ending at ≈−11 mV at pH = 11.

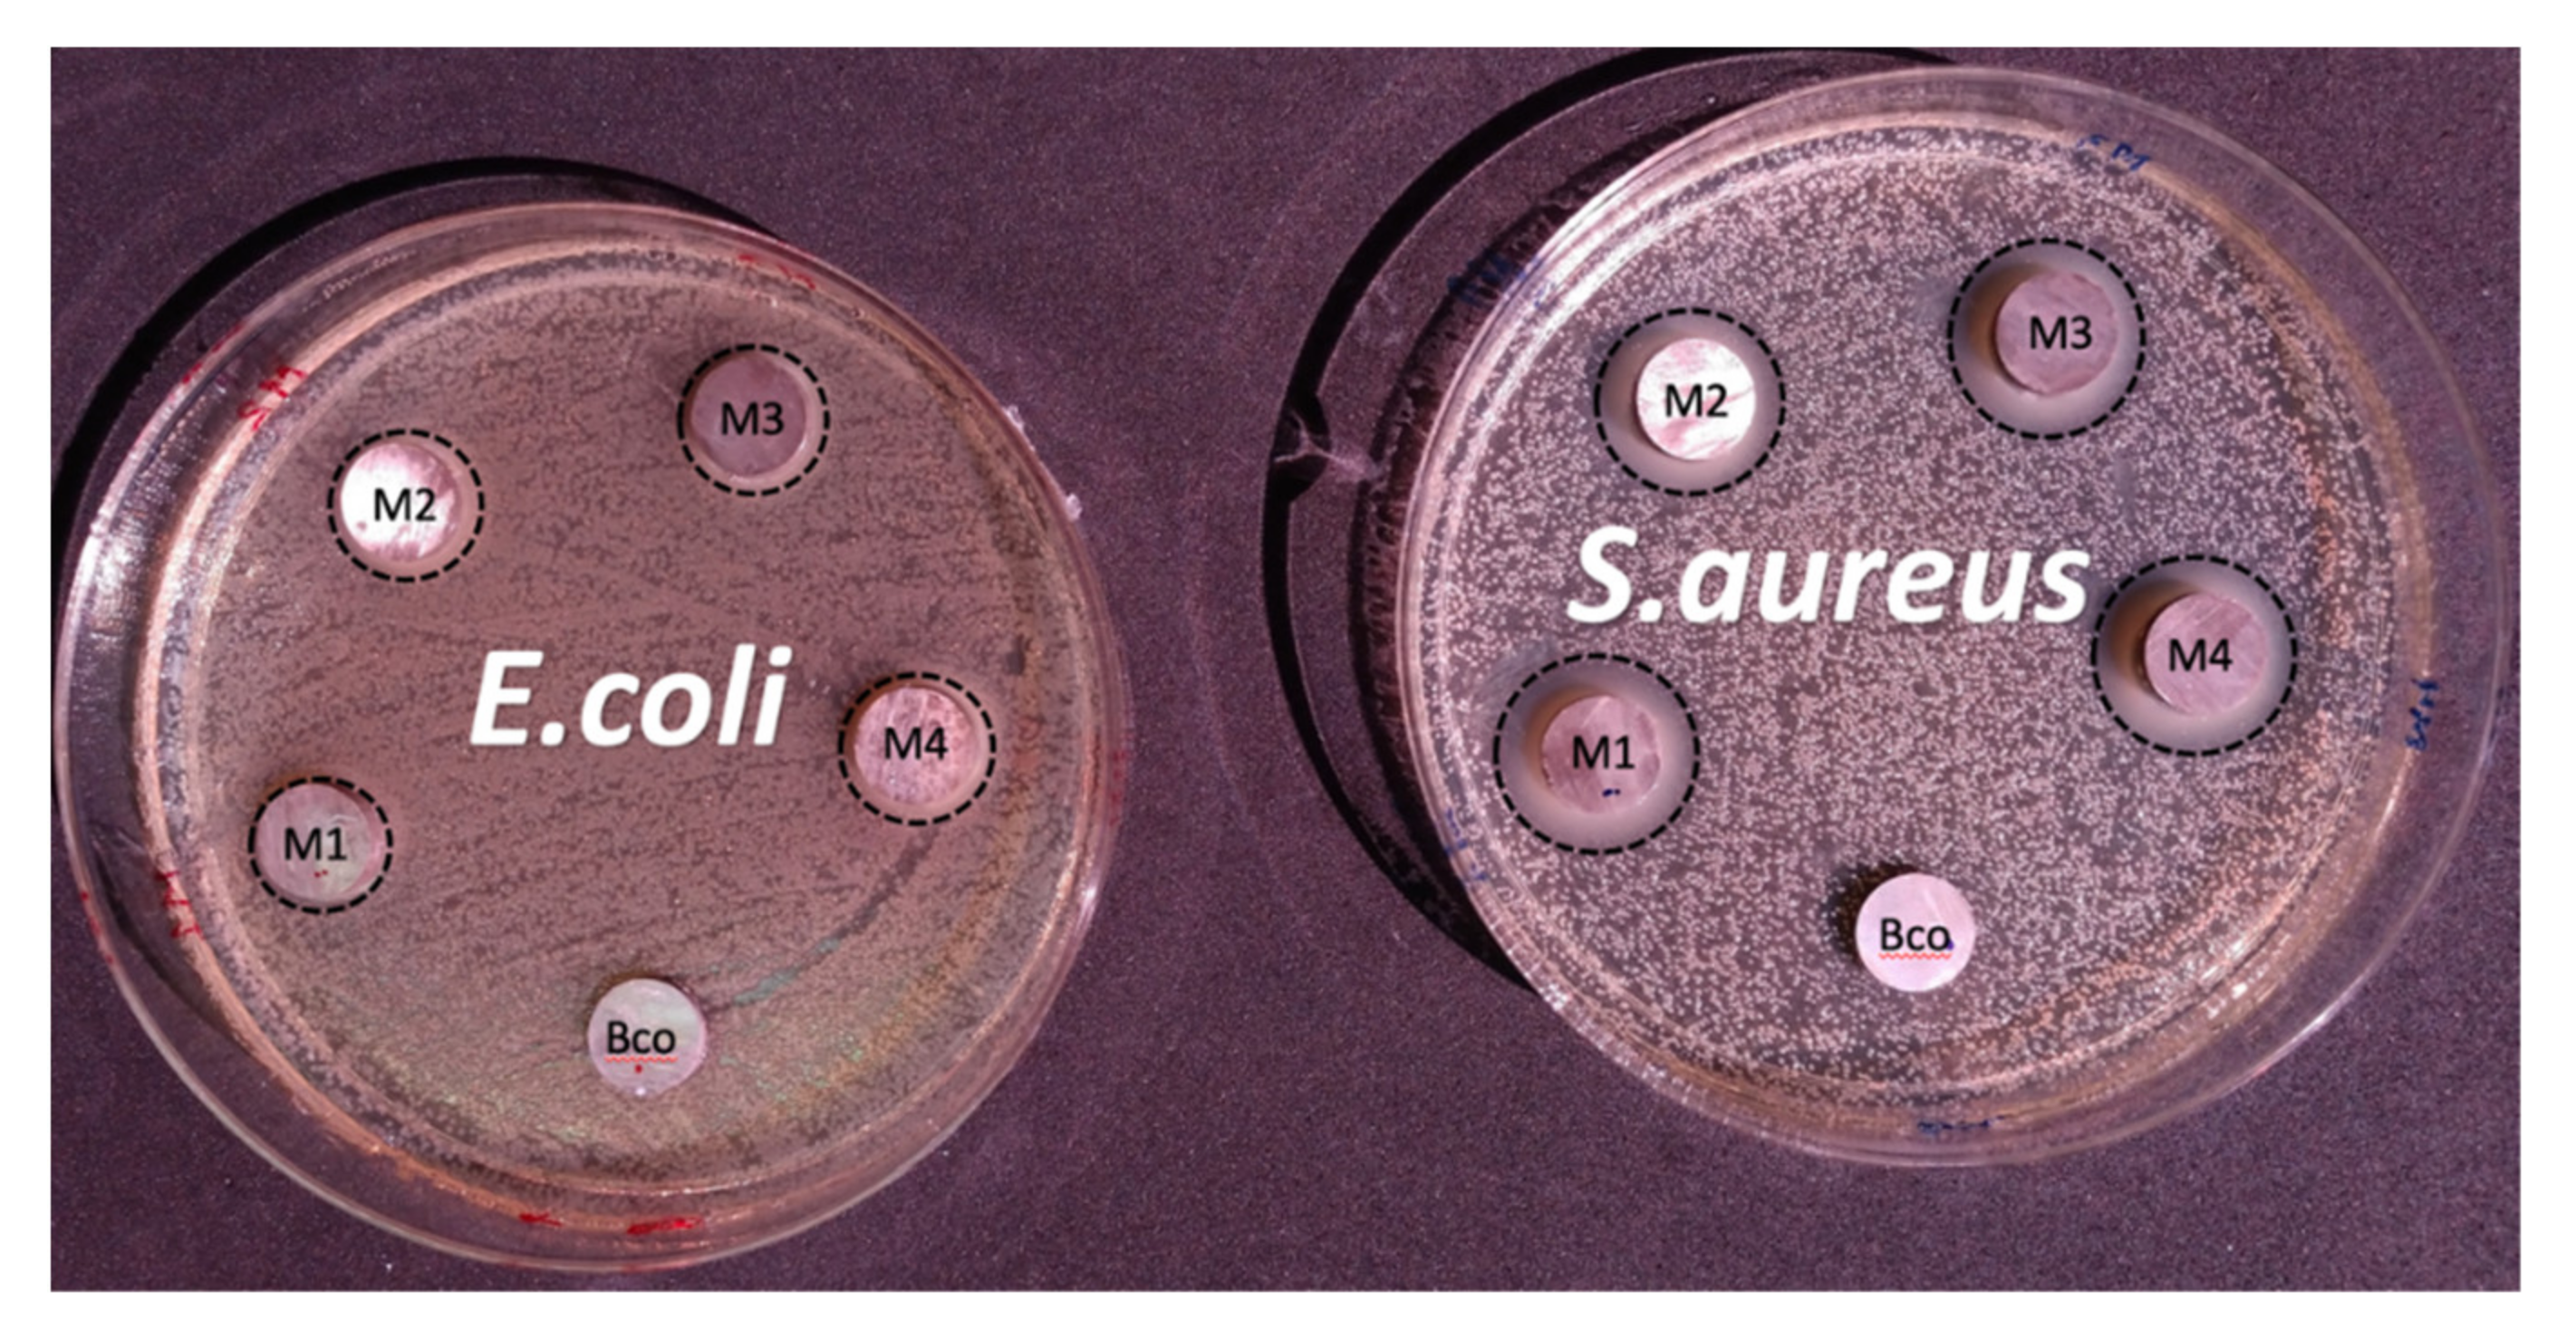
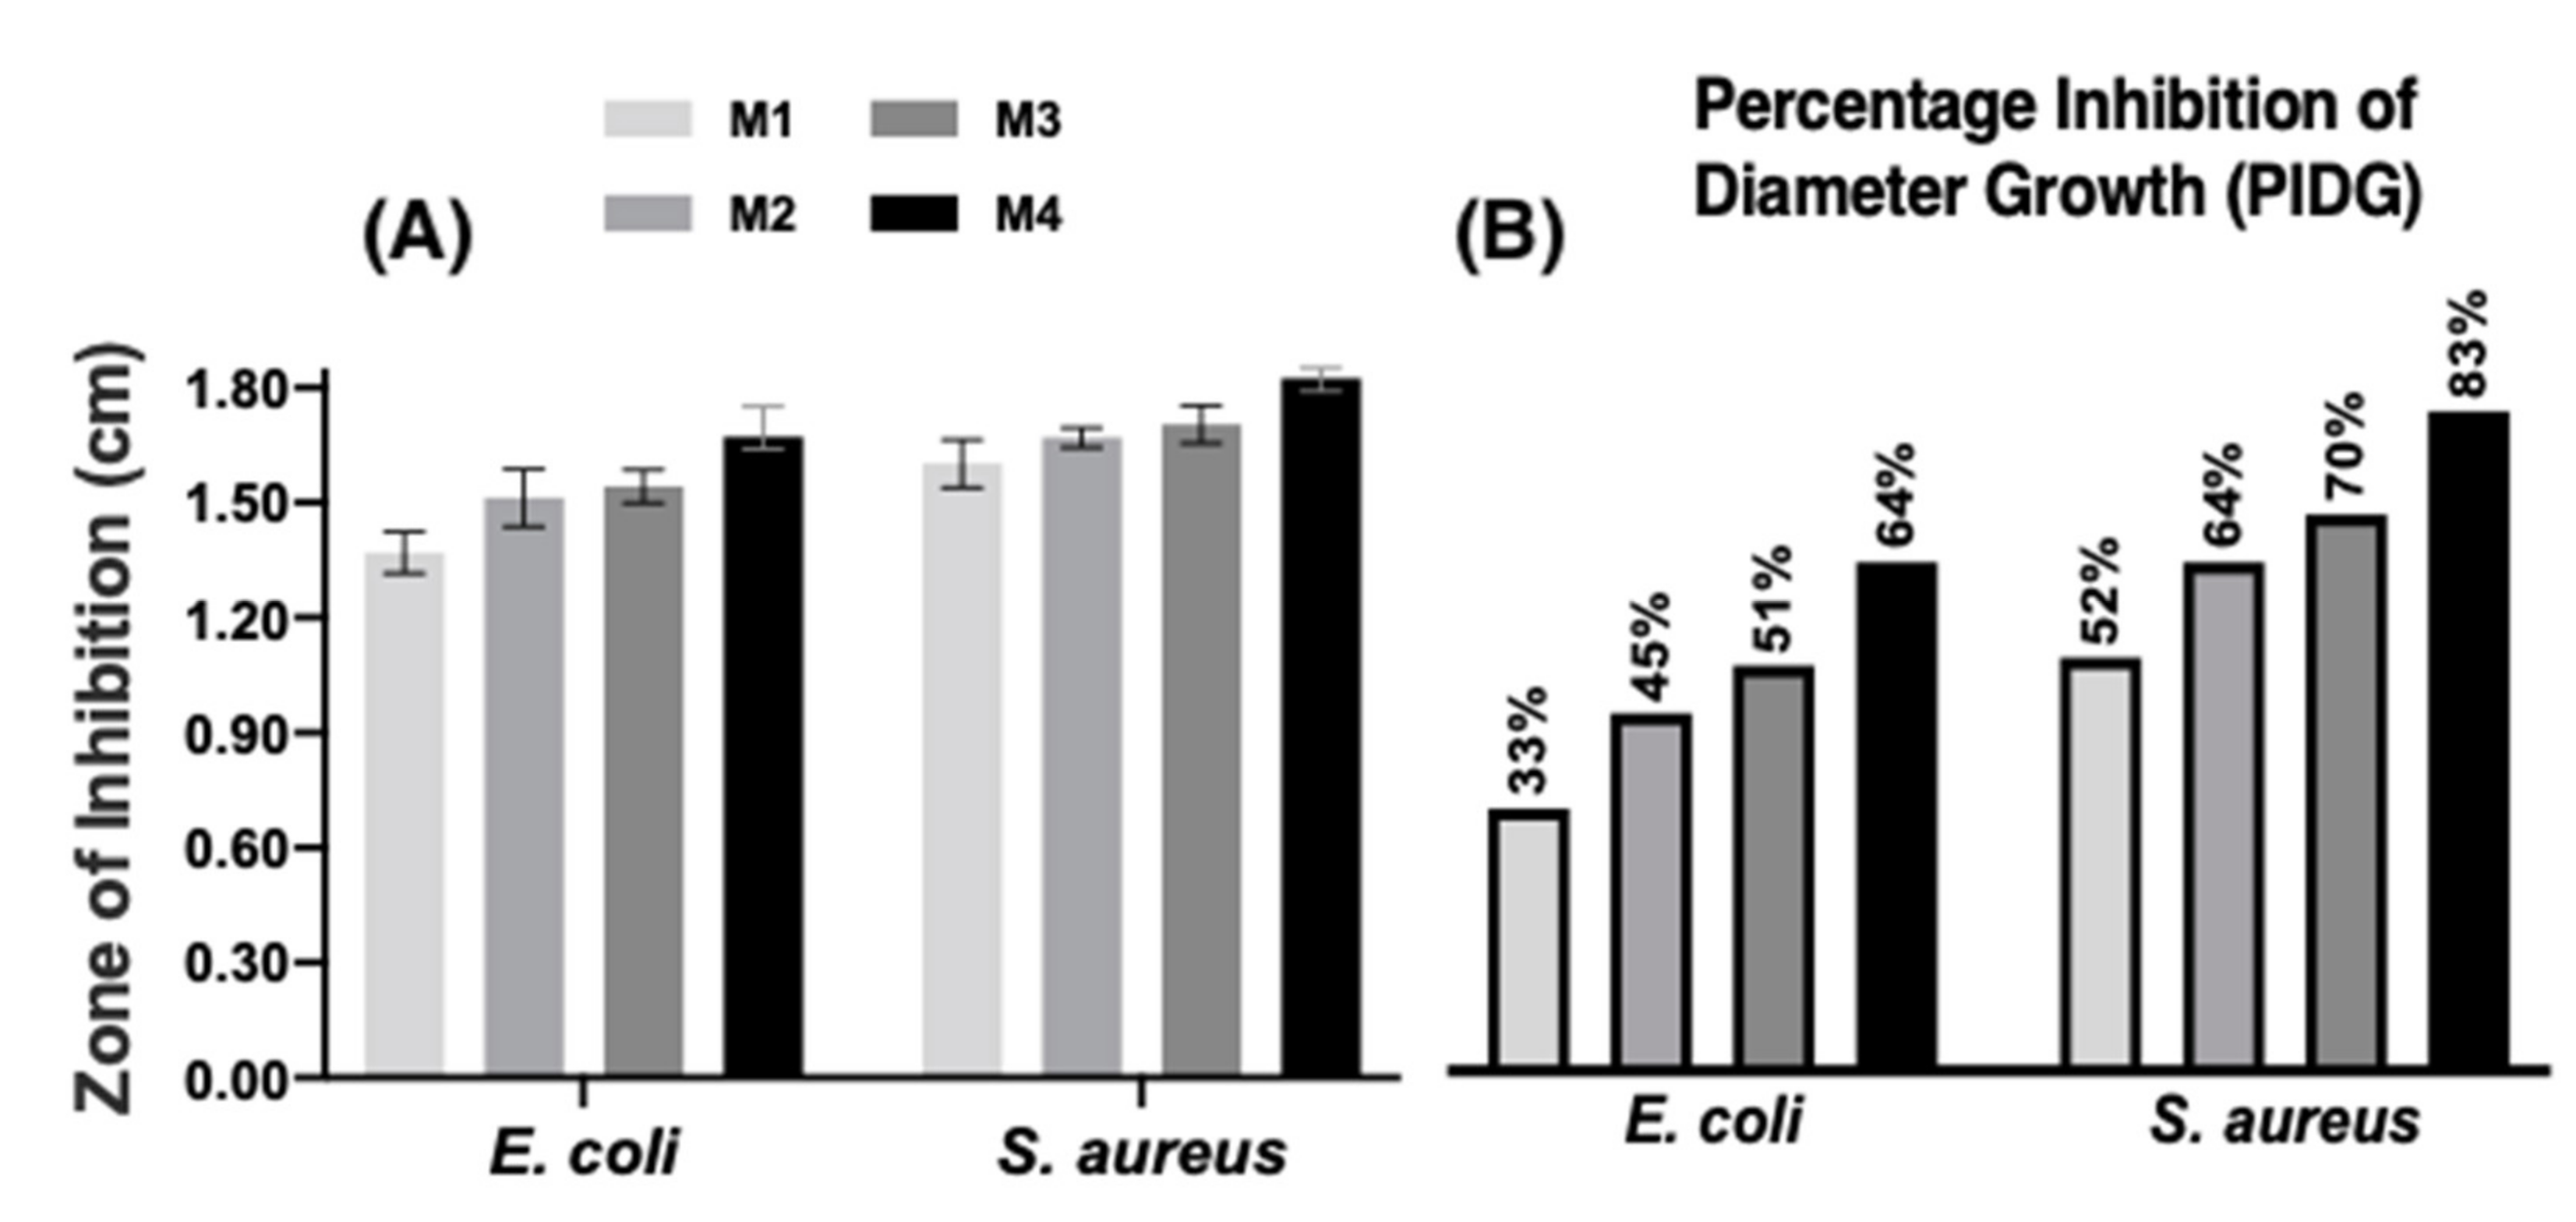
3.6.2. Agar Disk-Diffusion Test

This test was used to compare the ability to inhibit bacteria growth of E. coli and S. aureus on different substrates: bare surface of Mg-Ca0.3 (B) and in the presence of Ag-NPs, deposited from lowest to highest concentration of AgNO3 at different times (M1 to M4). The agar disk-diffusion test was carried out in an incubator at 37 °C after 24 h in the dark (Figure 15).
The histogram in Figure 16A (agar disk-diffusion test) compares the results of the diameters (halos) of zone of inhibition that the bacteria presented, and the corresponding images are presented in Figure 15. On the bare of Mg-Ca0.3 substrate, zone of inhibition was not observed. It was evident that a greater antibacterial activity was observed on the substrate M4, which surface is covered by agglomerates of Ag-NPs in an extended area (Figure 10C,D). For all the samples, S. aureus presented a larger zone of inhibition than E. coli, which indicated that S. aureus is more sensitive to the Ag-NPs than E. coli. After measuring the diameters of the inhibition halos, the percent of diameter of inhibition growth (PIDG) was determined (Figure 16B) according to the following equation [165]:
PIDG   % =     Diameter   of   sample Diameter   of   control Diameter   of   control     · 100  
where diameter of control is the diameter of the Mg-Ca0.3 samples (1 cm), and the diameter of sample is the average diameter of the zone of inhibition after agar disk-diffusion test of three replicates.
The results revealed that the zone of inhibition (Figure 16B) depends on the Ag-NPs content and their size deposited on the Mg-Ca0.3 surface: a higher content (surface of available area) of Ag-NPs gives a possibility for more binding capacity of the particle interaction with the bacterial cell membrane. The higher inhibition percentage reached was ~83% for S. aureus and ~64% for E. coli.
The exact antimicrobial mechanism of Ag-NPs is still not completely known; however, it is suggested that it depends on chemisorbed Ag+ ions, released from the silver partial oxidation as a consequence of its sensitivity to oxygen [166]. Studies report that the Ag-NPs can generate long-lasting antibacterial activity due to the consequent release of Ag+ ions which kill the bacteria [167,168,169,170]. On the other hand, considering that the surface charge of Ag-NPs is not actually measured [171], their interaction with bacteria cell is still open to discussion.

4. Conclusions

The electrochemical degradation process of Mg-Ca0.3 alloy, exposed for 14 days to Hank’s physiological solution (at 37 °C), was compared with that of pure Mg, in order to provide more detailed information on the effect of Ca.
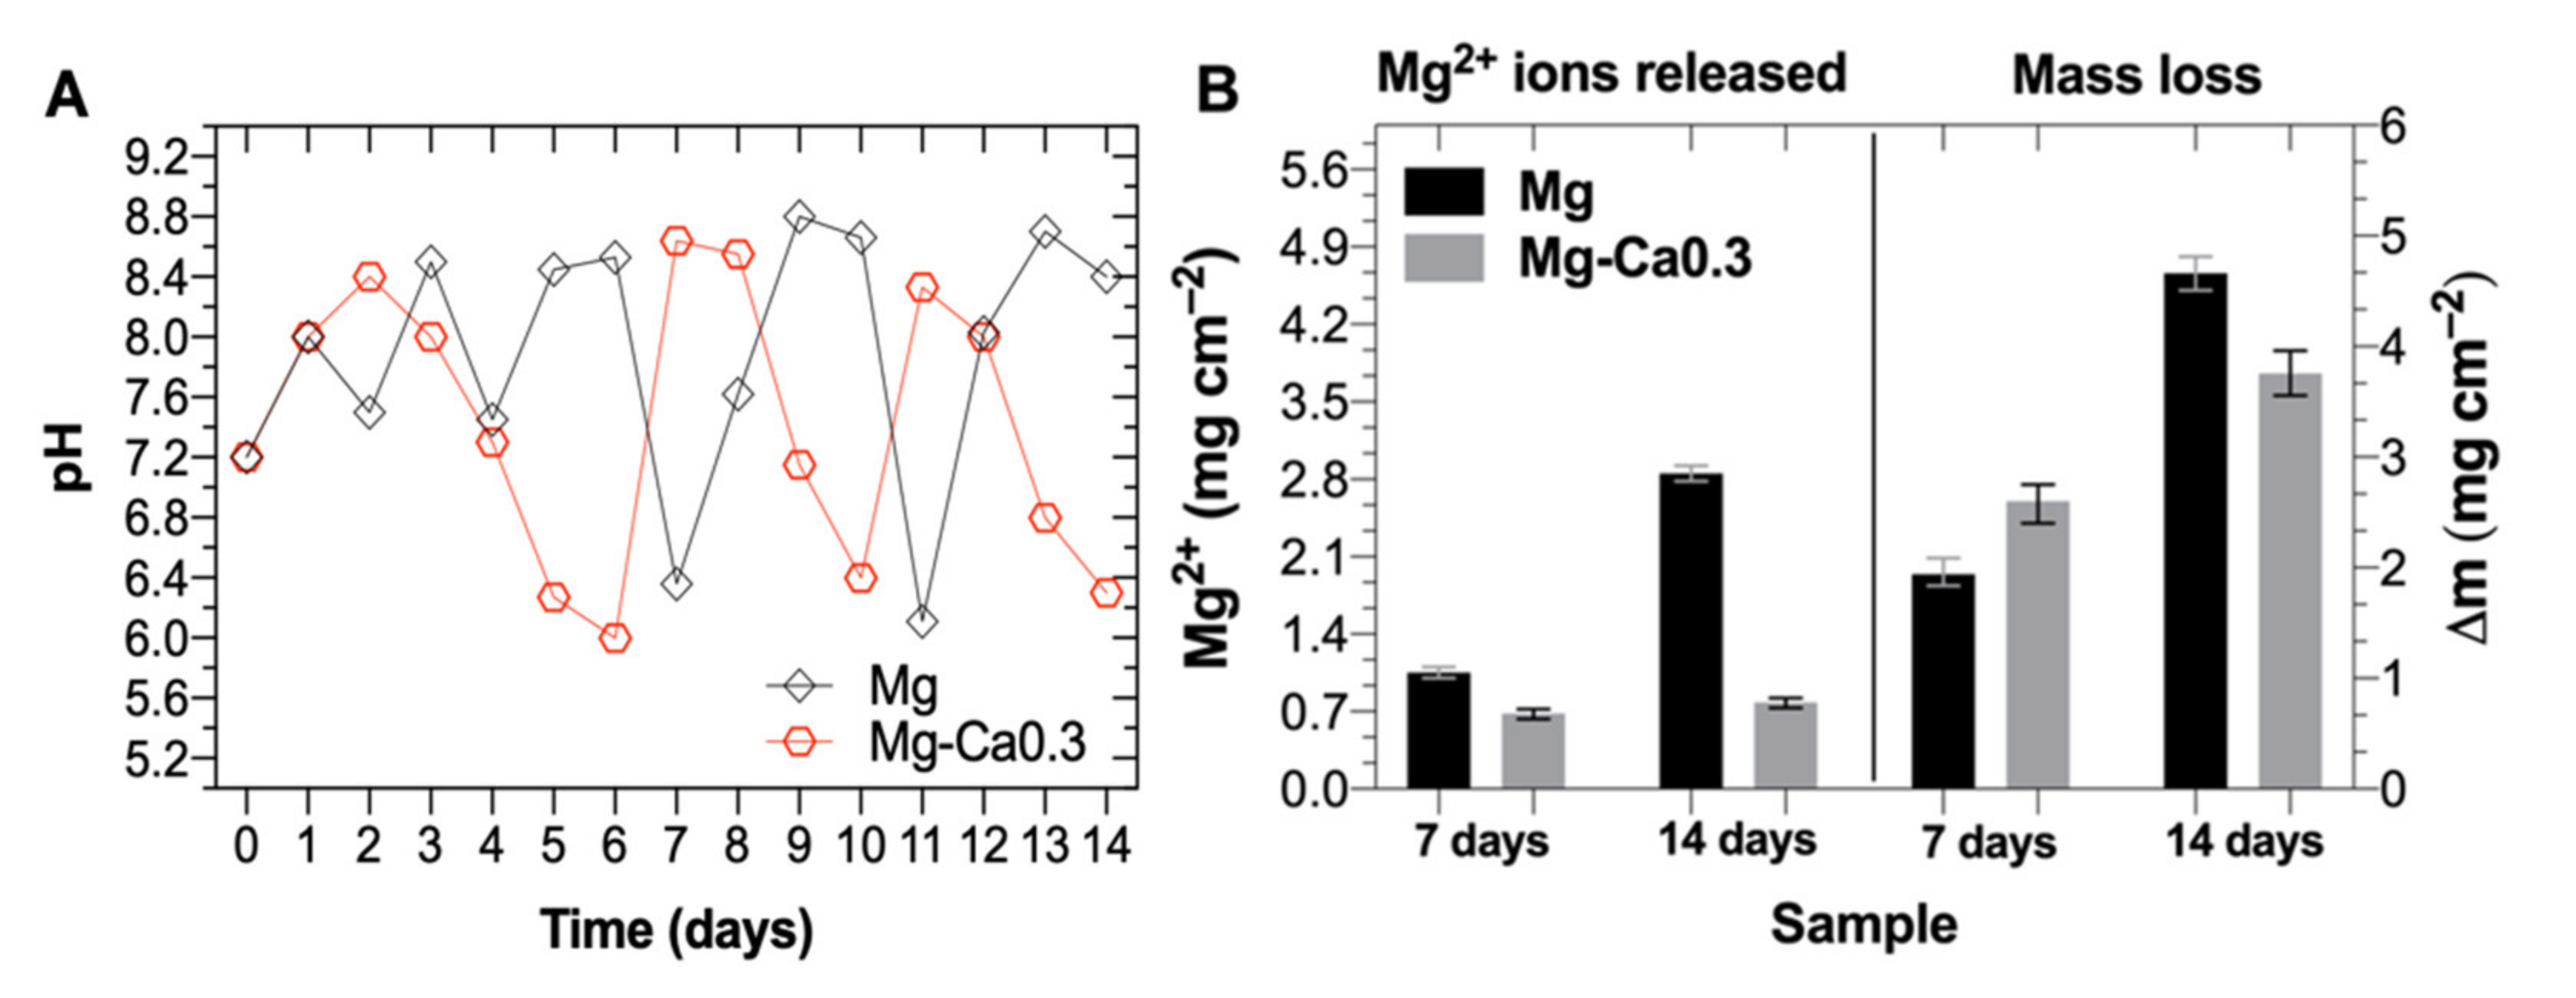
  • At the end of the experiment, the pH of Hank’s solution reached alkaline value of ~8.3 for Mg samples, while that of Mg-Ca0.3 decreased to pH ~6.3. The values of mass loss and concentration of the released Mg2+ ions were a consequence of the change in pH over time. The mass loss of Mg-Ca0.3 (3.76 mg cm−2) was ~20% lower than that of the Mg samples (4.66 mg cm−2). The concentration of released Mg2+ ions was ~3.6 times lower for the Mg-Ca0.3 alloy than that for Mg. A fraction of the mass loss and concentration of the released Mg2+ ions are a result of the formation of soluble MgCl2, as also considering the chelating effect of the gluconic acid.
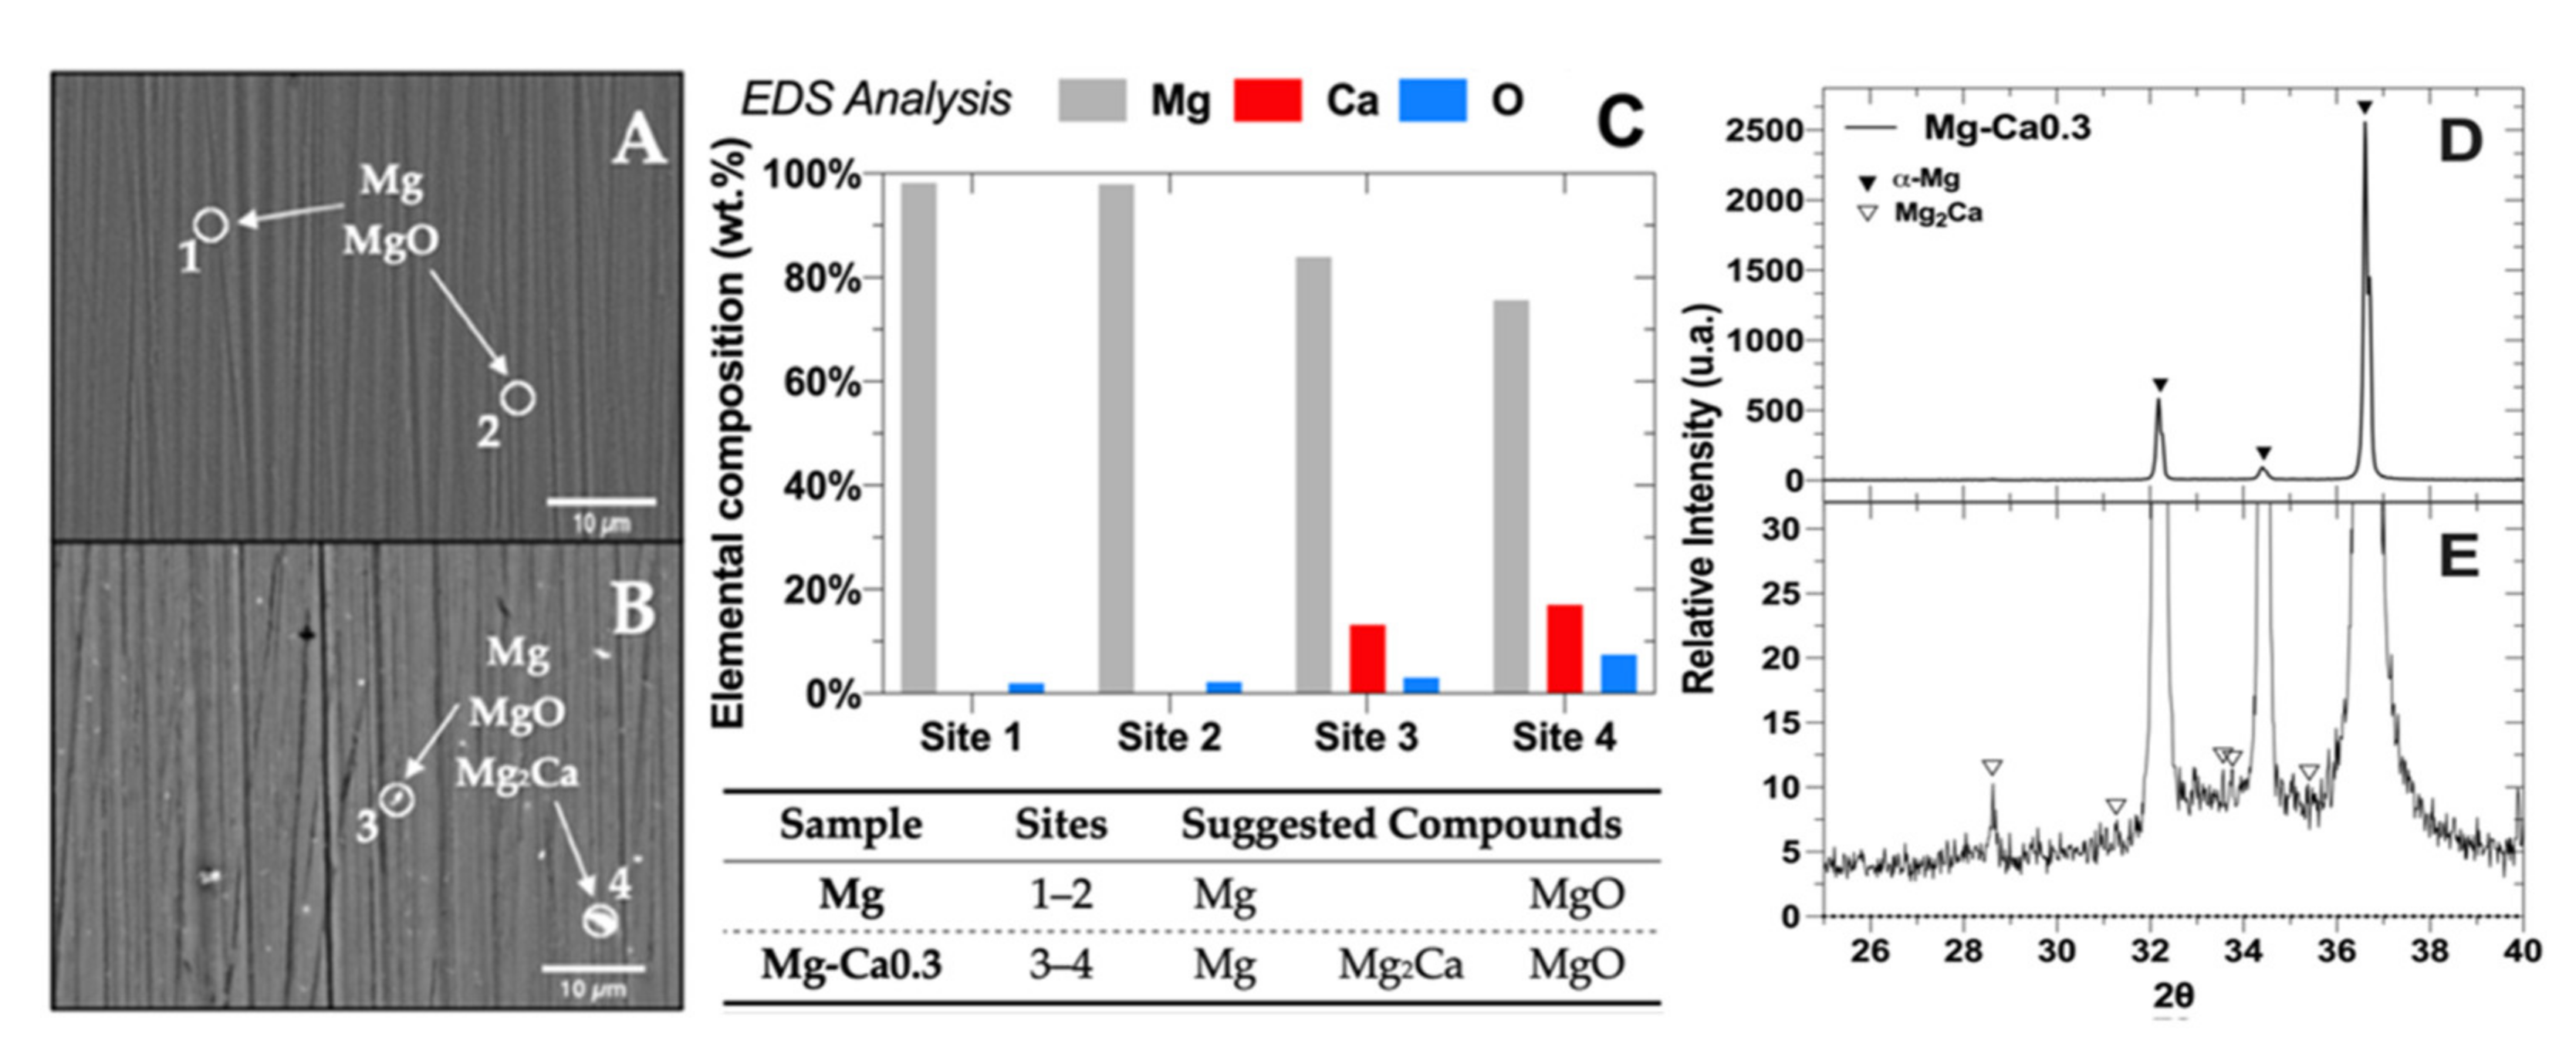
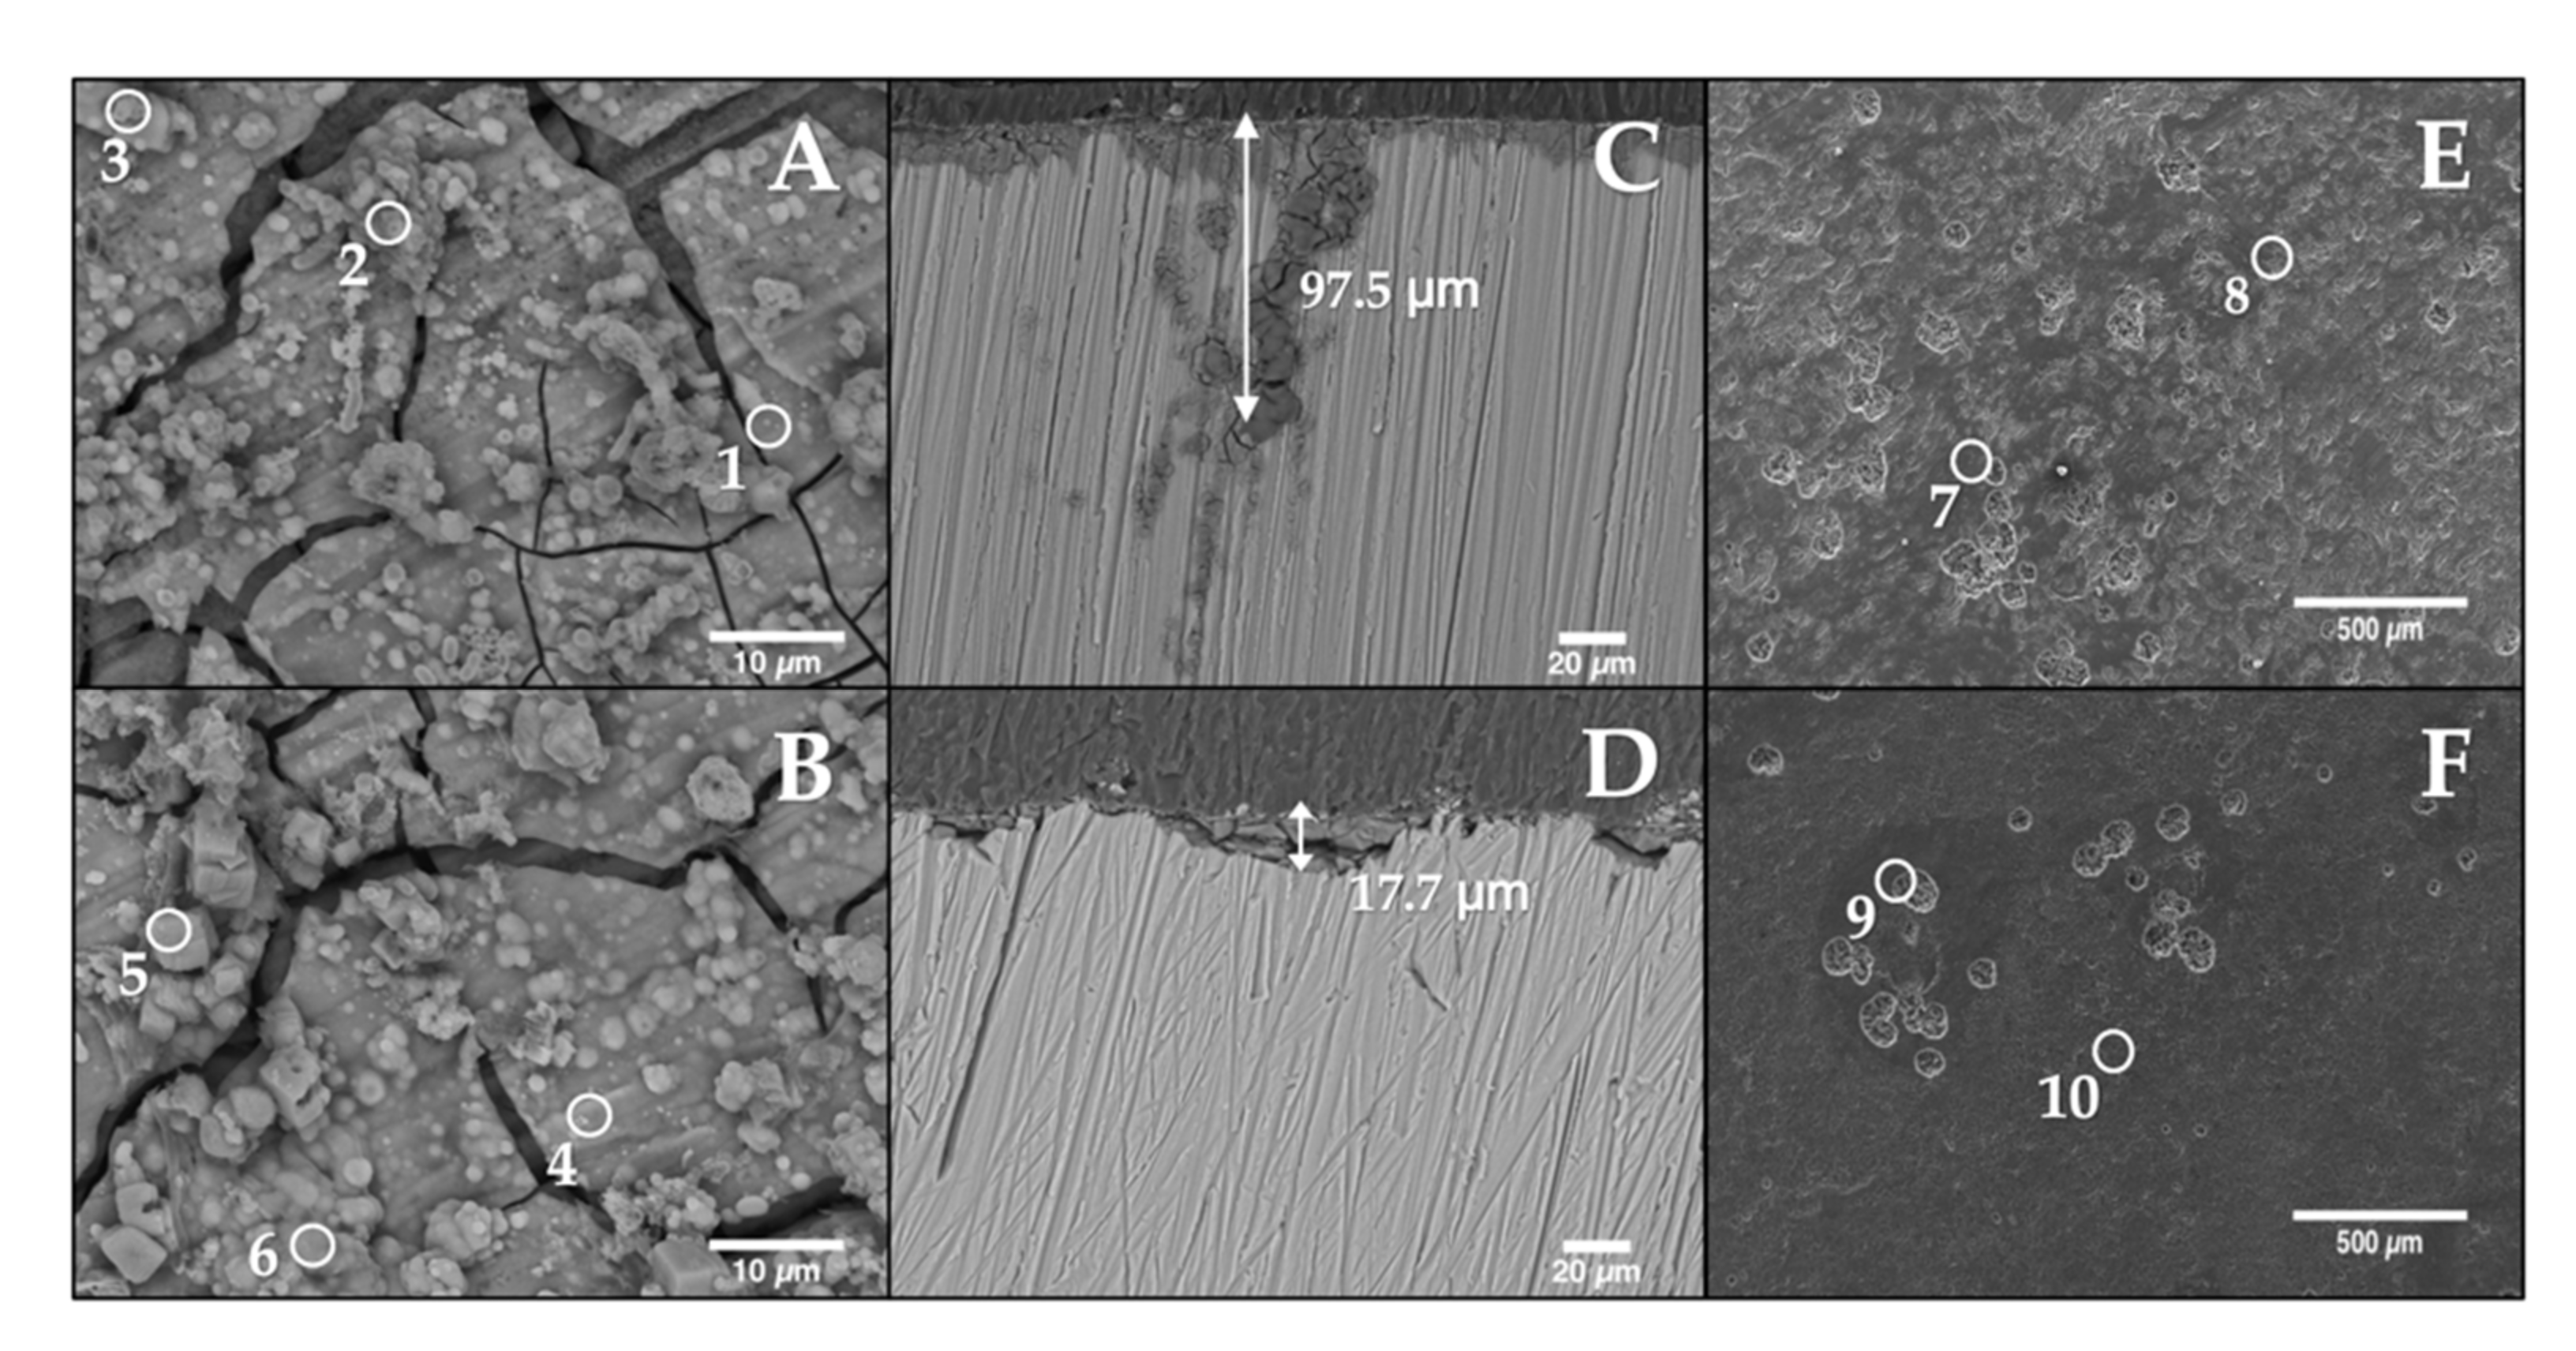
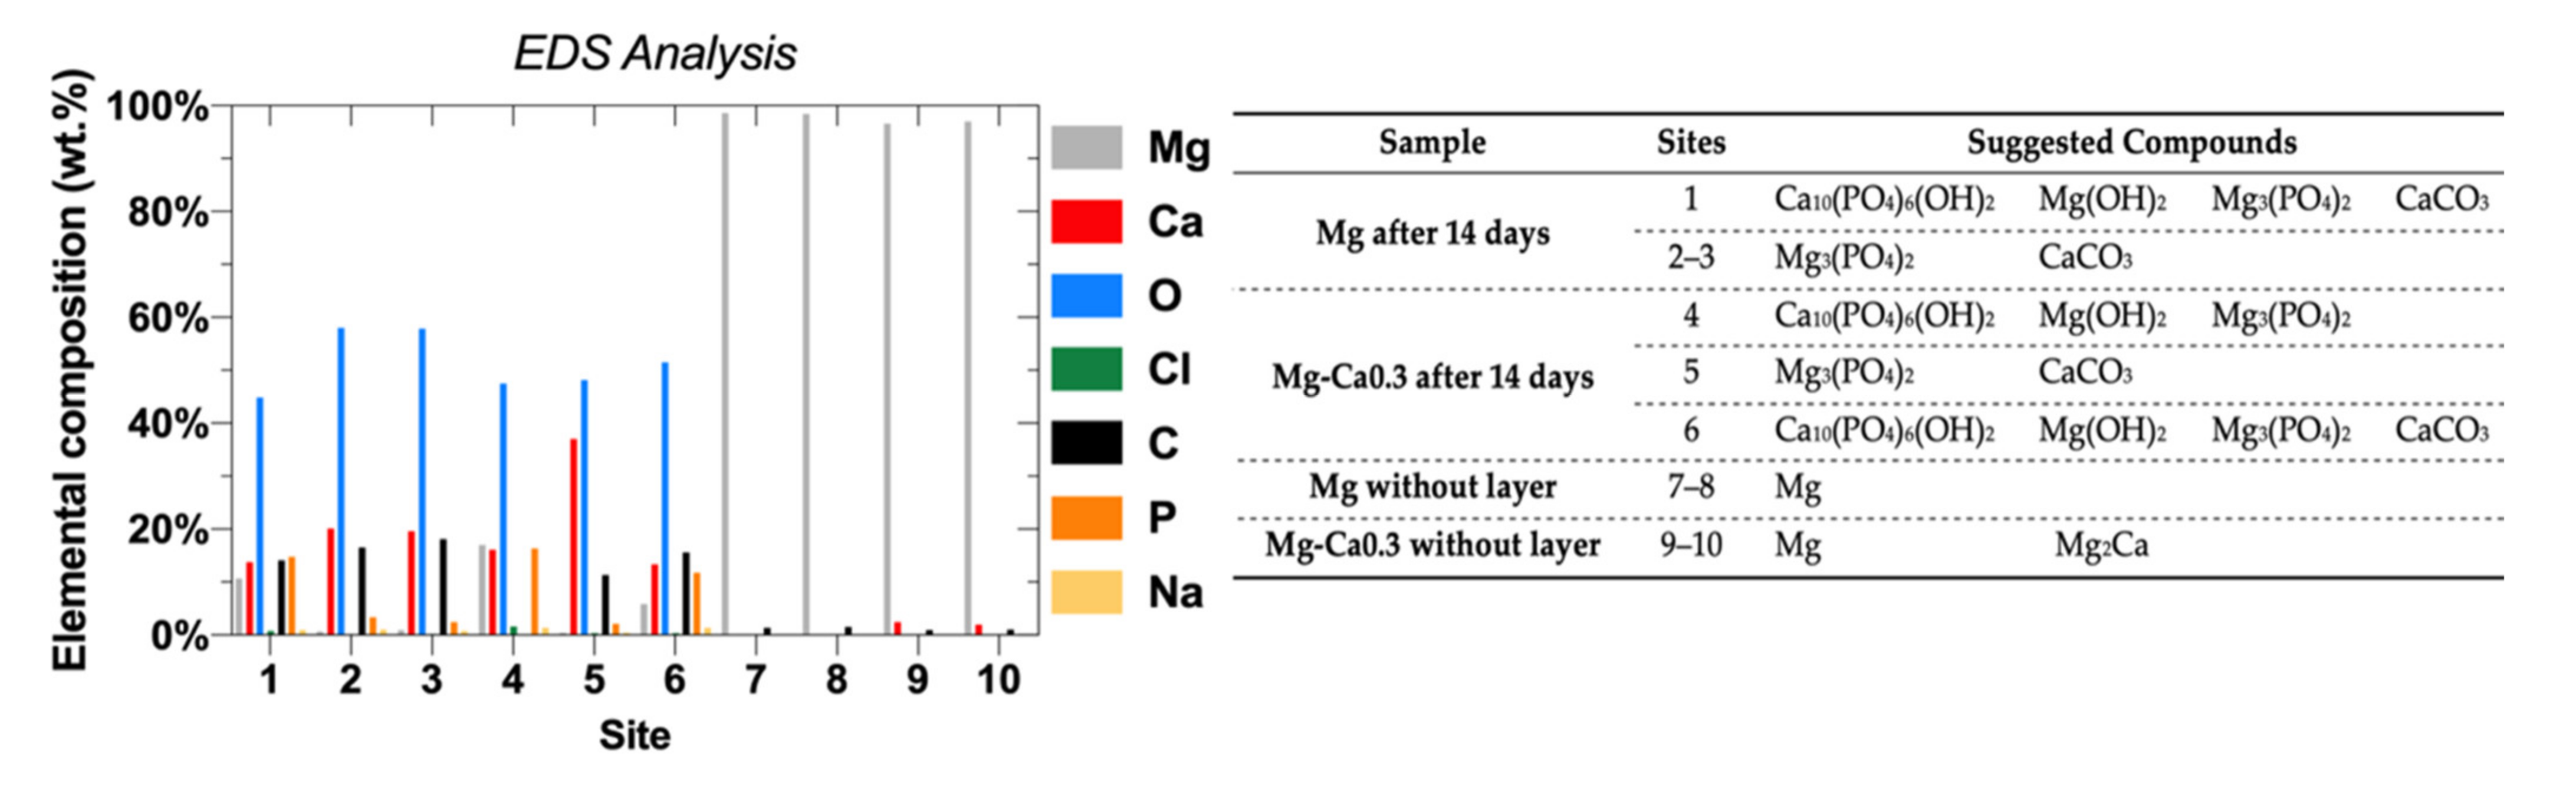
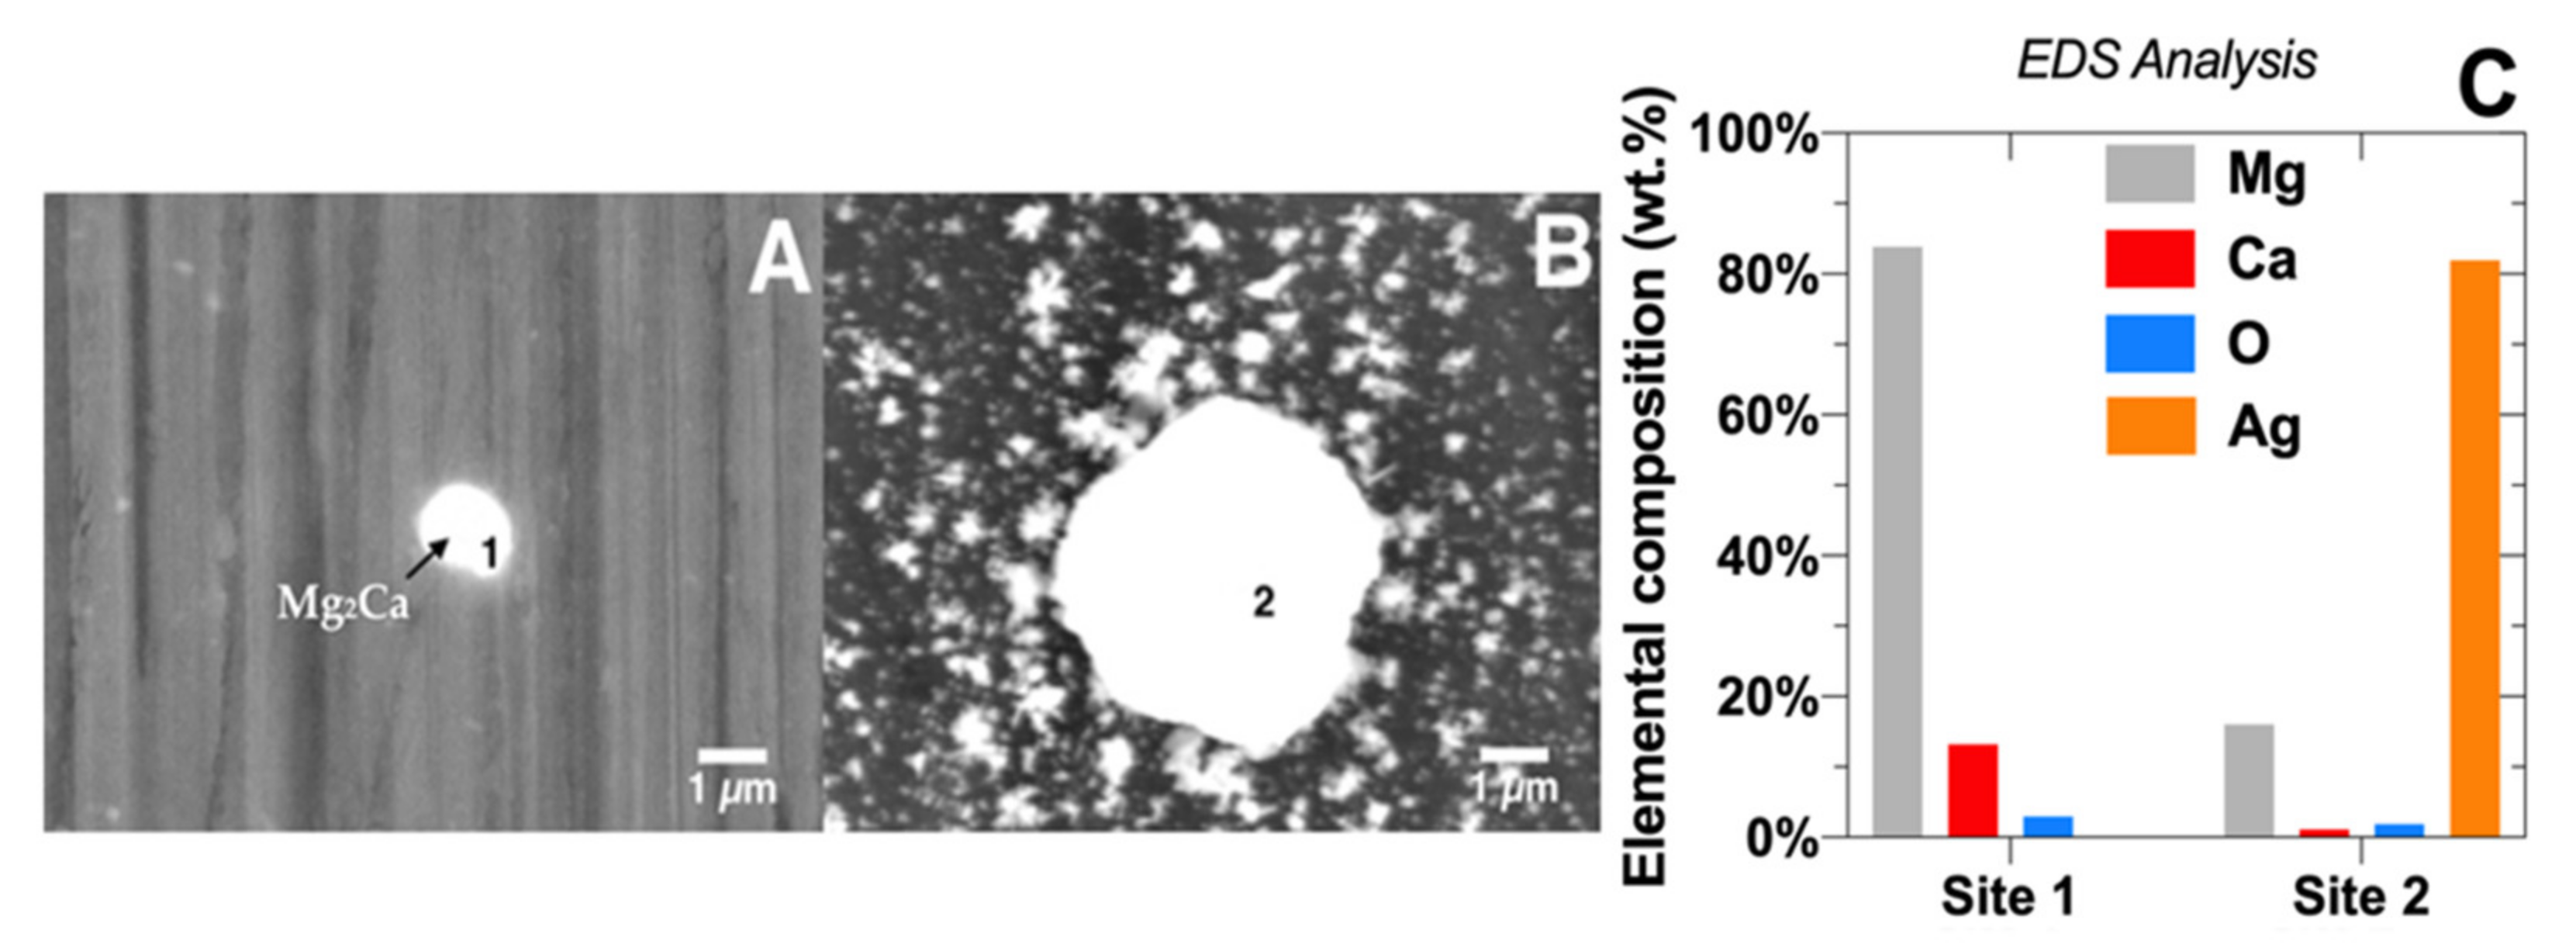
  • The intermetallic Mg2Ca particles appeared on the surface of Mg-Ca0.3 even after the removal of the formed layers, suggesting their role as local cathodic sites. According to the analysis of XPS spectra, the decrease in the content of the compounds formed on the Mg-Ca0.3 and Mg surfaces was as follows: Ca10(PO4)6(OH)2 > Mg3(PO4)2 > Mg(OH)2 > CaCO3.
  • The values of the EN-resistance (Rn) of Mg-Ca0.3 (3.42 kΩ cm2) was 5.5 times greater than that of Mg (0.62 kΩ cm2), indicating that the product layer formed on Mg-Ca0.3 is more protective.
  • The total polarization resistance (Rp), estimated from the EIS data indicated that Rp for Mg-Ca0.3 was ~three times higher than that of Mg, suggesting the Ca positive effect.
  • The electroless deposited Ag-nanoparticles (Ag-NPs) on Mg-Ca0.3 were characterized by the time evolution of the UV-Vis absorption spectra and change in color of the Mg-Ca0.3 substrate. The XRD spectra indicated the presence of nanostructured Ag crystals of FCC cell, in which the calculated average size was 10 nm.
  • The measured contact angle of the Ag-NPs (>120°) indicated that their surfaces may be considered as superhydrophobic, and thus, they may exhibit an antibacterial behavior. The calculated surface free energy (SFE) showed a tendency to very negative values, which suggest that the Ag-NPs exhibit a poor cell bacteria adhesion, as well as poor wettability properties.
  • The ability to prevent growth of S. aureus (Staphylococcus aureus) and E. coli (Escherichia coli) bacteria, in the presence of Ag-NPs, was proved by the agar disk diffusion method (Kirby–Bauer test). The greater antibacterial effect of S. aureus was attributed to its more negative zeta-potential, attracting more the released Ag+ ions from the Ag-NPs.

Author Contributions

J.L.G.-M. performed the corrosion and antibacterial tests. G.R.-G. contributed to UV-Vis of Ag-NPs analysis. M.Z.F.-T. contributed to antibacterial properties analysis. S.F.J. contributed to EIS analysis. J.L.G.-M. and L.V. discussed the results and wrote the manuscript. L.V. supervised the project. All correspondence should be directed to L.V. All authors have read and agreed to the published version of the manuscript.

Funding

This research received no external funding.

Institutional Review Board Statement

Not applicable.

Informed Consent Statement

Not applicable.

Data Availability Statement

Data presented in this study are available on request from the corresponding author. The data are not public, due to privacy issues.

Acknowledgments

J. Luis González-Murguía acknowledges the Mexican National Council for Science and Technology (CONACYT) for the scholarship granted to him for his Ph.D. study. The authors gratefully thank the National Laboratory of Nano- and Biomaterials (LANNBIO-CINVESTAV) for allowing the use of DRX, SEM-EDS and XPS facilities, and to Daniel Aguilar, Victor Rejón Moo and Willian Cauich for their support in data acquisition. The projects: FOMIX-Yucatán 2008-108160, CONACYT LAB-2009-01-123913, 292692, 294643, 188345 y 204822.

Conflicts of Interest

The authors declare no conflict of interest.

References

  1. Kirkland, N.T. Magnesium biomaterials: Past, present and future. Corros. Eng. Sci. Technol. 2012, 47, 322–328. [Google Scholar] [CrossRef] [Green Version]
  2. Li, N.; Zheng, Y. Novel Magnesium Alloys Developed for Biomedical Application: A Review. J. Mater. Sci. Technol. 2013, 29, 489–502. [Google Scholar] [CrossRef]
  3. Zheng, Y.; Gu, X.; Witte, F. Biodegradable metals. Mater. Sci. Eng. R. Rep. 2014, 77, 1–34. [Google Scholar] [CrossRef]
  4. Luthringer, B.J.; Feyerabend, F.; Willumeit-Römer, R. Magnesium-based implants: A mini-review. Magnes. Res. 2014, 27, 142–154. [Google Scholar] [CrossRef] [Green Version]
  5. Tkacz, J.; Slouková, K.; Minda, J.; Drábiková, J.; Fintová, S.; Doležal, P.; Wasserbauer, J. Influence of the Composition of the Hank’s Balanced Salt Solution on the Corrosion Behavior of AZ31 and AZ61 Magnesium Alloys. Metals 2017, 7, 465. [Google Scholar] [CrossRef] [Green Version]
  6. Riaz, U.; Shabib, I.; Haider, W. The current trends of Mg alloys in biomedical applications—A review. J. Biomed. Mater. Res. Part B Appl. Biomater. 2018, 107, 1970–1996. [Google Scholar] [CrossRef]
  7. Chen, Y.-T.; Hung, F.-Y.; Syu, J.-C. Biodegradable Implantation Material: Mechanical Properties and Surface Corrosion Mechanism of Mg-1Ca-0.5Zr Alloy. Metals 2019, 9, 857. [Google Scholar] [CrossRef] [Green Version]
  8. Kim, S.G.; Inoue, A.; Masumoto, T. Increase of Mechanical Strength of a Mg85Zn12Ce3 Amorphous Alloy by Dispersion of Ultrafine hcp-Mg Particles. Mater. Trans. JIM 1991, 32, 875–878. [Google Scholar] [CrossRef] [Green Version]
  9. The American Foundry Society Technical Department. Magnesium Alloys; The American Foundry Society Technical Department: Schaumburg, IL, USA, 2006. [Google Scholar]
  10. Staiger, M.P.; Pietak, A.M.; Huadmai, J.; Dias, G. Magnesium and its alloys as orthopedic biomaterials: A review. Biomaterials 2006, 27, 1728–1734. [Google Scholar] [CrossRef] [PubMed]
  11. Richards, A.M.; Coleman, N.W.; Knight, T.A.; Belkoff, S.M.; Mears, S.C. Bone density and cortical thickness in normal, osteopenic, and osteoporotic sacra. J. Osteoporos. 2010, 2010, 504078. [Google Scholar] [CrossRef] [Green Version]
  12. Li, L.C.; Gao, J.C.; Wang, Y. Evaluation of cyto-toxicity and corrosion behavior of alkali-heat-treated magnesium in simulated body fluid. Surf. Coat. Technol. 2004, 185, 92–98. [Google Scholar] [CrossRef]
  13. Pleshchitser, A. Biological Role of Magnesium. Clin. Chem. 1958, 4, 429–451. [Google Scholar] [CrossRef]
  14. Hartwig, A. Role of magnesium in genomic stability. Mutat. Res. 2001, 475, 113–121. [Google Scholar] [CrossRef]
  15. Chen, Q.; Thouas, G.A. Metallic implant biomaterials. Mater. Sci. Eng. R Rep. 2015, 87, 1–57. [Google Scholar] [CrossRef]
  16. Song, G.; Song, S. A Possible Biodegradable Magnesium Implant Material. Adv. Eng. Mater. 2007, 9, 298–302. [Google Scholar] [CrossRef]
  17. Witte, F.; Kaese, V.; Haferkamp, H.; Switzer, E.; Meyer-Lindenberg, A.; Wirth, C.J.; Windhagen, H. In vivo corrosion of four magnesium alloys and the associated bone response. Biomaterials 2005, 26, 3557–3563. [Google Scholar] [CrossRef]
  18. Serre, C.M.; Papillard, M.; Chavassieux, P.; Voegel, J.C.; Boivin, G. Influence of magnesium substitution on a collagen–apatite biomaterial on the production of a calcifying matrix by human osteoblasts. J. Biomed. Mater. Res. 1998, 42, 626–633. [Google Scholar] [CrossRef]
  19. Chen, Y.; Xu, Z.; Smith, C.; Sankar, J. Recent advances on the development of magnesium alloys for biodegradable implants. Acta Biomater. 2014, 10, 4561–4573. [Google Scholar] [CrossRef]
  20. Zhao, D.; Witte, F.; Lu, F.; Wang, J.; Li, J.; Qin, L. Current status on clinical applications of magnesium-based orthopaedic implants: A review from clinical translational perspective. Biomaterials 2017, 112, 287–302. [Google Scholar] [CrossRef]
  21. Seitz, J.-M.; Wulf, E.; Freytag, P.; Bormann, D.; Bach, F.-W. The Manufacture of Resorbable Suture Material from Magnesium. Adv. Eng. Mater. 2010, 12, 1099–1105. [Google Scholar] [CrossRef]
  22. Chng, C.B.; Lau, D.P.; Choo, J.Q.; Chui, C.K. A bioabsorbable microclip for laryngeal microsurgery: Design and evaluation. Acta Biomater. 2012, 8, 2835–2844. [Google Scholar] [CrossRef] [PubMed]
  23. ASTM F565-04. In Standard Practice for Care and Handling of Orthopedic Implants and Instruments; ASTM International: West Conshohocken, PA, USA, 2013. [CrossRef]
  24. Wen, C.E.; Mabuchi, M.; Yamada, Y.; Shimojima, K.; Chino, Y.; Asahina, T. Processing of biocompatible porous Ti and Mg. Scr. Mater. 2001, 45, 1147–1153. [Google Scholar] [CrossRef]
  25. Yamasaki, Y.; Yoshida, Y.; Okazaki, M.; Shimazu, A.; Uchida, T.; Kubo, T.; Akagawa, Y.; Hamada, Y.; Takahashi, J.; Matsuura, N. Synthesis of functionally graded MgCO3 apatite accelerating osteoblast adhesion. J. Biomed. Mater. Res. 2002, 62, 99–105. [Google Scholar] [CrossRef]
  26. Wolf, F.I.; Cittadini, A. Chemistry and biochemistry of magnesium. Mol. Asp. Med. 2003, 24, 3–9. [Google Scholar] [CrossRef]
  27. Zreiqat, H.; Howlett, C.R.; Zannettino, A.; Evans, P.; Schulze-Tanzil, G.; Knabe, C.; Shakibaei, K.M. Mechanisms of magnesium-stimulated adhesion of osteoblastic cells to commonly used orthopaedic implants. J. Biomed. Mater. Res. 2002, 62, 175–184. [Google Scholar] [CrossRef] [PubMed]
  28. Yamasaki, Y.; Yoshida, Y.; Okazaki, M.; Shimazu, A.; Kubo, T.; Akagawa, Y.; Uchida, T. Action of FGMgCO3Ap-collagen composite in promoting bone formation. Biomaterials 2003, 24, 4913–4920. [Google Scholar] [CrossRef]
  29. Revell, P.A.; Damien, E.; Zhang, X.S.; Evans, P.; Howlett, C.R. The Effect of Magnesium Ions on Bone Bonding to Hydroxyapatite Coating on Titanium Alloy Implants. Key Eng. Mater. 2003, 254, 447–450. [Google Scholar] [CrossRef]
  30. Park, J.B.; Bronzino, J.D. Biomaterials: Principles and Applications; CRC Press: Boca Raton, FL, USA, 2003; pp. 1–20. ISBN 0-8493-1491-7. [Google Scholar]
  31. Prakasam, M.; Locs, J.; Salma-Ancane, K.; Loca, D.; Largeteau, A.; Berzina-Cimdina, L. Biodegradable Materials and Metallic Implants-A Review. J. Funct. Biomater. 2017, 8, 44. [Google Scholar] [CrossRef] [Green Version]
  32. Song, G.L. Corrosion electrochemistry of magnesium (Mg) and its alloys. In Corrosion of Magnesium Alloys, 1st ed.; Song, G.L., Ed.; Woodhead Publishing: Cambridge, UK, 2011; pp. 3–65. [Google Scholar] [CrossRef]
  33. Bahmani, A.; Arthanari, S.; Shin, K.S. Formulation of corrosion rate of magnesium alloys using microstructural parameters. J. Magnes. Alloys 2020, 8, 134–149. [Google Scholar] [CrossRef]
  34. Pourbaix, M. Atlas of Electrochemical Equilibria in Aqueous Solution; Pergamon Press: Oxford, UK, 1966. [Google Scholar]
  35. Jenkins, H.D.B. Handbook of Chemistry and Physics, 73rd ed.; CRC Press: Boca Raton, FL, USA, 1992; p. 5585. [Google Scholar]
  36. Atkins, P.; De Paula, J. Atkins’ Physical Chemistry, 10th ed.; Oxford University Press: Oxford, UK, 2014; pp. 255–257. ISBN 9780198769866. [Google Scholar]
  37. Cui, L.; Liu, H.; Xue, K.; Zeng, W.; Li, R.; Guan, S. In Vitro Corrosion and Antibacterial Performance of Micro-Arc Oxidation Coating on AZ31 Magnesium Alloy: Effects of Tannic Acid. J. Electrochem. Soc. 2018, 165, C821–C829. [Google Scholar] [CrossRef]
  38. Curioni, M.; Salamone, L.; Scenini, F.; Santamaria, M.; Di Natale, M. A mathematical description accounting for the superfluous hydrogen evolution and the inductive behaviour observed during electrochemical measurements on magnesium. Electrochim. Acta 2018, 274, 343–352. [Google Scholar] [CrossRef]
  39. Makar, G.L.; Kruger, J. Corrosion of magnesium. Int. Mater. Rev. 1993, 38, 138–153. [Google Scholar] [CrossRef]
  40. Silva, E.L.; Lamaka, S.V.; Mei, D.; Zheludkevich, M.L. The reduction of dissolved oxygen during magnesium corrosion. Chem. Open 2018, 7, 664–668. [Google Scholar] [CrossRef] [PubMed]
  41. Strebl, M.; Bruns, M.; Virtanen, S. Editors’ choice—Respirometric in situ methods for real-time monitoring of corrosion rates: Part I. Atmospheric corrosion. J. Electrochem. Soc. 2020, 167, 021510. [Google Scholar] [CrossRef]
  42. Wang, C.; Mei, D.; Wiese, G.; Wang, L.; Deng, M.; Lamaka, S.V.; Zheludkevich, M.L. High rate oxygen reduction reaction during corrosion of ultra-high-purity magnesium. NPJ Mater. Degrad. 2020, 4, 42. [Google Scholar] [CrossRef]
  43. Li, S.; Yang, X.; Hou, J.; Du, W. A review on thermal conductivity of magnesium and its alloys. J. Magnes. Alloys 2020, 8, 78–90. [Google Scholar] [CrossRef]
  44. Mei, D.; Lamaka, S.V.; Lu, X.; Zheludkevich, M.L. Selecting medium for corrosion testing of bioabsorbable magnesium and other metals—A critical review. Corros. Sci. 2020, 171, 108722. [Google Scholar] [CrossRef]
  45. Barzegari, M.; Mei, D.; Lamaka, S.V.; Geris, L. Computational modeling of degradation process of biodegradable magnesium biomaterials. Corros. Sci. 2021, 109, 109674. [Google Scholar] [CrossRef]
  46. Zhang, E.; Yin, D.; Xu, L.; Yang, L.; Yang, K. Microstructure, mechanical and corrosion properties and biocompatibility of Mg–Zn–Mn alloys for biomedical application. Mater. Sci. Eng. C 2009, 29, 987–993. [Google Scholar] [CrossRef]
  47. Sankar, M.; Vishnu, J.; Gupta, M.; Manivasagam, G. Magnesium-Based Alloys and Nanocomposites for Biomedical Application, Applications of Nanocomposite Materials in Orthopedics; Woodhead Publishing: Cambridge, UK, 2018; pp. 83–109. [Google Scholar] [CrossRef]
  48. Nie, J.F.; Muddle, B.C. Precipitation hardening of Mg-Ca(-Zn) alloys. Scr. Mater. 1997, 37, 1475–1481. [Google Scholar] [CrossRef]
  49. Ilich, J.Z.; Kerstetter, J.E. Nutrition in bone health revisited: A story beyond calcium. J. Am. Coll. Nutr. 2000, 19, 715–737. [Google Scholar] [CrossRef] [PubMed]
  50. ASM International. Alloy Phase Diagram. In Handbook ASM; ASM International: Materials Park, OH, USA, 1992; Volume 3, p. 79. [Google Scholar]
  51. Xiong, X.; Yang, Y.; Deng, H.; Li, M.; Li, J.; Wei, G.; Peng, X. Effect of Ca Content on the Mechanical Properties and Corrosion Behaviors of Extruded Mg–7Li–3Al Alloys. Metals 2019, 9, 1212. [Google Scholar] [CrossRef] [Green Version]
  52. Li, Y.; Liang, Z.; Yang, L.; Zhao, W.; Wang, Y.; Yu, H.; Qin, C.; Wang, Z. Surface Morphologies and Mechanical Properties of Mg-Zn-Ca Amorphous Alloys under Chemistry-Mechanics Interactive Environments. Metals 2019, 9, 327. [Google Scholar] [CrossRef] [Green Version]
  53. Tan, L.; Yu, X.; Wan, P.; Yang, K. Biodegradable Materials for Bone Repairs: A Review. J. Mater. Sci. Technol. 2013, 29, 503–513. [Google Scholar] [CrossRef]
  54. Nam, N.D. Role of Zinc in Enhancing the Corrosion Resistance of Mg-5Ca Alloys. J. Electrochem. Soc. 2015, 163, C76–C84. [Google Scholar] [CrossRef] [Green Version]
  55. Villars, P.; Calvert, L.D.; Pearson, W.B. Pearson’s Handbook of Crystallographic Data for Intermetallic Phases; ASM International: Russell, OH, USA, 1985. [Google Scholar]
  56. Li, Z.J.; Gu, X.N.; Lou, S.Q.; Zheng, Y.F. The development of binary Mg–Ca alloys for use as biodegradable materials within bone. Biomaterials 2008, 29, 1329–1344. [Google Scholar] [CrossRef]
  57. Kirkland, N.T.; Birbilis, N.; Walker, J.; Woodfield, T.; Dias, G.J.; Staiger, M.P. In-vitro dissolution of magnesium–calcium binary alloys: Clarifying the unique role of calcium additions in bioresorbable magnesium implant alloys. J. Biomed. Mater. Res. 2010, 95, 91–100. [Google Scholar] [CrossRef] [PubMed]
  58. Zheng, H.; Yu, L.; Lyu, S.; You, C.; Chen, M. Insight into the Role and Mechanism of Nano MgO on the Hot Compressive Defor-mation Behavior of Mg-Zn-Ca Alloys. Metals 2020, 10, 1357. [Google Scholar] [CrossRef]
  59. Zhang, E.; Yang, L. Microstructure, mechanical properties and bio-corrosion properties of Mg–Zn–Mn–Ca alloy for biomedical application. Mater. Sci. Eng. A 2008, 497, 111–118. [Google Scholar] [CrossRef]
  60. Bakhsheshi-Rad, R.; Abdul-Kadir, M.R.; Idris, M.H.; Farahany, S. Relationship between the corrosion behavior and the thermal characteristics and microstructure of Mg–0.5Ca–xZn alloys. Corros. Sci. 2012, 64, 184–197. [Google Scholar] [CrossRef] [Green Version]
  61. Bakhsheshi Rad, H.R.; Hasbullah Idris, M.; Abdul Kadir, M.R.; Farahany, S. Microstructure analysis and corrosion behavior of biodegradable Mg–Ca implant alloys. Mater. Des. 2012, 33, 88–97. [Google Scholar] [CrossRef]
  62. Yang, J.; Peng, J.; Nyberg, E.A.; Pan, F.S. Effect of Ca addition on the corrosion behavior of Mg–Al–Mn alloy. Appl. Surf. Sci. 2016, 369, 92–100. [Google Scholar] [CrossRef]
  63. Mohedano, M.; Luthringer, B.J.C.; Mingo, B.; Feyerabend, F.; Arrabal, R.; Sanchez-Egido, P.J.; Blawert, C.; Willumeit-Römer, R.; Zheludkevich, M.L.; Matykina, E. Bioactive plasma electrolytic oxidation coatings on Mg-Ca alloy to control degradation behavior. Surf. Coat. Technol. 2017, 315, 454–467. [Google Scholar] [CrossRef]
  64. Lee, S.H.; Chung, D.S.; Park, B.O.; Kim, Y.G.; Jeong, H.G.; Kim, H.S. The Influence of Heat Treatment and Ca contents on the Electrochemical Characteristics of Mg-Ca Alloys. J. Korean Soc. Heat Treat. 2004, 17, 173–179. [Google Scholar]
  65. Kim, W.C.; Kim, J.G.; Lee, J.Y.; Seok, H.K. Influence of Ca on the corrosion properties of magnesium for biomaterials. Mater. Lett. 2008, 62, 4146–4148. [Google Scholar] [CrossRef]
  66. Saris, N.E.; Mervaala, E.; Karppanen, H.; Khawaja, J.A.; Lewenstam, A. Magnesium: An update on physiological, clinical and analytical aspects. Clin. Chim. Acta 2000, 294, 1–26. [Google Scholar] [CrossRef]
  67. Okuma, T. Magnesium and bone strength. Nutrition 2001, 17, 679–680. [Google Scholar] [CrossRef]
  68. Wan, Y.; Xiong, G.; Luo, H.; He, F.; Huang, Y.; Zhou, X. Preparation and characterization of a new biomedical magnesium–calcium alloy. Mater. Des. 2008, 29, 2034–2037. [Google Scholar] [CrossRef]
  69. Witte, F.; Hort, N.; Vogt, C.; Cohen, S.; Kainer, K.U.; Willumeit, R. Degradable biomaterials based on magnesium corrosion. Curr. Opin. Solid State Mater. Sci. 2008, 12, 63–72. [Google Scholar] [CrossRef] [Green Version]
  70. Harandi, S.E.; Mirshahi, M.; Koleini, S.; Idris, M.H.; Jafari, H.; Kadir, M.R.A. Effect of calcium content on the microstructure, hardness and in-vitro corrosion behavior of biodegradable Mg-Ca binary alloy. Mater. Res. 2013, 16, 11–18. [Google Scholar] [CrossRef] [Green Version]
  71. Coelho, P.G.; Jimbo, R. Osseointegration of metallic devices: Current trends based on implant hardware design. Arch. Biochem. Biophys. 2014, 561, 99–108. [Google Scholar] [CrossRef]
  72. Sedelnikova, M.B.; Komarova, E.G.; Sharkeev, Y.P.; Tolkacheva, T.V.; Sheikin, V.V.; Egorkin, V.S.; Mashtalyar, D.V.; Kazakbaeva, A.A.; Schmidt, J. Characterization of the Micro-Arc Coatings Containing β-Tricalcium Phosphate Particles on Mg-0.8Ca Alloy. Metals 2018, 8, 238. [Google Scholar] [CrossRef] [Green Version]
  73. Sedelnikova, M.B.; Ugodchikova, A.V.; Tolkacheva, T.V.; Chebodaeva, V.V.; Cluklhov, I.A.; Khimich, M.A.; Bakina, O.V.; Lerner, M.I.; Egorkin, V.S.; Schmidt, J.; et al. Surface Modification of Mg0.8Ca Alloy via Wollastonite Micro-Arc Coatings: Sig-nificant Improvement in Corrosion Resistance. Metals 2021, 11, 754. [Google Scholar] [CrossRef]
  74. Nidadavolu, E.P.S. Degradation Behavior of Mg-Ca Alloys. Master’s Thesis, Technische Fakultät Christian-Albrechts-Universität zu Kiel, Geesthacht, Germany, 2015. [Google Scholar]
  75. Nidadavolu, E.P.S.; Feyerabend, F.; Ebel, T.; Willumeit-Römer, R.; Dahms, M. On the Determination of Magnesium Degradation Rates under Physiological Conditions. Materials 2016, 9, 627. [Google Scholar] [CrossRef] [Green Version]
  76. Nidadavolu, E.P.S.; Krüger, D.; Zeller-Plumhoff, B.; Tolnai, D.; Wiese, B.; Feyerabend, F.; Ebel, T.; Willumeit-Römer, R. Pore characterization of PM Mg–0.6Ca alloy and its degradation behavior under physiological conditions. J. Magnes. Alloys 2021, 9, 686–703. [Google Scholar] [CrossRef]
  77. Krause, A.; von der Höh, N.; Bormann, D.; Krause, C.; Bach, F.-W.; Windhagen, H.; Meyer-Lindenberg, A. Degradation behaviour and mechanical properties of magnesium implants in rabbit tibiae. J. Mater. Sci. 2010, 45, 624–632. [Google Scholar] [CrossRef]
  78. Necula, B.S.; Fratila-Apachitei, L.E.; Berkani, A.; Apachitei, I.; Duszczyk, J. Enrichment of anodic MgO layers with Ag nanoparticles for biomedical applications. J. Mater. Sci. Mater. Med. 2009, 20, 339–345. [Google Scholar] [CrossRef] [Green Version]
  79. Oh, J.K.; Yegin, Y.; Yang, F.; Zhang, M.; Li, J.; Huang, S.; Verkhoturov, S.V.; Schweikert, E.A.; Perez-Lewis, K.; Scholar, E.A.; et al. The influence of surface chemistry on the kinetics and thermodynamics of bacterial adhesion. Sci. Rep. 2018, 8, 17247. [Google Scholar] [CrossRef] [PubMed]
  80. Hori, K.; Matsumoto, S. Bacterial adhesion: From mechanism to control. Biochem. Eng. J. 2010, 48, 424–434. [Google Scholar] [CrossRef]
  81. Van der Wal, A.; Norde, W.; Zehnder, A.J.B.; Lyklema, J. Determination of the total charge in the cell walls of Gram-positive bacteria. Colloids Surf. B Biointerfaces 1997, 9, 81–100. [Google Scholar] [CrossRef]
  82. An, Y.H.; Friedman, R.J. Concise review of mechanisms of bacterial adhesion to biomaterial surfaces. J. Biomed. Mater. Res. 1998, 43, 338–348. [Google Scholar] [CrossRef]
  83. Hermansson, M. The DLVO theory in microbial adhesion. Colloids Surf. B Biointerfaces 1999, 14, 105–119. [Google Scholar] [CrossRef]
  84. Wilson, W.; Wade, M.; Holman, S.C.; Champlin, F.R. Status of methods for assessing bacterial cell surface charge properties based on zeta potential measurements. J. Microbiol. Methods 2001, 43, 153–164. [Google Scholar] [CrossRef]
  85. Poortinga, A.T.; Bos, R.; Norde, W.; Busscher, H.J. Electric double layer interactions in bacterial adhesion to surfaces. Surf. Sci. Rep. 2002, 47, 1–32. [Google Scholar] [CrossRef]
  86. Speranza, G.; Gottardi, G.; Pederzolli, C.; Lunelli, L.; Canteri, R.; Pasquardini, L.; Carli, E.; Lui, A.; Maniglio, D.; Brugnara, M.; et al. Role of chemical interactions in bacterial adhesion to polymer surfaces. Biomaterials 2004, 25, 2029–2037. [Google Scholar] [CrossRef]
  87. Redman, J.A.; Walker, S.L.; Elimelech, M. Bacterial Adhesion and Transport in Porous Media:  Role of the Secondary Energy Minimum. Eviron. Sci. Technol. 2004, 38, 1777–1785. [Google Scholar] [CrossRef] [PubMed]
  88. Cerca, N.; Pier, G.B.; Vilanova, M.; Oliveira, R.; Azeredo, J. Quantitative analysis of adhesion and biofilm formation on hydrophilic and hydrophobic surfaces of clinical isolates of Staphylococcus epidermidis. Res. Microbiol. 2005, 156, 506–514. [Google Scholar] [CrossRef] [Green Version]
  89. Boks, N.P.; Norde, W.; van der Mei, H.C.; Busscher, H.J. Forces involved in bacterial adhesion to hydrophilic and hydrophobic surfaces. Microbiology 2008, 154, 3122–3133. [Google Scholar] [CrossRef] [PubMed] [Green Version]
  90. Kłodzińska, E.; Szumski, M.; Dziubakiewicz, E.; Hrynkiewicz, K.; Skwarek, E.; Janusz, W.; Buszewski, B. Effect of zeta potential value on bacterial behavior during electrophoretic separation. Electrophoresis 2010, 31, 1590–1596. [Google Scholar] [CrossRef]
  91. Robinson, D.A.; Griffith, R.W.; Shechtman, D.; Evans, R.B.; Conzemius, M.G. In vitro antibacterial properties of magnesium metal against Escherichia coli, Pseudomonas aeruginosa and Staphylococcus aureus. Acta Biomater. 2010, 6, 1869–1877. [Google Scholar] [CrossRef]
  92. Ren, L.; Lin, X.; Tan, L.; Yang, K. Effect of surface coating on antibacterial behavior of magnesium based metals. Mater. Lett. 2011, 65, 3509–3511. [Google Scholar] [CrossRef]
  93. Sondi, I.; Salopek-Sondi, B. Silver nanoparticles as antimicrobial agent: A case study on E. coli as a model for Gram-negative bacteria. J. Colloid Interface Sci. 2004, 275, 177–182. [Google Scholar] [CrossRef]
  94. Alt, V.; Bechert, T.; Steinrücke, P.; Wagener, M.; Seidel, P.; Dingeldein, E.; Domann, E.; Schnettler, R. An in vitro assessment of the antibacterial properties and cytotoxicity of nanoparticulate silver bone cement. Biomaterials 2004, 25, 4383–4391. [Google Scholar] [CrossRef]
  95. Kim, J.S.; Kuk, E.; Yu, K.; Kim, J.; Park, S.; Lee, H.; Kim, S.; Park, Y.; Park, Y.; Hwang, C.; et al. Antimicrobial effects of silver nanoparticles. Nanomedicine 2007, 3, 95–101. [Google Scholar] [CrossRef] [PubMed]
  96. Shahverdi, A.R.; Fakhimi, A.; Shahverdi, H.R.; Minaian, S. Synthesis and effect of silver nanoparticles on the antibacterial activity of different antibiotics against Staphylococcus aureus and Escherichia coli. Nanomedicine 2007, 3, 168–171. [Google Scholar] [CrossRef]
  97. Burdușel, A.-C.; Gherasim, O.; Grumezescu, A.; Mogoantă, L.; Ficai, A.; Andronescu, E. Biomedical Applications of Silver Nanoparticles: An Up-to-Date Overview. Nanomaterials 2018, 8, 681. [Google Scholar] [CrossRef] [PubMed] [Green Version]
  98. Liu, Y.; Li, C.; Luo, S.; Wang, X.; Zhang, Q.; Wu, H. Inter-transformation between silver nanoparticles and Ag+ induced by humic acid under light or dark conditions. Ecotoxicology 2020, 30, 1376–1385. [Google Scholar] [CrossRef]
  99. Pan, X.; Medina-Ramirez, I.; Mernaugh, R.; Liu, J. Nanocharacterization and bactericidal performance of silver modified titania photocatalyst. Colloids Surf. B Biointerfaces 2010, 77, 82–89. [Google Scholar] [CrossRef]
  100. Wang, X.; Hou, X.; Luan, W.; Li, D.; Yao, K. The antibacterial and hydrophilic properties of silver-doped TiO2 thin films using sol–gel method. Appl. Surf. Sci. 2012, 258, 8241–8246. [Google Scholar] [CrossRef]
  101. Rusu, A.; Hancu, G.; Cristina Munteanu, A.; Uivarosi, V. Development perspectives of silver complexes with antibacterial quinolones: Successful or not? J. Organomet. Chem. 2017, 839, 19–30. [Google Scholar] [CrossRef]
  102. ISO 16428. Implants for Surgery—Test Solutions and Environmental Conditions for Static and Dynamic Corrosion Tests on Implantable Materials and Medical Devices; ISO: Geneve, Switzerland, 2005.
  103. Kuwahara, H.; Al-Abdullat, Y.; Mazaki, N.; Tsutsumi, S.; Aizawa, T. Precipitation of Magnesium Apatite on Pure Magnesium Surface during Immersing in Hank’s Solution. Mater. Trans. 2001, 42, 1317–1321. [Google Scholar] [CrossRef] [Green Version]
  104. Abidin, N.I.Z.; Martin, D.; Atrens, A. Corrosion of high purity Mg, AZ91, ZE41 and Mg2Zn0.2Mn in Hank’s solution at room temperature. Corros. Sci. 2011, 53, 862–872. [Google Scholar] [CrossRef]
  105. ASTM G31-12a. In Standard Guide for Laboratory Immersion Corrosion Testing of Metals; ASTM International: West Conshohocken, PA, USA, 2021. [CrossRef]
  106. ASTM G1-03. In Standard Practice for Preparing, Cleaning and Evaluating Corrosion Test Specimens; ASTM International: West Conshohocken, PA, USA, 2017. [CrossRef]
  107. ASTM G199-09. In Standard Guide for Electrochemical Noise Measurement; ASTM International: West Conshohocken, PA, USA, 2020. [CrossRef]
  108. Dawson, J.L. Electrochemical noise measurement: The definitive in-situ technique for corrosion applications. In Electrochemical Noise Measurement for Corrosion Applications; Kearns, J., Scully, J., Roberge, P., Reichert, D., Dawson, J.L., Eds.; ASTM STP 1277; ASTM International: West Conshohocken, PA, USA, 1996; pp. 3–35. [Google Scholar] [CrossRef]
  109. Xia, D.-H.; Song, S.-Z.; Behnamian, Y. Detection of corrosion degradation using electrochemical noise (EN): Review of signal processing methods for identifying corrosion forms. Corros. Eng. Sci. Technol. 2016, 51, 527–544. [Google Scholar] [CrossRef]
  110. Zhao, H.; Cui, J. Electroless plating of silver on AZ31 magnesium alloy substrate. Surf. Coat. Technol. 2007, 201, 4512–4517. [Google Scholar] [CrossRef]
  111. Djokić, S.S.; Cavallotti, P.L. Electroless Deposition: Theory and Applications. In Electrodeposition. Modern Aspects of Electrochemistry; Djokic, S., Ed.; Springer: New York, NY, USA, 2010; Volume 4, pp. 251–289. [Google Scholar] [CrossRef]
  112. Heatley, N.G. A method for the assay of penicillin. Biochem. J. 1944, 38, 61–65. [Google Scholar] [CrossRef] [Green Version]
  113. Clinical and Laboratory Standards Institute. M02-A11, Performance Standards for Antimicrobial Disk Susceptibility Tests: Approved Standard; Clinical and Laboratory Standards Institute: Wayne, PA, USA, 2012. [Google Scholar]
  114. Balouiri, M.; Sadiki, M.; Ibnsouda, S.K. Methods for in vitro evaluating antimicrobial activity: A review. J. Pharm. Anal. 2016, 6, 71–79. [Google Scholar] [CrossRef] [Green Version]
  115. Liu, Y.; Liu, X.; Zhang, Z.; Farrell, N.; Chen, D.; Zheng, Y. Comparative, real-time in situ monitoring of galvanic corrosion in Mg-Mg2Ca and Mg-MgZn2 couples in Hank’s solution. Corros. Sci. 2019, 161, 108185. [Google Scholar] [CrossRef]
  116. Ding, Z.Y.; Cui, L.Y.; Chen, X.B.; Zeng, R.C.; Guan, S.K.; Li, S.Q.; Zhang, F.; Zou, Y.H.; Liu, Q.Y. In vitro corrosion of micro-arc oxidation coating on Mg-1Li-1Ca alloy—The influence of intermetallic compound Mg2Ca. J. Alloys Compd. 2018, 764, 250–260. [Google Scholar] [CrossRef]
  117. Khorasani, F.; Emamy, M.; Malekan, M.; Mirzadeh, H.; Pourbahari, B.; Krajnák, T.; Minárik, P. Enhancement of the microstructure and elevated temperature mechanical properties of as-cast Mg-Al2Ca-Mg2Ca in-situ composite by hot extrusion. Mater. Charact. 2019, 147, 155–164. [Google Scholar] [CrossRef]
  118. Zeng, R.C.; Li, X.T.; Li, S.Q.; Zhang, F.; Han, E.H. In vitro degradation of pure Mg in response to glucose. Sci. Rep. 2015, 5, 13026. [Google Scholar] [CrossRef] [PubMed]
  119. Thakur, V.K.; Thakur, M.K.; Kessler, M.R. Handbook of Composites from Renewable Materials; John Wiley & Sons: Hobokken, NJ, USA, 2017. [Google Scholar]
  120. Zhang, Y.F.; Hinton, B.; Wallace, G.; Liu, X.; Forsyth, M. On corrosion behaviour of magnesium alloy AZ31 in simulated body fluids and influence of ionic liquid pretreatments. Corros. Eng. Sci. Technol. 2012, 47, 374–382. [Google Scholar] [CrossRef]
  121. Gnedenkov, A.S.; Mei, D.; Lamaka, S.V.; Sinebryukhov, S.L.; Mashtalyar, D.V.; Vyaliy, I.E.; Zheludkevich, M.L.; Gnedenkov, S.V. Localized currents and pH distribution studied during corrosion of MA8 Mg alloy in the cell culture medium. Corros. Sci. 2020, 170, 108689. [Google Scholar] [CrossRef]
  122. Song, G.L.; Atrens, A. Corrosion Mechanisms of Magnesium Alloys. Adv. Eng. Mater. 2000, 1, 11–33. [Google Scholar] [CrossRef]
  123. Santamaria, M.; Di Quarto, F.; Zanna, S.; Marcus, P. Initial surface film on magnesium metal: A characterization by X-ray photoelectron spectroscopy (XPS) and photocurrent spectroscopy (PCS). Electrochim. Acta 2007, 53, 1314–1324. [Google Scholar] [CrossRef] [Green Version]
  124. Fournier, V.; Marcus, P.; Olefjord, I. Oxidation of magnesium. Surf. Int. Anal. 2002, 34, 494–497. [Google Scholar] [CrossRef]
  125. Moulder, J.F.; Stickle, W.F.; Sobol, P.E.; Bomben, K.D. Handbook of X-Ray Photoelectron Spectroscopy; Physical Electronics Inc.: Chanhassen, MN, USA, 1992. [Google Scholar]
  126. Felker, D.L.; Sherwood, P.M.A. Magnesium Phosphate (Mg3(PO4)2) by XPS. Surf. Sci. Spectra 2001, 8, 38–44. [Google Scholar] [CrossRef]
  127. Nelson, A.E. Mature Dental Enamel [Calcium Hydroxyapatite, Ca10(PO4)6(OH)2] by XPS. Surf. Sci. Spectra 2002, 9, 250–259. [Google Scholar] [CrossRef]
  128. Baer, D.R.; Moulder, J.F. High Resolution XPS Spectrum of Calcite (CaCO3). Surf. Sci. Spectra 1993, 2, 1–7. [Google Scholar] [CrossRef]
  129. Song, Y.; Shan, D.; Chen, R.; Zhang, F.; Han, E.H. Biodegradable behaviors of AZ31 magnesium alloy in simulated body fluid. Mater. Sci. Eng. C 2009, 29, 1039–1045. [Google Scholar] [CrossRef]
  130. Yamamoto, A.; Hiromoto, S. Effect of inorganic salts, amino acids and proteins on the degradation of pure magnesium in vitro. Mater. Sci. Eng. C 2009, 29, 1559–1568. [Google Scholar] [CrossRef]
  131. Xin, Y.; Hu, T.; Chu, P.K. Degradation behaviour of pure magnesium in simulated body fluids with different concentrations of HCO3. Corros. Sci. 2011, 53, 1522–1528. [Google Scholar] [CrossRef]
  132. Atrens, A.; Song, G.L.; Cao, F.; Shi, Z.; Bowen, P.K. Advances in Mg corrosion and research suggestions. J. Magnes. Alloys 2013, 1, 177–200. [Google Scholar] [CrossRef] [Green Version]
  133. ASTM G102–89. In Standard Practice for Calculation of Corrosion Rates and Related Information from Electrochemical Measurements; ASTM International: West Conshohocken, PA, USA, 1989. [CrossRef]
  134. Hladky, K.; Dawson, J.L. The measurement of corrosion using electrochemical 1f noise. Corros. Sci. 1982, 22, 231–237. [Google Scholar] [CrossRef]
  135. Kearns, J.R.; Eden, D.A.; Yaffe, M.R.; Fahey, J.V.; Reichert, D.L.; Silverman, D.C. ASTM Standardization of Electrochemical Noise Measurement. In Electrochemical Noise Measurement for Corrosion Applications; Kearns, J.R., Scully, J.R., Roberge, P.R., Reirchert, D.L., Dawson, L., Eds.; ASTM International: Russell, OH, USA, 1996; pp. 446–471. [Google Scholar]
  136. Cottis, R.A. Interpretation of Electrochemical Noise Data. Corrosion 2001, 57, 265–285. [Google Scholar] [CrossRef]
  137. Bertocci, U.; Gabrielli, C.; Huet, F.; Keddam, M. Noise resistance applied to corrosion measurements I. theoretical analysis. J. Electrochem. Soc. 1997, 144, 31–37. [Google Scholar] [CrossRef]
  138. Sanchez-Amaya, J.M.; Cottis, R.A.; Botana, F.J. Shot noise and statistical parameters for the estimation of corrosion mechanisms. Corros. Sci. 2005, 47, 3280–3299. [Google Scholar] [CrossRef]
  139. Malamud, B.D.; Turcotte, D.L. Self-affine time series: Measures of weak and strong persistence. J. Stat. Plan. Inference 1999, 80, 173–196. [Google Scholar] [CrossRef]
  140. Eke, A.; Herman, P.; Bassingthwaighte, J.; Raymond, G.; Percival, D.; Cannon, M.; Balla, I.; Ikrényi, C. Physiological time series: Distinguishing fractal noises from motions. Pflügers Archiv. 2000, 439, 403–415. [Google Scholar] [CrossRef]
  141. Delignieres, D.; Ramdani, S.; Lemoine, L.; Torre, K.; Fortes, M.; Ninot, G. Fractal analyses for ‘short’ time series: A re-assessment of classical methods. J. Math. Psychol. 2006, 50, 525–544. [Google Scholar] [CrossRef]
  142. Feliu, S., Jr. Electrochemical impedance spectroscopy for the measurement of the corrosion rate of magnesium alloys: Brief review and challenges. Metals 2020, 10, 775. [Google Scholar] [CrossRef]
  143. Ardelean, H.; Frateur, I.; Zanna, S.; Atrens, A.; Marcus, P. Corrosion protection of AZ91 magnesium alloy by anodizing in niobium and zirconium-containing electrolytes. Corros. Sci. 2009, 51, 3030–3038. [Google Scholar] [CrossRef]
  144. Dinodi, N.; Shetty, A.N. Alkyl carboxylates as efficient and green inhibitors of magnesium alloy ZE41 corrosion in aqueous salt solution. Corros. Sci. 2014, 85, 411–427. [Google Scholar] [CrossRef]
  145. Cordoba-Torres, P.; Mesquita, T.J.; Nogueira, R.P. Relationship between the Origin of Constant-Phase Element Behavior in Electrochemical Impedance Spectroscopy and Electrode Surface Structure. J. Phys. Chem. C 2015, 119, 4136–4148. [Google Scholar] [CrossRef]
  146. Pinchuk, A.; Hilger, A.; Von Plessen, G.; Kreibig, U. Substrate effect on the optical response of silver nanoparticles. Nanotechnology 2004, 15, 1890–1896. [Google Scholar] [CrossRef]
  147. Jain, P.K.; El-Sayed, M.A. Noble Metal Nanoparticle Pairs: Effect of Medium for Enhanced Nanosensing. Nano Lett. 2008, 8, 4347–4352. [Google Scholar] [CrossRef]
  148. Johnson, P.B.; Christy, R.W. Optical constants of the noble metals. Phys. Rev. B 1972, 6, 4370–4379. [Google Scholar] [CrossRef]
  149. Kumura, S.; Sugita, T.; Nakamura, K.; Kobayashi, N. An improvement in the coloration properties of Ag deposition-based plasmonic EC devices by precise control of shape and density of deposited Ag nanoparticles. Nanoscale 2020, 12, 23975–23983. [Google Scholar] [CrossRef]
  150. Holzwarth, U.; Gibson, N. The Scherrer equation versus the ‘Debye-Scherrer equation’. Nat. Nanotechnol. 2011, 6, 534. [Google Scholar] [CrossRef] [PubMed]
  151. Loua, C.-W.; Chenb, A.-P.; Lic, T.-T.; Linbde, C.-H. Antimicrobial activity of UV-induced chitosan capped silver nanoparticles. Mater. Lett. 2014, 128, 248–252. [Google Scholar] [CrossRef]
  152. Singaravelan, R.; Bangaru Sudarsan Alwar, S. Electrochemical synthesis, characterisation and phytogenic properties of silver nanoparticles. Appl. Nanosci. 2015, 5, 983–991. [Google Scholar] [CrossRef] [Green Version]
  153. ASTM D5725-99. In Standard Test Method for Surface Wettability and Absorbency of Sheeted Materials Using an Automated Contact Angle Tester, Annual Book of ASTM Standards; ASTM: West Conshohocken, PA, USA, 2008.
  154. Carré, A.; Mittal, K.L. Superhydrophobic Surface; CRC Press: Boca Raton, FL, USA, 2009; pp. 3–17. [Google Scholar]
  155. Yeganeh, M.; Mohammadi, N. Superhydrophobic surface of Mg alloys: A review. J. Magnes. Alloys 2018, 6, 59–70. [Google Scholar] [CrossRef]
  156. Mahmood, M.H.; Maleque, M.A.; Rahman, M. Hard-Hydrophobic Nano-CuO Coating via Electrochemical Oxidation for Heat Transfer Performance Enhancement. Arab. J. Sci. Eng. 2021, 1–11. [Google Scholar] [CrossRef]
  157. Sanchez-Perez, A.; Cano-Millá, N.; Moya Villaescusa, M.J.; Montoya Carralero, J.M.; Navarro Cuellar, C. Effect of Photofunctionalization with 6 W or 85 W UVC on the Degree of Wettability of RBM Titanium in Relation to the Irradiation Time. Appl. Sci. 2021, 11, 5427. [Google Scholar] [CrossRef]
  158. Li, X.-M.; Reinhoudt, D.; Crego-Calama, M. What do we need for a superhydrophobic surface?. A review on the recent progress in the preparation of superhydrophobic surfaces. Chem. Soc. Rev. 2007, 36, 1350–1368. [Google Scholar] [CrossRef]
  159. Zhang, X.; Shi, F.; Niu, J.; Jiang, Y.; Wang, Z. Superhydrophobic surfaces: From structural control to functional application. J. Mater. Chem. 2008, 18, 621–633. [Google Scholar] [CrossRef]
  160. Guo, Z.; Liu, W.; Su, B.-L. Superhydrophobic surfaces: From natural to biomimetic to functional. J. Colloid Interface Sci. 2011, 353, 335–355. [Google Scholar] [CrossRef]
  161. Zhang, Y.-L.; Xia, H.; Kim, E.; Sun, H.-B. Recent developments in superhydrophobic surfaces with unique structural and functional properties. Soft Matter 2012, 8, 11217–11231. [Google Scholar] [CrossRef]
  162. Latthe, S.S.; Gurav, A.B.; Maruti, C.S.; Vhatkar, R.S. Recent Progress in Preparation of Superhydrophobic Surfaces: A Review. J. Surf. Eng. Mater. Adv. Technol. 2012, 2, 76–94. [Google Scholar] [CrossRef]
  163. Mohamed, A.M.A.; Abdullah, A.M.; Younan, N.A. Corrosion behavior of superhydrophobic surfaces: A review. Arab. J. Chem. 2015, 8, 749–765. [Google Scholar] [CrossRef] [Green Version]
  164. Zhang, D.; Wang, L.; Qian, H.; Li, X. Superhydrophobic surfaces for corrosion protection: A review of recent progresses and future directions. J. Coat. Technol. Res. 2016, 13, 11–29. [Google Scholar] [CrossRef] [Green Version]
  165. Himratul-Aznita, W.H.; Mohd-Al-Faisal, N.; Fathilah, A.R. Determination of the percentage inhibition of diameter growth (PIDG) of Piper betle crude aqueous extract against oral Candida species. J. Med. Plants Res. 2011, 5, 878–884. [Google Scholar] [CrossRef]
  166. Lok, C.N.; Ho, C.M.; Chen, R.; He, Q.Y.; Yu, W.Y.; Sun, H.; Tam, P.K.H.; Chiu, J.F.; Che, C.M. Silver nanoparticles: Partial oxidation and antibacterial activities. J. Biol. Inorg. Chem. 2007, 12, 527–534. [Google Scholar] [CrossRef]
  167. Spadaro, J.A.; Berger, T.J.; Barranco, S.D.; Chapin, S.E.; Becker, R.O. Antibacterial Effects of Silver Electrodes with Weak Direct Current. Antimicrob. Agents Chemother. 1974, 6, 637–642. [Google Scholar] [CrossRef] [Green Version]
  168. Gupta, A.; Matsui, K.; Lo, J.F.; Silver, S. Molecular basis for resistance to silver cations in Salmonella. Nat. Med. 1999, 5, 183–188. [Google Scholar] [CrossRef]
  169. Choi, O.; Deng, K.K.; Kim, N.J.; Ross, L.; Surampalli, R.Y.; Hu, Z. The inhibitory effects of silver nanoparticles, silver ions, and silver chloride colloids on microbial growth. Water Res. 2008, 42, 3066–3074. [Google Scholar] [CrossRef] [PubMed]
  170. Shao, Y.; Zeng, R.C.; Li, S.Q.; Cui, L.Y.; Zou, Y.H.; Guan, S.K.; Zheng, Y.F. Advance in Antibacterial Magnesium Alloys and Surface Coatings on Magnesium Alloys: A Review. Acta Metall. Sin. 2020, 33, 615–629. [Google Scholar] [CrossRef]
  171. Choi, O.; Hu, Z. Size Dependent and Reactive Oxygen Species Related Nanosilver Toxicity to Nitrifying Bacteria. Environ. Sci. Technol. 2008, 42, 4583–4588. [Google Scholar] [CrossRef] [PubMed]
Figure 1. SEM images (2000×) of the Mg (A) and Mg-Ca0.3 (B) reference surfaces. (C) EDS analysis of sites marked on the SEM images and the suggested compounds. (D) XRD spectra of Mg-Ca0.3 alloy surface and (E) zoom of 2θ region, presenting Mg2Ca particles.
Metals 11 01357 g001
Figure 2. Changes in times of: (A) Hank’s solution pH up to 14 days during the exposure of Mg and Mg-Ca0.3 samples up to 14 days; (B) concentration of the released Mg2+ ions and measured mass loss (Δm) at 7 and 14 days. (Electrolyte renewal every 24 h).
Metals 11 01357 g002
Figure 3. SEM images of the morphological surfaces changes after immersion in Hank´s solution for 14 days: (A) Mg and (B) Mg-Ca0.3 (2000×); cross-sections (500×): (C) Mg and (D) Mg-Ca0.3; surfaces after the removal of layers (50×): (E) Mg and (F) Mg-Ca0.3.
Metals 11 01357 g003
Figure 4. EDS analysis of corresponding sites marked in the SEM images (Figure 3A,B,E,F) and suggested compounds, formed before and after removal of the surface layers.
Metals 11 01357 g004
Figure 5. XPS spectra of the layers grown on (A) Mg and (B) Mg-Ca0.3 surfaces after exposure to Hank’s solution for 14 days (at 37 °C).
Metals 11 01357 g005
Figure 6. Potentiodynamic polarization (PDP) curves of Mg and Mg-Ca0.3 after 24 h of immersion in Hank’s solution.
Metals 11 01357 g006
Figure 7. Corrosion current density fluctuations at OCP of (A) Mg and (B) Mg-Ca0.3 during 24 h of exposure to Hank’s solution.
Metals 11 01357 g007
Figure 8. PSD of corrosion current density fluctuations vs. frequency in bi-logarithmic scale for Mg (A) and Mg-Ca0.3 alloy (B) after 24 h of immersion in Hank’s solution.
Metals 11 01357 g008
Figure 9. (A) Nyquist diagrams of Mg and Mg-Ca0.3 exposed for 24 h to Hank’s physiological solution at 21 °C; (B) equivalent circuits used to fit experimental EIS spectra; and (C) Bode diagrams.
Metals 11 01357 g009
Figure 10. ELD of Ag-nanoparticles on Mg-Ca0.3 surface form 10−3 M and 10−2 M AgNO3 solutions at different times: (A) UV-Vis absorption spectra (evolution over time), (B) representative circular images, (C) SEM micrographs of selected areas (5000×), and (D) Ag-NPs and agglomerate size distribution on the Mg-Ca0.3 surface.
Metals 11 01357 g010
Figure 11. SEM images (10,000×) of Mg-Ca0.3 surface: (A) before and (B) after electroless deposited Ag-NPs and agglomerates by 10−3 M AgNO3 (t = 3 min, at 21 °C) and (C) EDS analysis on marked sites.
Metals 11 01357 g011
Figure 12. XRD spectra of Ag-NPs deposited on Mg-Ca0.3 surface (from 10−3 M, t = 6 min). The column bar graphs correspond to HCP Mg-JCPDS #350821 and FCC Ag-JCPDS #04-0783.
Metals 11 01357 g012
Figure 13. (A) Contact angle values, (B) calculated surface free energy (SFE), and (C) description of the surfaces.
Metals 11 01357 g013
Figure 14. Average values of zeta potential of E. coli and S. aureus bacteria vs. pH of Mueller–Hinton culture broth.
Metals 11 01357 g014
Figure 15. E. coli and S. aureus bacteria growth of on Mg-Ca0.3: bare surface (B); Ag-NPs deposits on Mg-Ca0.3; M1 (10−3 M, 1 min), M2 (10−3 M, 3 min), M3 (10−3 M, 6 min) and M4 (10−2 M, 1 min).
Metals 11 01357 g015
Figure 16. Histogram of comparison of the diameters of the (A) zone of inhibition and (B) PIDG, for the sample surfaces exposed to E. coli and S. aureus on agar for 24 h at 37 °C in an incubator (dark conditions).
Metals 11 01357 g016
Table 1. Nominal composition of the extruded Mg-Ca0.3 alloy.
AlloyChemical Composition (wt.%)
AlCuFeNiZnCaMg
Mg-Ca0.30.0160.00190.00190.00140.00600.23Bal.
Table 2. Values of Rp, jcorr, B’, and MR for Mg and Mg-Ca0.3 in Hank’s solution (at 27 °C), estimated by PDP curves.
SampleRp (kΩ cm2)B’ (mV)jcorr (μA cm−2)MR (g m−2 d−1)
Mg31.5738.521.220.12
Mg-Ca0.332.8133.791.030.10
Table 3. Fitting parameters estimated from EIS data of Mg and Mg-Ca0.3 exposed for 24 h to Hank’s physiological solution at 21 °C.
Circuit ElementsMgMg-Ca0.3
Rs (Ω cm2)30.28 ± 0.4126.03 ± 0.59
CPE1 (µS sn cm−2)0.34 ± 0.095.92 ± 0.84
n10.79 ± 0.020.74 ± 0.01
R1 (Ω cm2)279.2 ± 9.10580.90 ± 53.70
CPE2 (µsn/Ω cm2)22.48 ± 0.526.04 ± 0.76
n20.71 ± 0.040.85 ± 0.01
R2 (kΩ cm2)12.62 ± 0.1240.80 ± 0.42
Rp (kΩ cm2)12.9041.38
Publisher’s Note: MDPI stays neutral with regard to jurisdictional claims in published maps and institutional affiliations.

