Article

Corrosion Behavior of Gravity Cast and High-Pressure Die-Cast AM60 Mg Alloys with Ca and Y Addition

1
School of Materials Science and Engineering, Hebei University of Technology, Tianjin 300401, China
2
Hefei Nova Advanced Materials Company Ltd., Hefei 230000, China
3
School of Materials Science and Engineering, Hefei University of Technology, Hefei 230009, China
4
Implementation Research Division, Korea Institute of Materials Science, Changwon 51508, Korea
5
CITIC Dicastal Co., Ltd., Qinhuangdao 066011, China
6
Magnesium Technology Innovation Center, School of Materials Science and Engineering, Seoul National University, 1 Gwanak-ro, Seoul 08826, Korea
*
Author to whom correspondence should be addressed.
Metals 2022, 12(3), 495; https://doi.org/10.3390/met12030495
Submission received: 10 February 2022 / Revised: 9 March 2022 / Accepted: 10 March 2022 / Published: 15 March 2022

Abstract

:
In this study, the microstructure and related corrosion behavior of AM60 alloys with/without Ca and Y addition upon gravity casting (GC) and high-pressure die-casting (HPDC) are investigated by means of SEM/EDS characterization, immersion/salt spray test, hydrogen releasing, as well as electrochemistry examination. When utilizing GC, AM60 alloy with Ca and Y addition (named AZXW6000 alloy) has better corrosion resistance compared with AM60 alloy. Thanks to grain refinement and second phase networks introduced in HPDC, the anti-corrosion properties of the AM alloy seem much better than those of the GC counterpart. The corrosion mechanism of both GCed and HPDCed AM60-based alloys is also investigated in detail. The inspiration from present work can provide more thinking for developing high corrosion-resistant Mg alloys using different casting methods.

1. Introduction

Magnesium (Mg) and its alloys are regarded as the lightest structural metallic materials with density of about 1.74 g·cm−3, representing about 1/4 of that of steel. As a result of this weight saving advantage, Mg alloys are widely used in vehicles to reduce CO2 emissions in order to protect our environment [1,2,3,4,5]. In addition, Mg alloys also show excellent die-castability, dimensional stability, specific stiffness, and damping capacity, which makes them prospective candidates for the automobile industry [2,6,7,8]. However, the standard electrode potential of magnesium is extremely low—2.37 V [9], which severely limits its applications [10]. Thus, improving corrosion resistance and understanding the mechanism behind are the key points nowadays [11,12]. Up to now, the possible methods of enhancement of Mg alloys corrosion resistance are alloy composition optimization, modern surface-finishing technique, and so on [13]. Recently, Ca has been proved to be one of the significant alloying elements because of its low cost, grain refinement, as well as sound corrosion resistance [14]. Particularly, Ca can form a dense oxide layer in Mg alloys to improve the corrosion resistance [15], for instance, Mg–2Ca (in wt%) has the best corrosion resistance [16]. On the other hand, as Ca addition increases, the grains of such alloys become finer. Moreover, addition of trace Y into Mg alloys shows similar results [17]. When the content of Y is less than 0.3 wt%, the AZ91 alloy represents superior corrosion resistance [18]. Recently, the combined addition of Ca and Y exhibits an effective approach to improving the corrosion resistance of Mg alloys [19]. Besides, various casting routes, such as pressure casting, semi-solidified casting, and other special casting methods, can also influence the corrosion rate. For example, castings obtained by the vacuum suction casting method have better corrosion resistance in chlorinated substances [20]. Rheological high-pressure die-casting has better corrosion resistance and mechanical properties than high-pressure die-casting [21]. Engineers are eager to obtain a balance between mechanical properties and corrosion resistance of Mg products by tuning the processing parameters of castings. So far, many researchers report the corrosion performance of Mg alloys fabricated under the same method, however, only rare literatures compare differences in corrosion behavior of Mg alloys upon various casting approaches. Thus, the corrosion behaviors of gravity casting (GC) and high-pressure die-casting (HPDC) of AM60 alloys with/without Ca and Y addition are compared in terms of microstructure characterization, hydrogen evolution, immersion tests (IT), and electrochemical measurements [4]. The aim of this study is to investigate the effects of Ca- and Y-alloying elements, as well as the influence of casting methods on the corrosion mechanism of AM60 alloys. It can give better understanding and strategies for developing high performance Mg foundry products in near future.

2. Materials and Methods

2.1. Preparation of Samples

The gravity casting (GC) was smelted in a furnace at 740 °C with protection-mixed gases 1% SF6 and 99% CO2. The molten metal was poured into a stainless steel mold with dimensions of Φ 60 mm × 200 mm. All gravity casting samples used in this experiment were obtained from the central area of the ingot. The high-pressure die-casting (HPDC) was carried out by YIZUMI cold chamber HPDC machine. The production conditions were summarized as follows: melting temperature at 680 ± 20 °C, mold preheating temperature at 210 ± 20 °C, final injection speed at 4.8 ± 0.5 m·s−1. The casting time was about 90 ± 5 s and the casting pressure was 155 ± 5 bar. The average thickness of the HPDC castings was 2.5 mm. The chemical composition of AM60 and AM60 + 0.3Ca + 0.3Y (AMXW6000) alloys upon various casting processes was measured using X-ray fluorescence (XRF), and is shown in Table 1. The alloy phase was measured using X-ray diffraction (XRD) with an XRD detection scan power of 4 KW, a measurement range between 20° and 80°, and a scan speed of 12°/min.

2.2. Microstructure

Before a scanning electron microscope (SEM) observation, the samples were ground and polished. Then, the samples were washed with ethanol and dried. Finally, the samples were etched using 4.2 g picric acid, 70 mL ethanol, 10 mL acetic acid, and 10 mL distilled water [22]. JSM-6510A SEM with energy-dispersive spectrometer (EDS) was used to observe the corroded surface and examine related compositions.

2.3. Hydrogen Evolution Collections (HEC)

The HEC samples were taken from AM60 and AMXW6000 alloys in different casting states. Only one surface was retained and the rest was wrapped with epoxy resin. The exposed 4 cm2 (2 × 2 cm) surfaces of each sample were finely ground and polished. The hydrogen evolution experiment was performed by immersion in 3.5 wt% NaCl solution with pH = 11. Usually, during the corrosion process of Mg alloys, the pH value of the solution would gradually rise to 11 [23,24], thus, NaOH was used to adjust it before the experiment. The released hydrogen was collected using an inverted funnel and burets. The volume of hydrogen was measured every 12 h for 11 days, and the experiment was repeated 3 times.

2.4. Immersion Test (IT) and Salt Spray Test (SST)

The sample sizes for IT and SST were 20 × 20 × 2.5 mm3. The 3.5 wt% (pH = 11) NaCl solution was used in IT and immersion times were 1 h, 3 h, 12 h, 2 days, and 8 days, respectively. The samples were taken out for corrosion evaluation according to various corrosion times. In addition, the samples for the neutral salt spray test were suspended in 5 wt% NaCl salt spray (pH = 6.5–7.2) at 35 °C for 15 days. In particular, the samples of both IT and SST were taken out in the case of 5 and 15 days, respectively, and cleaned with 20 wt% CrO3 and 1 wt% AgNO3 solution and deionized water. Then, the samples were dried and the weight loss was recorded by electronic balance. In order to avoid errors, the weight loss results were the average of the three tests.

2.5. Electrochemical Measurements

Electrochemical experiments were carried out at room temperature in 3.5 wt% NaCl solution with pH = 11 using an electrochemical workstation CHI760. The samples were machined into 10 × 10 × 2.5 mm3 thin sheets, and the excess parts were wrapped with epoxy resin, leaving 1 cm2 working surface polished for measurement. The open circuit potential (OCP) was maintained for 20 min to make the potential stable. Electrochemical impedance spectroscopy (EIS) was performed in the frequency range from 100 kHz to 0.01 Hz, and the vibration amplitude was 5 mV. The Tafel curves of the samples were measured under potential from −2 to −1 V and scan rate at 1 mV·s−1. All tests were repeated 3 times to obtain representative datasets.

3. Results and Discussion

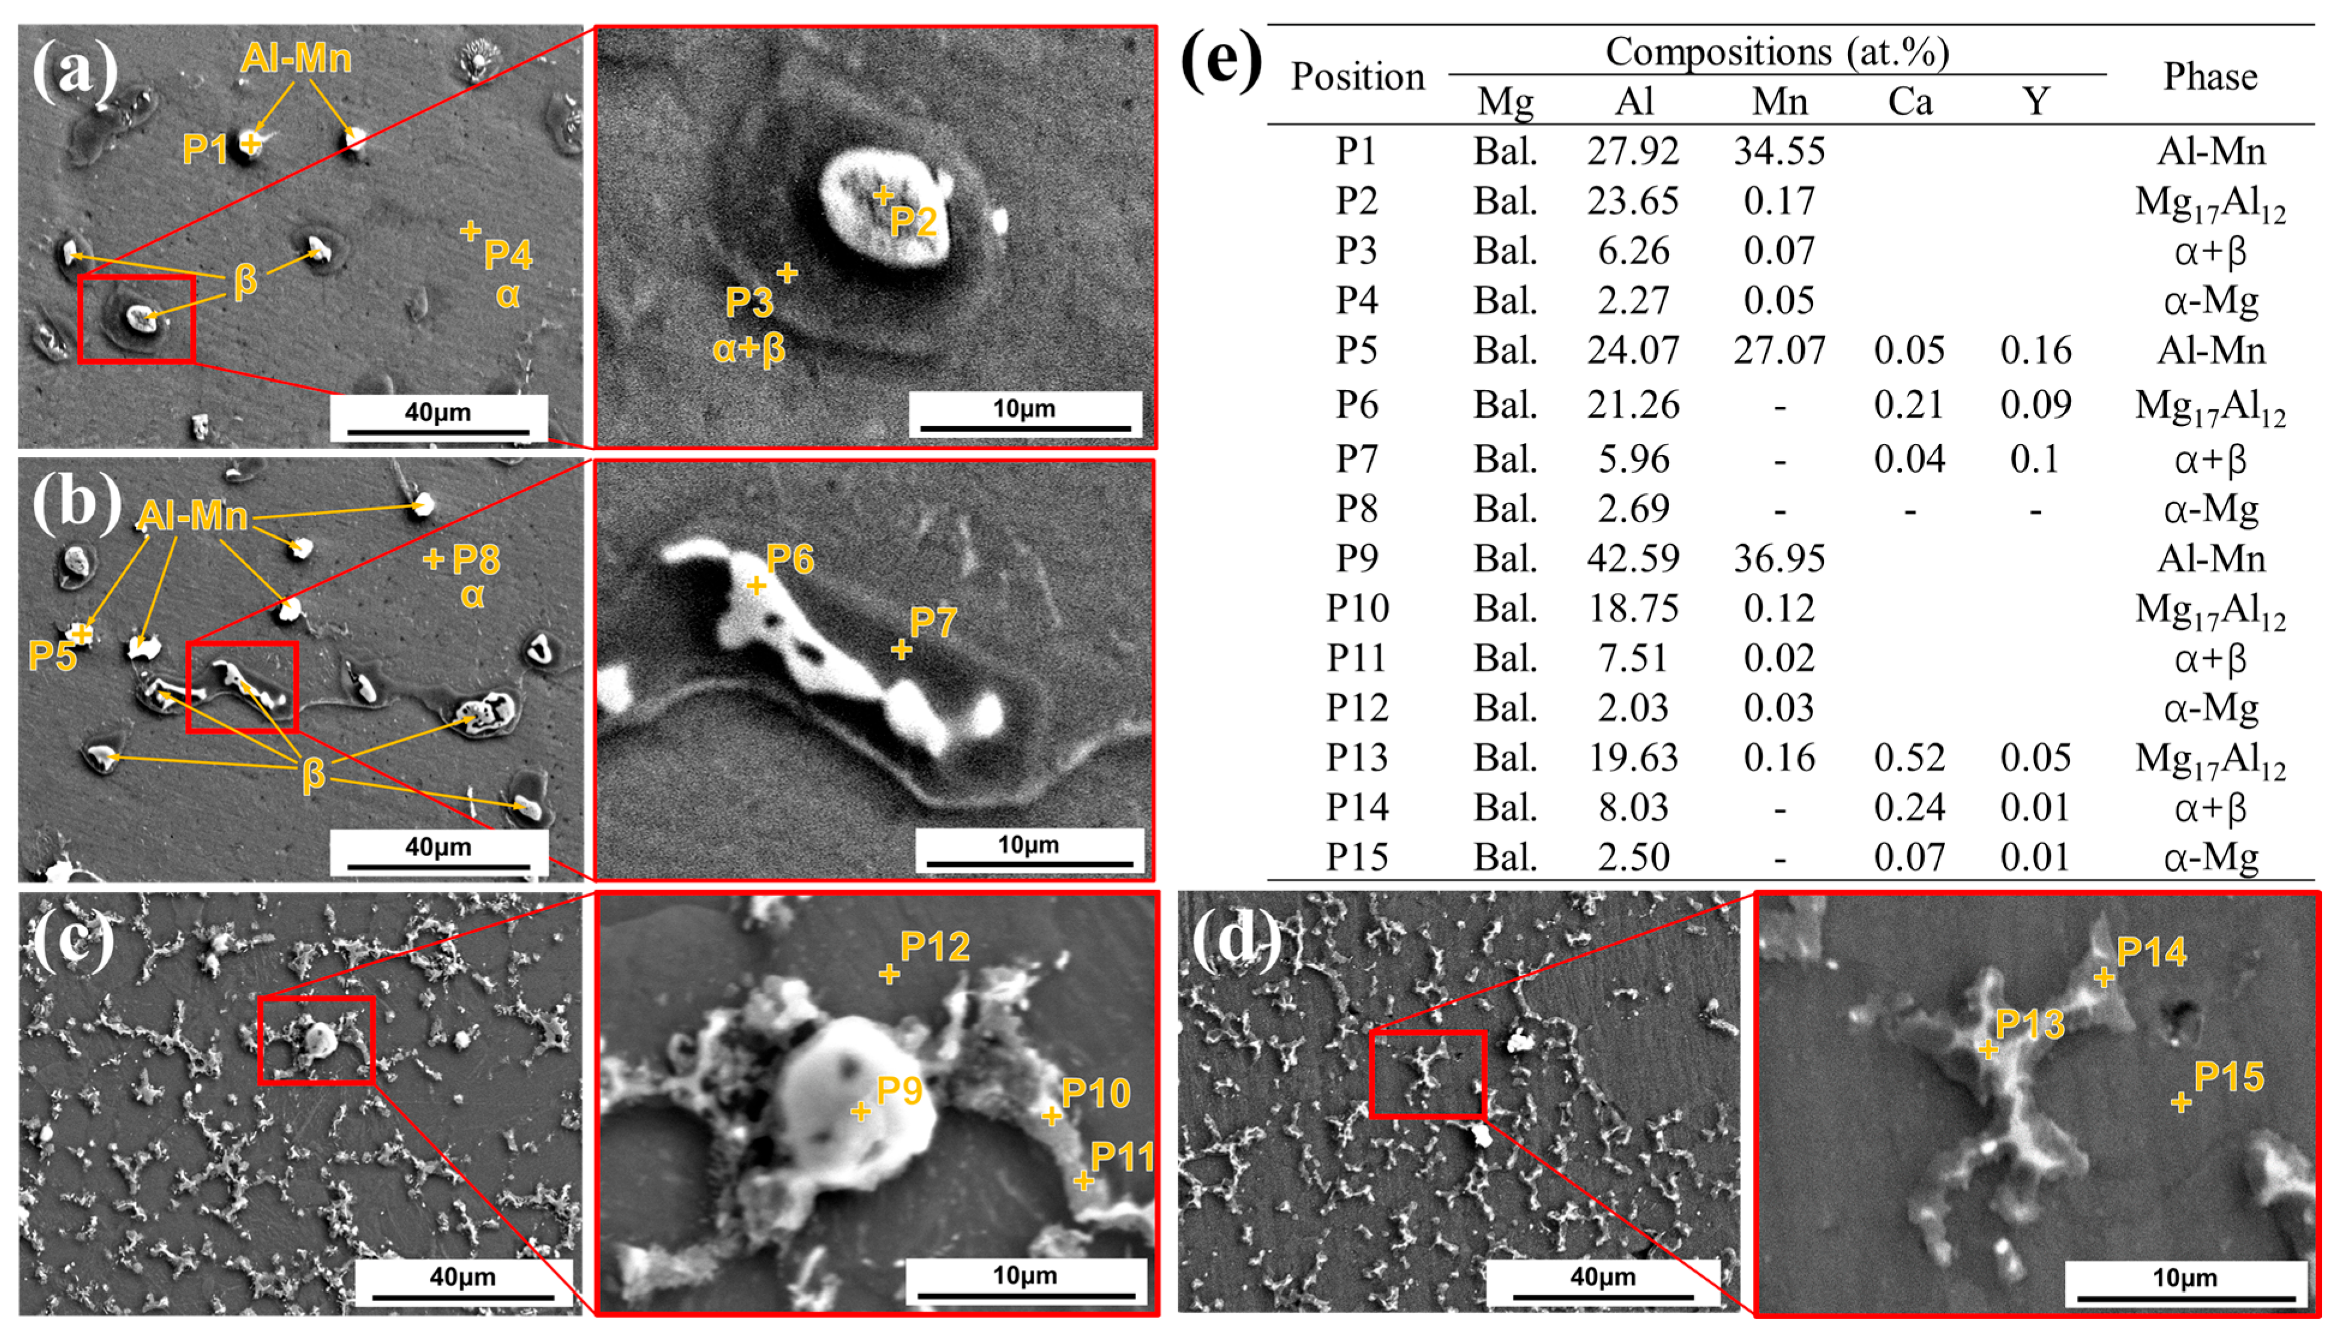
3.1. Microstructure of Magnezium-Based Alloys

The PandatTM software was used to calculate the fraction of phases in solidification, as shown in Figure 1a,b. The Mg–6Al–Mn alloy is mainly composed of α-Mg and β-Mg17Al12 phases, and also contains small amounts of Al–Mn, Al–Ca, and Al–Mg–Y phases. However, because of the limited content of Al–Mn, Al–Mg–Y, and Al–Ca, no peaks of intermetallic compounds are found in Figure 1c, as shown in a similar study [25].
Figure 2a,b shows that second phases in GC samples are mainly distributed at grain boundaries (GBs) in irregular spherical shapes. The grain size of GC AM60 and AMXW6000 alloys are 116.50 μm and 128.57 μm, respectively. The second phases in the HPDC specimen are mostly decorated at GBs in rod and granule forms, as shown in Figure 2c,d. In the case of HPDCed samples, the grain sizes of AM60 and AMXW6000 alloys are 10.14 μm and 10.36 μm, respectively. Clearly, the content of the second phases in HPDC is significantly higher than that in GC, and the grain size is also refined. Some researchers reported that the corrosion resistance of the material increases with smaller grain size [26,27,28]. Besides, the individual white particles in GCed alloys are the Al–Mn phase (see Figure 2a,b), and the white particles wrapped by the gray ring structure represent the β phase, in which the gray ring structure is eutectic α + β phase. After adding a small amount of Ca and Y into the GCed AM60 alloy, the second phase was clearly connected, which is also represented in another study [29]. It is well known that the corrosion in Mg alloys usually begins in the form of pitting, preferring to occur near second phase particles (i.e., β-Mg17Al12, Al–Mn, and Al–Mn–Fe phases [4]), with high cathode potential [30]. Only α-Mg, β-Mg17Al12, and Al–Mn phases are found in AM60 and AMXW6000 alloys, so it is believed that the α-Mg phase around the β-Mg17Al12 and Al–Mn phases is the initial corroded position in NaCl solution. In addition, the Al–Mn phase still exists in spherical after HPDC (See Figure 2c); the content of the β-Mg17Al12 phase increases greatly and their shape becomes more irregular because the solidification speed by HPDC is faster than that of GC. It can also be observed that the second phase forms a discontinuous network in HPDC alloys. The lower Al content of the Mg17Al12 phase is due to non-equilibrium solidification compared to GC.

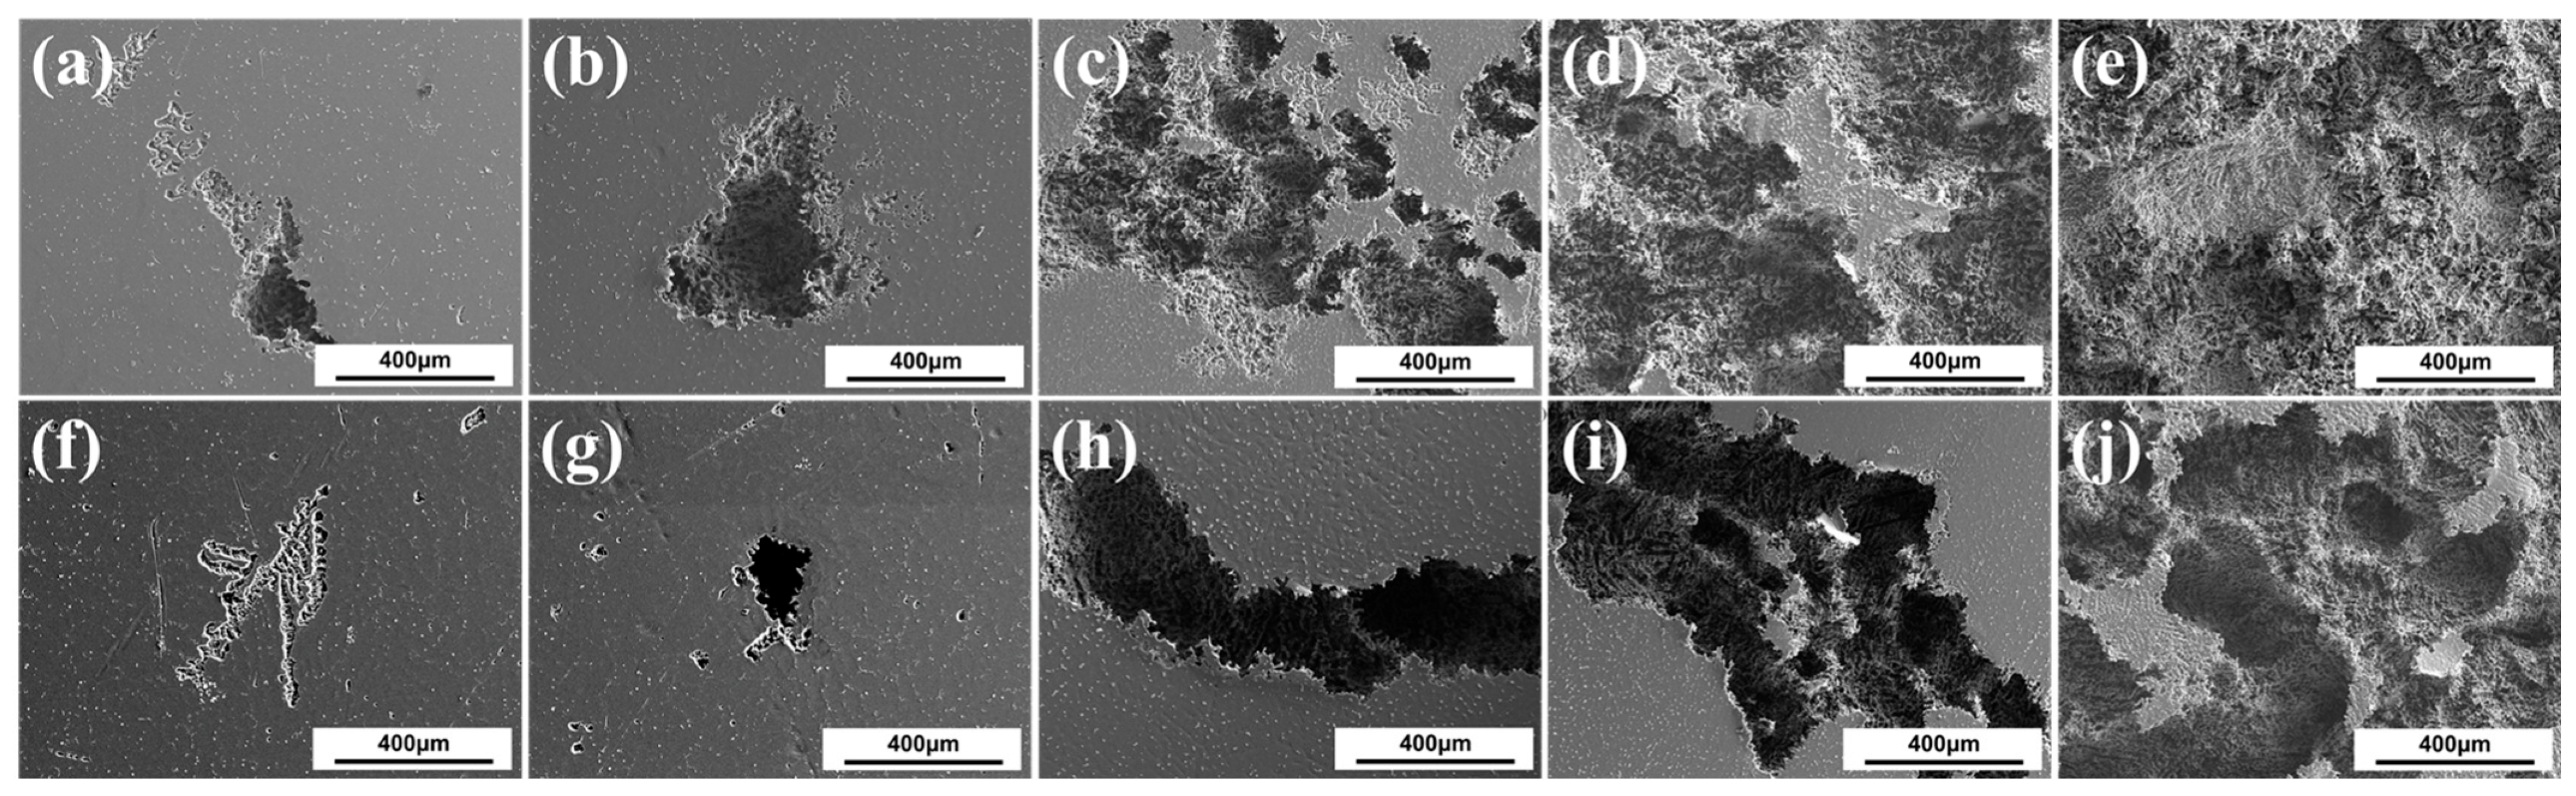
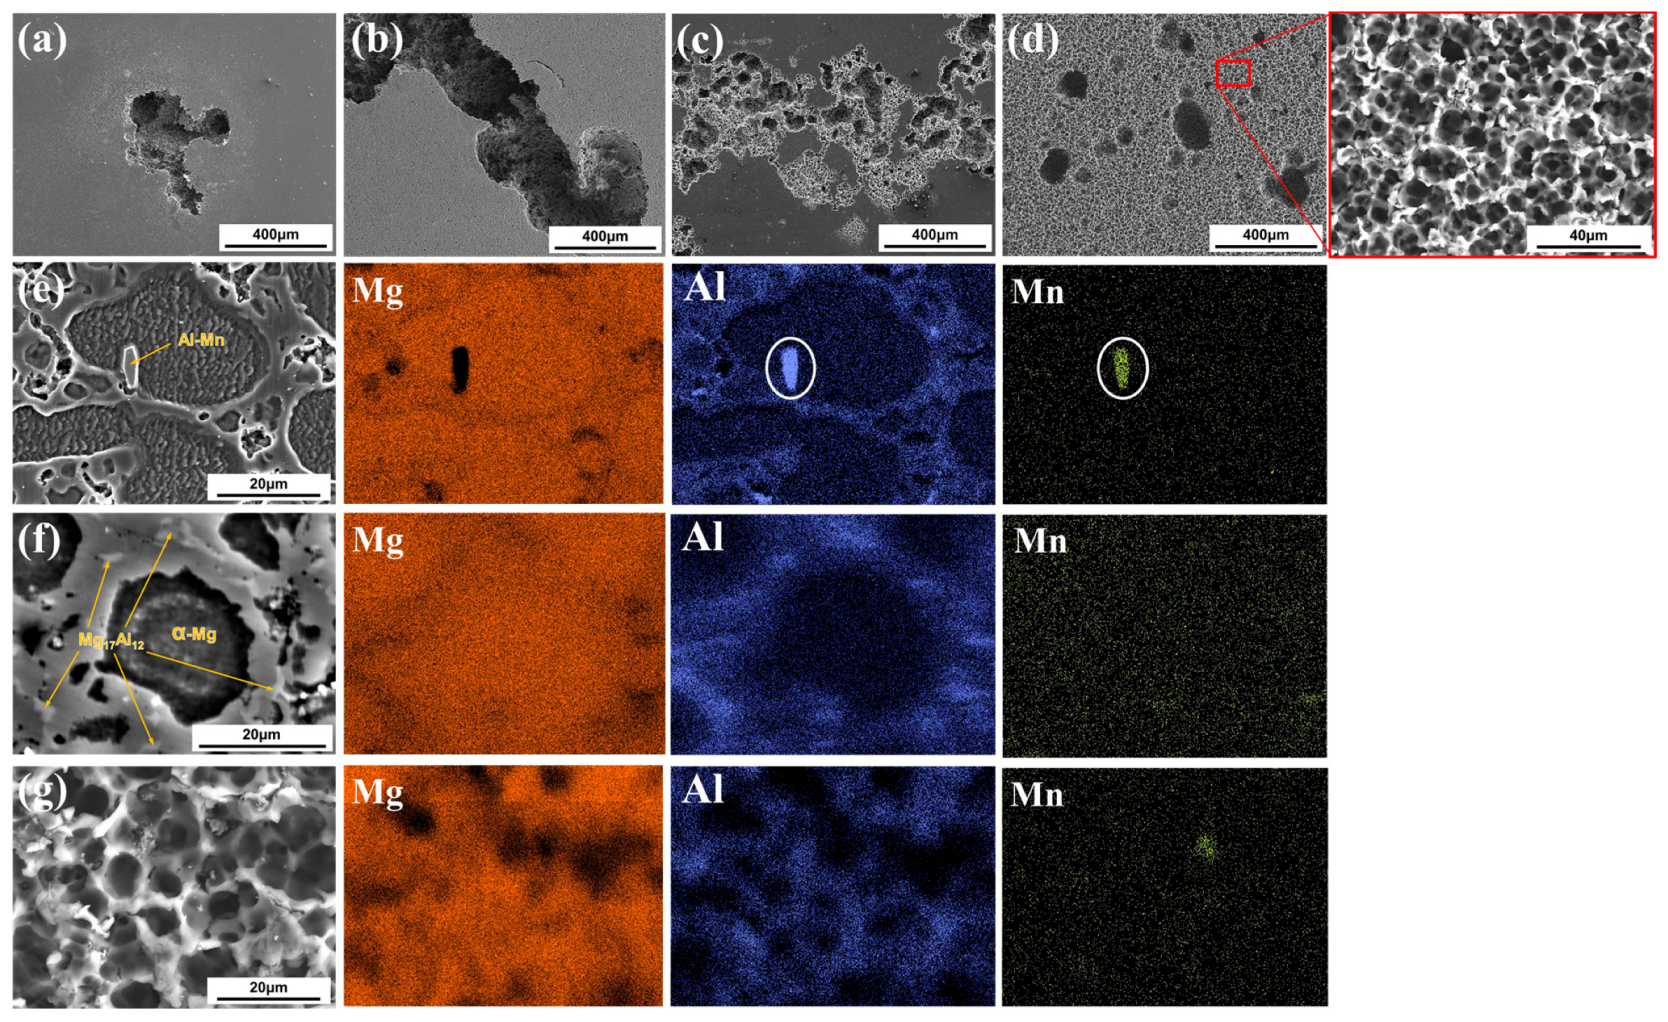
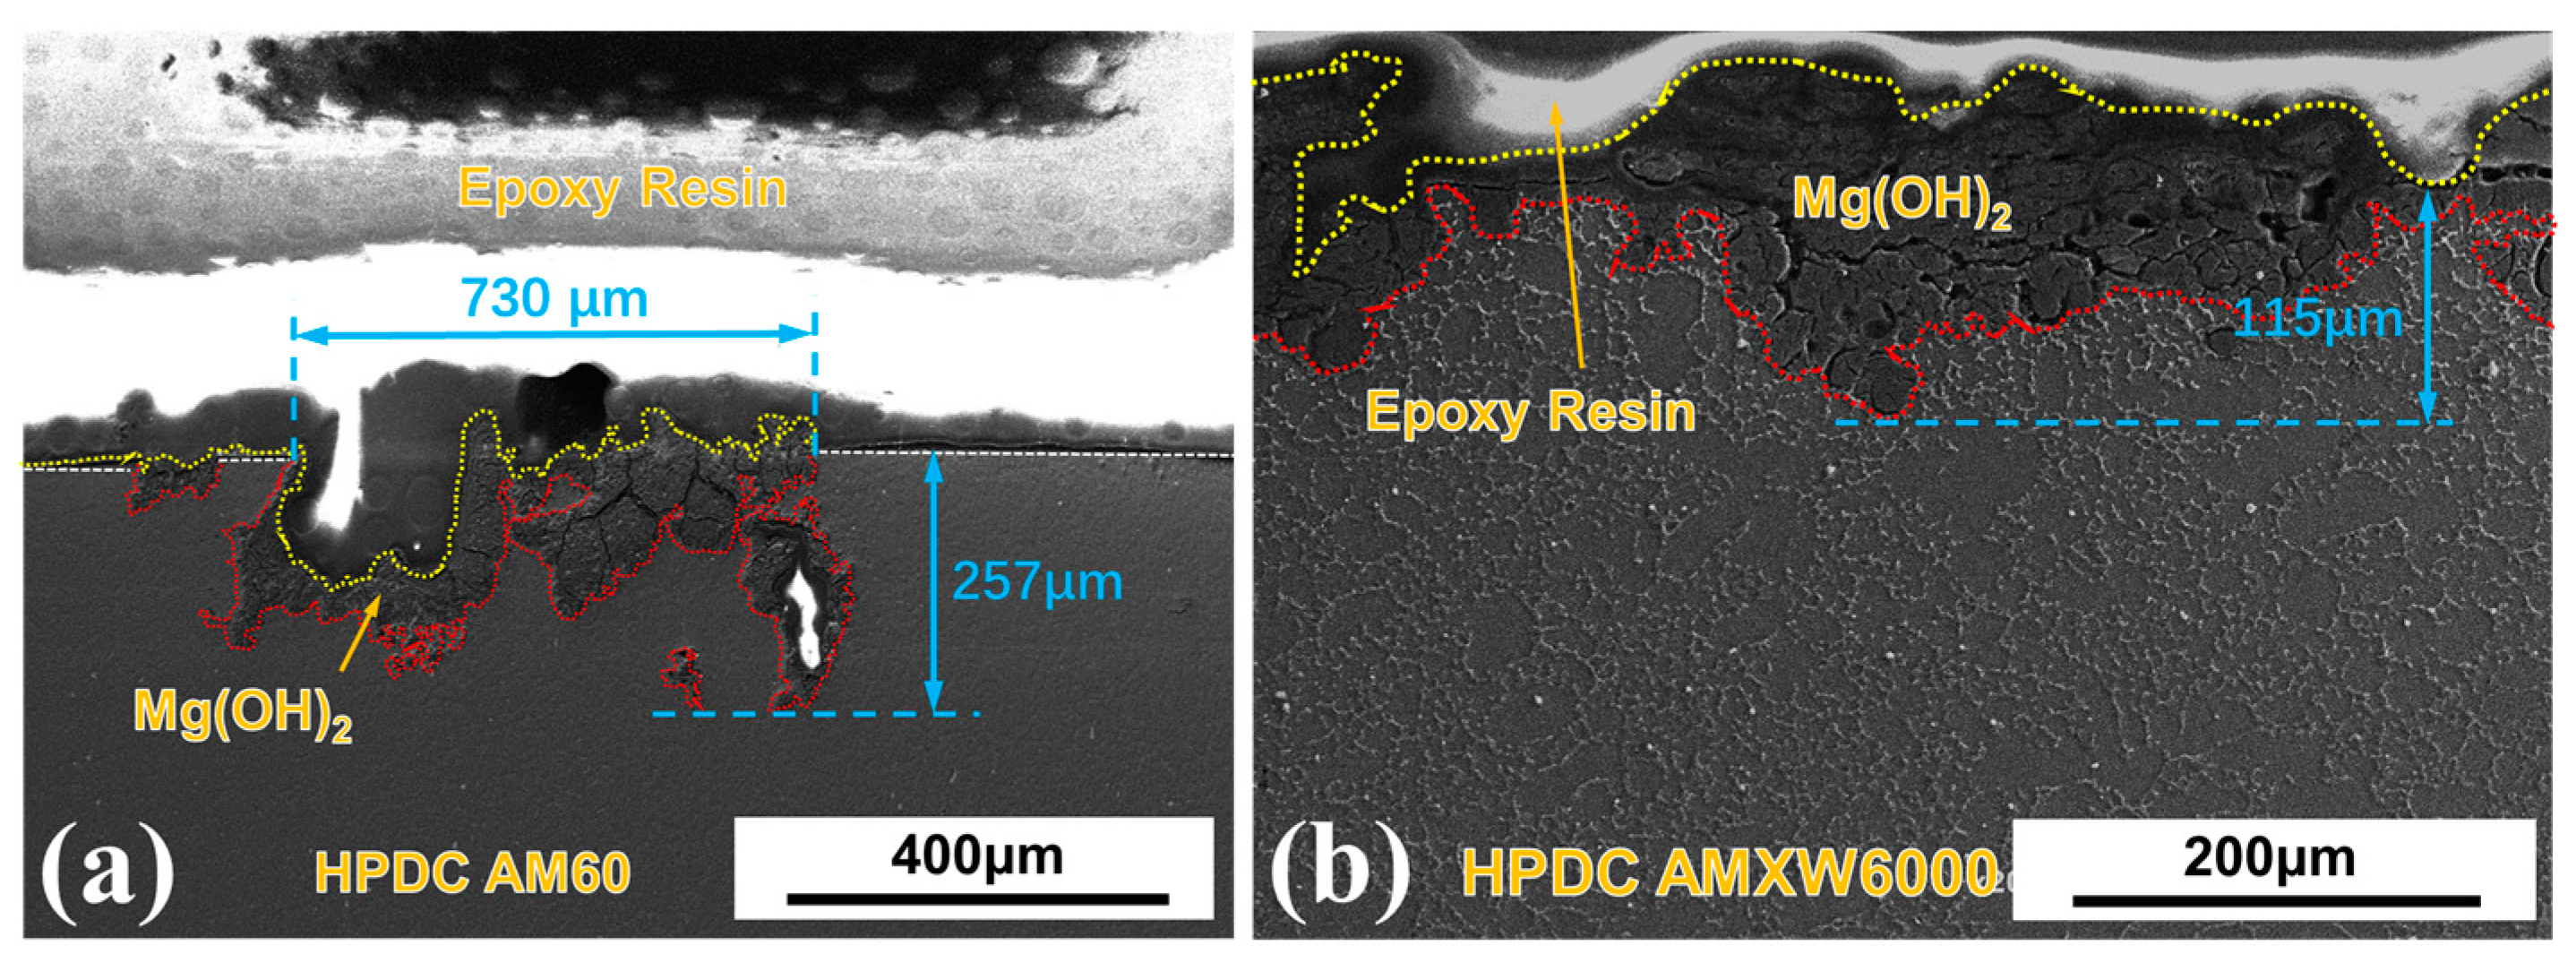
3.2. Corrosion Behavior

The surface morphologies of the two GCed alloys after removing corrosion products for different immersion times, are shown in Figure 3. In the case of the GC AM60 alloy (see Figure 3a–e), corrosion begins as pitting, then the pitting micro-craters expand, increasing their expansion surface and depth as the holding time increases to 12 h. Finally, pitting connected with each other and severe corrosion appears on the entire surface after 1 week. The corrosion behavior of the GCed AMXW6000 alloy is similar to the AM60 alloy, as illustrated in Figure 3f–j. For instance, the initial pitting turns into filiform corrosion after 12 h, forming a deep corrosion valley. As the corrosion continues, the corrosion valley begins to spread, and eventually, a large area of corroded surface can be seen in the GC AMXW6000 alloy. This result is consistent with previous reports of corrosion of Mg alloys [13]. In addition, by comparing the corroded surface of two alloys at the same immersion time, it can be found that addition of Ca and Y under GC can effectively improve the corrosion resistance of AMXW6000. Previous results reported that the addition amount of Ca and Y should be below a critical value which plays an important role in slowing down corrosion rates [31].
Figure 4 and Figure 5 present the corrosion morphology and alloy mapping of HPDCed AM60 and AMXW6000 alloys, respectively. Corrosion begins to appear after 3 h immersion in both alloys. Then, large pitting occurs and expands in HPDCed AM60 at 12 h (see Figure 4b). With the extension of the immersion time to 8 days, the corrosion spreads to the whole surface, as shown in Figure 4d. As the corrosion progresses, the α-Mg phase is corroded and disappears first, leaving only the reticulated second phase on the surface, which is not easily corroded. It is well documented that there is a potential difference between α-Mg and β-Mg17Al12 phases [13,32]. Compared with the Mg matrix, the second phase has a higher potential and acts as the cathode, so the lower potential matrix is preferred to be corroded as the anode. The greater the potential difference between the cathode and anode, the larger the corrosion force and the greater the anode corrosion rate. With the progress of galvanic corrosion, severe local corrosion (or corrosion pitting) will eventually occur, causing grains to fall, and thus, accelerating the corrosion of Mg alloys [30]. Figure 4e–g shows the distribution of Mg, Al, and Mn on the corroded surface of HPDC AM60 after immersion for 12 h, 2 days and 8 days, respectively. The distribution of these elements reveals a reticulated distribution of Al and uniform distribution of Mg across the entire surface except for Mn-rich areas. As the corrosion proceeds, the second phases gradually increase.
As confirmed in Figure 4e,f, the α-Mg phase with the lowest Al content begins to corrode first, while the corrosion of the second phase is relatively slow, which is consistent with Ref [24,33]. Nevertheless, other studies showed that the second phase causes micro-galvanic corrosion at the beginning, but with the corrosion deepening, the second phase also acted as a barrier, which means that the second phase not only played a role in accelerating the micro-galvanic corrosion, but also played a role in preventing the corrosion propagation [34,35,36]. In the present study, the second phase is mostly distributed at GBs, after the α-Mg phase is corroded, the remaining second phase can form a network retarding the corrosion, as shown in Figure 4g.
Figure 5 shows the corrosion morphology of HPDCed AMXW6000 alloy after immersion for different times. The surface corrosion of HPDCed AMXW6000 alloy after 12 h immersion in 3.5 wt% NaCl is similar to that of HPDCed AM60 after 8 days of corrosion. Almost the whole surface starts to corrode in 3 h. After 12 h, the corrosion of the matrix continuously increases, and the pits looks like dendrite (see Figure 5b). Then, the corrosion process accelerates and the pits network combines, as shown in Figure 5c. Additionally, some tiny black fallen particles can be observed. After 8 days of corrosion, the second phase continues to fall in large quantities, and the corrosion becomes more serious. Although a reticulated microstructure is formed in both HPDCed AM60 and AMXW6000 alloys, the network morphology of HPDCed AM60 is obviously more integrated than that of the HPDCed AMXW6000 alloy, so it can be inferred that the reticulated structure formed in HPDCed AM60 alloy seems more compact. Based on the observations, the complete network of second phases is good for corrosion resistance, since the HPDCed AM60 alloy with unbroken network showed better anti-corrosion properties.
By comparing the EDS mapping in terms of corrosion time of the HPDCed AMXW6000 alloy in Figure 5e–g, the Ca distributes in a more uniform way, while Y forms a Mg–Al–Y phase and tends to gather. With more deepening of the corrosion degree, the α-Mg phase gradually corrodes away, and β-Mg17Al12, Al–Mn, Mg–Al–Y, and other phases with higher corrosion potential are hard to corrode, but remain on the surface, as shown in Figure 5g.
Figure 6 shows the cross-section SEM images of HPDCed alloys immersed in 3.5 wt% NaCl solution for 4 days. The HPDCed AM60 alloy has a large uncorroded area that is clearly isolated from the corroded area (“unaffected surface”—dot-line in white). The HPDCed AMXW6000 alloy is more susceptible to corrosion than AM60 and most of the surface is covered by corrosion products (“corroded surface”—dot-line in yellow). Corrosion spreads and stops in the direction of the thickness and this area is labeled with a red dotted line (“affected surface”). The maximum corrosion depth and width of the pitting corrosion of the HPDCed AM60 alloy are 257 μm and 730 μm, respectively, as shown in Figure 6a. Figure 6b shows the lateral corrosion morphology of HPDCed AMXW6000 alloy with a maximum corrosion depth of 115 μm; the corrosion occurs in almost the whole surface. Under HPDCed conditions, the AM60 alloy tends to corrode more locally, while the AMXW6000 alloy tends to corrode more extensively, but to a shallow depth.
Usually, there are two mechanisms for β-Mg17Al12 phase related to corrosion in Mg alloys. One is the mechanism of forming a micro-galvanic corrosion to accelerate the corrosion of the α-Mg phase. The α-Mg phase potential is lower than that of the β-Mg17Al12 phase, and the β-Mg17Al12 phase tends to form a micro-galvanic corrosion with the α-Mg phase, leading to the accelerated corrosion of the magnesium substrate. The other is the mechanism of corrosion protection. The β-Mg17Al12 phase is easy to gather at GBs during casting. If the β phase forms a network-like structure, it is not easy for the remaining β phase to undergo further corrosion after the α-Mg phase has been corroded. Thus, it can protect the magnesium alloy [35]. However, if the β-Mg17Al12 phase does not form a perfect grid (see GC samples in Figure 2) when the α-Mg matrix corroded, the corrosion will further extend to the interior part resulting in the β-Mg17Al12 phase being dropped off. According to the above results and analysis, the corrosion mechanisms of both HPDC and GC are shown in Figure 7a,b, respectively. Generally, the first phase to be corroded is the α-phase, micro-currents will be generated between different phases due to the potential difference [4]. Additionally, the β phases as corrosion obstructers depend on the network forming, as well as grain size.

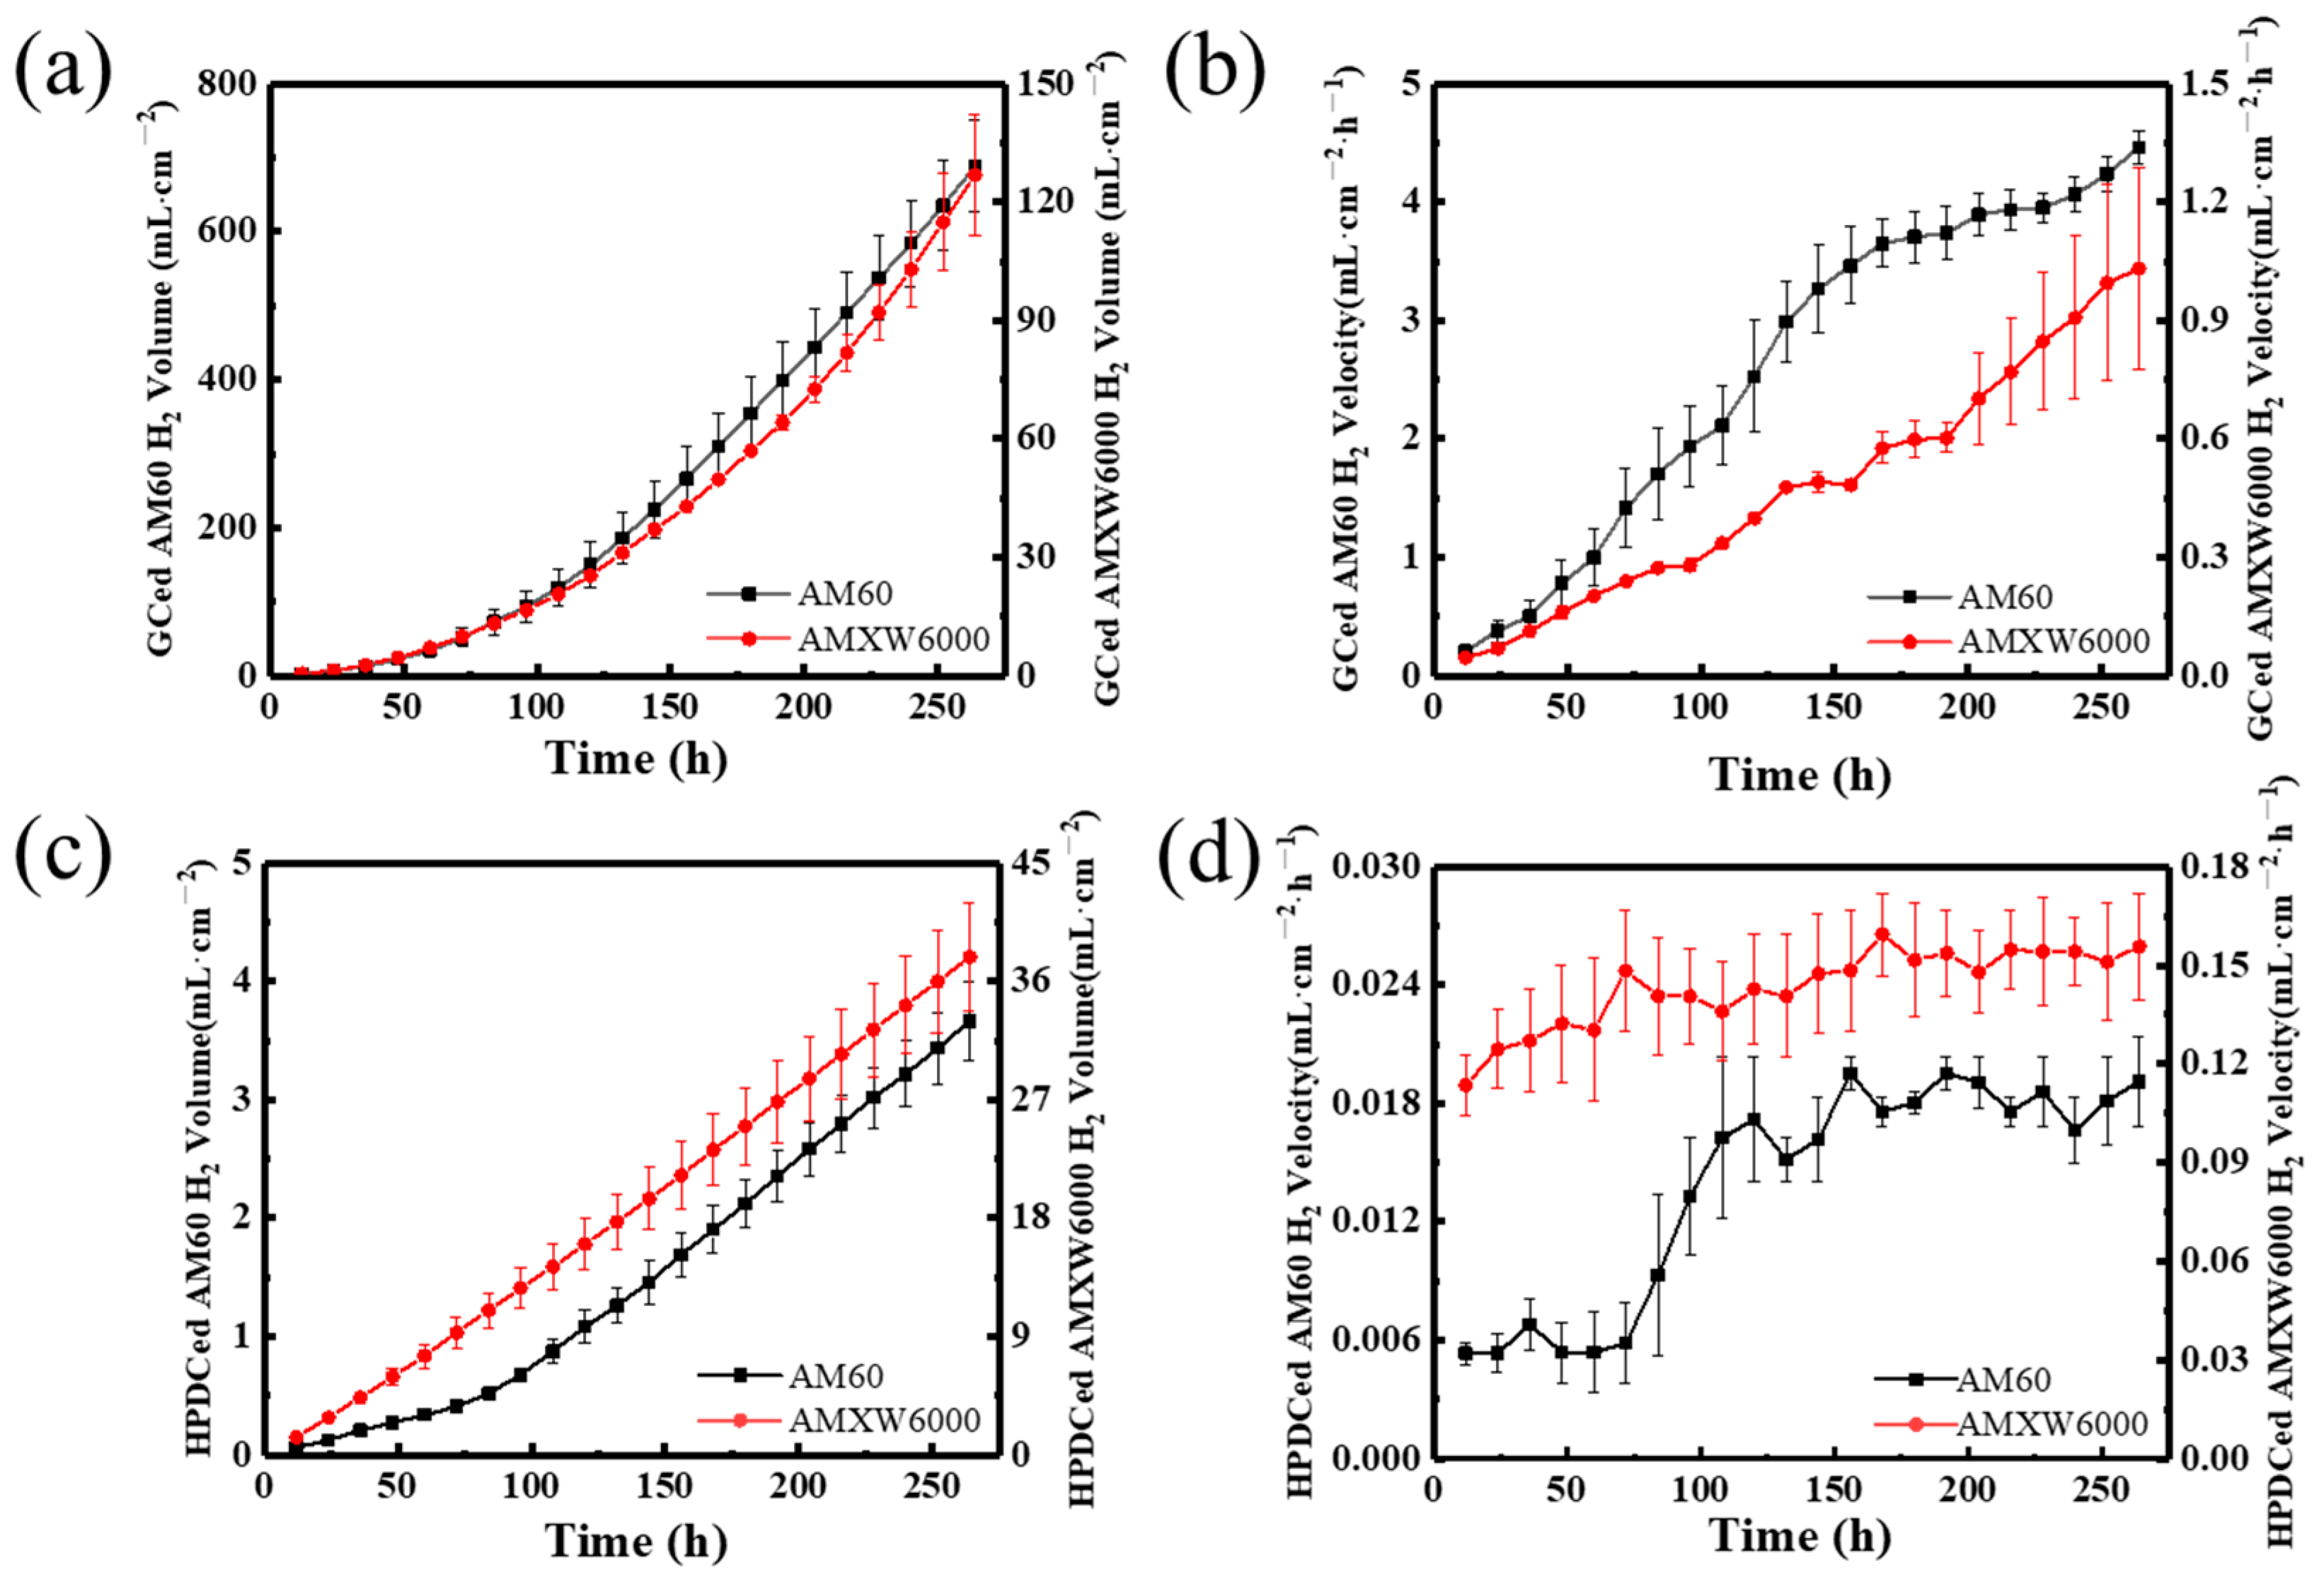
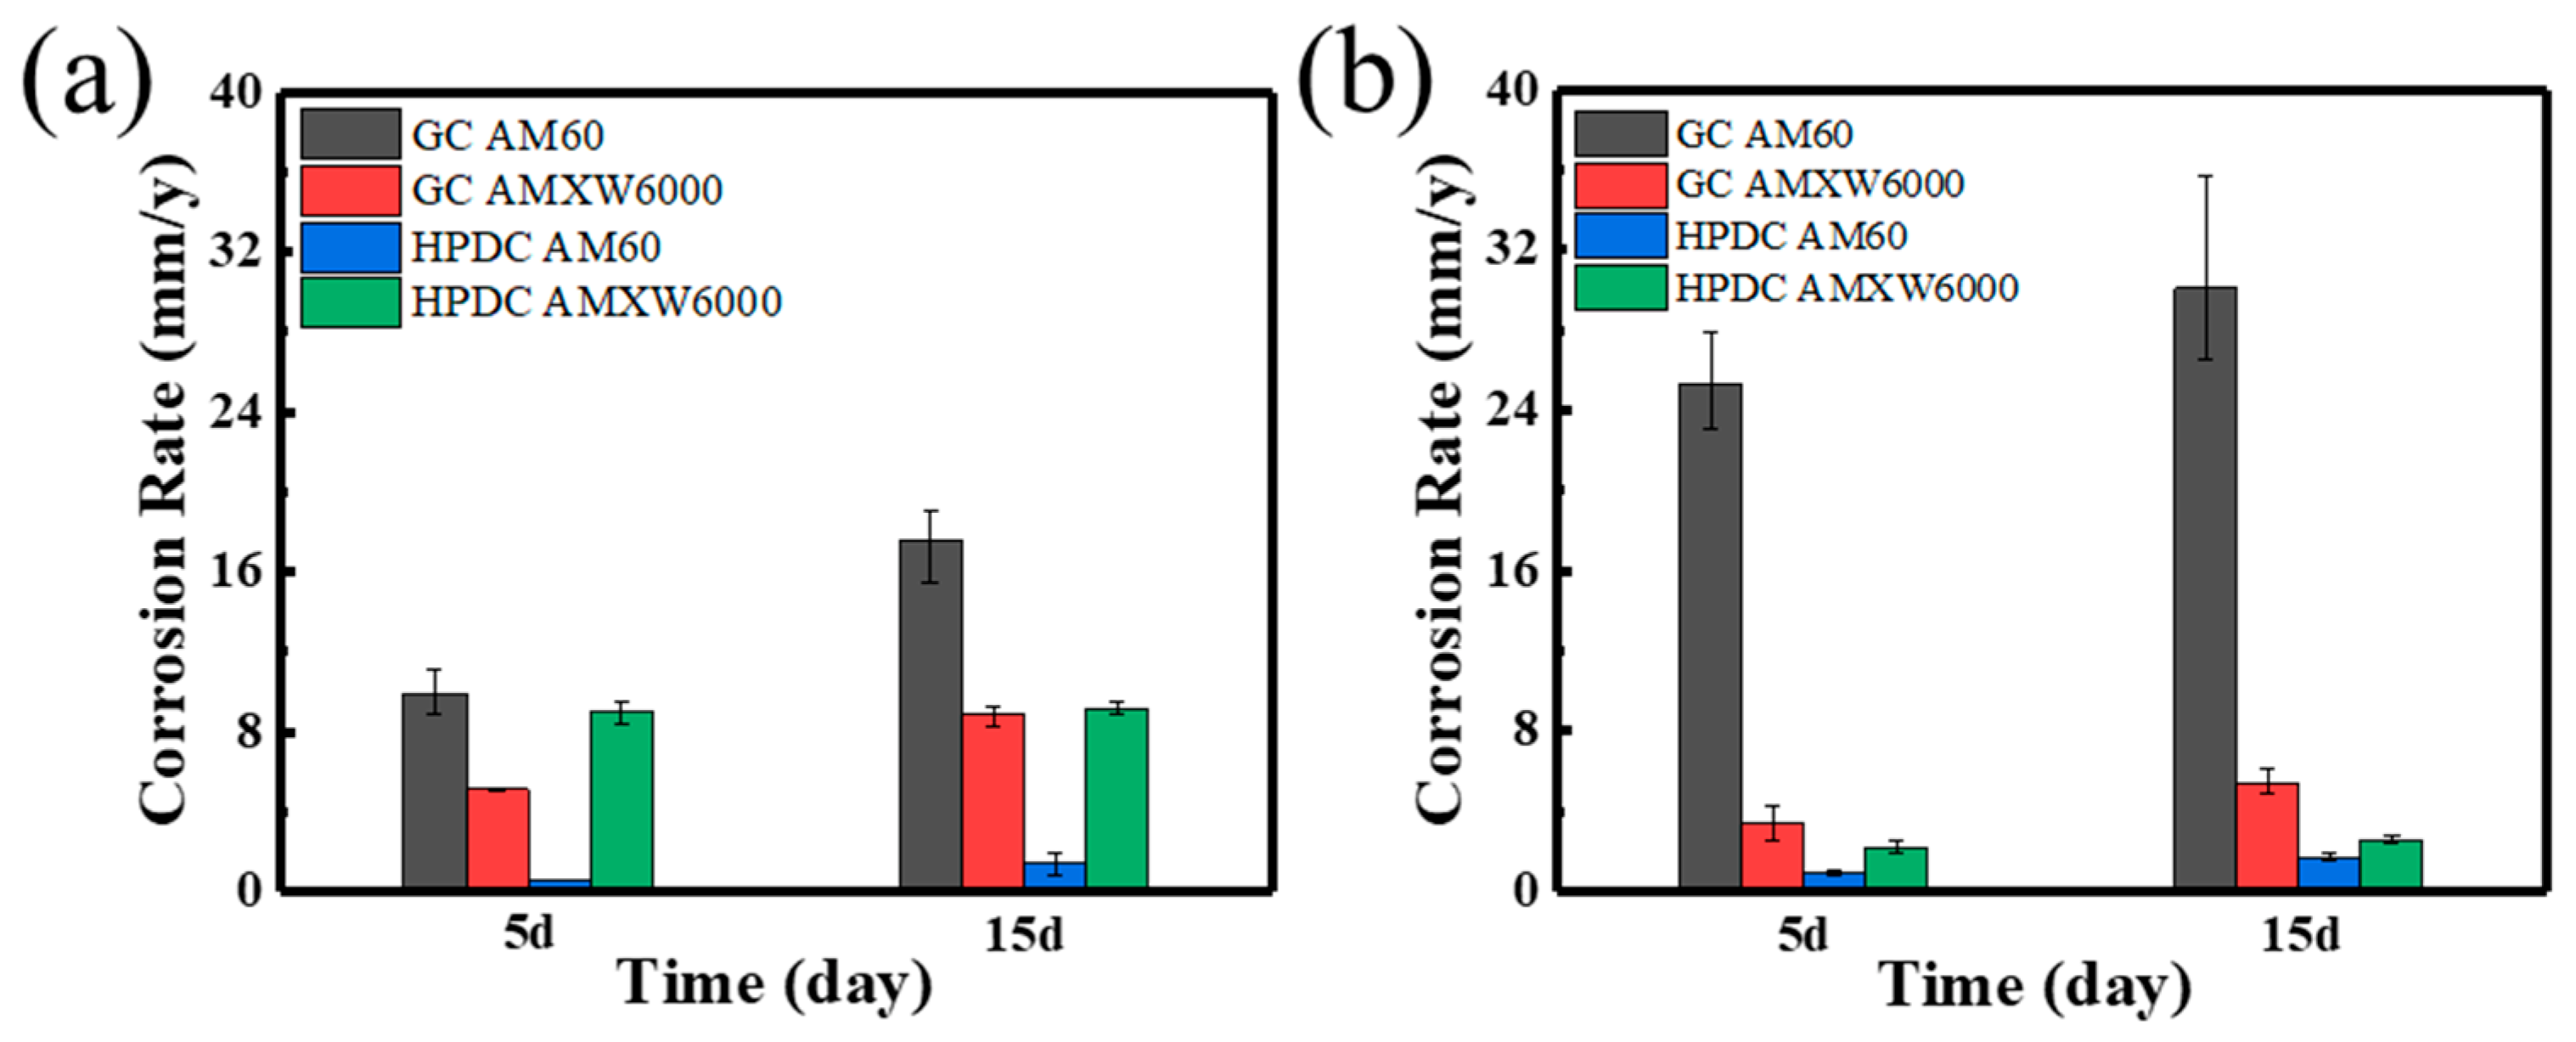
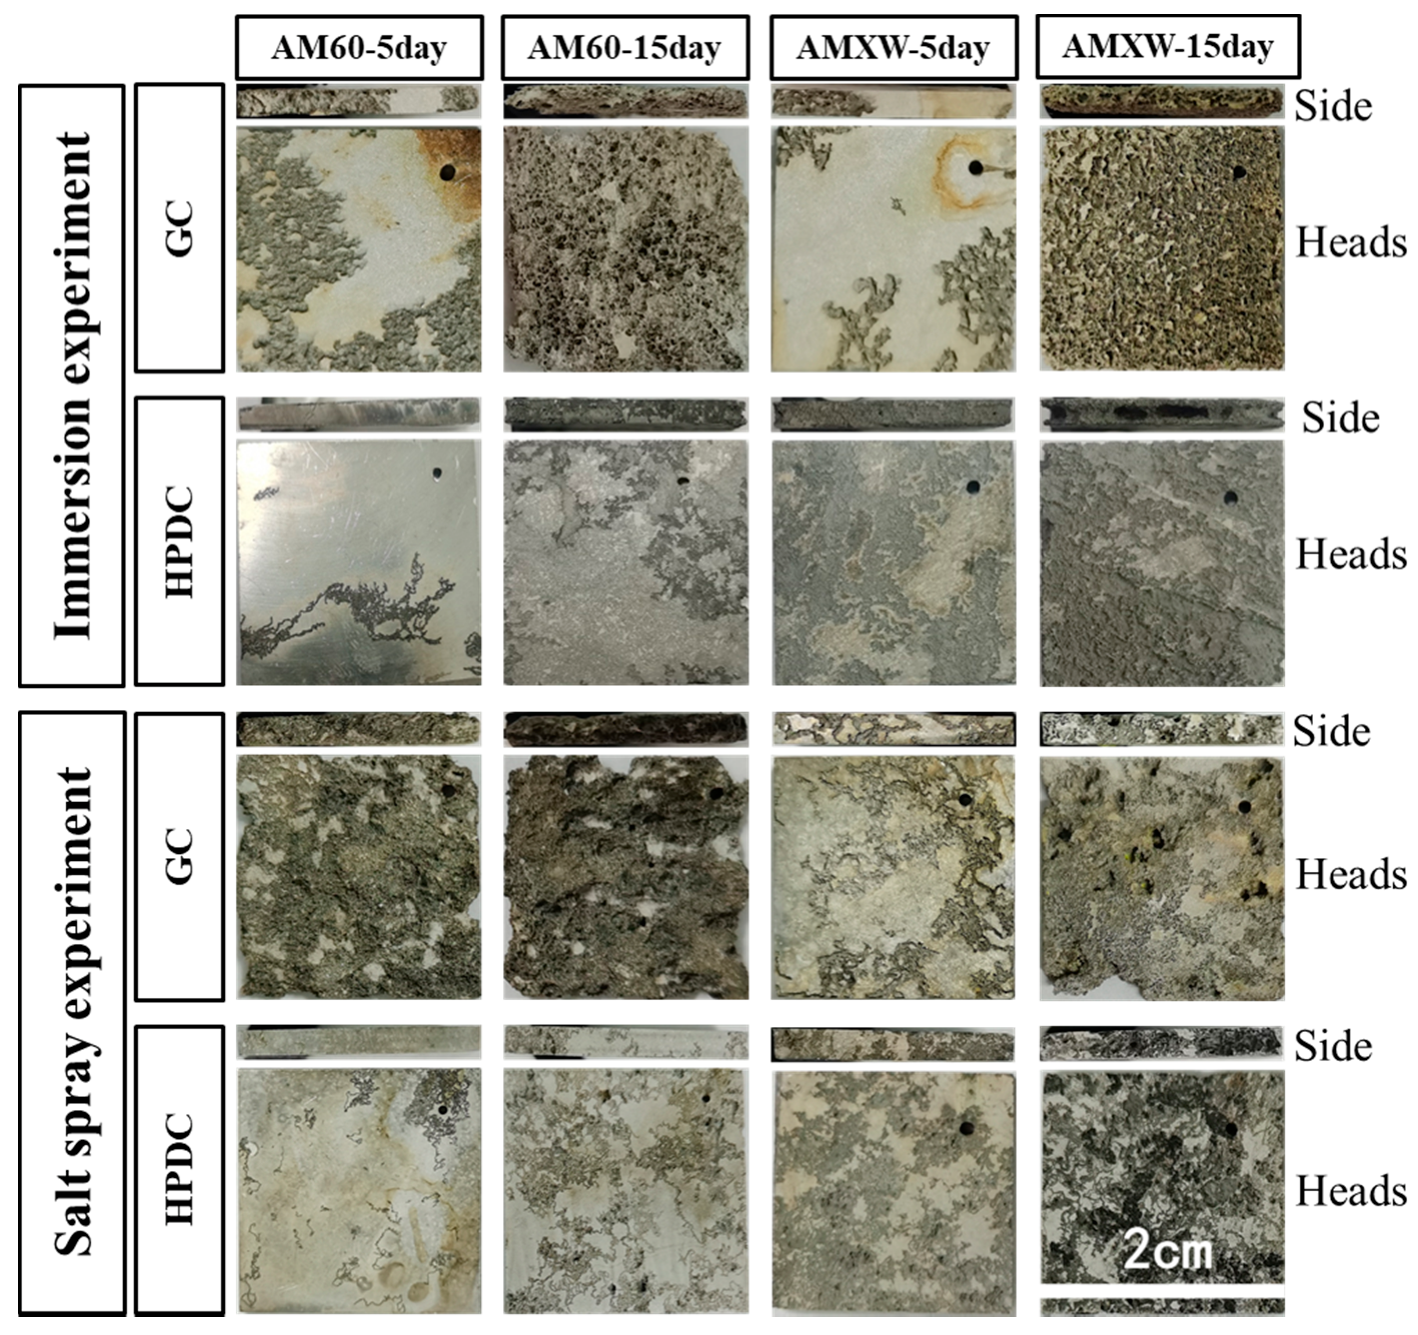
3.3. Hydrogen Evolution (HE), Immersion Test (IT), and Salt Spray Test (SST)

The corrosion rate of Mg alloys can be characterized by comparing the hydrogen evolution rate. Figure 8a,c shows the hydrogen release of AM60 and AMXW6000 samples, prepared by GC and HPDC. After over 250 h, the order of the hydrogen evolution volume is as follows: GCed AM60 > GCed AMXW6000 > HPDCed AMXW6000 > HPDCed AM60. The volume of H2 evolution of GCed AM60 alloy is about five times than that of GCed AMXW6000 alloy. However, the hydrogen release volume of AMXW6000 alloy is approximately ten times than that of AM60 alloy in the case of the HPDC process. As shown in Figure 8b,d, the corrosion rate of HPDCed AM60 alloy is the lowest, while the corrosion rate of GCed AM60 alloy is the highest. For GC samples, the second phase does not play a role in preventing corrosion, but it accelerates corrosion. This can be expected from Figure 3—the specific surface area increases after corrosion; therefore, the rate of hydrogen evolution increases continuously by galvanic corrosion. For HPDC specimen, the second phase presents a network structure, as shown in Figure 4 and Figure 5; the second phase of the network structure will play a positive role in restricting corrosion and finally achieve a relatively stable corrosion rate. The reason why the corrosion rate of HPDCed AM60 alloy is slower, resulted from the hindering effect of the second phase. When the α matrix is corroded, the retained second phase-containing layer on the surface is formed, which is close to a network structure and acts as barrier to somehow slow down the corrosion. In addition, the corrosion product, Mg(OH)2, adheres to the surface of the samples, which also delayed the corrosion.
However, the hydrogen collection results will be greatly affected by collection devices with hydrogen bubbles often stuck to funnels, dropper walls, and samples surfaces. In addition, significant differences are observed in the results of mass loss based on different corrosive ways, so long-term weight loss experiements of 5 days and 15 days, such as IT and SST, are applied here. Figure 9 shows the changes of the average corrosion rates of GC/HPDCed samples based on IT and SST. Table 2 lists the weight loss rate of IT and SST in detail. It can be seen that the corrosion resistance of HPDCed AM60 sample is the best, while the corrosion resistance of GCed AM60 sample is the worst.
Figure 10 shows the appearance of four samples after the removal of corrosion products for 5 and 15 days of corrosion in IT and SST. All samples were corroded severely. However, the HPDCed AM60 alloy is still subjected to the lowest level of corrosion, in which the surface still has a glossy finish after 5 days of immersion corrosion. A comparison of the previous HE, IT, and SST experimental results shows that the corrosion resistance of the AM60 alloy after HPDC has improved by at least ten times. The results indicated that the magnesium alloy produced by HPDC can obtain better corrosion resistance. Unfortunately, based on the above results from HE, IT, and SST, the corrosion resistance of the HPDCed AMXW6000 alloy has degraded compared with the AM60 counterpart. Although the corrosion resistance of AM60 alloys can be improved by adding Ca and Y in GC, Ca and Y addition to AM60 alloys seems not as good in HPDC and needs further study.

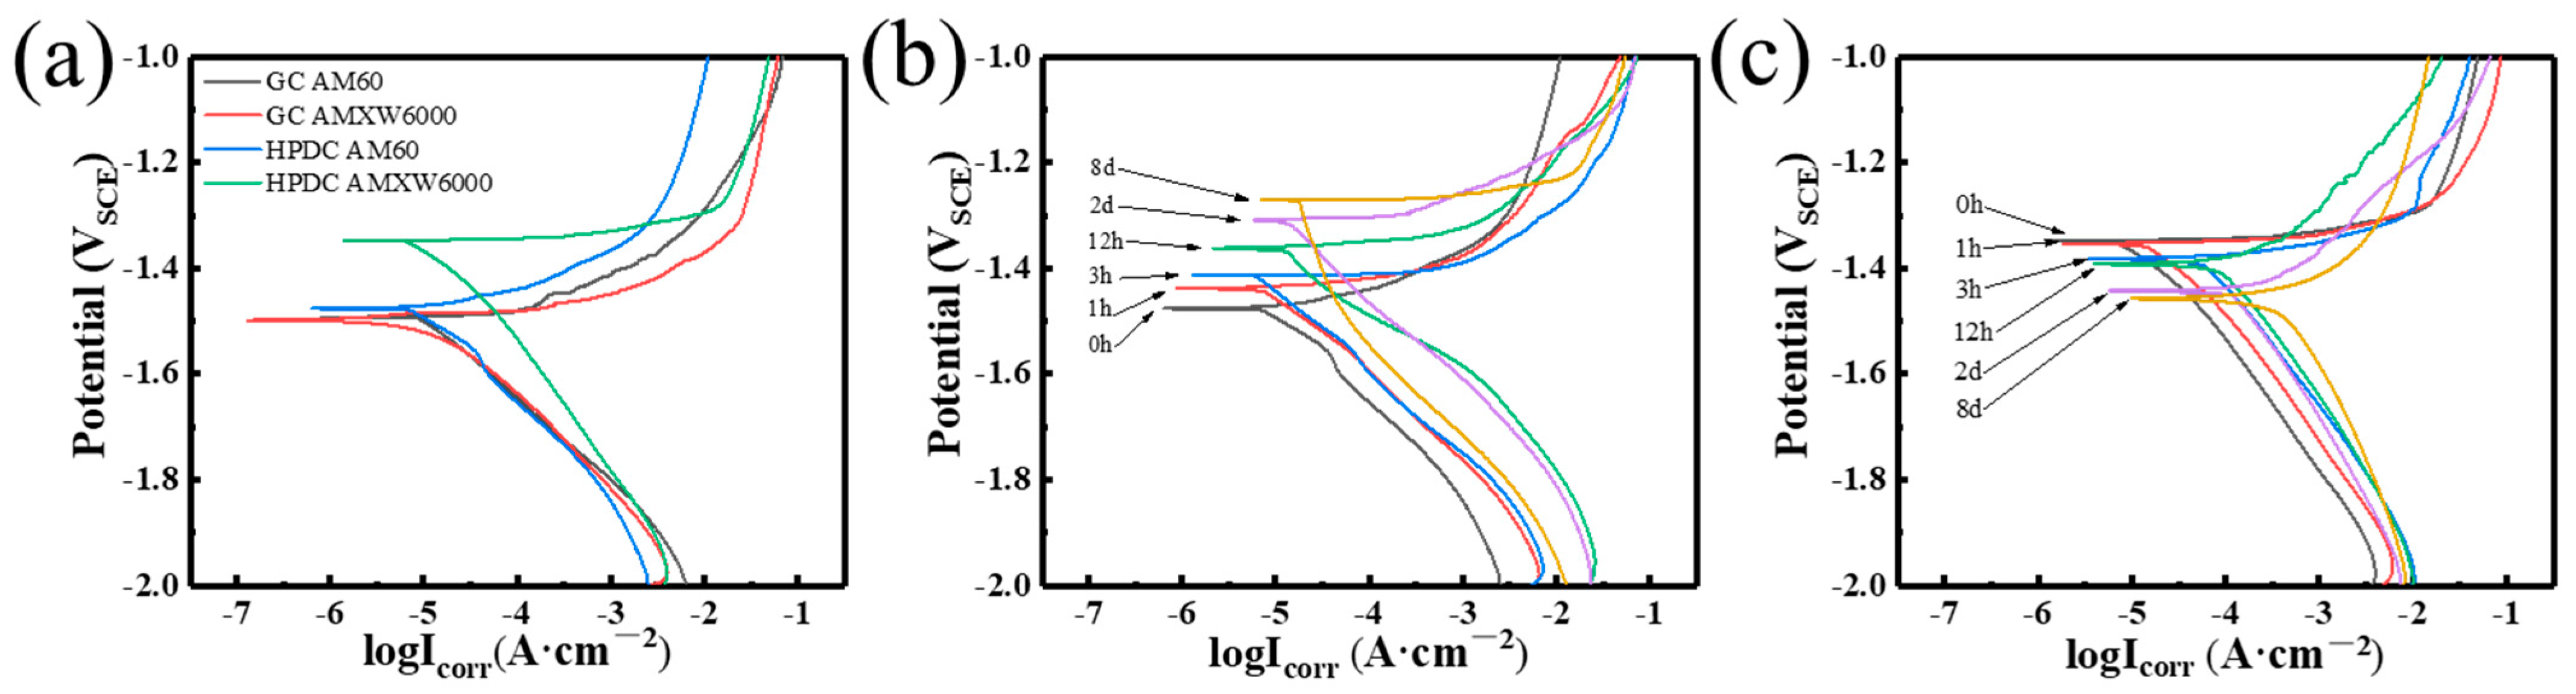
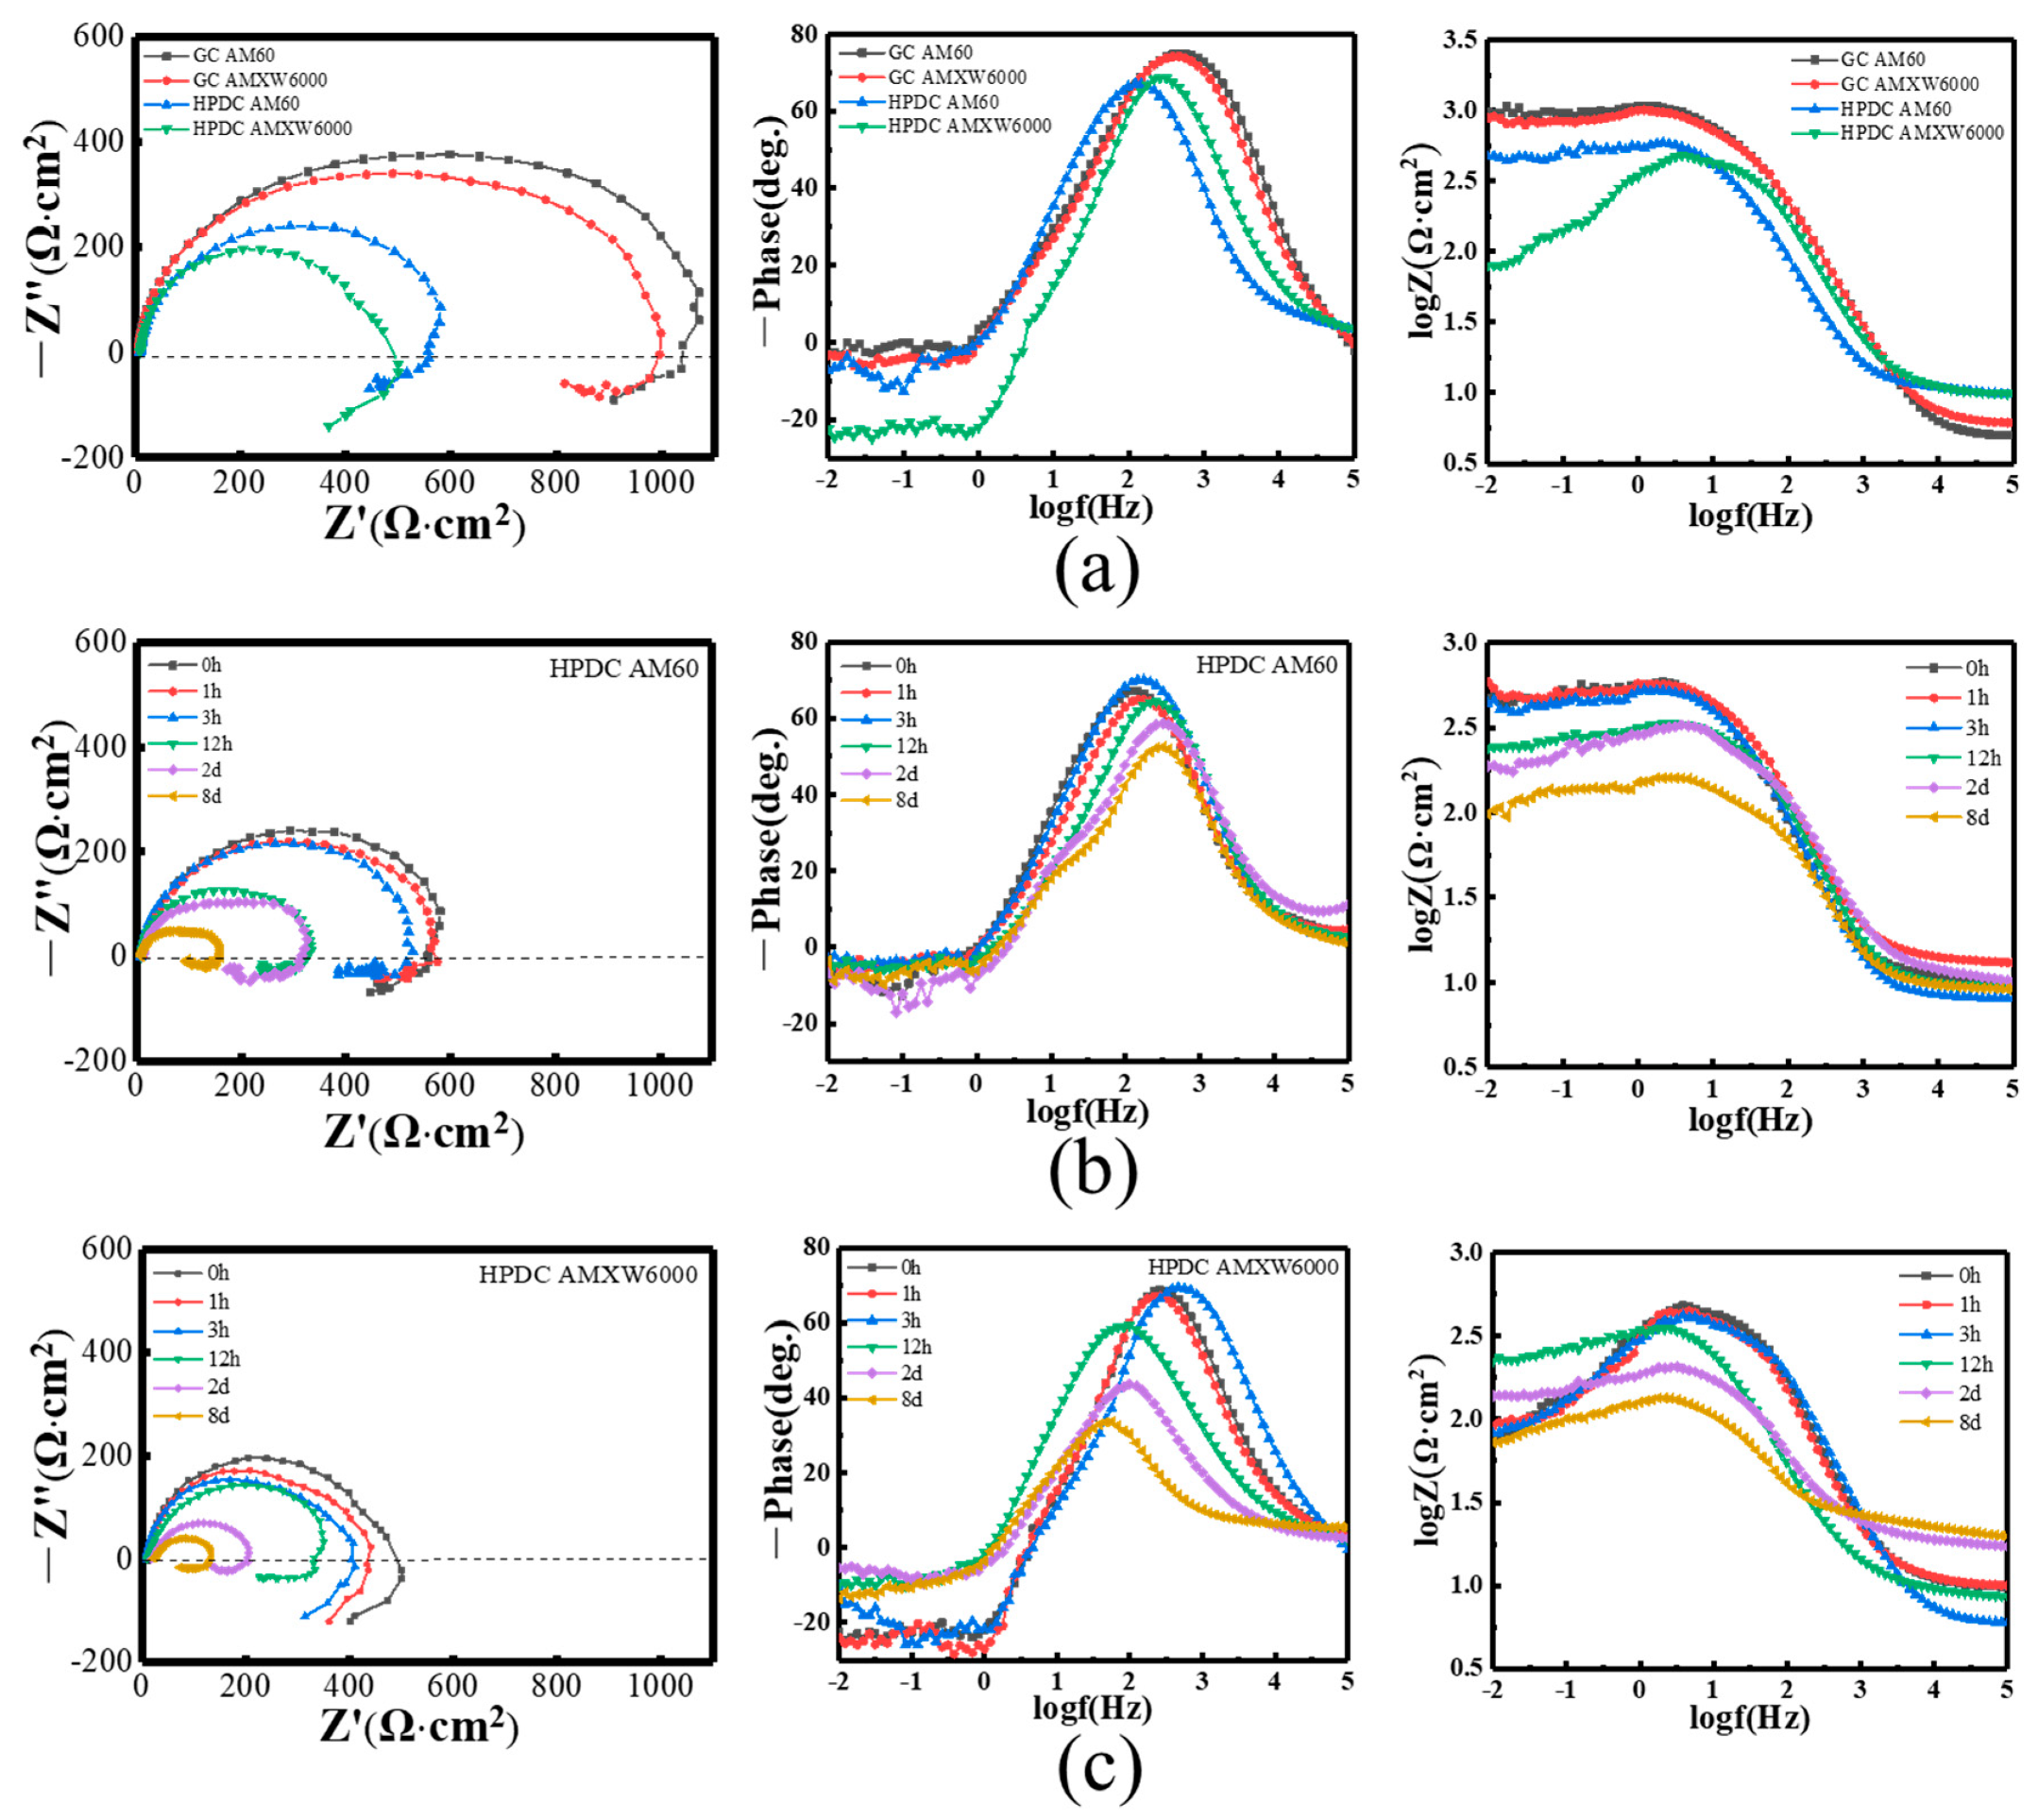
3.4. AC Impedance and Polarization Behavior

Tafel curves of the four samples are shown in Figure 11. It can be seen that the corrosion current of the GC alloys in the initial state is the lowest due to the low second phase area fraction, and the electronic transfer between second phases and matrix is relative low in the very beginning [24]. The Tafel curves of HPDCed AM60 and AMXW6000 alloys vary with time. As it can be seen from Figure 11b,c, the corrosion current of HPDC alloys gradually increases. It shows that as the corrosion proceeds, the corrosion rate of the HPDC alloy increases.
The second phase area fraction of the HPDC alloy at the initial stage of corrosion is significantly more than that of the GC, and the second phase is anodic with respect to the α phase, which will cause the potential to move to a more anodic direction and will generate more current density [24]. So, at the initial stage of corrosion HPDC potential is higher than GC. As the corrosion proceeds, the current and potential of the HPDCed AM60 alloy gradually increase, and the second phase on the surface causes the potential to move in a more anodic direction.
Figure 12 shows the electrochemical impedance spectroscopy (EIS) results of all samples. The Nyquist plots of all samples are composed of a capacitance arc at high and medium frequencies and an inductive arc at low frequencies. For the capacitance arc, the larger diameter indicates better corrosion resistance [37,38]. In the case of HPDCed AM60 and AMXW6000 alloys (see Figure 12b,c), with the increase in immersion time, the Nyquist curves decrease in diameter and the Bode phase plots decrease slightly in maximum peak value. It is indicating that the corrosion resistance decreases with the increase in corrosion time, which is consistent with the conclusion of the Tafel curves, exhibited in Figure 11.
The circuit of the EIS spectrum, fitted by equivalent electric circuit diagrams, is shown in Figure 13. The Rs, Rt, and Ct represent resistance of solution, charge transfer resistance, and micro-capacitance formed at the interface of the solution. Ct is caused by the ions in the solution not having enough time to diffuse, respectively. The oxide layer is weak and easy to crack, which will lead to further corrosion. The Rf and Cf indicate the diffusion of ions through the oxide film, where Rf represents the resistance of the film and Cf represents the capacitance of the film [18]. The L represents the second phase or the impurity particles formed on the surface. Commonly, the Rt value is used to evaluate the corrosion resistance of the alloy. As the corrosion progresses, the charge transfer resistance of the HPDCed alloy decreases, therefore, the corrosion resistance decreases; similar trends are also reported in Refs [34,39,40].

4. Conclusions

In summary, the influence of small amounts of Ca and Y on the corrosion properties of AM60 alloys was studied, as well as the corrosion mechanism of these two kinds of alloys under GC and HPDC was analyzed in depth. From the above results and discussion, we can draw the following main conclusions:
(1)
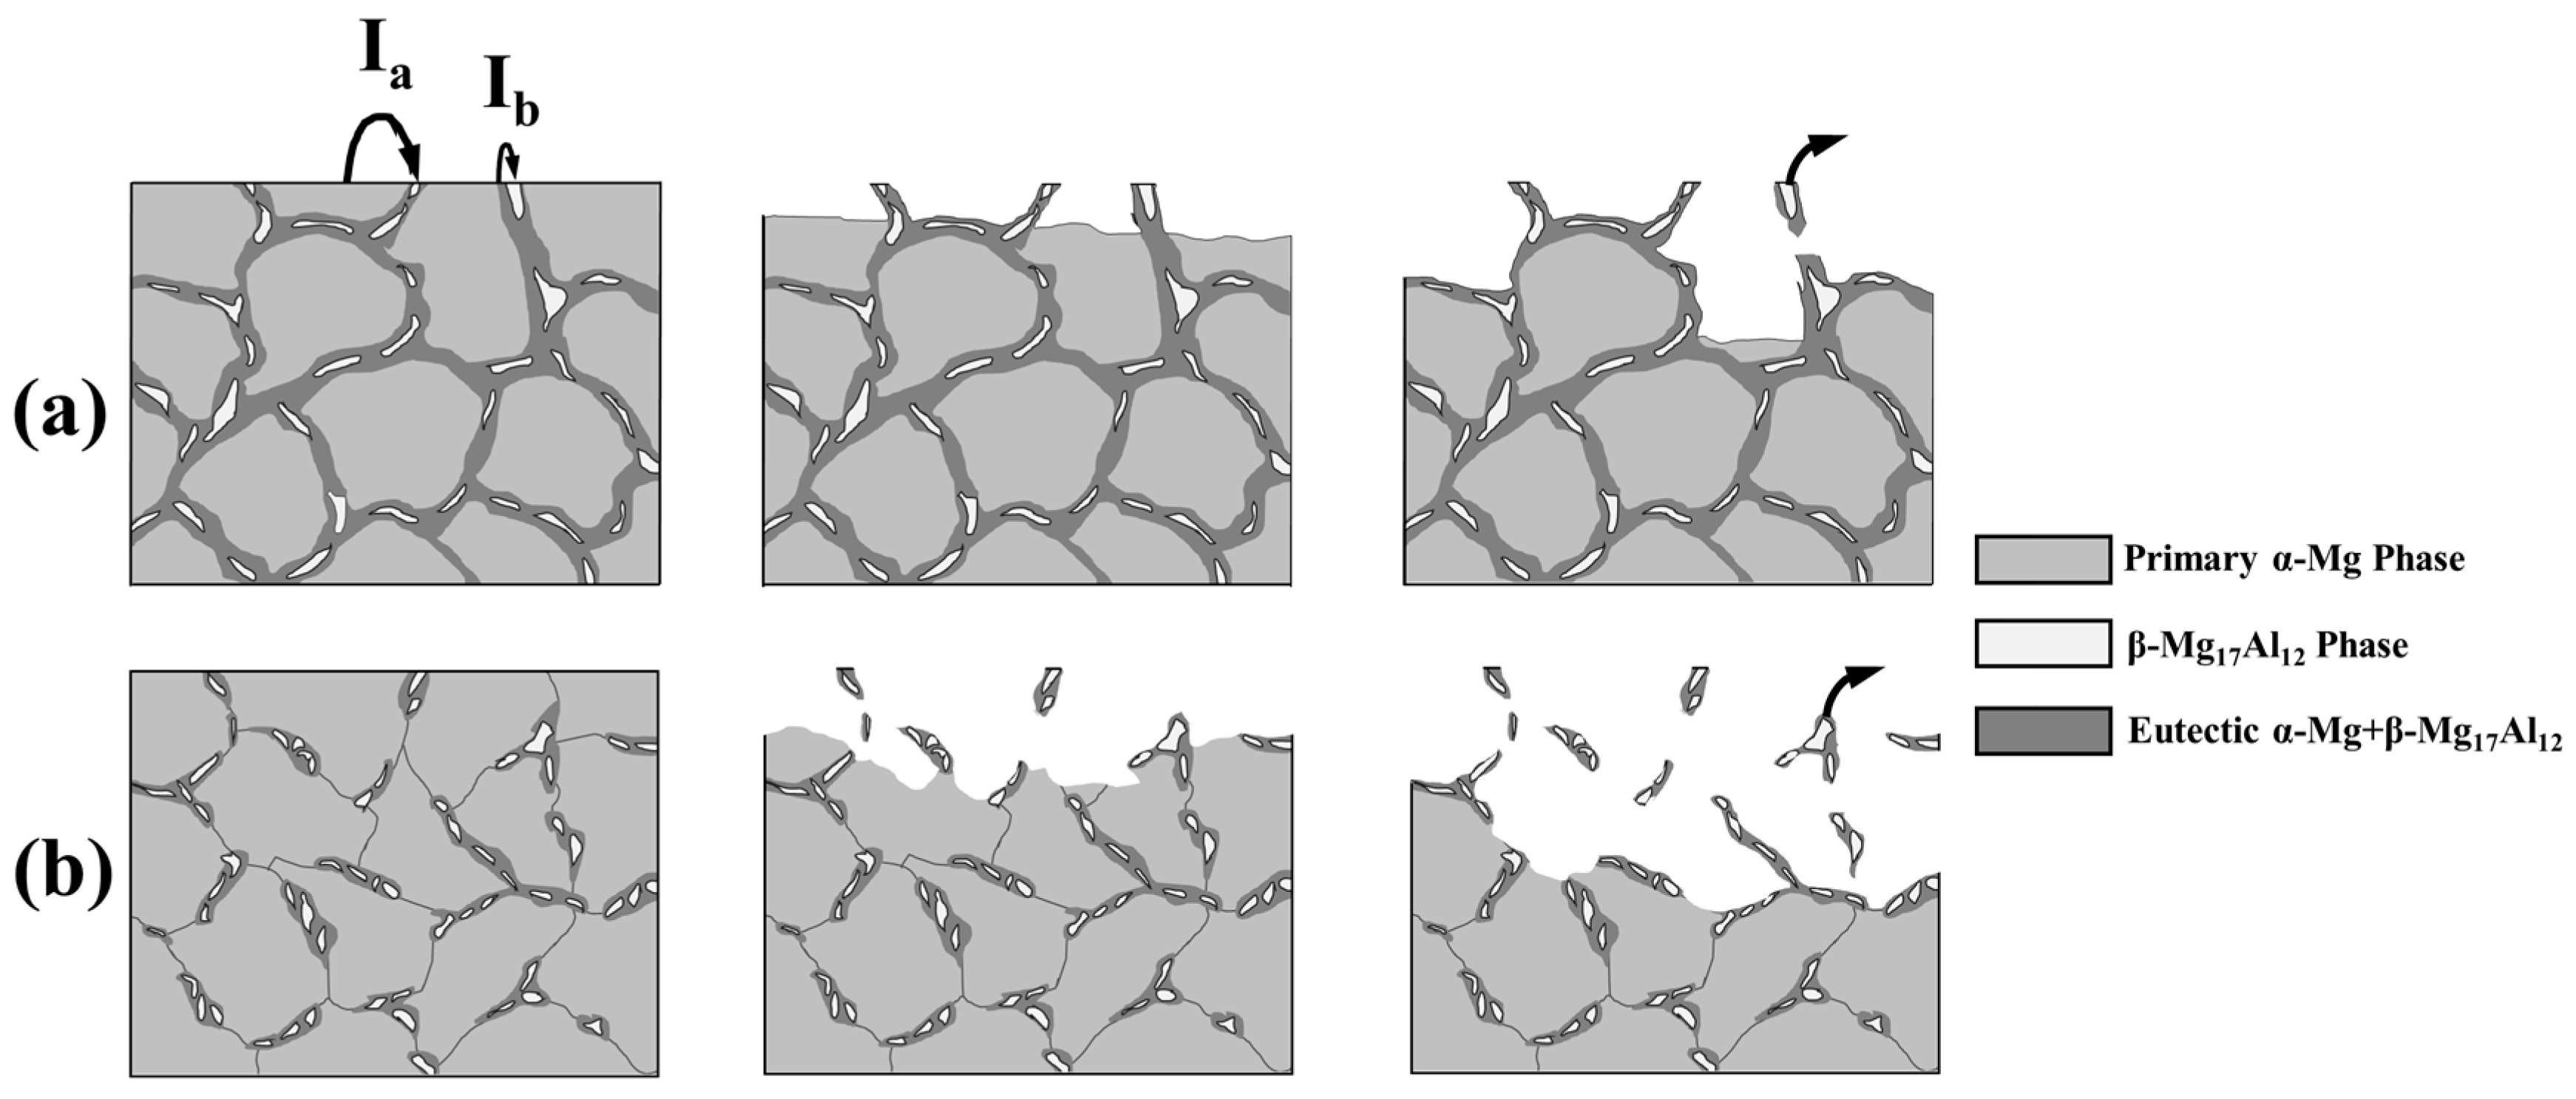
The corrosion rate of HPDCed alloys is lower than that of GCed counterparts, which is mainly due to the formation of a second phase network and grain refinement.
(2)
Comparing the results of HE, IT, and SST—the corrosion resistance of the AM60 alloy increased by a factor between 2 and 5 with the addition of Ca and Y under GC conditions. However, for HPDCed samples, the AM60 alloy exhibits better corrosion resistance due to second phase hindering electrochemical corrosion action. Thus, the corrosion effect of Ca and Y on the AM60 alloy under different casting processing is different.
(3)
Although the second phase network structure serves to slow down corrosion, the corrosion resistance of HPDCed alloys gradually decreases with the corrosion process.
We hope this study can not only provide new corrosion insights of AM60 based alloys from inspection of various casting processes, but also better understanding of novel designs of high performance Mg alloys in the near future.

Author Contributions

Conceptualization, H.Y., X.Y., Y.K. and B.Y.; data curation, X.Y. and H.Y.; formal analysis, W.Y. and L.H.; funding acquisition, H.Y. and Y.K.; investigation, S.K.; methodology, H.Y. and K.S.; project administration, H.Y., W.Z. and W.Y.; resources, H.Y., W.Z., W.Y., L.H., C.L. and B.Y.; supervision, B.Y., W.Y., L.H., Y.K. and C.L.; validation, W.Z., S.K. and W.Y.; writing—original draft, H.Y. and X.Y.; writing—review & editing, H.Y., W.Y., S.K., Y.K., B.Y., L.H., C.L., W.Z. and K.S. All authors have read and agreed to the published version of the manuscript.

Funding

This work was supported by the National Natural Science Foundation of China (No. 51701060), the Scientific Research Foundation for the Returned Overseas Chinese Scholars of Hebei Province (No. C20190505) and KIGAM DMR project from NST, Korea (No. CRC-15-06-KIGAM).

Institutional Review Board Statement

Not applicable.

Informed Consent Statement

Not applicable.

Data Availability Statement

Not applicable.

Conflicts of Interest

The authors declare no conflict of interest.

References

  1. Kumar, D.; Phanden, R.K.; Thakur, L. A review on environment friendly and lightweight Magnesium-Based metal matrix composites and alloys. Mater. Today Proc. 2020, 38, 359–364. [Google Scholar] [CrossRef]
  2. Joost, W.J.; Krajewski, P.E. Towards magnesium alloys for high-volume automotive applications. Scr. Mater. 2016, 128, 107–112. [Google Scholar] [CrossRef]
  3. Tharumarajah, A.; Koltun, P. Is there an environmental advantage of using magnesium components for light-weighting cars? J. Clean. Prod. 2007, 15, 1007–1013. [Google Scholar] [CrossRef]
  4. Esmaily, M.; Svensson, J.E.; Fajardo, S.; Birbilis, N.; Frankel, G.S.; Virtanen, S.; Arrabal, R.; Thomas, S.; Johansson, L.G. Fundamentals and advances in magnesium alloy corrosion. Prog. Mater. Sci. 2017, 89, 92–193. [Google Scholar] [CrossRef]
  5. Weiler, J.P. A review of magnesium die-castings for closure applications. J. Magnes. Alloys 2019, 7, 297–304. [Google Scholar] [CrossRef]
  6. Luo, A.A. Applications: Aerospace, automotive and other structural applications of magnesium. Fundam. Magnes. Alloy Metall. 2013, 10, 266–316. [Google Scholar]
  7. Luo, A.A.; Sachdev, A.K. Applications of magnesium alloys in automotive engineering. Adv. Wrought Magnes. Alloys 2012, 1, 393–426. [Google Scholar]
  8. Weiler, J.P. Exploring the concept of castability in magnesium die-casting alloys. J. Magnes. Alloys 2021, 9, 102–111. [Google Scholar] [CrossRef]
  9. Pan, F.S.; Yang, J.; Nyberg, E.A.; Peng, J. Effect of Ca addition on the corrosion behavior of Mg-Al-Mn alloy. Appl. Surf. Sci. 2016, 369, 92–100. [Google Scholar]
  10. Powell, B.R.; Krajewski, P.E.; Luo, A.A. Magnesium alloys for lightweight powertrains and automotive structures. Mater. Des. Manuf. Lightweight Veh. 2010, 80, 114–173. [Google Scholar]
  11. Song, G.L.; Atrens, A. Corrosion Mechanisms of Magnesium Alloys. Adv. Eng. Mater. 2010, 1, 11–33. [Google Scholar] [CrossRef]
  12. Xu, T.; Yang, Y.; Peng, X.; Song, J.; Pan, F.S. Overview of advancement and development trend on magnesium alloy. J. Magnes. Alloys 2019, 7, 536–544. [Google Scholar] [CrossRef]
  13. Atrens, A.; Song, G.L.; Cao, F.; Shi, Z.M.; Bowen, P.K. Advances in Mg corrosion and research suggestions. J. Magnes. Alloys 2013, 1, 177–200. [Google Scholar] [CrossRef] [Green Version]
  14. Kim, K.H.; Nam, N.D.; Kim, J.G.; Shin, K.S.; Jung, H.C. Effect of calcium addition on the corrosion behavior of Mg–5Al alloy. Intermetallics 2011, 19, 1831–1838. [Google Scholar] [CrossRef]
  15. Chu, J.H.; Tong, L.B.; Jiang, Z.H.; Zou, D.N.; Zhang, H.J. A comparison study of Ce/La and Ca microalloying on the bio-corrosion behaviors of extruded Mg-Zn alloys. J. Magnes. Alloys 2020, 8, 1269–1280. [Google Scholar] [CrossRef]
  16. You, B.S.; Park, W.W.; Chung, I.S. The effect of calcium additions on the oxidation behavior in magnesium alloys. Scr. Mater. 2000, 11, 1089–1094. [Google Scholar] [CrossRef]
  17. Liu, W.; Cao, F.; Jia, B.; Zheng, L.; Zhang, J.; Cao, C.; Li, X. Corrosion behaviour of AM60 magnesium alloys containing Ce or La under thin electrolyte layers. Part 2: Corrosion product and characterization. Corros. Sci. 2010, 52, 639–650. [Google Scholar] [CrossRef]
  18. Luo, T.J.; Yang, Y.S.; Li, Y.J.; Dong, X.G. Influence of rare earth Y on the corrosion behavior of as-cast AZ91 alloy. Electrochim. Acta 2009, 54, 6433–6437. [Google Scholar] [CrossRef]
  19. Sang, K.W.; Blawert, C.; Yasakau, K.A.; Yi, S.; Chang, D.Y. Effects of combined addition of Ca and Y on the corrosion behaviours of die-cast AZ91D magnesium alloy. Corros. Sci. 2020, 166, 108451–108463. [Google Scholar]
  20. Szklarz, Z.; Krawiec, H.; Rogal, L. The effect of vacuum suction casting on the microstructure and corrosion behavior of aluminium alloy 2017. Mater. Sci. Eng. 2019, 240, 23–32. [Google Scholar] [CrossRef]
  21. Qi, M.; Kang, Y.; Qiu, Q.; Tang, W.; Li, J.; Li, B. Microstructures, mechanical properties, and corrosion behavior of novel high-thermal-conductivity hypoeutectic Al-Si alloys prepared by rheological high pressure die-casting and high pressure die-casting. J. Alloys Compd. 2018, 749, 487–502. [Google Scholar] [CrossRef]
  22. Wu, M.; Xiong, S. Microstructure Characteristics of the Eutectics of Die Cast AM60B Magnesium Alloy. J. Mater. Sci. Technol. 2011, 27, 1150–1156. [Google Scholar] [CrossRef]
  23. Cao, F.; Shi, Z.; Hofstetter, J.; Uggowitzer, P.J.; Song, G.; Ming, L.; Atrens, A. Corrosion of ultra-high-purity Mg in 3.5% NaCl solution saturated with Mg(OH)2. Corros. Sci. 2013, 75, 78–99. [Google Scholar] [CrossRef]
  24. Ambat, R.; Aung, N.N.; Zhou, W. Evaluation of microstructural effects on corrosion behaviour of AZ91D magnesium alloy. Corros. Sci. 2000, 42, 1433–1455. [Google Scholar] [CrossRef]
  25. Kondori, B.; Mahmudi, R. Effect of Ca additions on the microstructure, thermal stability and mechanical properties of a cast AM60 magnesium alloy. Mater. Sci. Eng. 2010, 527, 2014–2021. [Google Scholar] [CrossRef]
  26. Ralston, K.D.; Birbilis, N.; Davies, C. Revealing the relationship between grain size and corrosion rate of metals. Scr. Mater. 2010, 63, 1201–1204. [Google Scholar] [CrossRef]
  27. Kim, H.S.; Kim, W.J. Enhanced corrosion resistance of ultrafine-grained AZ61 alloy containing very fine particles of Mg17Al12 phase. Corros. Sci. 2013, 75, 228–238. [Google Scholar] [CrossRef]
  28. Gollapudi, S. Grain size distribution effects on the corrosion behaviour of materials. Corros. Sci. 2012, 62, 90–94. [Google Scholar] [CrossRef]
  29. Aghion, E.; Lulu, N. The corrosion performance of die-cast magnesium alloy MRI230D in 3.5% NaCl solution saturated with Mg(OH)2. Mater. Charact. 2010, 61, 1221–1226. [Google Scholar] [CrossRef]
  30. Yim, C.D.; Kim, Y.M.; You, B.S. Effect of Ca Addition on the Corrosion Resistance of Gravity Cast AZ31 Magnesium Alloy. Mater. Trans. 2007, 48, 1023–1028. [Google Scholar] [CrossRef] [Green Version]
  31. Gusieva, K.; Davies, C.; Scully, J.R.; Birbilis, N. Corrosion of magnesium alloys the role of alloying. Int. Mater. Rev. 2015, 60, 169–194. [Google Scholar] [CrossRef]
  32. Cheng, Y.L.; Qin, Y.W.; Wang, H.M.; Zhang, Z. Comparison of corrosion behaviors of AZ31, AZ91, AM60 and ZK60 magnesium alloys. Trans. Nonferrous Met. Soc. China 2009, 19, 4–9. [Google Scholar] [CrossRef]
  33. Oliveira, M.C.L.D.; Pereira, V.S.M.; Correa, O.V.; Lima, N.B.D.; Antunes, R.A. Correlation between the corrosion resistance and the semiconducting properties of the oxide film formed on AZ91D alloy after solution treatment. Corros. Sci. 2013, 69, 311–321. [Google Scholar] [CrossRef]
  34. Jian, C.; Wang, J.; Han, E.; Dong, J.; Wei, K. AC impedance spectroscopy study of the corrosion behavior of an AZ91 magnesium alloy in 0.1 M sodium sulfate solution. Electrochim. Acta 2007, 52, 3299–3309. [Google Scholar]
  35. Pardo, A.; Merino, M.C.; Coy, A.E.; Arrabal, R.; Viejo, F.; Matykina, E. Corrosion behaviour of magnesium/aluminium alloys in 3.5 wt.% NaCl. Corros. Sci. 2008, 50, 823–834. [Google Scholar] [CrossRef]
  36. Song, G.; Atrens, A.; Dargusch, M. Influence of microstructure on the corrosion of diecast AZ91D. Corros. Sci. 1998, 41, 249–273. [Google Scholar] [CrossRef]
  37. Galicia, G.; Pébère, N.; Tribollet, B.; Vivier, V. Local and global electrochemical impedances applied to the corrosion behaviour of an AZ91 magnesium alloy. Corros. Sci. 2009, 51, 1789–1794. [Google Scholar] [CrossRef] [Green Version]
  38. Baril, G.; Blanc, C.; Pe, B.R.N. AC Impedance Spectroscopy in Characterizing Time-Dependent Corrosion of AZ91 and AM50 Magnesium Alloys Characterization with Respect to Their Microstructures. J. Electrochem. Soc. 2001, 148, 489–496. [Google Scholar] [CrossRef]
  39. Joensson, M.; Dan, P.; Thierry, D. Corrosion product formation during NaCl induced atmospheric corrosion of magnesium alloy AZ91D. Corros. Sci. 2007, 49, 1540–1558. [Google Scholar] [CrossRef]
  40. Sachdeva, D. Insights into microstructure based corrosion mechanism of high pressure die cast AM50 alloy. Corros. Sci. 2012, 60, 18–31. [Google Scholar] [CrossRef]
Figure 1. Solidification calculation of (a) AM60 alloy and (b) AMXW6000 alloy by PandatTM; (c) XRD patterns of AM60 and AMXW6000 alloys under GC and HPDC.
Metals 12 00495 g001
Figure 2. SEM images of (a) GC AM60 alloy, (b) GC AMXW6000 alloy, (c) HPDC AM60 alloy, (d) HPDC AMXW6000 alloy, and corresponding (e) EDS results in (ad), respectively.
Metals 12 00495 g002
Figure 3. SEM observation of (ae) GC AM60 alloy and (fj) GC AMXW6000 alloy by immersion after 1 h, 3 h, 12 h, 2 days, 8 days, respectively.
Metals 12 00495 g003
Figure 4. SEM images of HPDCed AM60 alloy under various immersion time: (a) 3 h; (b) 12 h; (c) 2 days; (d) 8 days; SEM with EDS mapping of HPDCed AM60 alloy after immersion for (e) 12 h; (f) 2 days; (g) 8 days, respectively.
Metals 12 00495 g004
Figure 5. SEM images of HPDCed AMXW6000 alloy under various immersion time: (a) 3 h; (b) 12 h; (c) 2 days; (d) 8 days; SEM with EDS mapping of HPDCed AM6000 alloy after immersion for (e) 12 h; (f) 2 days; (g) 8 days, respectively.
Metals 12 00495 g005
Figure 6. Cross sectional SEM images of HPDCed (a) AM60 alloy and (b) AMXW6000 alloy after 4 days immersion.
Metals 12 00495 g006
Figure 7. Schematic diagram of corrosion behavior in (a) HPDCed sample and (b) GCed alloys.
Metals 12 00495 g007
Figure 8. H2 release volume (a,c) and calculated evolution rate (b,d) of AM60 and AMXW6000 alloy in terms of time in GC and HPDC state, respectively.
Metals 12 00495 g008
Figure 9. Corrosion rate examined by weight loss tests of GC and HPDC samples: (a) IT and (b) SST results, respectively.
Metals 12 00495 g009
Figure 10. Macro-morphology of corroded surface & side under IT and SST after 5 and 15 days.
Metals 12 00495 g010
Figure 11. Linear polarization curves of (a) as-received GC and HPDC samples, (b) HPDCed AM60 and (c) AMXW6000 alloys, for different values of corrosion time.
Metals 12 00495 g011
Figure 12. Nyquist plots and Bode impedance plots of (a) as-received GC and HPDC samples, (b,c) HPDCed AM60 and AMXW6000 alloy with different corrosion times, respectively.
Metals 12 00495 g012
Figure 13. Equivalent electric circuit diagrams of EIS from Figure 12.
Metals 12 00495 g013
Table 1. The chemical composition (in wt%) of AM60 and AMXW6000 alloys by GC and HPDC.
SamplesMgAlMnCaYSiFe
GCed AM60Bal.6.3000.340--0.0100.0065
GCed AMXW6000Bal.6.0700.1400.1900.2000.0770.0084
HPDCed AM60Bal.6.0600.330--0.0780.0064
HPDCed AMXW6000Bal.6.0500.1200.2300.1700.0480.0095
Table 2. Corresponding weight loss results in Figure 9.
TimeSamplesImmersion Corrosion Rate (mm·y−1)Salt Spray Corrosion Rate (mm·y−1)
5 daysGCed AM609.90 ± 1.125.32 ± 2.3
GCed AMXW60005.13 ± 0.0413.41 ± 0.85
HPDCed AM600.58 ± 0.0340.90 ± 0.15
HPDCed AMXW60009.02 ± 0.512.20 ± 0.35
15 daysGCed AM6017.63 ± 1.730.07 ± 4.5
GCed AMXW60008.92 ± 0.515.37 ± 0.53
HPDCed AM601.43 ± 0.531.71 ± 0.20
HPDCed AMXW60009.13 ± 0.252.55 ± 0.22
Publisher’s Note: MDPI stays neutral with regard to jurisdictional claims in published maps and institutional affiliations.

