
Ultrasonic Metal Welding of Multilayered Copper Foils to Nickel-Plated Copper Sheet in Lithium-Ion Battery Cell


Abstract
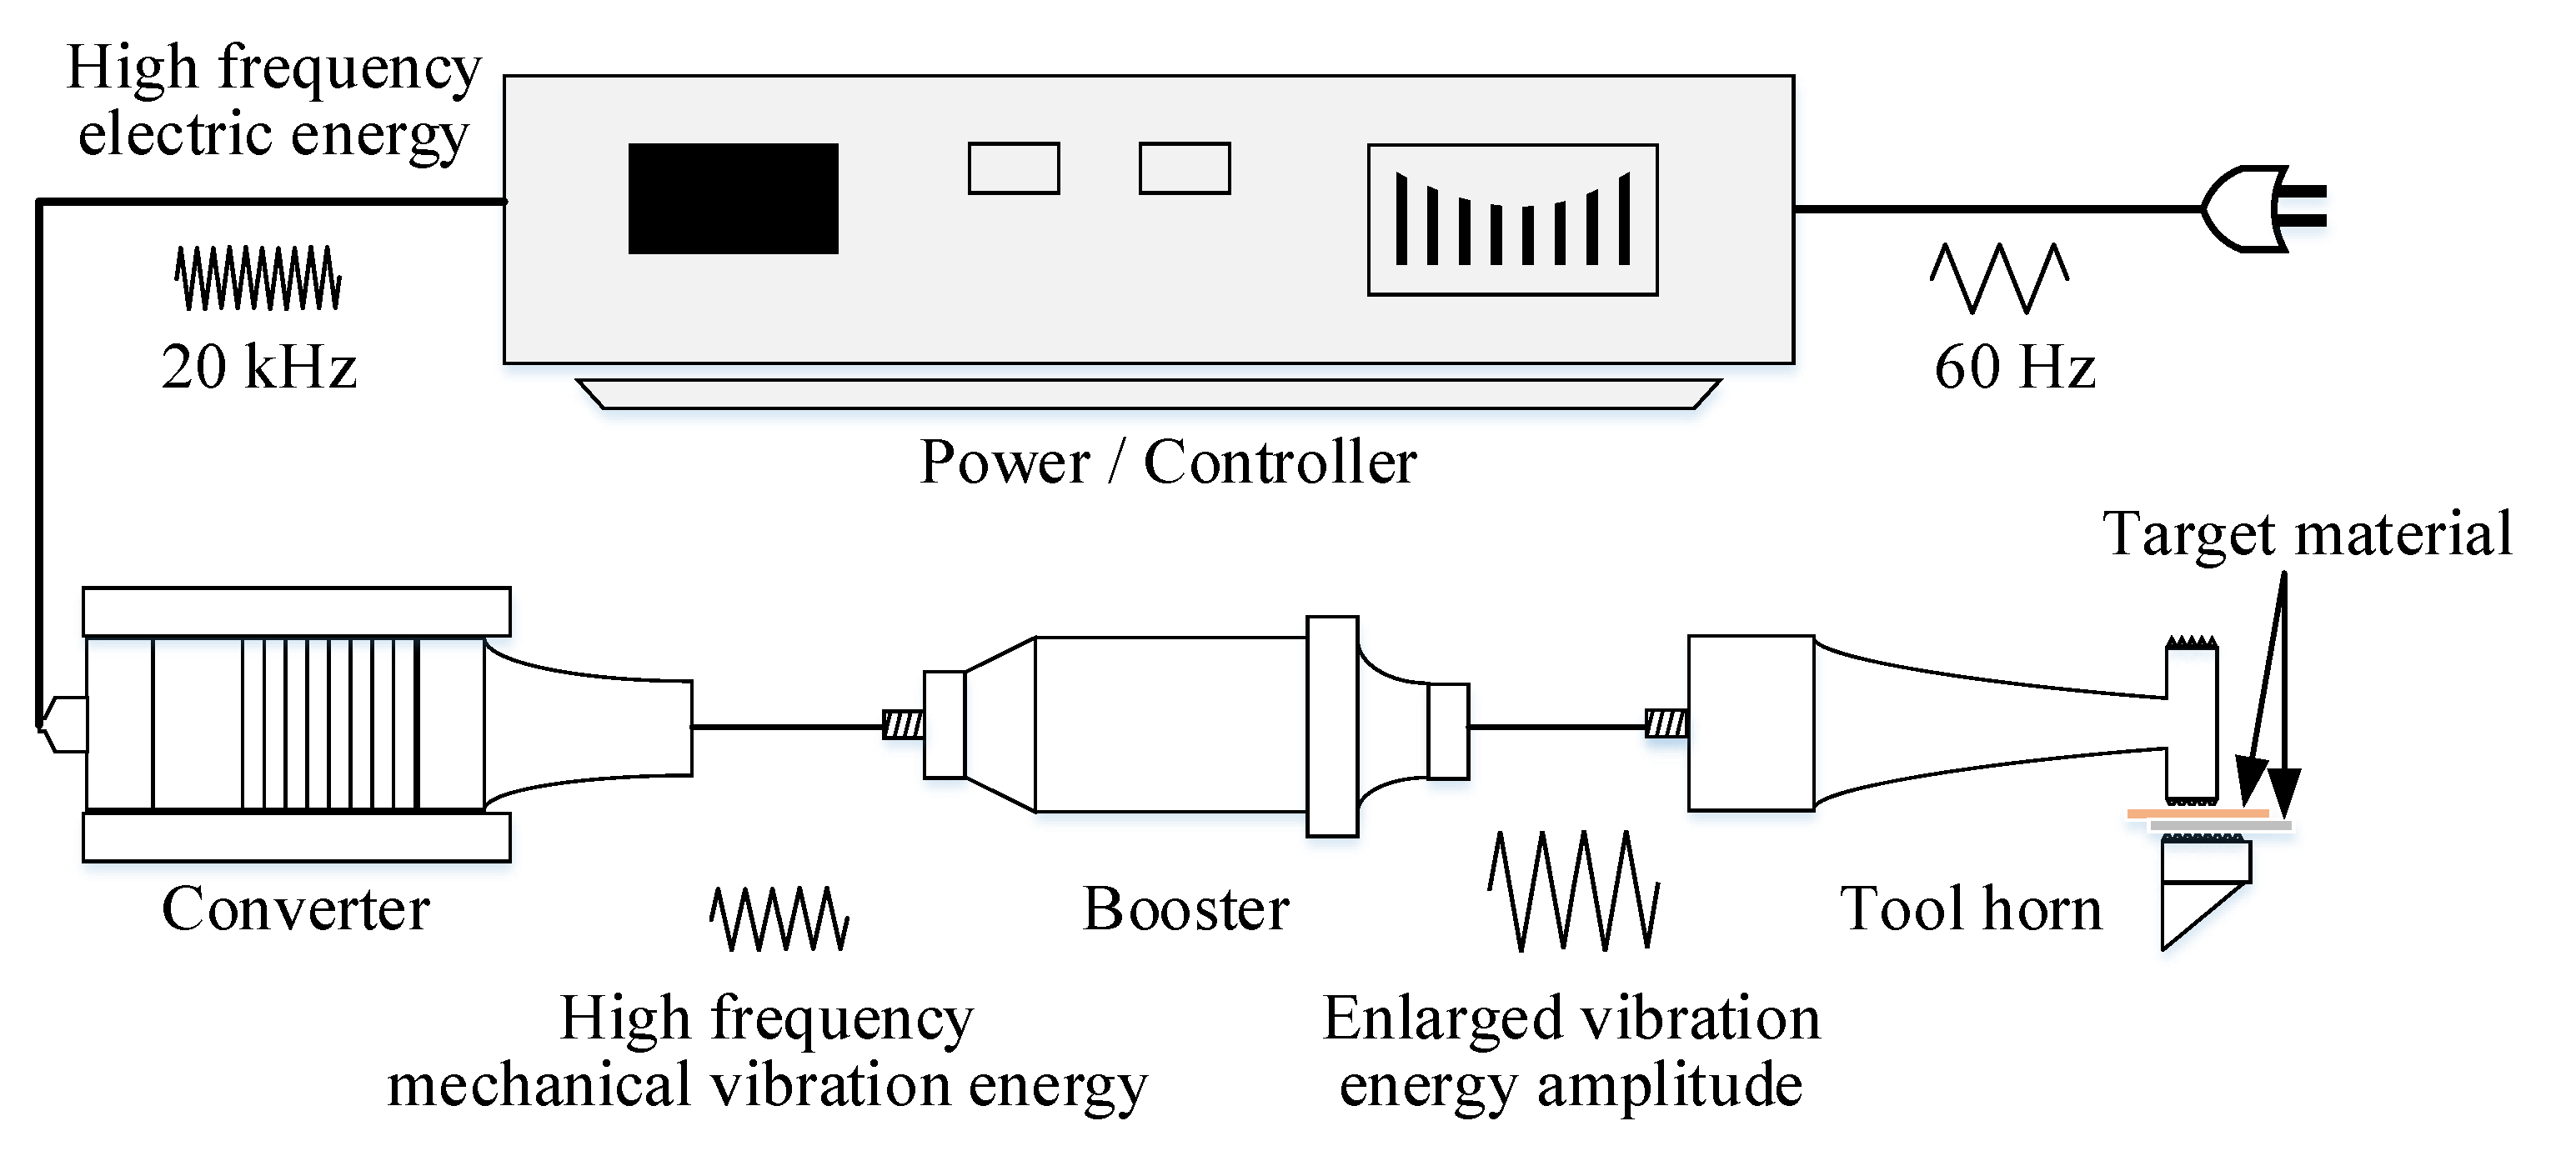
:1. Introduction
2. Experimental Procedure
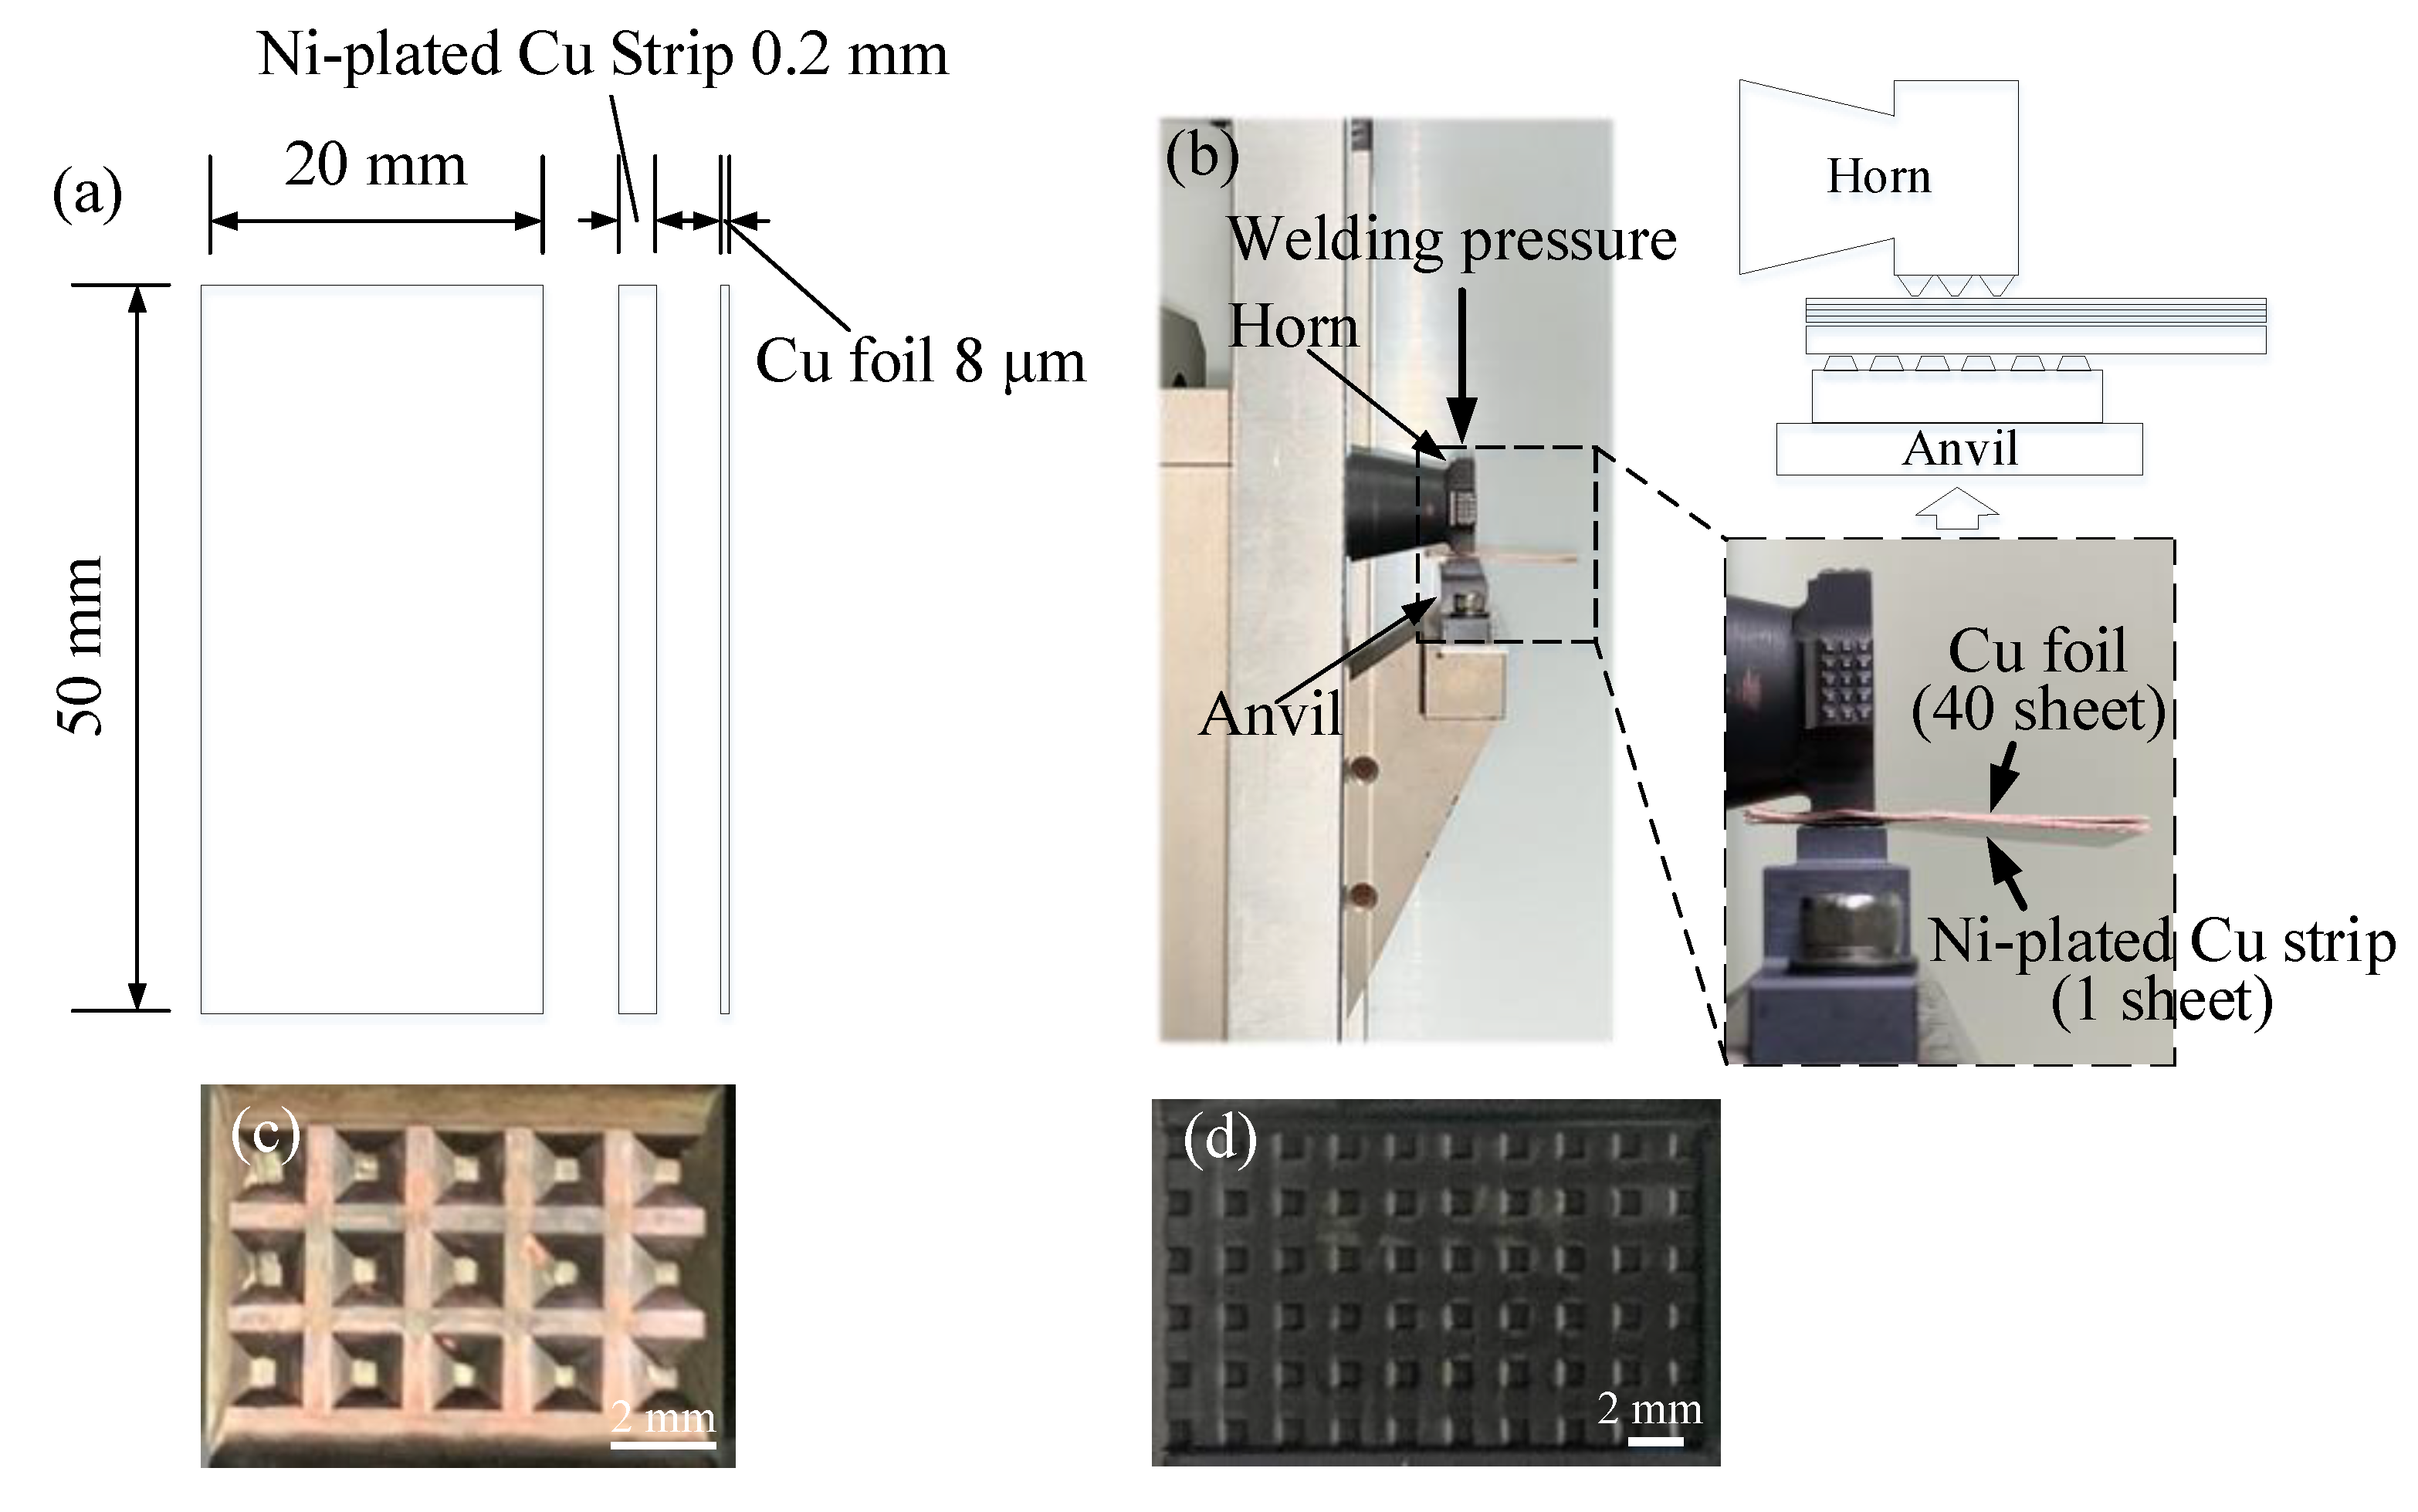
2.1. Materials and Experimental Methods
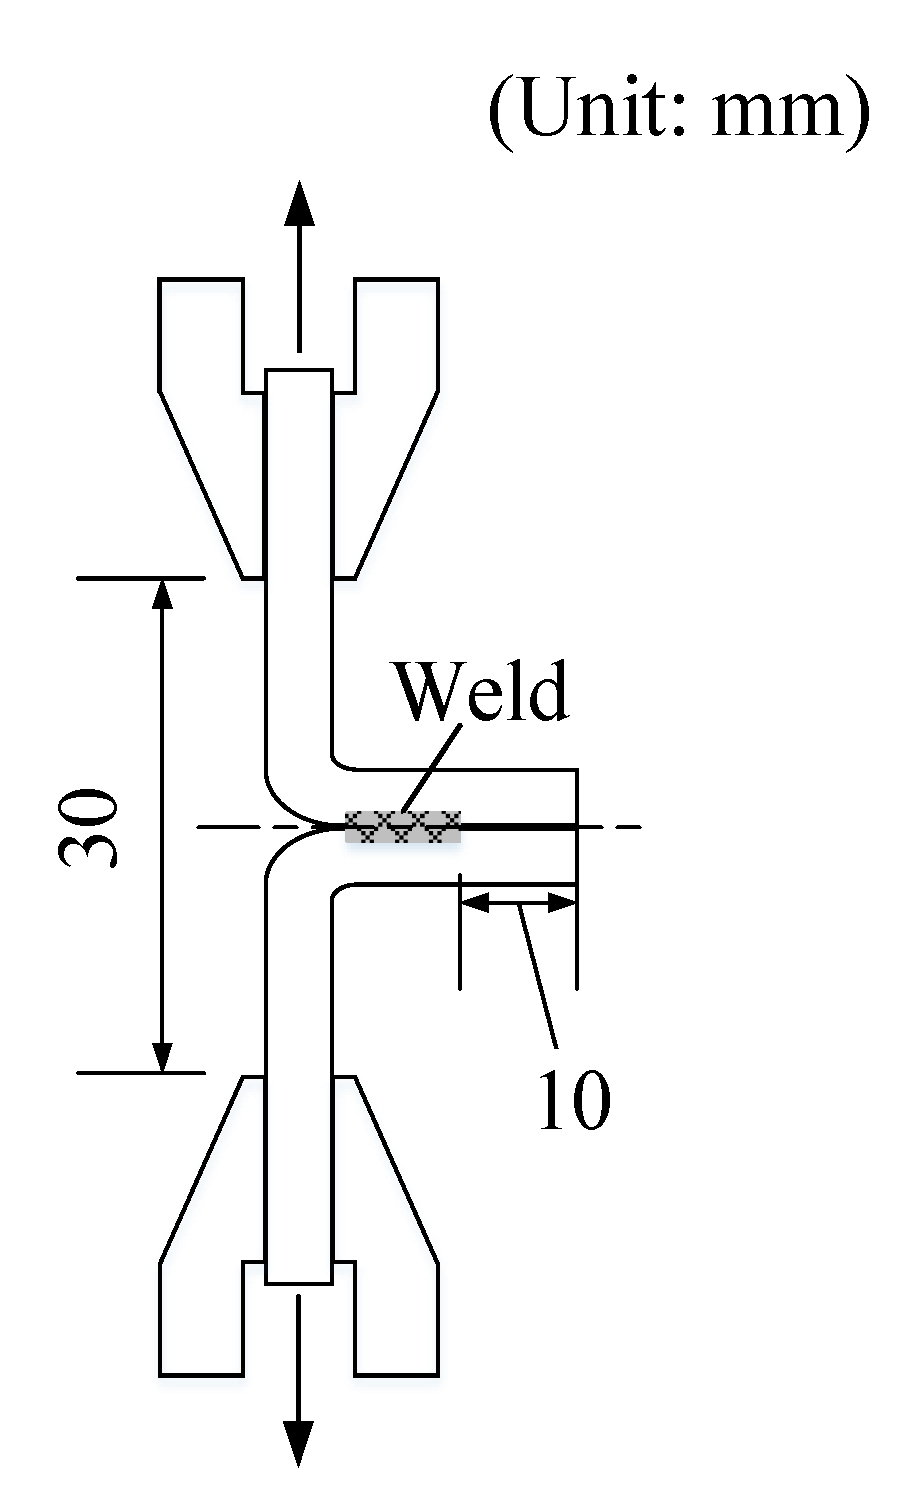
2.2. Weldability Evaluation
3. Results and Discussion
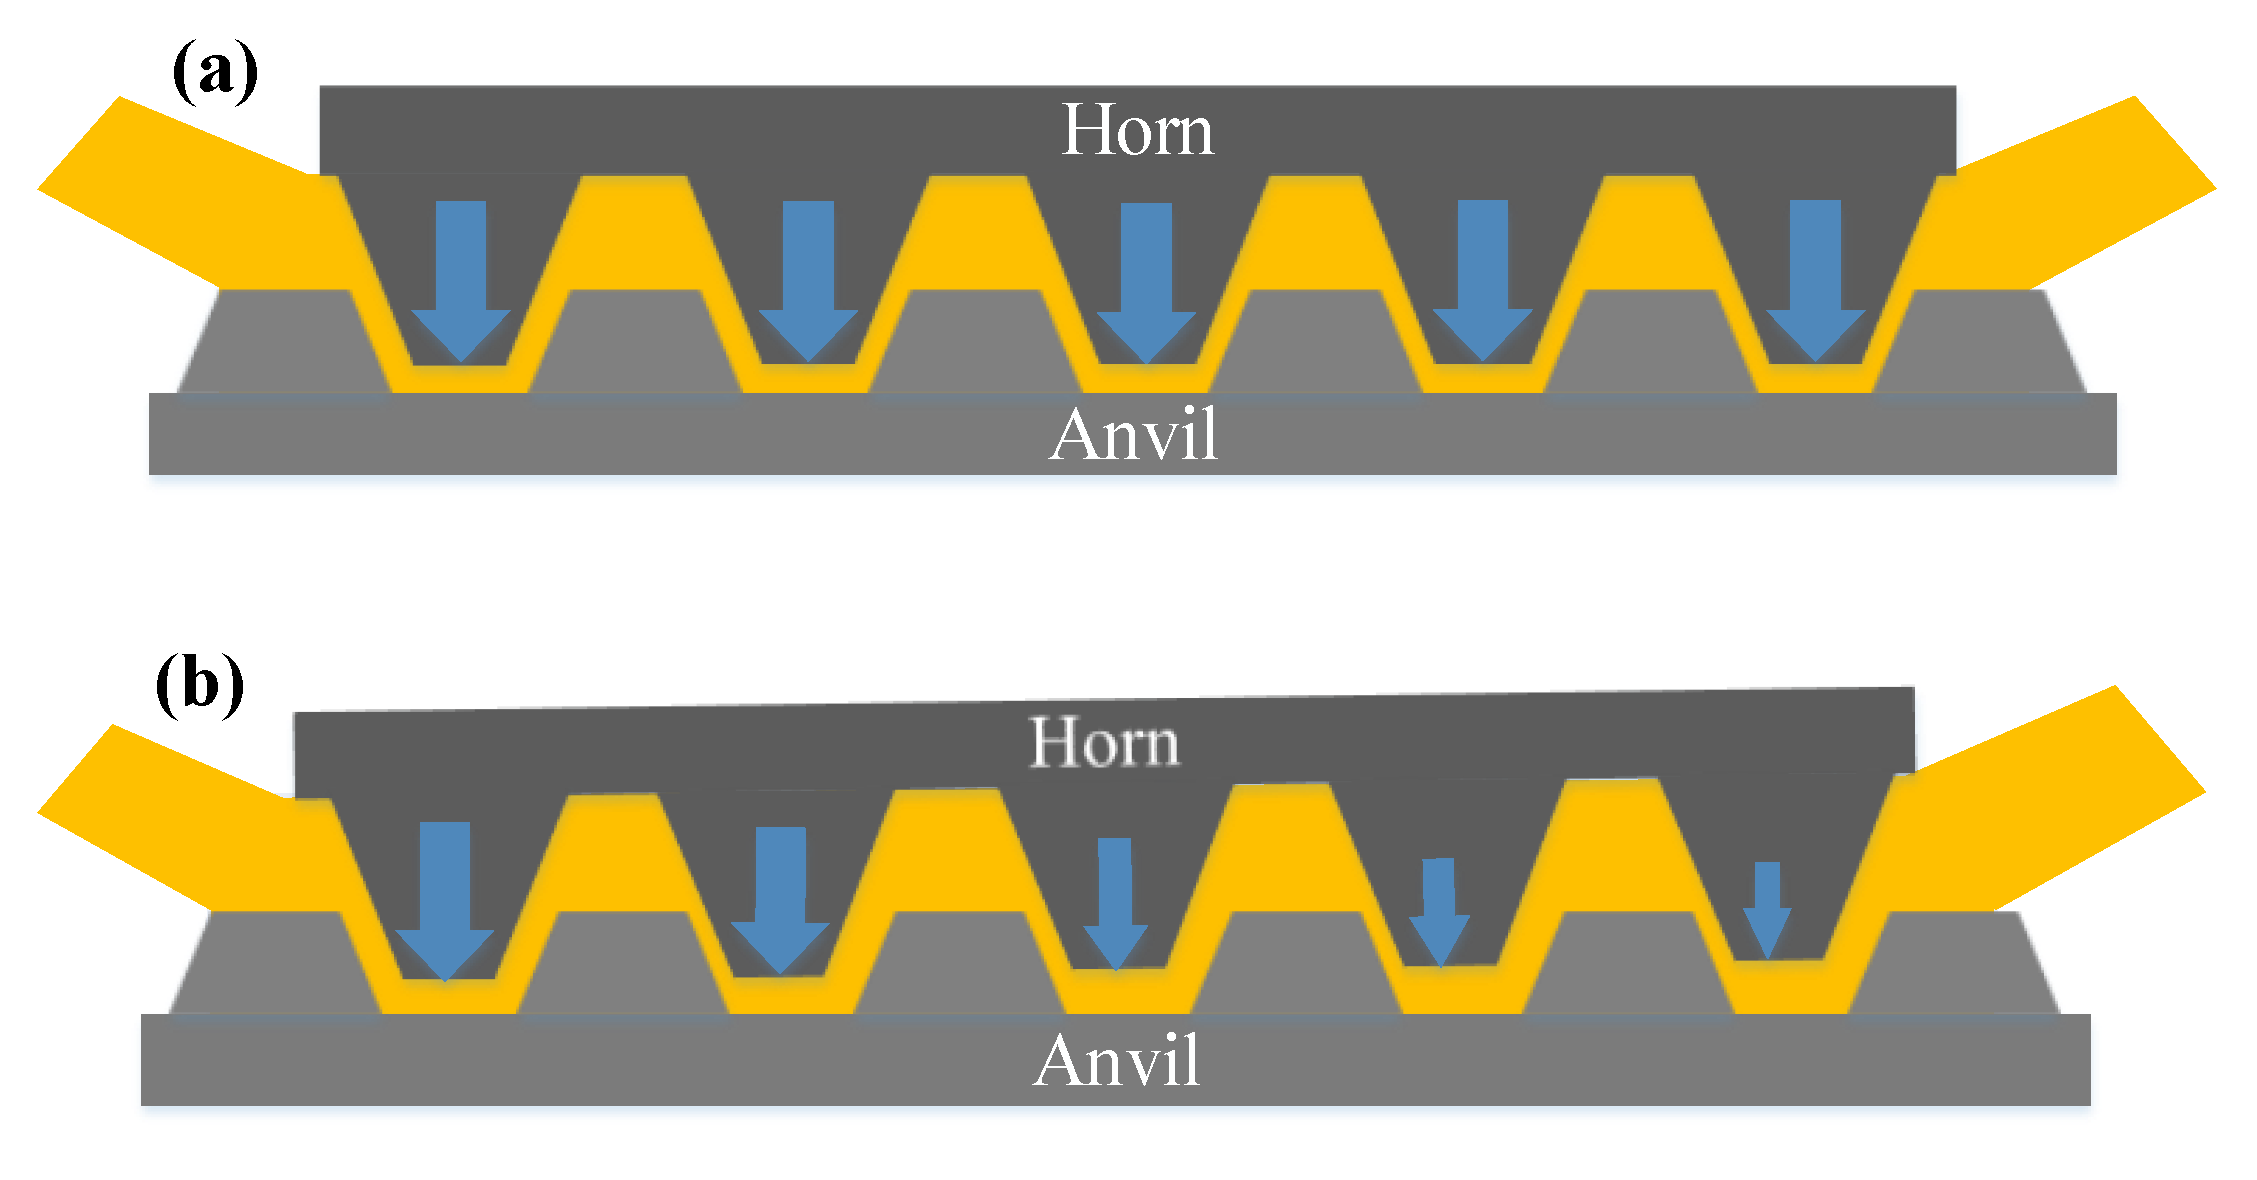
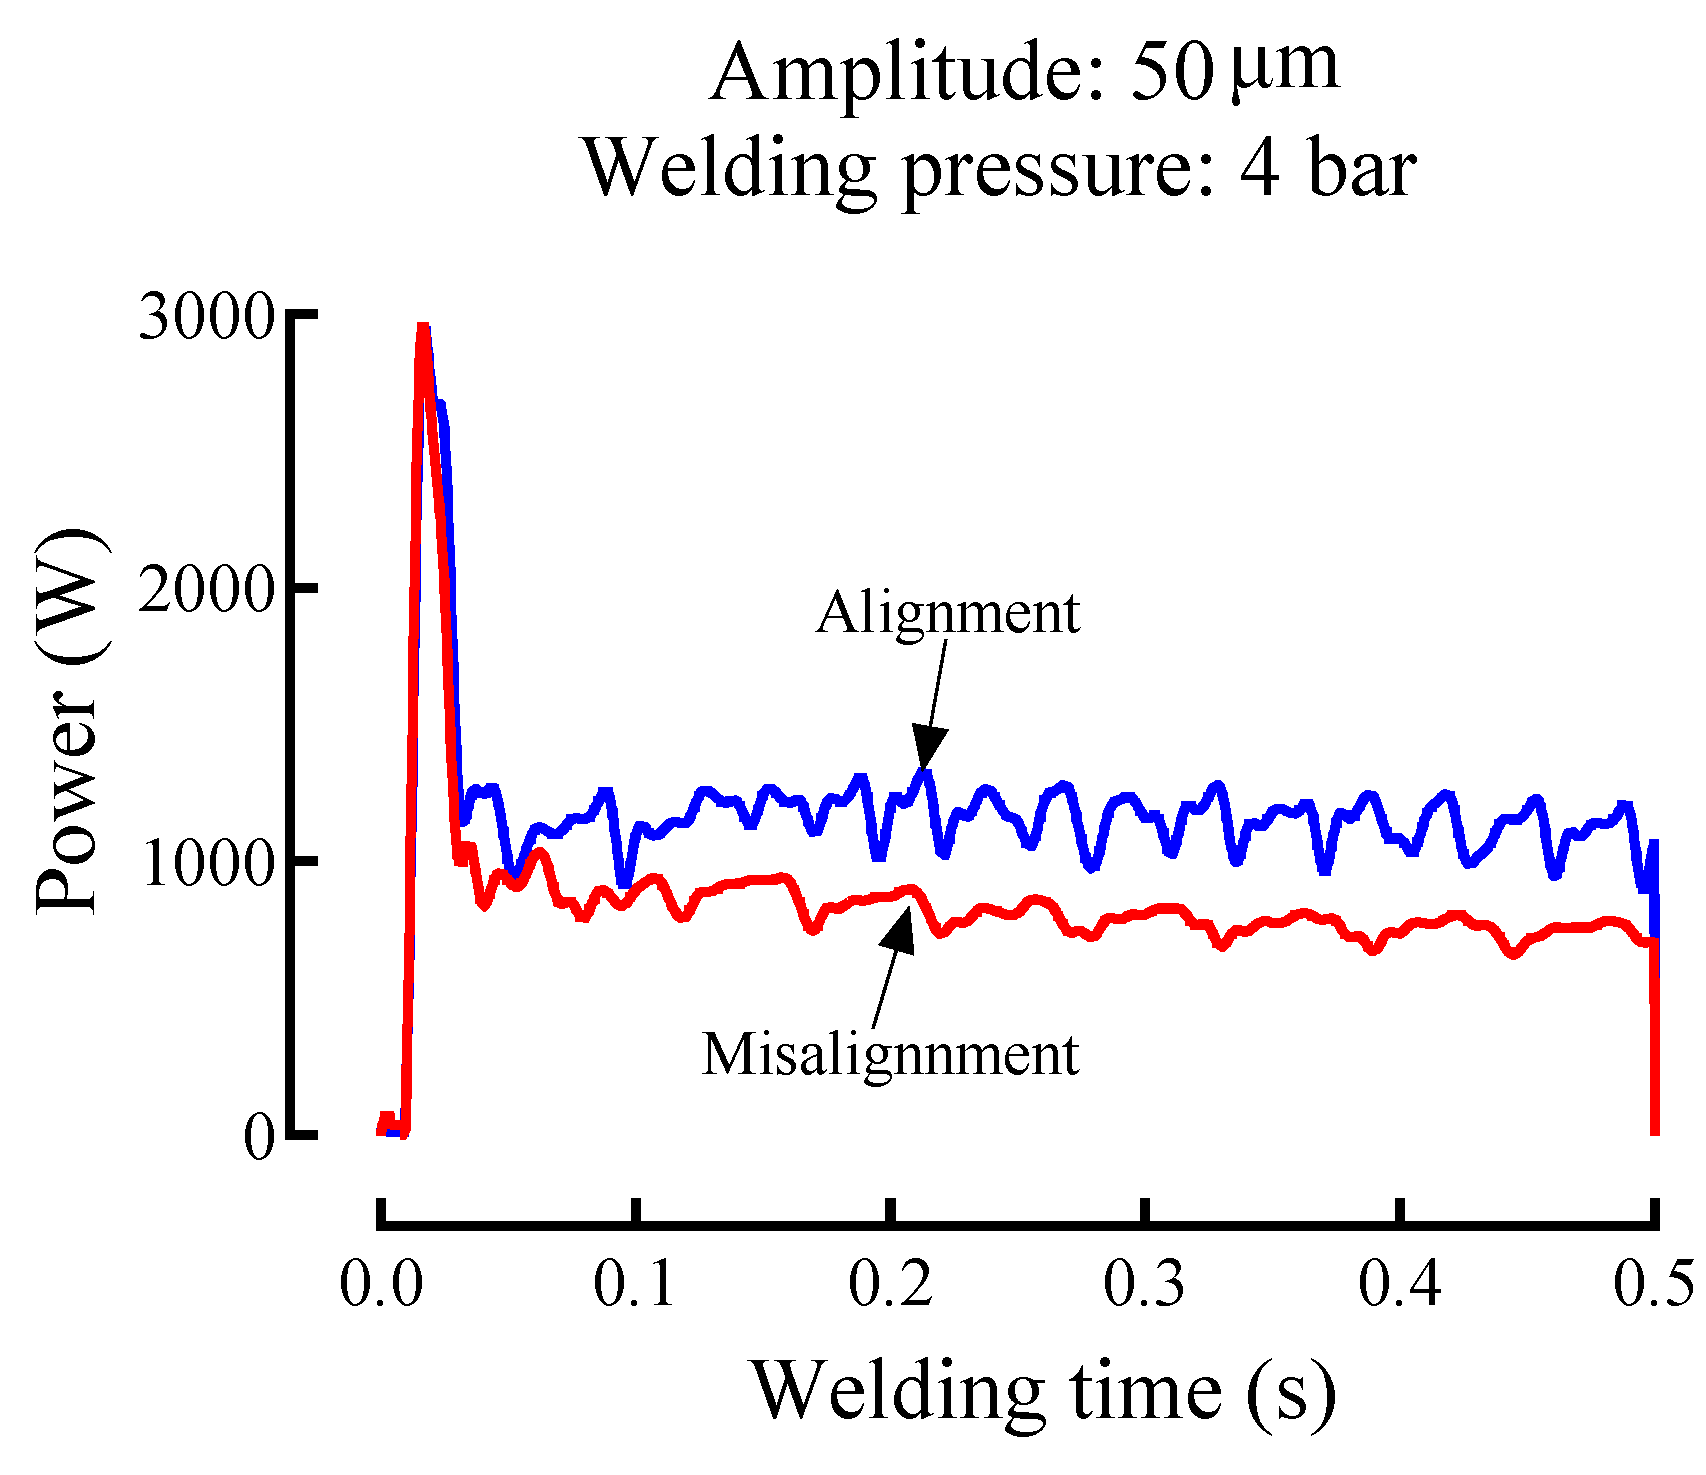
3.1. Alignment Effect
3.2. Weldability Evaluation
3.3. Cross-Section Analysis
4. Conclusions
- (1)
- In the UMW, it was proved that the horn alignment setup condition affects the weldability by performing comparative experiments. A sound weld can be ensured due to a high welding energy even under the same conditions by forming a higher weld area where the knurl of the horn is engaged with the anvil in the horn-aligned setup when compared to the case of misalignment.
- (2)
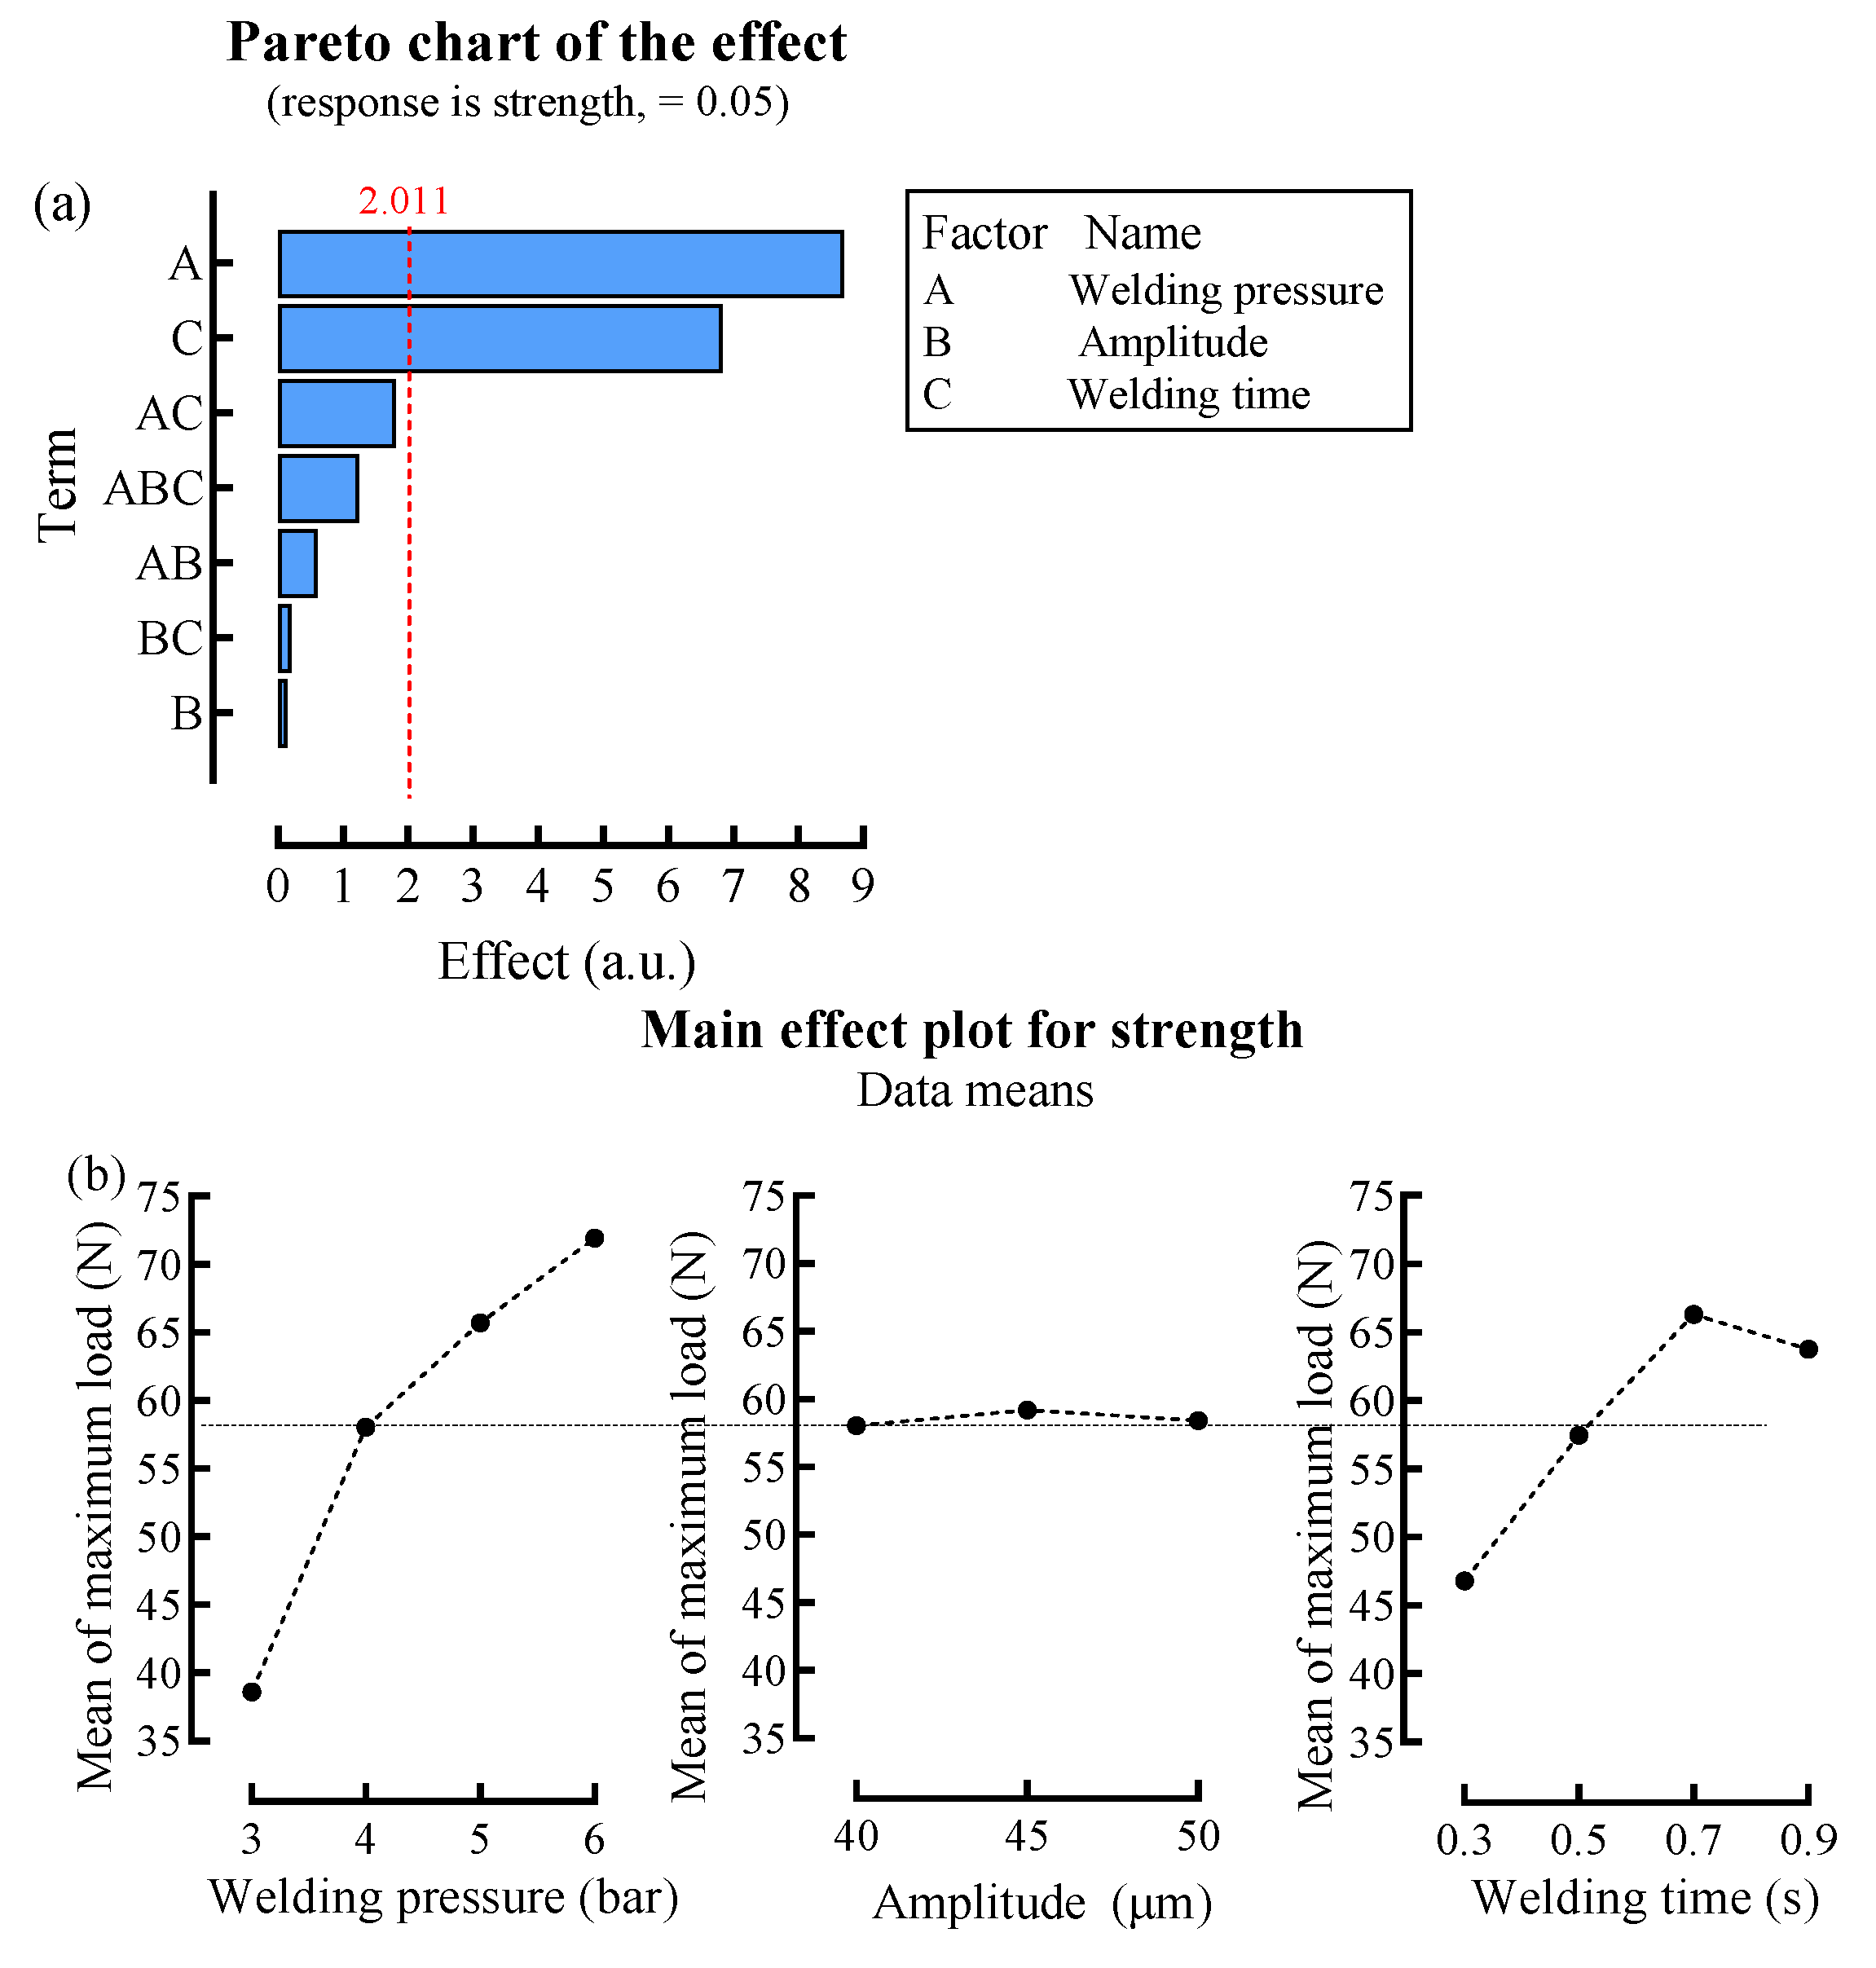
- The experiment was conducted based on the designed experimental method, and the weldability was analyzed using statistical techniques. Based on the analysis of the Pareto chart and main effect, it was confirmed that the amplitude factor was almost unrelated to the average strength, and that the welding pressure and welding time factor correspond to the average strength.
- (3)
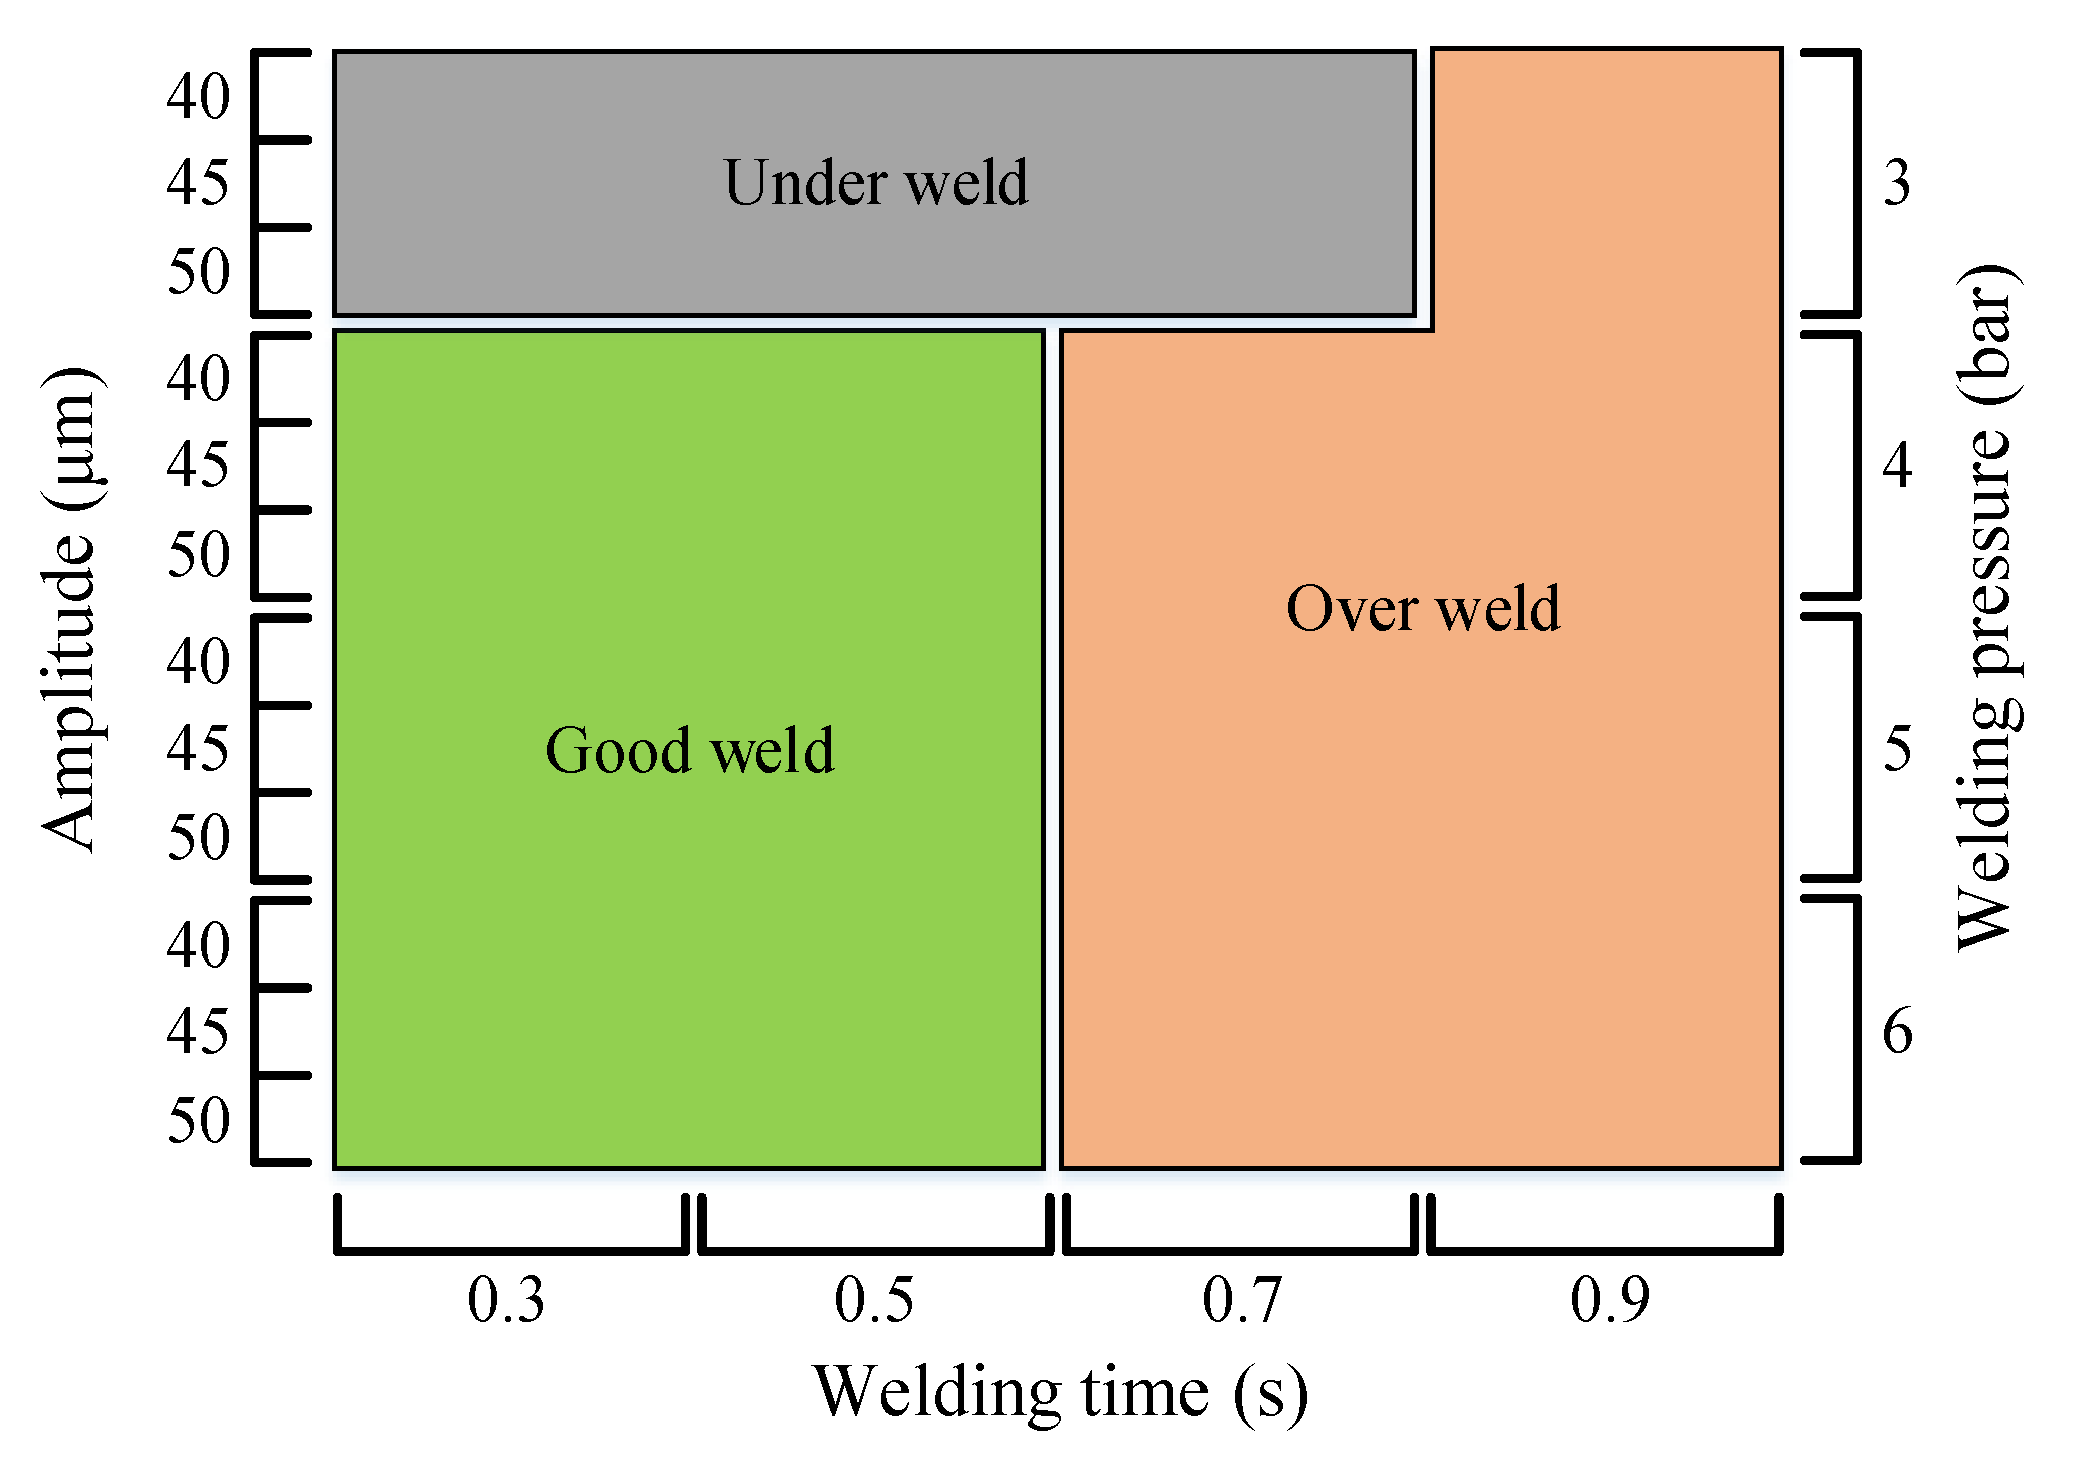
- The welding lobe area was derived according to the weldability evaluation standards. Consequently, sound weldability was ensured in the region of welding conditions with a welding pressure of 3 bars or higher and a welding time of 0.5 s or lesser in the used material combination.
- (4)
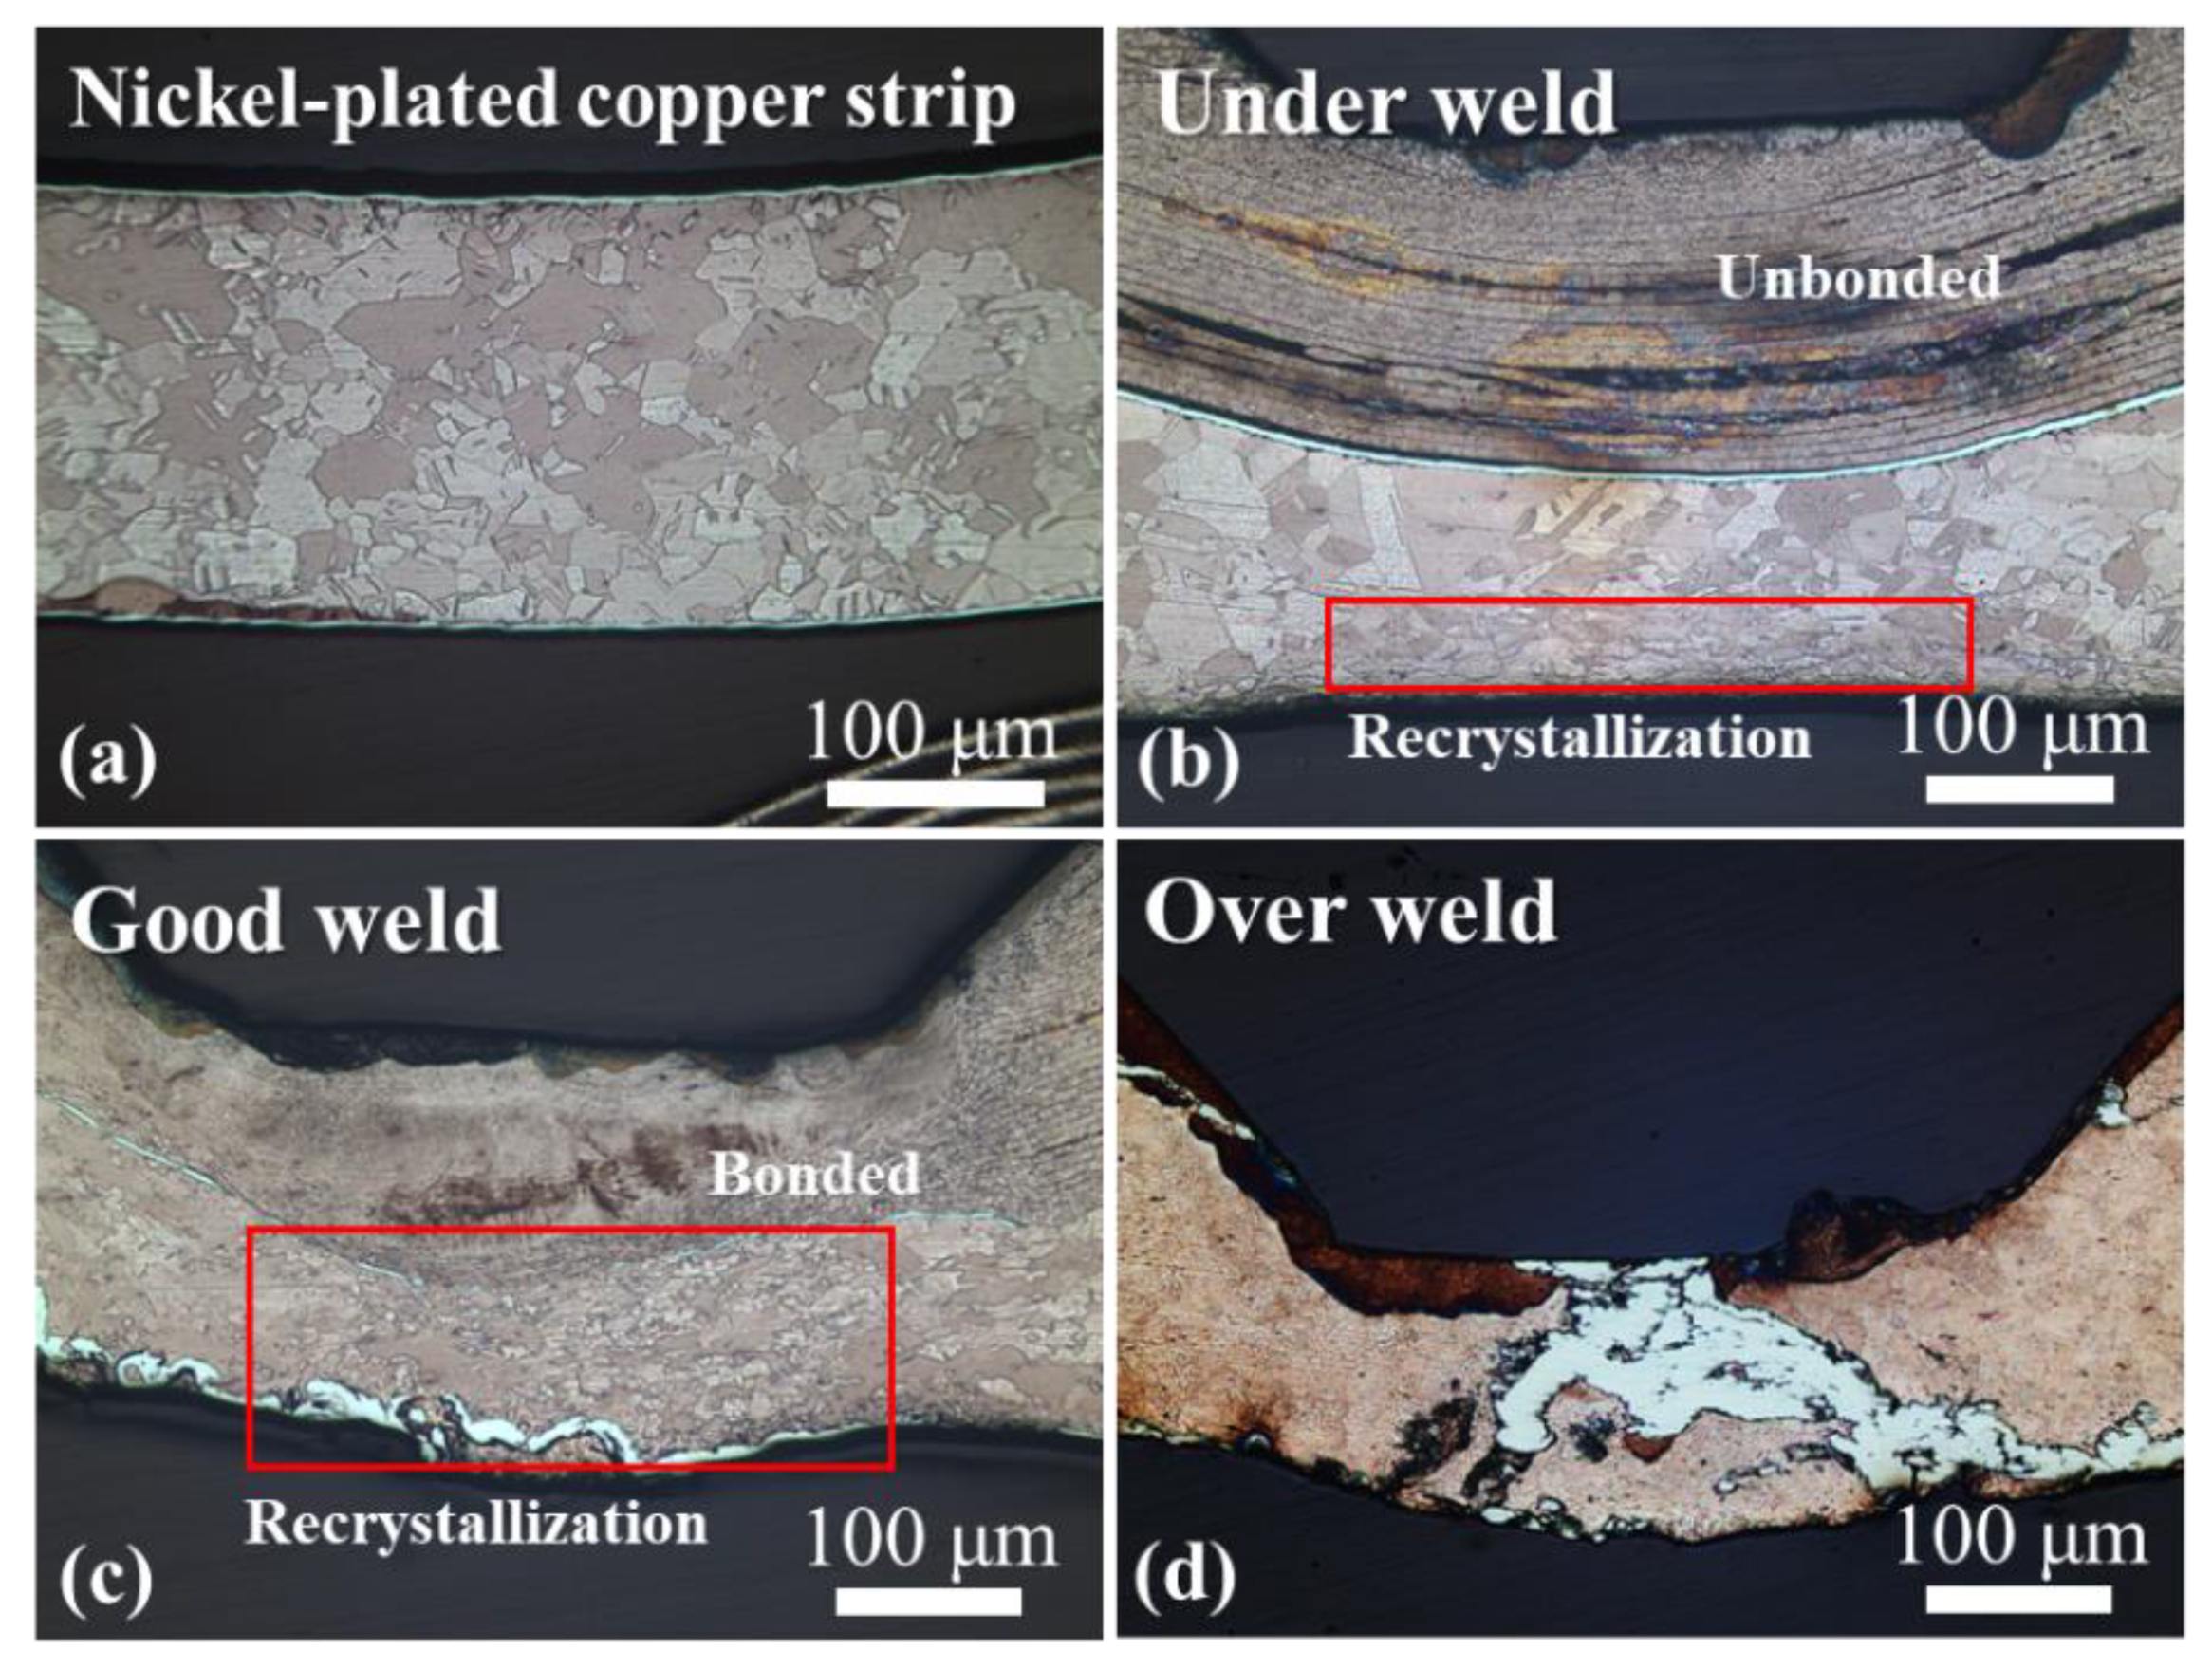
- The cross-sectional images corresponding to the weld quality and the behavior of the Ni layer and microstructure were analyzed using FE-SEM. Consequently, it was observed that no metallurgical bond was formed in the under weld due to unbonded region in the weld where the knurl was pressed. The deformation and movement of the Ni layer were observed in the over weld because of the thinning that occurs due to the excessive flow of energy into the weld where the knurl was pressed.
- (5)
- This study is a basic analysis of the welding of battery cell materials of multilayered foils. The obtained research results can be effectively utilized in the welding production of high-density battery cells and the development of UMW welding quality monitoring technology. The future scope of the study include the conduction of research on the development of monitoring technology for the UMW process of high-density battery cells.
Author Contributions
Funding
Institutional Review Board Statement
Informed Consent Statement
Data Availability Statement
Conflicts of Interest
References
- Chu, S.; Majumdar, A. Opportunities and challenges for a sustainable energy future. Nature 2012, 488, 294–303. [Google Scholar] [CrossRef] [PubMed]
- Lee, S.; Kim, T.; Jack, H.; Wayne, W.; Jeffrey, A. Joining Technologies for Automotive Lithium-Ion Battery Manufacturing: A Review. ASME Conf. Proc. 2010, 1, 541–549. [Google Scholar] [CrossRef]
- Das, A.; Li, D.; Williams, D.; Greenwood, D. Joining Technologies for Automotive Battery Systems Manufacturing. World Electr. Veh. J. 2018, 9, 22. [Google Scholar] [CrossRef] [Green Version]
- Zhou, Y.; Gorman, P.; Tan, W.; Ely, K.J. Weldability of thin sheet metals during small-scale resistance spot welding using an alternating-current power supply. J. Electron. Mater. 2000, 29, 1090–1099. [Google Scholar] [CrossRef]
- Lee, S.J.; Nakamura, H.; Kawahito, Y.; Katayama, S. Effect of welding speed on microstructural and mechanical properties of laser lap weld joints in dissimilar Al and Cu sheets. Sci. Technol. Weld. Join. 2013, 19, 111–118. [Google Scholar] [CrossRef]
- Biro, E.; Weckman, D.C.; Zhou, Y. Pulsed Nd:YAG laser welding of copper using oxygenated assist gases. Met. Mater. Trans. A 2002, 33, 2019–2030. [Google Scholar] [CrossRef]
- Das, A.; Li, D.; Williams, D.; Greenwood, D. Weldability and shear strength feasibility study for automotive electric vehicle battery tab interconnects. J. Braz. Soc. Mech. Sci. Eng. 2019, 41, 54. [Google Scholar] [CrossRef] [Green Version]
- Kim, T.; Yum, J.; Hu, S.; Spicer, J.; Abell, J. Process robustness of single lap ultrasonic welding of thin, dissimilar materials. CIRP Ann. 2011, 60, 17–20. [Google Scholar] [CrossRef]
- Zhang, W.; Ao, S.; Oliveira, J.; Li, C.; Zeng, Z.; Wang, A.; Luo, Z. On the metallurgical joining mechanism during ultrasonic spot welding of NiTi using a Cu interlayer. Scr. Mater. 2020, 178, 414–417. [Google Scholar] [CrossRef]
- Zhang, W.; Ao, S.S.; Oliveira, J.P.; Zeng, Z.; Luo, Z.; Hao, Z.Z. Effect of ultrasonic spot welding on the mechanical behaviour of NiTi shape memory alloys. Smart Mater. Struct. 2018, 27, 085020. [Google Scholar] [CrossRef]
- Ying, L.; Haseung, C.; Wayne, C.; Teresa, R.; Jack, H.; Elijah, K.; Abell, J. Joint Formation in Multilayered Ultrasonic Welding of Ni-Coated Cu and the Effect of Preheating. J. Manuf. Sci. Eng. 2018, 140, 111003. [Google Scholar] [CrossRef]
- Elangovan, S.; Prakasan, K.; Jaiganesh, V. Optimization of ultrasonic welding parameters for copper to copper joints using design of experiments. Int. J. Adv. Manuf. Technol. 2010, 51, 163–171. [Google Scholar] [CrossRef]
- Yang, J.; Cao, B.; Lu, Q. The Effect of Welding Energy on the Microstructural and Mechanical Properties of Ultrasonic-Welded Copper Joints. Materials 2017, 10, 193. [Google Scholar] [CrossRef] [PubMed] [Green Version]
- Arimoto, K.; Sasaki, T.; Doi, Y.; Kim, T. Ultrasonic Bonding of Multi-Layered Foil Using a Cylindrical Surface Tool. Metals 2019, 9, 505. [Google Scholar] [CrossRef] [Green Version]
- Zhanzhan, S.; Zhengqiang, Z.; Yifu, Z.; Hua, Z.; Qiankun, X. Recrystallization Behavior of a Pure Cu Connection Interface with Ultrasonic Welding. Metals 2021, 11, 61. [Google Scholar] [CrossRef]
- Das, A.; Masters, I.; Williams, D. Process robustness and strength analysis of multi-layered dissimilar joints using ultrasonic metal welding. Int. J. Adv. Manuf. Technol. 2018, 101, 881–900. [Google Scholar] [CrossRef] [Green Version]
- Das, A.; Barai, A.; Masters, I.; Williams, D. Comparison of Tab-To-Busbar Ultrasonic Joints for Electric Vehicle Li-Ion Battery Applications. World Electr. Veh. J. 2019, 10, 55. [Google Scholar] [CrossRef] [Green Version]
- Das, A.; Ashwin, T.; Barai, A. Modelling and characterisation of ultrasonic joints for Li-ion batteries to evaluate the impact on electrical resistance and temperature raise. J. Energy Storage 2019, 22, 239–248. [Google Scholar] [CrossRef] [Green Version]
- Lee, S.S.; Kim, T.H.; Hu, S.J.; Cai, W.W.; Abell, J.A. Joining technologies for automotive lithium-ion battery manufacturing: A review. In Proceedings of the International Manufacturing Science and Engineering Conference, Erie, PA, USA, 12–15 October 2010; pp. 541–549. [Google Scholar]


| Variables | Levels |
|---|---|
| Welding pressure (bar) | 3, 4, 5, 6 |
| Peak-to-peak amplitude (μm) | 40, 45, 50 |
| Welding time (s) | 0.3, 0.5, 0.7, 0.9 |
| Weld Quality | Under Weld | Good Weld | Over Weld |
|---|---|---|---|
| Maximum T-peel load | <40 N | >40 N | N/A |
| Discoloration (Foil) | x | x | o |
| Weld appearance |  |  |  |
| Misalignment | Alignment | |||
|---|---|---|---|---|
| Horn-Foil | Anvil-Tap | Horn-Foil | Anvil-Tap | |
| Weld Appearance |  |  |  |  |
| Cross-section |  |  | ||
| Fracture Surface | |||||
|---|---|---|---|---|---|
| Amplitude (μm) | Welding Pressure (bar) | Welding Time (s) | |||
| Misalignment | Alignment | ||||
| 0.5 | 0.7 | 0.5 | 0.7 | ||
| 50 | 4 |  |  |  |  |
| 5 |  |  |  |  | |
| Weld Quality | Weld Cross-Section | Maximum Load (N) |
|---|---|---|
| Under weld |  | 26.7 |
| Good weld |  | 60.0 |
| Over weld |  | 31.8 |
| Weld Quality | Image | Cu | Ni |
|---|---|---|---|
| Under weld |  |  |  |
| Good weld |  |  |  |
| Over weld |  |  |  |
Publisher’s Note: MDPI stays neutral with regard to jurisdictional claims in published maps and institutional affiliations. |
© 2021 by the authors. Licensee MDPI, Basel, Switzerland. This article is an open access article distributed under the terms and conditions of the Creative Commons Attribution (CC BY) license (https://creativecommons.org/licenses/by/4.0/).
Share and Cite
Shin, S.; Nam, S.; Yu, J.; Park, J.; Kim, D. Ultrasonic Metal Welding of Multilayered Copper Foils to Nickel-Plated Copper Sheet in Lithium-Ion Battery Cell. Metals 2021, 11, 1195. https://doi.org/10.3390/met11081195
Shin S, Nam S, Yu J, Park J, Kim D. Ultrasonic Metal Welding of Multilayered Copper Foils to Nickel-Plated Copper Sheet in Lithium-Ion Battery Cell. Metals. 2021; 11(8):1195. https://doi.org/10.3390/met11081195
Chicago/Turabian StyleShin, Seungmin, Sangwoo Nam, Jiyoung Yu, Jiyong Park, and Dongcheol Kim. 2021. "Ultrasonic Metal Welding of Multilayered Copper Foils to Nickel-Plated Copper Sheet in Lithium-Ion Battery Cell" Metals 11, no. 8: 1195. https://doi.org/10.3390/met11081195