Article

A Unified Adjustment Model for Gaussian Pulse Welding on Aluminum Alloys

1
College of Robotics, The Open University of Guangdong, Guangzhou 510091, China
2
College of Electromechanical Engineering, Guangdong Polytechnic Normal University, Guangzhou 510635, China
3
School of Mechanical and Automotive Engineering, South China University of Technology, Guangzhou 510641, China
*
Author to whom correspondence should be addressed.
Metals 2021, 11(4), 671; https://doi.org/10.3390/met11040671
Submission received: 6 April 2021 / Revised: 17 April 2021 / Accepted: 18 April 2021 / Published: 20 April 2021
(This article belongs to the Special Issue Advanced Welding Technology in Metals II)

Abstract

:
To solve the challenge of welding aluminum alloys, a unified adjustment model for Gaussian pulse welding is established. This model can achieve improved welding performance by adjusting the base current of the weak pulse group within a specific range of average welding current inputs. The flat overlaying welding is carried out on the base material: 6061 aluminum alloys with thicknesses of 2 mm, 3 mm, and 5 mm. A stable welding process, indicated by reduced spatter, is produced, with a soft arc sound and good repeatability in the waveforms of the real-time current and voltage. The weld has a shiny surface and regular fish scale ripples. Metallographic analysis shows that the fusion line is clear, and there are no visible defects, while the weld zone has fine dendritic structures. The tensile test results indicate that fractures occur in the heat-affected zone, and that the tensile strength reaches about 68% of that of the base metal.

1. Introduction

Aluminum alloys are low-density, lightweight, have high recyclability, and are composed of one of Earth’s most abundant natural resources. Aluminum alloys can attain good casting performance, processing plasticity, and mechanical strength by the addition of certain alloying elements. At present, they are increasingly used in navigation and shipbuilding, rail technology, aeronautics, aerospace, and other industries. However, the difficulty of welding aluminum alloys is a significant obstacle, restricting their wider application. The surface of an aluminum alloy easily forms a protective oxide film. Hence, it is challenging to generate the arc—many hydrogen pores form, and are difficult to eliminate in the molten pool, affecting the weld’s physical properties. Therefore, often only the most experienced welding experts can efficiently complete welds with a highly valued fish scale appearance and excellent performance [1,2,3,4,5].
In recent years, the aluminum alloy welding technology and process have been greatly developed, and researchers have proposed a variety of new processes to improve the effect of weld formation [6,7,8]. The authors of [9] examined the different forms of droplet transfer during the MIG welding of aluminum alloys. It is believed that “one pulse, one drop” is the most suitable form of droplet transfer for the welding of aluminum alloys. Ripples can reflect the quality of the welding process. Five key operational parameters were chosen to study their effects on the formation and the characteristics of ripples [10]. The profile map of weld beads and their formation mechanism in gas metal arc welding was investigated in order to explore the role played by the bottom wall in determining the flow pattern and the resultant bead profile [11].
The Gaussian pulse welding method proposed by the authors of [12] used a concentrated energy input and had flexible control parameters, superior to the traditional double-pulse aluminum alloy welding process. Many researchers have used ultrasonic and laser-assisted aluminum alloy pulse welding, and found that these two methods can control the droplet transfer process, enhance the stability of the welding process, and refine the grain size of the weld [13,14]. The current waveform [15] and the number of pulses [16] during the welding process affect the weld-forming effect, while the use of different pulse currents can refine the grain structure of the weld [17]. The authors of [18] conducted welding experiments on 6061 aluminum alloy using two filler metals under different heat treatment conditions, and found that heat treatment and the composition of the welding wire had a great impact on the physical properties of the weld. The authors of [19] provided a study of the mechanical properties and microstructure of a friction-welded coupe composed of a weight heavy alloy mixed with an aluminum alloy. An artificial neural network integrated with a genetic algorithm was used in a gas tungsten arc welding process [20]. Welding experiments with five optimal welding parameters are satisfactory. Laser beam oscillation welding, when applied to aluminum alloys, can decrease porosity problems significantly [21]. The authors of [22] presented a numerical framework of keyhole-induced porosity formation, as well as methods to suppress porosity in laser beam oscillation welding. Upon the use of oscillation during welding, porosity decreased, and was fully inhibited when using an infinite oscillating path with a frequency of 200 Hz.
The above researchers have conducted a lot of in-depth research on aluminum alloy welding methods and processes, and have achieved many results. However, there is little research on the unified adjustment of intelligent welding power sources, and a unified adjustment model can greatly reduce the proficiency requirements for welders of aluminum alloys.
The welding of aluminum alloys has stringent requirements on process parameters, since slight variations in pulse current size, duty cycle, voltage, and wire feeding speed can cause significant differences in weld generation. To reduce the difficulty of aluminum alloy welding, the Gaussian pulse welding method is used to establish a unified parameter adjustment model. In a specific range of average welding current inputs, this model can weld 6061 aluminum alloy plates of various thicknesses by adjusting the pulse’s base current. The welding process is stable, with reduced spatter and regular fish scale ripples.
The present study establishes a unified mathematical model of Gaussian pulse welding. Three sets of welding experiments were performed on 2 mm, 3 mm, and 5 mm 6061 aluminum alloy plates. The appearance of the welds, the current and voltage signals during the welding process, the tensile tests, and the metallographic analyses of the welds verified the validity of the model.

2. Material and Methodology

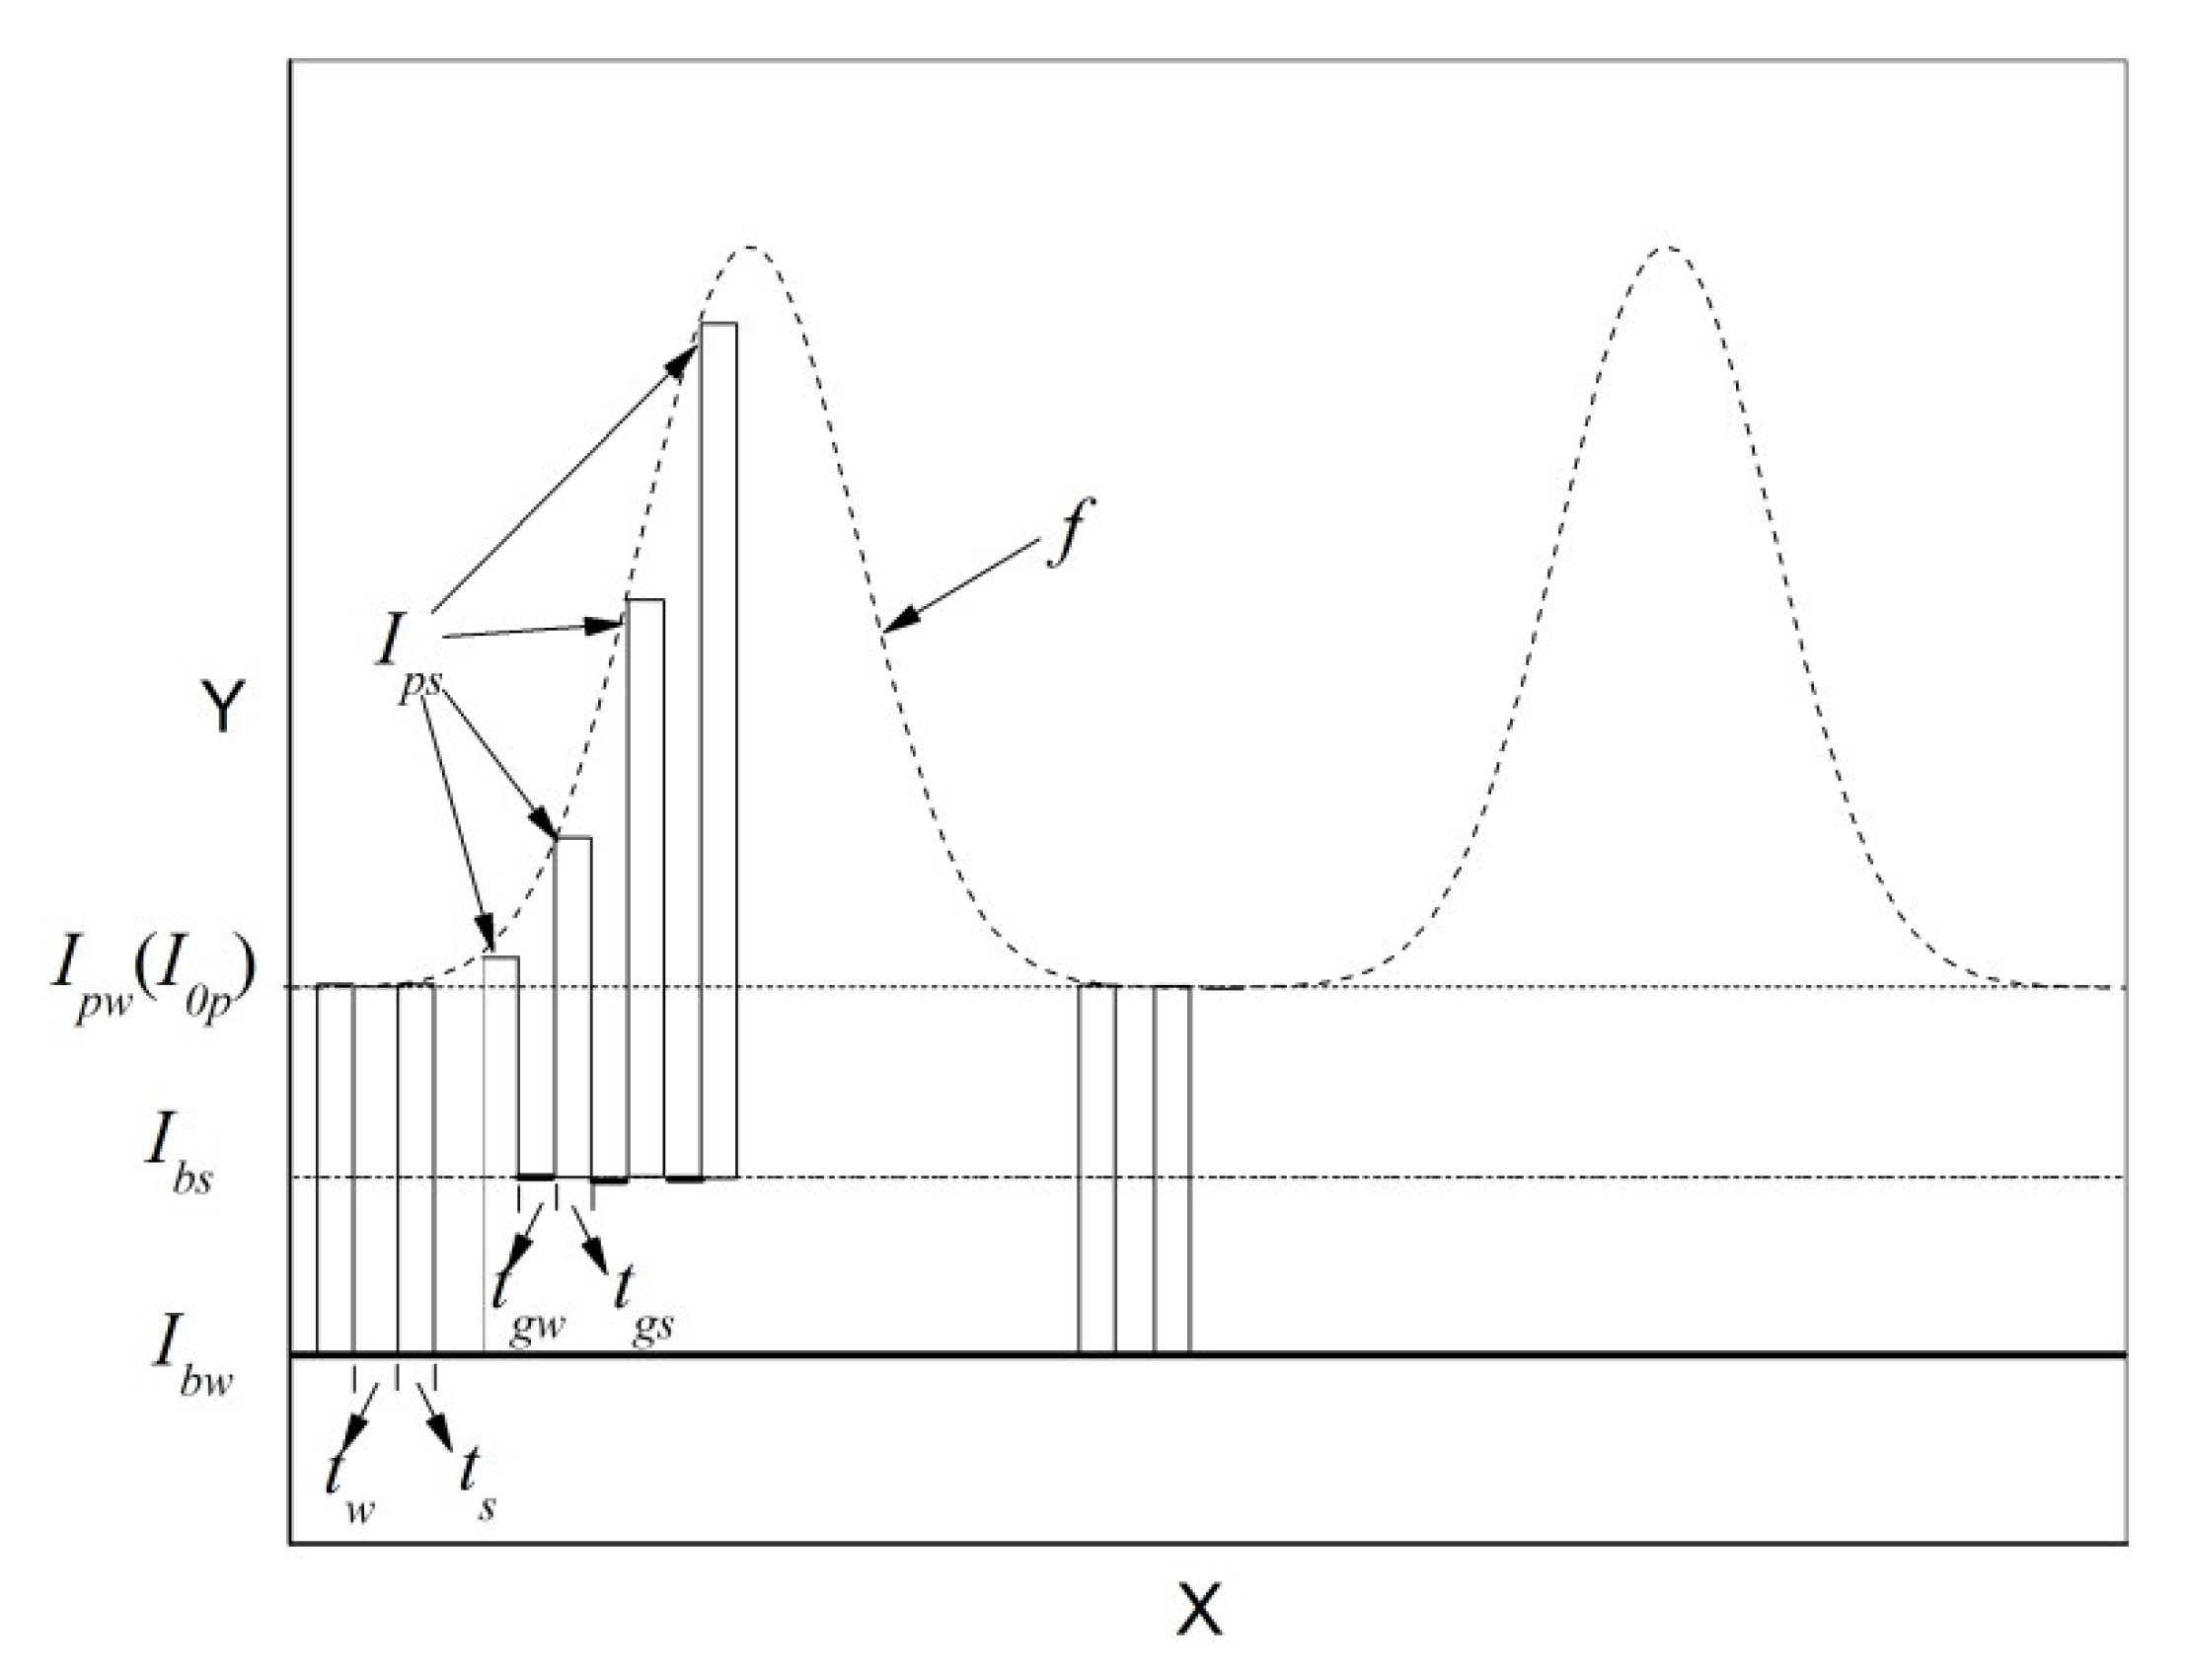
2.1. Gaussian Pulse Welding Method

Gaussian pulse welding is a new type of double-pulse welding method for aluminum alloy materials, as shown in Figure 1. This method uses the Gaussian function curve’s smooth characteristics to slowly increase and decrease the input energy of the pulse current during the strong pulse group stage, so that the heat input during the welding process presents regular variation, representing a Gaussian curve. Simultaneously, this method can utilize the alternating appearance of strong and weak pulse groups to achieve the rhythmic stirring of the molten pool, which is conducive to gas overflow. As a result, the weld formed has regular fish scale ripples, and can achieve good results in the welding test of aluminum alloy plates of various thicknesses [12].
As shown in Figure 1, function, f(x), represents a Gaussian function curve. To facilitate its application to the welding process, it can be simplified into Equation (1). Ips represents the peak current of the Gaussian pulse, and its magnitude is the summation of the peak initial current of the Gaussian pulse, Iop, and the Gaussian value. Ibs represents the strong Gaussian pulse group’s base current, Ipw represents the weak pulse group’s peak current, and Ibw represents the weak pulse group’s base current. tgs represents the time interval of the peak current of the strong Gaussian pulse group, tgw represents the time interval of the strong Gaussian pulse group’s base current, ts represents the time interval of the peak current of the weak pulse group, and tw represents the time interval of the base current of the weak pulse group.
f ( x ) = a e x 2
F ( x ) = + a e x 2 = a π
The area, F(x), of the region enclosed by the function’s curve and the x-axis can be obtained via the indefinite integration of the Gaussian function, as shown in Equation (2). It can be seen that the area enclosed by the Gaussian function curve is related to the parameter a. Once a is determined, the area enclosed by the curve is determined and the input current corresponding to the welding can be determined. Therefore, Gaussian pulse welding is a welding method with controllable input energy.

2.2. Unified Adjustment Model

It can be seen in Figure 1 that the magnitude of the Gaussian pulse’s peak current, Ips, changes with time. The variation conforms to the Gaussian curve, with the relationship expressed by Equation (3):
I p s = I o p + a e x 2
The average input current throughout the welding process is calculated using Equation (4), where Iavg represents the current size of the Gaussian pulse, ns represents the number of Gaussian pulses, a represents the peak value of the Gaussian curve, and nw represents the number of weak pulses. The welding process shows that when the values of ns and nw are appropriately selected, both the time interval of the strong and weak pulses and the current magnitudes are kept within a relatively wide range. The welding process is very stable, and weld generation is excellent. These characteristics provide the basis for establishing a unified adjustment model based on the base current of the weak Gaussian pulse groups.
In order to facilitate the setting of test parameters, assumptions such as Equations (5) and (6) are made, and they are substituted into Equation (4), providing Equation (7) to determine the average welding current.
After a large number of welding experiments, the number and time of strong and weak pulses in Equation (7) can be optimized and fixed within a specific average current range, with decent welding performance. In this way, Equation (7) can be simplified to Equation (8) within a specific average current range, where A and B are constants; thus, different average welding currents can be obtained by adjusting the parameter Ibw.
I avg = ( n s ( ( I o p + a π t g s / ( t g s + t g w ) ) t g s + I b s t g w ) + n w ( I o p t s + I b w t w ) ) / ( n s ( t g s + t g w ) + n w ( t s + t w ) )
t g s = t s
I b s = β I b w . . β [ 1 , 10 ]
I a v g = ( ( n s + n w ) t s I o p + a n s π t s 2 / ( t s + t g w ) + ( β n s t g w + n w t w ) I b w ) / ( n s ( t s + t g w ) + n w ( t s + t w ) )
I a v g = A + B I b w

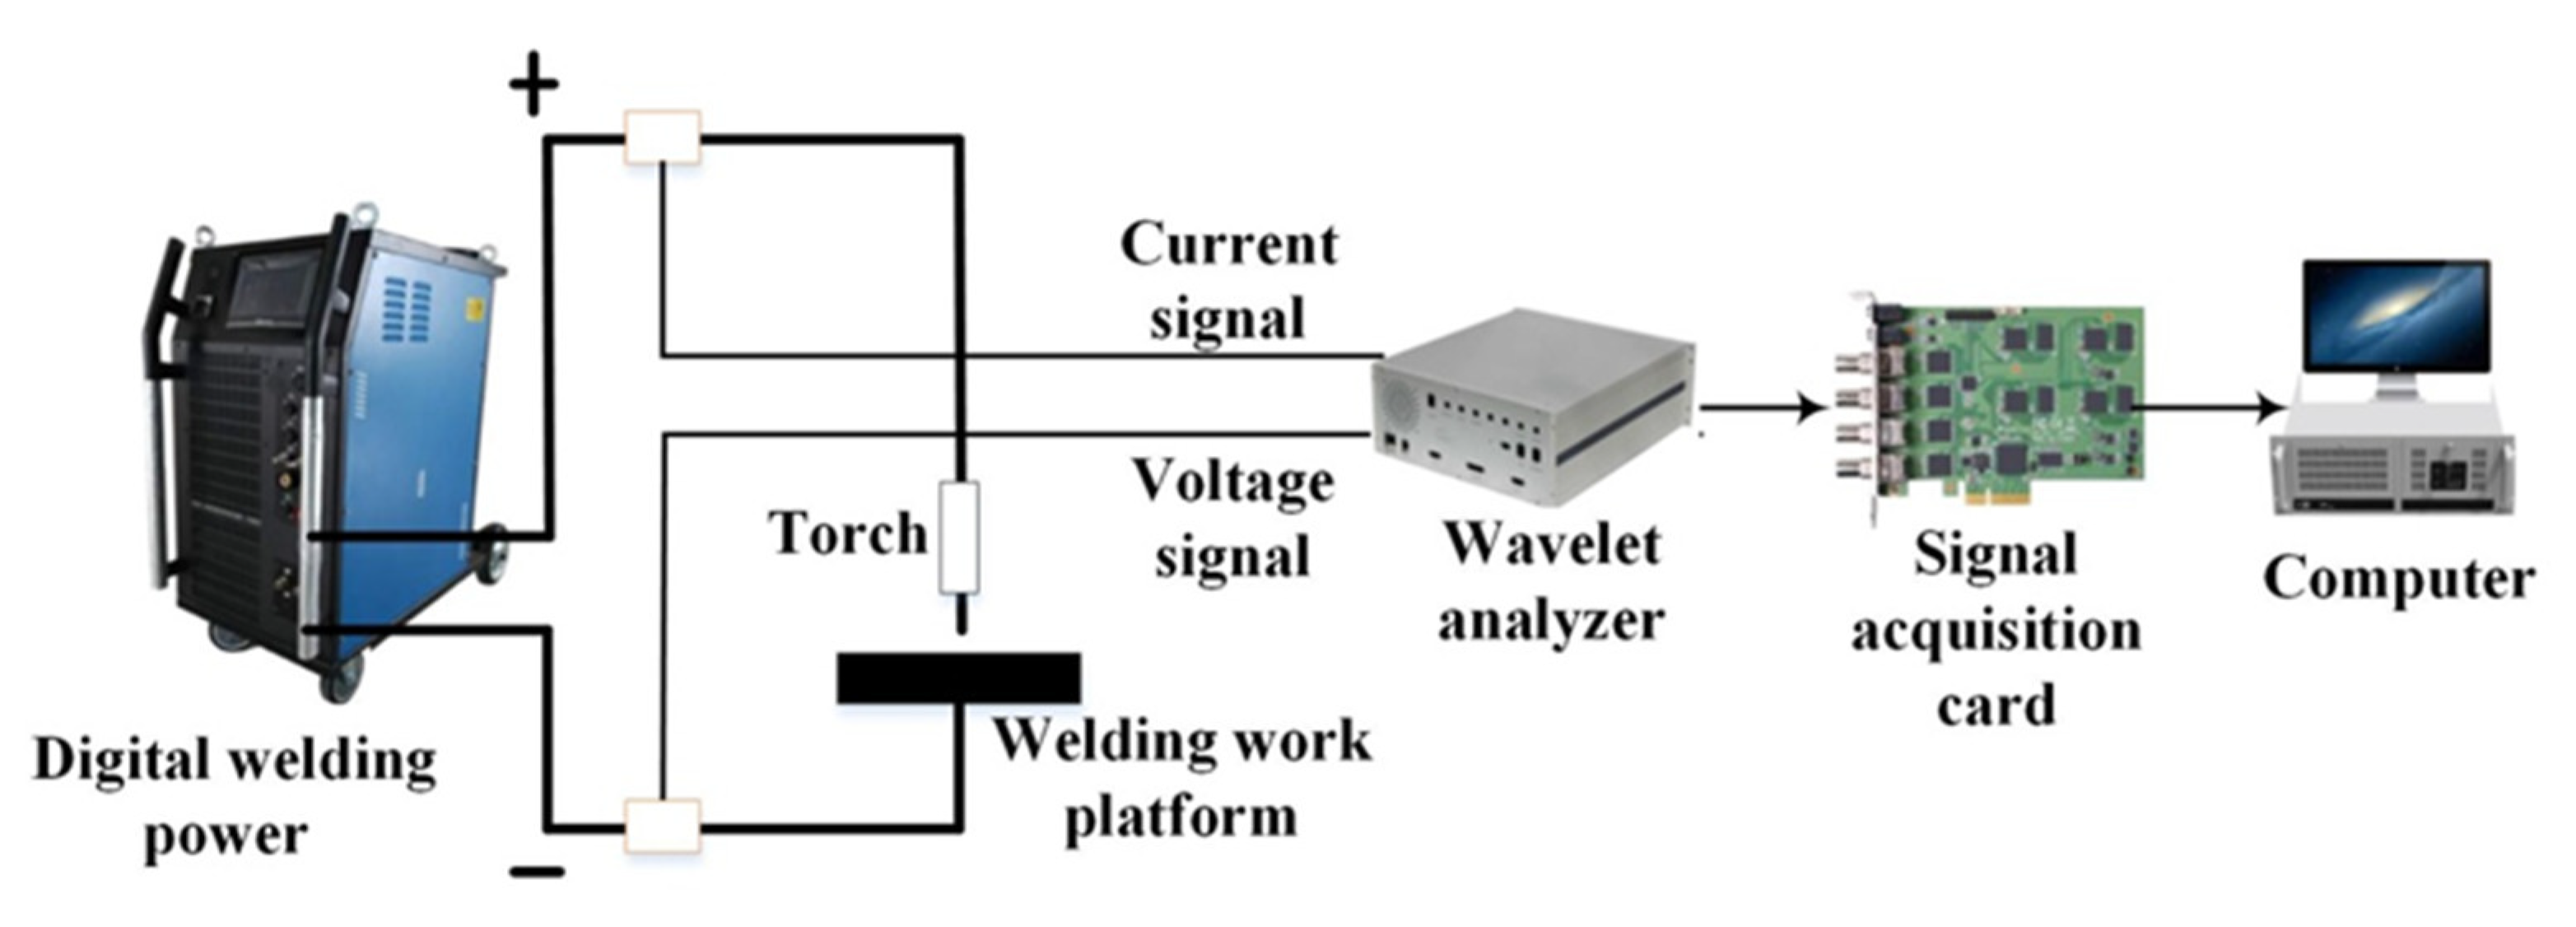
2.3. Test Conditions

To verify the effectiveness of the Gaussian pulse unified adjustment model, a flat overlaying welding test was carried out on 6061 aluminum alloy base plates with thicknesses of 2 mm, 3 mm, and 5 mm under different currents. The test conditions used a DSP digital inverter power supply (Self-developed, Guangzhou, China) developed by the laboratory, ER4043 aluminum–silicon alloy welding wire with a diameter of 1.2 mm, and 6061 aluminum alloy base plates with a length of 250 mm and a width of 100 mm. The chemical compositions of the 6061 aluminum alloy and the ER4043 aluminum–silicon alloy are provided in Table 1. The shielding gas was argon, with a purity of 99.99% and a gas flow rate of 18 L/min. The wire extension was 15 mm, the walking speed of the welding mechanics was constant and the wire was fed at a constant speed. The feeding speed increased with the increase in the average welding current, while the current and voltage signals of the welding process were collected in real time by a wavelet analyzer (Self-developed, Guangzhou, China). The schematic diagram of the welding system used in the test is given in Figure 2.
The test parameters are shown in Table 2. According to Equation (7), the a in the model was 40, β was 1.2, ns was 21, nw was 14, and Flow denoted the low frequency.
After the test was completed, the tensile test samples were prepared by wire cutting along the direction perpendicular to the weld, according to the dimensions in Figure 3. The thickness of the tensile piece was 2 mm, and the surface was polished to be smooth. The weld bead hardness was tested using a Shimadzu HMV-2T Micro Hardness Tester (Shimadzu (China) Co. Ltd., Suzhou, China). The applied pressure was 0.98 N and the test time was 15 s. From the weld’s center to one side of the substrate, the test was carried out at intervals of 0.5 mm (weld area) and 1 mm (away from the weld area). The mechanical properties of the tensile samples were tested using a universal tensile testing machine (Shenzhen-Sansi Co. Ltd., Shenzhen, China). Three samples were taken from the base material, Test 2 and Test 3, and the average value of the obtained tensile data was taken. The metallographic specimen was grounded with water sandpaper, polished with diamond dispersion, and placed into Keller’s reagent (H2O: HCl: HNO3: HF = 95%: 1.5%: 2.5%: 1%, volumetric ratio), before being corroded for 45 s and then dried. Finally, a Leica DMI3000 M optical microscope (Leica Camera Co. Ltd., Wetzlar, Germany) was used to observe the metallographic structure.

3. Test Results and Analysis

3.1. Stability of the Welding Process

The three sets of experiments in Table 1 were completed. In all experiments, the welding process was stable, the spatter was reduced, and the arc sound was soft. Figure 4 shows the weld appearance in experiments 1–3. From Figure 4, it can be seen that the welds in the three sets of experiments have bright surfaces and regular fish scale ripples.
The current and voltage signals collected during the welding process are shown in Figure 5. The electrical signal directly reflects the stability of the welding process. Poor welding performance caused more significant fluctuations in the electrical signals. It can be seen from Figure 5 that the current and voltage signals of the three sets of experiments were stable, and that the entire current waveform presents a regular Gaussian waveform variation. The voltage fluctuation range was small, and no short circuit or arc termination occured, indicating a stable welding process. In the three sets of current and voltage waveform graphs, the base current of the weak pulse groups was the independent variable, increasing from 30 A to 90 A, resulting in a proportional increase in the base current of the strong pulse groups, so that the average current input throughout the welding process increased from 72 A to 126 A. The successful completion of the three sets of experiments proved the effectiveness of the unified adjustment model.

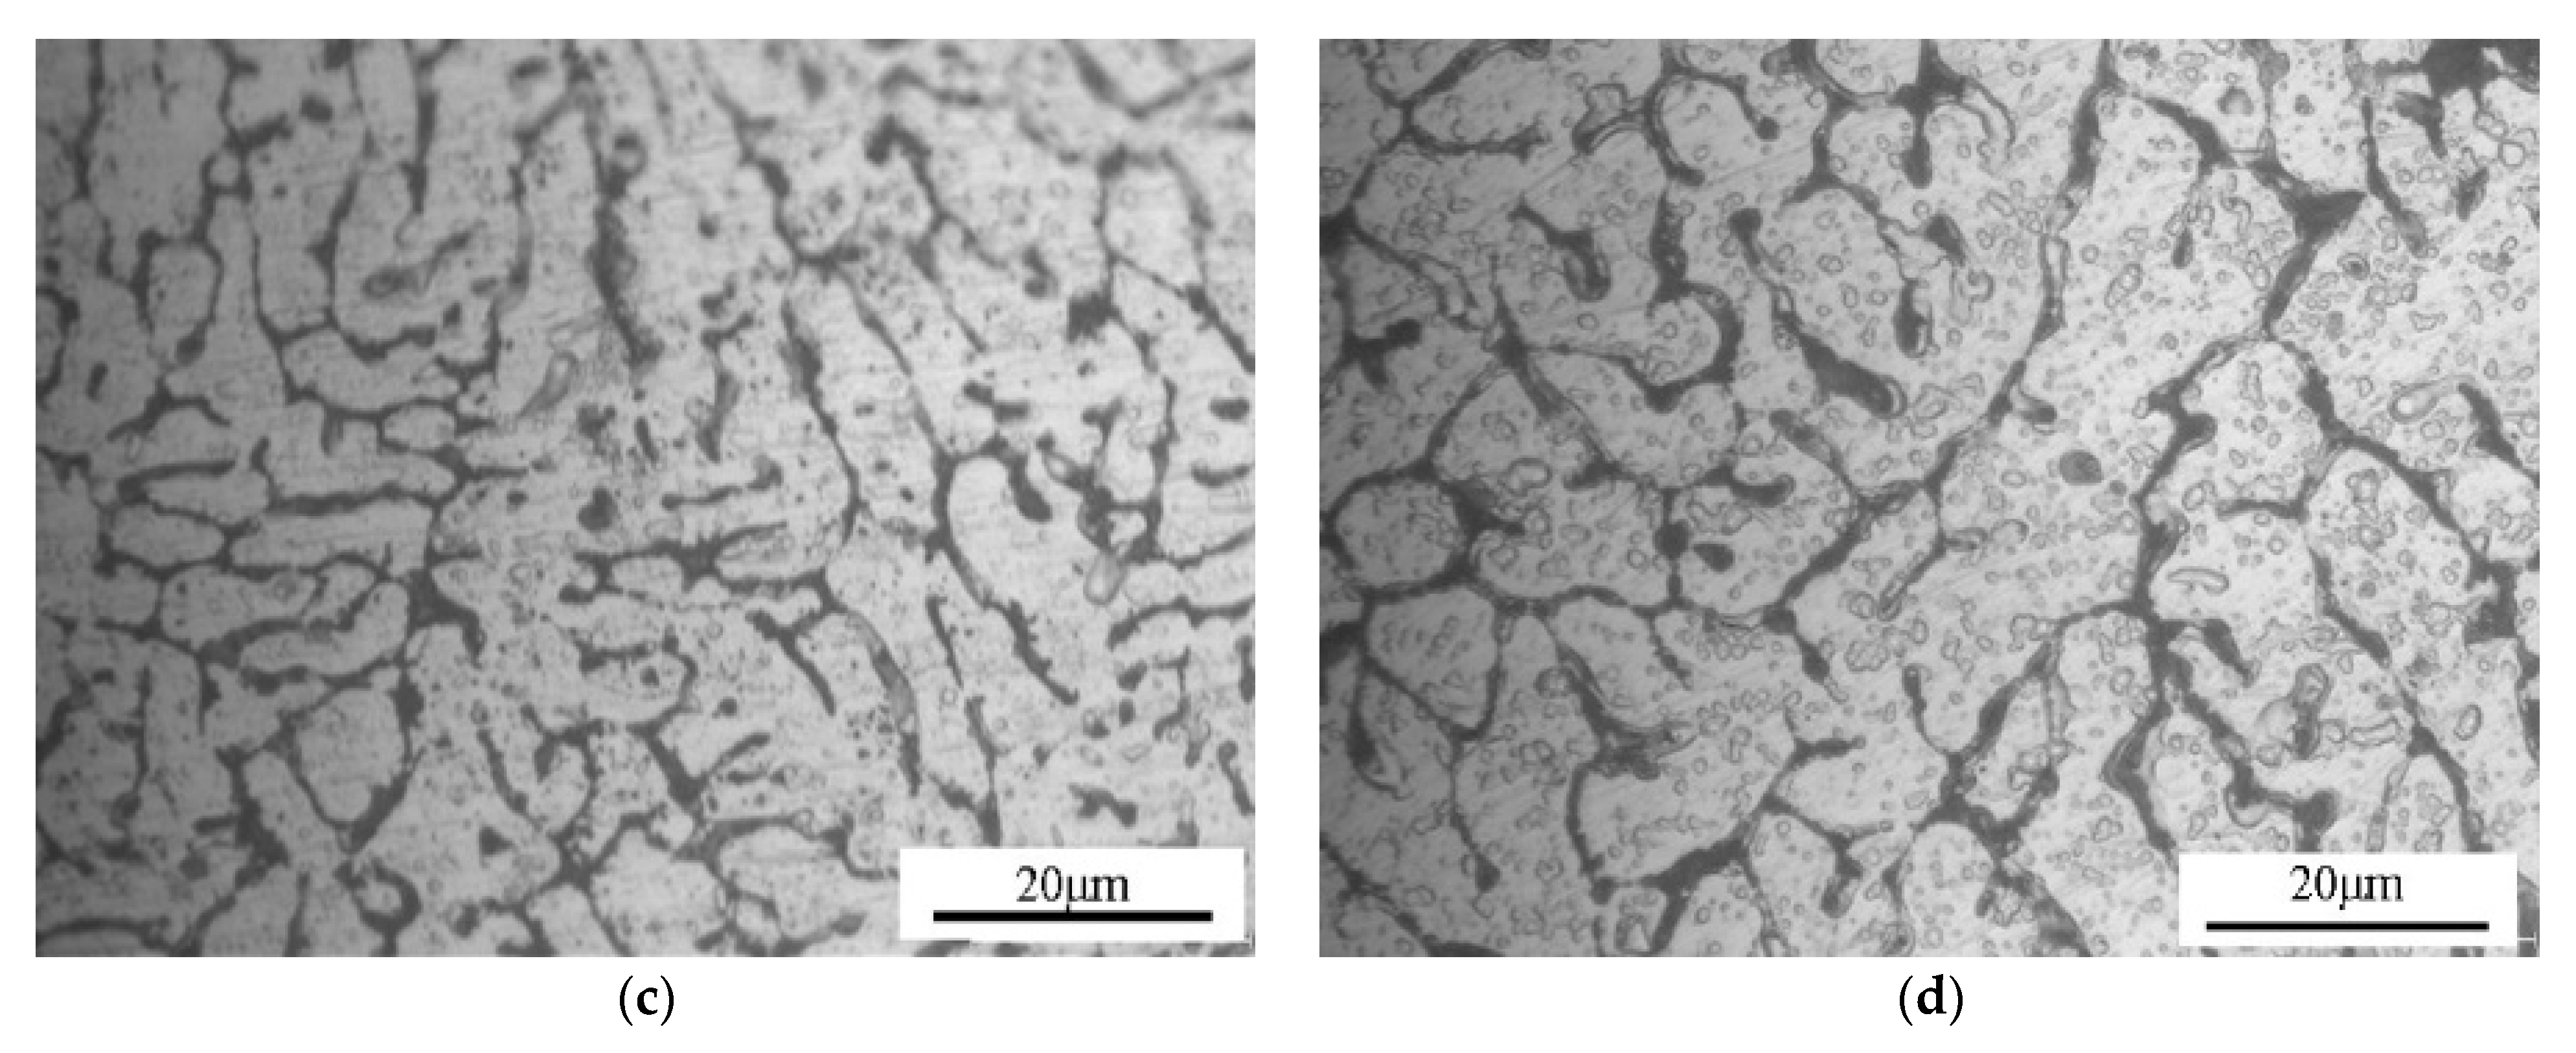
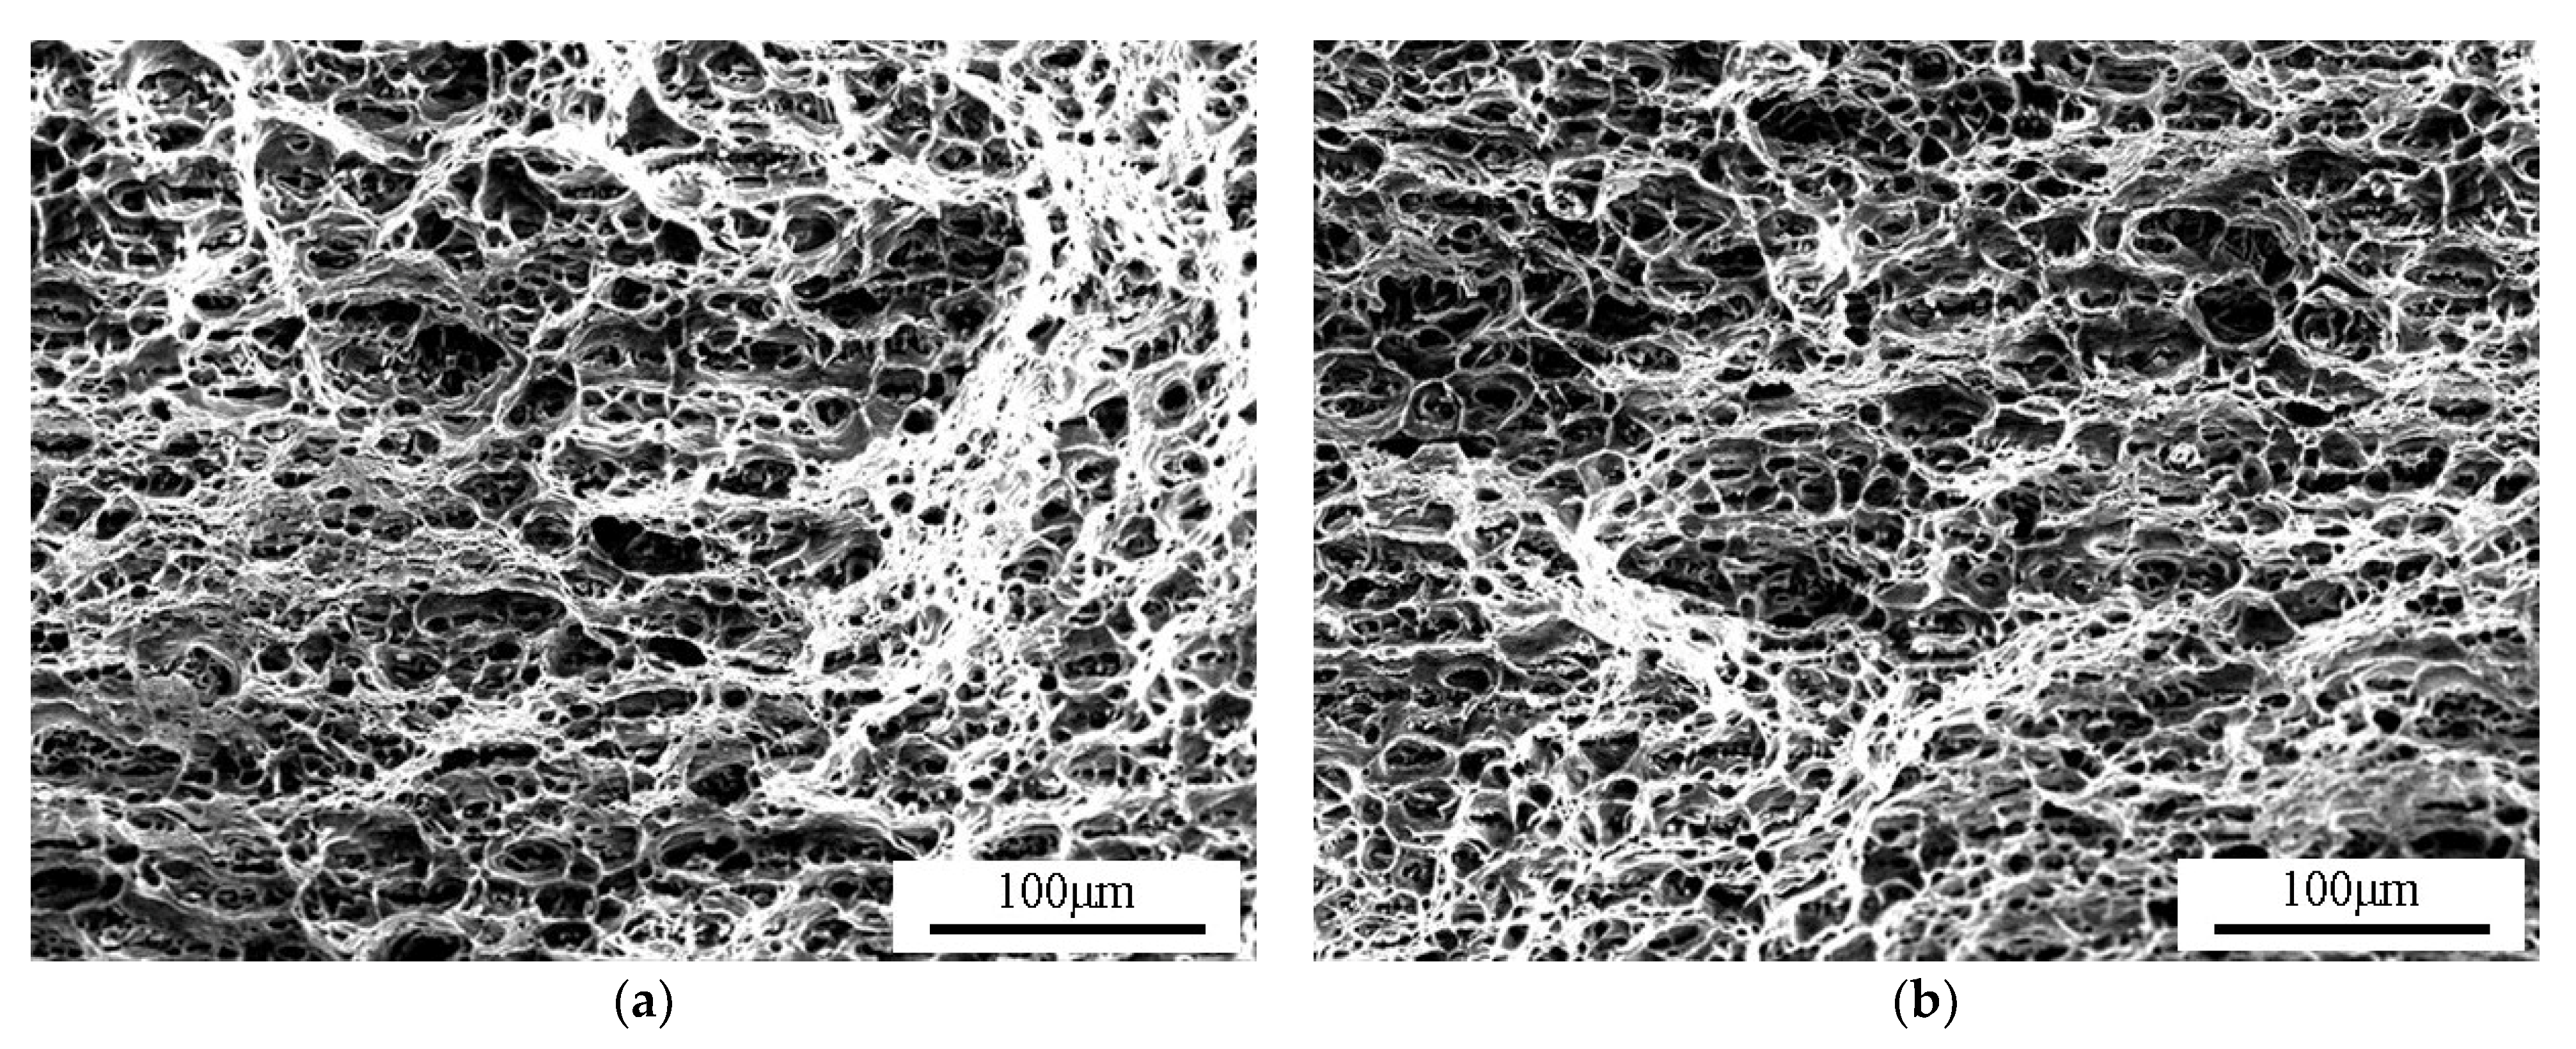
3.2. Microstructure of Weld Beads

Figure 6a–d shows the metallographic structures in Tests 2 and 3. The weld fusion zone is visible in Figure 6a,b. Because of the thorough stirring of Gaussian pulses, there are no visible cracks, pores, or other macroscopic defects surrounding the fusion line. Along the direction of the fusion line, dendritic grains growing up perpendicular to the fusion line can be observed. The temperature of the molten pool was high, and the cooling rate was fast after melting. It can be seen that the grains in the weld zone were finer than those in the heat-affected zone. The coarse grains in the heat-affected zone were produced under the influence of high temperature for a long time, affecting the mechanical properties of the weld. As can be seen in Figure 6c,d, the middle region of each of the welds in the two experiments is composed of dendritic grains of different sizes, and the black aluminum–silicon eutectic phase is present between the grain boundaries. The grain sizes, when viewed under a 500× microscope, are slightly different in Test 2 and Test 3, and the grains of Test 2 are smaller than those of Test 3. The difference in line energy input is the reason for the differences in microstructure.

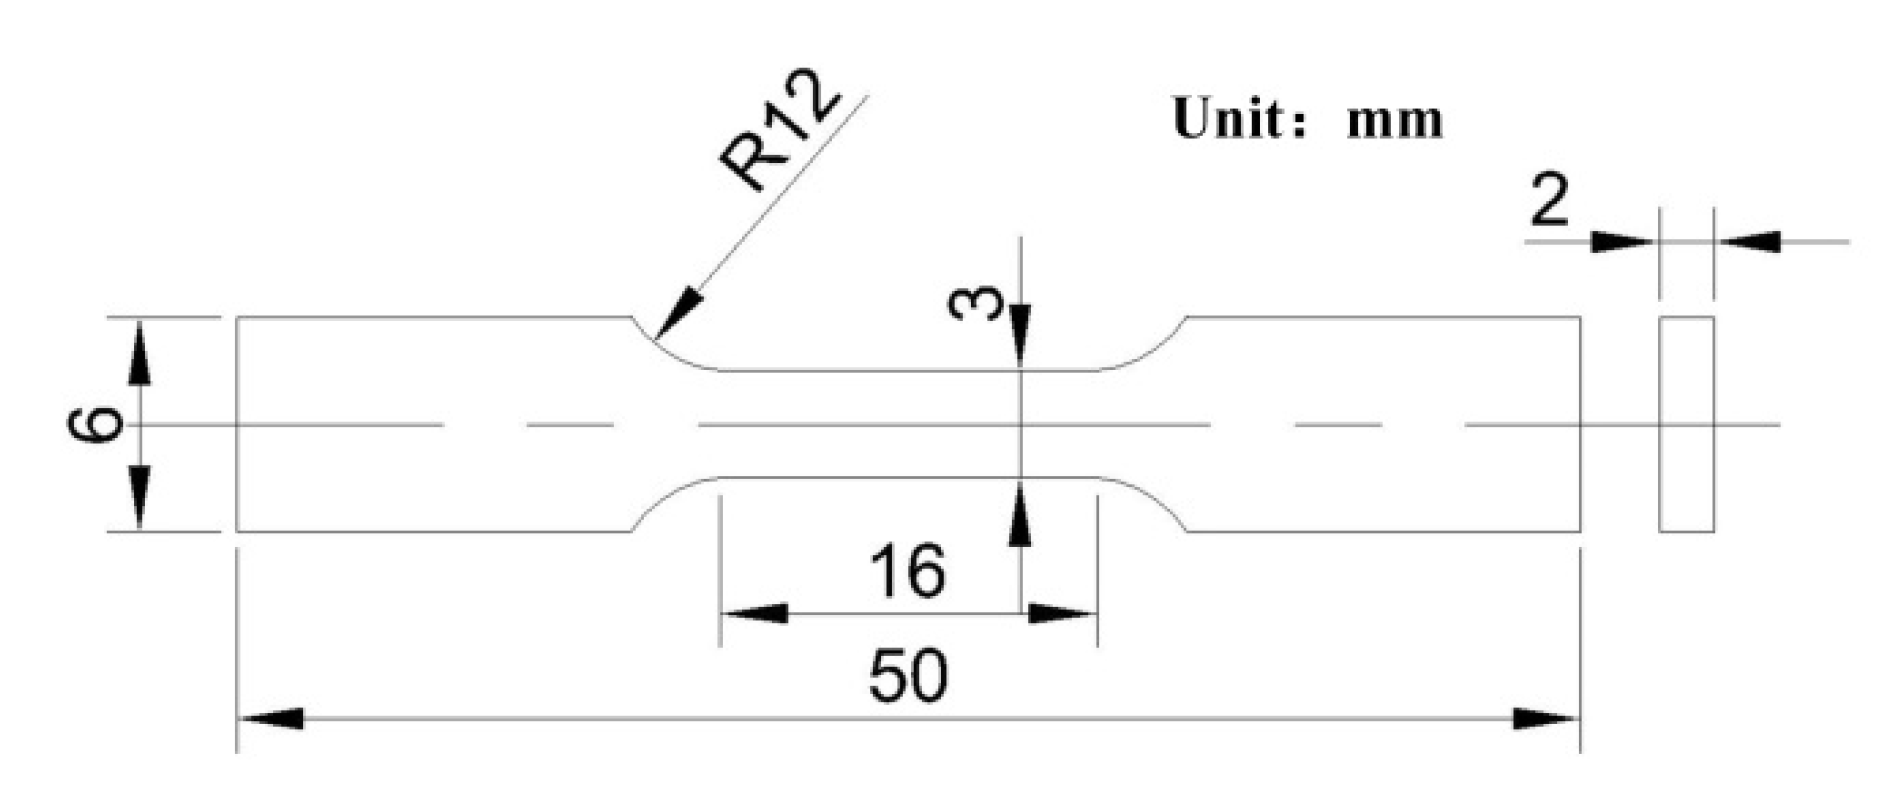
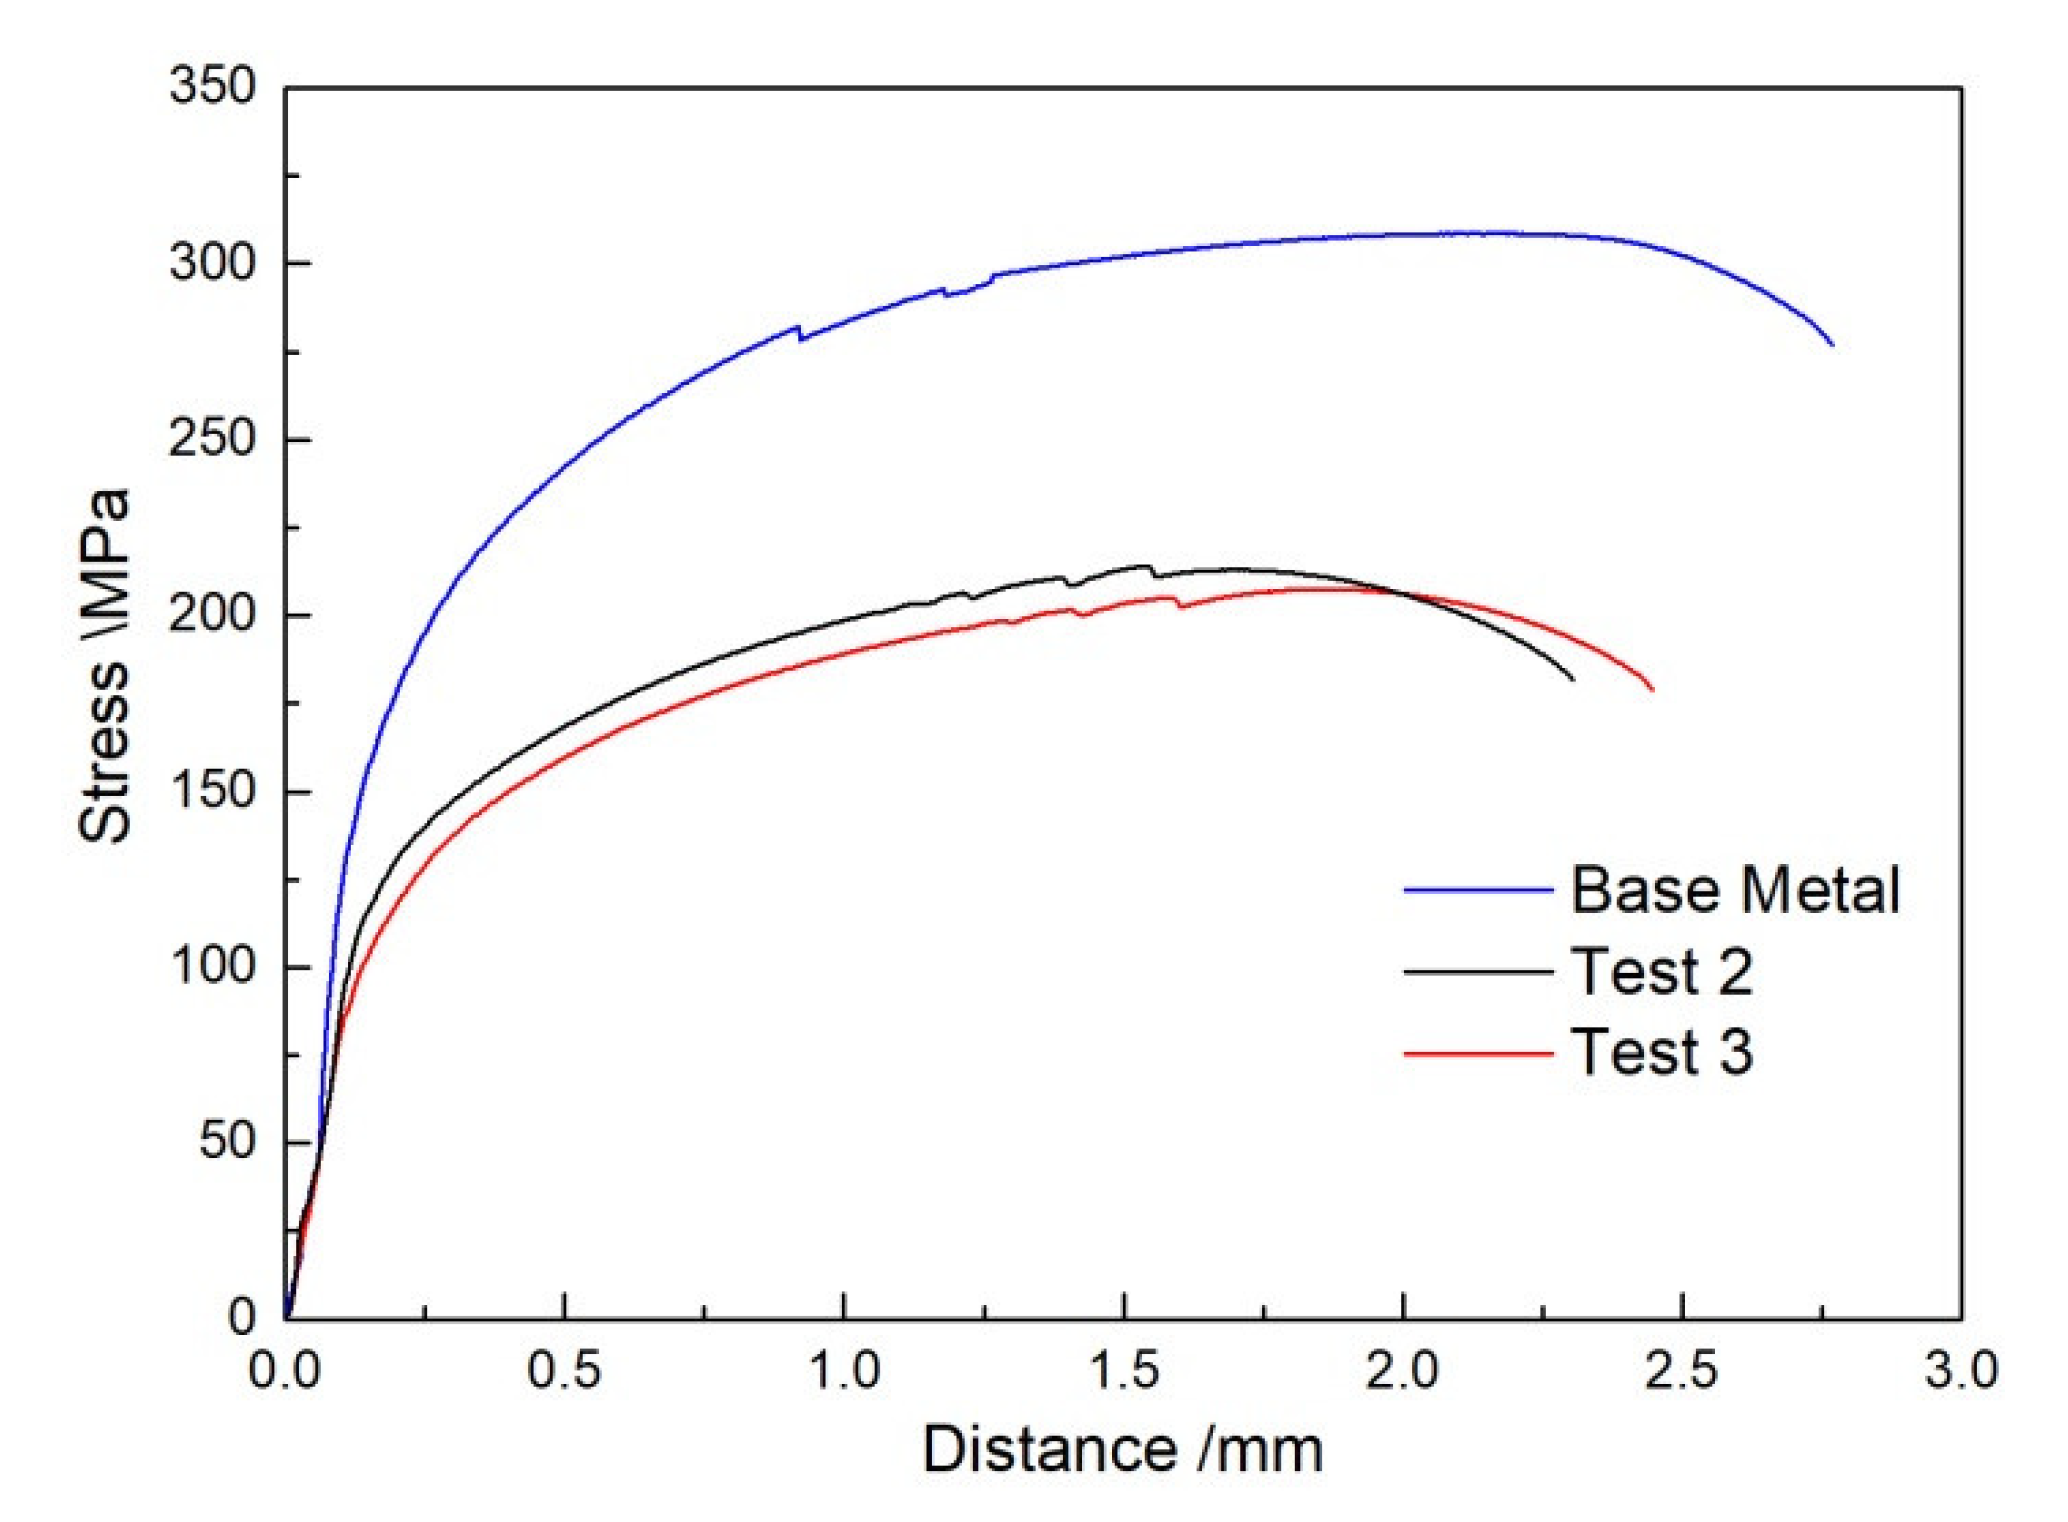
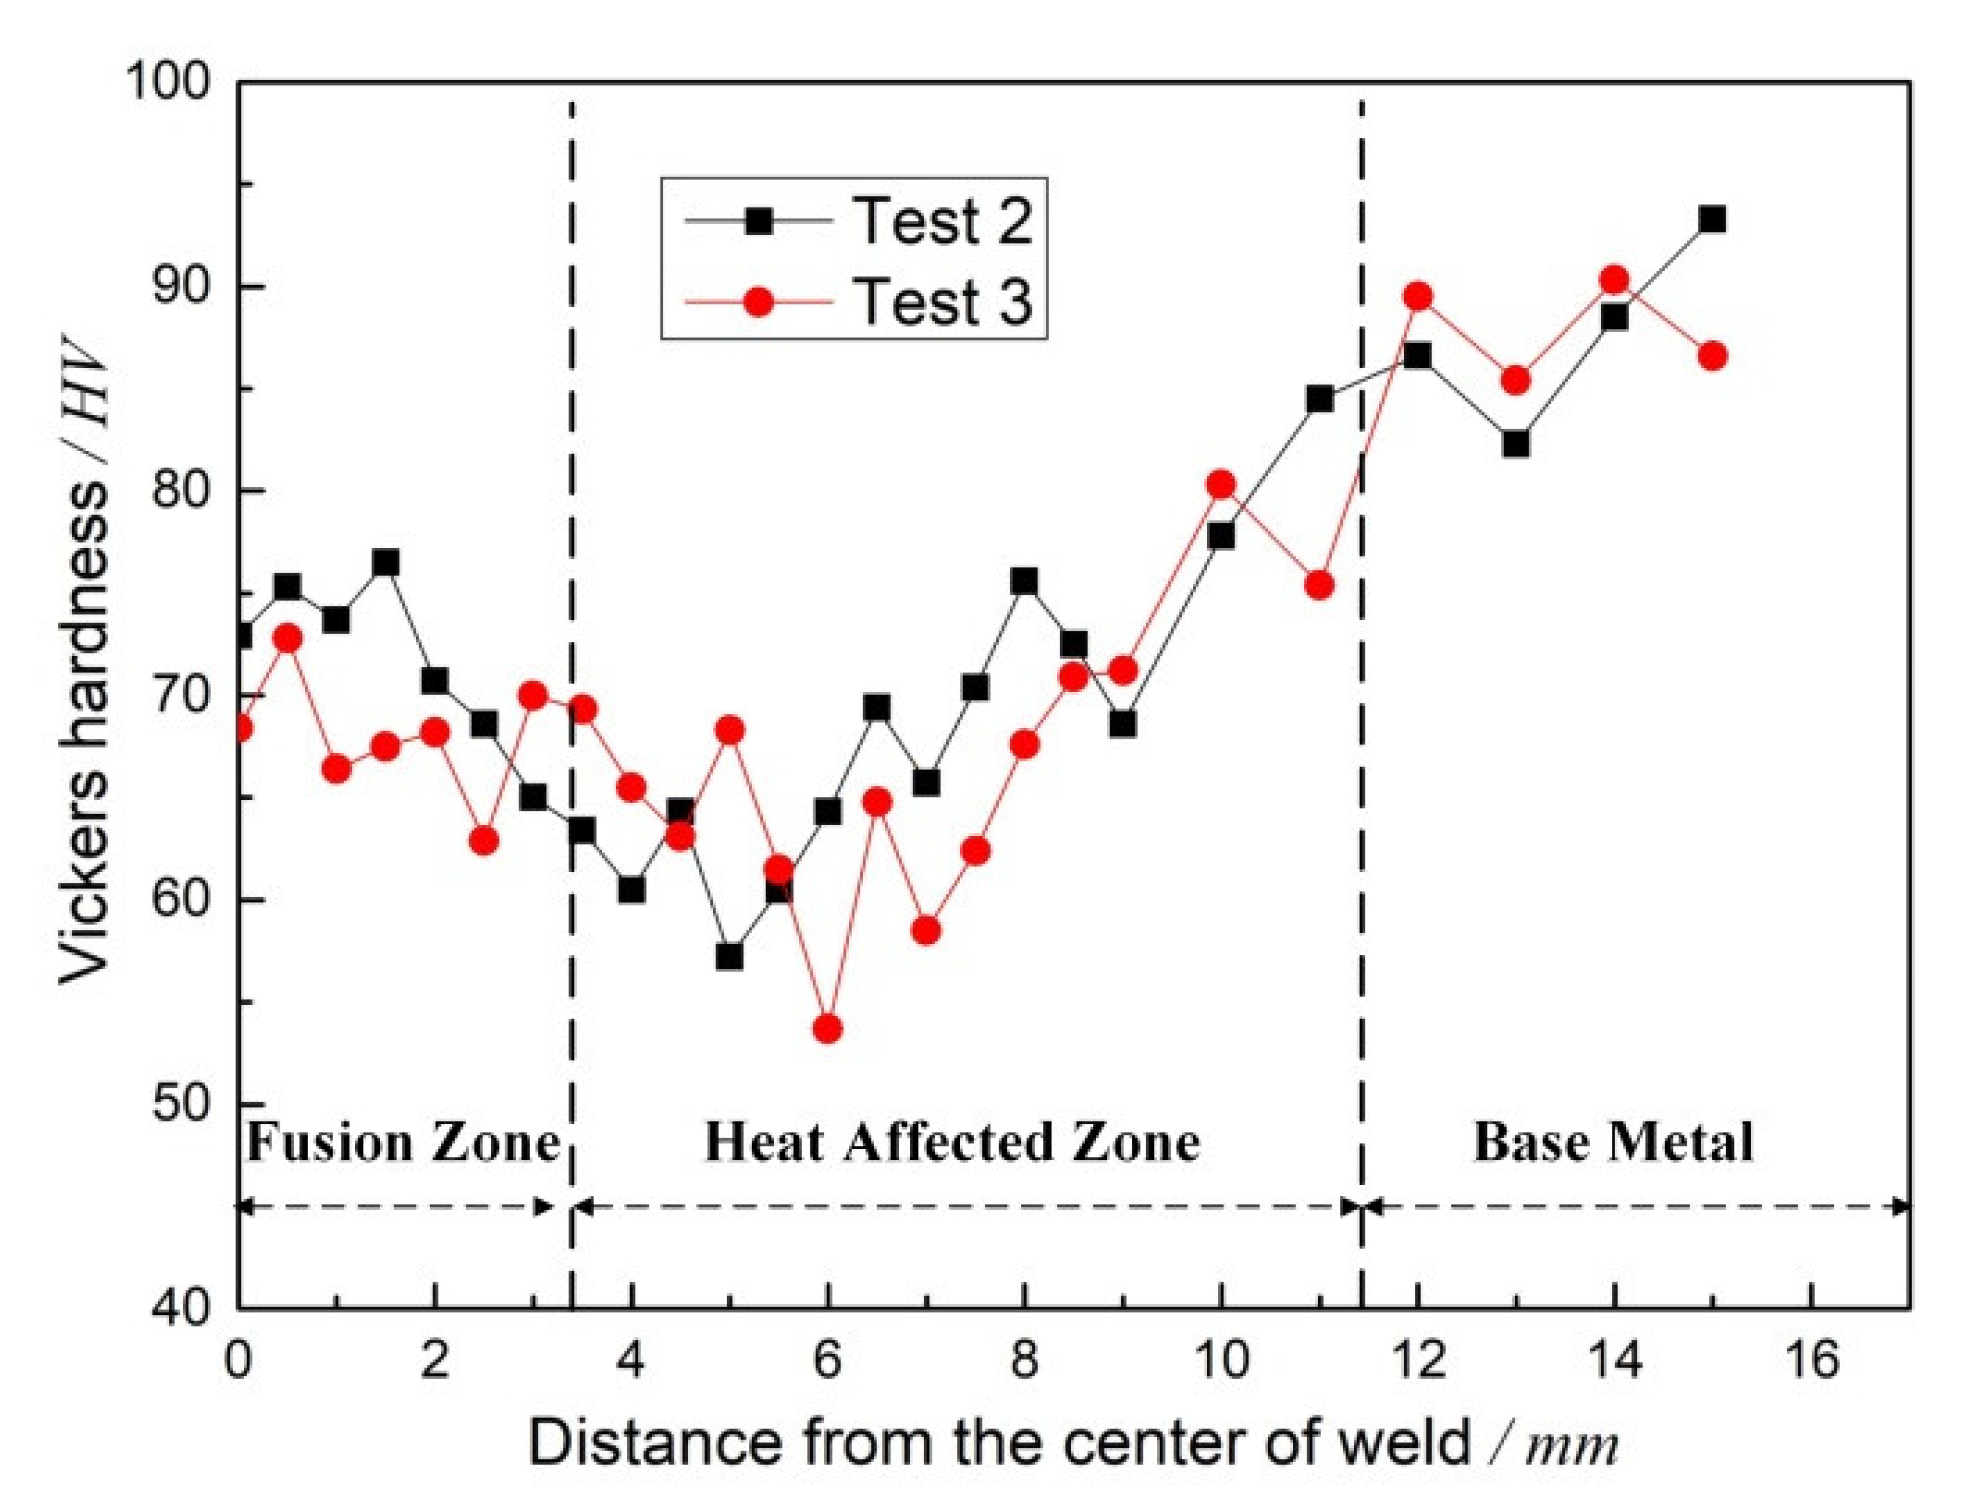
3.3. Mechanical Properties of Weld Beads

The tensile specimens tested in the second and third sets all fractured in the heat-affected zone. This indicates that the heat-affected zone is the weakest section of the weld, which is consistent with the results seen in the microstructures of the welds. The maximum tensile strengths were 213 MPa and 208 MPa, respectively; the tensile strength of the base metal was 308 MPa, and the average tensile strength of the heat-affected zone of the weld reached about 68% of that of the base metal. The stress–strain curves are as shown in Figure 7. Twenty-five points along one side of the weld’s center line were taken to measure the Vickers microhardness curve; the results are as shown in Figure 8. The average hardness of Test 2 was 72.32 HV, while the average hardness of Test 3 was 70.42 HV. We also believe that the reason for the differences in the hardness of the microstructure area is the difference in line energy input. The lowest hardness measured by the two sets of experiments always appeared in the heat-affected zone.
Figure 9 shows the SEM micrographs of the fracture sections of the two sets of tensile specimens. It can be seen that the tensile fracture of the weld is mainly composed of a large number of irregular dimples, with significant plastic deformation before fracture, indicating ductile fracture mode.

4. Conclusions

(1)
A mathematical model for simplifying the unified adjustment of Gaussian pulse welding currents for aluminum alloys has been established. This model realizes a new process of adjusting the average welding current input through the weak pulse groups’ base current. Furthermore, it reduces the difficulty in realizing the unified adjustment of the welding process, by establishing an expert database based on a large amount of experimental data.
(2)
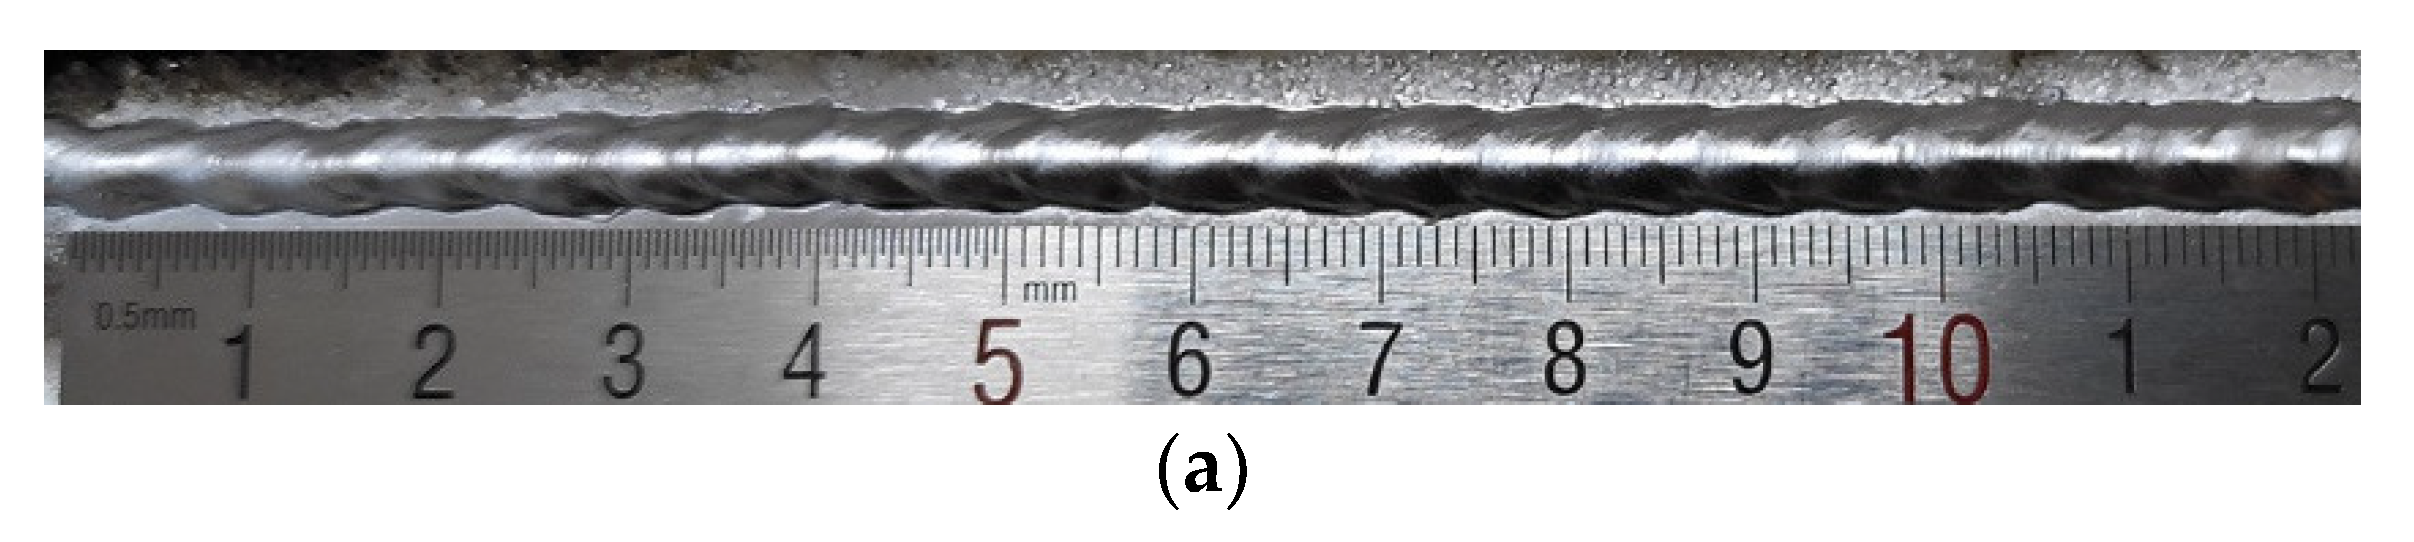
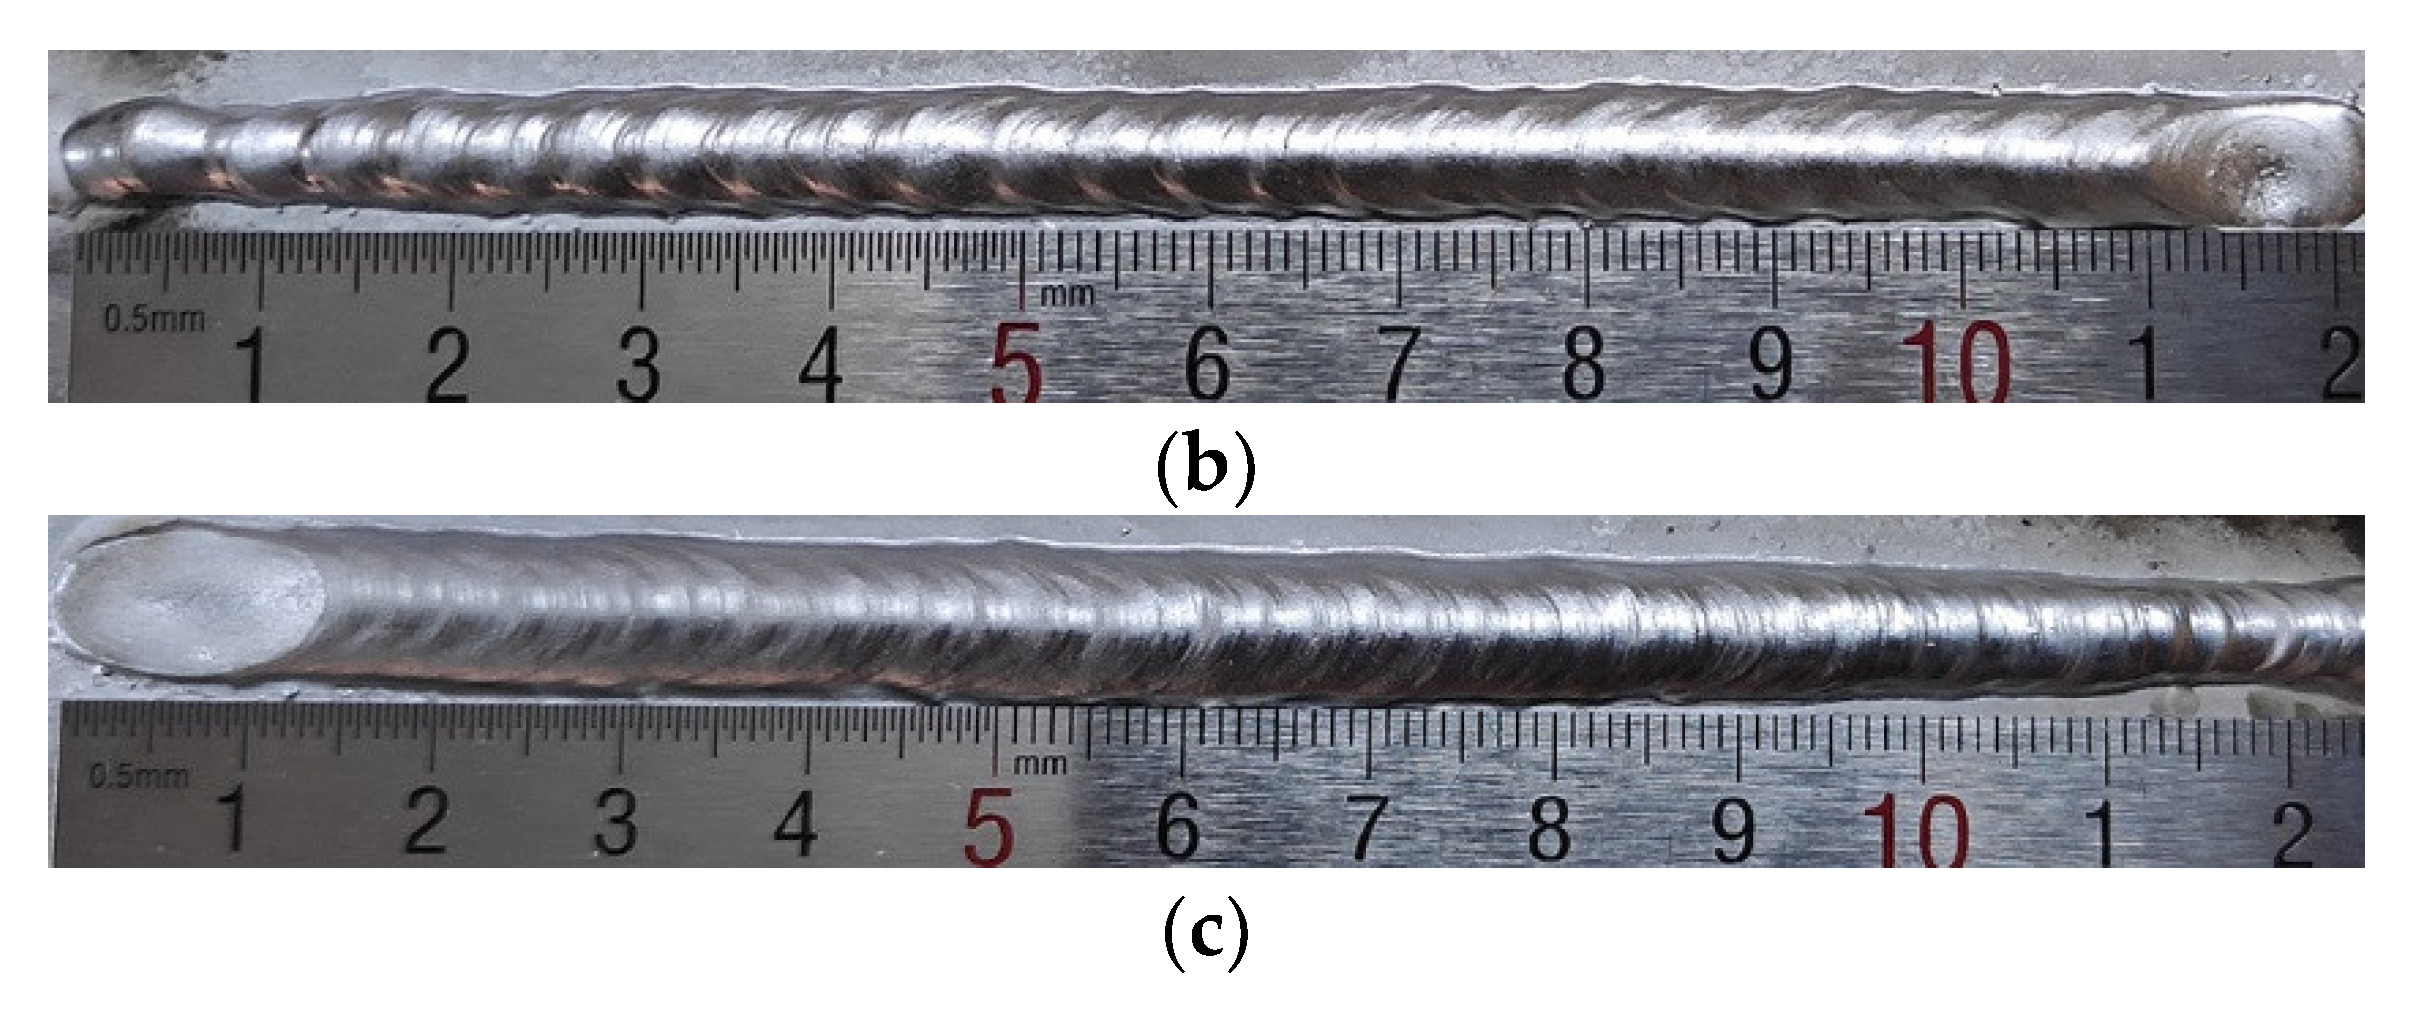
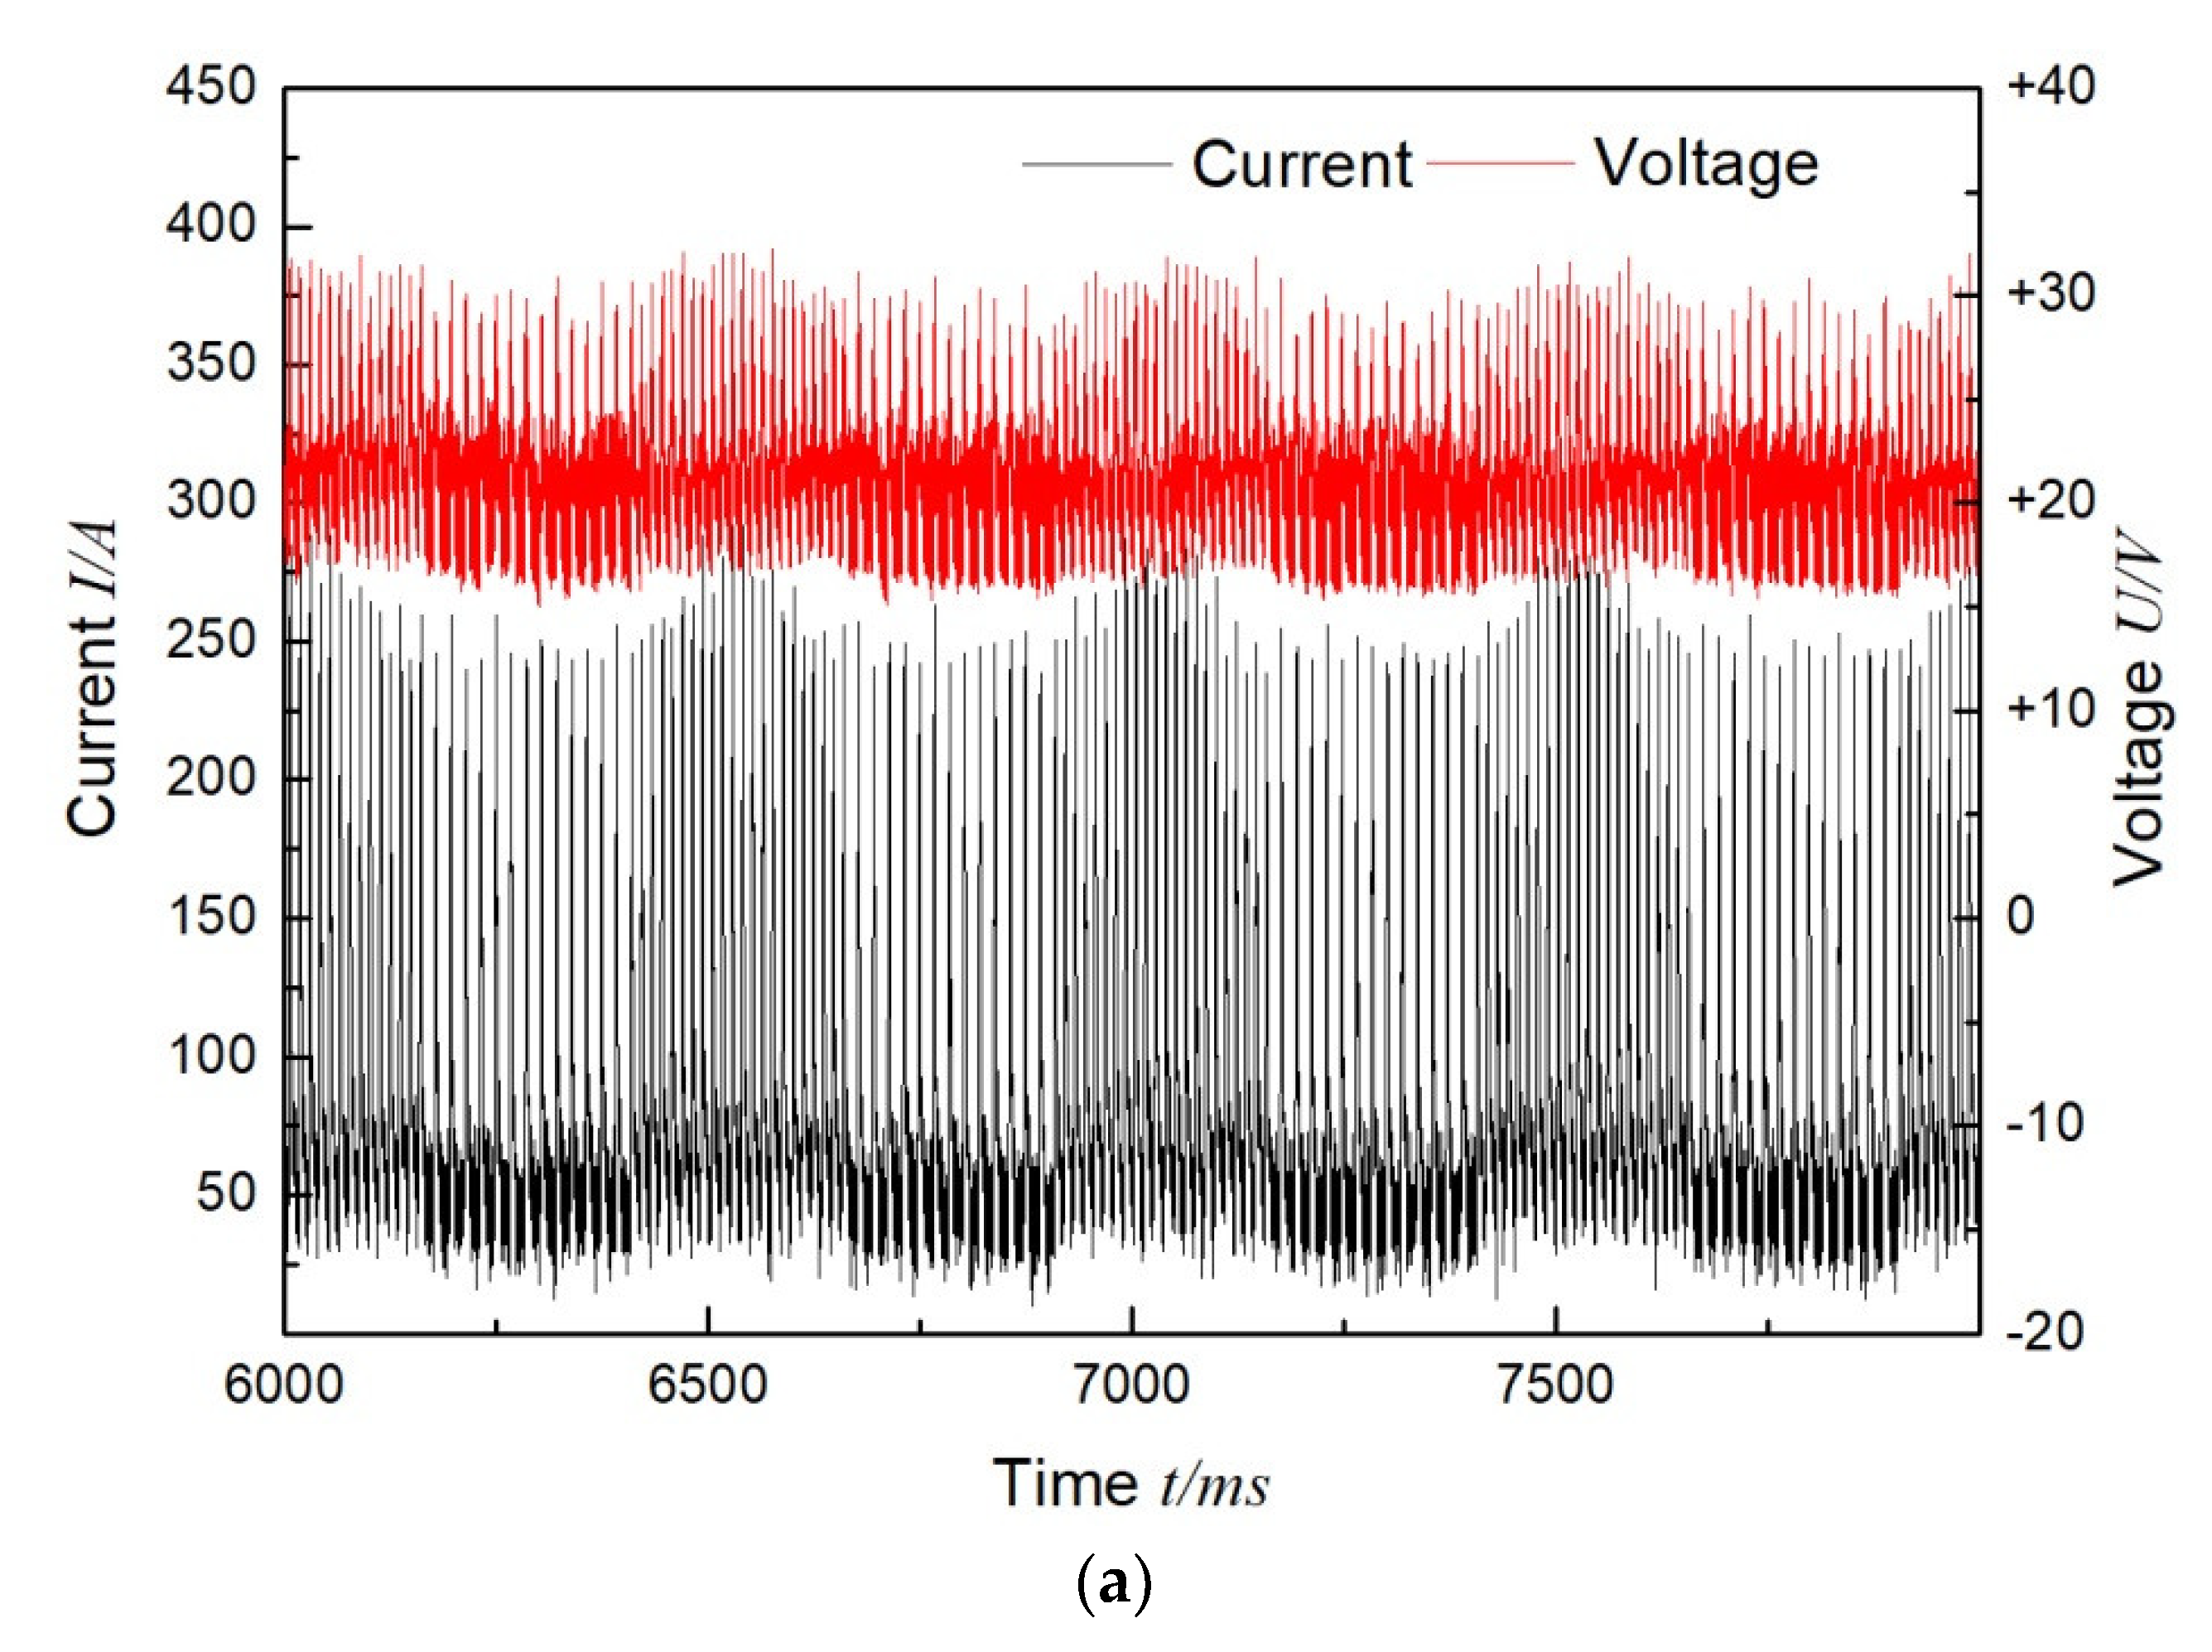
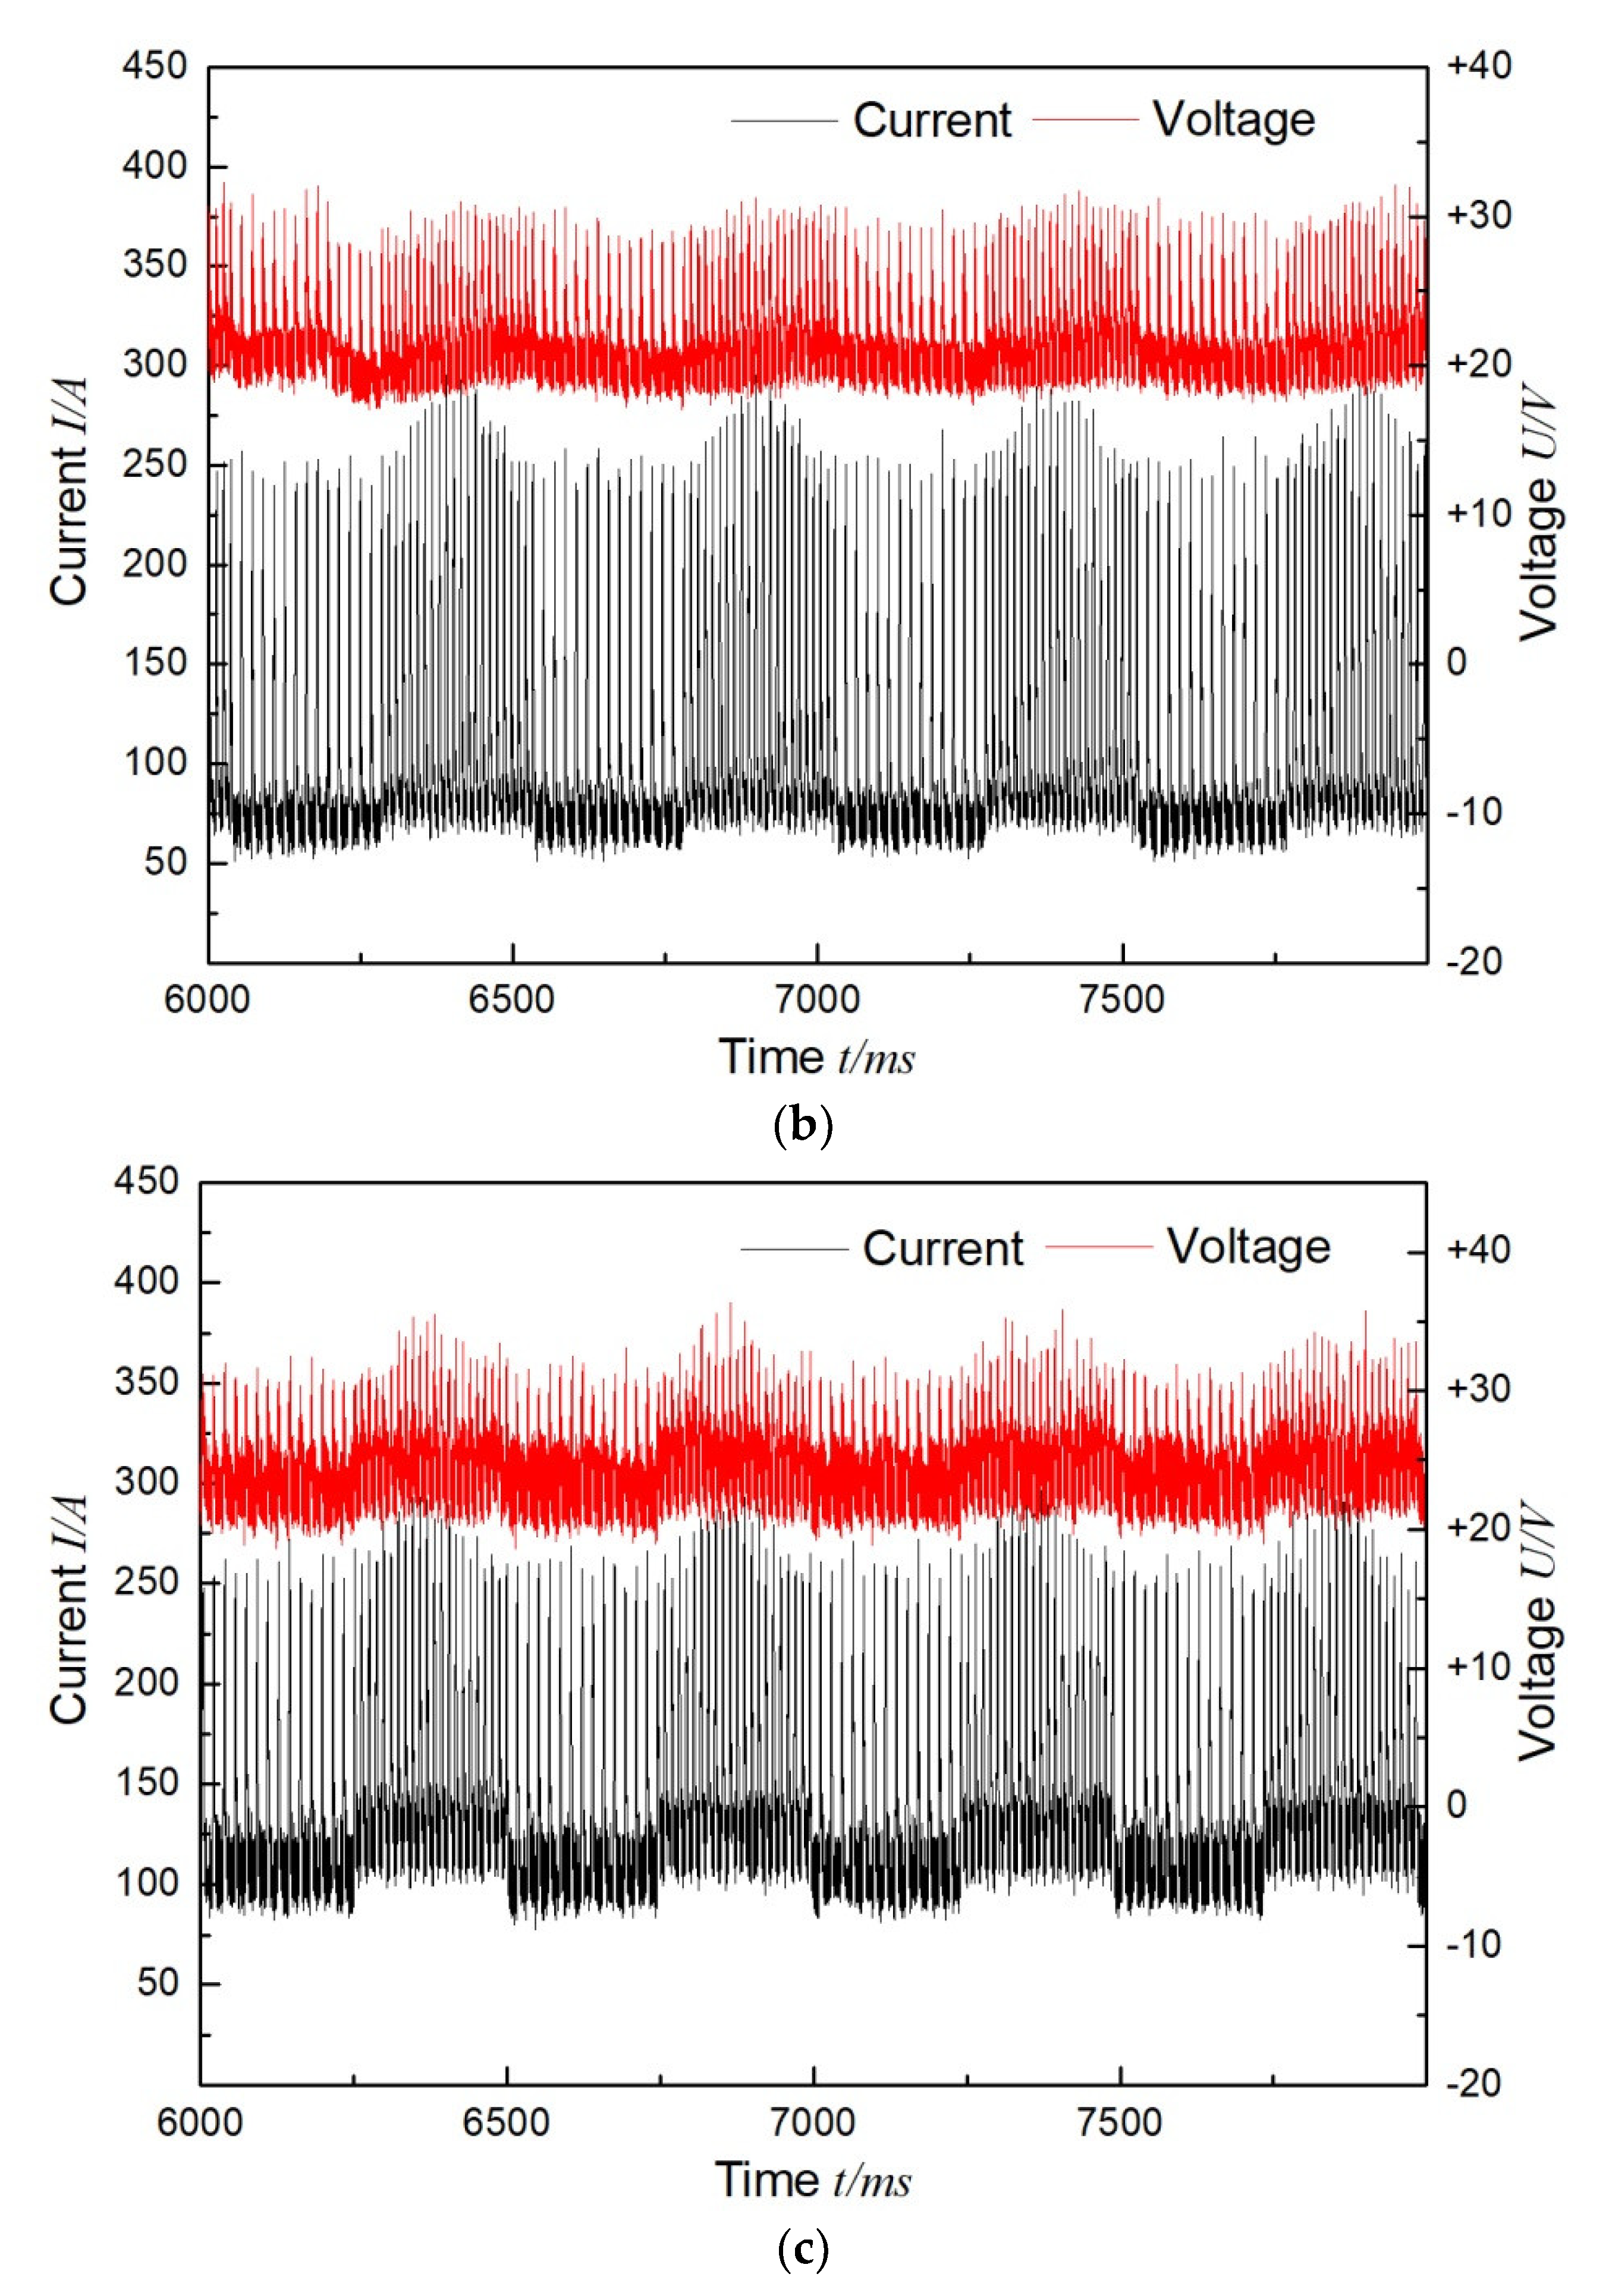
The effectiveness of the unitary mathematical model has been verified by overlaying welding experiments on 2–5 mm thick 6061 aluminum alloy plates. The average current inputs of the three sets of tests were 72 A, 92 A, and 126 A, respectively, which were obtained by adjusting only one parameter. The three sets of test welds had bright surfaces with regular fish scale ripples, reduced spatter, and good repeatability of the current and voltage signals during welding.
(3)
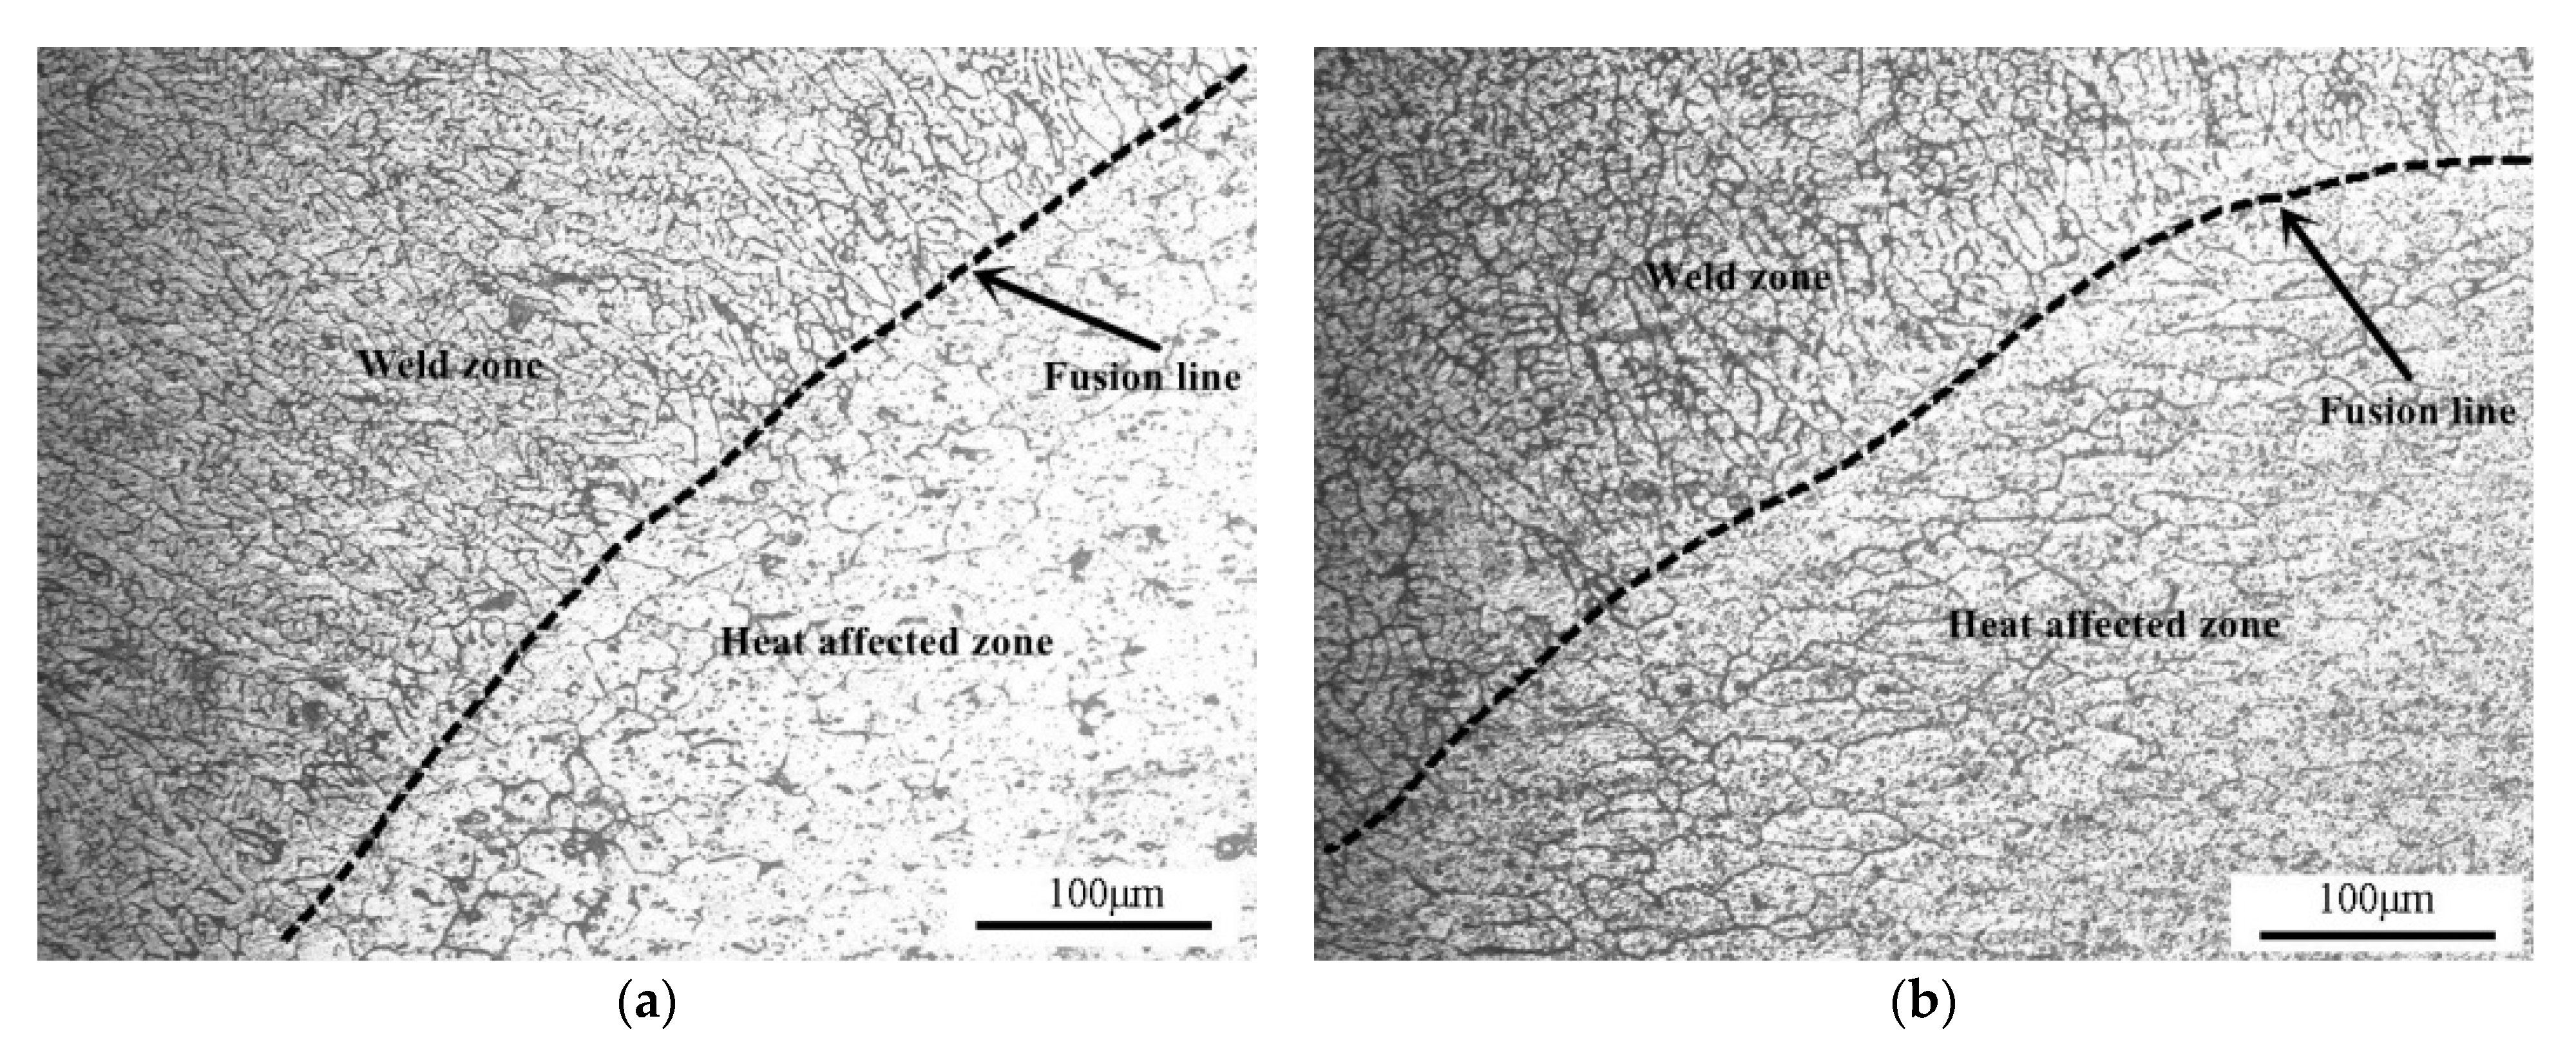
The welds’ metallographic structures were mainly composed of fine dendrites, indicating good physical properties. The welded surfaces fractured in their heat-affected zones during tensile testing. The maximum tensile strength of Test 2 was 213 MPa, while the maximum tensile strength of Test 3 was 208 MPa, reaching about 68% of that of the base material. The average hardness of Test 2 was 72.32 HV, while the average hardness of Test 3 was 70.42 HV. The lowest hardness measured by the two sets of experiments always appeared in the heat-affected zone.

Author Contributions

Conceptualization, Q.Z. and X.Y.; methodology, Q.Z. and H.H.; formal analysis, Q.Z., B.X. and P.Y.; writing—original draft preparation, Q.Z. and J.X.; project administration, J.X.; funding acquisition, J.X. All authors have read and agreed to the published version of the manuscript.

Funding

This research was funded by the National Natural Science Foundation of China (51875213, 51805099), the Guangdong Provincial Department of Education General University Scientific Research Project (2020KTSCX397, 2020CJPT008), and the Guangdong University Student Science and Technology Innovation Cultivation Special Fund Project (pdjh2021b0770).

Conflicts of Interest

The authors declare no conflict of interest.

References

  1. Liu, A.; Tang, X.; Lu, F. Arc profile characteristics of Al alloy in double-pulsed GMAW. Int. J. Adv. Manuf. Technol. 2013, 65, 1–7. [Google Scholar] [CrossRef]
  2. Reis, R.P.; Scotti, A.; Norrish, J.; Cuiuri, D. Investigation on welding arc interruptions in the presence of magnetic fields: Arc length, torch angle and current pulsing frequency influence. IEEE Tran. Plasma Sci. 2013, 41, 133–139. [Google Scholar] [CrossRef] [Green Version]
  3. Wang, L.; Wu, C.S.; Gao, J.Q. Suppression of humping bead in high speed GMAW with external magnetic field. Sci. Technol. Weld. Join. 2016, 21, 139–141. [Google Scholar] [CrossRef]
  4. Wang, L.L.; Jin, L.; Huang, W.J.; Xue, J.X. Effect of Thermal Frequency on AA6061 Aluminum Alloy Double Pulsed Gas Metal Arc Welding. Mater. Manuf. Process. 2015, 31, 2152–2157. [Google Scholar] [CrossRef]
  5. Jin, L.; Xue, J.X.; Hu, Y.; Zhang, Z. Effects of Thermal Frequency on Microstructures, Mechanical and Corrosion Properties of AA6061 Joints. Appl. Sci. 2018, 8, 540. [Google Scholar] [CrossRef] [Green Version]
  6. Chen, X.; Yu, G.; He, X.; Li, S.; Miao, H. Effect of droplet impact on molten pool dynamics in hybrid laser-MIG welding of aluminum alloy. Int. J. Adv. Manuf. Technol. 2018, 96, 209–222. [Google Scholar] [CrossRef] [Green Version]
  7. Chen, S.; Xu, B.; Jiang, F. Blasting type penetrating characteristic in variable polarity plasma arc welding of aluminum alloy of type 5A06. Int. J. Heat Mass. Transf. 2018, 118, 1293–1306. [Google Scholar] [CrossRef]
  8. Chang, Q.; Sun, D.; Gu, X.; Li, H. Microstructures and mechanical properties of metal inert-gas arc welded joints of aluminum alloy and ultrahigh strength steel using Al-Mg and Al-Cu fillers. J. Mater. Res. 2017, 32, 666–676. [Google Scholar] [CrossRef]
  9. Subramaniam, S.; White, D.R.; Jones, J.E.; Lyons, D.W. Droplet transfer in pulsed gas metal arc welding of aluminum. Weld. J. 1998, 77, 458–464. [Google Scholar]
  10. Yao, P.; Zhou, K.; Tang, H. Effects of Operational Parameters on the Characteristics of Ripples in Double-Pulsed GMAW Process. Materials 2019, 12, 2767. [Google Scholar] [CrossRef] [Green Version]
  11. Zhang, Z.H.; Xue, J.X. Profile Map of Weld Beads and Its Formation Mechanism in Gas Metal Arc Welding. Metals 2019, 146, 10. [Google Scholar] [CrossRef] [Green Version]
  12. Zhu, Q.; Xue, J.; Yao, P.; Dong, C.; Wang, L.; Heng, G.; Li, Z. Gaussian Pulsed Current Waveform Welding for Aluminum Alloys. Mater. Manuf. Process. 2015, 30, 1124–1130. [Google Scholar] [CrossRef]
  13. Chen, C.; Fan, C.L.; Cai, X.Y.; Lin, S.B.; Yang, C.L. Analysis of droplet transfer, weld formation and microstructure in Al-Cu alloy bead welding joint with pulsed ultrasonic-GMAW method. J. Mater. Process. Technol. 2019, 271, 144–151. [Google Scholar] [CrossRef]
  14. Jia, Y.Z.; Xiao, J.; Chen, S.J.; Huang, W.H. Pulsed laser enhanced metal transfer of aluminum alloy in GMAW. Opt. Laser. Eng. 2019, 121, 29–36. [Google Scholar] [CrossRef]
  15. Xue, J.X.; Lin, F.L.; Jin, L.; Hu, Y. Influence of pulse current waveform on mechanical properties of Tandem double wire MIG welding. Trans. China. Weld. Inst. 2019, 40, 6–10. [Google Scholar]
  16. Wu, W.; Xue, J.X.; Jin, L.; Zhang, Z.Z. Effect of modulating frequency in changing pulse numbers on aluminum alloy double pulsed welding. Trans. China. Weld. Inst. 2019, 40, 126–130. [Google Scholar]
  17. Balasubramanian, V.; Ravisankar, V.; Reddy, G.M. Effect of pulsed current welding on mechanical properties of high strength aluminum alloy. Int. J. Adv. Manuf. Technol. 2008, 36, 254–262. [Google Scholar] [CrossRef]
  18. Guzman, I.; Granda, E.; Acevedo, J.; Martinez, A.; Davila, Y.; Velazquez, R. Comparative in Mechanical Behavior of 6061 Aluminum Alloy Welded by Pulsed GMAW with Different Filler Metals and Heat Treatments. Materials 2019, 12, 4157. [Google Scholar] [CrossRef] [Green Version]
  19. Winiczenko, R.; Goroch, O.; Krzynska, A.; Kaczorowski, M. Friction welding of tungsten heavy alloy with aluminum alloy. J. Mater. Process. Technol. 2017, 246, 42–55. [Google Scholar] [CrossRef]
  20. Tomaz, I.D.; Colaco, F.H.G.; Sarfraz, S.; Pimenov, D.Y.; Gupta, M.K.; Pintaude, G. Investigations on quality characteristics in gas tungsten arc welding process using artificial neural network integrated with genetic algorithm. Int. J. Adv. Manuf. Technol. 2021, 113, 3569–3583. [Google Scholar] [CrossRef]
  21. Wang, Z.M.; Oliveira, J.P.; Zeng, Z.; Bu, X.Z.; Peng, B.; Shao, X.Y. Laser beam oscillating welding of 5A06 aluminum alloys: Microstructure, porosity and mechanical properties. Opt. Laser. Technol. 2019, 111, 58–65. [Google Scholar] [CrossRef]
  22. Ke, W.C.; Bu, X.Z.; Oliveira, J.P.; Xu, W.G.; Wang, Z.M.; Zeng, Z. Modeling and numerical study of keyhole-induced porosity formation in laser beam oscillating welding of 5A06 aluminum alloy. Opt. Laser. Technol. 2021, 133, 106540. [Google Scholar] [CrossRef]
Figure 1. Schematic of the Gaussian pulse welding method.
Metals 11 00671 g001
Figure 2. Schematic diagram of the experimental welding system.
Metals 11 00671 g002
Figure 3. Size of the tensile sample.
Metals 11 00671 g003
Figure 4. Appearance picture of weld beads: (a) Test 1; (b) Test 2; (c) Test 3.
Metals 11 00671 g004aMetals 11 00671 g004b
Figure 5. Voltage and current signals of the welding process: (a) Test 1; (b) Test 2; (c) Test 3.
Metals 11 00671 g005aMetals 11 00671 g005b
Figure 6. Metallographic diagrams of the welds: (a) The region near the weld fusion line in Test 2. (b) The region near the weld fusion line in Test 3. (c) The middle region of the weld bead in Test 2. (d) The middle region of the weld bead in Test 3.
Metals 11 00671 g006aMetals 11 00671 g006b
Figure 7. Stress–distance curves.
Metals 11 00671 g007
Figure 8. Vickers hardness curves of the weld beads.
Metals 11 00671 g008
Figure 9. Tensile fracture morphologies of the welds: (a) Test 2; (b) Test 3.
Metals 11 00671 g009
Table 1. Chemical compositions of the 6061 and ER4043 aluminum alloys (wt. %).
MaterialMgSiFeCuMnCrAl
60610.960.520.250.250.120.26Bal.
ER 40430.055.600.80.30.05-Bal.
Table 2. Parameters of the unified adjustment experiment process.
Test NumberSize of Base Material
mm × mm × mm
Ips
I /A
ts
t / ms
Ibs
I /A
tgw
t / ms
Iop
I /A
Ibw
I /A
tw
t / ms
Iavg
I /A
Flow
f /Hz
1250 × 100 × 2vary with gaussian curve2.5369.52603014.5722
2250 × 100 × 32.5609.52605014.5922
3250 × 100 × 52.51089.52609014.51262
Publisher’s Note: MDPI stays neutral with regard to jurisdictional claims in published maps and institutional affiliations.

