Article

Investigation of the Intermetallic Compounds Fragmentation Impact on the Formation of Texture during the as Cast Structure Thermomechanical Treatment of Aluminum Alloys

by
Evgenii Aryshenskii
1,
Jurgen Hirsch
1,2 and
Sergey Konovalov
1,*
1
Department of Metals Technology and Aviation Materials, Samara National Research University, Moskovskoye Shosse 34, 443086 Samara, Russia
2
Hydro Aluminium Rolled Products GmbH, Research and Development, D-53117 Bonn, Germany
*
Author to whom correspondence should be addressed.
Metals 2021, 11(3), 507; https://doi.org/10.3390/met11030507
Submission received: 20 February 2021 / Revised: 12 March 2021 / Accepted: 17 March 2021 / Published: 19 March 2021
(This article belongs to the Special Issue Microstructure and Mechanical Properties of Aluminum Alloys)

Abstract

:
In this work, the influence of the intermetallic particle fragmentation during hot rolling of the as cast structure on the evolution of textures in aluminum alloys 8011, 5182 and 1565 was investigated. For this purpose, laboratory multi-pass rolling of the cast material was carried out. At various degrees of hot rolling deformation, the process was stopped, and the metal was quenched and sent for optical and electron microscopy to investigate the large intermetallic particles. In addition, the grain structure was studied and an X-ray analysis was carried out in order to determine the main texture components. Some of the samples were held at a temperature above the recrystallization threshold and then cooled in air; the grain structure and texture composition were also studied. In addition, the simulation of the texture evolution was carried out under various modes of rolling of aluminum alloys, taking into account the process of fragmentation of intermetallic particles. The investigation showed that intermetallic compounds with a deformation degree of 1.8, on average, decrease the particle size by 5–7 times. The large eutectic particles remaining after homogenization are drawn out in the direction of deformation and are crushed, increasing their number accordingly. Therefore, the most favorable stage for the formation of recrystallization nuclei on particles is the moment when they are already numerous and their sizes are much larger than subgrains. Simulation of hot rolling of the investigated alloys showed that considering the factor of fragmentation of intermetallic particles during hot deformation of the as-cast structure significantly increases the accuracy of the results.

1. Introduction

Nowadays, aluminum and its alloys are among the most promising materials [1,2,3,4,5,6,7]. One of the most common problems in the production of aluminum sheets and strips is the texture that develops during thermomechanical processing, which leads to anisotropy of mechanical properties that, in turn, reduces the stability of cold forming operations. In deep drawing of the sheet, anisotropy leads to the occurrence of ears (Figure 1) that affect final geometries and tolerances and require additional processes like trimming at the lowest point of the workpiece, thereby increasing costs and reducing yield [8,9,10]. Reducing anisotropy by controlling the texture evolution is possible by achieving approximately equal amounts of the rolling texture (β-fiber) and recrystallization (cubic) textures components, leading to the balancing of ears occurring at 45° and 0° to the rolling axis, respectively [11,12]. To obtain the specific texture composition, it is necessary to control its evolution throughout the entire process by appropriate thermomechanical treatment. This requires understanding of the process details, since the alloy chemical composition and the process parameters of its thermomechanical treatment will jointly influence its evolution.
One of the factors associated with the chemical composition is the size and amount of primary intermetallic particles of the second (minor) phase generated during the casting/solidification process. During subsequent hot rolling, particles larger than ~1 μm in size become nuclei of new grains during recrystallization along with such microstructure elements as high-angle boundaries, as well as the cubic texture components and shear bands. The reason is that large particles can accumulate a large number of dislocations during the process of hot deformation and form a very favorable place for the generation of new grain nuclei during the recrystallization process. This nucleation mechanism is called particle stimulated nucleation (PSN) [13,14,15,16]. It should be noted that the nuclei of the new grains generated by this mechanism have a certain orientation at the local level, which, however, is independent for each particle. Therefore, recrystallization according to the PSN scheme provides more random orientations and rather weak textures on the macroscale [15,16]. Hence, it is important to control PSN not only from the recrystallization point of view, but also from the point of view of obtaining a specific texture composition. PSN plays a special role in aluminum alloys with high magnesium content [17,18,19,20]. The latter reduces the stacking-fault energy by reducing the size of subgrains that belong to different elements of the microstructure (for example, cube oriented grains) [21] as compared to those that arise in particles of the minor phase. This makes the PSN approach especially competitive in this type of alloys [19]. If the magnesium content is increased to 6%—together with higher manganese, silicon and iron contents—PSN begins to completely prevail over other mechanisms of nucleation under certain thermomechanical processing conditions [19], which is why the size and amount of the intermetallic particles must be controlled to successfully obtain the desired texture composition.
The details of the evolution of primary intermetallic particles during homogenization and their subsequent effect on recrystallization are well studied [22,23,24]. There are also a number of studies showing that intermetallic particles crush during deformation at the stage of processing the as-cast structure after homogenization [25,26]. Most of these studies are devoted to the study of the morphology and mechanical properties of particles using the methods of X-ray 3D-tomography [26,27]. However, they practically do not describe how crushing of intermetallic particles affects the process of recrystallization and texture evolution.
These data obtained for the homogenized state or measured after hot working of the as-cast structure are used in models that describe the evolution of texture in aluminum alloys when calculating the amount of PSN [20,28,29,30,31]. Nonetheless, these models do not take into account the fragmentation stage between homogenization and during hot rolling of the cast structure at the exit from the reversing rougher mill when the number and size of particles can vary greatly. Controlling the texture is especially important at this stage because, in most cases, specific texture effects are already observed at the exit of the reversing stand.
The purpose of this article is to study how fragmentation of the particles during the development of an as-cast structure will affect the PSN mechanism and, thus, the texture evolution during the development of the as-cast structure of aluminum alloys with high magnesium content. Particular attention will be paid to alloys with high magnesium content in which the PSN mechanism is often decisive for recrystallization and texture formation.

2. Experiment Description

To study the effect of intermetallic particle fragmentation on the texture evolution in alloys with high magnesium content, three alloys, namely 5182, 1565 and 8011, the chemical compositions of which are given in Table 1, were selected.
The 5182 alloy contains a moderate number of intermetallic compounds such as Mg2Si and Al6(MnFe). There are many more intermetallic compounds of both types in 1565 alloy due to the increased content of Mg and Mn. This makes it possible to study the effect of the intermetallic compound fragmentation on the texture evolution at the stage of rolling of the as-cast structure in alloys with significantly different amounts. In addition, the 8011 alloy was investigated as it does not contain high amount of magnesium and has subgrains that are, in general, larger than intermetallic particles.
Direct chill molded and homogenized (homogenization mode included annealing for 8 h at the temperature of metal 485–500 °C) alloy ingot samples 1565 and 5182 were next used for hot rolling. The samples for 8011 alloy were direct chill molded with homogenization at a temperature of the metal of 600 °C, which was held for 6 h, after which they were sent for hot rolling. Then, samples from all three alloys were hot rolled on a laboratory mill “DUO 220 mm” (Dima Maschinen-Handelsgesellschaft mbH, Esslingen am Neckar, Germany) in accordance with the modes given in Table 2, Table 3 and Table 4.
The samples with dimensions 30 mm × 100 mm × 250 mm were made for rolling of alloys 5182 and 1565 and 40 mm × 100 mm × 250 mm for 8011 alloy, respectively. For all investigated alloys, the samples were cut from semi-continuous cast ingots. The samples of alloys 5182 and 1565 were rolled from the ingots with 30 mm thickness, and the 8011 alloy ingots had 40 mm thickness. In each pass, it was attempted to keep the rolling steps equal to 5 mm. However, the reductions in the passes were different due to the gripping conditions as well as due to the limited positioning accuracy of the pressure screws and the variation of rolling forces due to contact friction conditions. The samples were rolled until a specific deformation was achieved. Passage numbers in which samples were taken were underlined. For each of the defined deformations, two strips were rolled. One was cooled in water immediately after deformation, and the other one was slowly cooled in air. The samples were studied using the optical and scanning microscopy methods of X-ray structural analysis. In addition, the grain structure was studied by optical microscopy in as-cast samples. In the homogenized state, intermetallic particles were investigated by electron and optical microscopy.
The purpose of this study was not to study the morphology and mechanical properties of the intermetallic particles but rather the effect of their fragmentation on the evolution of texture in the alloys studied here. Note that so far most of the modern models do not take the influence of the particle morphology on the nucleation process into account (although this factor undoubtedly plays an important role). Therefore, not X-ray tomography but light and electron microscopy were used for the study of particles, which made it possible to estimate the size and number of intermetallic compounds depending on the thermomechanical treatment mode. These data are sufficient for most models that deal with the size and number of intermetallic particles [20,29,31,32,33].
The microstructure of the samples was investigated using a Carl Zeiss Axiovert-40 MAT optical microscope. Preparation of the polished micro-specimen included cutting out of samples, mechanical grinding and mechanical polishing.
After mechanical polishing, the samples were polished in fluoroboric electrolyte, having the following composition:
-
H3BO3 11 g
-
HF 30 mL
-
H2O 2200 mL.
Electrolytic polishing was performed at room temperature and 30–35 V voltage. The microsections were held with forceps, and the working area was immersed to 1–10 mm depth in the electrolyte vessel. To eliminate oxidizing, the section was immersed and removed from the electrolyte under voltage. The polishing duration was 15–90 s, normally. After polishing, the section was washed in a vessel with warm water and dried out with filtering paper. The purpose of optical microscopy was to determine the size of the grain structure and study the crushing process of the large intermetallic compounds.
A JEOL 6390A scanning electron microscope (SEM) (JEOL Ltd., Tokyo, Japan) was used to study the size and distribution of dispersoids (to assess the recrystallization retarding force) and large intermetallic particles. The sample preparation technique consisted of mechanical grinding, polishing and electropolishing. Electropolishing of the specimen was carried out at 85–110 °C and a voltage of 10–30 V in electrolyte of the following composition: 500 mL of H3PO4, 300 mL of H2SO4, 50 g of CrO3 and 50 mL of H2O.
An image with a magnification sufficient to calculate the phase fraction was taken using a backscattered electron detector. In order to effectively count phases, the image was made with maximum contrast until the “noise” points appeared. The ImageJ program (1.52u, National Institutes of Health, Wayne Rasband (NIH), WI, USA) was used to process the image to the desired contrast of the aluminum matrix and secondary phases. Ten surveys were carried out for each case to collect statistics, which was necessary for more accurate determination of the size and distribution of the secondary phase particles.
The texture measurements in the form of X-ray pole figures were carried out on the samples, which were cut from the middle planes along the thickness of the workpiece. The survey plane of the pole figures was parallel to the rolling plane. The texture in the form of four incomplete pole figures, namely {111}, {200}, {220} and {311}, was investigated by the “reflection” method using a DRON-7 X-ray diffractometer (Bourevestnik, JSC, Saint-Petersburg, Russia) in CoKα radiation. Ranges of the inclination angles α (0 ÷ 70°) and rotation angle β (0 ÷ 360°) with steps α and β = 5° were used, measured by 1 sample for a given state of the material. The drop in intensity at the peripheral part of the pole figure due to the defocusing effect was corrected using correction coefficients calculated based on the conditions of the X-ray photography of the pole figures. The orientation distribution function (ODF) was calculated from the measured pole figures, representing a superposition of a large number (2000) of standard distributions with the same small scattering. This ODF was also used to calculate the full pole figures and inverse pole figures for three mutually perpendicular directions in the sample: the direction of the normal to the rolling plane (ND), the direction of rolling (RD) and the transverse direction (TD).
In addition, using the data obtained during the experiments on the number of large and fine particles of the second phase, we simulated the evolution of the crystallographic structure for the thermomechanical rolling modes shown in Table 3 using the models previously developed by the authors [29,33,34]. At the same time, the data on the fragmentation of the intermetallic particles were introduced into the model (see Section 3.3). The data for the number of fine particles of the second phase, depending on the thermomechanical modes were taken from [19,35].

3. Results and Discussion

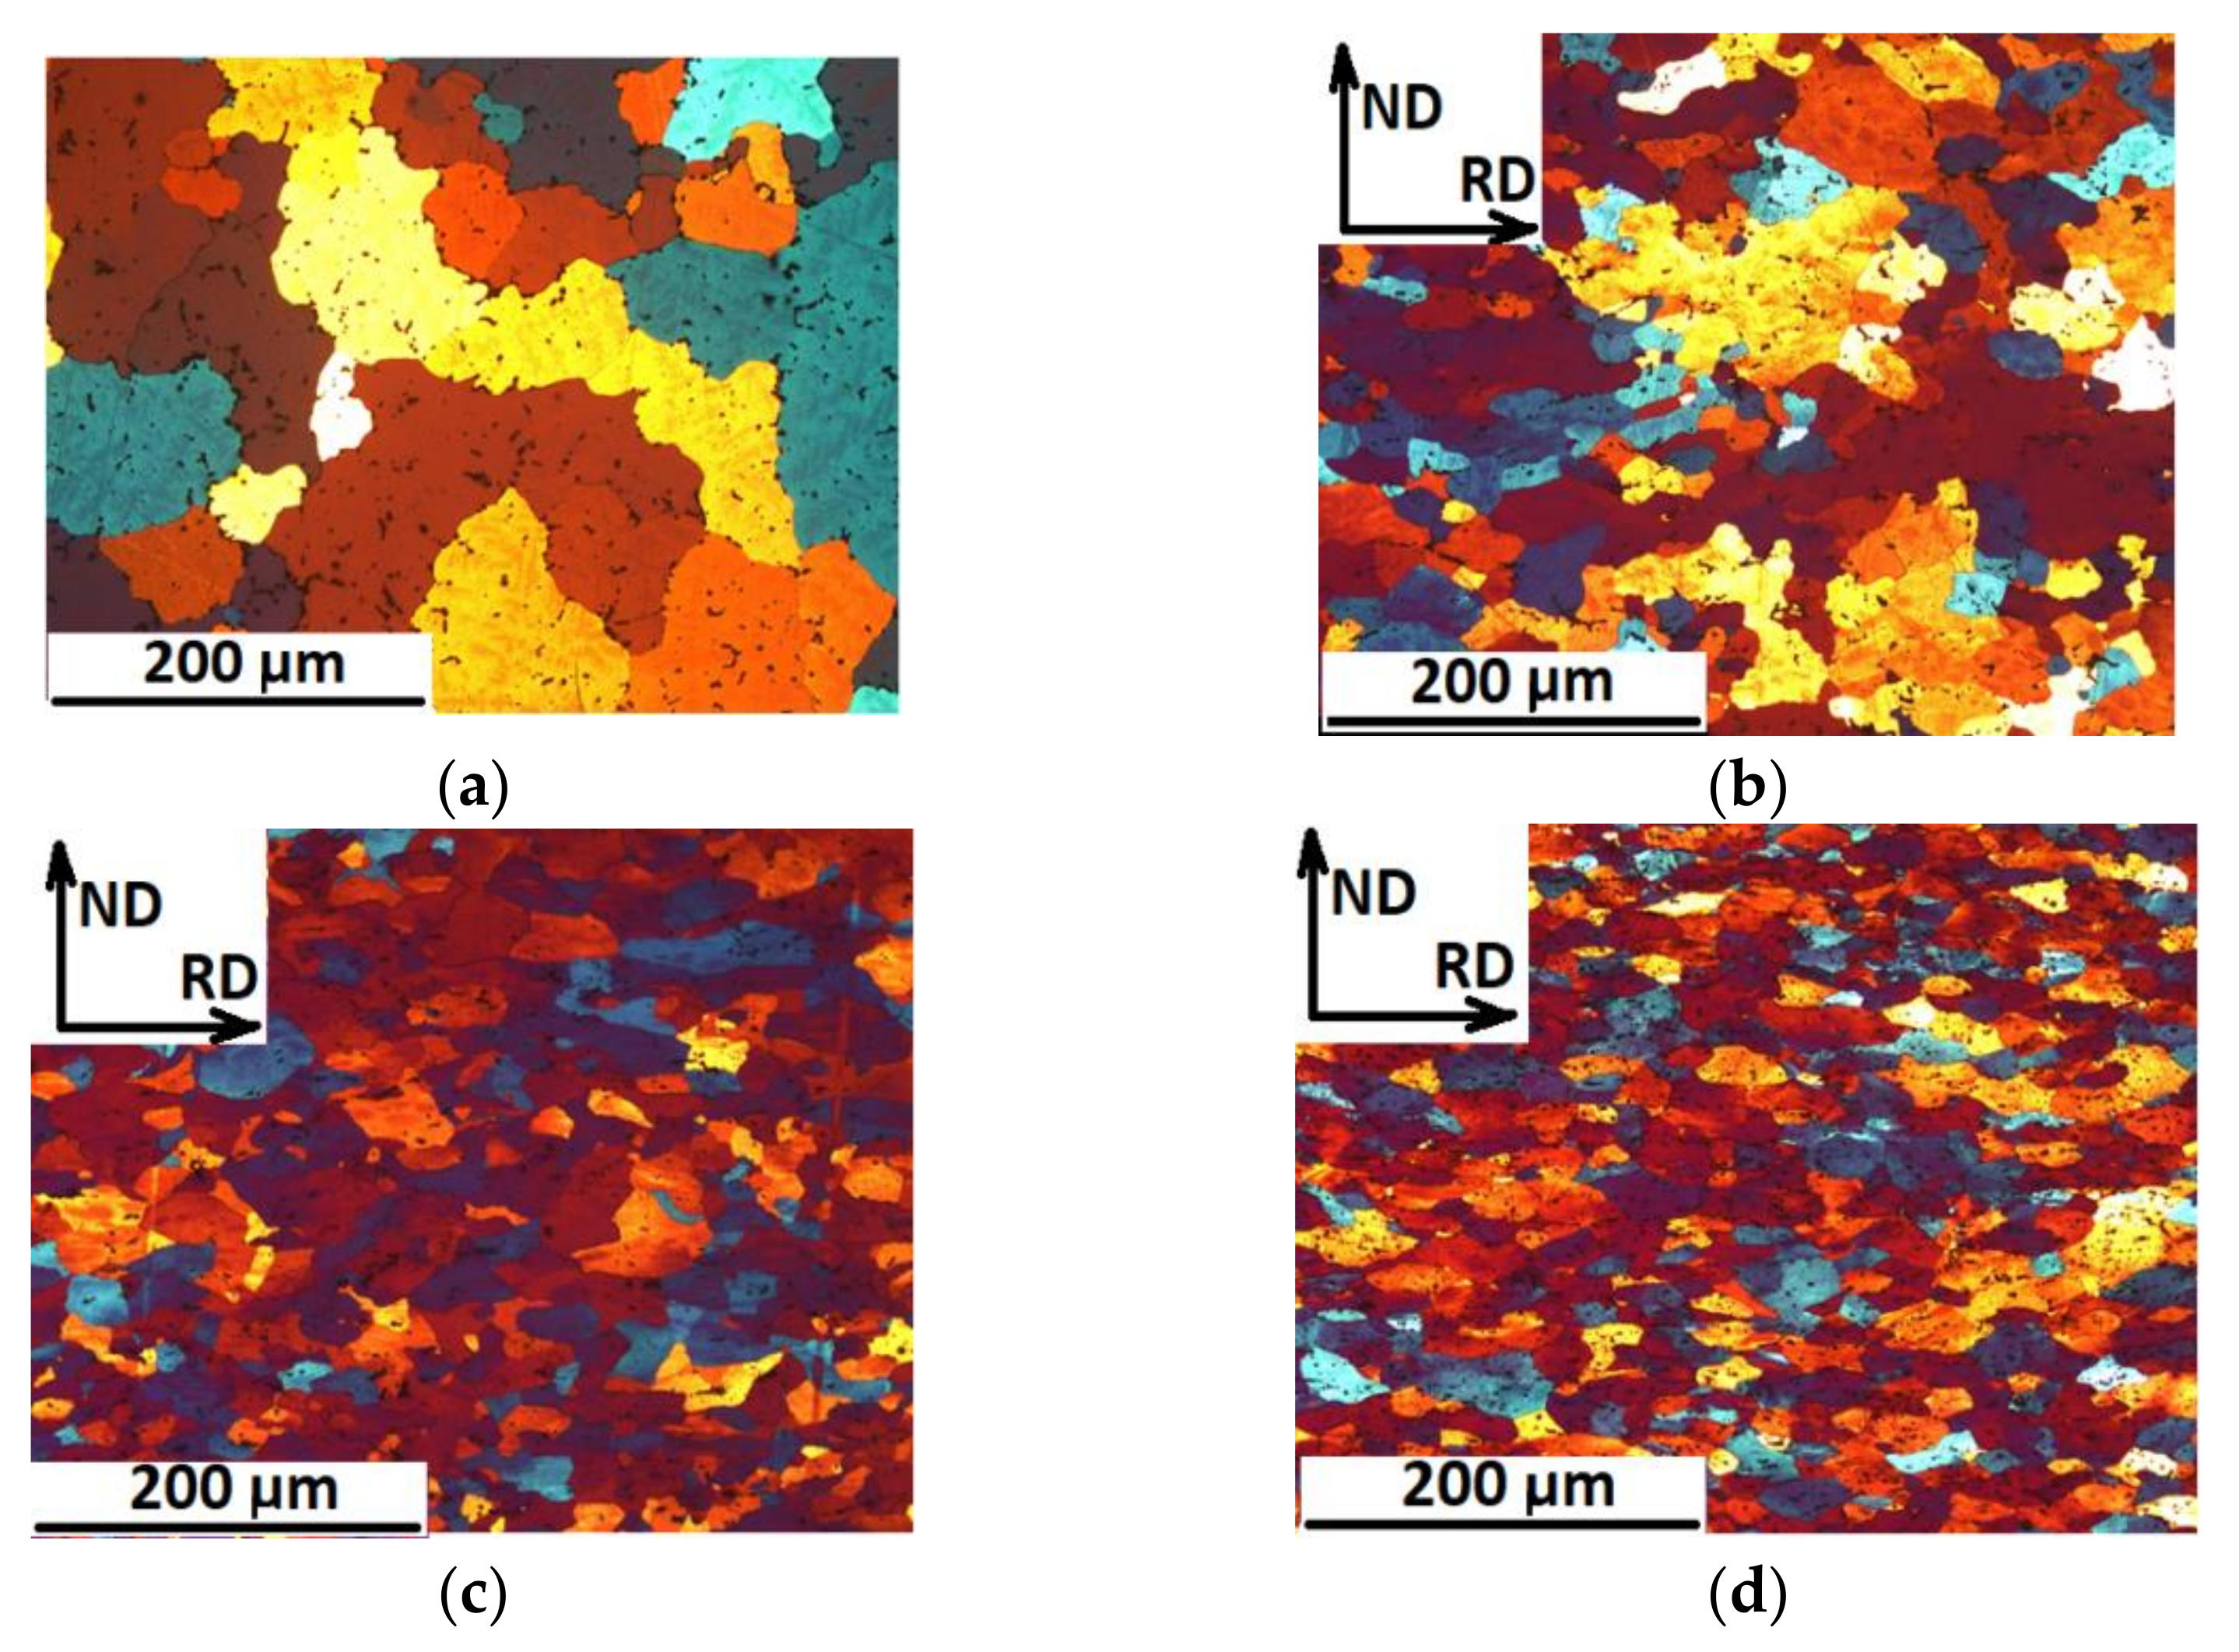
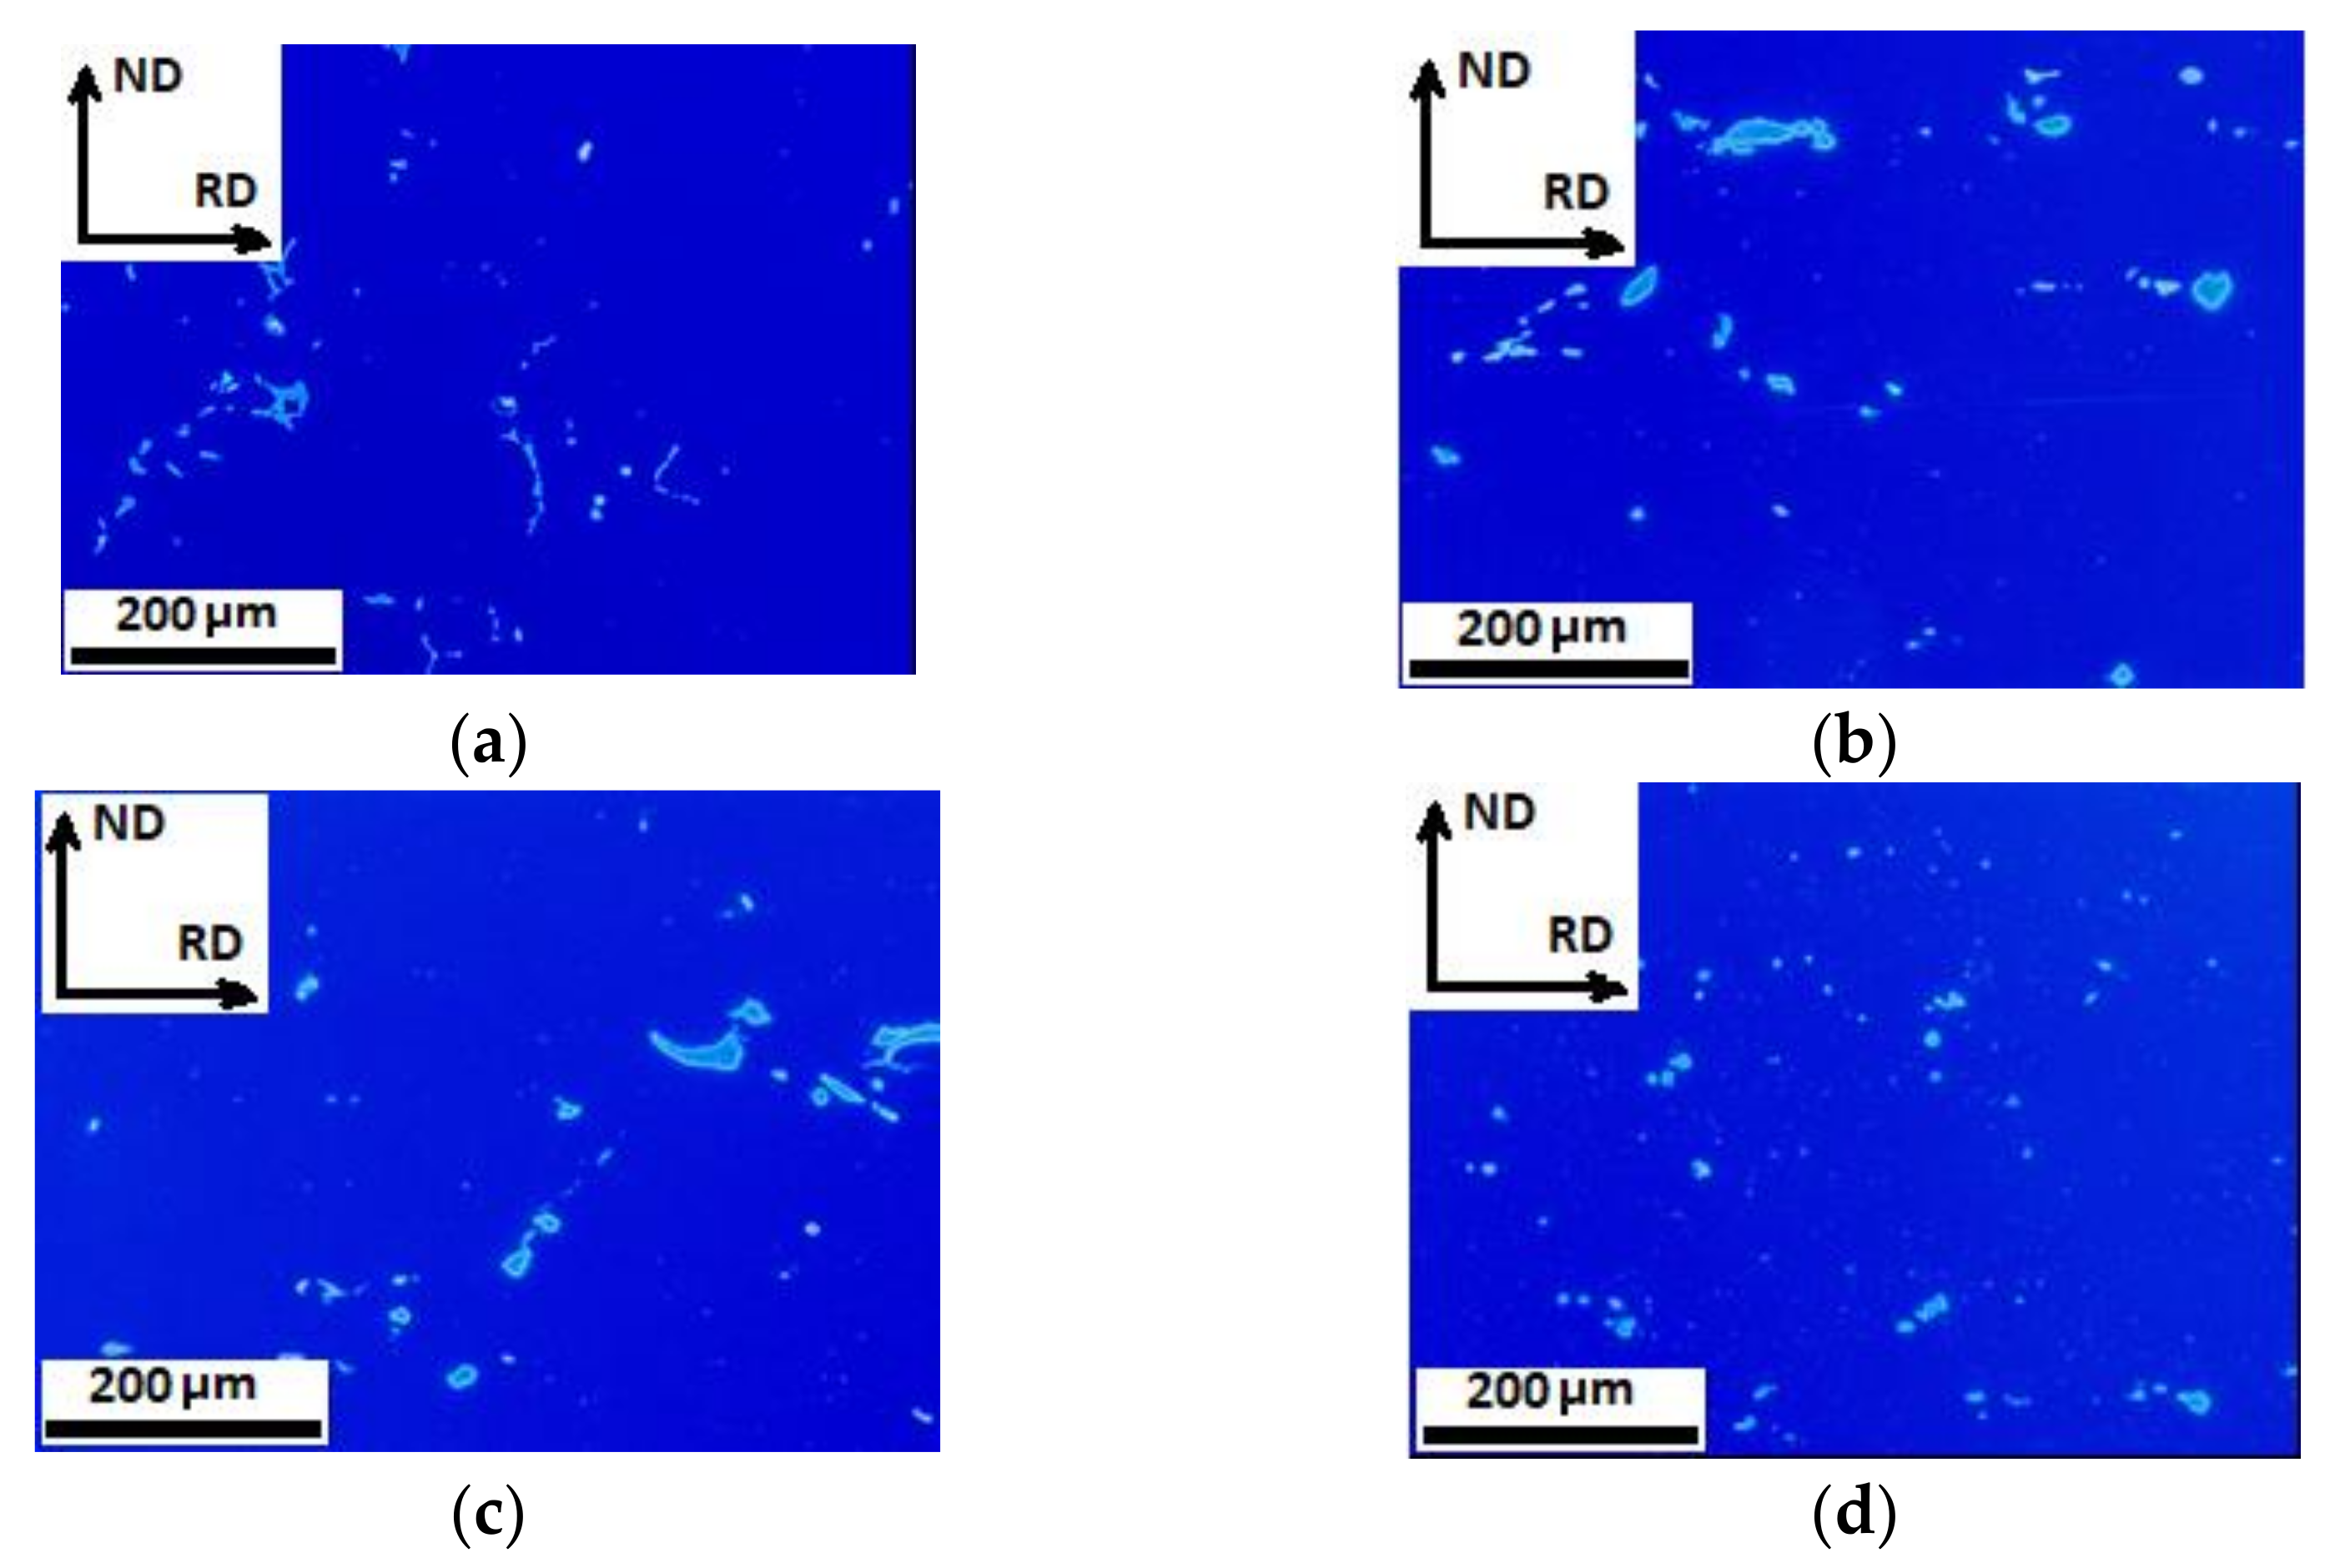
3.1. Optical Microscopy Data

Figure 2, Figure 3 and Figure 4 show the evolution of the grain structure during the processing of the as-cast structure.
The results for 5182 alloy are shown in Figure 2. In the as-cast state, this alloy had a dendritic structure with a grain size of 300 µm, which is typical for aluminum alloys at the given casting speed and without modifying elements such as Sc, Ti, Nb, etc. In the second pass the dendritic structure started to stretch, and the first signs of recrystallization in the form of individual grains appeared. Note that the high magnesium content greatly accelerated recrystallization, which began immediately after the completion of rolling (the time from the end of deformation to the fixation of the structure by quenching is 1 s). The possibility of dynamic recrystallization should also be excluded, since the deformation rate in this case (see Table 2) significantly exceeded the value at which the latter was observed [36,37]. As the deformation increased, the dendritic structure was completely replaced by the recrystallized structure (Figure 2c). In this case, one could observe larger grains with a size of 70 μm, which appeared after 33.23% deformation and a subsequent inter-deformation pause, and after 68.47% deformation of new grains with a size of 30 μm. The structure continued to refine after the next step of deformation, and the grains of the “first generation”, having a size of 70 µm, completely disappeared. There were grains of the “second generation” with a size of 40 μm and grains formed after 83.83% deformation with a size of 25 μm. Thus, recrystallization in this alloy began at the earliest stage of deformation and was very intense. The grain size was constantly refined during recrystallization. Therefore, the dendritic structure was fully destroyed by the second pass.
The results for 1565 alloy are shown in Figure 3. Recrystallization began during the deformation pause after 32.2% deformation (Figure 3b). However, the size and fractions of new grains were not large, which, as is shown below, was associated with the deceleration of the grain boundary motion by Zener-drag due to fine particles. Note that based on the position of the new grains (which are mainly located inside the old dendritic ones), these nuclei were particles of the second phase that began to play the role of recrystallization nuclei, because they accumulated dislocation pile-ups and related imperfections around them more actively. The dendritic structure gradually began to stretch. After increasing the deformation ratio to 67.13%, the dendritic structure continued to stretch in the direction of deformation. In this case, a greater number of underdeveloped grains appeared. This was due to the fact that the number of the structural imperfections increased and the deformation energy increased. However, it was still insufficient to achieve full recrystallization. At 83.53% deformation, the dendritic structure finally disappeared, giving way to the deformed one. However, complete recrystallization was still not observed.
The alloy 8011 behaved differently than the two magnesium containing alloys. Firstly, it also began to gradually stretch in the deformation direction of the dendritic cast structure. The greater the deformation ratio, the more elongated grains were observed. However, recrystallization in 8011 alloy was observed already when reaching 29.82% deformation (Figure 4b). The first newly formed equiaxed grains were observed immediately after the completion of deformation. After reaching 63.16% (Figure 4c) deformation and exposure to air, a significant amount of partial recrystallization was also observed. After 80.70% deformation (Figure 4d) and exposure to air, recrystallization was almost complete with only a few large grains remaining in a deformed state.
Note that 8011 alloy was much less prone to recrystallization than 5182, which happened in 5182 AA because the large content of magnesium dissolved in the aluminum matrix inhibited the movement of dislocations. Thereby the rate of the recovery process in this alloy was decreased [38], and its competition with the recrystallization process was also reduced. Therefore, the recovery did not counteract recrystallization and did not slow it down in the 8011 alloy. At the same time, there were significantly fewer fine particles of the second phase in 8011 alloy than in 1565 alloy. Therefore, recrystallisation was not completely inhibited in this alloy.

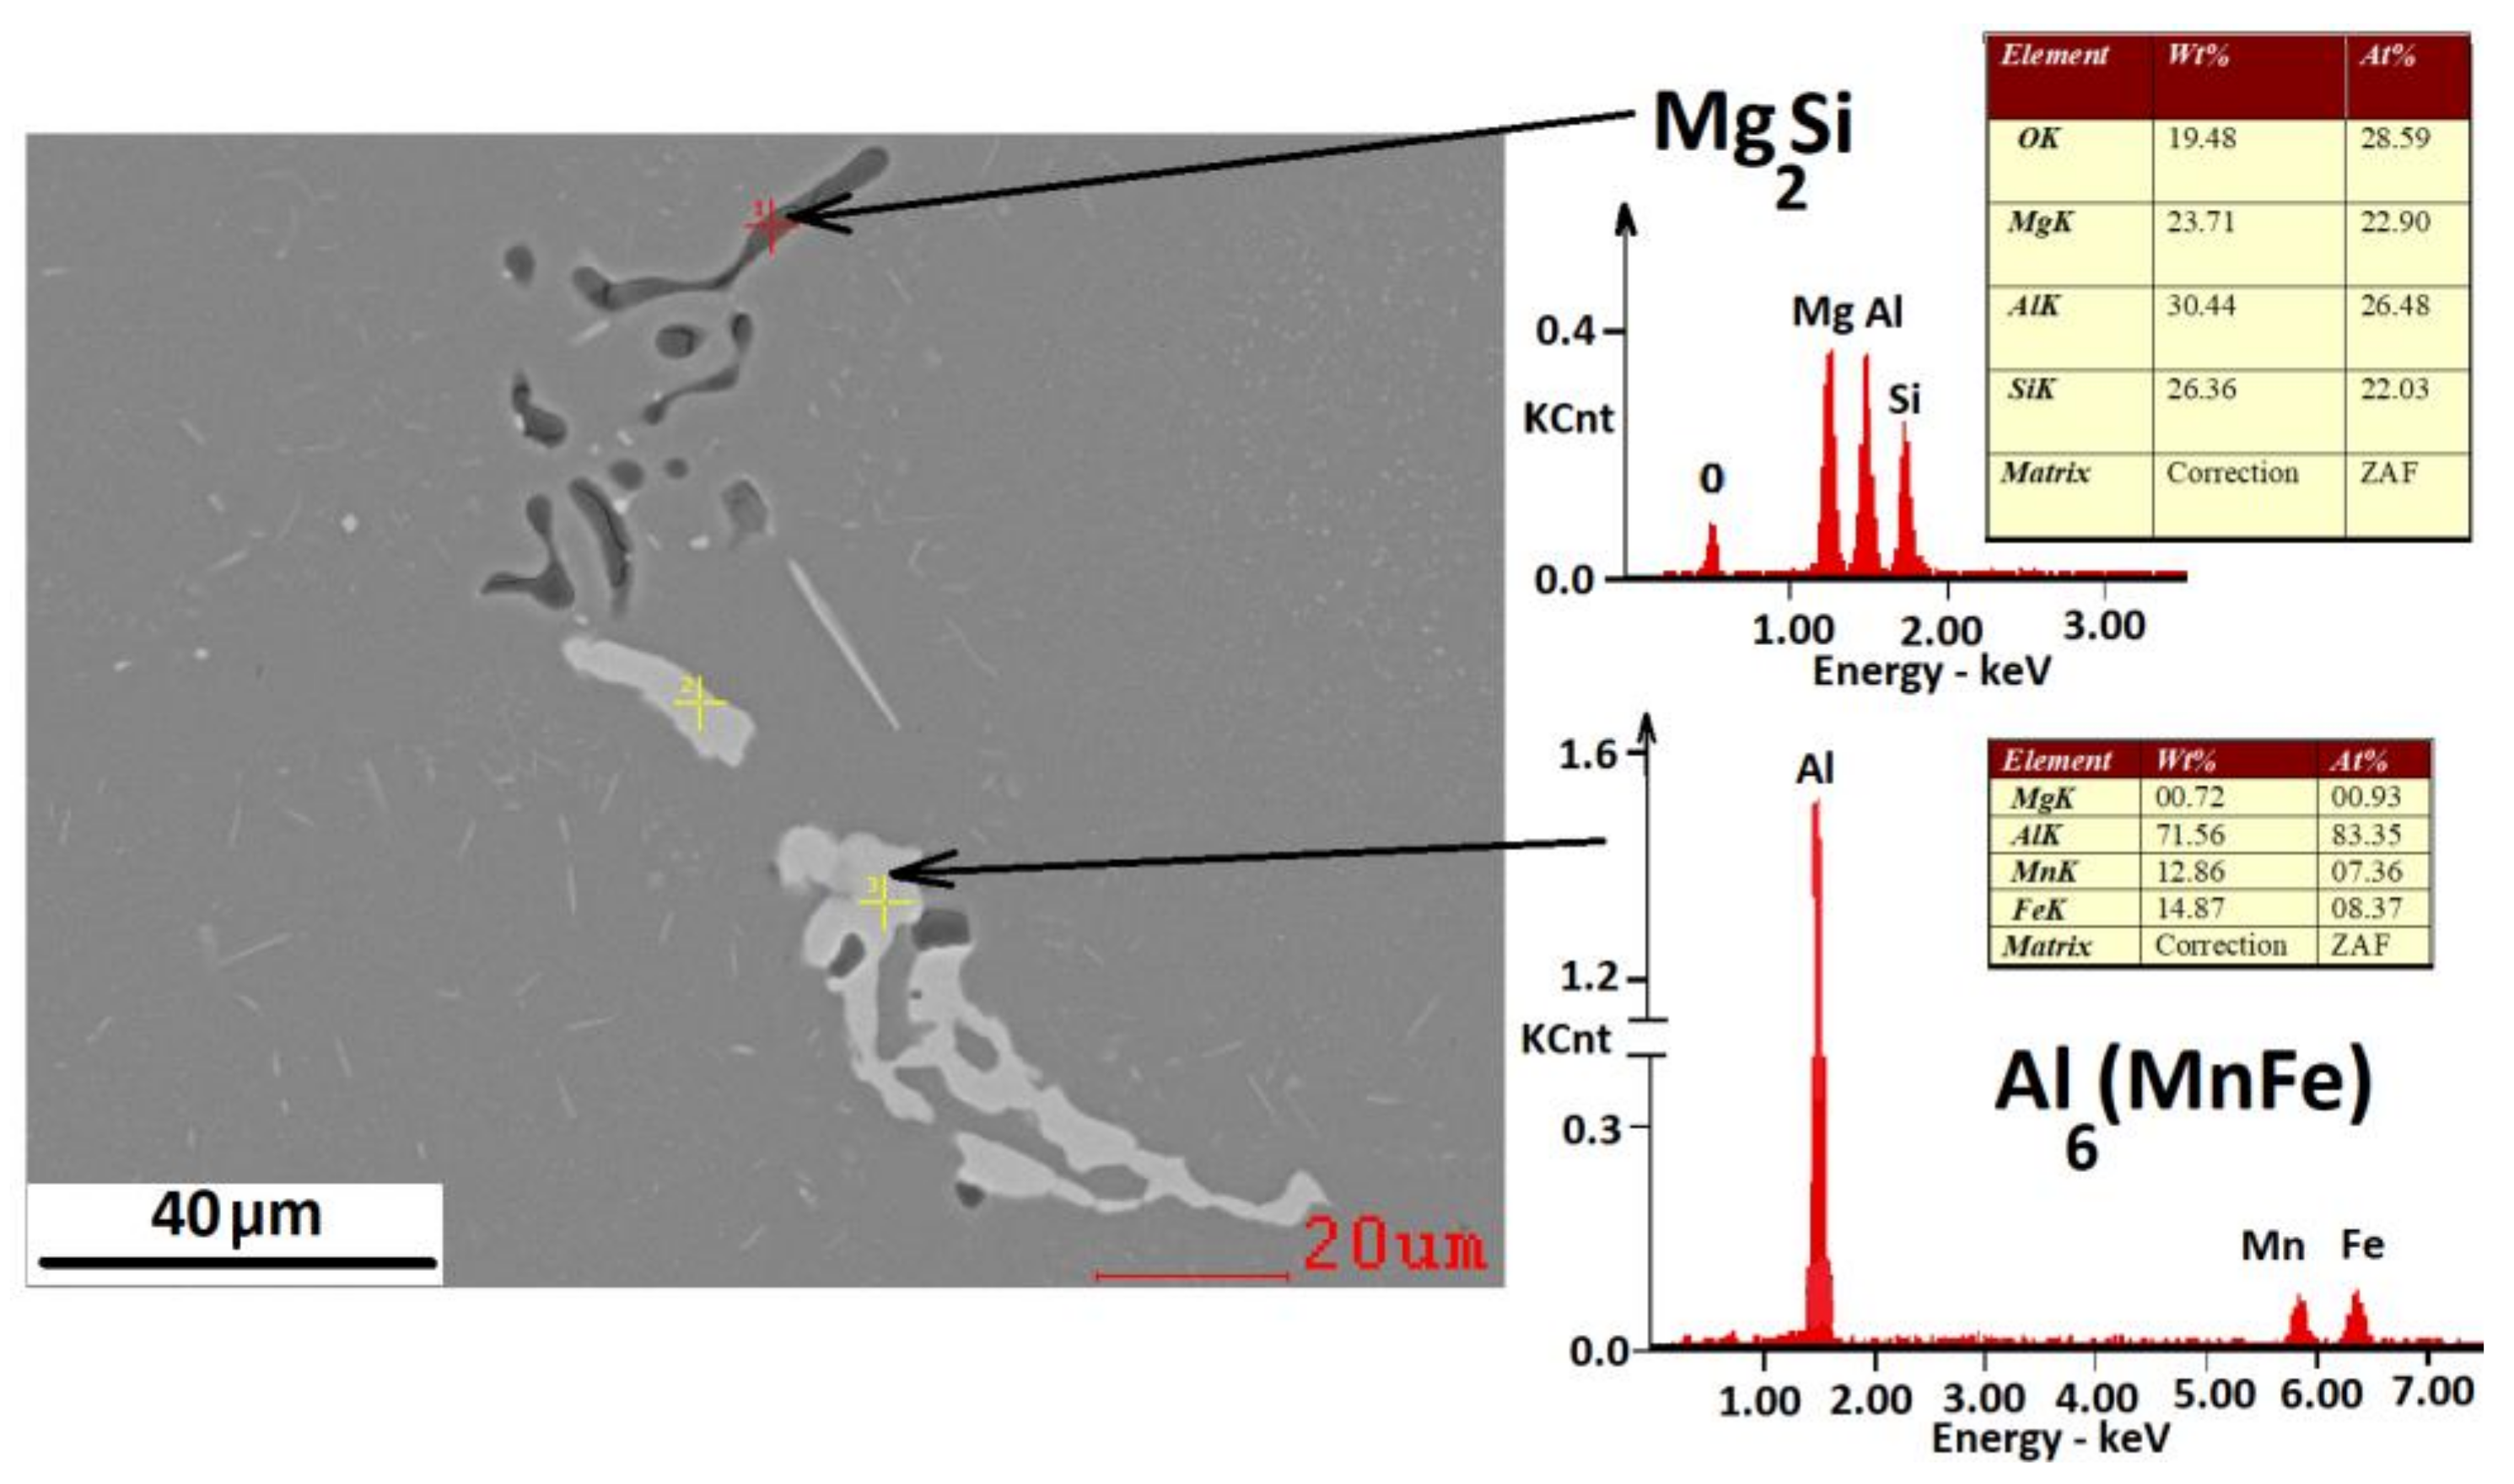
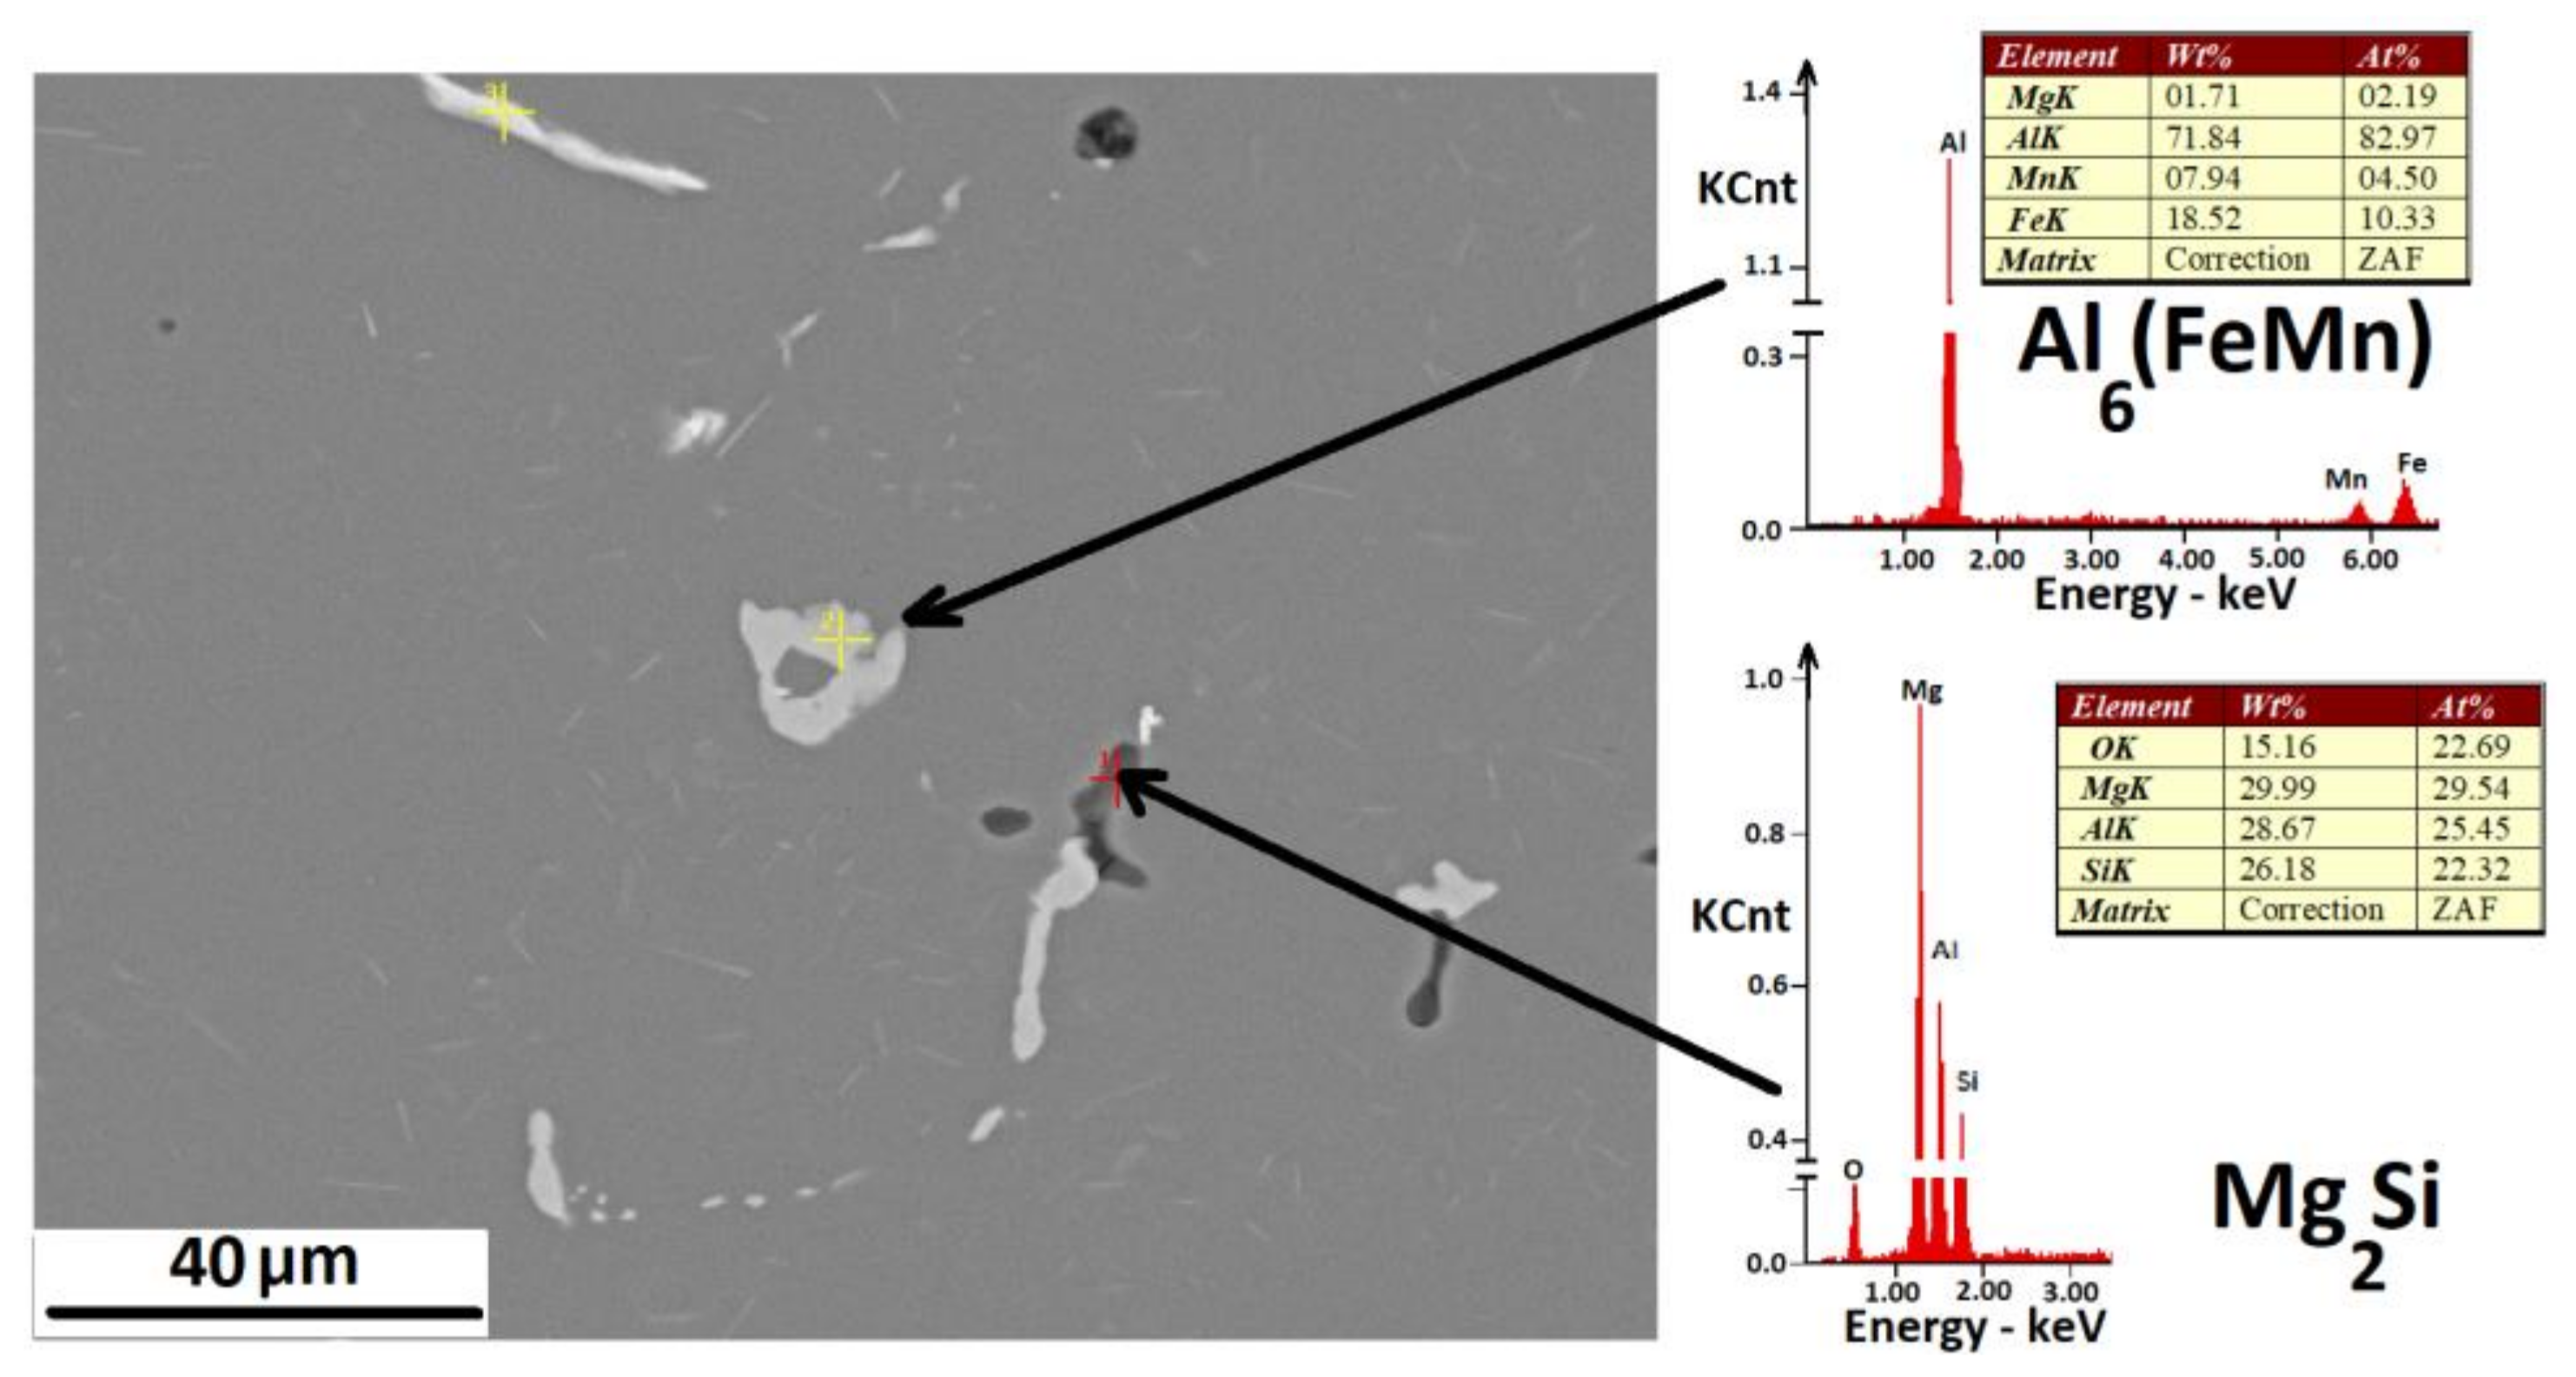
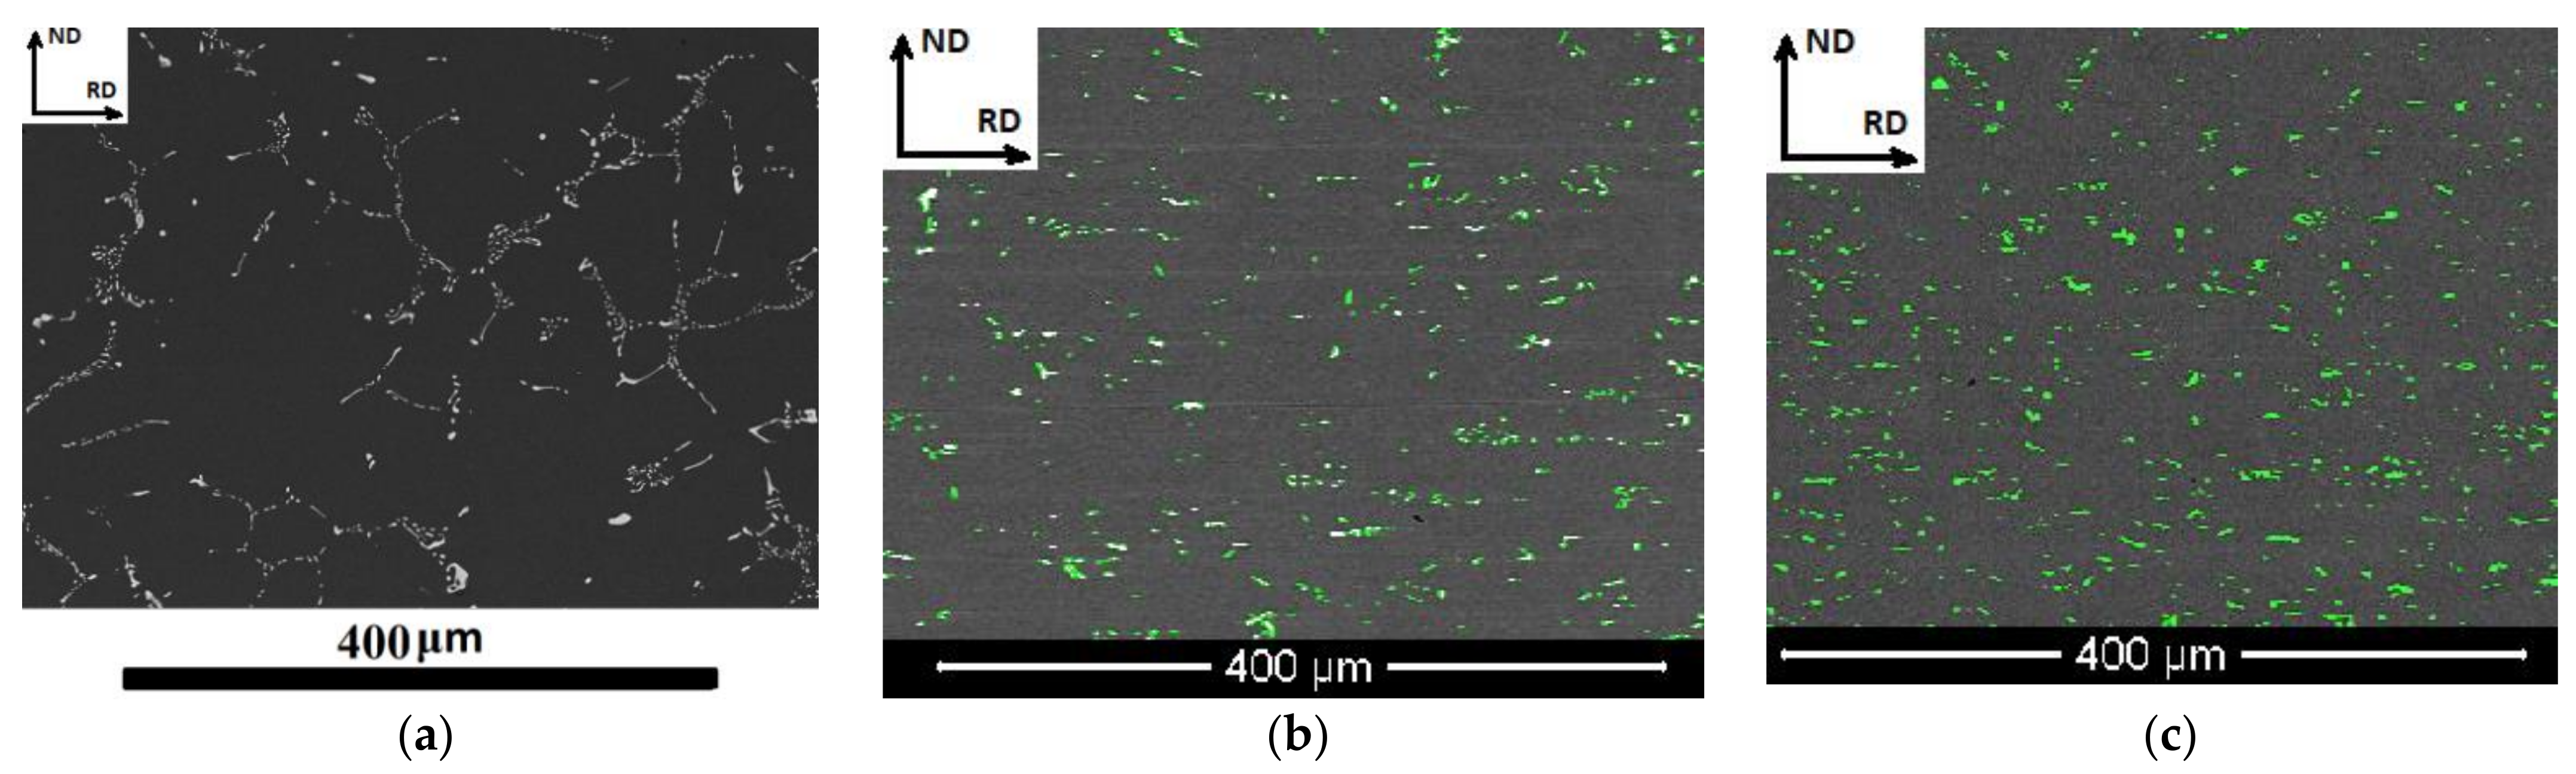
3.2. Electron Microscopy Data

Figure 5, Figure 6 and Figure 7 show micrographs of samples etched for 2nd phase detection.
After homogenization, 5182 alloy exhibited a characteristic structure of intermetallic compounds of acicular and more complex morphology with rather large dimensions, which is characteristic and repeatedly observed [22,23] for such conditions. At the next step, after 33.2% deformation (Figure 5a), the intermetallic compounds of complex shape were stretched in the rolling direction and crushed. The acicular particles became thinner and separated into parts, forming chains. After the next step and 68.47% (Figure 5c) deformation, the intermetallic compounds continued to fragment, but the overall picture did not change radically. The intermetallic compounds decreased by 3–5 times at the final stage of working the as-cast structure with 83.83% (Figure 5d) deformation, while the chains of the intermetallic compounds remained after the destruction of particles with acicular morphology.
The 1565 alloy contained much more intermetallic compounds, and, in general, they had similar dimensions and morphology to those observed in the 5182 alloy. At 32.2% (Figure 6b) deformation, they began to stretch in the direction of the aluminum matrix, and the fragments began to separate. However, the reduction ratio was much less than in the 5182 alloy. At 67.13% (Figure 6c) deformation, they continued to elongate and form chains of intermetallic compounds. At the final stage with 83.53% (Figure 6d) deformation, their sizes could be compared with those observed in the 5182 alloy.
The microstructural features observed in alloy 8011 differed significantly from those observed in the 5182 and 1565 Al–Mg alloys. The 8011 alloy initially contained larger intermetallic compounds, which were located very clearly along the boundaries of dendrites (Figure 7a). However, in contrast to the two abovementioned alloys, these intermetallic compounds were crushed much faster, and the resulting particles immediately had sizes that were observed for the other two alloys only at the last stages of rolling (Figure 7c,d).
The chemical analysis of the intermetallic particles showed that after homogenization in alloys 1565 (Figure 8) and 5182 (Figure 9), two main types of intermetallic particles remained, namely Al6(FeMn) (light) and Mg2Si (dark). Both types of particles were represented by an elongated, acicular and a more complex morphology. Large intermetallic particles of the beta phase Al3Mg2 were absent in both alloys, since according to most studies, they decompose during homogenization annealing and reappear only at the next stages of thermomechanical treatment in the form of fine particles.
In general, the results of electron and optical microscopy for the 5182 alloy were in good agreement with each other. For example, large intermetallic compounds up to 100 μm in size with various shapes and morphologies were observed in the homogenized state of the 5182 alloy (Figure 10a). Their average radius was 3.85 μm, and the total volume was 3.35%. The results of electron microscopy also showed that during further rolling, the particles were pulled in the deformation direction and fragmented into chains. The average size of the intermetallic compounds decreased with each deformation step. At 32.2% deformation, their average radius was 2.5 μm (Figure 10b), and after reaching 83.53%, it decreased to 2 μm (Figure 10c).
Two types of large intermetallic compounds, namely Al6(FeMn) and Mg2Si, were also observed in the homogenized 1565 alloy (Figure 11a). The intermetallic compounds themselves were larger; their average size was 4.4 μm and they occupied up to 4.8% of the total volume. It should be noted that there were significantly more Mg2Si particles than in 5182. The patterns obtained using optical and electron microscopy coincided for the deformation scenario of the 1565 alloy. As in the case of the 5182 alloy, the large intermetallic compounds were stretched towards the deformation direction, and their gradual fragmentation occurred with a decrease in size. In this case, after 67.13% deformation (Figure 11b), their average radius was 3 μm and after 83.53% deformation, it was already 1.7 μm (Figure 11c).
Electron microscopy data of alloy 8011 showed that the large intermetallic particles were much larger than those observed in 1565 and 5182. They were also observed along the edges of the dendritic structure in the as-cast state of 8011 alloy (Figure 12a), and they occupied a slightly smaller volume of 2%. However, unlike the two aforementioned alloys, the primary intermetallic compounds began to deteriorate much faster and earlier. Their chains, with an average particle diameter of 2.47 μm, were observed even at 63.16% deformation (Figure 12b). Their average diameter became 2.07 μm upon reaching 80.70% (Figure 12c) deformation. In all considered cases, the volume of the second phase particles did not exceed 2%.
It should also be noted that the most particles observed in the 8011 alloy were the particles of the Al12Fe3Si type (Figure 13), which are characteristic for this group of alloys.

3.3. Calculation of Changes in the Amount and Size Distribution of Intermetallic Compounds Depending on the Deformation Ratio

In order to use the results of electron and optical microscopy for simulation of the texture evolution, it was necessary to calculate the density distribution by size and total number of particles depending on deformation ratio. Due to the distinction in the chemical composition of the investigated alloys, it was practically impossible to hot roll them both with exactly the same degrees of deformation. As result, when all alloys were compared, it was not the relative deformation that was given, but rather the approximate values of its logarithmic degree.
Figure 13 shows the particle size distribution for all three alloys under investigation after homogenization and logarithmic deformations 0.4 and 1.8. Analyzing Figure 14, it can be concluded that the distribution of the intermetallic compounds in all three materials could be described by an exponential law, which is typical for aluminum alloys [20,29,34]. The distribution of the intermetallic particles, which followed the exponential law, was also observed in all studied alloys at any deformation ratio. For example, at the final stage of deformation (Figure 14c), the largest number of particles in 8011 alloy had a size of 1.4 μm; however in a homogenized state, it reached 13 μm. In this case, for example, at 1.8 logarithmic deformation rate, the number of intermetallic particles in the range from 1 to 5.5 μm was less in the 8011 alloy than in the other alloys. In terms of the number of intermetallic compounds with dimensions larger than 5.5 μm, the 8011 alloy occupied the middle position between 5182 and 1565. In the 5182 alloy, the largest number of the intermetallic compounds was between 1.5 and 6 μm. In the 1565 alloy, the number of intermetallic compounds exceeded their content in the other two alloys if their sizes were greater than 2.5 μm. In general, the intermetallic compounds of the 1565 alloy were larger than in the other two.
For each alloy, there is a certain minimum size of the intermetallic particles, designated as δint0. Then, the distribution density in all cases shown in Figure 14 is expressed by the well-known Equation (1) [29,32,39].
P δ i n t = N i n t e x p L δ i n t δ i n t 0
The total number of the intermetallic compounds is equal to the integral of the distribution density P(δint), i.e., the areas under the distribution curves. The number of PSN particles by size distribution is as follows (2):
N P S N = C P S N N 0 e x p L η * δ i n t
where
N 0 = N i n t L is a total number of particles,
The critical size is calculated as follows (3):
η * = 2 γ B P D P Z
The intermetallic compounds change their size distribution parameters Nint, L and δint0, depending on the alloy and the deformation ratio, which is listed in Table 5. Note that linear interpolation of the data given in Table 5 was used in the simulation when calculating the intermediate values.
The size of intermetallic particles spread over their domain according to gamma distribution. The probability distribution function is represented in Figure 15 for as cast and variably deformed samples for 1565 alloy. Figure 14 clearly shows how the size and amount of intermetallic compounds change depending on the deformation ratio obtained by the 1565 alloy when it is hot worked from the as-cast state. It can be seen that the largest number of particles had a size of 15 µm in the as-cast state, and at a deformation ratio of 1.8 it was reduced to 2.5 µm. It should be noted that such fragmentation will cut both ways. On the one hand, the more particles of the second phase, the higher the chance of nucleation. On the other hand, the number of particles increases during fragmentation.

3.4. Modeling the Texture Formation Process

To study the effect of intermetallic fragmentation on the evolution of the texture in more detail, mathematical modeling was carried out for the modes listed in Table 2, Table 3 and Table 4.
Before proceeding to the evolution of the texture components in specific alloys, it is necessary to note a general pattern, that the volume recrystallized according to PSN has a pronounced maximum. This is explained by the fact that the average particle size is higher at smaller deformations, but the number of particles is smaller. Therefore, there are not so many centers for activating the PSN mechanism. As the deformation ratio increases, the diameter of particles decreases. On the one hand, it decreases their ability to nucleate and, on the other hand, increases the total number of their nuclei. The largest volume of textures formed on PSN particles corresponds to the stage of intermetallic compound fragmentation at which they are still large enough for effective nucleation, but their number is already significant.
It should be noted that Figure 16 describes the scenario at which the entire volume is recrystallized, which, however, does not occur in the 8011 alloy. In addition, it should be noted that Figure 15 does not show the volume of random orientations formed from subgrains at crystallite boundaries and after recrystallization, which also appear in the form of textureless components. The largest amount of the recrystallization volume formed on PSN particles, as expected, was observed in the 1565 alloy (Figure 16a). At the peak values, their volume occupied almost 70%, gradually decreasing to 15%.
The 5182 alloy took an intermediate position, occupying up to 33% of the volume recrystallized according to the PSN method at its peak values (Figure 16b). However, it decreased to 12% upon reaching the logarithmic deformation degree of 1.5. In the 8011 alloy, the volume recrystallized by the PSN mechanism at the peak values was 25%, and it decreased to 9% at 1.5 logarithmic deformation (Figure 16c).
Comparing the data for all three alloys, it can concluded that for alloys with high magnesium content, the volume of recrystallization according to PSN was greater if we took the fragmentation process into account. This is due to the increased number of nuclei at the onset of deformation. Despite the increased number of the new PSN nuclei, their size decreased, and so the calculation showed smaller volumes of the recrystallized material by this mechanism when it took fragmentation into account. At the same time, as follows from the microscopic data, the 8011 alloy exhibited the strongest particle fragmentation. Therefore, a much larger number of recrystallization centers appeared than there was initially. Therefore, the calculations which take fragmentation of the intermetallic compounds into account always result in a large volume recrystallized by the PSN mechanism.
As for the comparison of the calculation with and without taking the fragmentation of intermetallic particles into account, modeling without this factor predicts a constant decrease in the volume of grains recrystallized by the PSN mechanism. This is due to the fact that the number of other nuclei is constantly increasing as the recrystallization structure is developed. In addition, the mechanism of the oriented growth is activated. At the same time, there is no compensation in the form of fragmentation and new nucleation centers.
It is important to consider deformation of the as-cast structure at the early stages and low values of the Zener–Hollomon parameter. The subgrains at such values of the Zener–Hollomon parameter are rather large and have the same size in all alloys, which can be clearly seen from Figure 17 using the data obtained in [19,35]. For plotting the well spread [40,41] in Figure 17, Equation (4) was used. It expresses subgrain size dependence on the Zener parameter for aluminum alloys.
δ s s m = A + B ln Z
  • δ s s m is subgrain size,
  • Z is Zener–Hollomon parameter,
  • m, A, B are evidence-based coefficients.
For 1565 and 5182 the following values of coefficients, namely m = 1, A = 0.0077, B = 0.0059, were taken from [19]. Coefficients m = 1, A = 0.0077, B = 0.0059 were taken for 8011 from [35].
Therefore, in order to see the effect of the subgrain size on the volume of recrystallized volume by the PSN mechanism, rolling with subsequent recrystallization at higher Zener parameters was simulated, taking fragmentation of the intermetallic compounds into account. It should be noted that, according to Figure 18, the subgrain size decreases in all alloys as the Zener–Hollomon parameter increases, thereby giving an additional advantage to the PSN mechanism. In alloys containing high amounts of magnesium, the increased Zener–Hollomon parameter leads to an acute decrease in subgrain size and, consequently, to an increase in the volume for which intermetallic second phase particles serve as nuclei (Figure 18a,b). In the 8011 alloy, the subgrains do not decrease so drastically with an increase in the Zener parameter (Figure 18c). Therefore, the growth of the recrystallized volume for which the particles of the second phase serve as nuclei is not noticeable. We also note that at low deformation ratios, the volume of the recrystallisation cubic and rolling (β-fiber) textures does not depend on the Zener–Hollomon parameter as strongly as at high deformation ratios. This is due to the fact that an insufficient number of nuclei of the cubic and β-fiber texture components is formed during hot rolling of the as-cast structure, even at high values of the Zener–Hollomon parameter. This is caused by the small length of grain boundaries on which they are formed. Another factor is the small volume of the β-fiber textures, which does not enable the oriented growth mechanism.

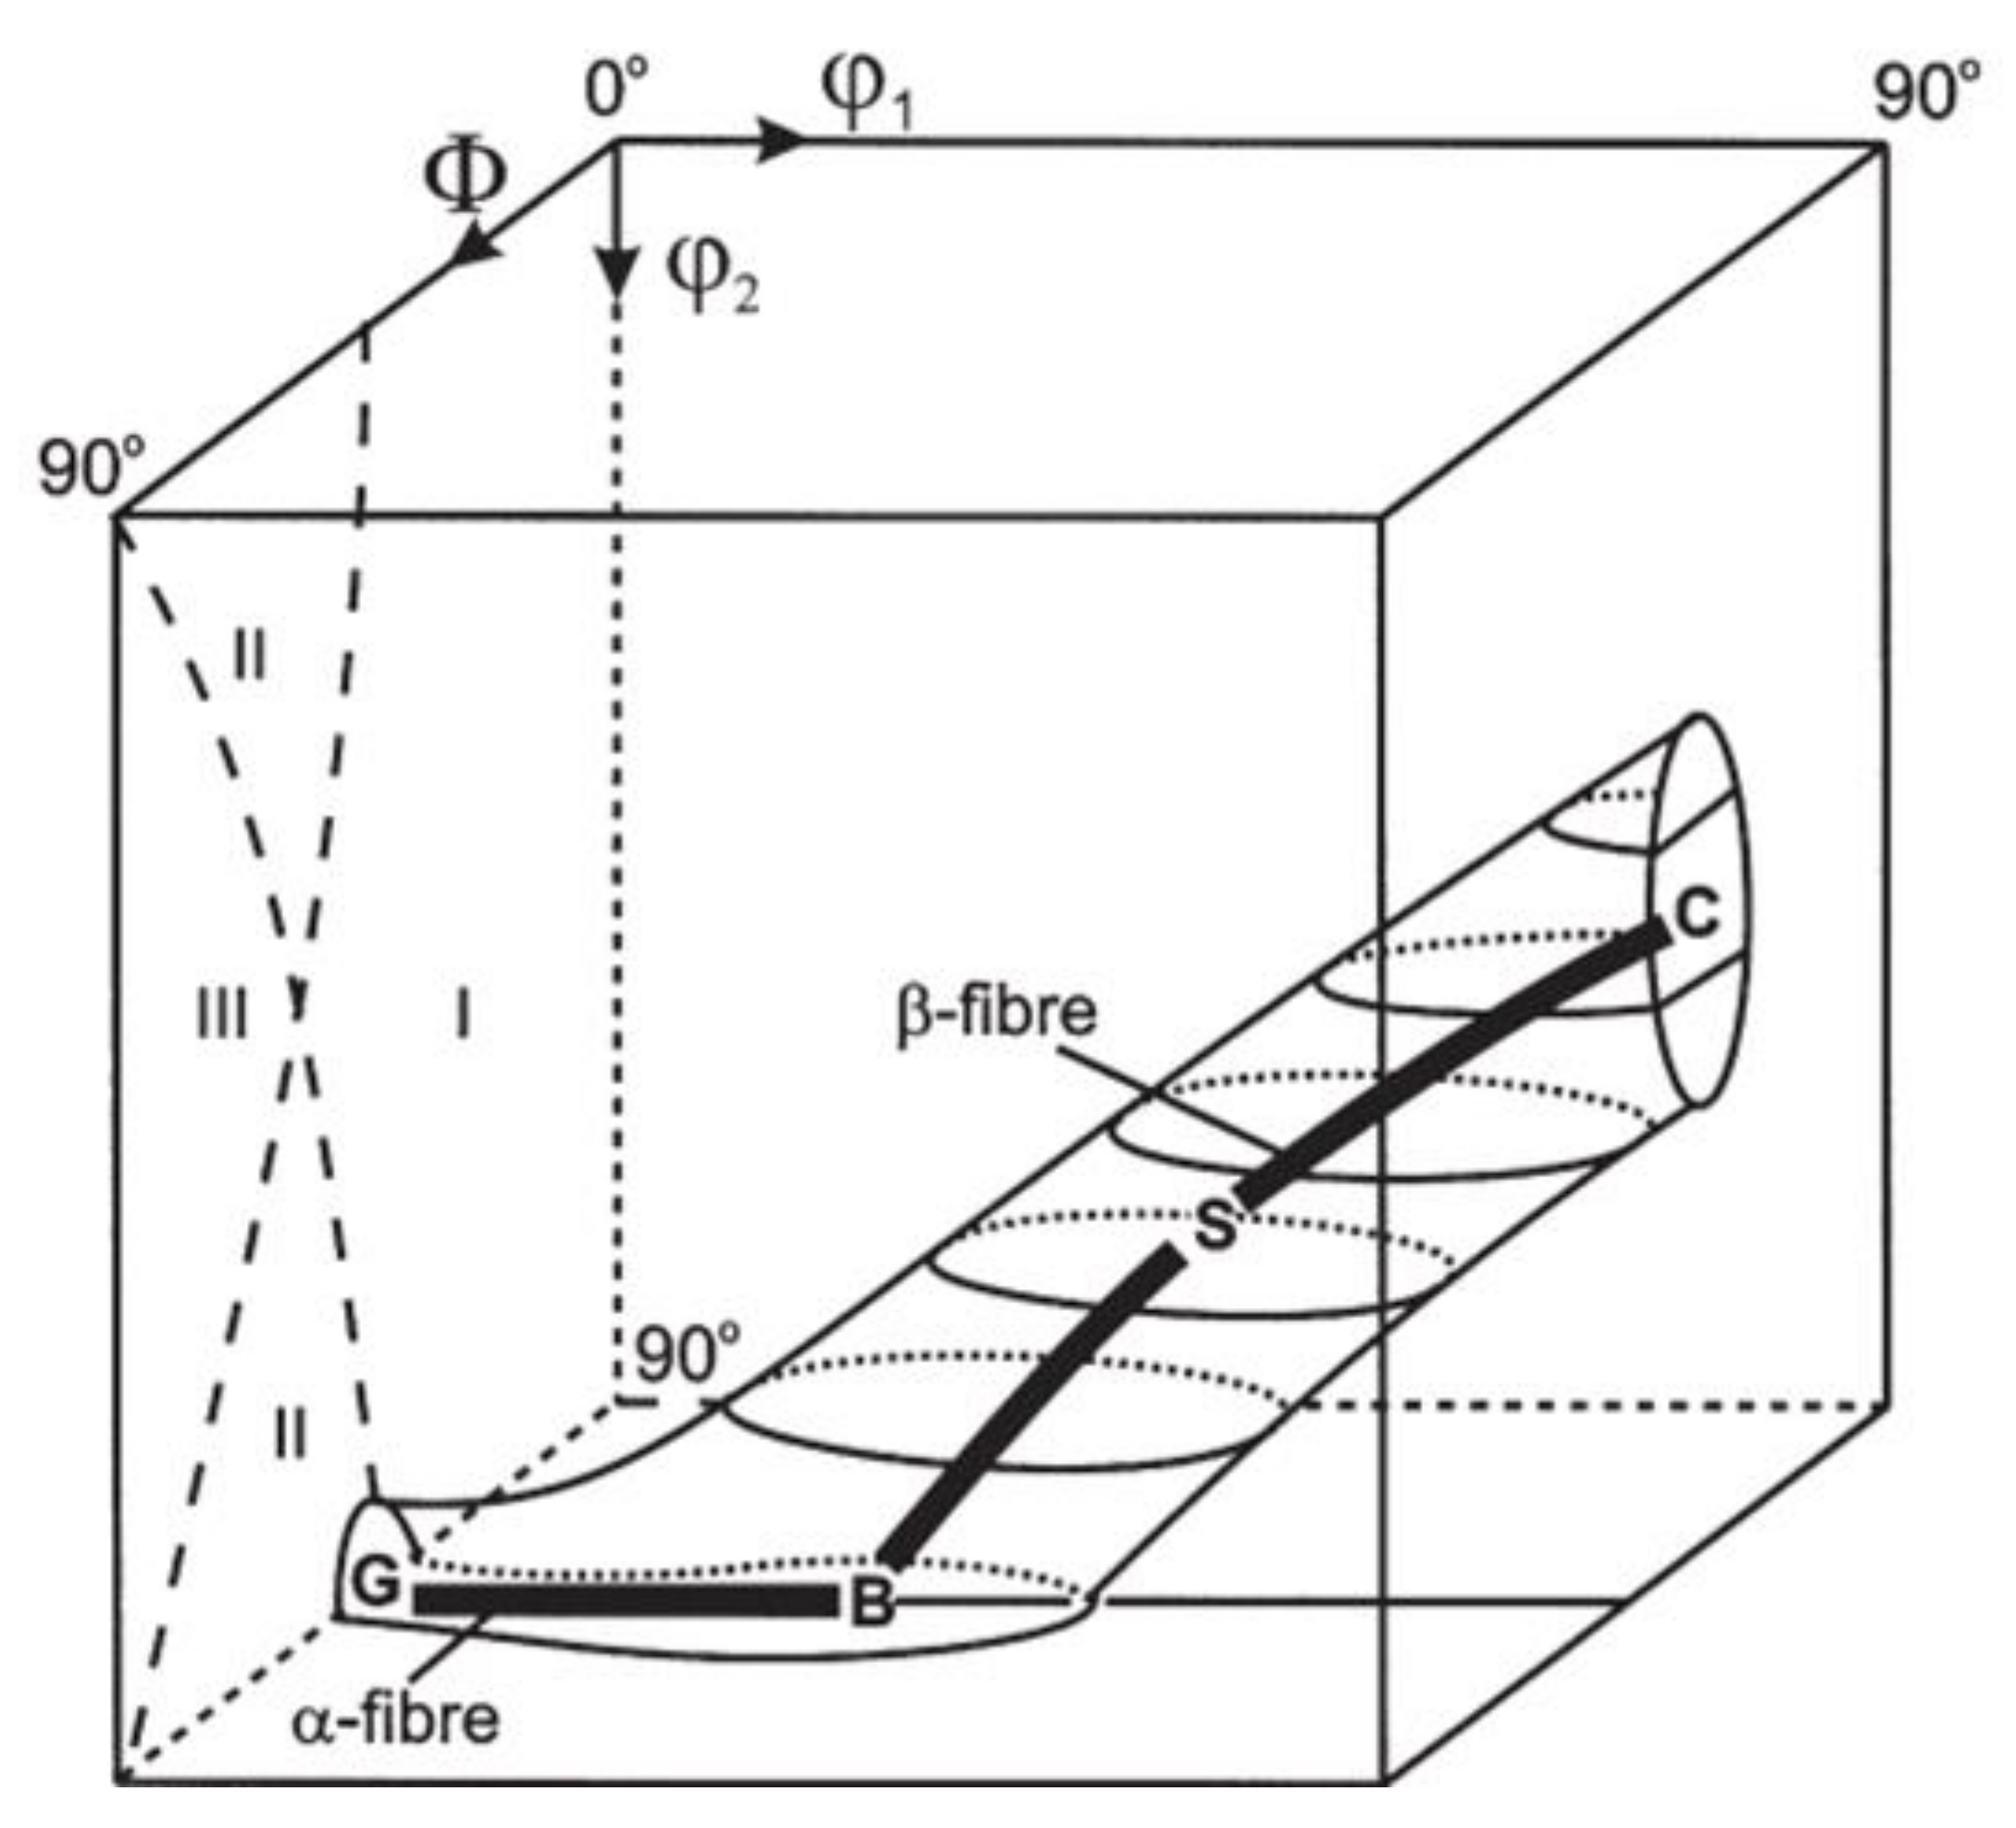
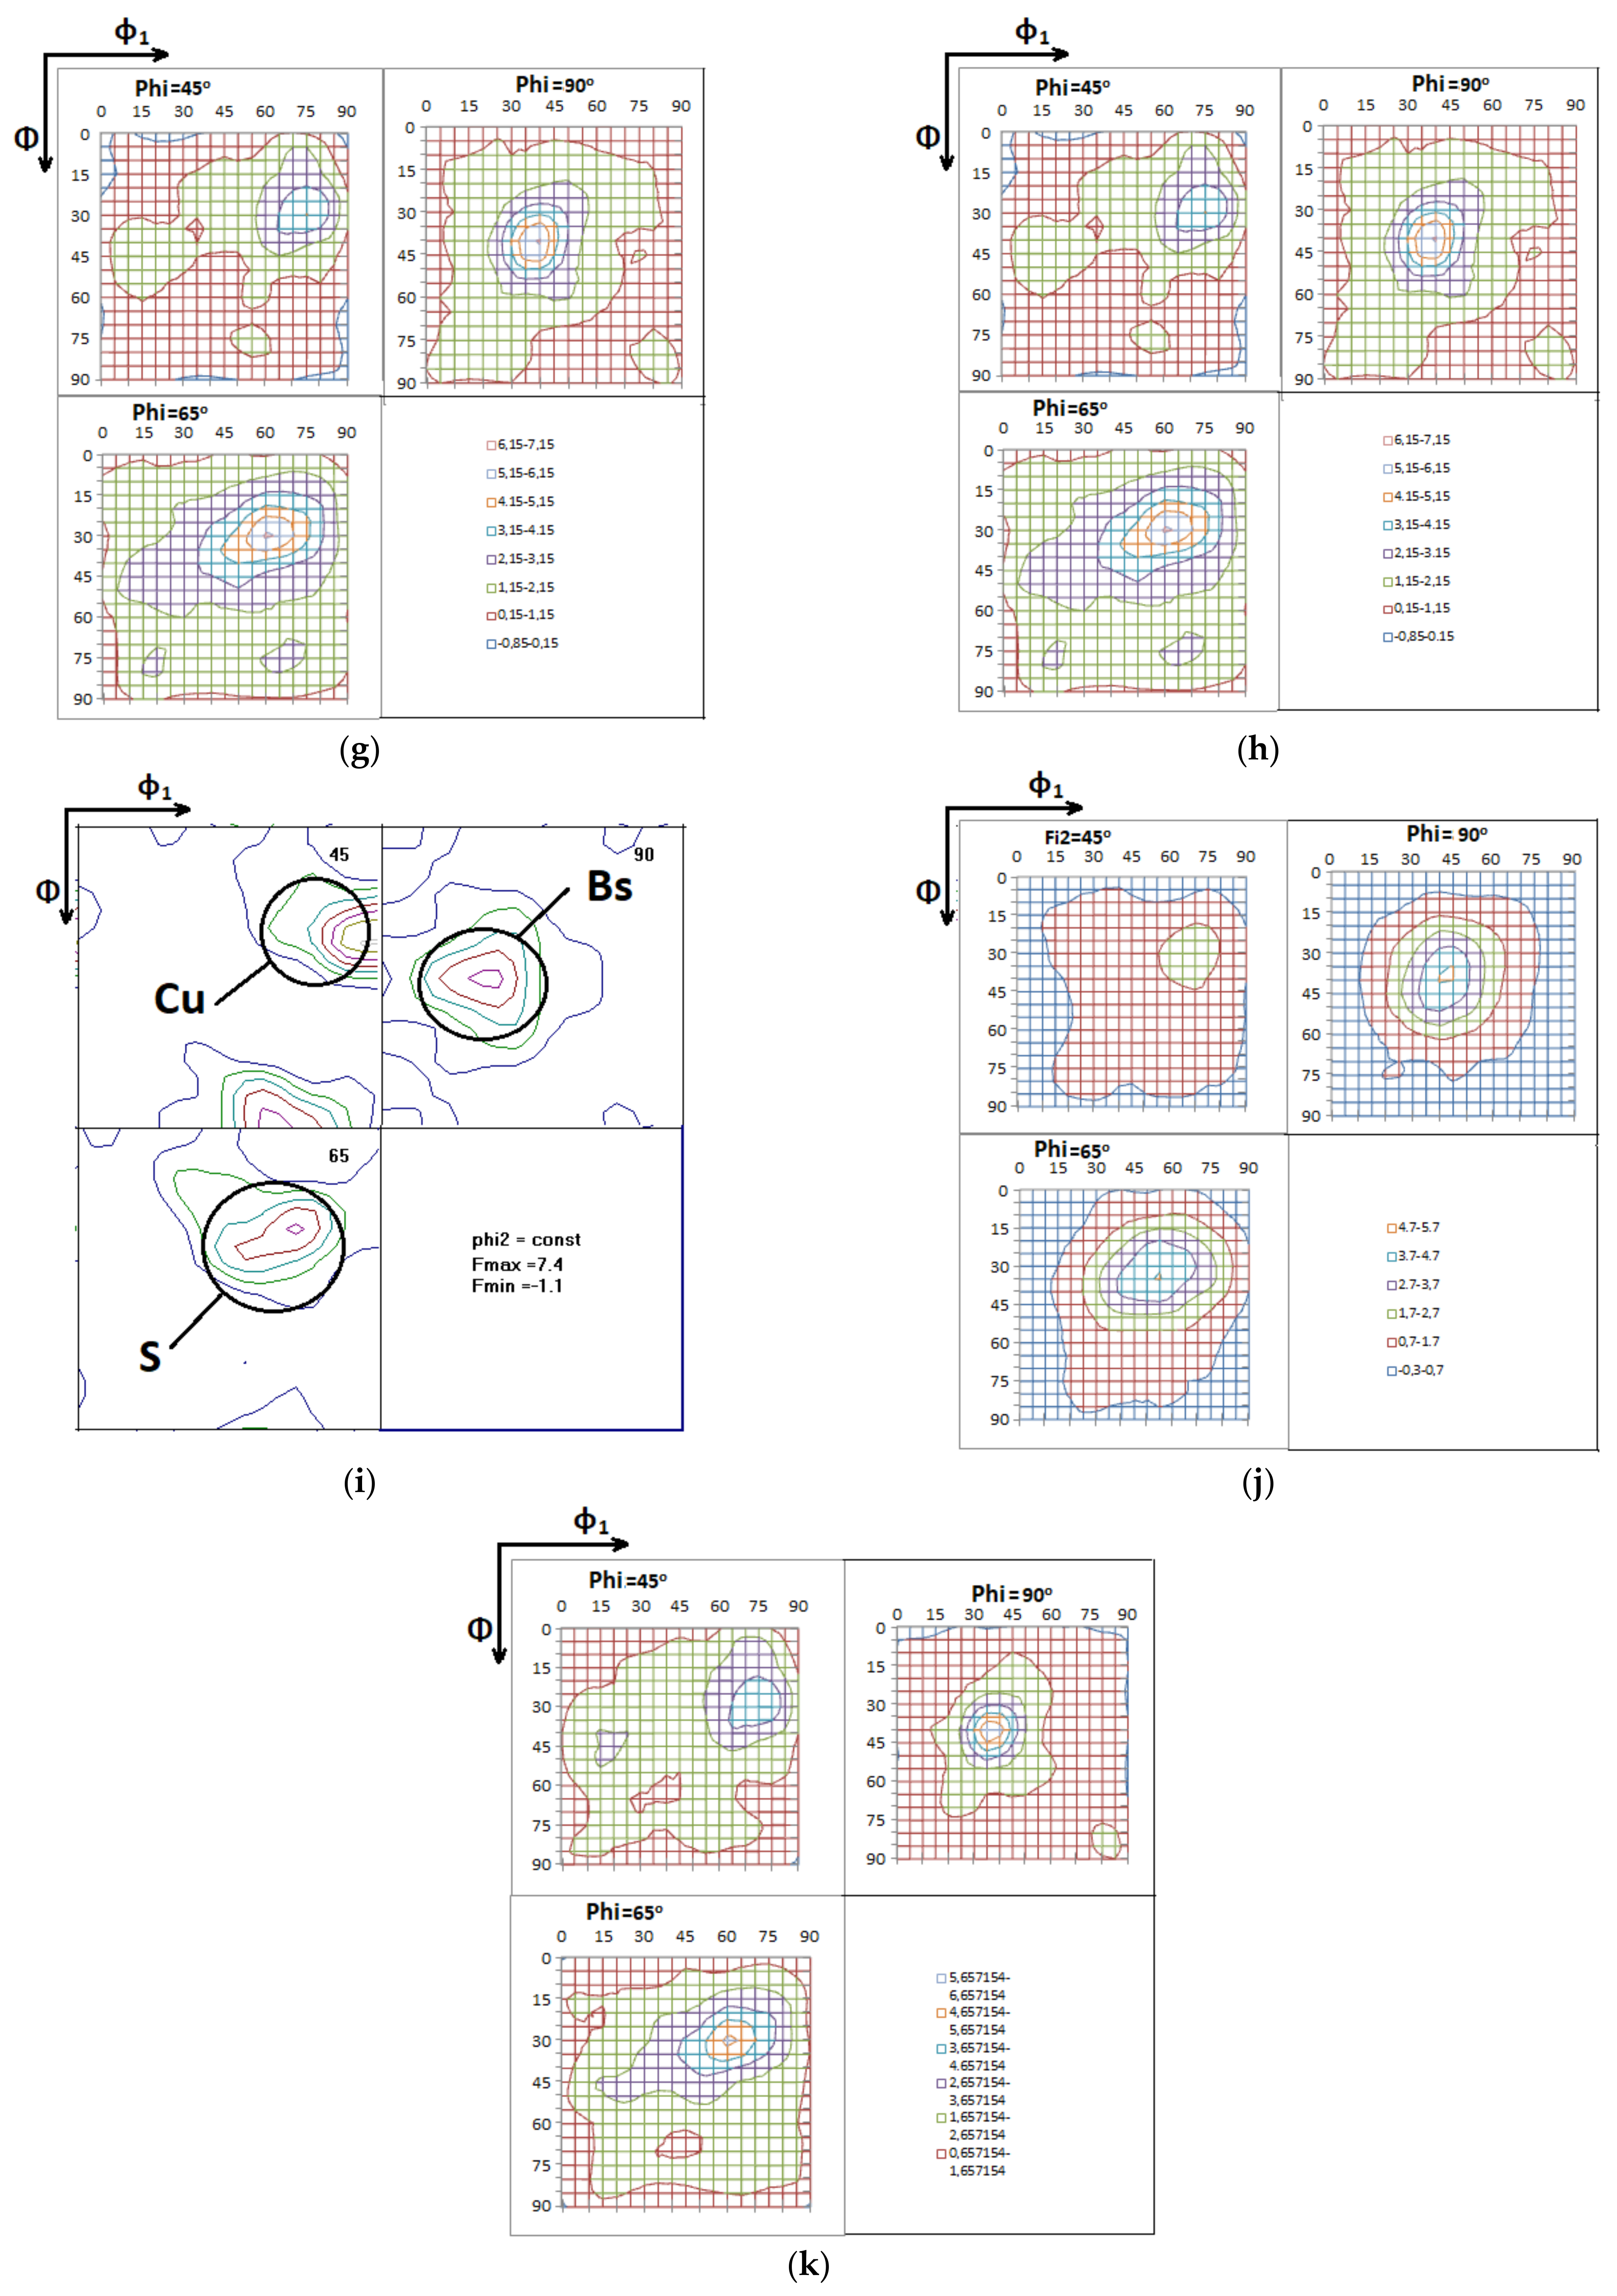
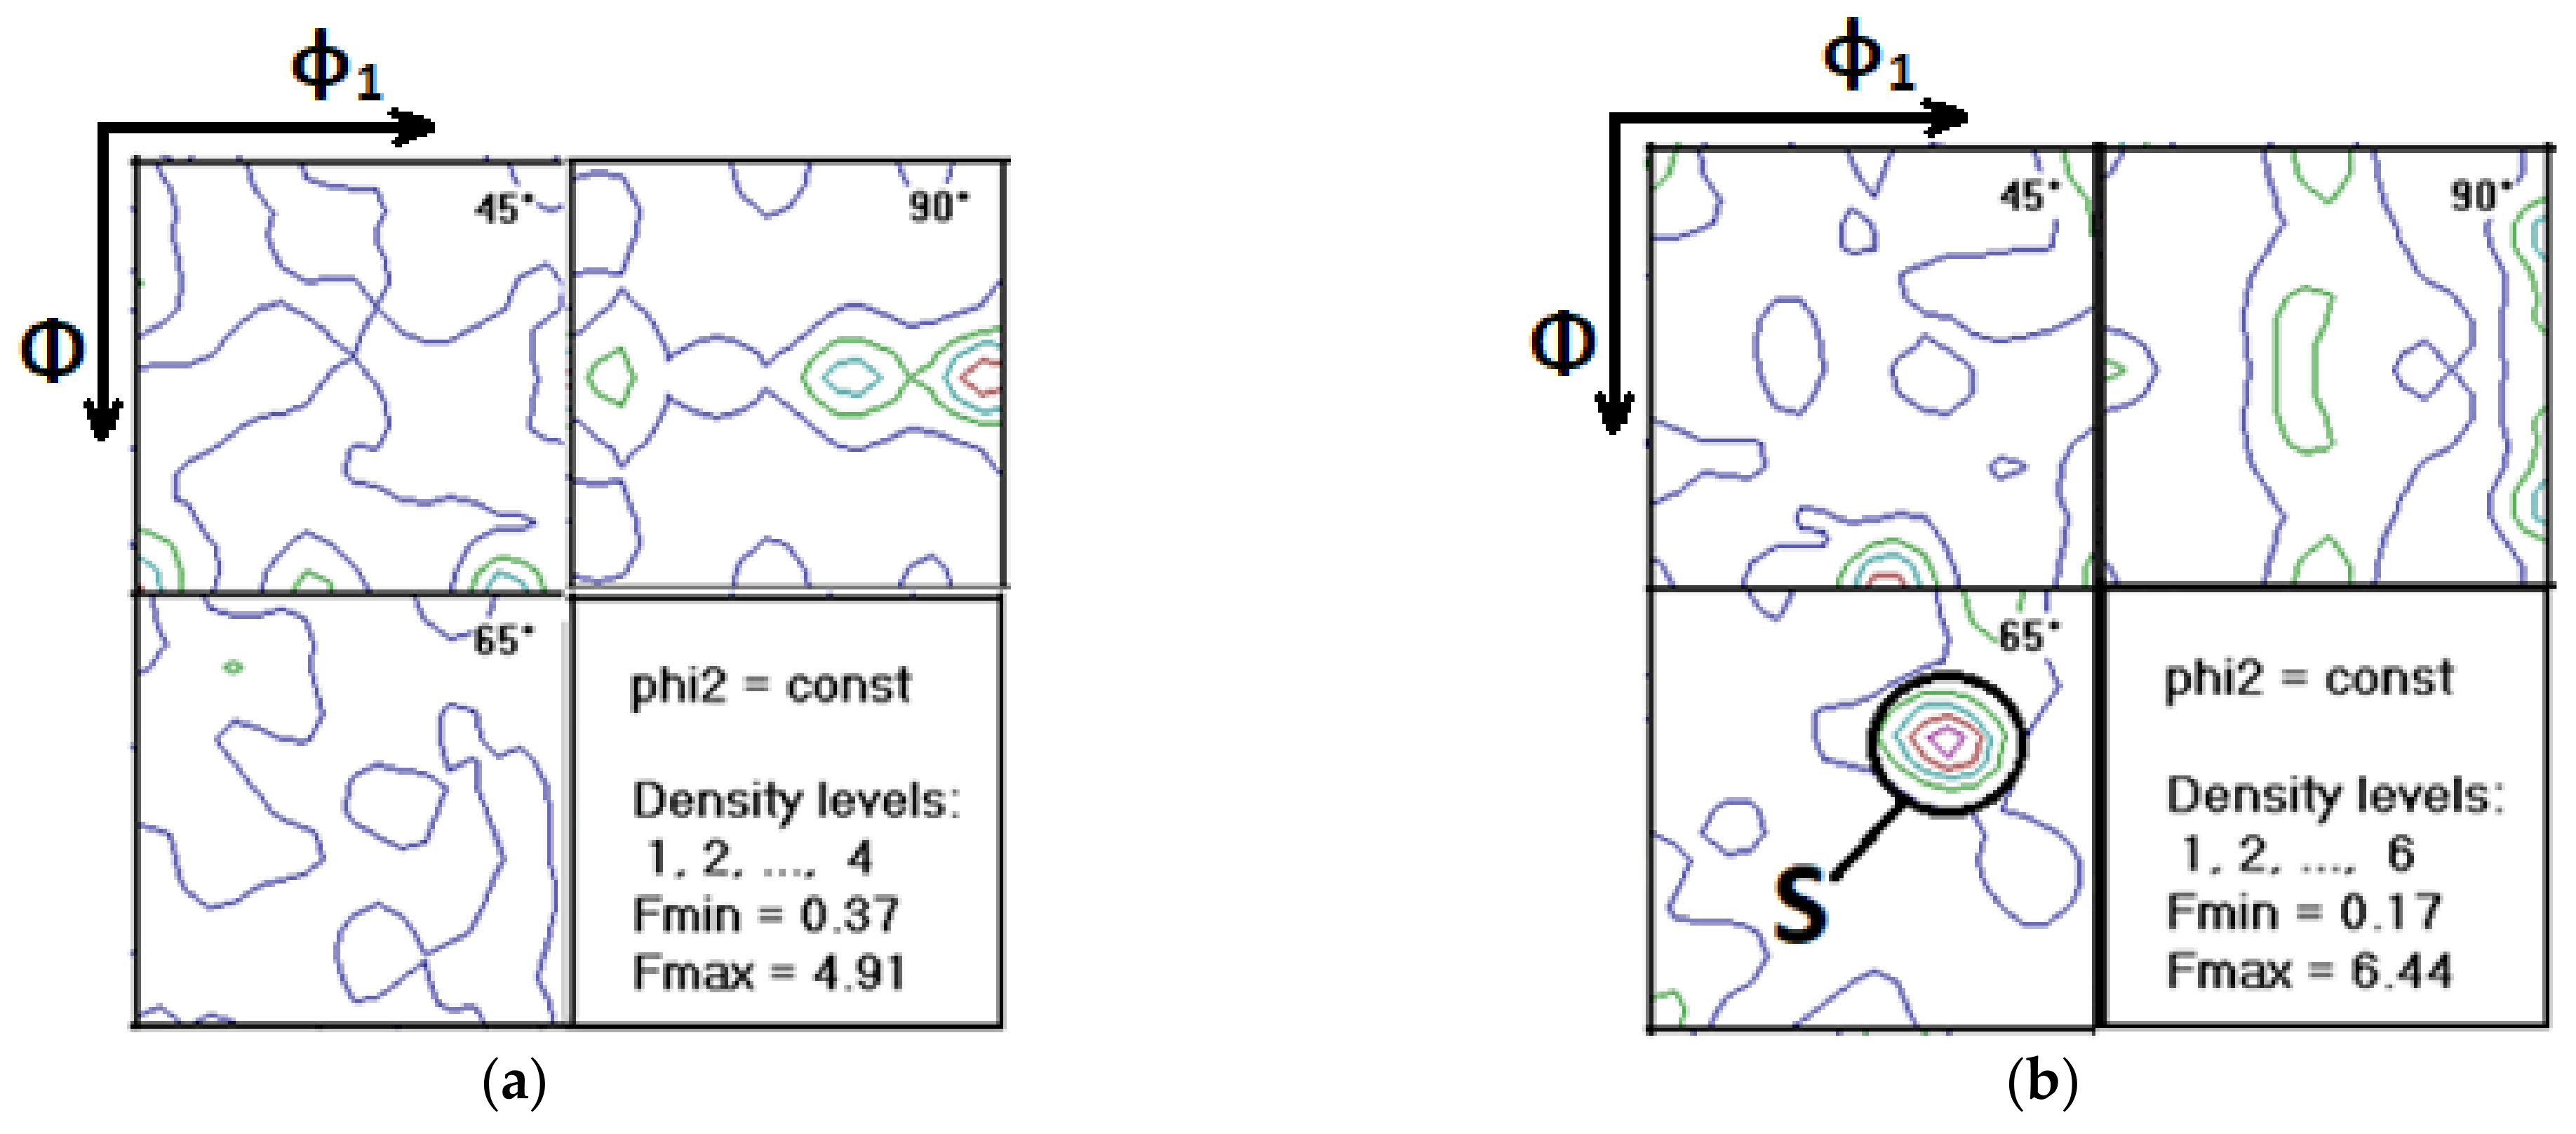
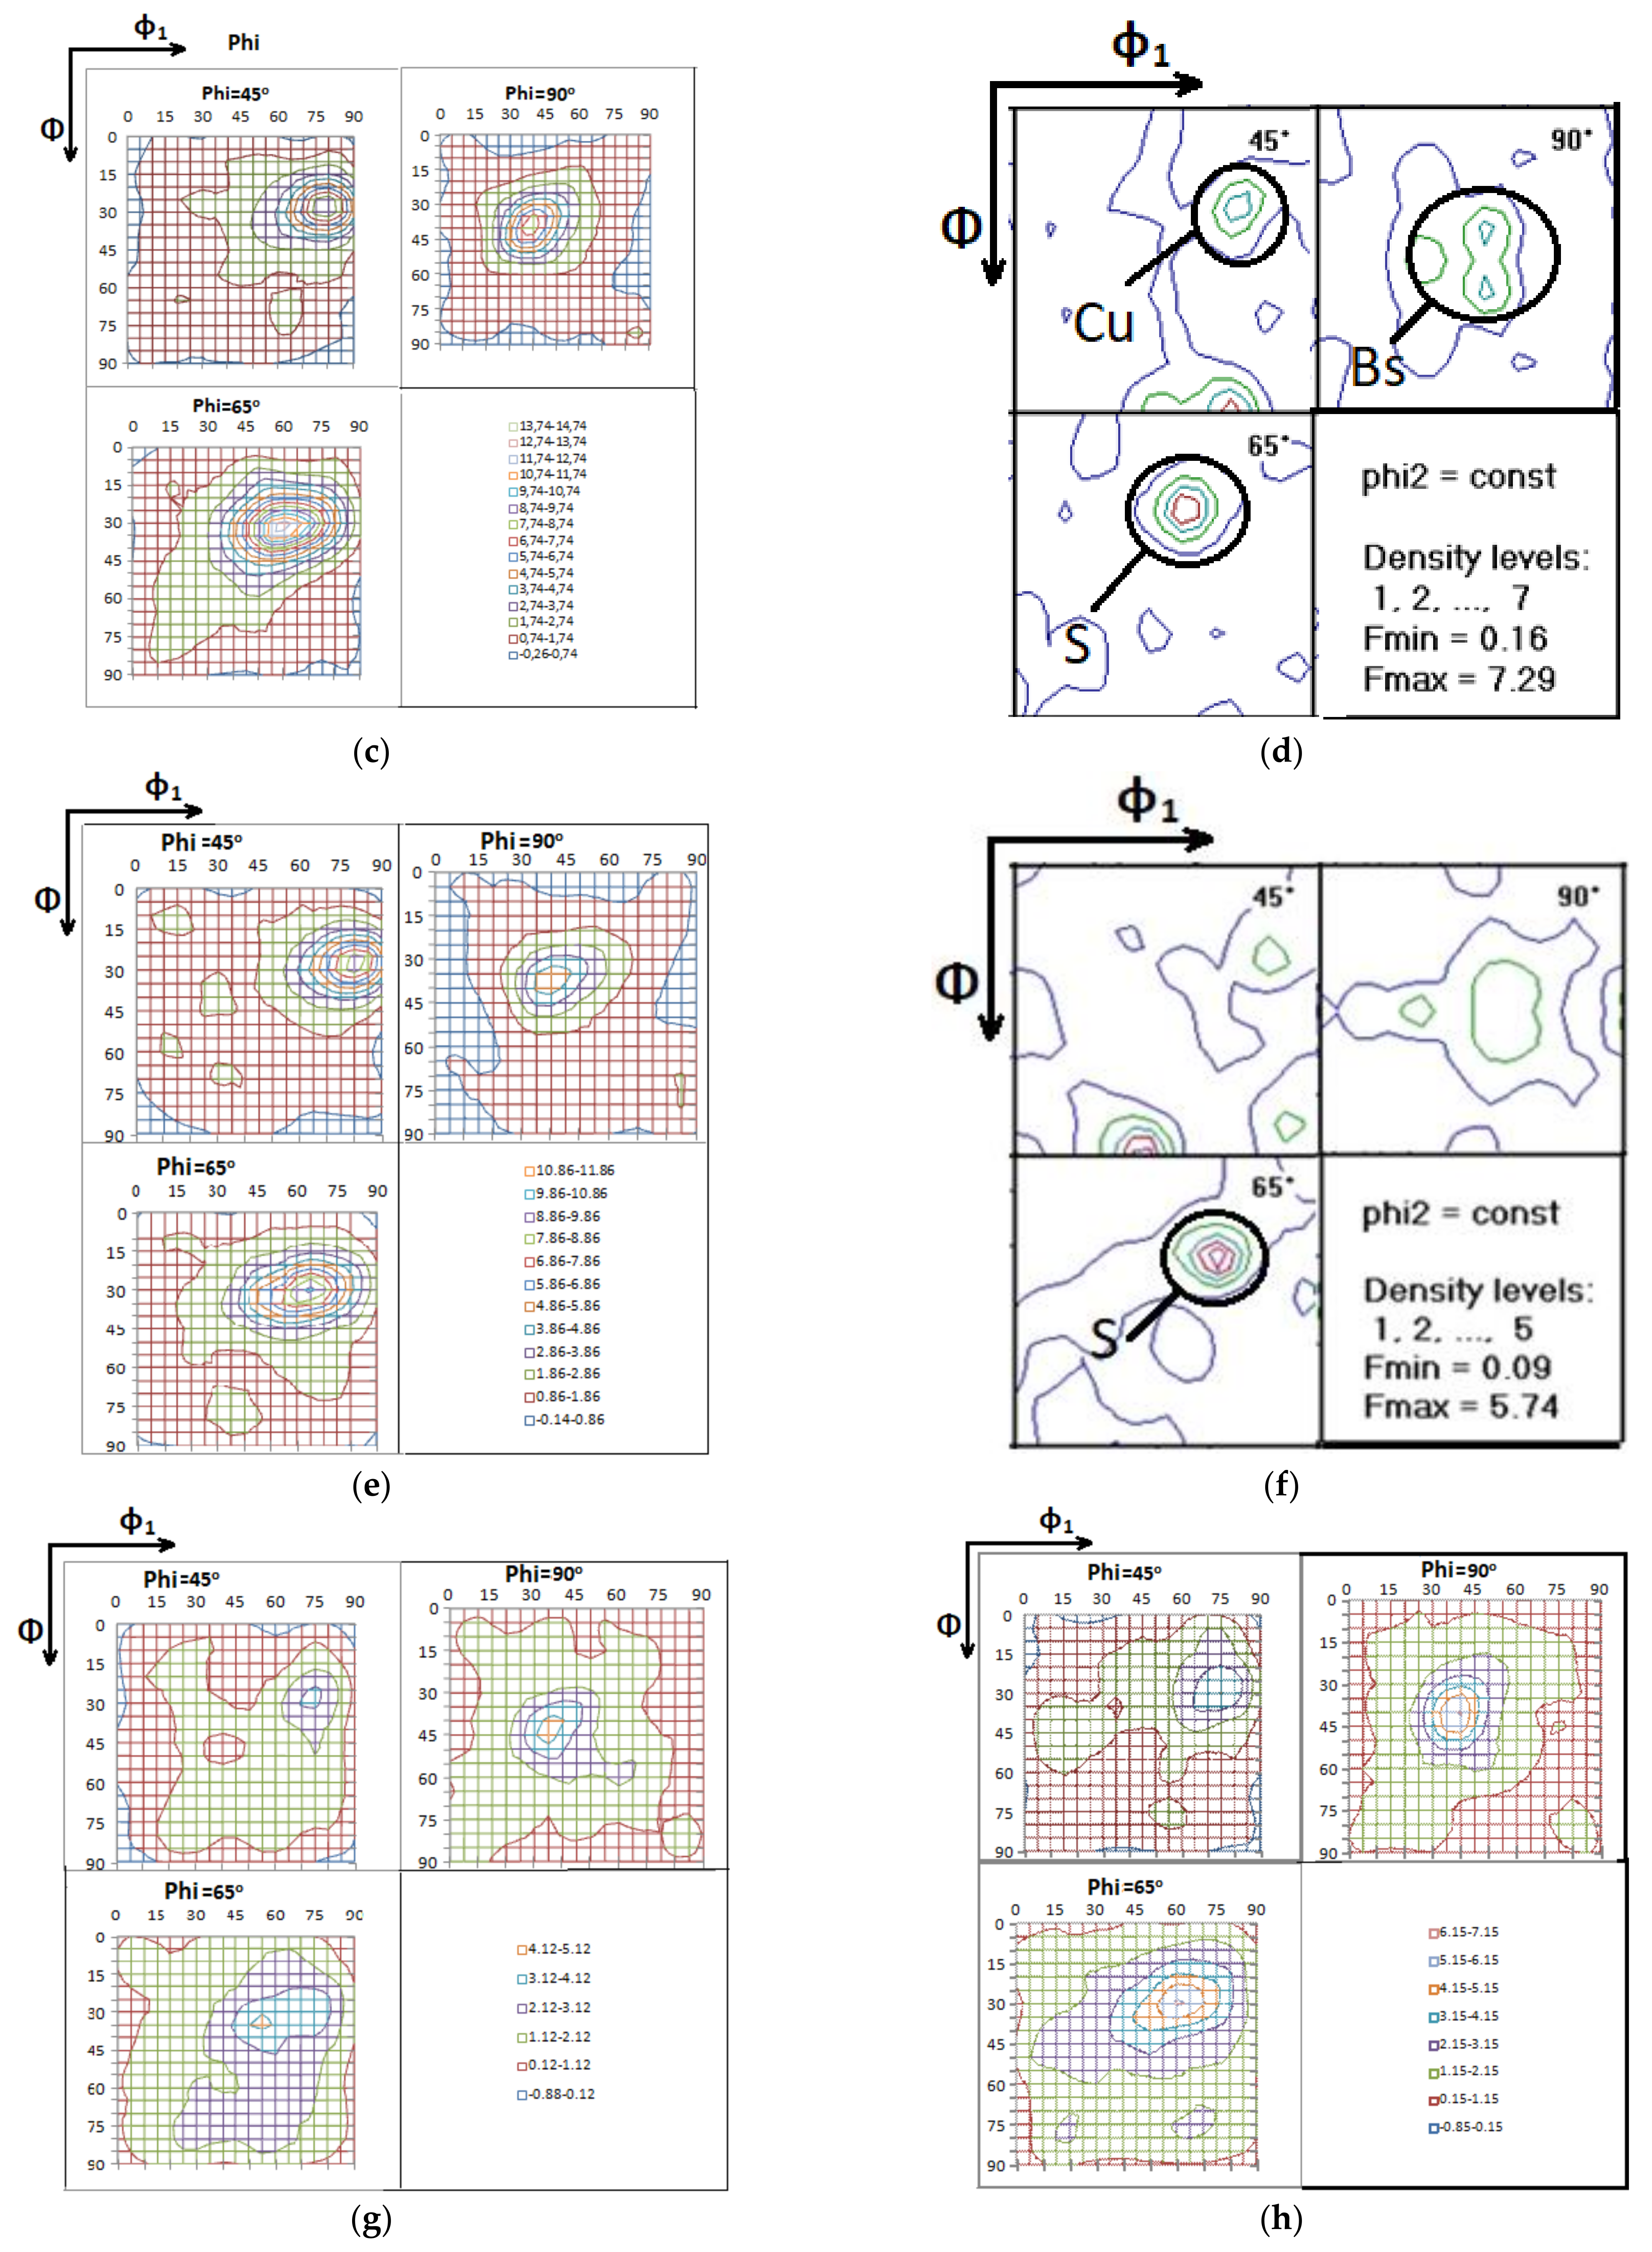
4. Texture Analysis Data

In order to study how textures develop during partial recrystallization and how texture affects the fragmentation of the intermetallic compounds, we need to consider the data of X-ray texture analysis and the results of modeling both with and without intermetallic particle fragmentation. Table 6 shows the main ideal textural components characteristic of aluminum alloys, and Figure 19 shows location of some of them on the Euler space [42].
Pronounced texture components were not observed in the as-cast state of the 5182 alloy (Figure 20a). This picture is typical for most aluminum alloys in the as-cast state [43,44] if no special casting methods are used. With the increased strain ratio to 32.2%, deformation textures, represented mainly by the rolling (β-fiber) texture components, i.e., “Cu” (copper), “Bs” (brass), as well as transitional texture B/S, appeared [45] (Figure 20b). Thus, the β-fiber texture began to form at this stage in the 5182 alloy. Note, however, that the Bs- and B/S-components did not favor oriented growth as much as did the pure S-component. As can be seen from the optical microscopy data, the recrystallization process already intensively progressed in this pass. The β-fiber texture significantly decreased its intensity, and only a weak Bs texture remained. Recrystallization textures did not appear (Figure 20f). It can be assumed that in this case, recrystallization proceeded mainly according to the PSN mechanism, which was actually predicted by the simulation data. The β-texture became more pronounced, and all its characteristic components, namely Bs, S and Cu, could be observed at an increased deformation ratio up to 83.83%.
According to the optical microscopy data in Figure 20d, some recrystallization also took place in this pass. At this stage, there was already enough β-fiber texture formed to ensure the oriented growth of the cubic and near-cubic recrystallization textures. The results of the texture analysis show that the β-fiber completely disappeared, and near-cubic textures appeared in its place, which, however, were not as pronounced as in the 1XXX and 3XXX alloy series at the similar stage of processing. This also indicates that there was competition between the textures formed on intermetallic particles and from other nuclei during recrystallization. The β-fiber texture was formed as a result of each deformation step. However, it could not accumulate due to the intense recrystallization process in between steps. In general, the calculations of texture development during deformation of the as-cast structure corresponded to the experimentally observed pattern. However, some inaccuracies occurred in the calculation of the β-texture, namely an underestimation of the Bs component and an overestimation of the Cu component. Without taking the intermetallic compound fragmentation into account during recrystallization after 30% deformation the calculation led to a somewhat overestimated value of the β-fiber textures in comparison with the experiment. Instead of a random texture, a certain amount of Cu and S texture components was observed. This was not the case when fragmentation of the intermetallic compounds was taken into account. The calculation which considered the intermetallic compound fragmentation during recrystallization after 83.53% deformation showed a picture closer to experiments, namely a weak texture of Bs and predominantly textureless (i.e., random) components. The calculations were not so accurate with mostly random texture components if the intermetallic compound fragmentation was taken into account. The experimental picture correlated well with Figure 16a. If the first stage of deformation increases the proportion of the textureless (random) components when taking fragmentation into account, then at a later stage, on the contrary, it decreases the textureless (random) components by reducing the number of particles which have a radius critical for nucleation of a new grain.
In in the as-cast state of the 1565 alloy (Figure 21a), as well as in the 5182 alloy, pronounced texture components were not observed. Upon reaching 32% deformation in the 1565 alloy, the β-fiber texture, which was mainly represented by components close to Cu and S, was formed. It should be noted that, in contrast to the 5182 alloy, the texture of Cu (copper) and components close to it were much more pronounced in 1565 alloy at this stage of thermomechanical treatment. This may be due to two factors. First, an increase in magnesium content and, consequently, a change in the stacking fault and planes available for slip. Secondly, this effect can be caused by nano-dispersed particles of the second phase [46], which could be observed more in the 1565 alloy than in 5182 [19]. Moreover, there was some Goss texture in 1565, which distinguished this alloy from 5182. The main components of the β-fiber texture were preserved after holding at temperature, although their intensity decreased due to partial recrystallization. The Goss texture was also preserved. No recrystallization texture components appeared, which means that recrystallization proceeded mainly according to the PSN mechanism. The β-fiber texture was represented by all three components, which were very pronounced, except for the Cu-texture. The intensity of the β-fiber components decreased after partial recrystallization, but all of its main components remained. Thus, the β-fiber texture accumulated in this alloy. They decreased their intensity during partial static recrystallization between passes but not as much as in 5182.
PSN is the main nucleation mechanism for this alloy. In general, the calculations of the texture evolution during the development of the as-cast structure in the 1565 alloy were close to the experimental data, except that the calculation slightly overestimated the β-fiber intensity at 83.53% deformation. However, the simulation results and the experimental texture compositions were still very close. When modeling (partial) recrystallization after 32% deformation and taking fragmentation of intermetallic compounds into account, a less pronounced texture distribution was observed, which, in general, corresponds to the real picture. Without taking fragmentation of intermetallic compounds into account, the intensity of the β-fiber texture increased significantly at this step. After 83.53% deformation, taking or not taking fragmentation of the intermetallic compounds into account did not greatly affect the texture composition. If this factor was not considered, a slightly less pronounced texture of the β-fiber was observed. In both cases, the calculated and experimental texture distributions were very similar. This is in good agreement with the data shown in Figure 21b. They indicate that taking or not taking fragmentation of the intermetallic compounds into account does not significantly affect the overall texture composition at the last stages of hot rolling.
A mostly random texture was also observed in the as-cast state of the 8011 alloy (Figure 22a). After 29.82% deformation, the β-fiber texture elements developed in this alloy, which consisted mainly of S and texture components close to it. Since there was practically no recrystallization (Figure 5b) in the pause between deformation steps at this stage of hot rolling of the as-cast structure, the pattern of texture distribution was preserved. As the deformation ratio was raised to 80.70%, the intensity of the β-fiber textures increased, and the cubic component as well as the subtle Bs (brass) one could be observed. Partial recrystallization during which the cubic and Goss textures were formed took place after 80.70% deformation.
Thus, the gradual accumulation of the β-fiber texture occurs due to the absence of recrystallization at small deformation ratios in the alloy 8011. However, the cubic texture grows rapidly with partial recrystallization after 80.70% deformation. There are two reasons for this. Firstly, enough β-fiber texture, which is necessary to trigger the mechanism of oriented growth, is accumulated. Secondly, as shown in [47], the size of the second phase particles and subgrains which belong to the β-fiber orientations is smaller than that of cubic ones. Therefore, finely dispersed Al6Fe particles more effectively block nuclei arising on the intermetallic particles and subgrains with β-fiber orientations than the cubic component gain advantage by oriented nucleation.
When simulating the evolution of the deformation texture, the calculated texture composition, in general, coincided with the experimental data. If fragmentation of the intermetallic compounds is not considered, calculation of partial recrystallization after 29.82% deformation will lead to an overestimation of the β-fiber texture volume. However, if we take this factor into account, such an error can be avoided (Figure 22j). Taking fragmentation of the intermetallic compounds into account when modeling recrystallization after 80.70% deformation insignificantly reduces the intensity of the cubic texture in comparison to calculations, where this factor is not taken into account.
The study has shown that fragmentation of the intermetallic compounds is observed in all aluminum alloys. The most intense fragmentation can be seen at the first stages of working of the as-cast structure when the primary intermetallic compounds are sufficiently large. Fragmentation is finished and practically disappears in the later stages of deformation. It should be noted that the chemical composition of the alloy affects the volume recrystallized according to the PSN scheme due to the number of intermetallic compounds. The difference in the size of subgrains practically has no effect. This is explained by the fact that the Zener–Hollomon parameter has low values at the stage of working out from the as-cast structure, and the subgrain size is the same for all alloys studied in this work. At the same time, simulation shows that the subgrain size will also begin to play a role with an increased Zener–Hollomon parameter. The results indicated that fragmentation of the intermetallic compounds must be taken into account when simulating the texture evolution during working of the as-cast structure. This factor can be ignored at latter stages to facilitate the model. However, in this case, the data for the amount and size of intermetallic compounds must be taken after the reversing mill when the fragmentation of intermetallic compounds has already passed.

5. Conclusions

(1)
The microstructural data obtained with the help of light and electron microscopy showed that the primary intermetallic compounds (“constituent particles”) which have “survived” homogenization are fragmented when the as-cast structure is worked out. In different alloys such effects of particle crushing occur in different ways, which is due to the influence of the chemical composition on the brittleness and the number and size of primary particles. On average they decrease by more than 10 times. At later stages the intensity of fragmentation decreases.
(2)
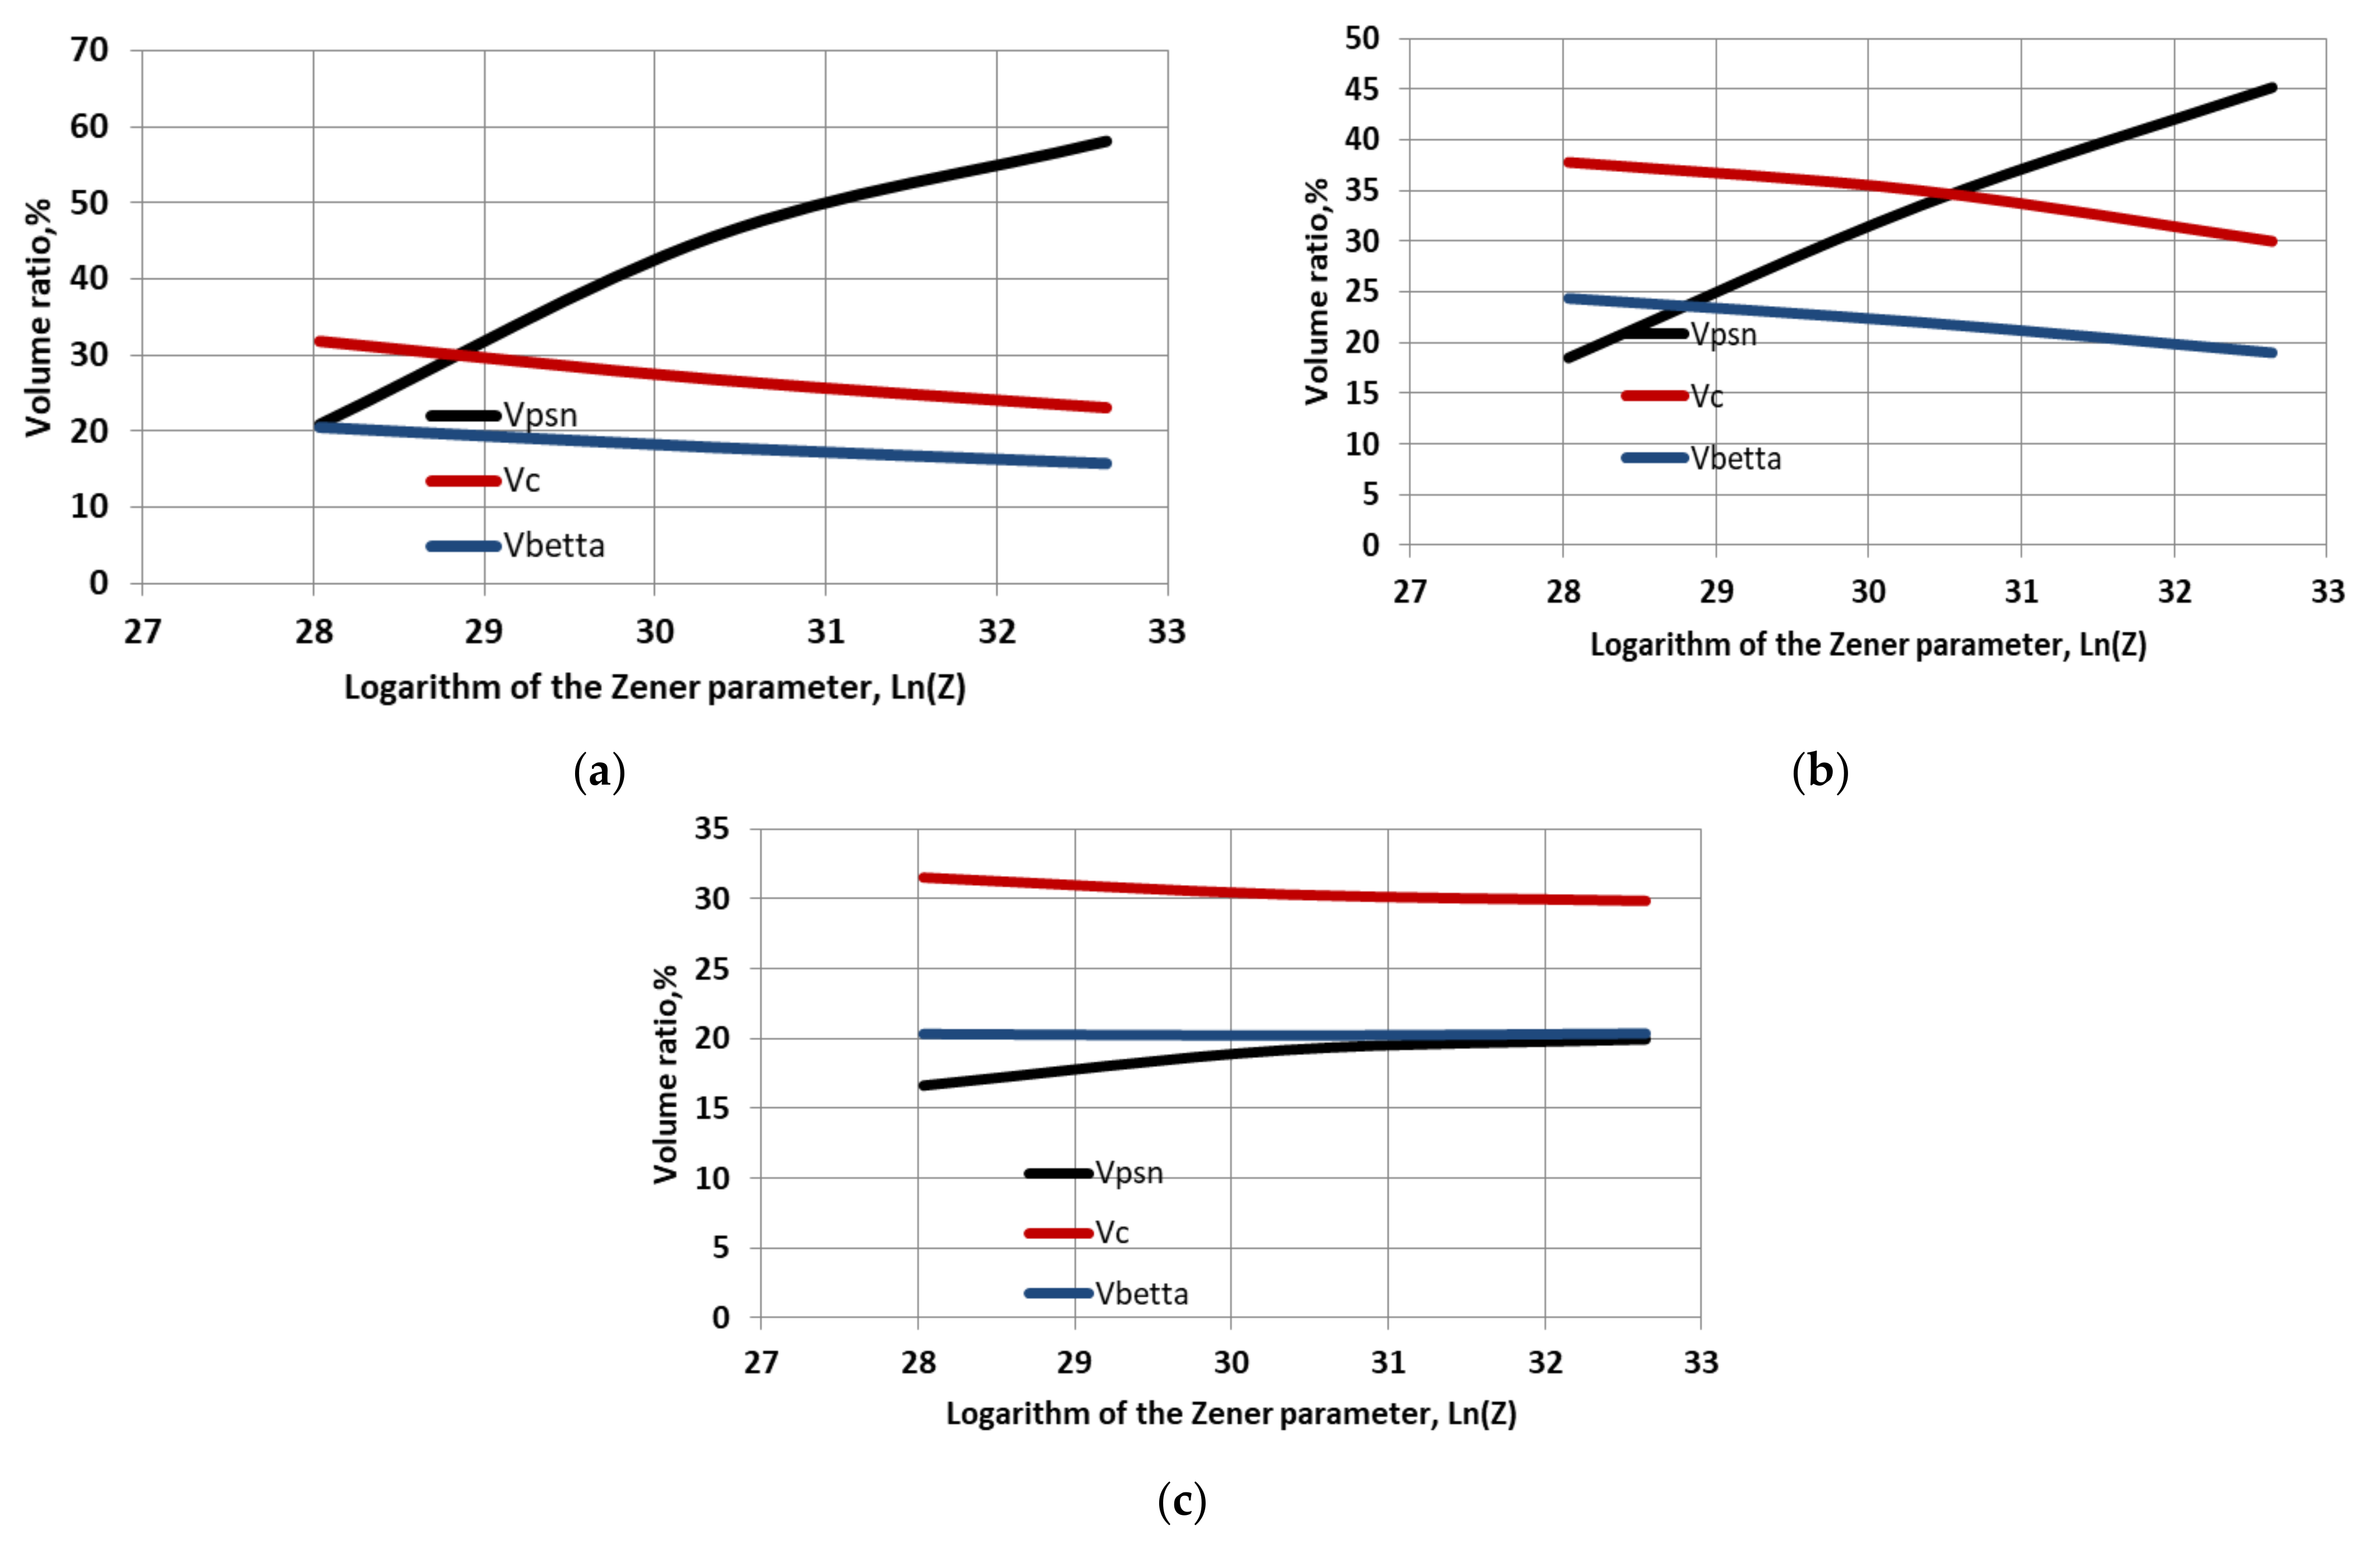
Simulation of the texture evolution showed that fragmentation of the intermetallic compounds must be taken into account, otherwise the volume of metal recrystallized according to PSN can either be overestimated or underestimated in the calculation, depending on the stage of thermomechanical treatment. If fragmentation of the intermetallic compounds is not considered at the early stages, the volume recrystallized according to the PSN mechanism is underestimated. This is due to the fact that, on the one hand, the particles themselves are still very large, but at the same time their number has already begun to grow. At later stages, the particles are crushed more. Therefore, they lose their potential as nuclei, despite the fact that their number is increased. The exception is the 8011 alloy in which an extremely large number of particles arise due to very intense fragmentation, and the effect of their increase in number overrides their reduction in size. Underestimation of the crushing of intermetallic compounds can lead to the overestimation of the cubic and β-fiber texture proportions at this stage of thermomechanical processing. At later stages, taking the fragmentation of intermetallic particles into account also increases the accuracy of calculations (less than in the first stages).
(3)
Stacking fault energy, which primarily affects the subgrain size, does not have a strong effect on the volume recrystallized and on intermetallic particles during the evolution of the as-cast structure during hot working. The main reason is that the Zener–Hollomon parameter has low values at the initial stage of the as-cast structure evolution. Because of this, the subgrain size does not vary much in different alloys at this stage. In addition, the nuclei of the recrystallization (cubic) and rolling (β-fiber) textures have sufficiently large sizes and could effectively compete with the particles of the first phase. However, they are not so numerous at this stage of thermomechanical processing. At the same time, simulation has shown that the differences in the sizes of subgrains for the 8011 and high-magnesium alloys and, consequently, differences in their texture composition will be amplified with an increased Zener–Hollomon parameter. Thus, the low amount of cubic and β-fiber texture during the development of the as-cast structure is explained not by their competition with PSN but by the small extent of grain boundaries on which the nuclei of these components are mainly generated. In addition, the subtle β-fiber texture does not allow the mechanism of oriented growth of the cubic texture to be activated.

Author Contributions

Conceptualization, E.A.; methodology E.A. and J.H.; software E.A. and S.K.; formal analysis E.A. and J.H.; investigation E.A. and S.K.; resources E.A. and S.K.; data curation E.A. and S.K.; writing—original draft preparation E.A. and J.H.; writing—review and editing, E.A., J.H., and S.K.; visualization E.A. and J.H. supervision S.K.; project administration E.A. and S.K.; funding acquisition E.A.; All authors have read and agreed to the published version of the manuscript.

Funding

The study is funded by a grant of the Russian Science Foundation, project 18-79-10099.

Institutional Review Board Statement

Not applicable.

Informed Consent Statement

Not applicable.

Data Availability Statement

The data presented in this study are available on request from the corresponding author.

Conflicts of Interest

The authors declare no conflict of interest.

References

  1. Fedorov, S.N.; Bazhin, V.Y. Development of mechanical properties of aluminum-silicon alloys. Smart Nanocomposites 2015, 6, 199–202. [Google Scholar]
  2. Bazhin, V.Y.; Gutema, E.M.; Savchenkov, S.A. Production Technology Features for Aluminum Matrix Alloys with a Silicon Carbide Framework. Metallurgist 2017, 60, 129–1272. [Google Scholar] [CrossRef]
  3. Deev, V.B.; Degtyar, V.A.; Kutsenko, A.I.; Selyanin, I.F.; Voitkov, A.P. Resource-Saving technology for the production of cast aluminum alloys. Steel Transl. 2007, 37, 991–994. [Google Scholar] [CrossRef]
  4. Aryshenskii, E.; Hirsch, J.; Yashin, V.; Sergei, K.; Kawalla, R. Influence of Local Inhomogeneity of Thermomechanical Treatment Conditions on Microstructure Evolution in Aluminum Alloys. J. Mater. Eng. Perform. 2018, 27, 6780–6799. [Google Scholar] [CrossRef]
  5. Belov, N.A.; Korotkova, N.O.; Akopyan, T.K.; Timofeev, V.N. Structure and Properties of Al-0.6%Zr-0.4%Fe-0.4%Si (wt.%) Wire Alloy Manufactured by Electromagnetic Casting. JOM 2020, 72, 1561–1570. [Google Scholar] [CrossRef]
  6. Sizyakov, V.M.; Bazhin, V.Y.; Vlasov, A.A. Status and prospects for growth of the aluminum industry. Metallurgist 2010, 54, 409–414. [Google Scholar] [CrossRef]
  7. Belov, N.; Akopyan, T.; Korotkova, N.; Murashkin, M.; Timofeev, V.; Fortuna, A. Structure and Properties of Ca and Zr Containing Heat Resistant Wire Aluminum Alloy Manufactured by Electromagnetic Casting. Metals 2021, 11, 236. [Google Scholar] [CrossRef]
  8. Engler, O.; Kalz, S. Simulation of earing profiles from texture data by means of a visco-plastic self-consistent polycrystal plasticity approach. Mater. Sci. Eng. A 2004, 373, 350–362. [Google Scholar] [CrossRef]
  9. Engler, O. Modeling of Texture and Texture-Related Properties during the Thermo-Mechanical Processing of Aluminum Sheets. Mater. Sci. Forum 2003, 426–432, 3655–3660. [Google Scholar] [CrossRef]
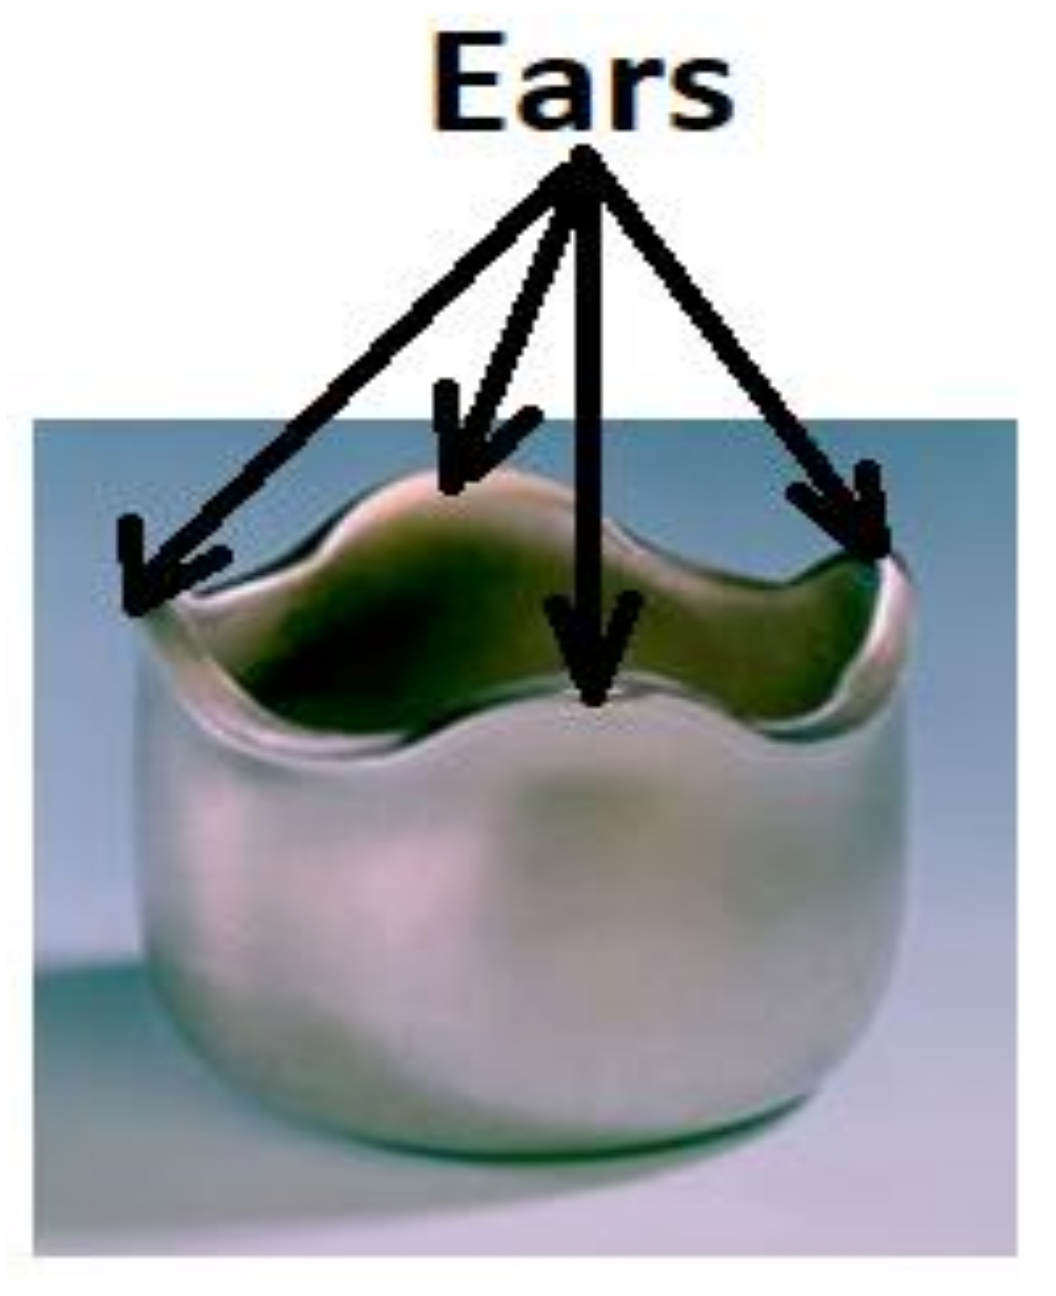
  10. Hutchinson, W.B.; Oscarsson, A.; Karlsson, A. Control of microstructure and earing behaviour in aluminium alloy AA 3004 hot bands. Mater. Sci. Technol. 1989, 5, 1118–1127. [Google Scholar] [CrossRef]
  11. Engler, O.; Hirsch, J. Polycrystal-plasticity simulation of six and eight ears in deep-drawn aluminum cups. Mater. Sci. Eng. A 2007, 452–453, 640–651. [Google Scholar] [CrossRef]
  12. Engler, O. Control of texture and earing in aluminium alloy AA 3105 sheet for packaging applications. Mater. Sci. Eng. A 2012, 538, 69–80. [Google Scholar] [CrossRef]
  13. Lucke, K.; Engler, O. Effects of particles on development of microstructure and texture during rolling and recrystallisation in fcc alloys. Mater. Sci. Technol. 1990, 6, 1113–1130. [Google Scholar] [CrossRef]
  14. Humphreys, F.; Hatherly, M. Recrystallization and Related Annealing Phenomena; Elsevier: Amsterdam, The Netherlands, 2012. [Google Scholar]
  15. Humphreys, F. The nucleation of recrystallization at second phase particles in deformed aluminium. Acta Met. 1977, 25, 1323–1344. [Google Scholar] [CrossRef]
  16. Chan, H.M.; Humphreys, F.J. Effect of particle stimulated nucleation on orientation of recrystallized grains. Met. Sci. 1984, 18, 527–530. [Google Scholar] [CrossRef]
  17. Wells, M.A.; Samarasekera, I.V.; Brimacombe, J.K.; Hawbolt, E.B.; Lloyd, D.J. Modeling the microstructural changes during hot tandem rolling of AA5XXX aluminum alloys: Part II. Textural evolution. Met. Mater. Trans. A 1998, 29, 621–633. [Google Scholar] [CrossRef]
  18. Wells, M.A.; Samarasekera, I.V.; Brimacombe, J.K.; Hawbolt, E.B.; Lloyd, D.J. Modeling the microstructural changes during hot tandem rolling of AA5XXX aluminum alloys: Part III. Overall model development and validation. Met. Mater. Trans. A 1998, 29, 709–719. [Google Scholar] [CrossRef]
  19. Aryshenskii, E.; Aryshenskii, V.; Beglov, E.; Chitnaeva, E.; Konovalov, S. Investigation of subgrain and fine intermetallic participles size impact on grain boundary mobility in aluminum alloys with transitional metal addition. Mater. Today Proc. 2019, 19, 2183–2188. [Google Scholar] [CrossRef]
  20. Vatne, H.; Wells, M. Modelling of the Recrystallization Behaviour of AA5xxx Aluminum Alloys after Hot Deformation. Can. Met. Q. 2003, 42, 79–88. [Google Scholar] [CrossRef]
  21. Zaïdi, M.A.; Sheppard, T. Development of microstructure throughout roll gap during rolling of aluminium alloys. Met. Sci. 1982, 16, 229–238. [Google Scholar] [CrossRef]
  22. Engler, O.; Liu, Z.; Kuhnke, K. Impact of homogenization on particles in the Al–Mg–Mn alloy AA 5454—Experiment and simulation. J. Alloy. Compd. 2013, 560, 111–122. [Google Scholar] [CrossRef]
  23. Engler, O.; Miller-Jupp, S. Control of second-phase particles in the Al-Mg-Mn alloy AA 5083. J. Alloy. Compd. 2016, 689, 998–1010. [Google Scholar] [CrossRef]
  24. Engler, O.; Kuhnke, K.; Hasenclever, J. Development of intermetallic particles during solidification and homogenization of two AA 5xxx series Al-Mg alloys with different Mg contents. J. Alloy. Compd. 2017, 728, 669–681. [Google Scholar] [CrossRef]
  25. Maire, E.; Grenier, J.; Daniel, D.; Baldacci, A.; Klocker, H.; Bigot, A. Quantitative 3D characterization of intermetallic phases in an Al–Mg industrial alloy by X-ray microtomography. Scr. Mater. 2006, 55, 123–126. [Google Scholar] [CrossRef]
  26. Moulin, N.; Jeulin, D.; Ducottet, C.; Bigot, A.; Boller, E.; Maire, E.; Barat, C.; Klocker, H.; Parra-Denis, E. Constituent Particle Break-Up During Hot Rolling of AA 5182. Adv. Eng. Mater. 2010, 12, 20–29. [Google Scholar] [CrossRef] [Green Version]
  27. Singh, S.S.; Schwartzstein, C.; Williams, J.J.; Xiao, X.; De Carlo, F.; Chawla, N. 3D microstructural characterization and mechanical properties of constituent particles in Al 7075 alloys using X-ray synchrotron tomography and nanoindentation. J. Alloy. Compd. 2014, 602, 163–174. [Google Scholar] [CrossRef]
  28. Schäfer, C.; Pomana, G.; Mohles, V.; Gottstein, G.; Engler, O.; Hirsch, J.; Hirsch, J. Recrystallization Modeling of AA8XXX Alloys with Cellular Automata Considering Recovering Kinetics. Adv. Eng. Mater. 2010, 12, 131–140. [Google Scholar] [CrossRef]
  29. Aryshenskii, E.; Kawalla, R.; Hirsch, J. Development of New Fast Algorithms for Calculation of Texture Evolution during Hot Continuous Rolling of Al-Fe Alloys. Steel Res. Int. 2017, 88, 1700053. [Google Scholar] [CrossRef]
  30. Schäfer, C.; Gottstein, G. Modeling Recrystallization of Aluminum Alloys: A Refined Approach to Particle Stimulated Nucleation. Mater. Sci. Forum. 2007, 558, 1169–1175. [Google Scholar] [CrossRef]
  31. Engler, O.; Vatne, H.E. Modeling the recrystallization textures of aluminum alloys after hot deformation. JOM 1998, 50, 23–27. [Google Scholar] [CrossRef]
  32. Vatne, H.; Furu, T.; Ørsund, R.; Nes, E. Modelling recrystallization after hot deformation of aluminium. Acta Mater. 1996, 44, 4463–4473. [Google Scholar] [CrossRef]
  33. Engler, O.; Löchte, L.; Hirsch, J. Through-Process Simulation of Texture and Properties during the Thermomechanical Processing of Aluminium Sheets. Acta Mater. 2007, 55, 5449–5463. [Google Scholar] [CrossRef]
  34. Evgenii, A.; Erkin, B.; Hirsch, J.; Vladimir, A.; Segrey, K. Development of the new fast approach for calculation of texture evolution during hot deformation of aluminum alloys. Procedia Manuf. 2019, 37, 492–499. [Google Scholar] [CrossRef]
  35. Aryshenskii, E.; Hirsch, J.; Bazhin, V.; Kawalla, R.; Pral, U. Impact of Zener-Hollomon parameter on substructure and texture evolution during thermomechanical treatment of iron-containing wrought aluminium alloys. Trans. Nonferrous Met. Soc. China 2019, 29, 893–906. [Google Scholar] [CrossRef]
  36. Smirnov, A.S.; Konovalov, A.V.; Pushin, V.G.; Uksusnikov, A.N.; Zvonkov, A.A.; Zajcev, I.M. Peculiarities of the Rheological Behavior for the Al-Mg-Sc-Zr Alloy Under High-Temperature Deformation. J. Mater. Eng. Perform. 2014, 23, 4271–4277. [Google Scholar] [CrossRef]
  37. Ihara, K.; Miura, Y. Dynamic recrystallization in Al–Mg–Sc alloys. Mater. Sci. Eng. A 2004, 387–389, 647–650. [Google Scholar] [CrossRef]
  38. Morris, J.G. Dynamic Strain Aging in Aluminum Alloys. Mater. Sci. Eng. 1974, 13, 101–108. [Google Scholar] [CrossRef]
  39. Nes, E.; Hutchinson, W.B. Texture and Grain Size Control During Processing of Metals. In Tenth Risoe International Symposium on Metallurgy and Materials Science; Risoe National Laboratory: Roskilde, Denmark, 1989; pp. 233–249. [Google Scholar]
  40. Velay, X. Prediction and control of subgrain size in the hot extrusion of aluminium alloys with feeder plates. J. Mater. Process. Technol. 2009, 209, 3610–3620. [Google Scholar] [CrossRef]
  41. Duan, X.; Sheppard, T. Influence of forming parameters on the final subgrain size during hot rolling of aluminium alloys. J. Mater. Process. Technol. 2002, 130, 245–249. [Google Scholar] [CrossRef]
  42. Engler, O.; Randle, V. Introduction to Texture Analysis: Macrotexture, Microtexture and Orientation Mapping; CRC Press: Boca Raton, FL, USA, 2010; pp. 1–31. [Google Scholar]
  43. Hirsch, J. Through Process Modelling. Mater. Sci. Forum 2006, 519–521, 15–24. [Google Scholar] [CrossRef]
  44. Hirsch, J.; Aryshensky, E.V.; Grechnikova, A.F.; Drits, A.M.; Smz, S.A. Microstructural evolution and crystallographic texture in the production of aluminium strips for food containers industry Part 2. Tsvetnye Met. 2018, 62–69. [Google Scholar] [CrossRef]
  45. Hirsch, J.; Lücke, K. Overview no. 76. Acta Met. 1988, 36, 2883–2904. [Google Scholar] [CrossRef]
  46. Engler, O.; Hirsch, J.; Lucke, K. Texture development in Al-1.8 wt% Cu depending on the precipitation state—II. Recrystallization textures. Acta Met. Mater. 1995, 43, 121–138. [Google Scholar] [CrossRef]
  47. Engler, O. On the Influence of Dispersoids on the Particle Stimulated Nucleation of Recrystallization in an Al-Fe-Si Model Alloy. Mater. Sci. Forum 1998, 273–275, 483–488. [Google Scholar] [CrossRef] [Green Version]
Figure 1. Earing effect after drawing a cylindrical billet from an anisotropic aluminum tape.
Metals 11 00507 g001
Figure 2. Microstructure of 5182 alloy specimen: (a) cast specimen, (b) 33.23% deformation, (c) 68.47% deformation, (d) 83.83% deformation.
Metals 11 00507 g002
Figure 3. Microstructure of 1565 alloy specimen: (a) cast specimen, (b) 32.2% deformation, (c) 67.13% deformation, (d) 83.53% deformation.
Metals 11 00507 g003
Figure 4. Microstructure of 8011 alloy specimen: (a) cast specimen, (b) 29.82% deformation, (c) 63.16% deformation, (d) 80.70% deformation.
Metals 11 00507 g004
Figure 5. Micrographs of samples etched to reveal the phases of 5182 alloy: (a) homogenization, (b) 33.2% deformation, (c) 68.47% deformation, (d) 83.83% deformation.
Metals 11 00507 g005
Figure 6. Micrographs of samples etched to reveal the phases of 1565 alloy: (a) homogenization, (b) 32.2% deformation, (c) 67.13% deformation, (d) 83.53% deformation.
Metals 11 00507 g006
Figure 7. Micrographs of samples etched to reveal the phases of 8011 alloy: (a) homogenization, (b) 29.82% deformation, (c) 63.16% deformation, (d) 80.70% deformation.
Metals 11 00507 g007
Figure 8. Chemical composition of the large intermetallic particles in 1565 alloy.
Metals 11 00507 g008
Figure 9. Chemical composition of the large intermetallic particles of the minor phase in 5182 alloys.
Metals 11 00507 g009
Figure 10. Micrographs of samples etched to reveal 5182 alloy phases: (a) 32.2% deformation, (b) 67.13% deformation, (c) 83.53% deformation.
Metals 11 00507 g010
Figure 11. Micrographs of samples etched to reveal 1565 alloy phases: (a) 32.2% deformation, (b) 67.13% deformation, (c) 83.53% deformation.
Metals 11 00507 g011
Figure 12. Micrographs of samples etched to reveal 8011 alloy phases: (a) 32.2% deformation, (b) 63.16% deformation, (c) 80.70% deformation μ.
Metals 11 00507 g012
Figure 13. Chemical composition of the large intermetallic particles of the second phase in 8011 alloy.
Metals 11 00507 g013
Figure 14. Distribution density of the sizes of intermetallic compounds in homogenized (a), after deformation ~0.4 logarithmic strain (b) and ~1.8 (c) logarithmic strain.
Metals 11 00507 g014
Figure 15. Evolution of size distribution of the intermetallic compounds during rolling from the as-cast state. The curves are plotted using the coefficients Nint, L and δint0 for the 1565 alloy.
Metals 11 00507 g015
Figure 16. Calculated dependence of the recrystallized material textures on deformation values: taking fragmentation of intermetallic compounds into account = solid curves; disregarding fragmentation = dashed curves; (a) 1565 alloy, (b) 5182 alloy, (c) 8011 alloy.
Metals 11 00507 g016
Figure 17. Dependence of the subgrain size on the Zener–Hollomon parameter for different alloys.
Metals 11 00507 g017
Figure 18. Calculated dependence of the recrystallization textures on the Zener–Hollomon parameter, taking fragmentation of the intermetallic compounds into account: (a) 1565 alloy, (b) 5182 alloy, (c) 8011 alloy.
Metals 11 00507 g018
Figure 19. Ideal texture orientations on orientation distribution function (ODF).
Metals 11 00507 g019
Figure 20. Calculation results for 5182 alloy: (a) homogenization, (b) 33.2% deformation, (c) 33.2% deformation (modeling); (d) 83.53% deformation; (e) 83.53% deformation (modeling); holding at 32.2% deformation and elevated temperature: (f) experimental data. Calculation results for 5182 alloy: (g) taking fragmentation into account, (h) without regard to fragmentation of intermetallic compounds; holding at 83.53% deformation and elevated temperature: (i) experimental data, (j) taking fragmentation into account, (k) without regard to fragmentation of intermetallic compounds.
Metals 11 00507 g020aMetals 11 00507 g020bMetals 11 00507 g020c
Figure 21. Calculation results for 1565 alloy: (a) homogenization, (b) 33.2% deformation, (c) 33.2% deformation (modeling), (d) 83.53% deformation, (e) 83.53% deformation (modeling); holding at 32.2% deformation and elevated temperature: (f) experimental data, (g) taking fragmentation into account, (h) without regard to fragmentation of intermetallic compounds; holding at 83.53% deformation and elevated temperature: (i) experimental data, (j) taking fragmentation into account, (k) without regard to fragmentation of intermetallic compounds.
Metals 11 00507 g021aMetals 11 00507 g021b
Figure 22. Calculation results for 1565ch alloy: (a) homogenization, (b) 29.82% deformation, (c) 29.82% deformation (modeling); holding at 29.82% deformation and elevated temperature: (f) experimental data. Calculation results for 8011 alloy: (g) taking fragmentation into account, (h) without regard to fragmentation of intermetallic compounds; (d) 80.70% deformation; (e) 80.70% deformation (modeling), (i)-experimental data, (j) taking fragmentation into account, (k) without regard to fragmentation of intermetallic compounds.
Metals 11 00507 g022aMetals 11 00507 g022bMetals 11 00507 g022c
Table 1. Chemical compositions of the alloys studied.
AlloyAlloy Composition (wt %)
MgMnZrScSiFeZnCrTiCu
51824.80.5--0.140.20.2-<0.1<0.1
15655.60.80.1-0.120.220.50.07<0.1<0.1
80110.20.2--0.30.90.10.1<0.1<0.1
Table 2. Actual rolling parameters of 5182 alloy.
No. Roll PassSpeed,
m/min
Thickness, mmΔhT in, °CDeform., %Total Deform., %T out, °C
30.00
11025.725.2852017.6017.60474
21020.034.6952018.9733.23484
31014.405.6352028.1152.00460
41012.002.452016.6760.00469
5109.462.5452021.1768.47498
6106.845.1652043.0077.20484
7104.851.9952029.0983.83363
Table 3. Actual rolling parameters of 1565 alloy.
No. Roll PassSpeed,
m/min
Thickness, mmΔhT in, °CDeform., %Total Deform., %T out, °C
30.00
11025.434.5745415.2315.23474
21020.345.0943020.0232.20484
31015.504.8446323.8048.33460
4109.865.6446136.3967.13469
5106.922.9446529.8276.93498
6104.944.9246449.9083.53484
Table 4. Actual rolling parameters of 8011 alloy.
No. Roll PassSpeed,
m/min
Thickness, mmΔhT in, °CDeform., %Total Deform., %T out, °C
40.00
17.7038.601.405003.513.51450
211.6035.792.815007.2710.53440
311.6033.682.115005.8815.79468
412.2030.882.814908.3322.81447
512.8028.072.814909.0929.82444
613.4025.262.8149010.0036.84440
714.1021.753.5148013.8945.61413
814.7018.253.5148016.1354.39425
915.4014.743.5147519.2363.16395
1015.4011.233.5147523.8171.93424
1115.407.7192983.5147031.2580.70380
Table 5. Parameters of size distribution of intermetallic particles.
AlloysDeformation
Cast~0.18~0.4~0.7~1.1~1.8
N i n t L δ i n t 0
µm
N i n t L δ i n t 0
µm
N i n t L δ i n t 0
µm
N i n t L δ i n t 0
µm
N i n t L δ i n t 0
µm
N i n t L δ i n t 0
µm
15657 × 10110.17133.6 × 10120.3611.61 × 10130.539.63.0 × 10130.687.19.9 × 10130.794.65.3 × 10140.861.9
80112 × 10110.11101.6 × 10120.258.74.8 × 10120.377.21.1 × 10130.475.84.6 × 10130.542.891.1 × 10140.591.4
51827.4 × 10110.259.653.7 × 10120.528.281 × 10130.776.893 × 10130.995.11 × 10141.143.315.7 × 10141.241.4
Table 6. Euler angles of ideal texture components [42].
ComponentMiller Indices
{hkl}〈uvw〉
Euler Angles
φ1Φφ2
Cube{001}〈100〉0°/90°
Cube RD{013}〈100〉22°0°/90
Cube ND001}〈310〉22°0°/90°
Goss{011}〈100〉45°0°/90°
Bs011}〈211〉35°45°0°/90°
Cu{112}〈111〉90°30°45°
S{123}〈634〉60°35°65°
Publisher’s Note: MDPI stays neutral with regard to jurisdictional claims in published maps and institutional affiliations.

