Article

Processing and Characterization of Bilayer Materials by Solid State Sintering for Orthopedic Applications

by
Jorge Sergio Téllez-Martínez
1,
Luis Olmos
2,
Víctor Manuel Solorio-García
1,
Héctor Javier Vergara-Hernández
1,*,
Jorge Chávez
2 and
Dante Arteaga
3
1
Tecnológico Nacional de México/ITMorelia, Av. Tecnológico # 1500, Colonia Lomas de Santiaguito, Morelia C.P. 58120, Mexico
2
INICIT, Universidad Michoacana de San Nicolás de Hidalgo, Fco. J. Mujica S/N, Morelia C.P. 58060, Mexico
3
Centro de Geociencias, Universidad Nacional Autónoma de México, Blvd. Juriquilla No. 3001, Querétaro C.P. 76230, Mexico
*
Author to whom correspondence should be addressed.
Metals 2021, 11(2), 207; https://doi.org/10.3390/met11020207
Submission received: 31 December 2020 / Revised: 18 January 2021 / Accepted: 19 January 2021 / Published: 23 January 2021

Abstract

:
A new processing route is proposed to produce graded porous materials by placing particles of Ti6Al4V with different sizes in different configurations to obtain bilayer samples that can be used as bone implants. The sintering behavior is studied by dilatometry and the effect of the layers’ configuration is established. To determine pore features, SEM and computed microtomography were used. Permeability is evaluated by numerical simulations in the 3D real microstructures and the mechanical properties are evaluated by compression tests. The results show that a graded porosity is obtained as a function of the size of the particle used. The mechanical anisotropy due to the pore size distribution and the sintering kinetics, can be changed by the particle layer arrangements. The Young modulus and yield stress depend on the relative density of the samples and can be roughly predicted by a power law, considering the layers’ configuration on the compression behavior. Permeability is intimately related to the median pore size that leads to anisotropy due to the layers’ configuration with smaller and coarser particles. It is concluded that the proposed processing route can produce materials with specific and graded characteristics, with the radial configuration being the most promising for biomedical applications.

1. Introduction

Nowadays, industrial processes demand materials with specific properties and localized microstructures to improve material performance. To satisfy particular needs, the development of materials with changing mechanical properties and/or microstructures along a preferential direction has been developed. These are called Functional Graded Materials (FGMs). Among these materials, a variation on the porosity along the part is very useful for different industrial applications, such as microfiltration [1], biomedical applications [2,3,4,5] and microelectronic devices [6]. Research into materials that can be used as bone implants has received a lot of attention in the past decade due to their capacity to improve human health. Some earlier investigations focused on solving the mismatch stiffness between metallic implants and human bones [6]. Therefore, there is a need to develop porous materials by using different techniques showing that the stiffness of Ti and its alloys can be reduced to close to that of human bones [7,8,9,10]. Nevertheless, it is worth noting that bones have anisotropic mechanical properties and that stiffness will change depending on the direction of analysis in the structure [11,12]. Thus, it is necessary for the design of FGMs to satisfy the requirements to produce an improved and specialized bone implant.
The powder metallurgy route is better suited to producing materials with graded properties. It allows for control over the sintering parameters and/or the introduction of space-holder particles; with that, it is possible to design the pore characteristics needed in a sample. Processes oriented toward the elaboration of FGMs with a graded porosity of Ti and its alloys have been reported [4,13,14,15,16]. M. Dewidar and Kim [13] and Lee et al. [14] produced Ti compacts consisting of a solid core and a porous outer shell and studied the compression behavior of such components. On the other hand, Ahmadi and Sadrnezhaad [15] elaborated on a component with a bonelike configuration, composed of foamy cores of different diameters surrounded by compact shells. The porous core diameter varied from 6 to 14 mm, whereas the outer diameter remained constant to 16 mm, with a linear relation found between Young’s modulus and the porous core diameter. Recently, Trueba et al. [16] concocted a device to produce materials with graded porosity in the radial direction that was used to produce FGMs of Ti by varying the quantity and pore size in the radial direction, from the core to the surface or vice versa. These works focused mainly on the mechanical response of the FGMs obtaining materials with stiffness and strength close to that of human bones. Nevertheless, biocompatibility and osteoconductivity are very important to producing a successful bone implant. The first one refers to the acceptance of the material inside the human body, which is related to the release of dangerous ions. For acceptance of materials in the body, after Ta, Ti and its alloys have superior biocompatibility [17]. Osteoconductivity, on the other hand, is the ability of a porous implant to facilitate bone growth through itself. Permeability plays a major role, as it favors the pass of nutrients and minerals to the osteocytes while removing metabolic waste as they are carried out through the porosity of the bones; this is associated with enhanced bone adaptation and regeneration [18]. Also, interconnected pores enhance anchoring and vascularization, obtaining better mechanical adhesion between bone and implant [19,20,21,22].
This work aims to develop Ti6Al4V materials with graded porosity by sintering particles with different sizes and distributions located in two main configurations: axial and radial directions. The sintering kinetic of each configuration is evaluated by dilatometry tests. To determine the pore size distribution of the sintered materials, characterization by scanning electronic microscopy (SEM) and computed microtomography is performed. The mechanical properties for graded porous materials are evaluated by compression tests, while permeability is estimated by numerical simulations in the different axes of the sample to determine the anisotropy created by the distribution of the pore sizes.

2. Materials and Methods

2.1. Sample Fabrication

Spherical Ti6Al4V powders furnished by Raymor (Boisbriand, QC, Canada) were used to develop this work. The powder was sieved into two different particle size distributions: 20–45 µm (Figure 1a) and 75–106 µm (Figure 1b). The chemical composition of powders furnished by the fabricant is as follows: 6.35% Al, 4% V, 0.21% Fe, 0.0045% H, 0.02% N, 0.02% O, 0.01% C and the balance of Ti.
To fabricate the samples, the powder’s mass was estimated, to obtain samples of 12 mm in height and 10 mm in diameter. The main objective of this study is to obtain porous materials. The powders were poured into a zirconia crucible which was lightly tapped. Four different samples were sintered in a L75 Linseis vertical dilatometer (Linseis Messgeraete GmbH, Selb, Germany) at 1260 °C with 5 min of holding under high purity Ar (99.999%) atmosphere. The cooling rate was the same for all samples 20 °C/min. Sample composition and sintering schedules are detailed in Table 1, as is the nomenclature for each sample.
Two additional samples of 1 and 2 mm in diameter were prepared to achieve the computed tomography analysis. The characteristics and composition of the samples are detailed in Table 2.

2.2. Sample Characterization

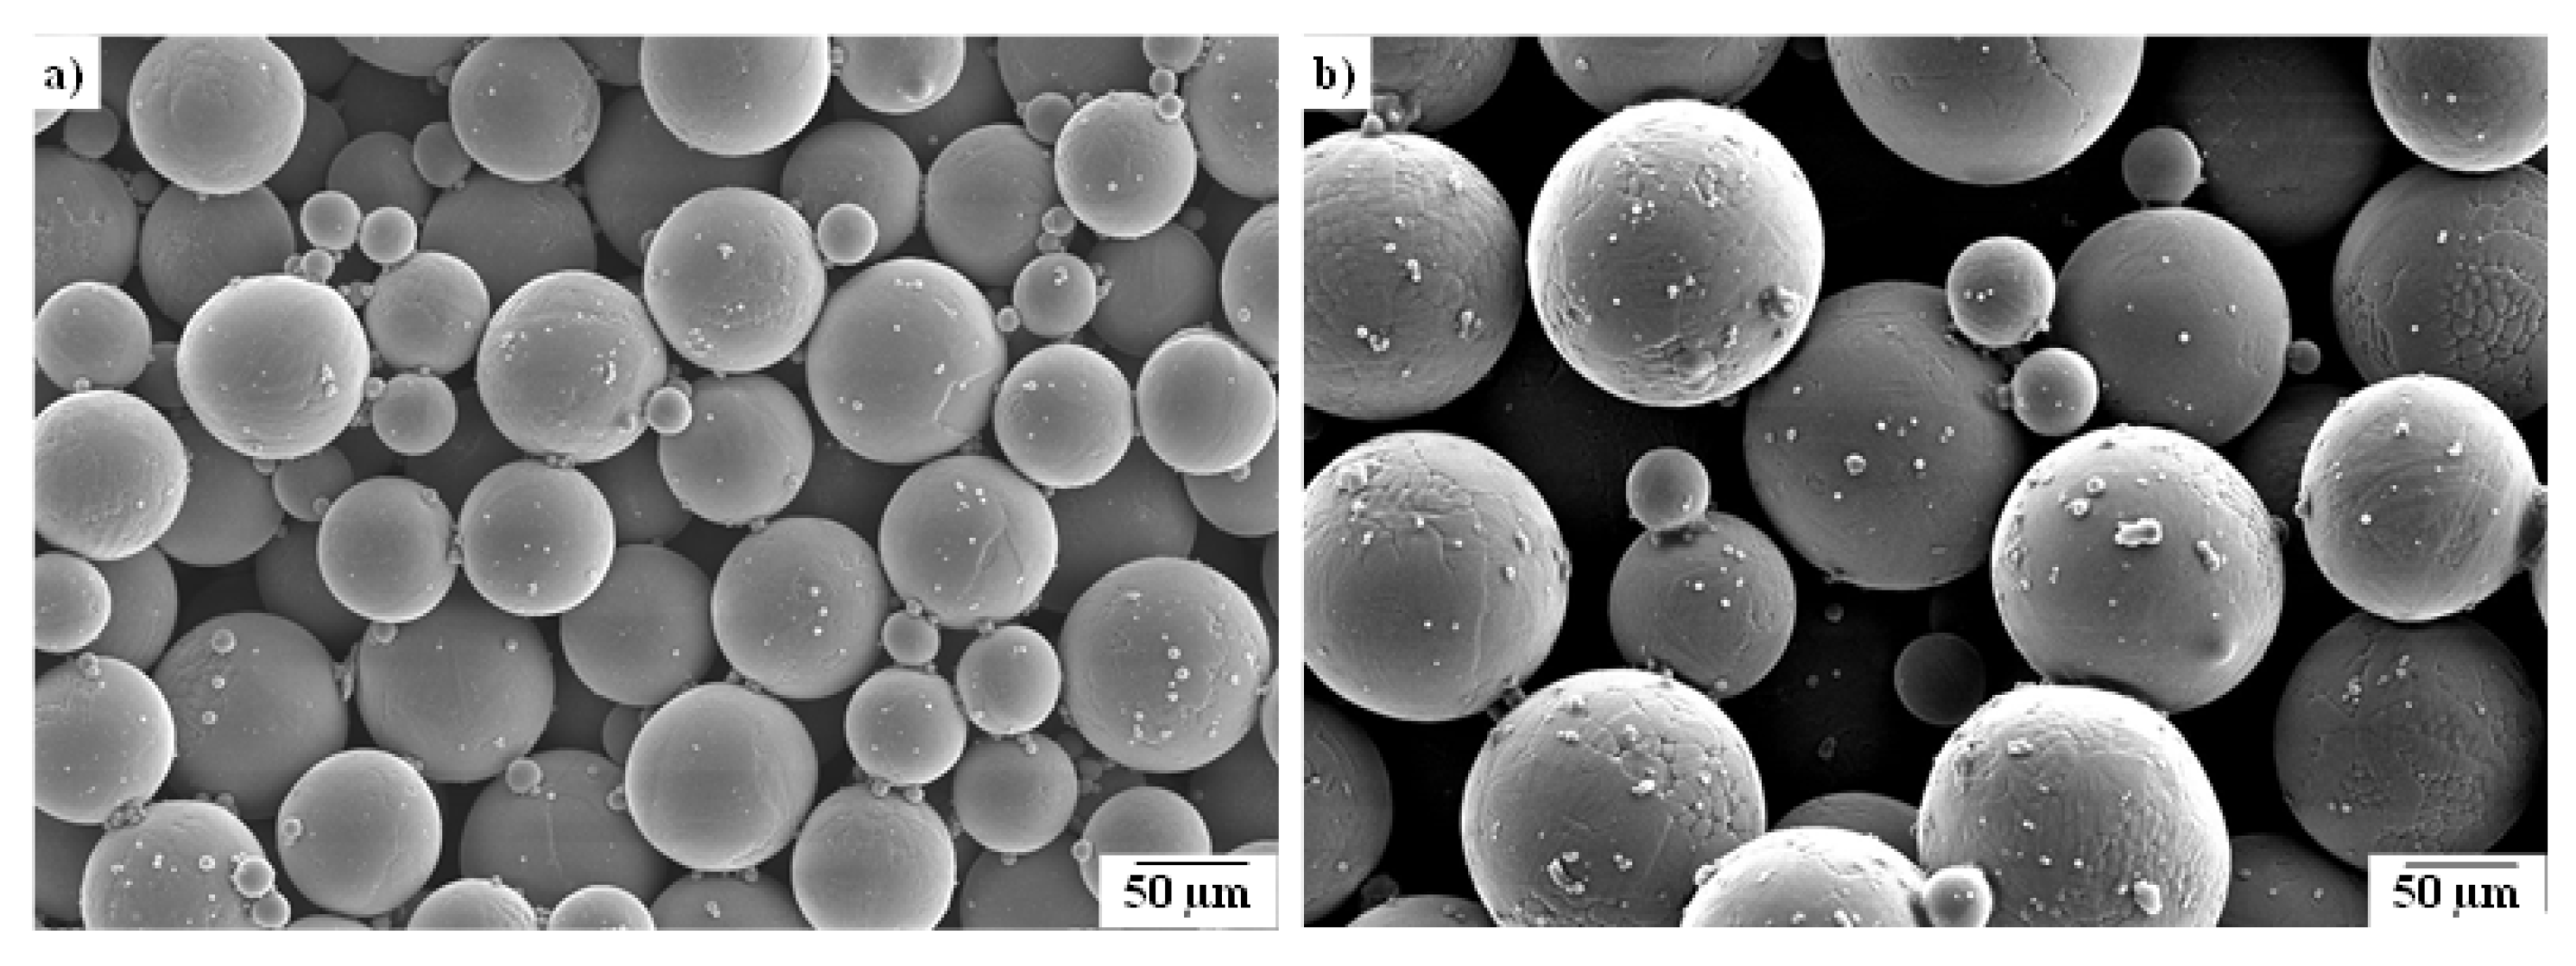
2.2.1. Scan Electronic Microscopy (SEM) Observation

Samples used for SEM observation were cut in half. Roughing was carried out with different SiC papers and polishing was performed by using alumina powders with a final size of 50 nm. After surface preparation, samples were cleaned in an ultrasonic bath for 30 min to remove alumina particles. The microstructure was observed with a Tescan MIRA 3 LMU field emission scanning electron microscope (FE-SEM, TESCAN ORSAY HOLDING, a.s., Brno-Kohoutovice, Czech Republic).

2.2.2. X-ray Microtomography (microCT)

To obtain detailed information about the porosity and its tridimensional distribution inside the samples, 3D images were acquired with a Zeiss Xradia 510 Versa 3D X-ray microscope (ZEIZZ, Oberkochen, Germany). The beam intensity was set at 120 kV, which was enough to pass through the 1- and 2-mm-diameter Ti6Al4V samples. Nearly 1600 projections were recorded around all 360° of the sample with a CCD camera (ZEIZZ, Oberkochen, Germany) of 1024 × 1024 pixels with a voxel size of 1 and 2 µm, respectively. The voxel size depends on the diameter of the samples, although it is possible to acquire inner volumes without destroying the sample. Those kinds of acquisitions take more time when the exposure time to radiation is longer. Because this work is aimed at analyzing the interparticle pores left between the particles after sintering, a 2 µm voxel size is needed to accurately assess the microstructure features.

2.3. Mechanical Property Evaluation

To obtain the mechanical properties, simple compression tests were performed on the 12-mm-height samples. For that, the bottom and top surfaces of the samples were polished and compression tests were performed following ASTM D695-02 with an Instron 1150 universal mechanical testing machine (INSTRON, Norwood, MA., USA) at a strain rate of 0.5 mm/min. From the stress-strain curves, the Young modulus and the yield strength were estimated in the elastic zone. The stress is measured by correcting the contact surface area of the sample, assuming that the volume was constant during compression. The axial strain is calculated as the ratio of the real axial displacement (after machine stiffness correction) to the initial height of samples.

2.4. Numerical Simulation Permeability

The flow properties of porous samples were estimated by numerical simulations of permeability performed using Avizo® software (V8.0, ThermoFisher SCIENTIFIC, Waltham, MA, USA) on the 3D binary images containing porosity. Before the numerical simulations were run, the minimum representative volume (MRV) was estimated by cropping the image in small volume cubes (20 × 20 × 20 voxels) at the center of the image. Then the pore volume fraction for that volume was calculated. These operations were repeated by increasing the cube volume by 20 voxels per side until constant relative density was reached. The optimal minimal volume to obtain enough accuracy in our results had to be calculated considering computational limitations, to save time for the numerical simulations. It was found that the volume at which the pore volume fraction reached a constant value was near 3003 voxels3. Therefore, a volume of 300 × 300 × 300 voxels was used for the numerical simulation in the three main directions of the cube, where x and y represent the horizontal plane and z the vertical axis.
Simulations on Avizo are based on the Darcy law by solving Navier-Stokes equations with a finite volume method. The simulation considered a single-phase incompressible Newtonian fluid with a steady-state laminar flow and a viscosity of 0.0045 Pa s, which represents the viscosity of the blood. The boundary conditions used were the inlet and outlet pressure, with values of 130 and 100 kPa, respectively.

3. Results and Discussion

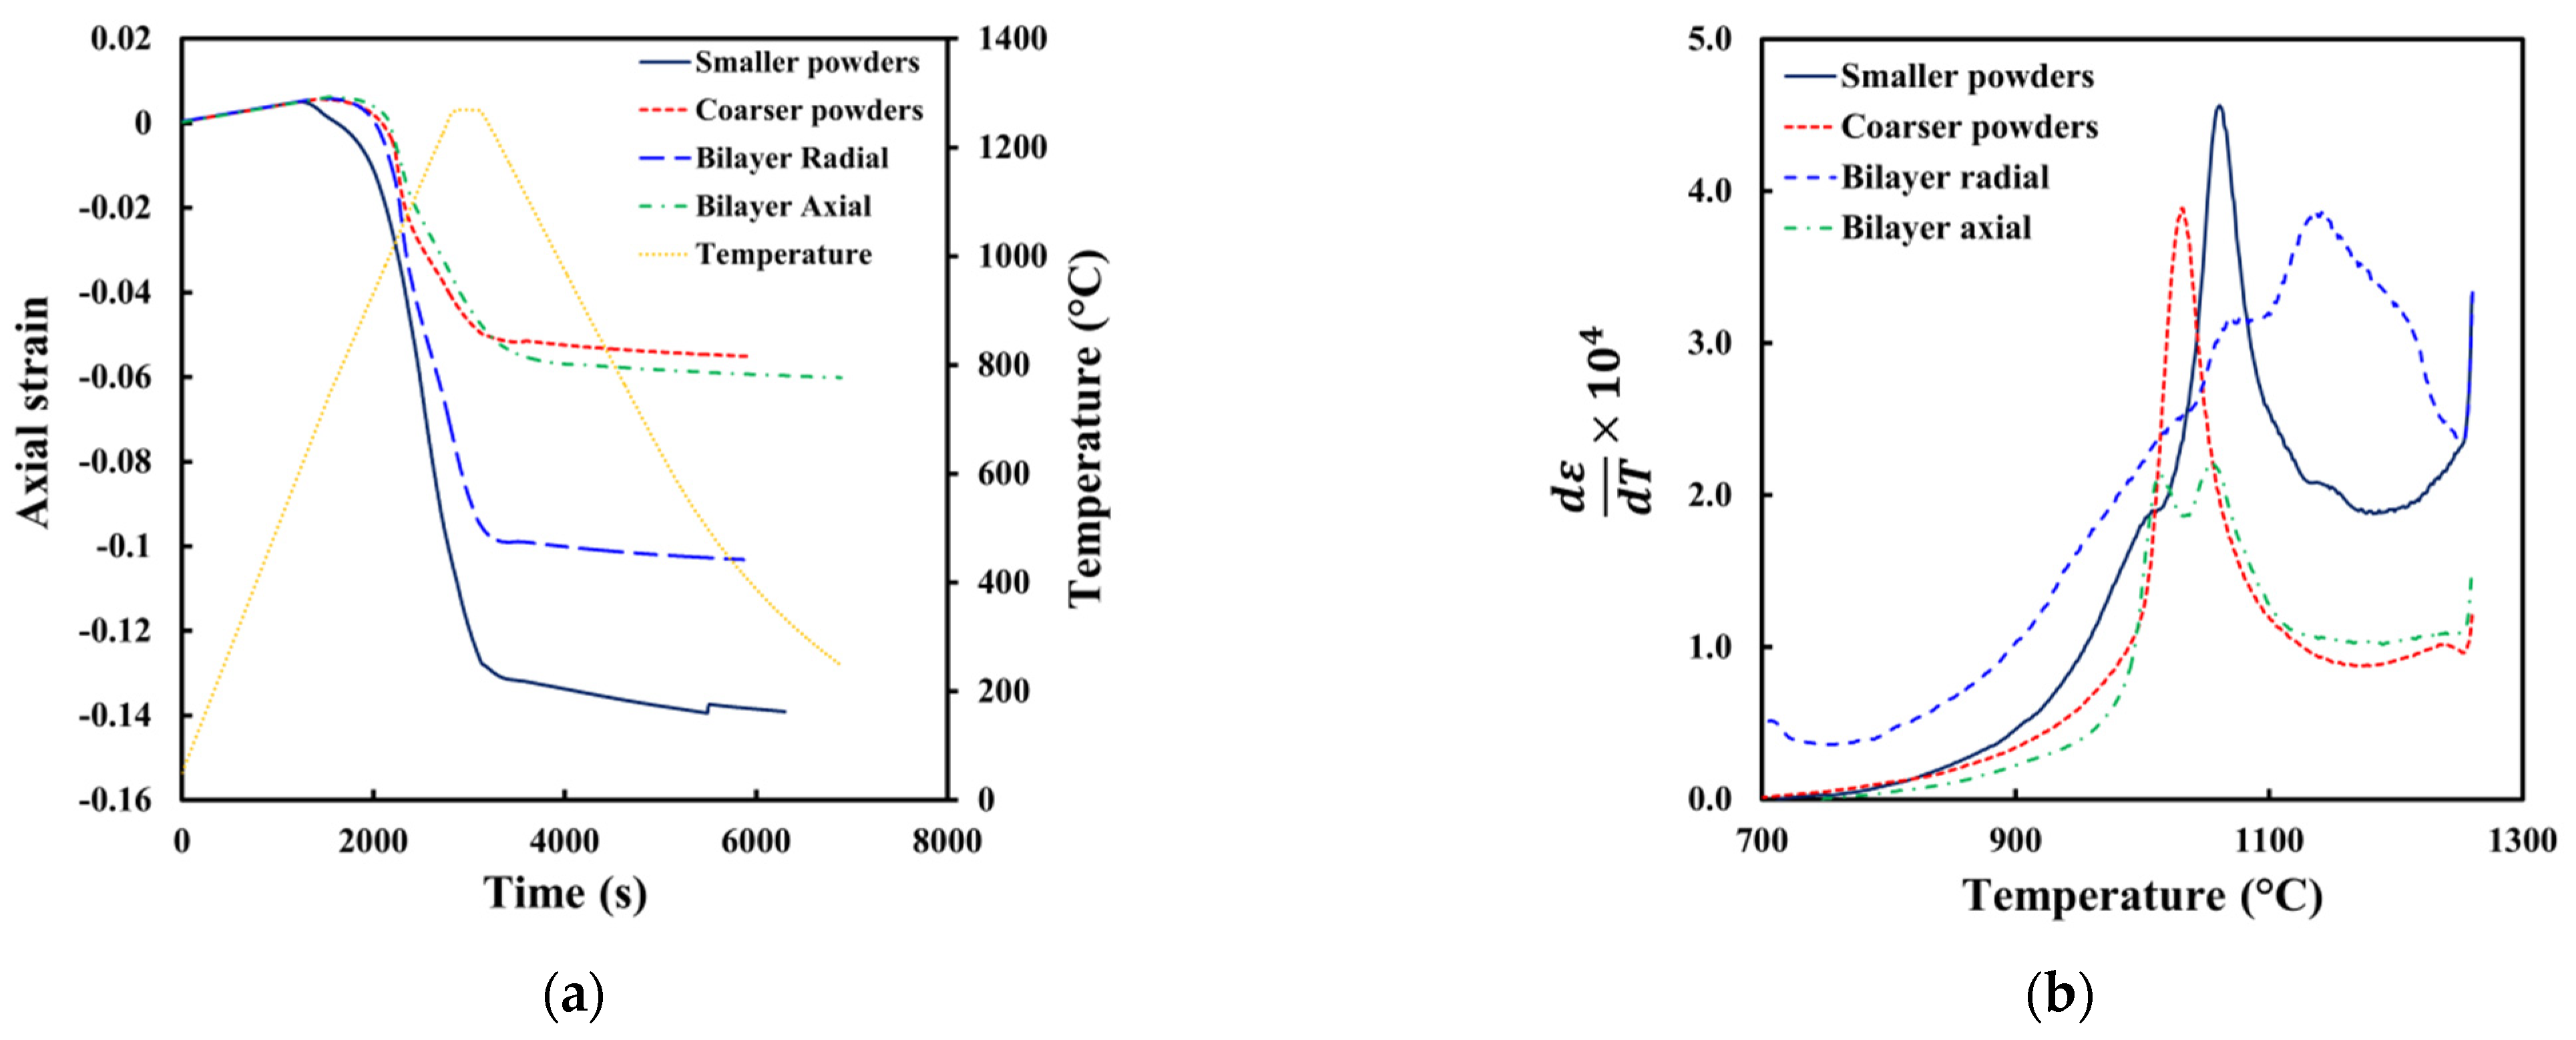
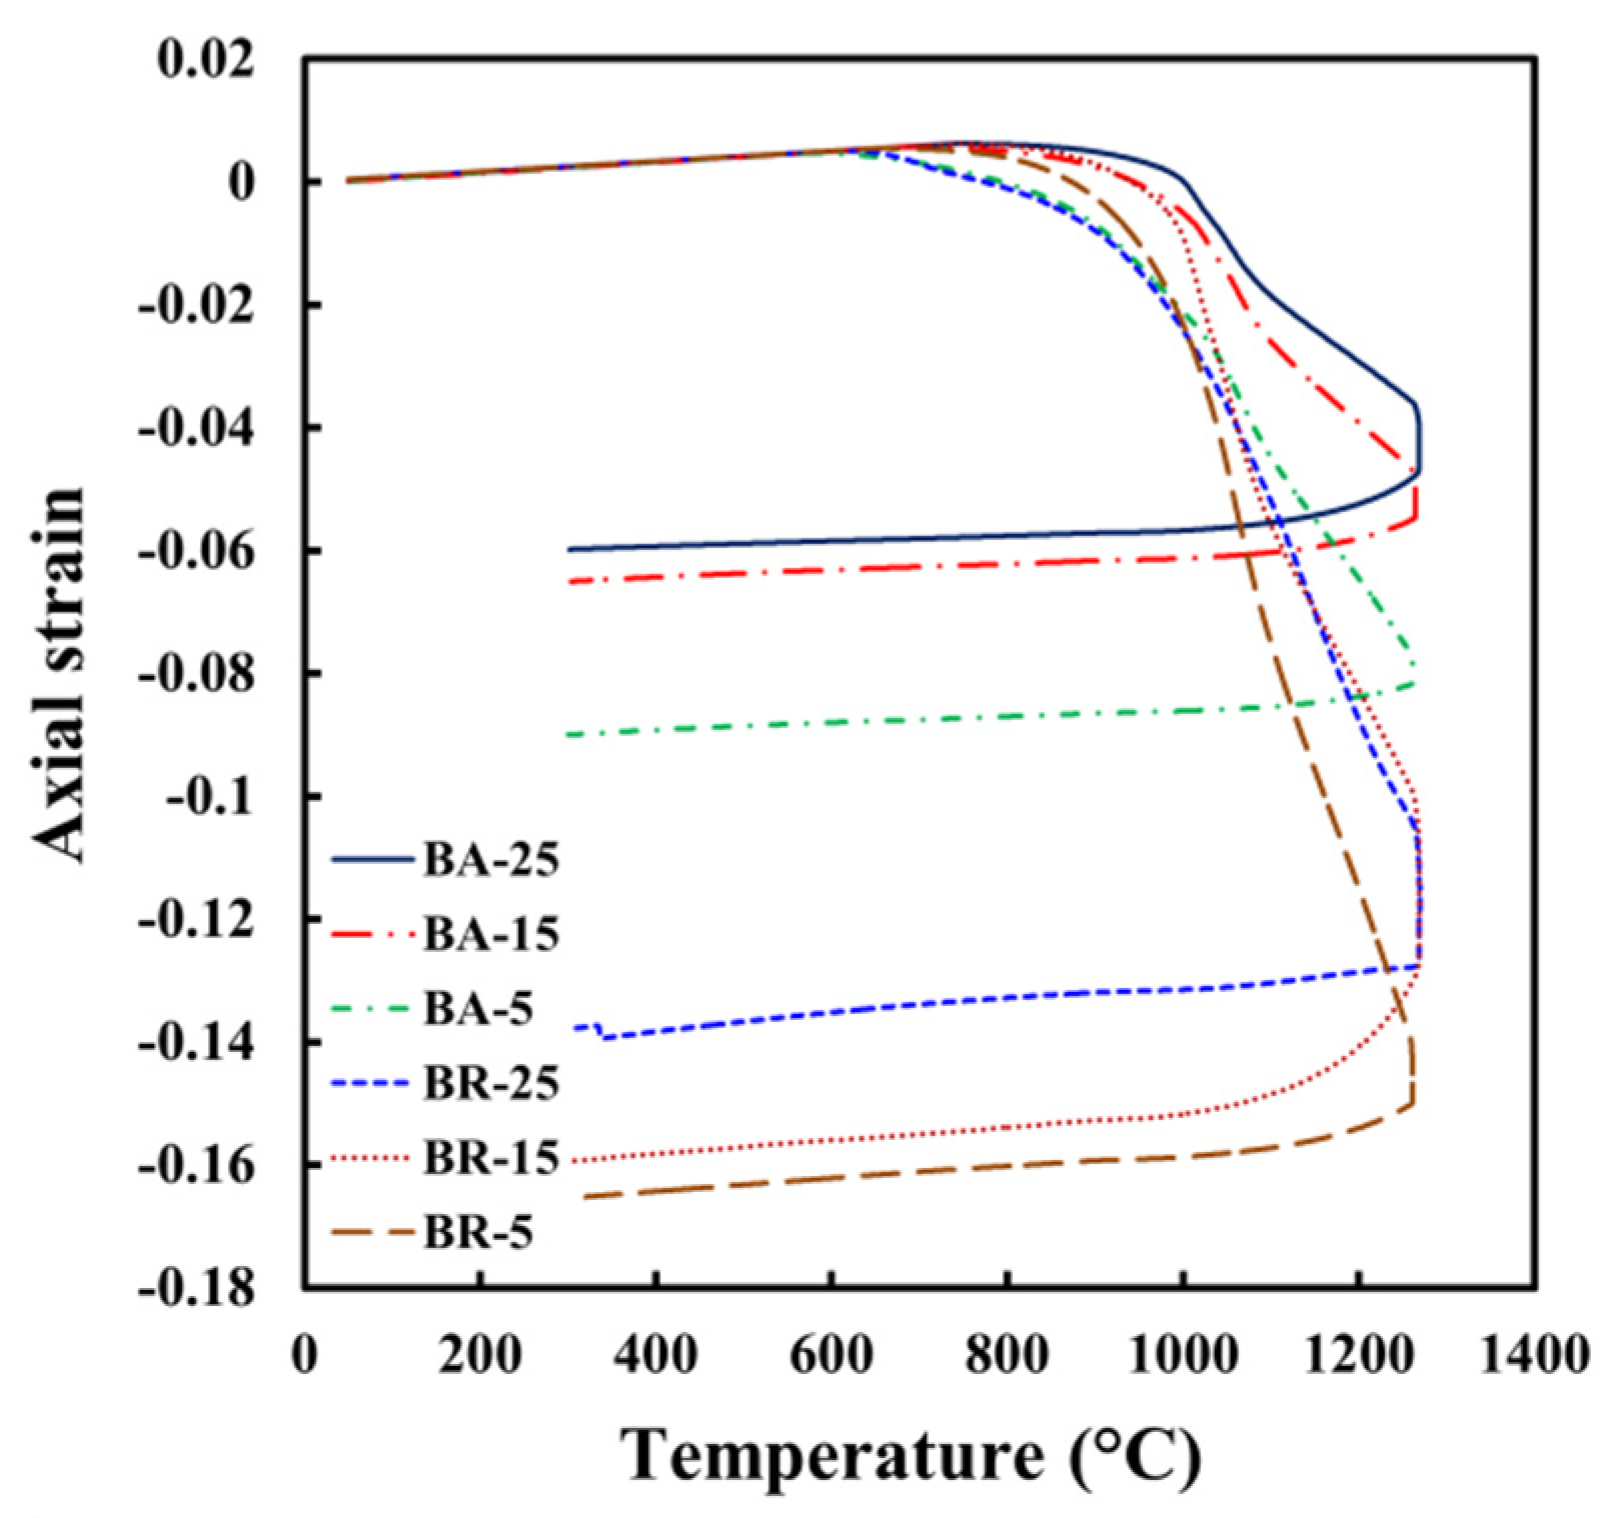
3.1. Sintering Kinetics

The axial strain for the different samples studied, as a function of the time and temperature during the entire thermal cycle, is depicted in Figure 2a. All samples show the same behavior. First, a positive deformation is due to the thermal dilation of the samples. Then a sharp negative deformation is found, which corresponds to the pore elimination by sintering. Finally, when the temperature reaches the sintering plateau, the axial deformation continues to be negative but with an exponential behavior. It is observed that smaller powders shrank at lower temperatures than coarser ones, which indicates that sintering was activated before. This is explained due to the smaller particles that show a higher surface energy that promotes the atomic diffusion during solid-state sintering [23]. The final deformation is 2.5 times larger for the sample with smaller particles in comparison to that reached by the coarser ones. A similar effect was reported for yttria-stabilized zirconia powder consolidated by flash sintering [24]. The behavior of bilayer samples falls between both monolith samples. However, the onset of sintering is driven by the coarser layer in both bilayers’ samples, as the shrinkage generated by the sintering is activated at the same temperature as that of the sample with coarser powders. Despite the fact that sintering is activated at the same time, a clear effect of the position of the layer is noted because the final deformation is larger when the radial configuration is used. This indicates that smaller powders induce stress at the interphase between both layers, which accelerates the shrinkage. On the other hand, each layer sinters more independently, although the axial strain is driven by the layer with the coarser powders.
The deformation rate as a function of the temperature during the heating stage is presented in Figure 2b for all samples heated at 25 °C/min. It is found that a maximum value of deformation rate is reached for the monolithic samples, which is higher for the sample with smaller particles, confirming the results discussed above. The bilayer samples show maximum values of the deformation rate, which correspond with the maximal ones of monolithic samples. For the axial configuration, the two peaks on the curve correspond approximately with the temperature of the peaks of the monolithic samples, indicating that each layer sinters independently with a low effect of the interphase. On the other hand, for the radial configuration, the maximal values of the deformation rate are reached later than the monolithic samples and the values are higher than those found in the axial configuration. This suggests that sintering is affected by the interphase along the vertical axis, though the maximal values of the deformation rate are retarded and the final deformation reached is larger than that of the bilayer with the axial configuration.
The effect of the heating rate on the axial strain is shown in Figure 3. As was expected, a slower heating rate increases the final strain and as has been discussed, the bilayers in the radial configuration show larger strains. However, the ratio between the maximal values of the strain diminishes from 2.5 to 1.9 times as the heating rate decreases from 25 to 5 °C/min.
The green and sintered relative densities of all samples studied were estimated by weighing the mass and measuring the volume of cylinders. The obtained values are listed in Table 3. The MSP-25 sample shows a lower green density than the MCP-25 sample, which is expected because smaller particles are more difficult to pack than coarser ones. However, the sintered density is 8% higher for the MSP-25 because sintering advances rapidly as the particle size diminishes. This confirms the findings about the axial strain. The bilayer samples have lower green relative densities than those obtained for monolithic samples, which indicates that packing is affected by the interphase of layers. Nonetheless, the green density of all bilayer samples has the same value, which is not expected because differences in packing between each layer should affect the final packing. The numeric values on the Table 3 show that the samples with the axial configuration (BA-X) have lower densities by sintered process respect at the samples with radial configuration (BR-X); independent of the heating rate. It can be noticed that the lower heating rates produce high densification but BA-5’s density is still less than BR-25. The highest value of the sintered relative density is obtained for the BR-5 sample, with a value of 78.59%. It is established that relative densities of bilayer samples BA-25 and BR-25 are close to the monolithic ones MCP-25 and MSP-25, respectively. The results confirm that volumetric densification has a strong relationship with the axial strain measured by dilatometry as is observed in Figure 2a.

3.2. Microstructural Characterization

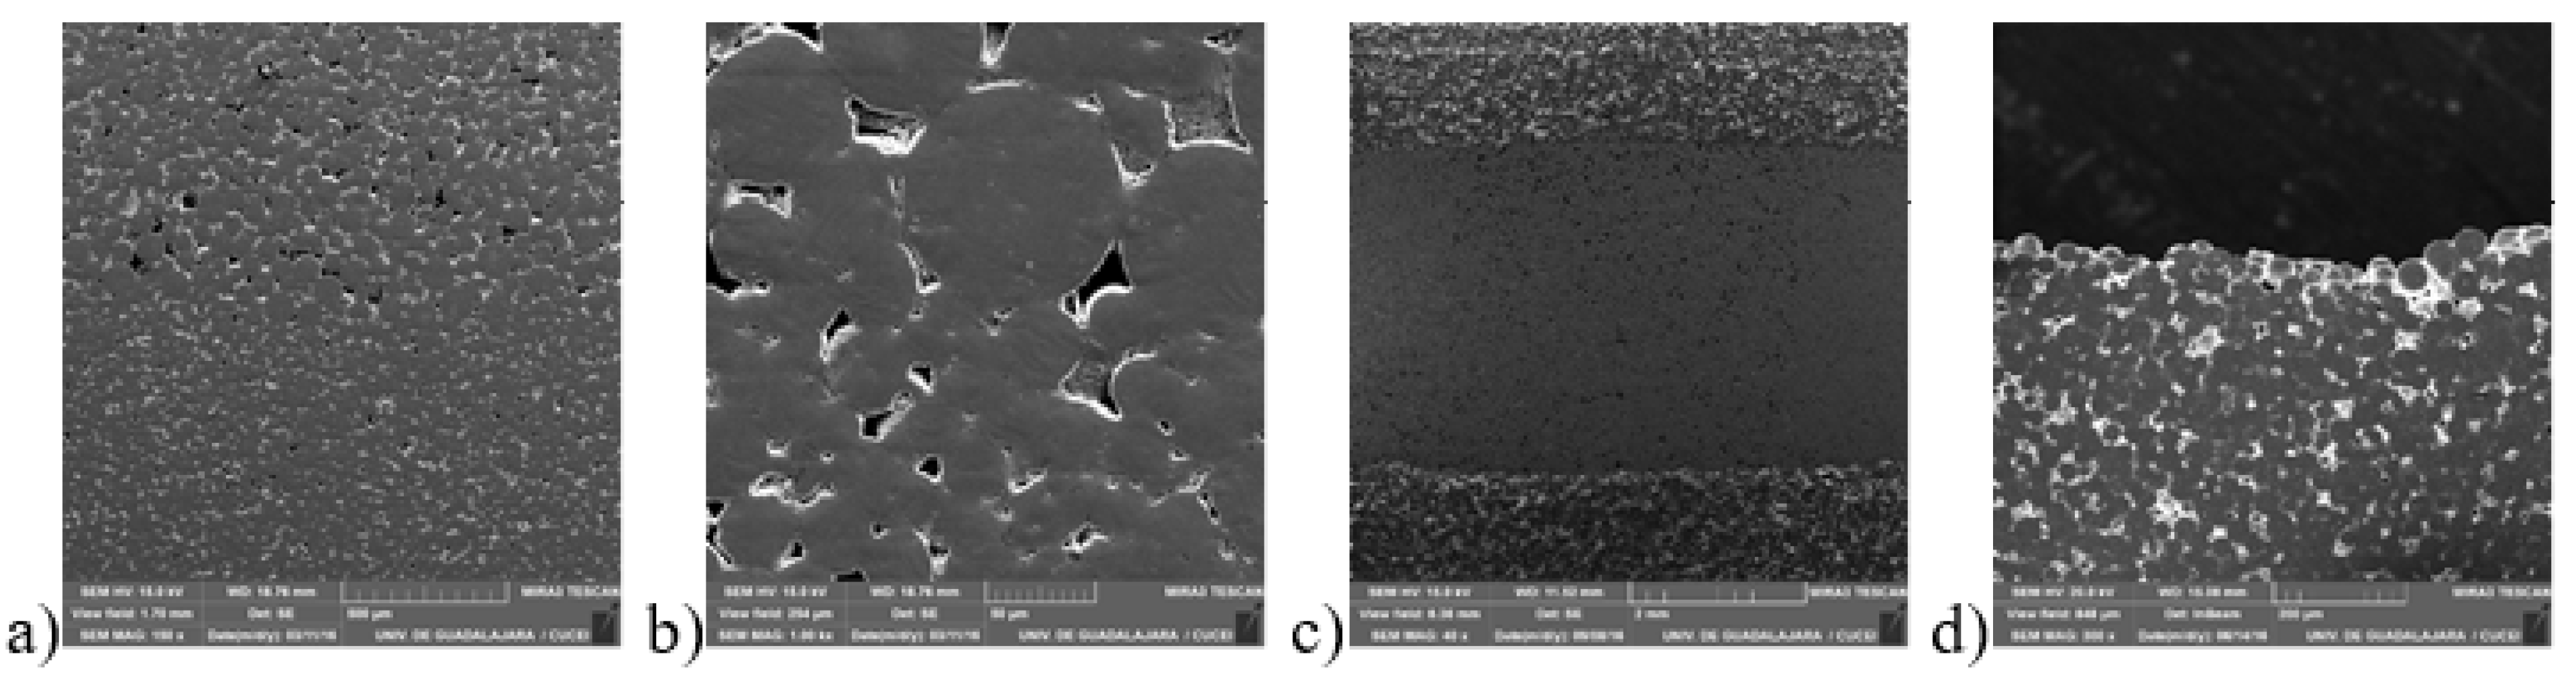
3.2.1. Scan Electronic Microscopy Observation

Microstructures of the bilayer samples are presented in Figure 4. The sample BA-25, Figure 4a,b, shows a clear division between both layers (interphase). The top layer is composed of coarser particles with a higher pore density. Despite this definition, through these 2D images, it is not possible to clearly establish the difference in the pore characteristics. Figure 4b is an approach of the interphase between both layers and it can be noticed that necks between particles are better developed for the smaller particles and the larger pores in the top layer between coarser particles. Because of surface preparation by cutting and polishing with alumina particles, some pores seems to be closed. Figure 4c,d show the polished surface of the BR-25 sample. The picture of Figure 4c shows a higher density of pores in the core composed of coarser particles; a more detailed difference about this observation will be exposed in the next section by using digital cutting planes (X-ray microtomography analysis). Figure 4d shows a section of the upper outline of the sample between the exterior edge and the core. On this borderline, it is possible to notice that the layer of smaller particles has undergone larger shrinkage in the axial direction compared to the core of the sample. From these images, we can determine that no fractures at the interphases were formed during sintering, despite the large difference in the deformation and deformation rate of both layers. This could be attributed to the lower densification required for the possible biomedical application.
Thus, the constraint stresses generated at the interphase between layers are weaker than those reported for bilayer ceramic processes by sintering [25].

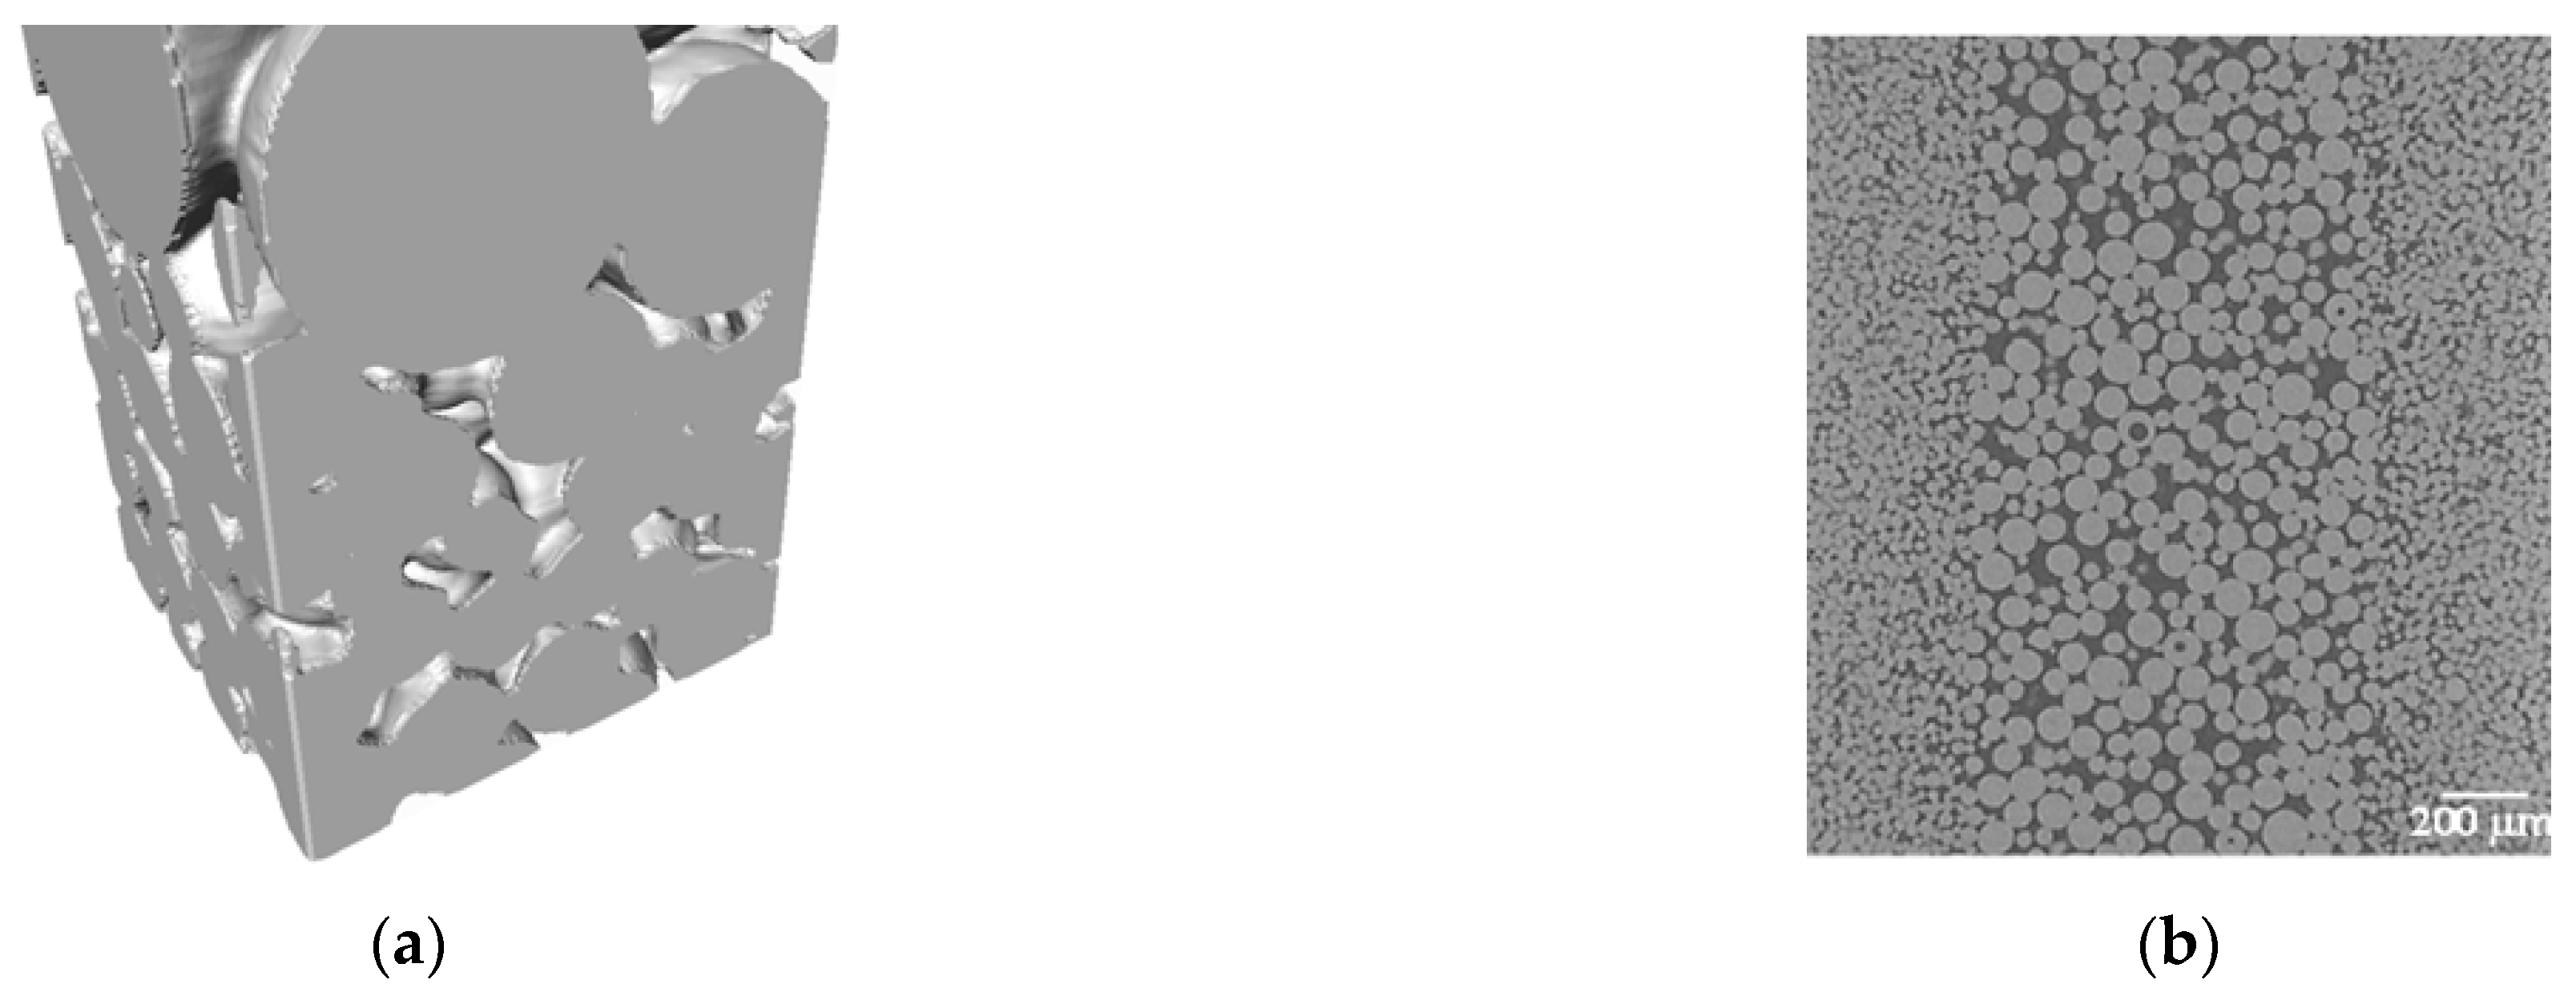
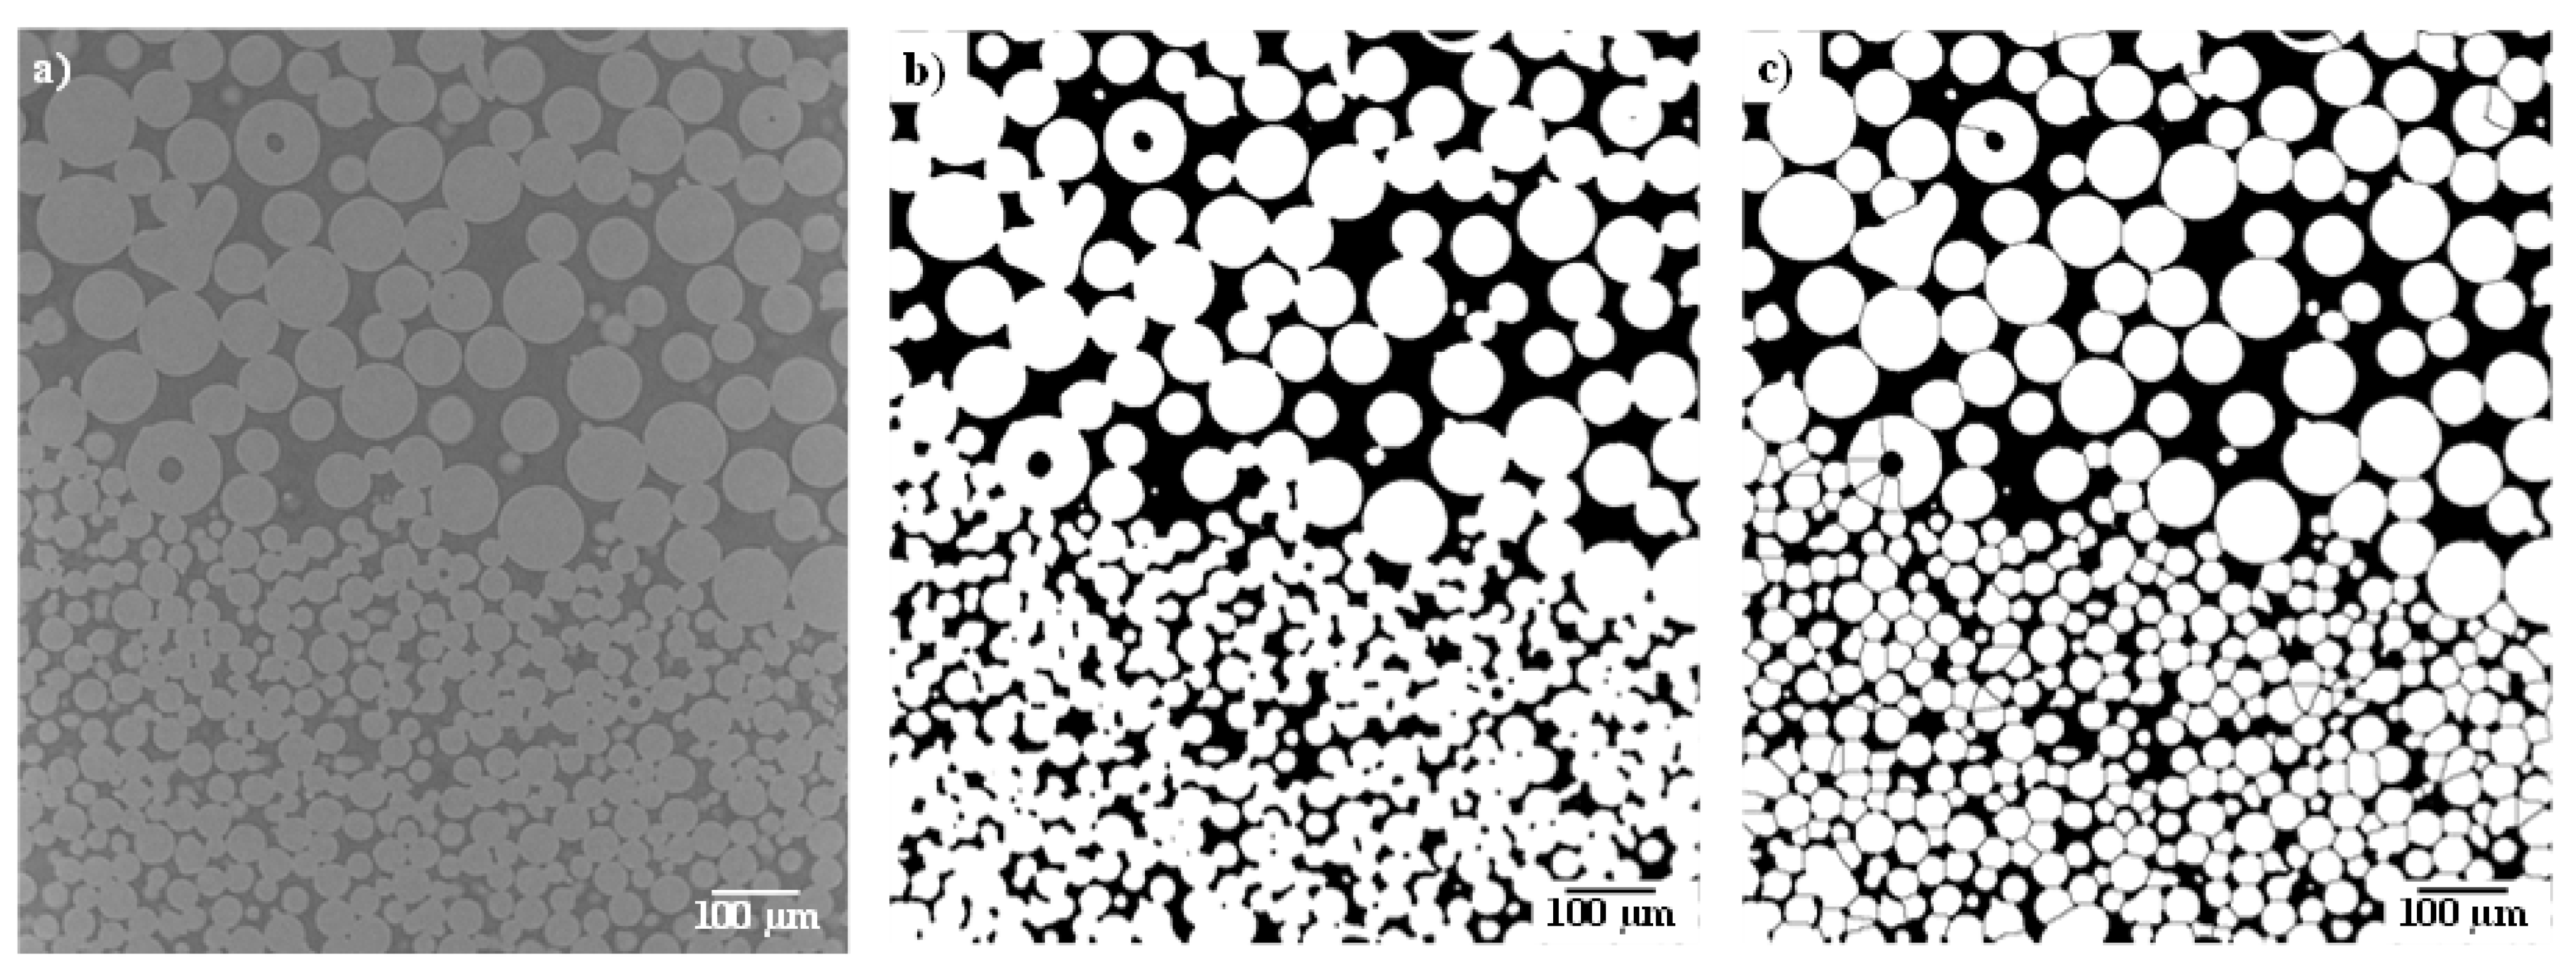
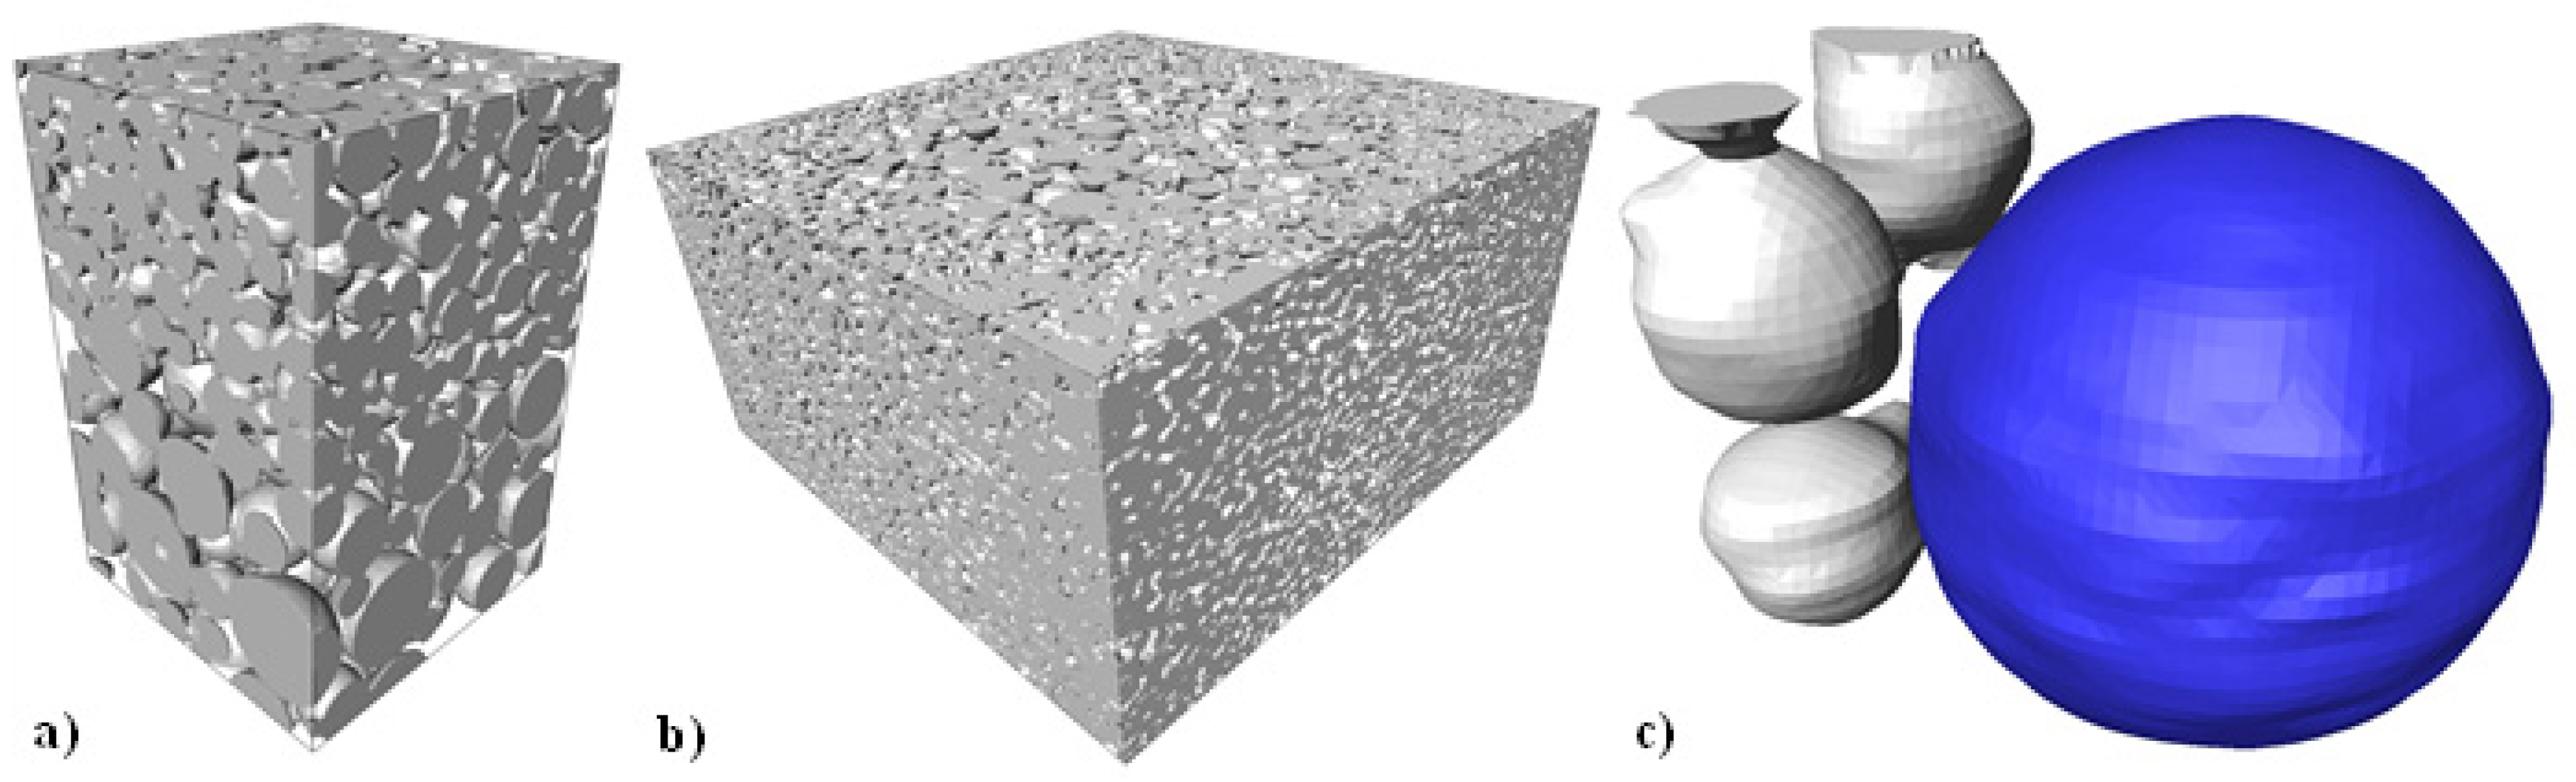
3.2.2. X-ray Microtomography Analysis

To obtain a deep analysis of the porosity generated by the radial and axial configuration of the bilayers, 3D images of the TBA-25 and TBR-25 samples were acquired using the Median and Unsharp mask filters with the open-source software Image J. Figure 5 shows a 3D and 2D virtual slice of both samples after reconstruction. Figure 5a shows the TBA-25 3D sample; it can be observed that the top layer is composed of coarser particles and the bottom layer of smaller particles. It can be seen that the interphase is not completely flat due to the fragile nature of the quartz capillary. Besides it is possible to better observe the porosity without surface modifications as the ones needed for SEM observation. The TBR-25 2D sample is shown in Figure 5b. We can observe that coarser particles are found in the core of the sample and that interphases are almost vertical. This indicates that the process method is optimal for elaboration of this type of configuration.
To enhance the contrast between the solid and void phases, 3D images were filtered with median and unsharp mask filters, obtaining good quality in the images, as we can observe in Figure 6a. The greyscale images were transformed into binary images to obtain quantitative information. A thresholding method was applied, separating the solid from the void spaces, in which the solid phase gets a value of 1 and void of 0, as can be observed in Figure 6b. This method allowed us to measure the pore volume fraction and size distribution and to run the permeability simulations. Finally, to obtain information like coordination number, neck size and distribution on the volume, a segmentation process was performed by following the watershed method used by Olmos et al. [26,27]. After this process, the particles are considered individual objects in the volume analyzed, as is shown in Figure 6c.
A 3D rendering of both samples TBA-25 and TBR-25 is shown in Figure 7a,b. Inner volumes were reconstructed due to the size of the sample. However, from these volumes, it can be observed that large particles are located at the bottom of Figure 7a and at the center of Figure 7b. Additional quantitative information will be presented from 3D images. Through this method, a coarse particle located at the interphase of the TBR-25 sample and the smaller particles that are in contact with it can be observed, as can be seen in Figure 7c. This helps to illustrate information at the particle level.
The quantitative data of the packing of particles is separated by layers; taking the whole sample into account, the 3D images allowed us to virtually select and crop the volume of interest inside the sample. The objective of this procedure was to establish the differences obtained after each layer of the bilayer samples was sintered. Table 4 lists the results involving particles and their environment, such as relative density, neck size (a/R), coordination number and particle sphericity. The relative density values calculated from the 3D images for TBA-25 and TBR-25 correspond to those measured from the volume and dimensions of the samples; see Table 3. The local values for each layer in both samples show that the layer with smaller particles is denser than the one with coarser particles. It is observed that the relative density for each layer in the TBA-25 sample is lower than that obtained in the monolithic samples for the same sintering conditions; see Table 3. This suggests that the stresses developed at the interphase reduce the densification in the corresponding layer, as was reported for sintering on solid substrates [28]. On the other hand, the values of the density measured in each layer of the TBR-25 sample correspond with those obtained for the monolithic samples, which indicates that radial configuration reduces the effect of interphase during densification.
The average ( a R ) ratio measured from the 3D data for each layer in both TBA-25 and TBR-25 samples increases as the relative density of the layer does, which is expected because the neck size is responsible for the densification. To validate the values obtained from the 3D images, the ( a R ) can be estimated from the geometrical relationship between axial shrinkage and the neck ratio proposed by German [29] as follows:
a R = ( Δ l l 0 b ) 1 2 ,
where:
  • ( a R ) , relationship between the neck’s radius and the particle’s diameter; ( Δ l l 0 ) , sample axial shrinkage; ( b ) , a parameter determined by experimental procedures with a value of 3.6.
Likewise, with the assumption that the volume changes are isotropic during sintering ( Δ V V 0 ) and because the mass remains constant during sintering, the relative density value reach ( D ) depends on the initial green density and the shrinkage as follows [29]:
D = D 0 ( 1 + Δ l l 0 ) 3 ,
where:
  • ( D 0 ) , is the initial relative density or green value.
Thus, an estimation of the neck size and the particle’s radius ratio can be calculated if one knows the relative density values by combining Equations (1) and (2), respectively. To estimate the ( a R ) ratio from Equations (1) and (2), the values of the ( D 0 ) for each layer were the ones measured for the MSP-25 and MCP-25 samples and the ( D ) values listed in Table 4. The ( a R ) obtained for the BA-25 smaller and coarser layers are 0.44 and 0.24. Meanwhile, the BR-25 smaller and coarser layers are 0.49 and 0.38, respectively. This demonstrates that the geometrical relationship of Equation (1) is a good approximation for lower values of relative densities, which is represented at early sintering stages.
The particle coordination number was calculated for each layer of both TBA-25 and TBR-25 samples after sintering by following the methodology used for Vagnon et al. [30]. The Z values increase as the relative density does for each layer, no matter their configuration. The Z value for the complete samples follows the same tendency.
The particles’ sphericity is another indicator of the sintering advance because, the lower the particle sphericity is, the higher the relative density, as is shown in Table 4, where the lower average value of sphericity is found for the layer that shows the highest densification.
The pore size distribution of both TBA-25 and TBR-25 samples is shown in Figure 8. To show the differences in the porosity that remained after sintering in each layer, the pore size distributions are estimated in subvolumes that contain only the characteristics of the smaller and coarser layers for both samples. As was expected, the smaller pore sizes are found in the layers with smaller particles and the pore size distribution of the complete sample falls in between both layers. To get a proper comparison of the porosity after sintering on both samples, the pore volume fraction, the median pore size (d50) and the tortuosity were measured from the 3D volumes, which are listed in Table 5.
The highest values for the pore volume fraction are found in the TBA-25 sample. Nevertheless, the larger median pore size was found for the TBR-25 sample, which indicates that the packing of particles in such a configuration is more complicated compared to the axial configuration. Qualitatively, the pore size distribution of the TBR-25 is slightly larger than that of the TBA-25, as can be noticed from Figure 8. The d50 obtained for the layer with smaller particles ranges between 14–16 µm and the d50 of particles is 36 µm, which means that the d50 pore size is close to 38% of the particle size. Similarly, the d50 pore size for the coarser particles ranges between 29–35 µm. Meanwhile, the particle size of d50 is 76 µm. The same ratio was found for the pore size, which represents 38% of the particle size. This indicates that the median pore size can be predicted from the initial particle size distribution when sintering takes place only in the early stages, as was also mentioned [26]. The values of tortuosity are very close for all layers ranging from 1.08–1.27, indicating that porosity shows a similar path in each layer. This happens because the particles are spherical and the sintering is in the early stage, which means that porosity is completely interconnected, as can be confirmed in the 3D rendering shown in Figure 9a,c.

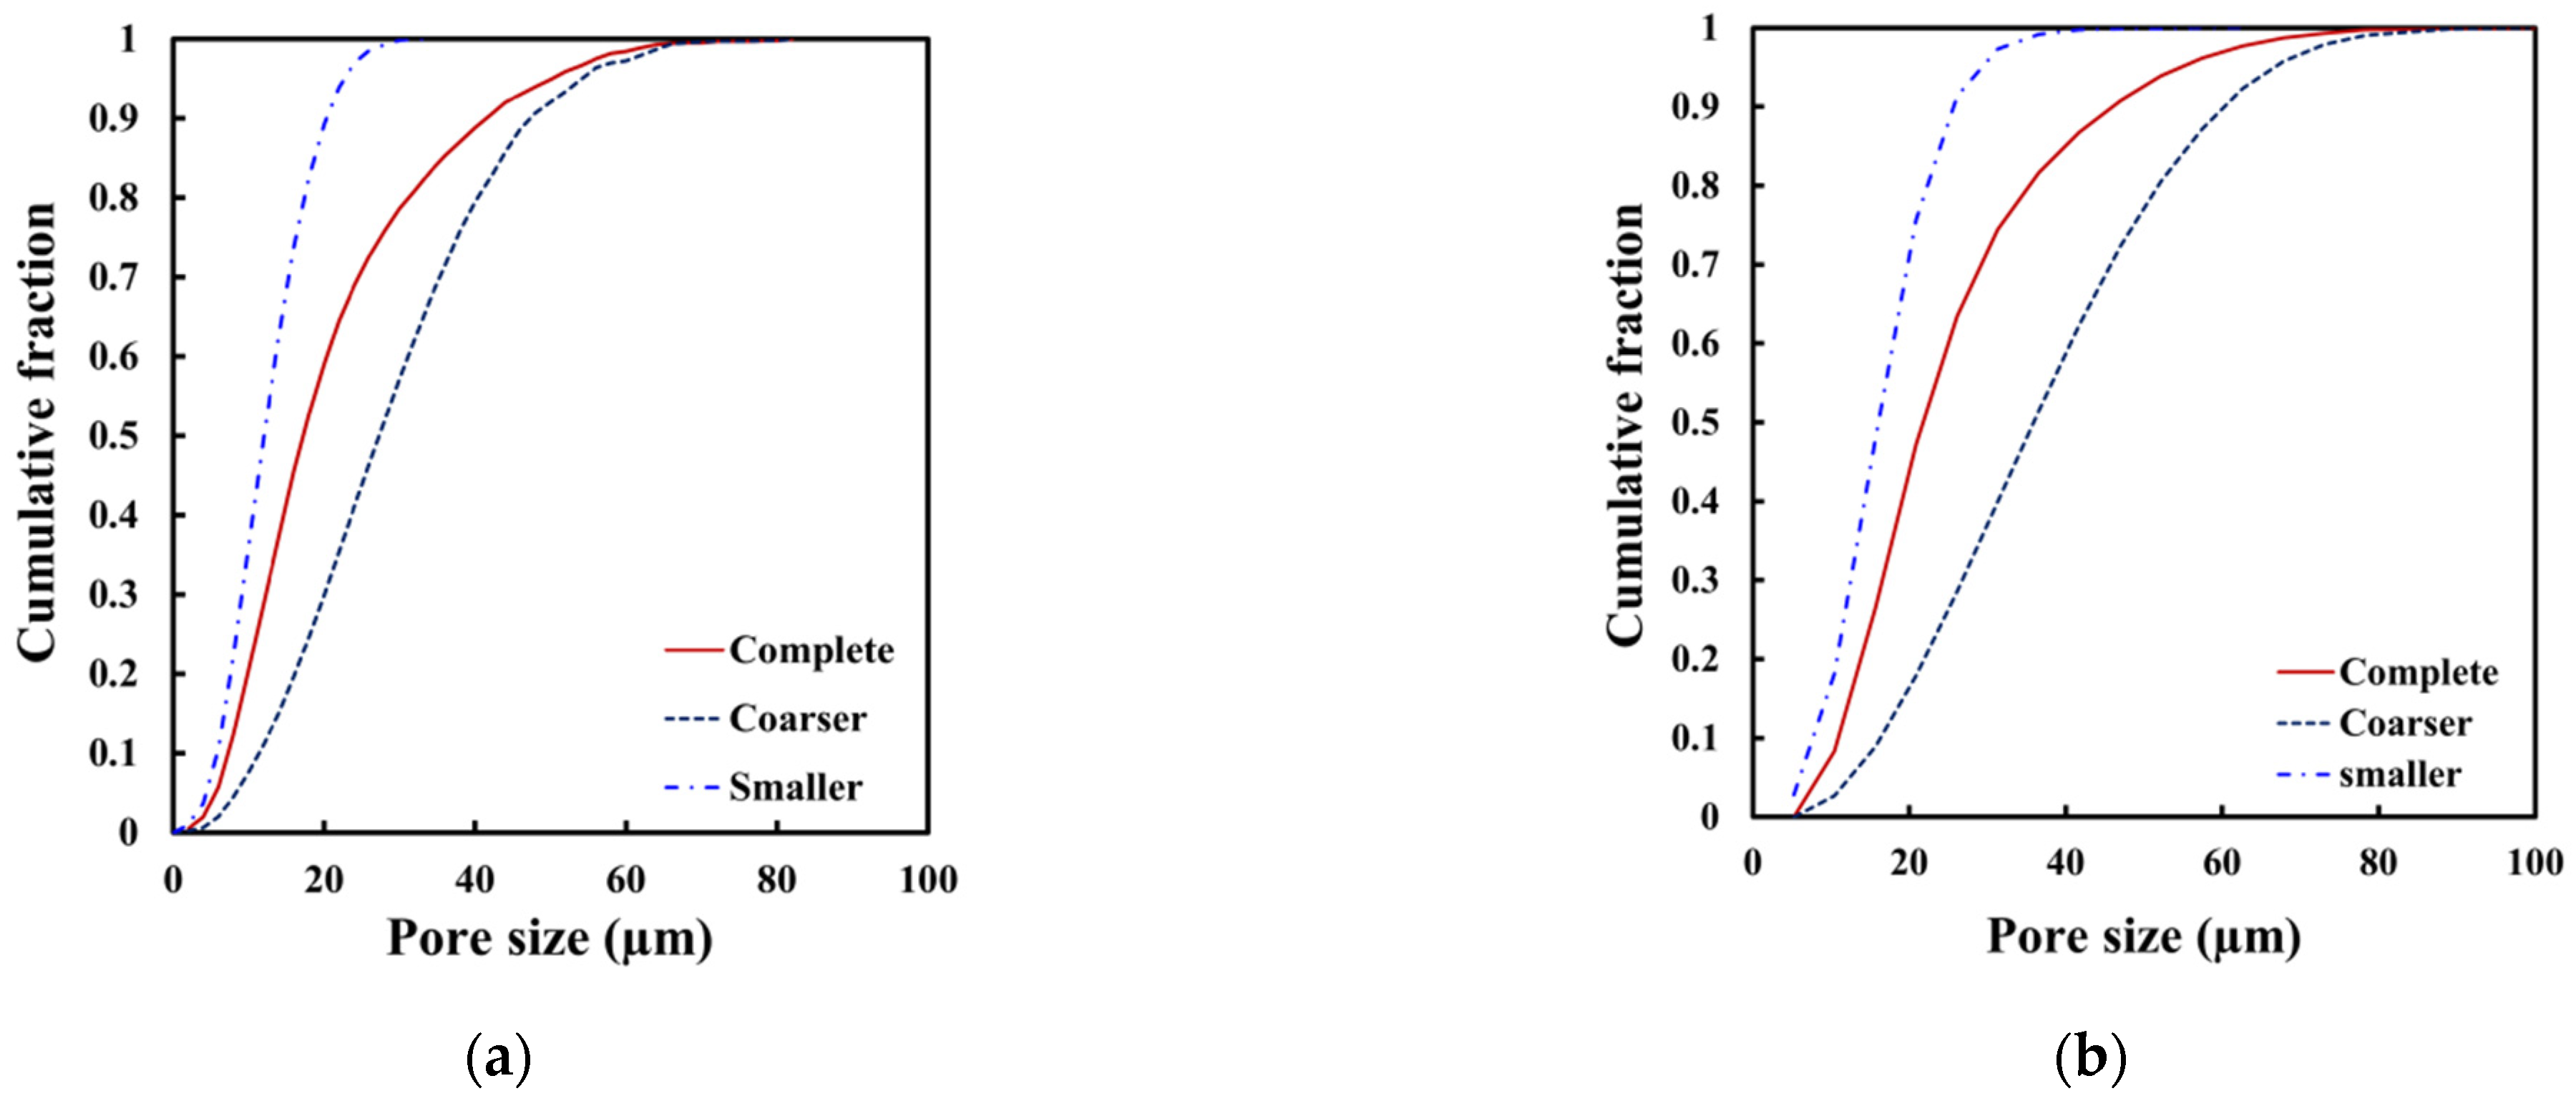
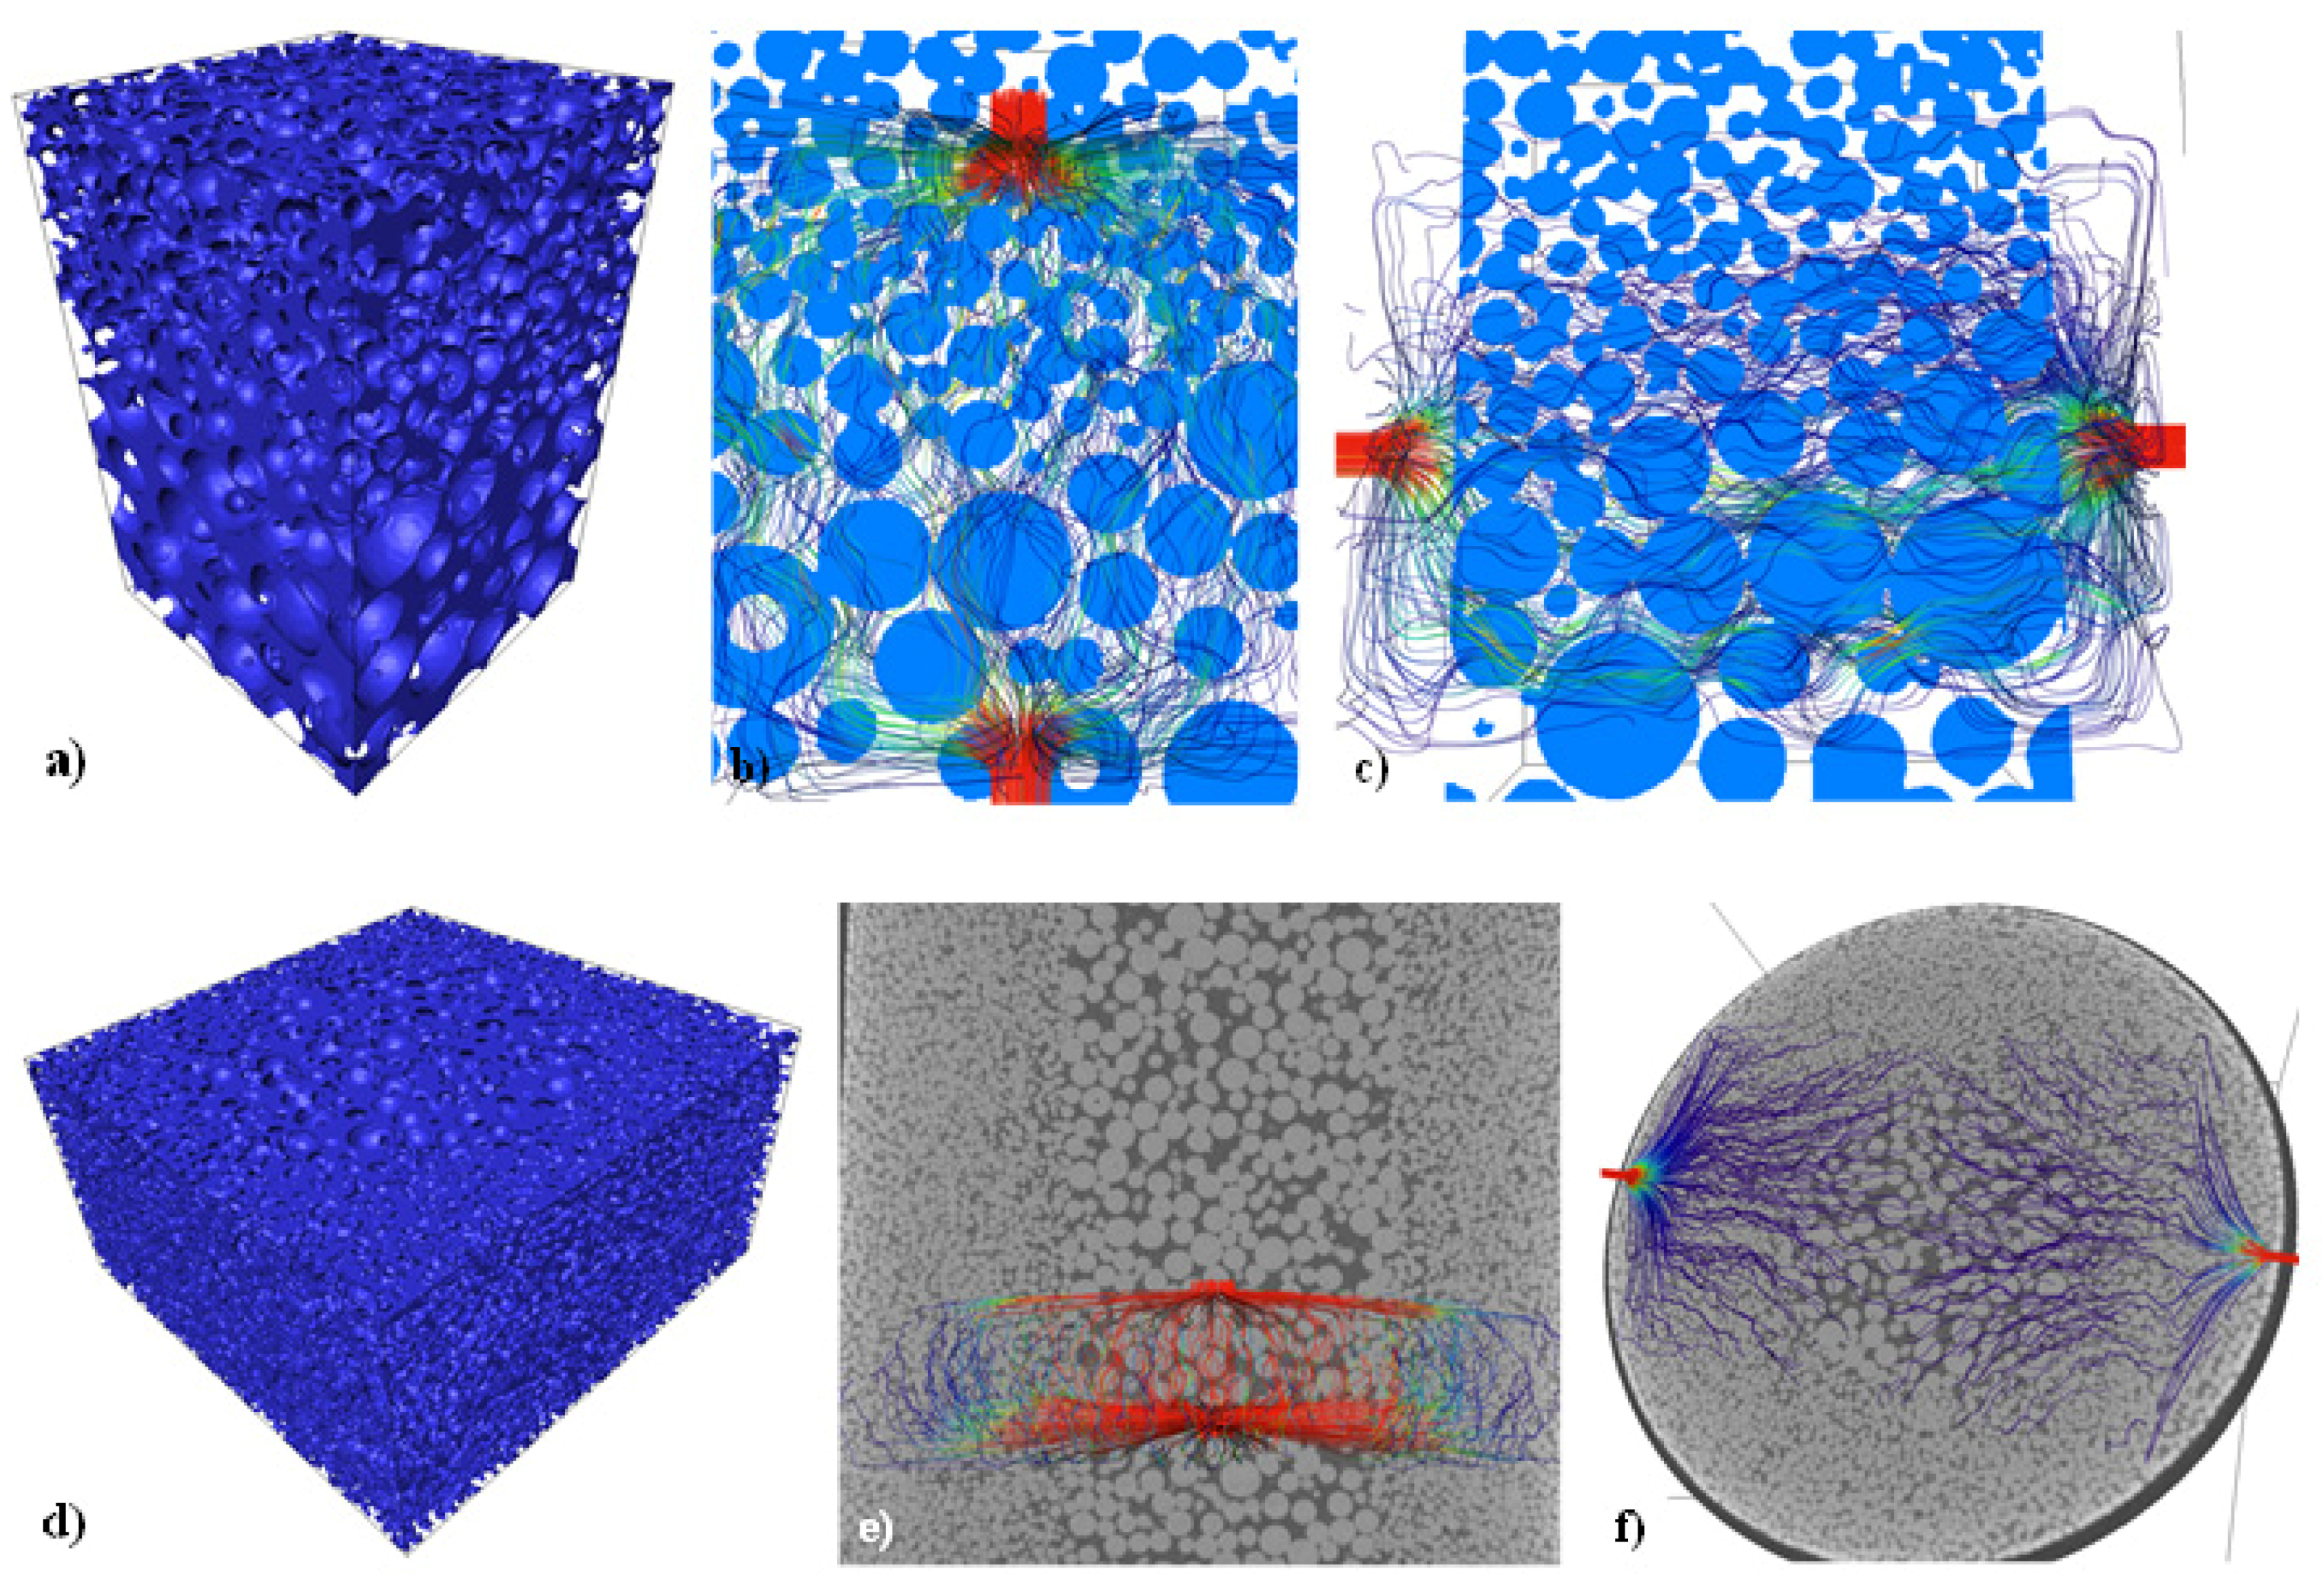
3.3. Permeability Evaluation

Figure 9 is a representation of a 3D rendering of the porosity found in the TBA-25 (Figure 9a) and TBR-25 (Figure 9d) samples, where it is possible to distinguish larger pores in the bottom and center of the samples as a consequence of the configuration of the layers, axial and radial, respectively. A pseudo color code to identify the connectivity of pores was used, obtaining only one color, which means that porosity is fully connected in both samples. Figure 9b,c show the flow path lines throughout the TBA-25 sample obtained from the numerical simulations in the axial and radial directions, respectively. The color code indicates the velocity of the fluid at any point in the volume, with red representing the highest velocity and blue the slowest. It is found that permeability in the radial direction is higher than in the axial one, for the TBA-25 sample, when the simulation is carried out in the whole sample. See Table 5.
To understand the behavior of the permeability, simulations were carried out in subvolumes containing only characteristics of each layer in both directions, axial and radial. The value of permeability in the layer with coarser particles is five times higher than the one with smaller particles. However, the permeability values estimated in the axial and radial directions are barely the same for each layer, which indicates a homogeneous porosity distribution in the sample. Therefore, when the fluid passes through the sample in the axial direction, the permeability is driven by the layer with the lowest permeability, as the fluid is forced to pass through that layer. For the radial direction, most of the fluid passes through the layer with the largest pores and the permeability is higher than in the axial direction. Qualitatively, the above mentioned can be deduced from the flow path lines shown in Figure 9b,c, where it can be noticed that the fluid can achieve a more tortuous and slower velocity when it is passing throughout the layer with smaller pores. In the radial direction, Figure 9c allows us to see more path lines in the bottom layer.
The values of permeability for the TBR-25 sample are slightly higher than those estimated for the TBA-25 sample but are in the same range. As was discussed above, the permeability shows a higher anisotropy when the complete sample is evaluated. For this case, the permeability higher values are obtained when the axial direction is evaluated. This is due to the fluid passing throughout the layer with larger pores that are located in the center of the sample, as can be noticed in Figure 9e. The permeability value in the axial direction is reduced by one-third of the value obtained for the layer with coarser particles. Figure 9f shows the flow path lines in the radial direction. As was mentioned, the paths become more tortuous in the layer with smaller particles. In that case, as the flow must pass twice throughout the layer with smaller particles, the permeability is close to the estimated value for that layer.
The values of permeability measured for the samples fabricated in this work are underestimated by three orders of magnitude compared to those measured by Grimm and Williams [31] for the human trabecular bone (0.4–11 × 10−9 m2) and those experimentally measured by Nauman et al. [11] in human vertebral and proximal femur bones, which have a large range of permeability values for human bones (2.68 × 10⁻¹¹–2 × 10⁻⁸ m2). On the other hand, the permeability values are in good agreement with the range measured for the natural cancellous bone (3 × 10⁻¹³–7.4 × 10⁻¹² m2) [32], which also has a maximal anisotropy in the permeability (axial/radial) of five times, similar to what was obtained by the radial configuration of layers. This is in agreement with that reported by Nauman et al. [11], who pointed out that permeability in human bones can reach high anisotropy in the permeability values, as much 22 times of difference between axial and radial directions.

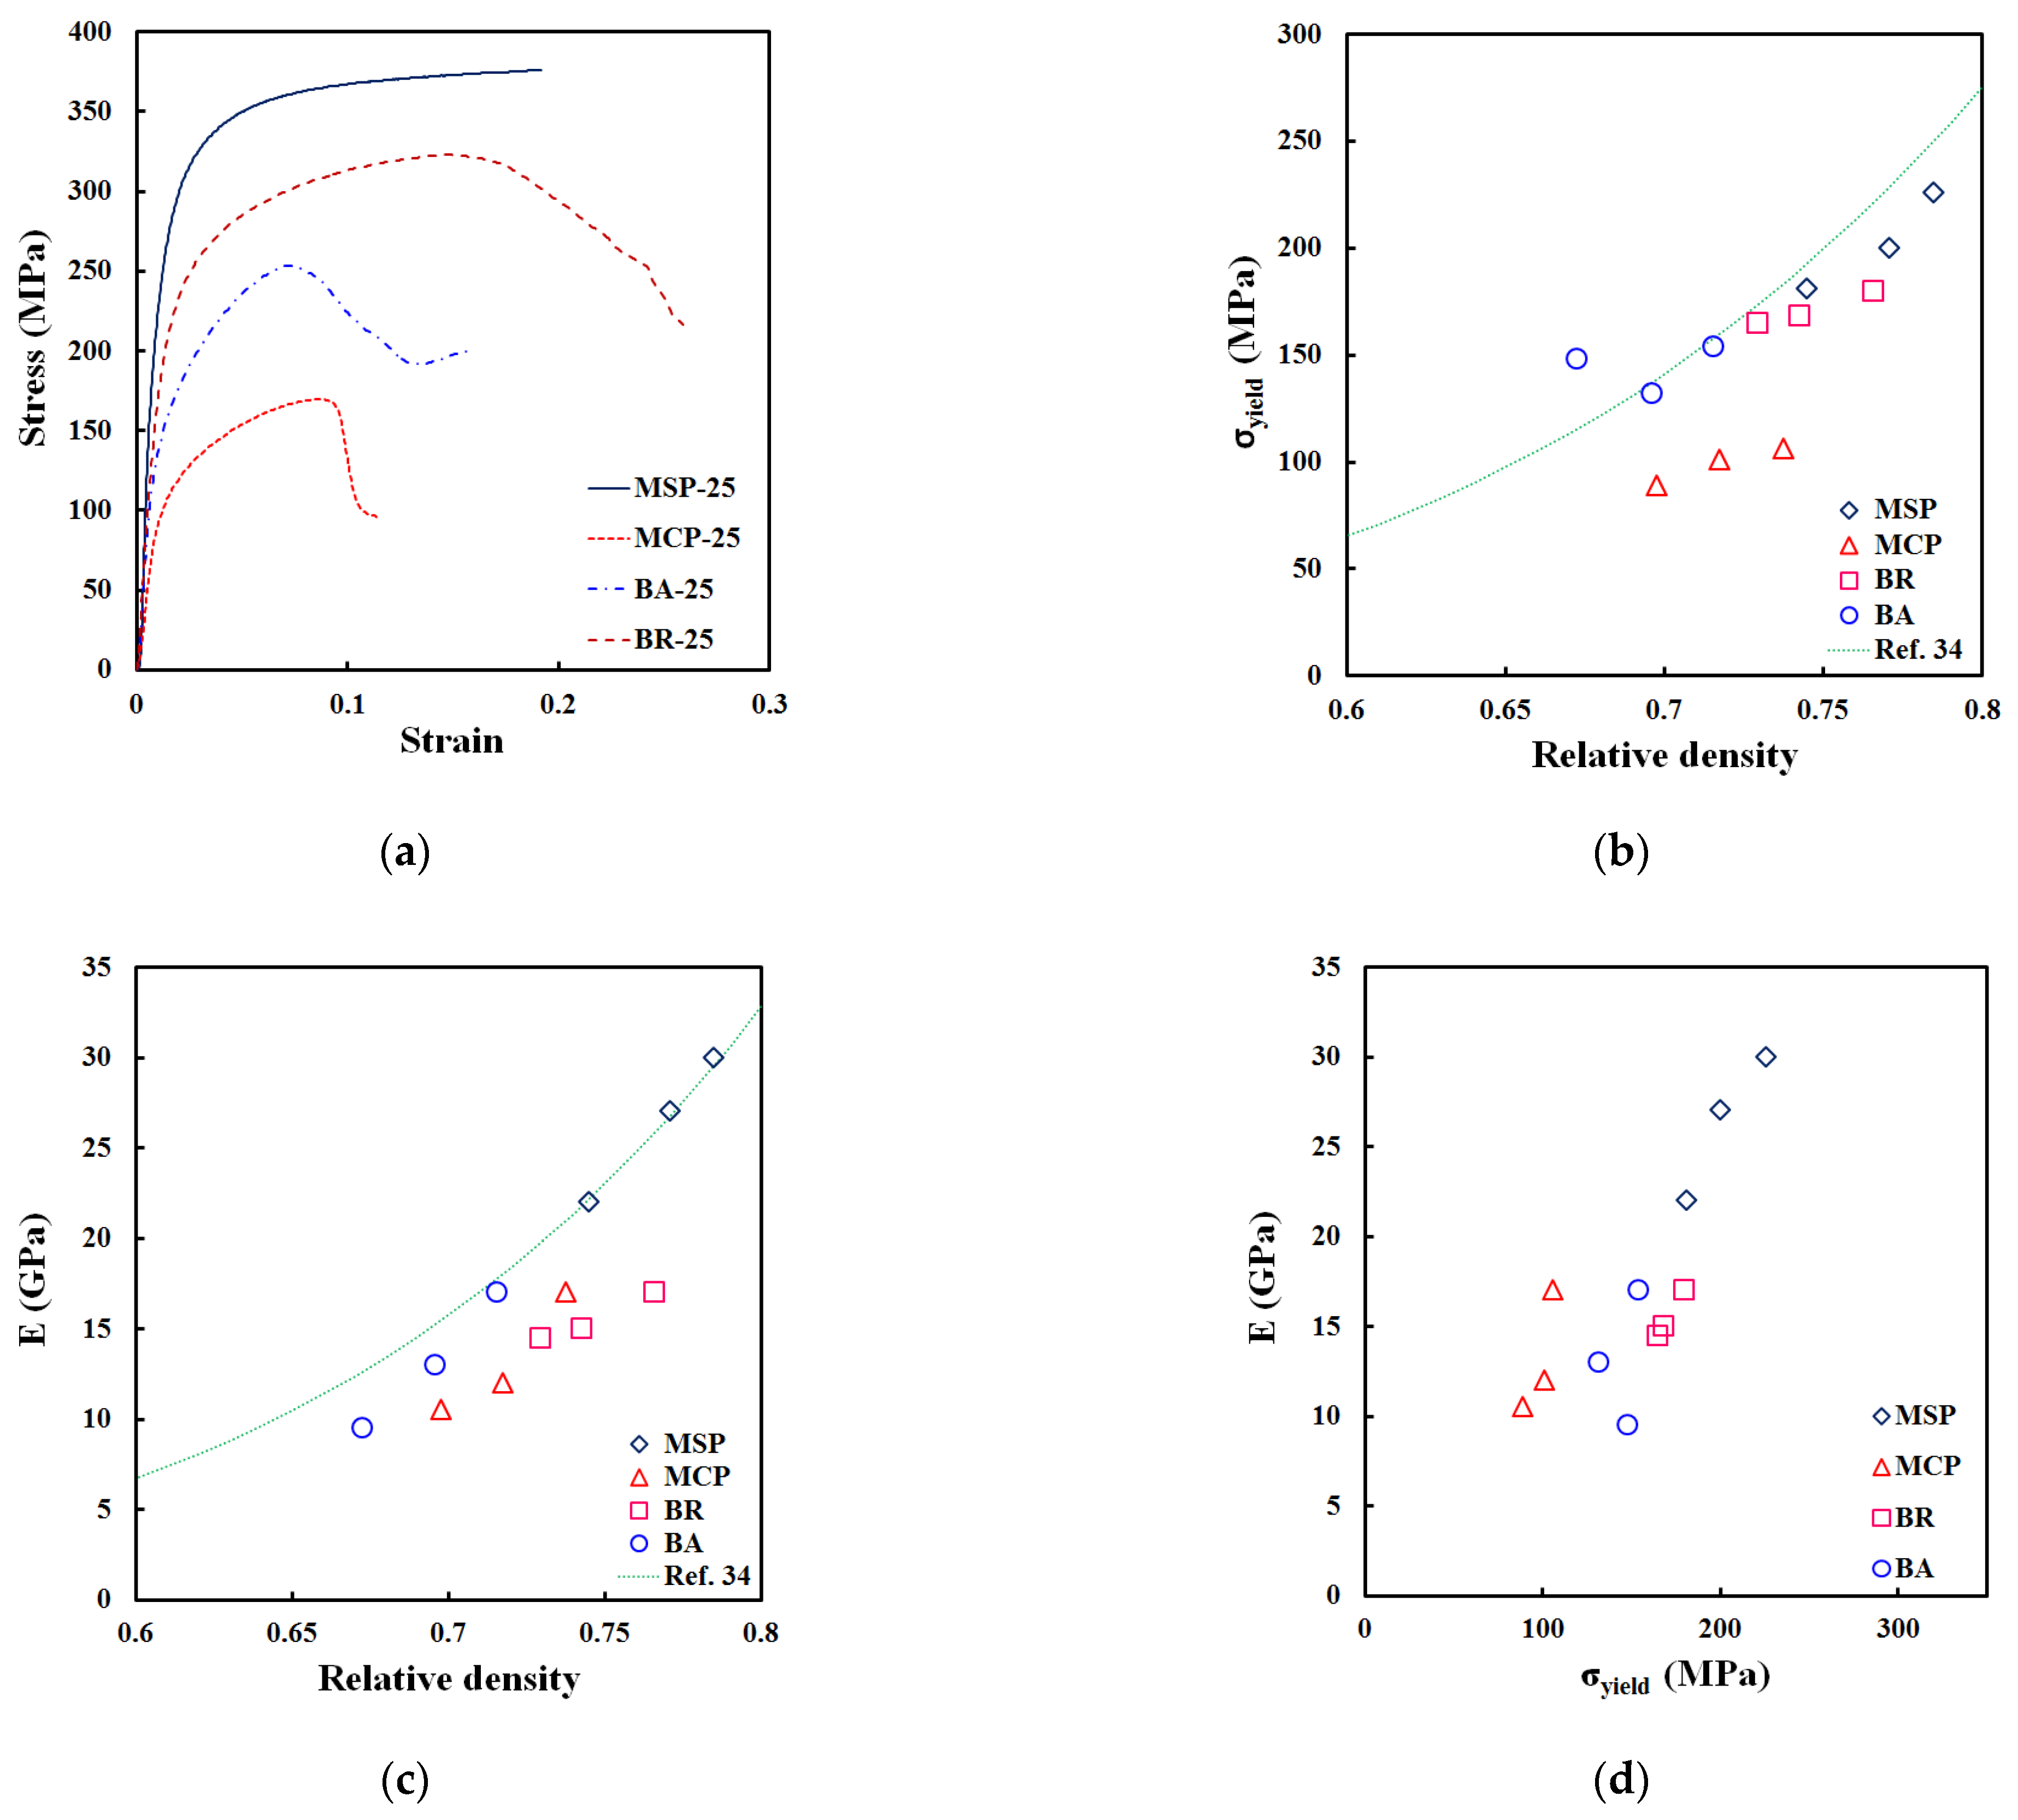
3.4. Mechanical Properties

The compression behavior of the bilayer samples is shown in Figure 10. Stress-strain curves of the MSP-25, MCP-25, BA-25 and BR-25 samples are plotted in Figure 10a. All samples show similar behavior, a linear increase in the stress as the strain increases, elastic zone and then a maximum value of the stress is reached until failure. The MSP-25 sample is the strongest among the others and the MCP-25 is the weakest. This is mainly because the relative density is higher for the MSP-25 sample, as well as the a/R ratio, which indicates that necks have a stronger connection between particles. The BA-25 and BR-25 samples show resistance in between the monolithic samples, which was expected. Qualitative analysis indicates that the BA-25 sample behaves as the MCP-25 one and the BR-25 shows similar behavior to the MSP-25 one. For the case of the axial configuration of layers, it is clear that the mechanical resistance is driven by the weakest layer with a small increment in the resistance due to the combination of both layers. Nevertheless, the mechanical values are closer to those of the MCP-25 sample. For the radial configuration of layers, it can be noticed that the resistance of the BR-25 is influenced by both layers and the values are closer to those of the MSP-25 sample. This indicates that the strongest layer can support more load during the compression test, as the weakest layer is in the core of the sample. These results show a similar trend to that reported by Ahmadi and Sadrnezhaad [15] for the compression behavior of foamy core samples, in which they suggest that mechanical resistance is linked to the foamy core diameter.
The Young’s modulus is estimated from the elastic zone of the stress-strain curves for all samples by fitting a slope in the zone mentioned. The results are depicted as a function of the relative density for the sample, Figure 10b. The higher value of E is 30 GPa and corresponds to the MSP-5 sample, which is the one with the highest relative density. We obtained a reduction of the E values for the monolithic samples when the relative density diminishes, which has been previously reported. However, the E values follow a power law as a function of the relative density that could be associated with that proposed by Gibson and Ashby [33] and modified by Cabezas et al. [34]. The E values calculated for the BA-X samples show a good agreement with the power law, which indicates that the mechanical response of the bilayer samples with axial configuration corresponds to the microstructure of the sample, with a normal effect of porosity. Also, the values of E for BR-X samples are lower than those calculated by the power law, with respect to the relative density of the whole sample. This suggests that stiffness is controlled by the sample with higher porosity. The E values obtained for the bilayer samples ranged between 9–17 GPa, agreeing with those reported for the compact bone [9].
The compressive strength is determined by the yield stress of samples and the values obtained from the stress-strain curves are plotted as a function of the samples’ relative density, Figure 10c. The values for the monolithic samples show a similar trend to E, which means the σyield diminishes as the relative density does. Nevertheless, it can be observed that samples with smaller particles have a better fit with the power law proposed by Cabezas et al. [34]. Meanwhile, the samples with coarser particles are overestimated by the power law. This can be attributed to the advance in the sintering because the a/R ratio is about two times smaller for coarser particles, for an increment of 3% on the relative density. This suggests that necks between particles are weaker and the failure of such samples is due to the necks breaking, which is shown in Figure 10a. Bilayer samples show good agreement with respect to the power law. It can be determined that BR-X samples with around the same relative density as MSP-X samples show a lower σyield, a result of the combination of layers that has an effect associated with either the a/R ratio or interphase wall effect.
To establish whether this kind of sample could perform well in orthopedic applications, the E values are depicted as a function of the σyield, Figure 10d. The combination of Young’s modulus and mechanical strength called “admissible strain” is defined as the strength-to-modulus ratio and the numerical study of the effect of several metallic elements was performed by Song et al. [35]. In this case, the higher the admissible strain, the more desirable the materials are for implant applications. It is found that stiffness and strength engage in near-linear behavior, in which the E increases as σyield does. The admissible strain values for all samples range from 6 to 15 × 10−3. Those values are higher than the ones reported by Zhou and Niinomi [36] for casting Ti-Ta alloys. On the other hand, those values are lower than those reported for porous materials [8], mainly because the addition of large pores reduces the stiffness of materials but the solid phase is more stable, which reduces the effect of porosity in the strength of the porous material. The highest value of the admissible strain was obtained for the BA-25 sample (15 × 10−3) and the second one with 11 × 10−3 is the BR-25 sample.

4. Conclusions

A novel experimental methodology to fabricate porous gradient materials with controlled porosity by powder metallurgy was proposed. The pore size distribution is determined by the initial particle size of powders and the sintering parameters of monolithic samples. Ti6Al4V bilayer components with two main configurations, axial and radial, were designed by placing particles with different size distributions in a determined place in the sample but any desired configuration can be achieved following this methodology. It was found that no cracks are developed at the interphase of bilayers components because the neck formation between particles is strong enough to support the stresses generated by different densification rates of layers.
It was assessed that mechanical properties and permeability are highly influenced by the configuration of layers, radial or axial one. The radial configuration of the layers is most suitable for bone implants because it is the natural configuration of bone and the Young’s modulus, yield stress and permeability values obtained are in good agreement with those reported for human bones. To reduce the E values, additional pores could be added to mimic the real porosity included in bones. This work is in progress by controlling the quantity and pore characteristics.

Author Contributions

J.S.T.-M.: conceptualization, formal analysis, investigation, writing—original draft preparation, writing-review and editing. L.O.: methodology, investigation, supervision, validation, writing-review and editing. V.M.S.-G.: methodology and investigation. H.J.V.-H.: advisor to graduate students, financial administration of the project and supervision as group head of the dilatometry laboratory. J.C.: methodology and investigation. D.A.: methodology, investigation, resources, software, visualization. All authors have read and agreed to the published version of the manuscript.

Funding

This research was funded by Tecnológico Nacional de México (TecNM)/Instituto Tecnológico de Morelia (ITM), through the Doctoral Program in Engineering Sciences. This support allowed the obtaining of J.S. Téllez-Martínez and V.M. Solorio-García. Additional funding was obtained by the CIC of the UMSNH and the Laboratorio Nacional SEDEAM. The Consejo Nacional de Ciencia y Tecnología (CONACyT) supported the posdoctoral program of J. Chávez (postdoctoral fellow, 000614).

Institutional Review Board Statement

Not applicable.

Informed Consent Statement

Not applicable.

Data Availability Statement

The manuscript “Processing and characterization of bilayer materials by solid state sintering for orthopedic applications” is an original work and has not been sent elsewhere. All the results are part of the research of the doctoral student (J.S. Téllez-Martínez), and the master’s degree student (V.M. Solorio-García). The experiments reported in this work focus on obtaining mechanical properties and permeability data in novel samples with a concentric bilayer structure of sintered particles. These data will be the basis for future works in the authors’ field of research.

Acknowledgments

The authors like to thank to the Laboratory “LUMIR” Geosciences of the UNAM, Juriquilla, for the 3D image acquisition and processing with microCT technology, and for the use of the Avizo® software. Finally, thank CONACyT for the support given to graduate students.

Conflicts of Interest

The authors declare no conflict of interest.

References

  1. Meulenberg, W.A.; Mertens, J.; Bram, M.; Buchkremer, H.-P.; Stöver, D. Graded porous TiO2 membranes for microfiltration. J. Eur. Ceram. Soc. 2006, 26, 449–454. [Google Scholar] [CrossRef]
  2. Reig, L.; Amigó, V.; Busquets, D.J.; Calero, J.A. Development of porous Ti6Al4V samples by microsphere sintering. J. Mater. Process. Technol. 2012, 212, 3–7. [Google Scholar] [CrossRef]
  3. Bender, S.; Chalivendra, V.; Rahbar, N.; el Wakil, S. Mechanical characterization and modeling of graded porous stainless steel specimens for possible bone implant applications. Int. J. Eng. Sci. 2012, 53, 67–73. [Google Scholar] [CrossRef]
  4. Torres, Y.; Trueba, P.; Pavón, J.J.; Chicardi, E.; Kamm, P.; García-Moreno, F.; Rodríguez-Ortiz, J.A. Design, processing and characterization of titanium with radial graded porosity for bone implants. Mater. Des. 2016, 110, 179–187. [Google Scholar] [CrossRef]
  5. Miao, X.; Sun, D. Graded/gradient porous biomaterials. Materials 2010, 3, 26–47. [Google Scholar] [CrossRef] [Green Version]
  6. Bahraminasab, M.; Sahari, B.B.; Edwards, K.L.; Farahmand, F.; Arumugam, M.; Hong, T.S. Aseptic loosening of femoral components—A review of current and future trends in materials used. Mater. Des. 2012, 42, 459–470. [Google Scholar] [CrossRef]
  7. Tirta, A.; Baek, E.R.; Chang, S.S.; Kim, J.H. Fabrication of porous material for micro component application by direct X-ray lithography and sintering. Microelectron Eng. 2012, 98, 297–300. [Google Scholar] [CrossRef]
  8. Cabezas-Villa, J.L.; Olmos, L.; Bouvard, D.; Lemus-Ruiz, J.; Jiménez, O. Processing and properties of highly porous Ti6Al4V mimicking human bones. J. Mater. Res. 2018, 33, 650–661. [Google Scholar] [CrossRef]
  9. Wang, X.; Xu, S.; Zhou, S.; Xu, W.; Leary, M.; Choong, P.; Xie, Y.M. Topological design and additive manufacturing of porous metals for bone scaffolds and orthopaedic implants: A review. Biomaterials 2016, 83, 127–141. [Google Scholar] [CrossRef]
  10. Torres, Y.; Rodríguez, J.A.; Arias, S.; Echeverry, M.; Robledo, S.; Amigo, V.; Pavón, J.J. Processing, characterization and biological testing of porous titanium obtained by space-holder technique. J. Mater. Sci. 2012, 47, 6565–6576. [Google Scholar] [CrossRef]
  11. Nauman, E.; Fong, K.; Keaveny, T. Dependence of intertrabecular permeability on flow direction and anatomic site. Ann. Biomed. Eng. 1999, 27, 517–524. [Google Scholar] [CrossRef] [PubMed]
  12. Daish, C.; Blanchard, R.; Gulati, K.; Losic, D.; Findlay, D.; Harvie, D.J.E.; Pivonka, P. Estimation of anisotropic permeability in trabecular bone based on microCT imaging and pore-scale fluid dynamics simulations. Bone Rep. 2017, 6, 129–139. [Google Scholar] [CrossRef] [PubMed] [Green Version]
  13. Dewidar, M.M.; Lim, J.K. Properties of solid core and porous surface Ti–6Al–4V implants manufactured by powder metallurgy. J. Alloys Compd. 2008, 454, 442–446. [Google Scholar] [CrossRef]
  14. Lee, J.H.; Park, H.J.; Hong, S.H.; Kim, J.T.; Lee, W.H.; Park, J.M.; Kim, K.B. Characterization and deformation behavior of Ti hybrid compacts with solid-to-porous gradient structure. Mater. Des. 2014, 60, 66–71. [Google Scholar] [CrossRef]
  15. Ahmadi, S.; Sadrnezhaad, S.K. A novel method for production of foamy core@ compact shell Ti6Al4V bone-like composite. J. Alloys Compd. 2016, 656, 416–422. [Google Scholar] [CrossRef]
  16. Trueba, P.; Chicardi, E.; Rodríguez-Ortiz, J.A.; Torres, Y. Development and implementation of a sequential compaction device to obtain radial graded porosity cylinders. J. Manuf. Process. 2020, 50, 142–153. [Google Scholar] [CrossRef]
  17. Matsuno, H.; Yokoyama, A.; Watari, F.; Uo, M.; Kawasaki, T. Biocompatibility and osteogenesis of refractory metal implants, titanium, hafnium, niobium, tantalum and rhenium. Biomaterials 2001. [Google Scholar] [CrossRef]
  18. Woodard, J.R.; Hilldore, A.J.; Lan, S.K.; Park, C.J.; Morgan, A.W.; Eurell, J.A.C.; Clark, S.G.; Wheeler, M.B.; Jamison, R.D.; Johnson, A.J.W. The mechanical properties and osteoconductivity of hydroxyapatite bone scaffolds with multi-scale porosity. Biomaterials 2007. [Google Scholar] [CrossRef]
  19. Takemoto, M.; Fujibayashi, S.; Neo, M.; Suzuki, J.; Kokubo, T.; Nakamura, T. Mechanical properties and osteoconductivity of porous bioactive titanium. Biomaterials 2005, 26, 6014–6023. [Google Scholar] [CrossRef]
  20. Dabrowski, B.; Swieszkowski, W.; Godlinski, D.; Kurzydlowski, K.J. Highly porous titanium scaffolds for orthopaedic applications. J. Biomed. Mater. Res. B Appl. Biomater. 2010, 95, 53–61. [Google Scholar] [CrossRef]
  21. Le, H.; Wang, C.A.; Huang, Y. Biomimetics Learning from Nature; InTechOpen: London, UK, 2010. [Google Scholar] [CrossRef]
  22. Kienapfel, H.; Sprey, C.; Wilke, A.; Griss, P. Implant fixation by bone ingrowth. J. Arthroplasty 1999, 14, 355–368. [Google Scholar] [CrossRef]
  23. Coble, R.L. Effects of particle-size distribution in initial-stage sintering. J. Am. Ceram. Soc. 1973, 56, 461–466. [Google Scholar] [CrossRef]
  24. Francis, J.S.; Cologna, M.; Raj, R. Particle size effects in flash sintering. J. Eur. Ceram. Soc. 2012, 32, 3129–3136. [Google Scholar] [CrossRef]
  25. Morsi, K.; Keshavan, H.; Bal, S. Processing of grain-size functionally gradient bioceramics for implant applications. J. Mater. Sci. Mater. Med. 2004, 15, 191–197. [Google Scholar] [CrossRef] [PubMed]
  26. Olmos, L.; Takahashi, T.; Bouvard, D.; Martin, C.L.; Salvo, L.; Bellet, D.; di Michiel, M. Analysing the sintering of heterogeneous powder structures by in situ microtomography. Philos. Mag. 2009. [Google Scholar] [CrossRef]
  27. Olmos, L.; Bouvard, D.; Cabezas-Villa, J.L.; Lemus-Ruiz, J.; Jiménez, O.; Arteaga, D. Analysis of compression and permeability behavior of porous Ti6Al4V by computed microtomography. Met. Mater. Int. 2019, 25, 669–682. [Google Scholar] [CrossRef]
  28. Martin, C.L.; Bordia, R.K. The effect of a substrate on the sintering of constrained films. Acta Mater. 2009, 57, 549–558. [Google Scholar] [CrossRef]
  29. German, R.M. Sintering theory and practice. Sol.-Terr. Phys. 1996, 568. [Google Scholar]
  30. Vagnon, A.; Rivière, J.P.; Missiaen, J.M.; Bellet, D.; Di Michiel, M.; Josserond, C.; Bouvard, D. 3D statistical analysis of a copper powder sintering observed in situ by synchrotron microtomography. Acta Mater. 2008, 56, 1084–1093. [Google Scholar] [CrossRef]
  31. Grimm, M.J.; Williams, J.L. Measurements of permeability in human calcaneal trabecular bone. J. Biomech. 1997, 30, 743–745. [Google Scholar] [CrossRef]
  32. Syahrom, A.; Kadir, M.R.A.; Harun, M.N.; Öchsner, A. Permeability study of cancellous bone and its idealised structures. Med. Eng. Phys. 2015, 37, 77–86. [Google Scholar] [CrossRef] [PubMed]
  33. Gibson, L.J.; Ashby, M.F. Cellular Solids: Structure and Properties; Cambridge University Press: Cambridge, UK, 1999; p. 52. [Google Scholar]
  34. Cabezas-Villa, J.L.; Lemus-Ruiz, J.; Bouvard, D.; Jiménez, O.; Vergara-Hernández, H.J.; Olmos, L. Sintering study of Ti6Al4V powders with different particle sizes and their mechanical properties. Int. J. Miner. Metall. Mater. 2018, 25, 1389–1401. [Google Scholar] [CrossRef]
  35. Song, Y.; Xu, D.S.; Yang, R.; Li, D.; Wu, W.T.; Guo, Z.X. Theoretical study of the effects of alloying elements on the strength and modulus of β-type bio-titanium alloys. Mater. Sci. Eng. A 1999, 260, 269–274. [Google Scholar] [CrossRef]
  36. Zhou, Y.L.; Niinomi, M. Ti–25Ta alloy with the best mechanical compatibility in Ti–Ta alloys for biomedical applications. Mater. Sci. Eng. C 2009, 29, 1061–1065. [Google Scholar] [CrossRef]
Figure 1. Scanning electronic microscopy (SEM) micrographs of Ti6Al4V powders sieved into two different particle size distributions: (a) 20–45 μm and (b) 45–75 μm.
Metals 11 00207 g001
Figure 2. (a) Axial strain as a function of time and temperature during the whole sintering cycle and (b) deformation rate as a function of the temperature during heating with a rate of 25 °C/min. Samples MSP-25, MCP-25, BA-25, BR-25.
Metals 11 00207 g002
Figure 3. Axial strain as a function of the temperature during the whole sintering cycle of bilayer samples sintered at 1260 °C with different heating rates from 5 to 25 °C/min.
Metals 11 00207 g003
Figure 4. SEM micrographs of bilayer samples sintered at 1260 °C with a heating rate of 25 °C/min; (a) and (b) BA-25 and (c) and (d) BR-25.
Metals 11 00207 g004
Figure 5. 3D and 2D virtual slices of samples of 1 and 2 mm in diameter, respectively, sintered at 1260 °C with a holding time of 5 min and a heating rate of 25 °C/min; (a) TBA-25 and (b) TBR-25.
Metals 11 00207 g005
Figure 6. 2D slice of the TBA-25 sample; (a) filtered image, (b) binary, (c) binary segmented.
Metals 11 00207 g006
Figure 7. Representation of the tridimensional internal volumes of the samples; (a) TBA-25 and (b) TBR-25 and (c) 3D particles at the interphase of TBR-25 after particle segmentation.
Metals 11 00207 g007
Figure 8. Pore size distribution of bilayer samples, (a) TBA-25 and (b) TBR-25.
Metals 11 00207 g008
Figure 9. 3D volume rendering of the porosity and streamlines for the fluid flow through pores in the axial and radial directions for TBA-25, (ac) and TBR-25, (df).
Metals 11 00207 g009
Figure 10. Compression behavior of the different samples tested; (a) stress-strain curves, (b) Young’s modulus as a function of the relative density, (c) yield stress as a function of the relative density and (d) Young’s modulus as a function of the yield stress.
Metals 11 00207 g010
Table 1. Characteristics and nomenclature of samples used for SEM and compression analysis with dimensions of 10 mm in diameter and 12 mm in height.
Sample TypeParticle Size (µm)Heating Rate
°C/min
NomenclatureFabrication Methodology
Metals 11 00207 i00120–45
(Volume Fraction Particles:1)
5MSP-5Monolithic samples were elaborated by pouring the particles into the crucible; then they were flattened by hand pressing with zirconia punch.
15MSP-15
25MSP-25
75–106
(Volume Fraction Particles: 1)
5MCP-25
15MCP-25
25MCP-25
Metals 11 00207 i00220–45
(Up Volume Fraction Particles: 0.5)
75–106
(Down Volume Fraction Particles: 0.5)
5BA-5To create a gradient of porosity in the axial direction, the sample was prepared by first pouring the smaller particles into a zirconia crucible. Then the surface was flattened by hand pressing with zirconia punch. The coarser particles were poured onto the smaller ones and the surface was again flattened.
15BA-15
25BA-25
Metals 11 00207 i00375–106
(Core Volume Fraction Particles: 0.25)
20–45
(Shell Volume Fraction Particles: 0.75)
5BR-5To create a gradient of porosity in the radial direction, this sample was fabricated by using a quartz tube of 5 mm inner diameter that was placed in the center of the zirconia crucible, where the coarser powders were poured. Then the smaller powders were poured around the quartz tube. Finally, the quartz tube was pulled out and the surface was flattened.
15BR-15
25BR-25
Table 2. Characteristics and nomenclature of the samples used for computed microtomography analysis with dimensions of 1 and 2 mm in diameter.
Sample TypeParticle Size (µm)Heating Rate
°C/min
NomenclatureFabrication Methodology
Metals 11 00207 i00475–106
(Up Volume Fraction Particles: 0.5)
20–45
(Down Volume Fraction Particles: 0.5)
25TBA-25This sample is fabricated by first pouring the smaller particles into a quartz crucible of 1 mm in diameter. Then the surface is flattened by hand pressing with a glass rod. Next, the coarser particles are poured over the smaller ones and the surface is again flattened.
Metals 11 00207 i00575–106
(Core Volume Fraction Particles: 0.25)
20–45
(Shell Volume Fraction Particles: 0.75)
25TBR-25This sample was prepared by using two quartz capillaries. The first one, with a 1 mm diameter, was used for the coarser powders. Then it was carefully introduced and placed on the center of a 2-mm-diameter capillary, where the smaller particles were poured around it. Finally, the smaller capillary was pulled out.
Table 3. Green and sintered relative densities of the different samples consolidated at different heating rates.
SampleGreen Density (D0)Sintered Density (Df)
MSP-250.61210.7413
MCP-250.62570.6902
BA-250.60080.6949
BA-150.60330.7003
BA-50.60040.7178
BR-250.60000.7308
BR-150.60160.7516
BR-50.60210.7859
Table 4. Quantitative data of the packing of particles of the two bilayer samples.
NomenclatureLayerRelative Density a R ZSphericity
TBA-25Smaller0.72210.437.520.7484
Coarser0.65640.255.830.8847
Complete0.6909-6.77-
TBR-25Smaller0.74940.487.950.7088
Coarser0.70630.396.460.7927
Complete0.7315-7.54--
Table 5. Porosity characteristics and properties.
LayerPore Volume Fraction (%)Median Pore Size (µm)TortuosityAxial Permeability (1 × 10⁻¹² m2)Radial Permeability (1 × 10⁻¹² m2)
TBA-25
Smaller27.7814.011.130.42330.4380
Coarser34.3629.271.222.29562.5903
Complete30.9017.241.180.81101.3368
TBR-25
Smaller25.0516.031.270.48140.3985
Coarser29.3935.861.083.05232.9721
Complete26.8421.771.172.09110.4854
Publisher’s Note: MDPI stays neutral with regard to jurisdictional claims in published maps and institutional affiliations.

