Article

Exploring the Strain Hardening Mechanisms of Ultrafine Grained Nickel Processed by Spark Plasma Sintering

by
Lucía García de la Cruz
1,
Mayerling Martinez Celis
1,
Clément Keller
2 and
Eric Hug
1,*
1
Laboratoire CRISMAT, UNICAEN, Normandie University, CNRS, 6 Bvd du Maréchal Juin, 14050 Caen, France
2
Groupe de Physique des Matériaux, CNRS-UMR6634, Université de Rouen, INSA de Rouen, Avenue de l′Université, 76800 Saint-Etienne du Rouvray, France
*
Author to whom correspondence should be addressed.
Metals 2021, 11(1), 65; https://doi.org/10.3390/met11010065
Submission received: 9 December 2020 / Revised: 24 December 2020 / Accepted: 28 December 2020 / Published: 30 December 2020

Abstract

:
Ultrafine grained (UFG) materials in the bigger grain size range (0.5–1) µm display a good combination of strength and ductility, unlike smaller size UFG and nanostructured metals, which usually exhibit high strength but low ductility. Such difference can be attributed to a change in plasticity mechanisms that modifies their strain hardening capability. The purpose of this work is to investigate the work hardening mechanisms of UFG nickel considering samples with grain sizes ranging from 0.82 to 25 µm. Specimens processed combining ball milling and spark plasma sintering were subjected to monotonous tensile testing up to fracture. Then, microstructural observations of the deformed state of the samples were carried out by electron backscattered diffraction and transmission electron microscopy. A lower strain hardening capability is observed with decreasing grain size. Samples in the submicrometric range display the three characteristic stages of strain hardening with a short second stage and the third stage beginning soon after yielding. Microstructural observations display a low fraction of low angle grain boundaries and dislocation density for the sample with d = 0.82 µm, suggesting changes in plasticity mechanisms early in the UFG range.

1. Introduction

Ultrafine grained (UFG) metals (with an average grain diameter d = 0.1–1 µm), situated between nanostructured metals (NsM) (d < 0.1 µm) and coarse grained (CG) materials display intriguing mechanical properties and plasticity mechanisms [1,2,3,4,5,6]. In CG polycrystals plastic deformation is controlled by dislocation dynamics, where dislocation sources can be found in grain boundaries and the grain core [7]. Meanwhile, in UFG/NsM metals, grain boundaries have been reported to be exclusively the dislocation sources and sinks, limiting their mean free path and consequently modifying their mechanical properties and hardening behavior [8,9]. The investigation of strain hardening in UFG/NsM metals is not straightforward for different reasons. The low ductility often displayed by such materials [10,11,12], with fracture or heterogeneous deformation after yielding, renders the study of the plasticity mechanisms and the determination of the classical stages of strain hardening challenging. In addition, the use of nonstandard tensile specimens [6,13,14] can generate confusing results if not analyzed correctly. F. Dalla Torre et al. [15] succeeded in the investigation of the evolution of the strain hardening rate and the hardening stages of two nanostructured Ni samples processed by electrodeposition (d = 21 ± 9 nm) and by high pressure torsion (d = 105 ± 69 nm). Both samples displayed a lower hardening rate than CG Ni, characterized by a steep decrease in the beginning of plastic deformation, and no transition between the first and second stages of work hardening. The reduced strain hardening capability has been explained in terms of a lower ability of the specimens to accumulate dislocations, which act as obstacles to dislocation glide. It has been reported [8,9] that in the UFG/NsM regime, dislocation storage is lessened by dynamic recovery and annihilation of dislocations at grain boundaries. Considering the continuous decrease in hardening rate with increasing strain for NsM, some authors consider that the third stage is directly reached whereas others suggest that no correlation exists between the hardening stages in conventional polycrystals and in NsM/UFG materials [15,16]. To help clarify these different positions, studies addressing the microstructure of NsM/UFG materials after tensile deformation are needed.
Despite the large bibliography concerning the mechanical properties of NsM and the smaller grain size range of UFG metals developed in the last three decades [17,18,19,20,21,22,23,24], information concerning strain hardening of larger grain sized UFG metals (also called submicrometric metals) is still lacking. The study of such samples could bring light to the transition, in terms of plasticity mechanisms, between conventional CG metals and NsM. Investigations on the mechanical properties of UFG copper [25], aluminum [26] and austenitic stainless steel [27] display an intriguing transition of tensile deformation behavior in samples with grain sizes in the range 0.4–4 µm. In this face centered cubic metals, a Lüders-type deformation, preceded in some cases by a yield drop, was observed in the beginning of plastic deformation. Moreover, the yield strength of specimens displaying the Lüders-type deformation was reported higher than the expected value from the Hall–Petch relation for aluminum by Yu et al. [26]. It was shown that such deviation corresponds to inhomogeneous yielding associated with a lack of mobile dislocations in the smaller grains of the UFG microstructures in the beginning of plastic deformation. This feature has also been observed by the authors in a previous article dedicated to the mechanical properties assessment of UFG Ni polycrystals [28]. The persistence of the deviation in UFG Ni, at a lower extent, at higher deformation states, suggests changes in the strain hardening mechanisms.
A large bibliography is available for pure Ni, often used as model material to investigate different properties such as diffusivity, mechanical strength, resistivity, etc. [29,30,31,32,33]. The lack of complex phases, precipitates or other structural features simplifies the study of such properties enabling the investigation of the effect of single parameters (grain size for instance). Thus, Ni was chosen as a starting point to understanding plastic deformation in UFG materials that are more complex.
This paper aims to study the evolution of strain hardening mechanisms for samples with grain sizes in the range 0.82–25 µm and to contribute to the knowledge of plastic deformation in the UFG range. Uniaxial tensile testing up to fracture was performed using standardized specimens and the obtained results analyzed focusing in strain hardening. Finally, electron backscattered diffraction (EBSD) and transition electron microscopy (TEM) were used to examine microstructures deformed at fracture and investigate dislocation accumulation and structures, shedding light on the hardening mechanisms.

2. Materials and Methods

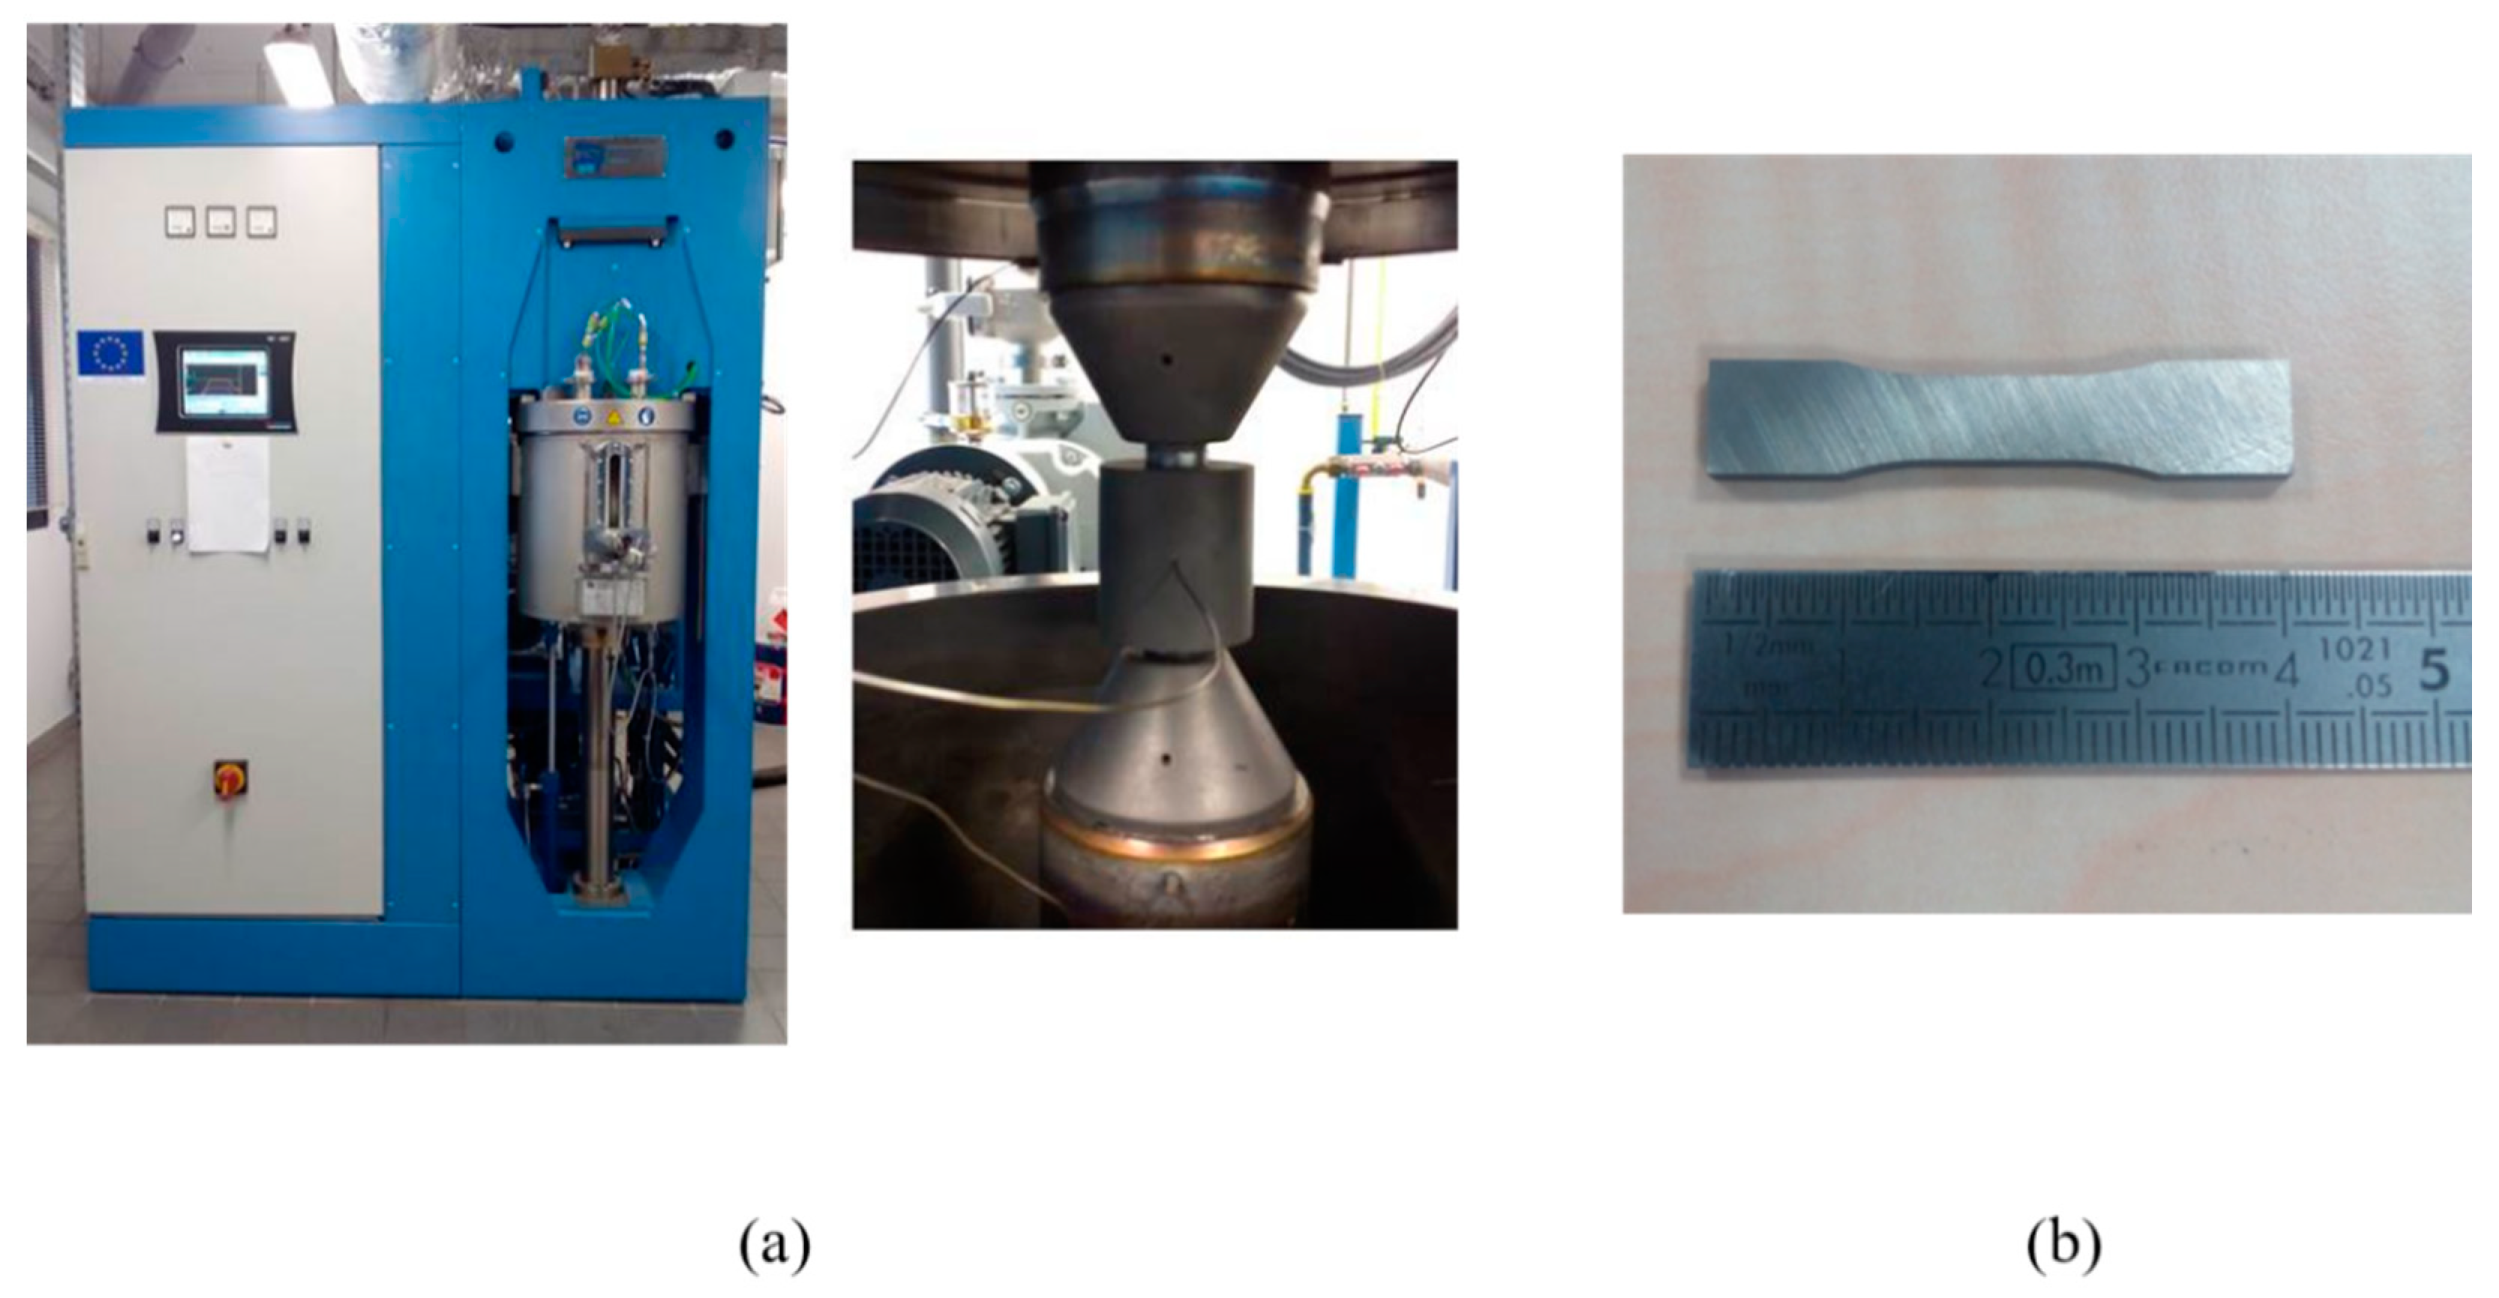
2.1. Sample Synthesis and Characterization

Powder metallurgy was chosen for the synthesis of the specimens, combining high energy ball milling (BM) and consolidation by spark plasma sintering (SPS), to produce specific fine grained (FG) and UFG microstructures. High purity nickel powder (>99.8%) was used as the starting material, with Fe 100 ppm, C 200–600 ppm, O 1000 ppm and S 10 ppm as the main impurities. To produce FG/UFG samples the as-received powder was modified by BM in a Fritsh planetary pulverisette 7, using WC vials (80 mL) and grinding balls (5 mm in diameter). A ball to powder ratio was fixed to 10:1 and anhydrous methanol was used as a process control agent. To avoid oxidation of the powders, vials were filled with high purity argon. Rotation speed and milling time were selected to produce highly deformed UFG powders with different characteristics, to process specimens with distinct microstructures after sintering. The synthesis parameters and grain size for each sample are displayed in Table 1. More information concerning the impact of BM parameters in the microstructure of consolidated samples can be found elsewhere [28].
The powders were sintered by SPS with a FCT System GmbH, HD25 SPS apparatus (Figure 1a left), under medium dynamic vacuum (0.5 mbar), using graphite dies, punches and foils (Figure 1a right). To limit grain growth, the sintering temperature was set to 1023 K, with a heating rate of 100 K/min by continuous current. The heating cycle was accompanied by a uniaxial pressure cycle throughout the sintering process, with a maximum value of 75 MPa. Maximum pressure and temperature were maintained for 10 min to ensure high density. Four disc-like specimens were processed using this program, with a diameter of approximately 50 mm and a thickness of 6 mm, to extract tensile specimens for mechanical testing (Figure 1b). To assess the impact of grain size on strain hardening mechanisms, an extra sample with a grain size in the CG range was produced from the as-received powder using the same sintering conditions, with the exception of temperature, 1273 K (Table 1). To confirm good homogeneity, hardness maps of the surface were performed in all samples. The density of the bulk samples was determined by an immersion densitometry method, with a mass accuracy of 1 mg.

2.2. Microstructure Analysis and Mechanical Properties

The microstructure of the sintered samples was investigated in the initial state and the deformed state at fracture by means of EBSD. Prior to measurements, samples were mechanically polished with SiC paper and electropolished using a solution of perchloric acid, 2-butoxyethanol and ethanol at a voltage of 24 V, for an optimal surface condition. The EBSD acquisition system used was a QUANTAX EBSD (Bruker, Berlin, Germany) mounted on a Zeiss Supra 55. An operating voltage of 15 kV, aperture size of 60 μm and a working distance (WD) of 14.5–16.5 mm were the acquisition parameters. For each sample, at least 1000 grains were covered using a step size ensuring more than 4 points per grain along a given direction. Data was analyzed with the TSL OIM 6 × 64 Analysis™ v 6.2 software (EDAX, Ametek Inc., Berwyn, PA USA) to estimate average grain size, grain boundary character distribution (GBCD), grain orientation, grain orientation spread (GOS) and Kernel average misorientation (KAM) of the sintered specimens. A misorientation angle of 2–15° [34] was chosen to define low angle grain boundaries (LAGBs), and Brandon’s criterion [35] was used to determine coincidence site lattice (CSL) fractions, calculated on a length basis. Basic clean-up was performed before each analysis to eliminate artifacts. In addition, TEM observations of dislocation structures were performed on selected samples with a JEOL 2010 at an operating voltage of 200 kV. To this aim, specimens were prepared from 3 mm discs mechanically polished down to approximately 100 µm and then electropolished using a solution of 17% perchloric acid in ethanol by the twin jet method in a Tenupol 5.
The influence of grain size in the UFG range on the strain hardening mechanisms was investigated using uniaxial tensile testing up to fracture. Dog-bone tensile samples with a gauge length of 11 mm and a thickness of 1 mm were extracted from the 50 mm discs (Figure 1b), using electrical discharge machining to avoid sample damage. More information concerning the dimensions of the tensile specimens and their position in the sintered sample can be found elsewhere [36,37]. Prior to testing the surfaces of the specimens were carefully polished with a diamond suspension of 6 µm to remove the roughness induced by the machining and to eliminate any contamination in the near surface area. A Zwick device with a load cell of 50 kN maximum capability was used for uniaxial tensile testing at room temperature. The strain rate was set to 10−3 s−1, and the deformation was recorded with the ARAMIS® software (Mentel Co., Ltd., Bangkok, Thailand) by measuring displacement fields using digital image correlation. The stress–strain measurements reported in the following paragraphs correspond to the average value from three different samples.

3. Results and Discussion

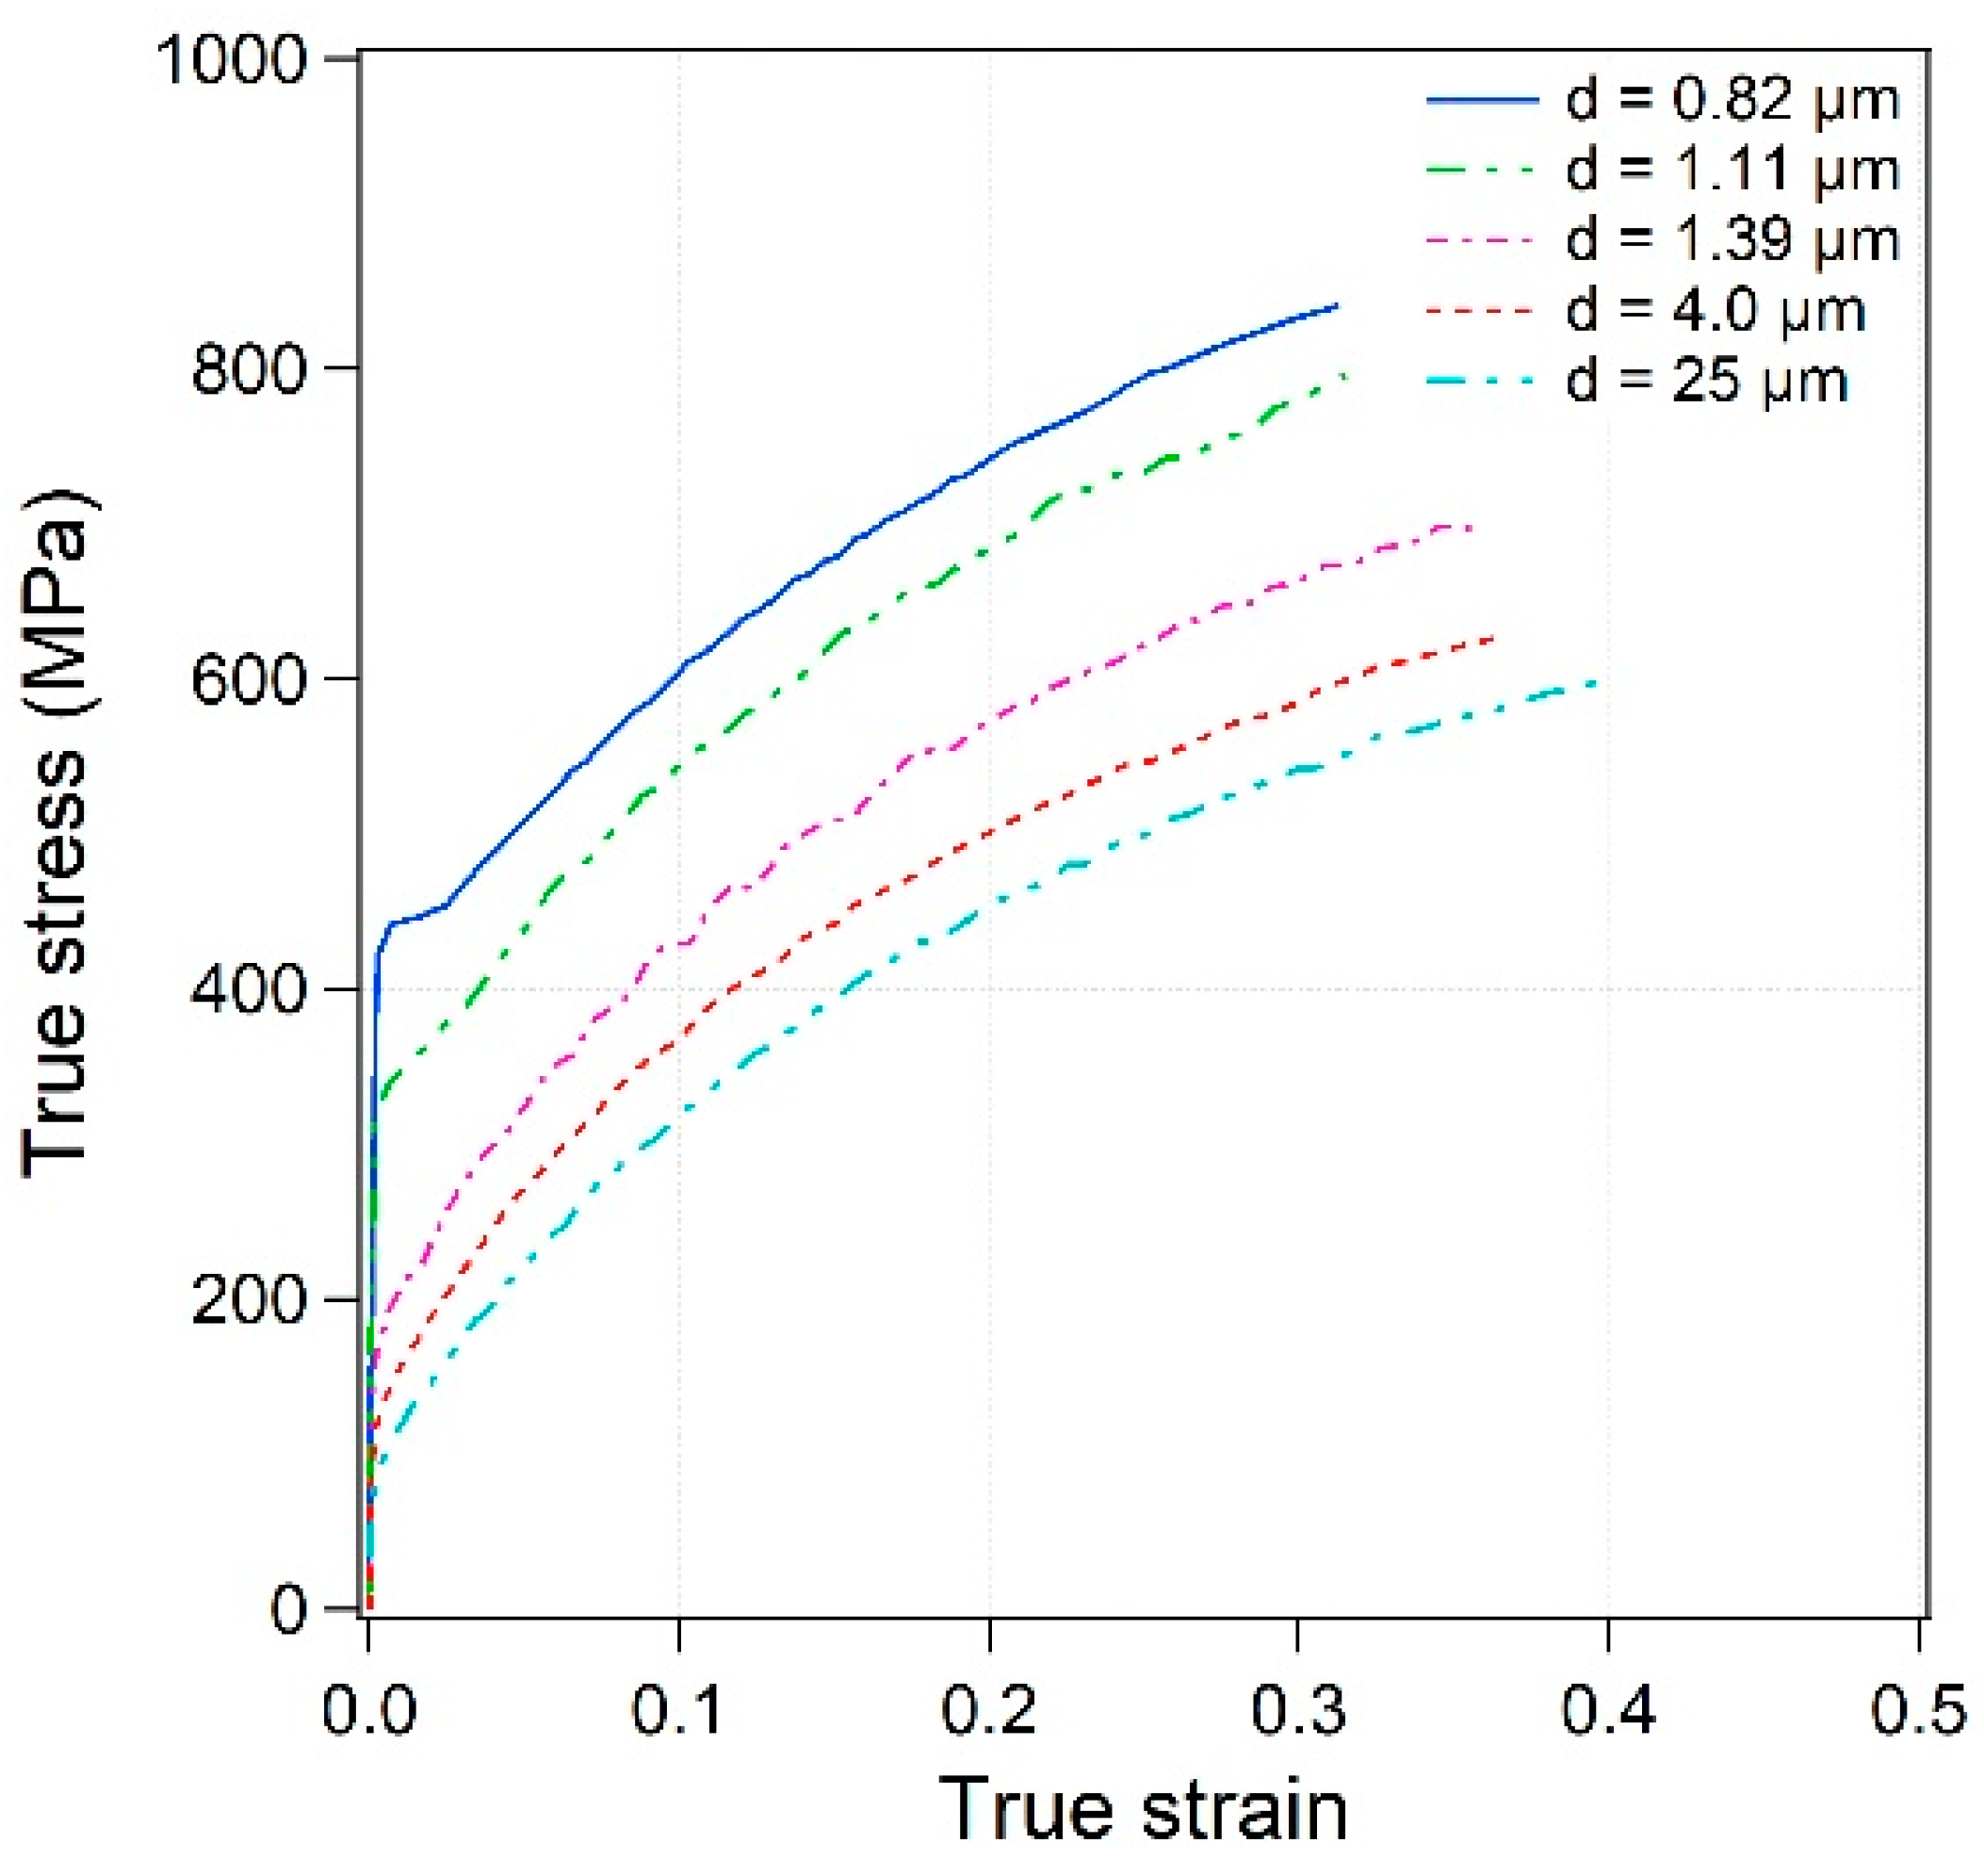
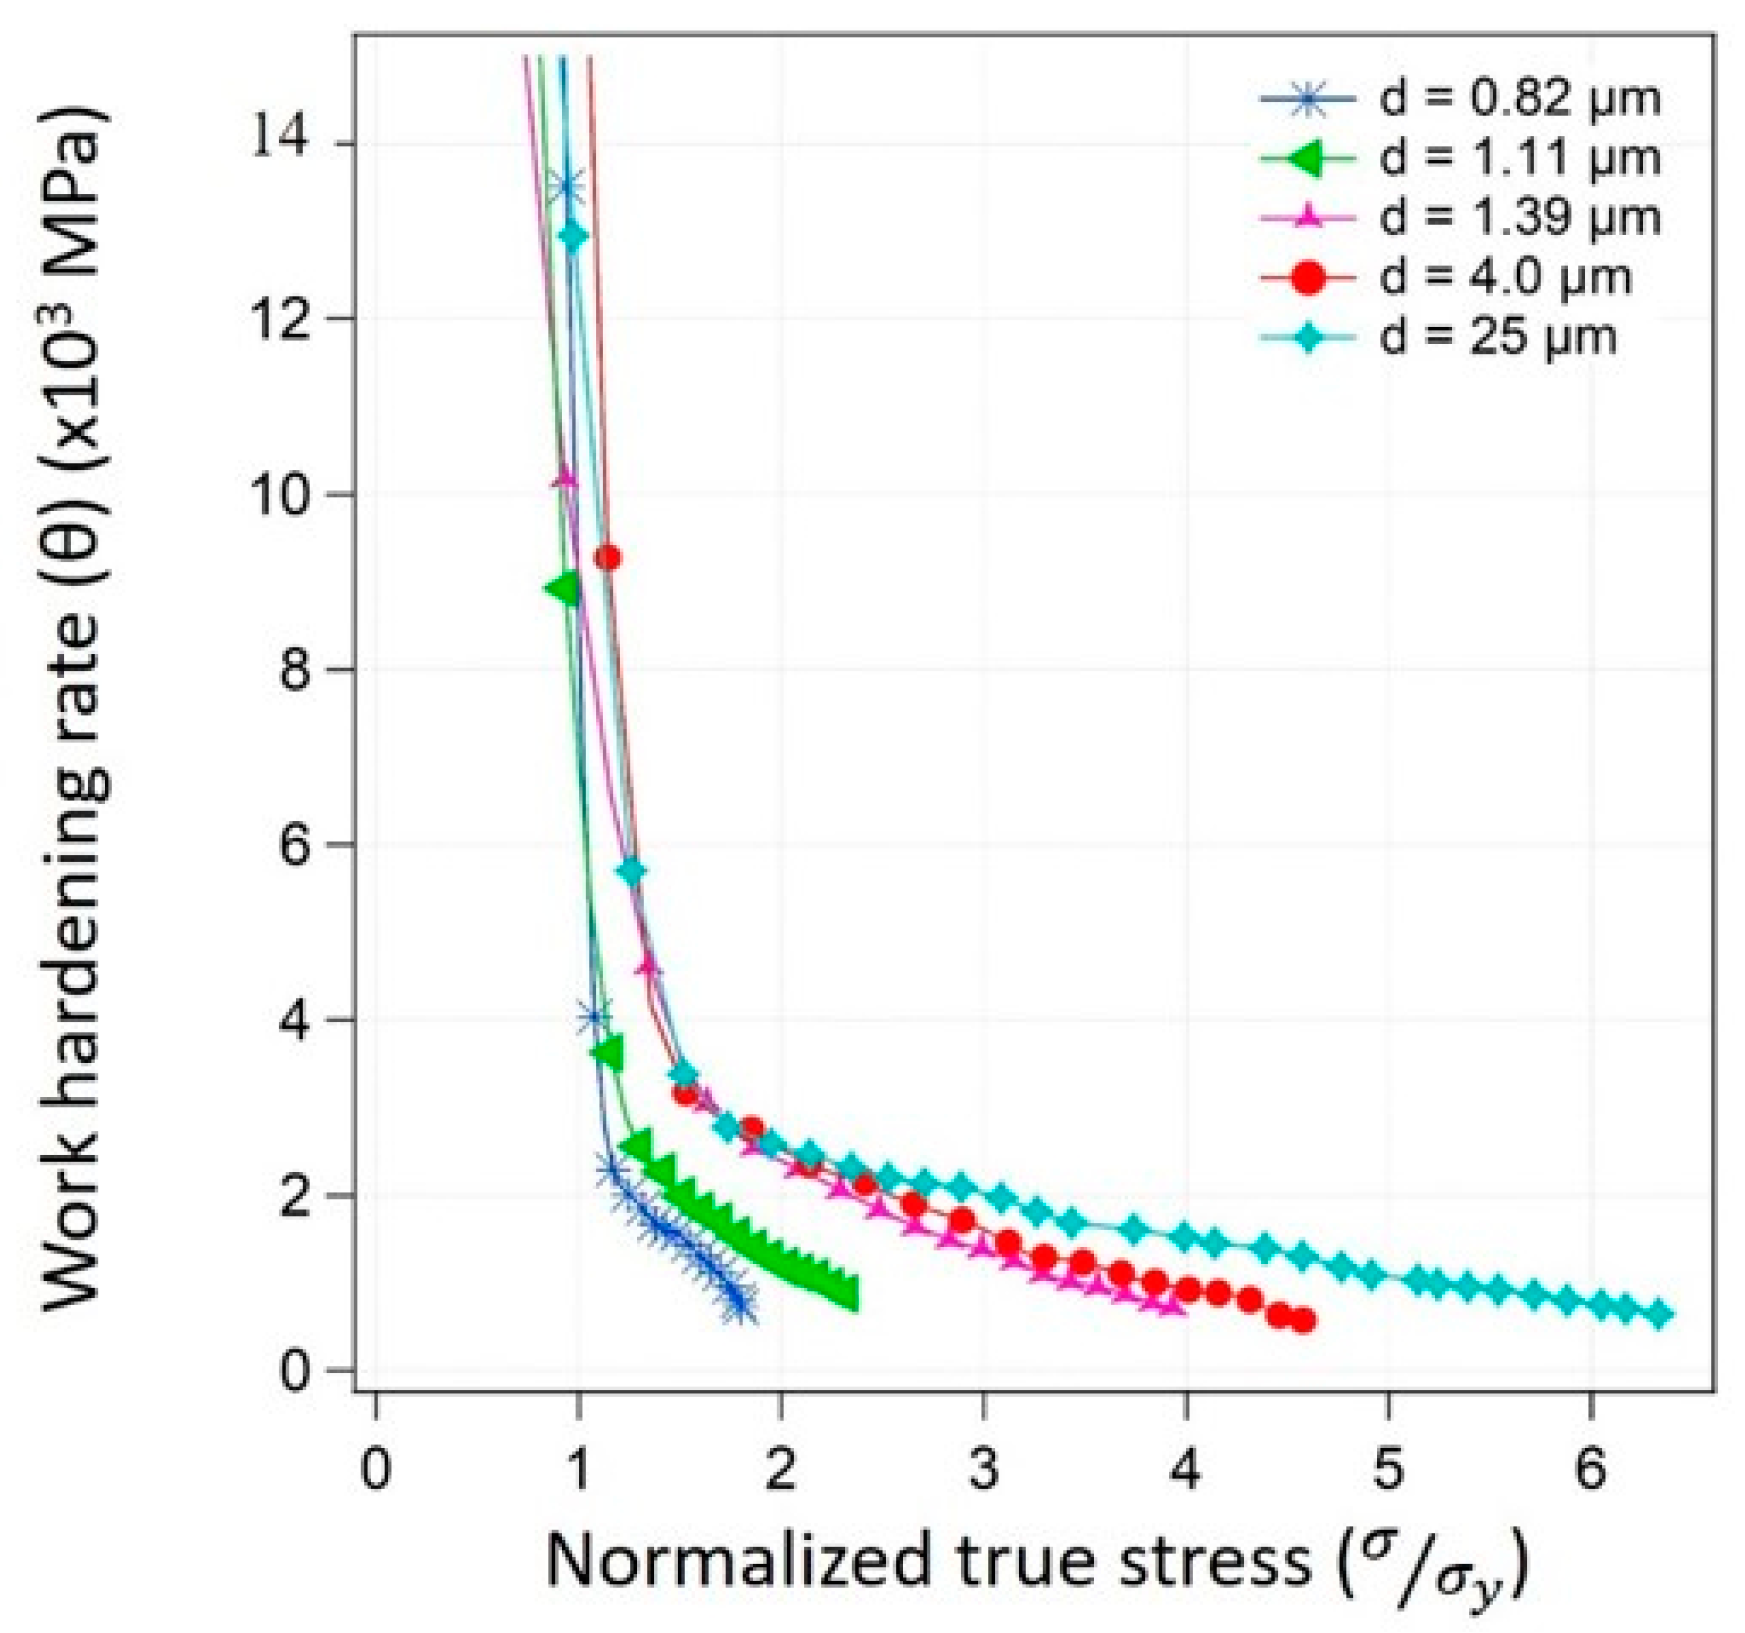
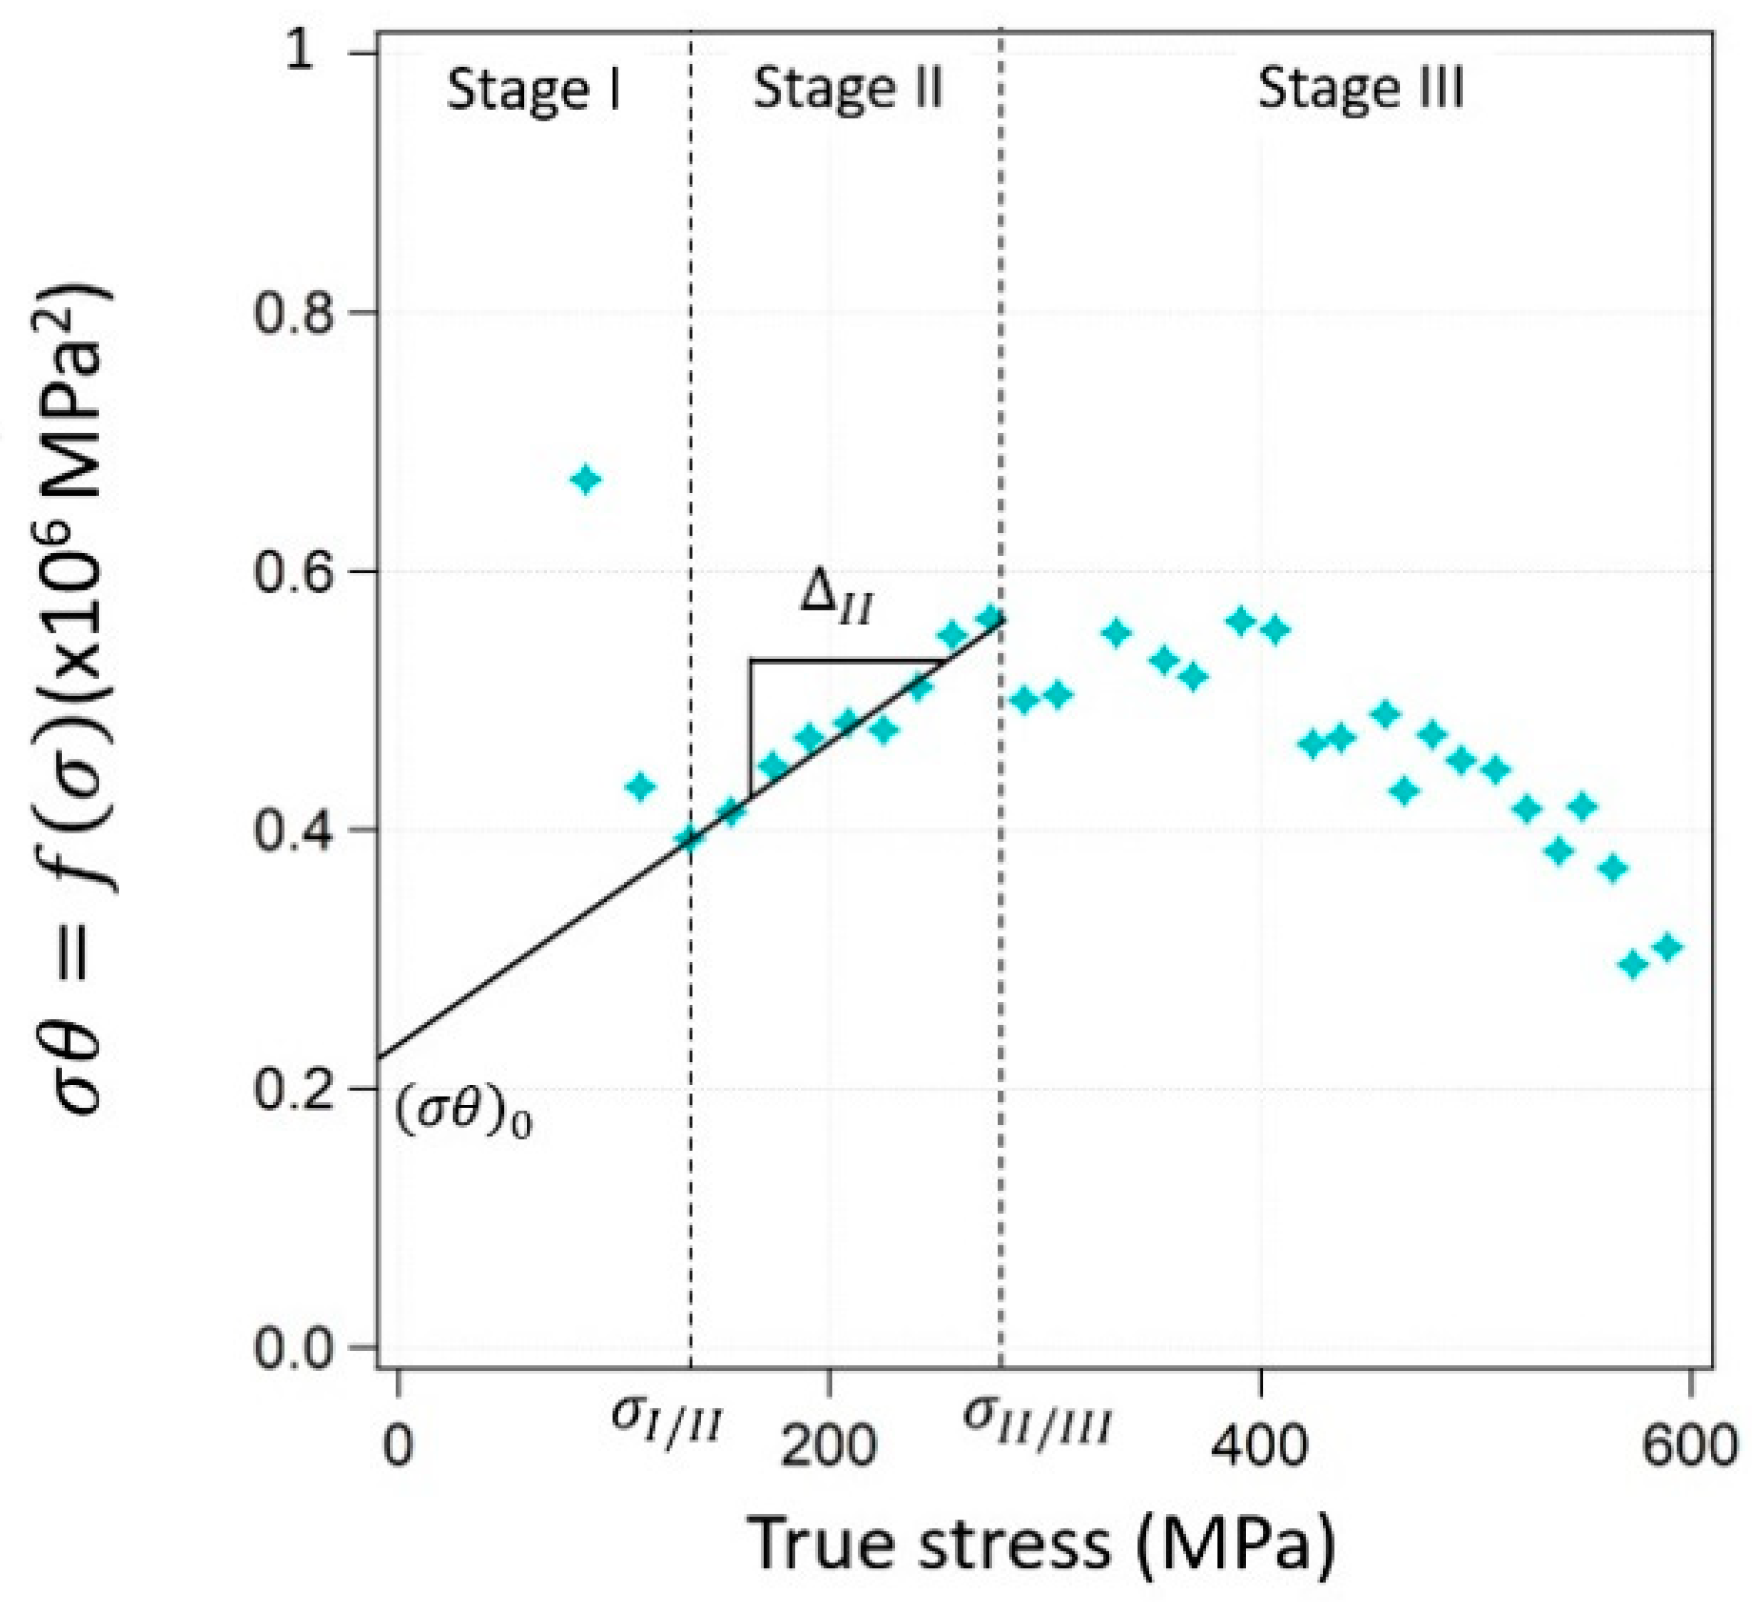
3.1. Strain Hardening in FG and UFG Ni

To investigate the influence of grain size in the FG/UFG range on the mechanisms of plasticity, five samples were prepared with grain sizes ranging from 0.82 to 25 µm. The synthesis parameters (Table 1) were selected to produce specimens with a small fraction of low angle grain boundaries (LAGBs) and a high fraction of Σ3 grain boundaries, and random high angle boundaries (HABs) [28]. The high relative density for all samples (Table 1) confirms the good consolidation of powders by SPS. In addition, specimens show overall low internal stress in the initial state, quantitatively estimated from a grain orientation spread (GOS) below 1° [28,38].
The respective true stress (σ)/true strain (ε) curves are plotted in Figure 2. Regardless the grain size, all samples display high strength and ductility in tensile deformation, with the best combination found for sample 1 (d = 0.82 µm).
As discussed in our previous work [28,37], samples 1 (d = 0.82 µm) and 2 (d = 1.11 µm), display an unusual Lüders-type plateau in the beginning of plastic deformation. The origin of this phenomenon seems to be an inhomogeneous yielding associated with a microstructure displaying grains of different sizes, which present specific deformation behaviors. The lack of mobile dislocations in the smallest grains of the UFG microstructures increases the yielding strength, followed by a Lüders-type deformation before homogeneous deformation begins. Despite the differences in grain size, covering three ranges, CG, FG and UFG, all samples display considerable strain hardening after yielding. However, if the ratio of maximum stress over yield stress is considered, bigger grain size samples display higher ratios with a value of seven observed for sample 5 (d = 25 µm), against a ratio of two displayed by sample 1 (d = 0.82 µm).
The evolution of the strain hardening rate θ = ( d σ d ε ) , with true stress normalized by yield strength (σy) is plotted in Figure 3. At low flow stress, a strong decrease in the hardening rate can be observed, which evolves towards a more stabilized hardening rate, irrespective of the sample. However, a clear difference can be observed between UFG and FG/CG samples. Samples 3–5 display the same hardening behavior at the beginning of plastic deformation, a steep decrease in θ followed by a smoother decrease. Then, for σ/σy = 2, hardening rates diverge as sample 5 (d = 25 µm) displays a higher hardening capability than samples 3 (d = 1.39 µm) and 4 (d = 4.0 µm). Samples 1 (d = 0.82 µm) and 2 (d = 1.11 µm) display, on the other hand, a much steeper decrease of θ in the beginning of plastic deformation followed by a much lower strain hardening rate, compared to the FG/CG counterparts. The lower hardening capability assessed for the UFG samples in this study, is in agreement with the tendency observed by F. Dalla Torre et al. [15]. Nevertheless, the transition to a more stabilized decrease in θ for UFG, contrasting with their observations on nanocrystalline Ni, suggests different hardening mechanisms in our samples.
Work hardening in polycrystals can be divided into three stages that are related to different plasticity mechanisms that can be investigated by physical models [39]. Using the Mecking–Kocks model, the relation between flow stress (σ) and total dislocation density ( ρ ) can be expressed as [40,41,42]:
σ = α μ b M ρ ,
where α is a coefficient that depends on the type of interaction between dislocations and their configuration, μ is the shear modulus, b is the norm of the Burgers vector and M is the Taylor factor [43,44]. Furthermore, for monophasic and recrystallized face centered cubic metals, the evolution of ρ with deformation can be described by the following equation [40,45,46]:
d ρ d ε = M ρ β b + k g M b d 2 M P y a ρ b .
The first term of the right-hand side of Equation (2) concerns the accumulation of mobile dislocations, where β represents the ratio between the dislocation mean free path (Λ) and the near neighbor dislocation spacing (ld): β = Λ l d , and the other parameters have their usual meaning. The dislocation mean free path is the distance travelled by a dislocation before being stopped by crystalline defects (i.e., other dislocations, precipitates and grain boundaries) and becomes stored [47]. The second term accounts for the generation of geometrically necessary dislocations (GNDs) at grain boundaries [46,48], where kg represents a geometric factor that depends on the morphology of grains. Finally, the last term corresponds to dislocation annihilation that results from generalized cross-slip. The probability of annihilation is represented by P and ya symbolizes the distance of annihilation of two dislocations by cross-slip [46,48]. If Equations (1) and (2) are combined the following expression is obtained:
σ · θ = σ d σ d ε = α μ M 2 2 β σ + α 2 μ 2 b M 3 k g 2 d α μ M P y a σ 2 b .
The low probability of dislocation annihilation in the beginning of strain hardening makes the last term in Equation (3) negligible throughout stages I and II. Thus, the study of the transition between hardening stages can be performed from the evolution of the product σ∙θ as it displays clear slope changes. Stage I is characterized by a steep decrease in σ∙θ and is characterized by non-homogeneous deformation with a gradual elastic to plastic transition, which depends on grain orientation and size. Planar/single slip is the main deformation mechanism and the elevated hardening rate is due to deformation incompatibility between grains. Then, a linear part of increasing σ∙θ represents stage II, which is characterized by multiple slip, beginning of cross-slip and the formation of dense dislocation structures, including tangles, dislocation walls and cells [49]. Assuming the Mecking–Kocks model and the approximation of low probability of dislocation annihilation, stage II can be investigated as dependent on two terms [50]:
σ · θ = α μ M 2 2 β σ + α 2 μ 2 b M 3 k g 2 d = Δ I I σ + ( σ θ ) 0 .
The first one ( Δ I I ), known as the latent hardening rate, is related to the accumulation and interaction between dislocations. The second one ((σθ)0) corresponds, for a polycrystal of a pure single-phase metal, to the contribution of grain boundaries, through GNDs, to strain hardening. The contribution of (σθ)0 to strain hardening increases when the microstructure is refined. Both terms can be obtained from the fraction of the plots of σ·θ as a function of stress situated between the transition stress from stage I to stage III (σI/II) and the one from stage II to III (σII/III). A linear fit of this section gives Δ I I as the slope and (σθ)0 as the origin intercept (Figure 4). Once linearity is lost, stage III of strain hardening begins, where cross-slip is generally occurring and dislocation annihilation predominantly takes place.
Figure 5a displays the evolution of σ∙θ with stress for the sintered samples. A strong effect of grain size on σI/II is observed, arising from the difference in σy between individual samples. When normalizing stress by σy (Figure 5b), the transition took place at a value of σ/σy close to 1.5 independently of the grain size.
The transition stress from stage II to stage III (σII/III), normalized by yield strength decreased with decreasing grain size (Figure 6). The stress necessary for the transition to stage III for CG nickel (sample 5) was 3.5 times its yield strength, whereas for the two UFG samples (framed in blue) the transition took place shortly after the initial yield stress. The faster transition from stage II to stage III in UFG samples suggests different hardening mechanisms compared to CG specimens.
The evolution of Δ I I with grain size is plotted in Figure 7a. Despite the important scattering of experimental values, resulting from noisy data, a decrease of the latent hardening rate with decreasing grain size can be observed, approaching zero for the smallest grain sizes. The latent hardening rate is related to the rate in which mobile dislocations are stored within the grain from the interaction with the dislocation density that is already stored [43]. In the second work hardening stage, dislocations store by rearranging into low energy structures such as dislocation cells. The faster transition to stage III in UFG specimens suggests that generalized cross-slip and annihilation of dislocations takes place in the beginning of plastic deformation, reducing the possibility of dislocation interaction and reorganization. A decrease in Δ I I implies a decrease of the interaction coefficient, α, and/or an increase of the parameter β (Equation (4)). A lower α suggests low dislocation interaction and organization. A higher β entails an increase in Λ and/or a decrease in ld, thus, a lower possibility of interaction between dislocations. The evolution of (σθ)0 as a function of the inverse value of grain size is displayed in Figure 7b. A linear trend can be depicted, where the parameter (σθ)0 increases with decreasing grain size. The value of kg can be determined from the slope:
( σ θ ) 0 = α 2 μ 2 b M 3 k g 2 · 1 d .
Considering the value of α estimated for polycrystals in [45], α = 0.45, the obtained value of kg in this study was 0.15 ± 0.02, which was in good agreement with the experimental value obtained in [45] for polycrystalline nickel, kg = 0.20. Thus, the Mecking–Kocks model applies to the study of the plasticity mechanisms in this work [51]. Given that (σθ)0 is related to the contribution of grain boundaries to strain hardening, these results suggest that for UFG samples, the hardening mechanisms mainly take place at grain boundaries. In consequence, when grain size decreases, dislocation interaction with grain boundaries becomes the main hardening mechanism.

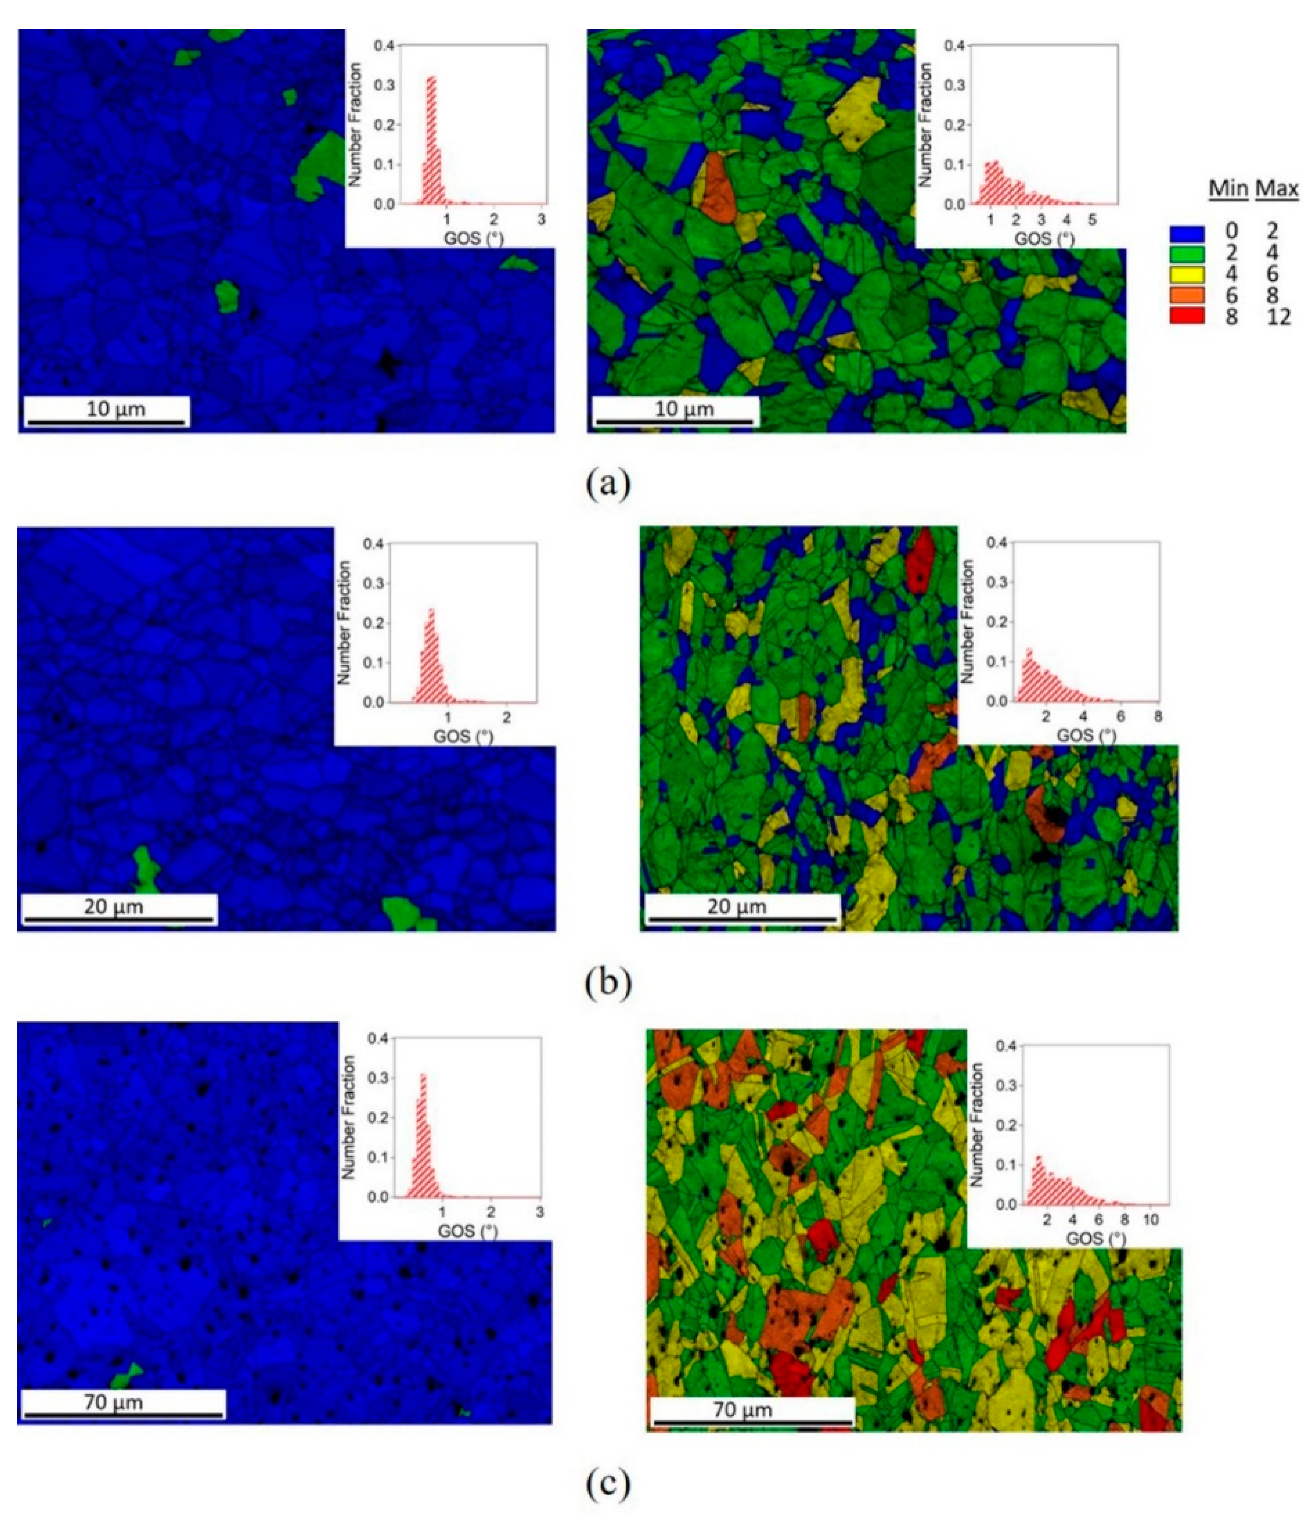
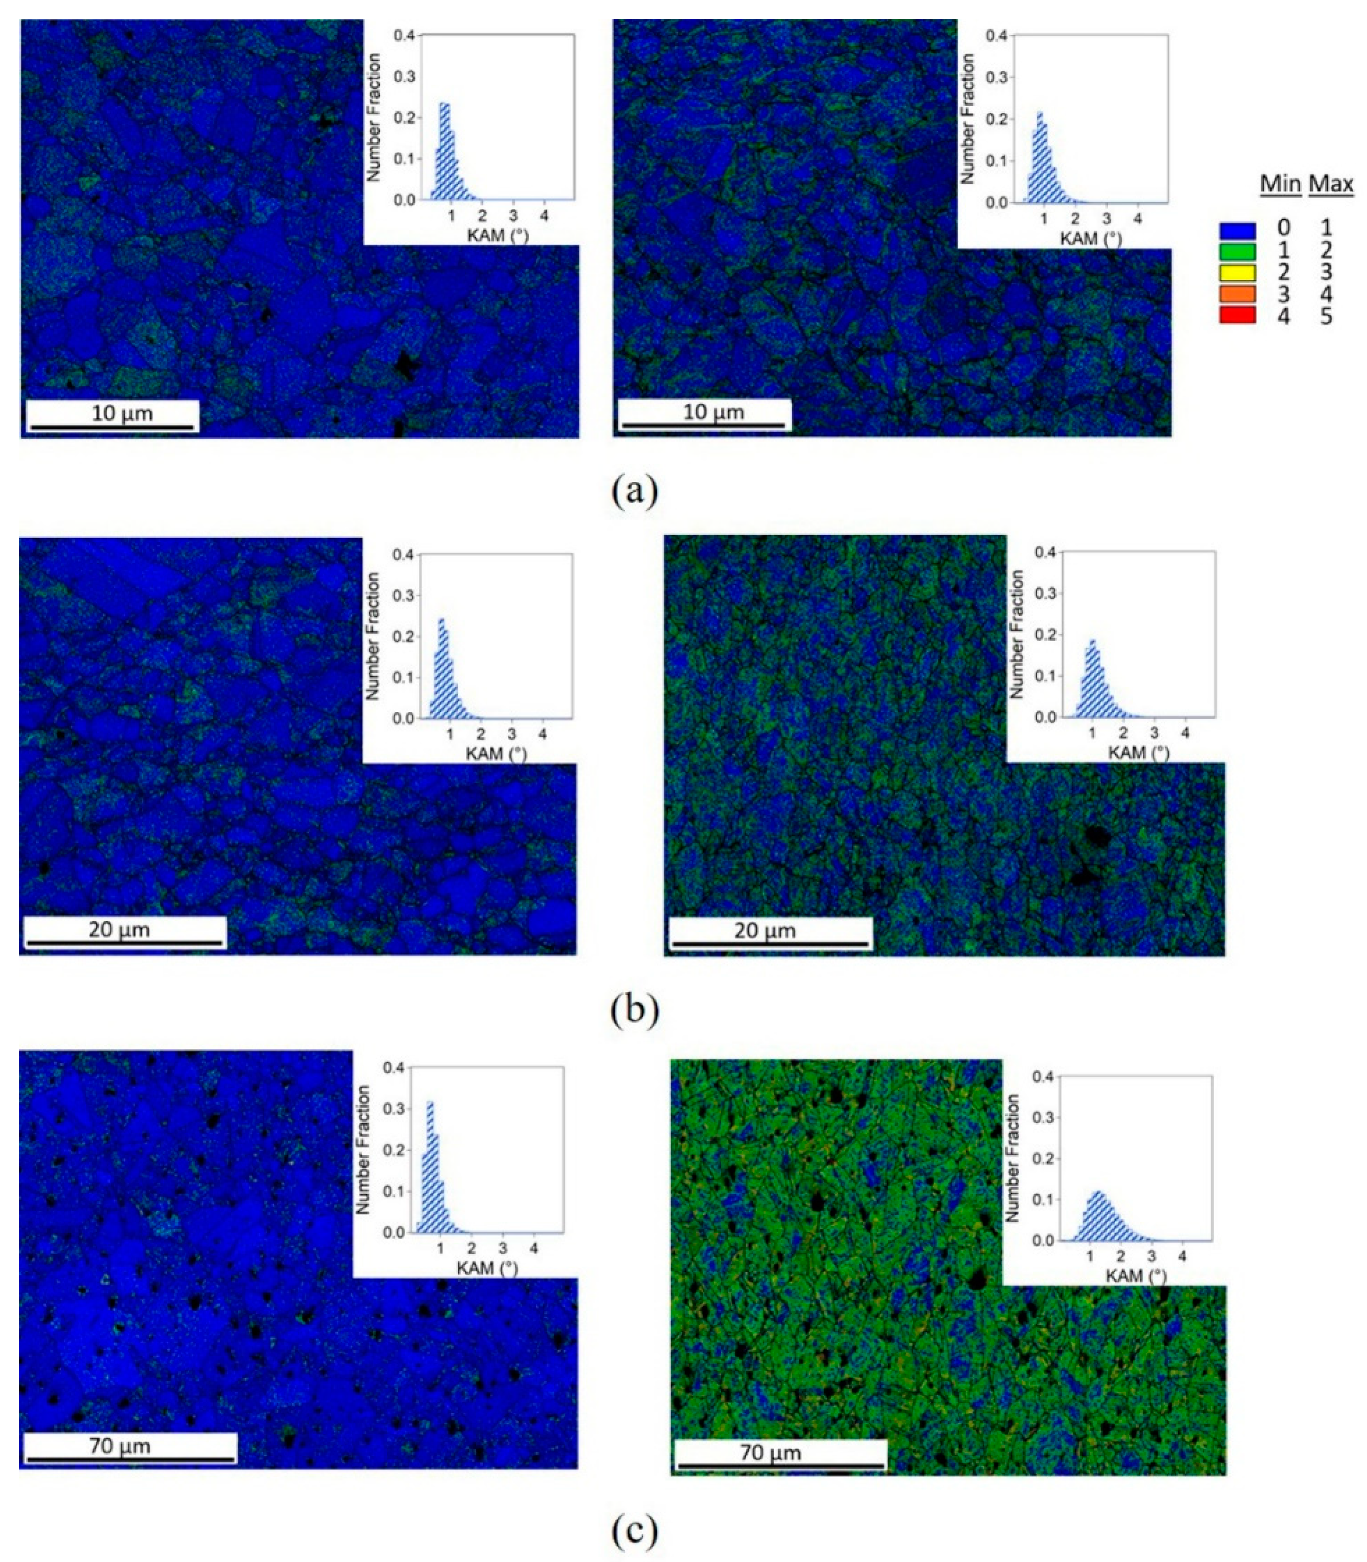
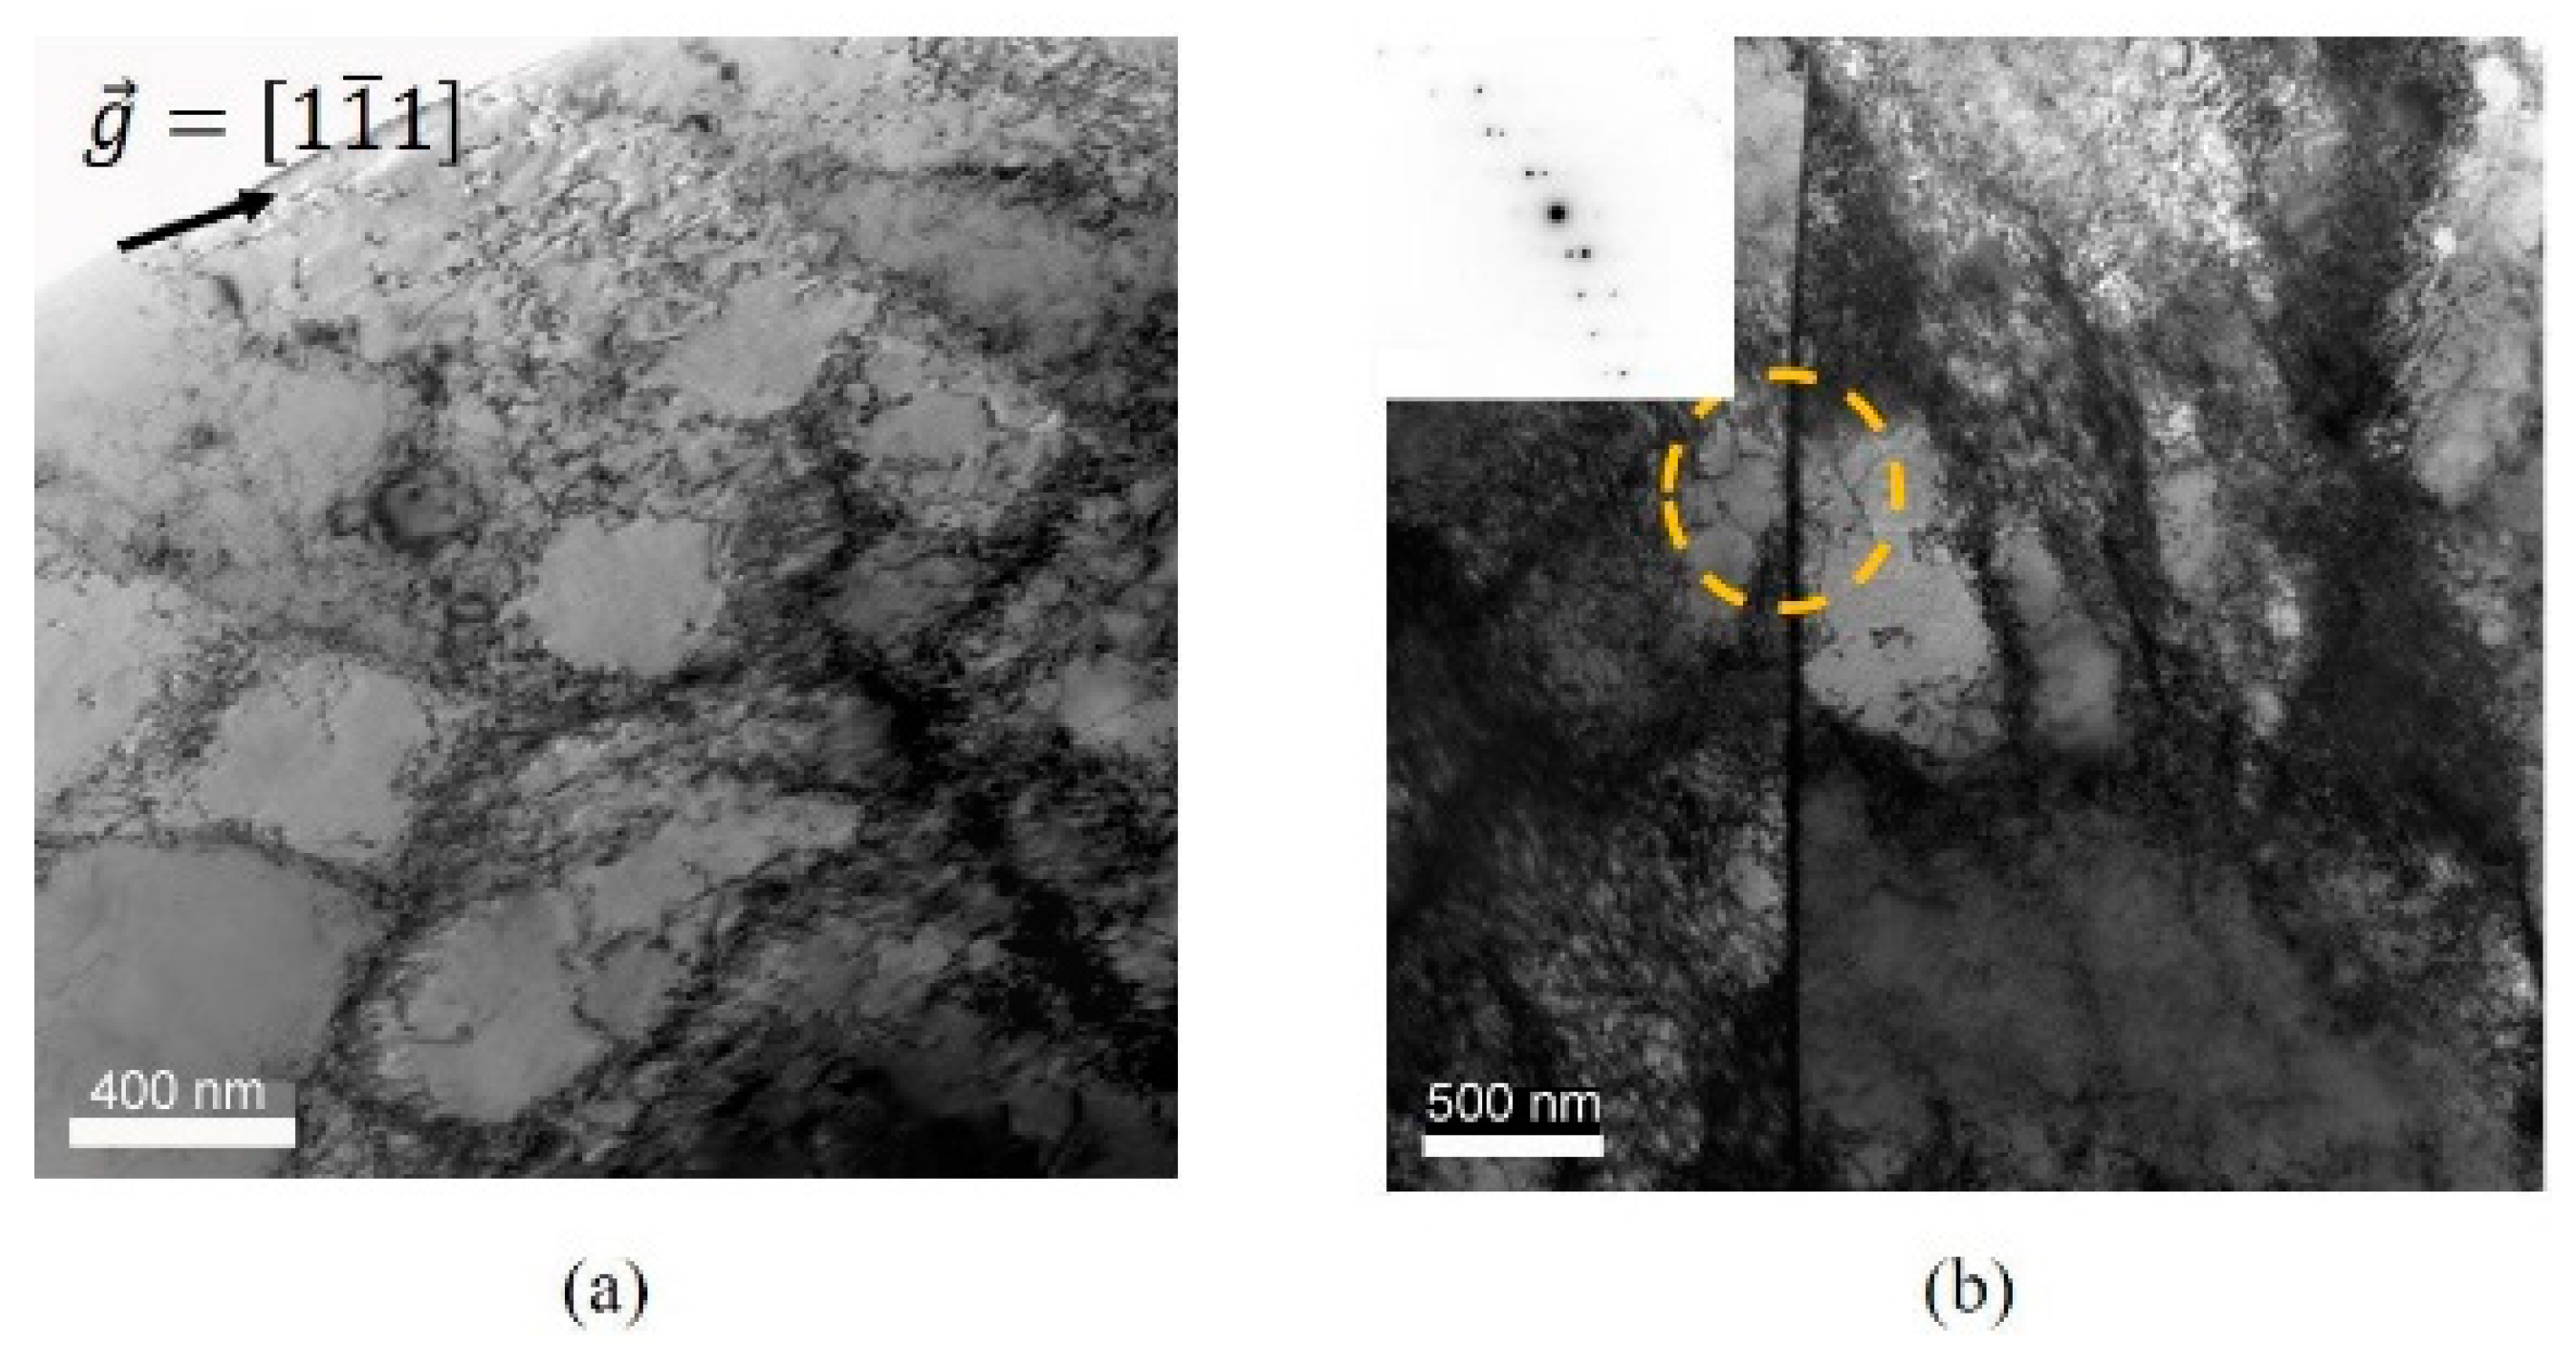
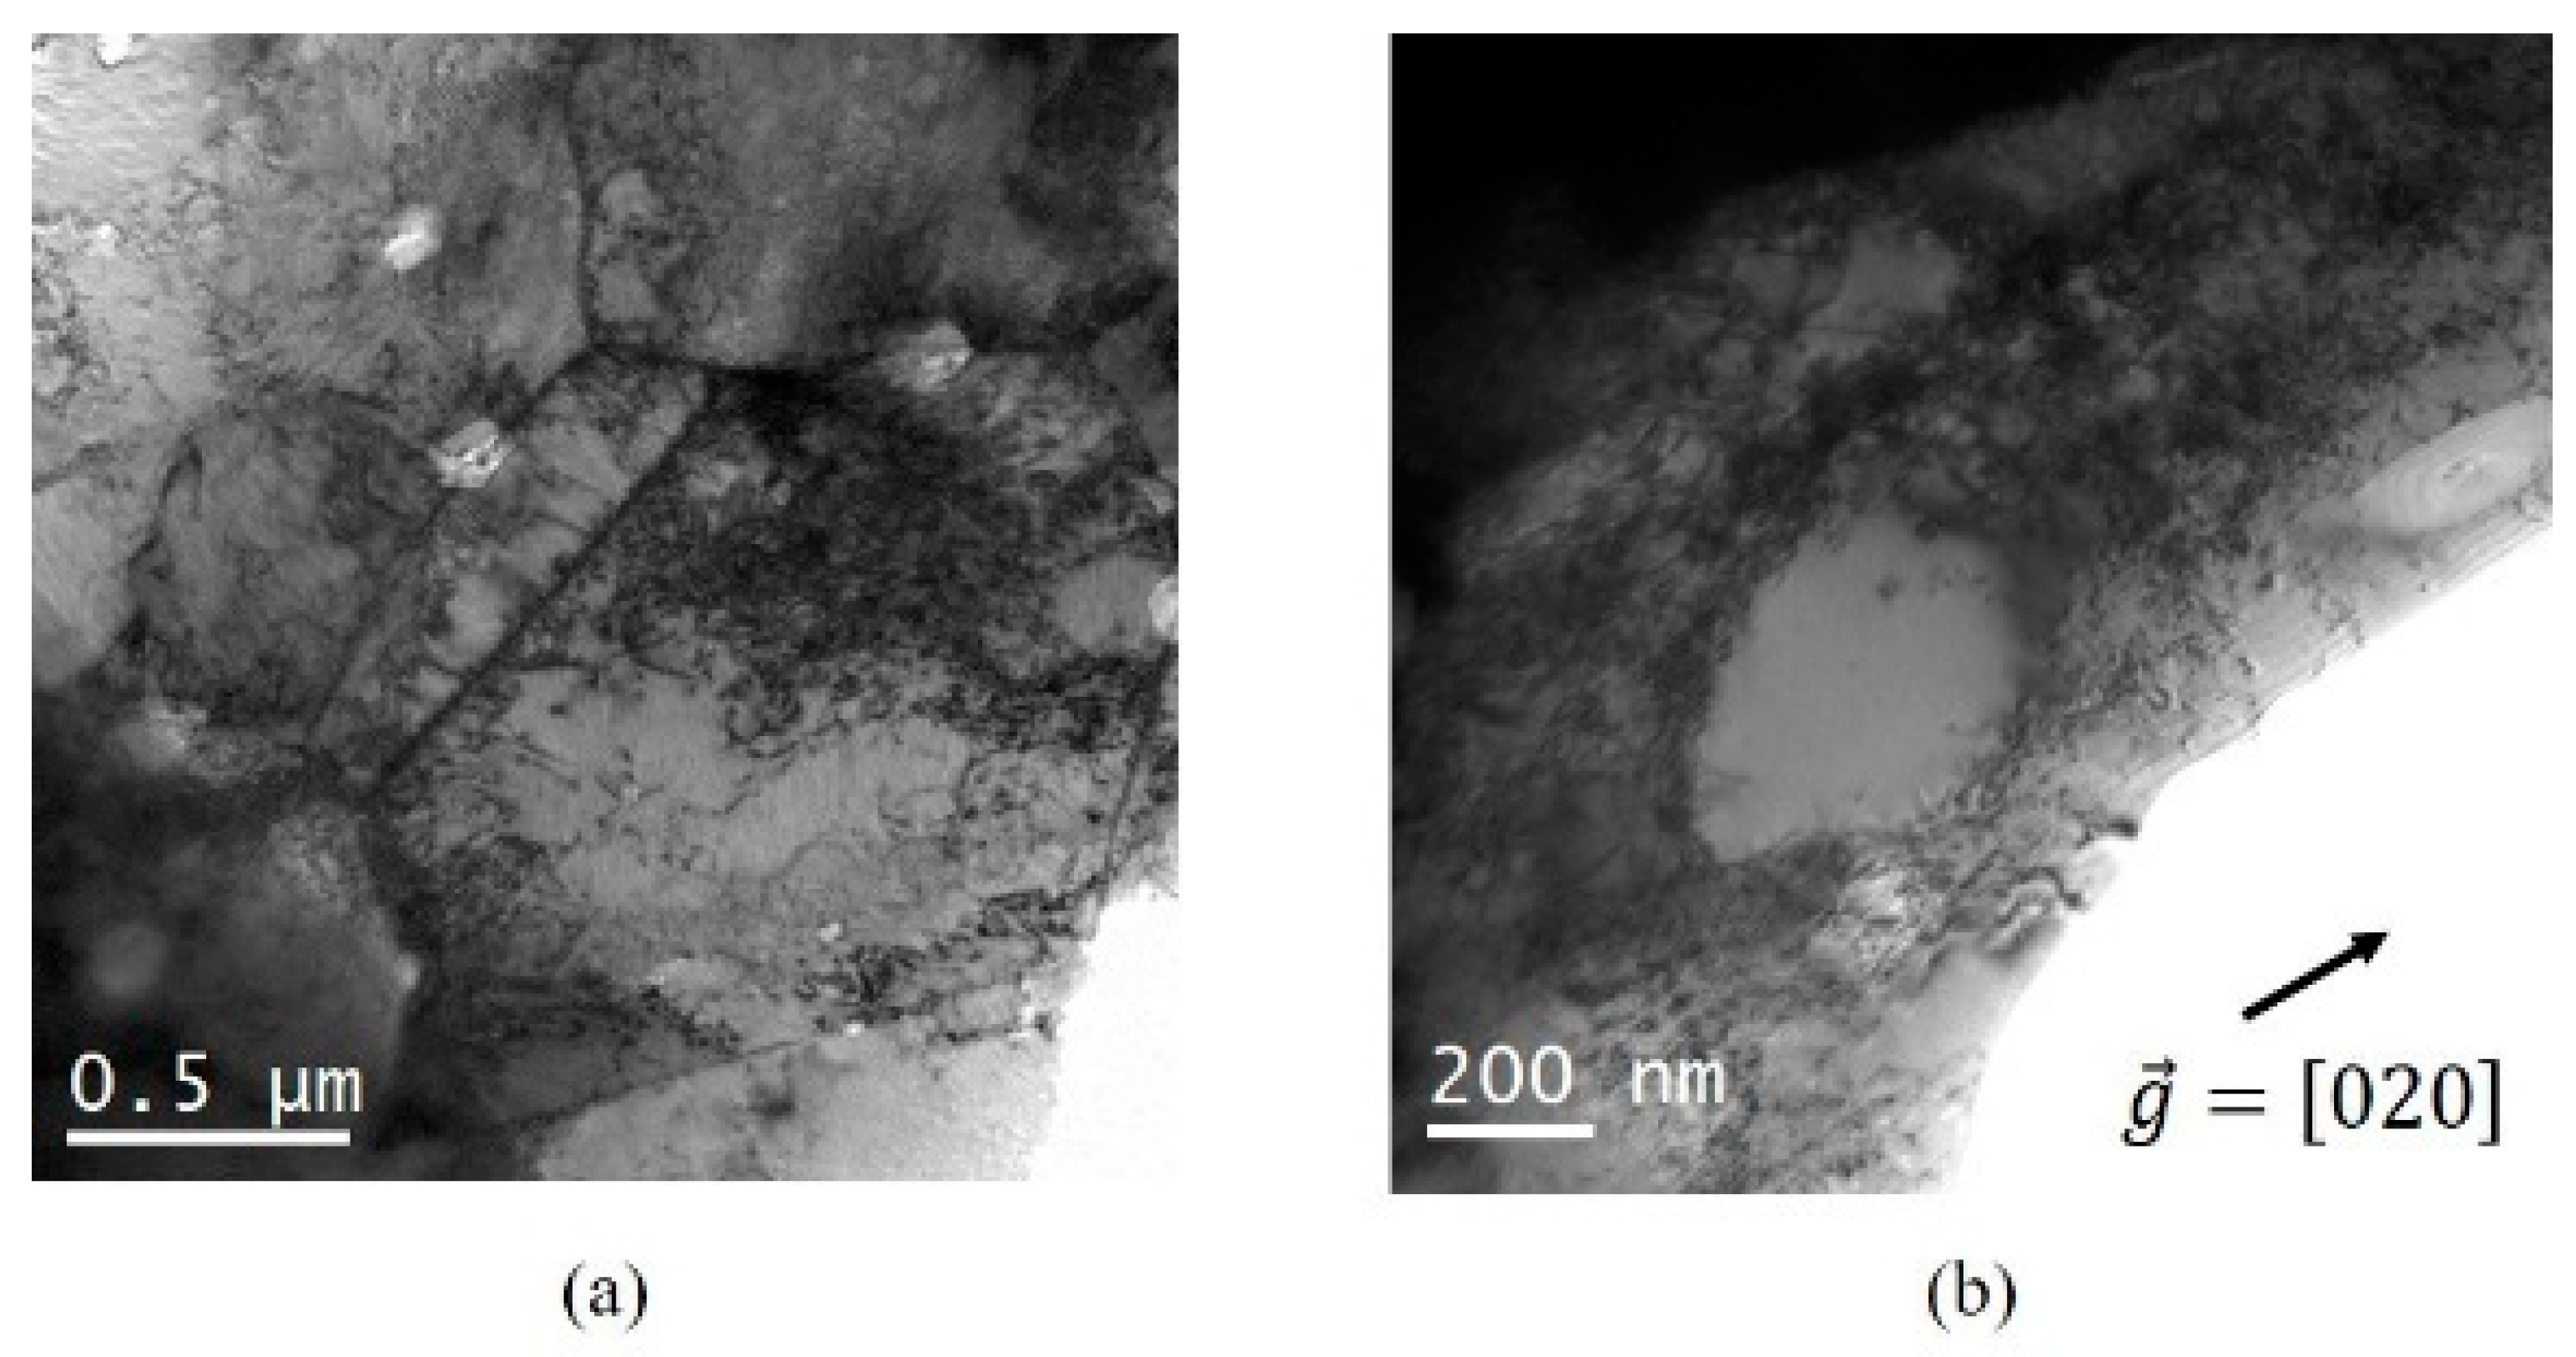
3.2. Investigation of the Deformed State at Fracture by EBSD and TEM Observations

Previous conclusions issued from the Mecking–Kocks model suggest a change in strain hardening mechanisms with grain refinement. Dislocation accumulation through cell formation would be present in the core of the grain for coarse grain specimens. Whereas in UFG samples, hardening would be mainly related to interactions between dislocations and grain boundaries. To explore this possibility, the deformed state at fracture was investigated by means of EBSD.
Figure 8 displays a global outlook of the deformed microstructures from the inverse pole figure (IPF) taking the tensile stress direction as reference. The good quality of the data was ensured by an indexation rate above 88% for all samples. A preferred crystallographic orientation is observed where grains rotate so that a <111> or <100> axis tends to become parallel to the tensile axis, which is the expected behavior for highly deformed face centered cubic (FCC) metals [52,53]. In addition, elongation of grains following the tensile stress axis can be observed, leading to an increase in the grain boundary area. This phenomenon is more present for samples 4 and 5 depicting higher grain size (Figure 8c,d) and almost negligible for sample 1, with the smallest grain size (Figure 8a). The area increase requires a high fraction of dislocations storing in the grain boundaries, which accounts for a significant part of the strain hardening energy [54]. The difference in elongation to fracture (εf) could explain such a difference as εf = 49% ± 3% for sample 4 (d = 4 µm) and εf = 39% ± 3% for sample 1 [28]. Nevertheless, Q.H. Bui et al. [33] reported a similar result for samples of CG and UFG Ni deformed in compression at the same level of deformation.
A change in the GBCD is also observed after deformation (Table 2), where a decrease in the Σ3 grain boundary density was accompanied by an important increase in the LAGB density. The lower fraction of Σ3 grain boundaries can be explained as the outcome of gliding dislocations interacting with pre-existing twin boundaries (a particular case of Σ3 grain boundaries), resulting in the accumulation of the slip dislocations in such boundaries. This can be achieved by dissociation of slip dislocations into partials under high stress [55,56]. Gubicza et al. [57] observed the same phenomenon for UFG Ni prepared by SPS from nanopowders deformed by the compression test. The higher fraction of LAGBs is the outcome of the arrangement of dislocations into subgrain boundaries at high levels of deformation [58].
Table 2 shows that bigger grain size entailed a sharper decrease in Σ3 grain boundaries and a stronger increase of LAGBs. The probability of reducing the fraction of Σ3 grain boundaries was thus higher for samples with grain sizes in the CG regime. The considerable difference in the fraction of LAGBs for fractured samples 4 and 5, compared to samples 1–3, can be related to the short strain hardening stage II in UFG samples. In this second stage, dislocations reorganize into lower energy structures to accommodate deformation. They evolve with increasing strain from tangled dislocations to dislocation cells due to a multiple slip, which enables the multiplication of dislocations. In stage III, cross-slip is generalized and dislocation cells are the predominant dislocation arrangement. For higher deformation levels, the misorientation across dislocation walls increases, which results in the development of subgrains from the original dislocation cells [59], ultimately forming LAGBs [54]. The fast occurrence of stage III in the UFG samples hinders the formation dislocation cells and their evolution to LAGBs.
EBSD is also useful in the investigation of the misorientations within grains, as this can be related to the presence of dislocations [29,38]. Figure 9 displays GOS cartographies of samples 1 (d = 0.82 µm) (a), 3 (d = 1.39 µm) (b) and 4 (d = 4 µm) (c), calculated for the initial state (left) and the deformed state at fracture (right). The average GOS value increased for all samples from 0.6°, in the initial state, to around 2°, in fractured samples, with the smallest value corresponding to sample 1 (GOS = 1.7° ± 0.9°). Nevertheless, the distribution of the GOS value highly depended on grain size. For instance, the fraction of grains with a GOS < 2° for sample 5 (d = 25 µm) was 2.9%, whereas sample 1 (d = 0.82 µm) exhibited a fraction of 29.8%.
To investigate the correlation between grain size and orientation spread, the EBSD data for sample 1 at fracture (d = 0.82 µm) was divided into two groups, based on the GOS value. The first group included grains that display a GOS < 2° and the second group grains with GOS > 2°. The measured average grain sizes of each partition were d = 0.54 ± 0.38 µm and d = 1.39 ± 0.84 µm, respectively. These results indicate that deformed grains in the UFG regime display less orientation spread and thus exhibited a lower level of deformation [60]. This difference in deformation capability offers an explanation to the heterogeneous deformation (Lüders-type plateau) at the beginning of plastic deformation. In addition, Figure 9 shows that at higher deformation levels, despite the macroscopic homogeneous deformation displayed in Figure 2, the deformation at a microscopic scale is heterogeneous and dependent on grain size. The same analysis was performed in samples 2 and 3, and a similar trend was observed concerning the grains in the UFG regime. The fraction of grains that displayed a GOS < 1° (considered as non-deformed grains) was less than 3% for all samples.
GOS cartographies offer a general view of deformation considering averaged values for each grain. Nevertheless, different deformation levels are present on a microscale inside the grains, where dislocations are frequently distributed in a heterogeneous manner, alternating regions of high and low local dislocation density. KAM cartographies can be employed for a local description of the presence of misorientations within a grain [61]. The first neighbor KAM cartographies of samples 1 (d = 0.82 µm) (a), 3 (d = 1.39 µm) (b) and 4 (d = 4 µm) (c) are displayed in Figure 10. In the deformed state in sample 4 (Figure 10c right), it is noticeable that high misorientations (above 1°) are present at grain boundaries and in the bulk of grains. In addition, the average KAM value in this sample increased from 0.7° in the initial state to 1.4° deformed at fracture, as expected for deformed samples [62]. With grain refinement, lower misorientations are observed and are mostly located at grain boundaries (Figure 10a,b right). The generalized higher dislocation density at grain boundaries is in agreement with the model developed by Meyers and Ashworth based on a different deformation behavior between the inside of grains and their boundaries [63]. Deformation incompatibility between grains develops a stress concentration at grain boundaries, which entails the activation of supplementary slip systems as compared to the core of the grain [7]. Hence, regions closer to the grain boundaries will strain harden faster. This effect is particularly noticeable in the UFG grains, which display low misorientations in the core of grains. These observations are in agreement with the results obtained in the previous section and suggest hardening mechanisms mainly related to interactions between dislocations and grain boundaries. Samples 1–3 display no significant change in the average KAM value between the initial state and the deformed state.
To complete these observations, TEM observations were performed at fracture for two samples, representing the FG and the UFG range. Figure 11 displays bright field TEM images of sample 4 (d = 4.0 µm). Grains divided by geometrical dislocation cells (or subgrains) can be observed with different misorientations as depicted in Figure 11a for a single grain observed using a diffraction vector g = [ 1 1 ¯ 1 ] . The high density of dislocations in the cell walls and cores can be observed in Figure 11b, where a grain boundary is displayed edge-on. The average size of the dislocation cells was estimated as 0.53 ± 0.18 µm, from 28 cells in different grains. This value, rather independent of grain size, is in agreement with the value of 0.35–0.55 µm observed in CG nickel [64] for a high plastic strain. The features of the deformed microstructure correspond to those expected for highly deformed nickel, characterized by high dislocation density and dislocation cells [65].
Concerning the UFG regime, the deformed state of sample 1 (d = 0.82 µm) displays a much different appearance (Figure 12). Figure 12a shows an overview of small equiaxed grains with a lower dislocation density inside grains, compared with sample 4 (d = 4.0 µm) (Figure 11). Moreover, dislocations tend to accumulate preferably close to grain boundaries. The lack of dislocation walls, tangles or cells indicates low misorientation (as seen in EBSD) and hardening mechanisms related mainly to the interaction between individual dislocations. A decrease in the interactions between dislocations and dense dislocation structures implies a decrease in the value of α and thus of Δ I I . Small size dislocation cells were rarely found in the deformed microstructure (Figure 12b). Given the grain size (d = 0.82 µm), which approaches the cell size in CG Ni, the few dislocation cells observed display in all cases a smaller size than those observed in FG specimens. Nevertheless, TEM observations show that dislocation cells are not a characteristic feature of the deformed state of UFG Ni. These results are in agreement with the EBSD analyses, and with the strain hardening behavior of UFG samples. The lower density of dislocations and the lack of dislocation substructures hinder the hardening capability of UFG specimens and has a major impact in their strain hardening mechanisms.

4. Conclusions

Changes in the plasticity mechanisms were investigated in Ni samples obtained by SPS with grain sizes ranging from 0.82 to 25 µm, through tensile testing up to fracture and microstructural observations. The main results obtained in this study can be summarized as follows:
-
Considerable strain hardening is displayed by all samples, including those with grain sizes in the UFG regime, although a decrease in the strain hardening capacity is observed with decreasing grain size.
-
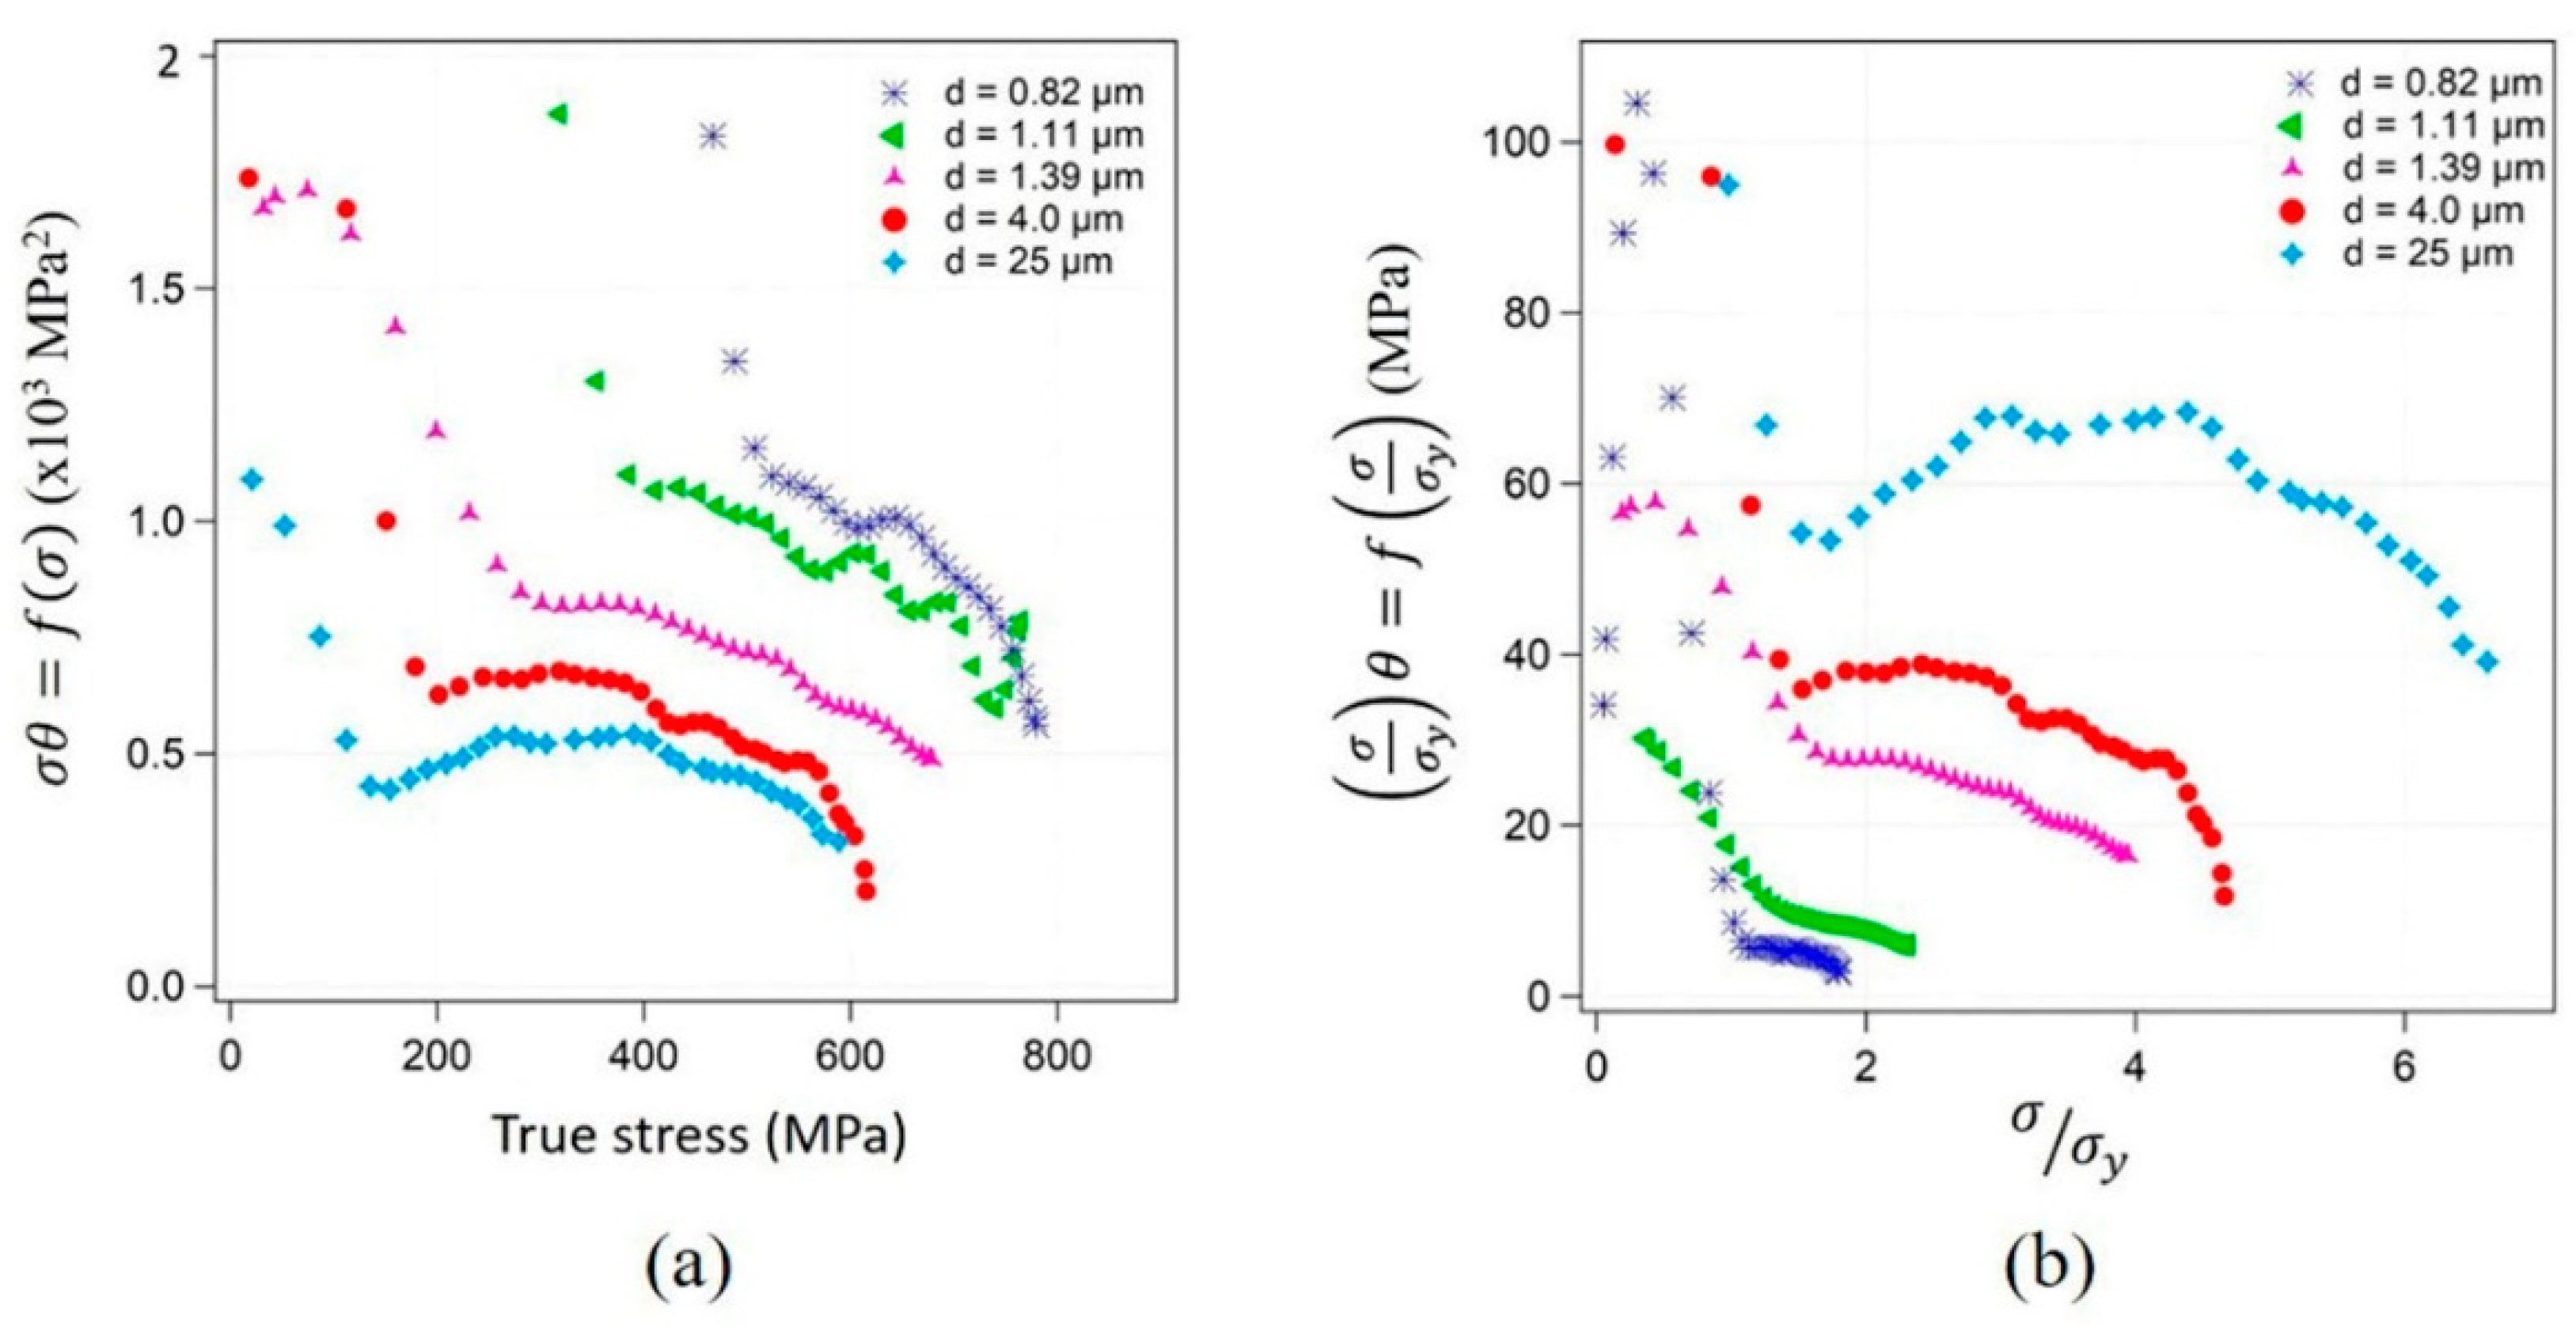
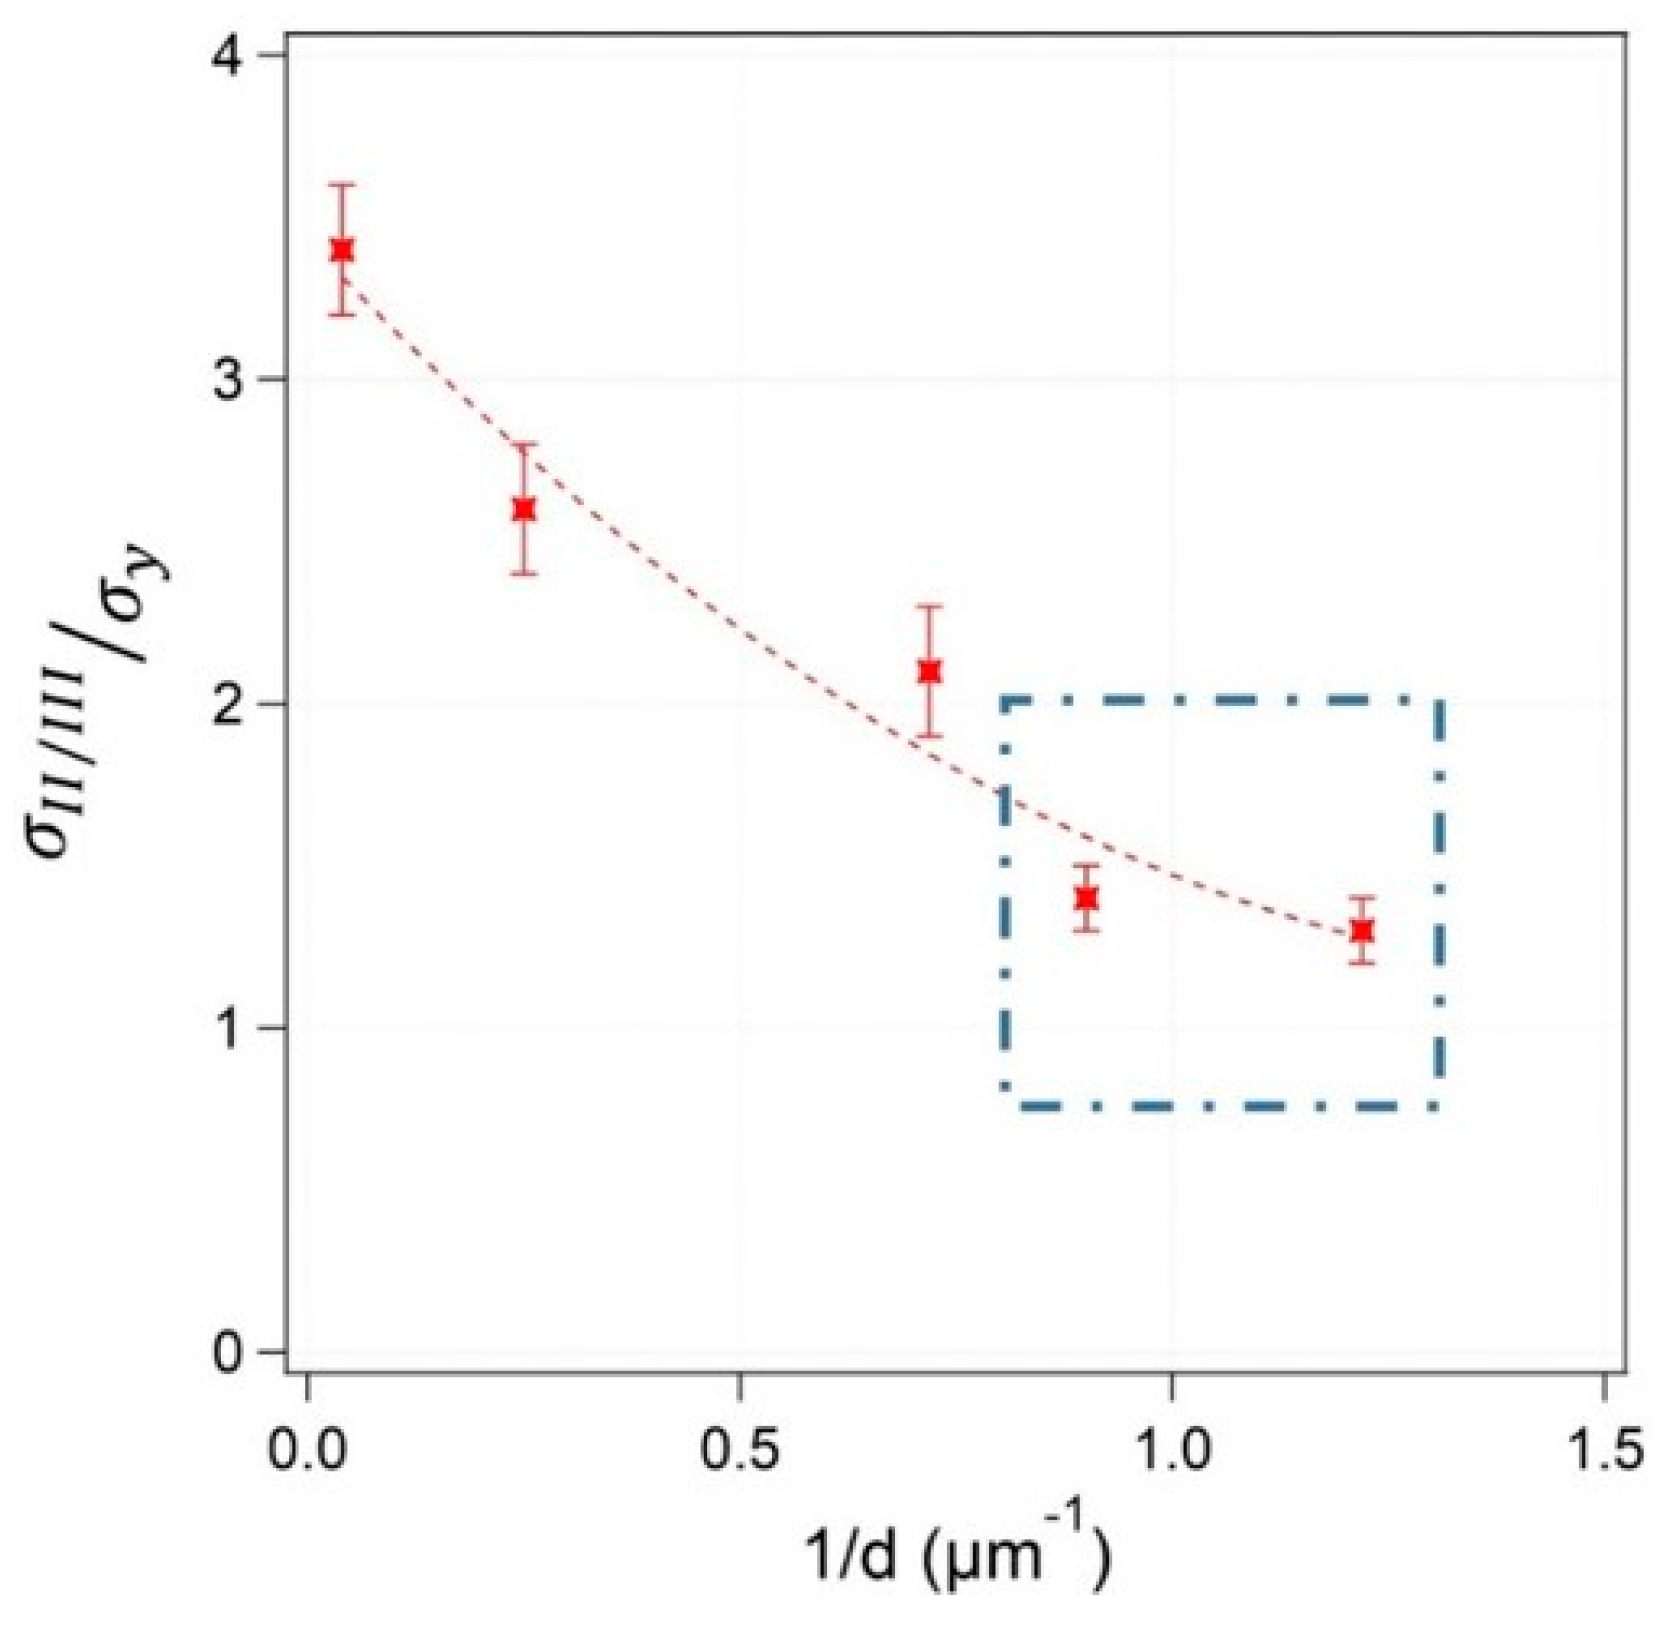
The three stages characteristic of plastic deformation in CG specimens were identified in the UFG samples. Considering the normalized stress σ/σy, the transition stress from stage I to II was similar in all samples, whereas a very short stage II was displayed by the UFG samples, entering in stage III just after initial yielding.
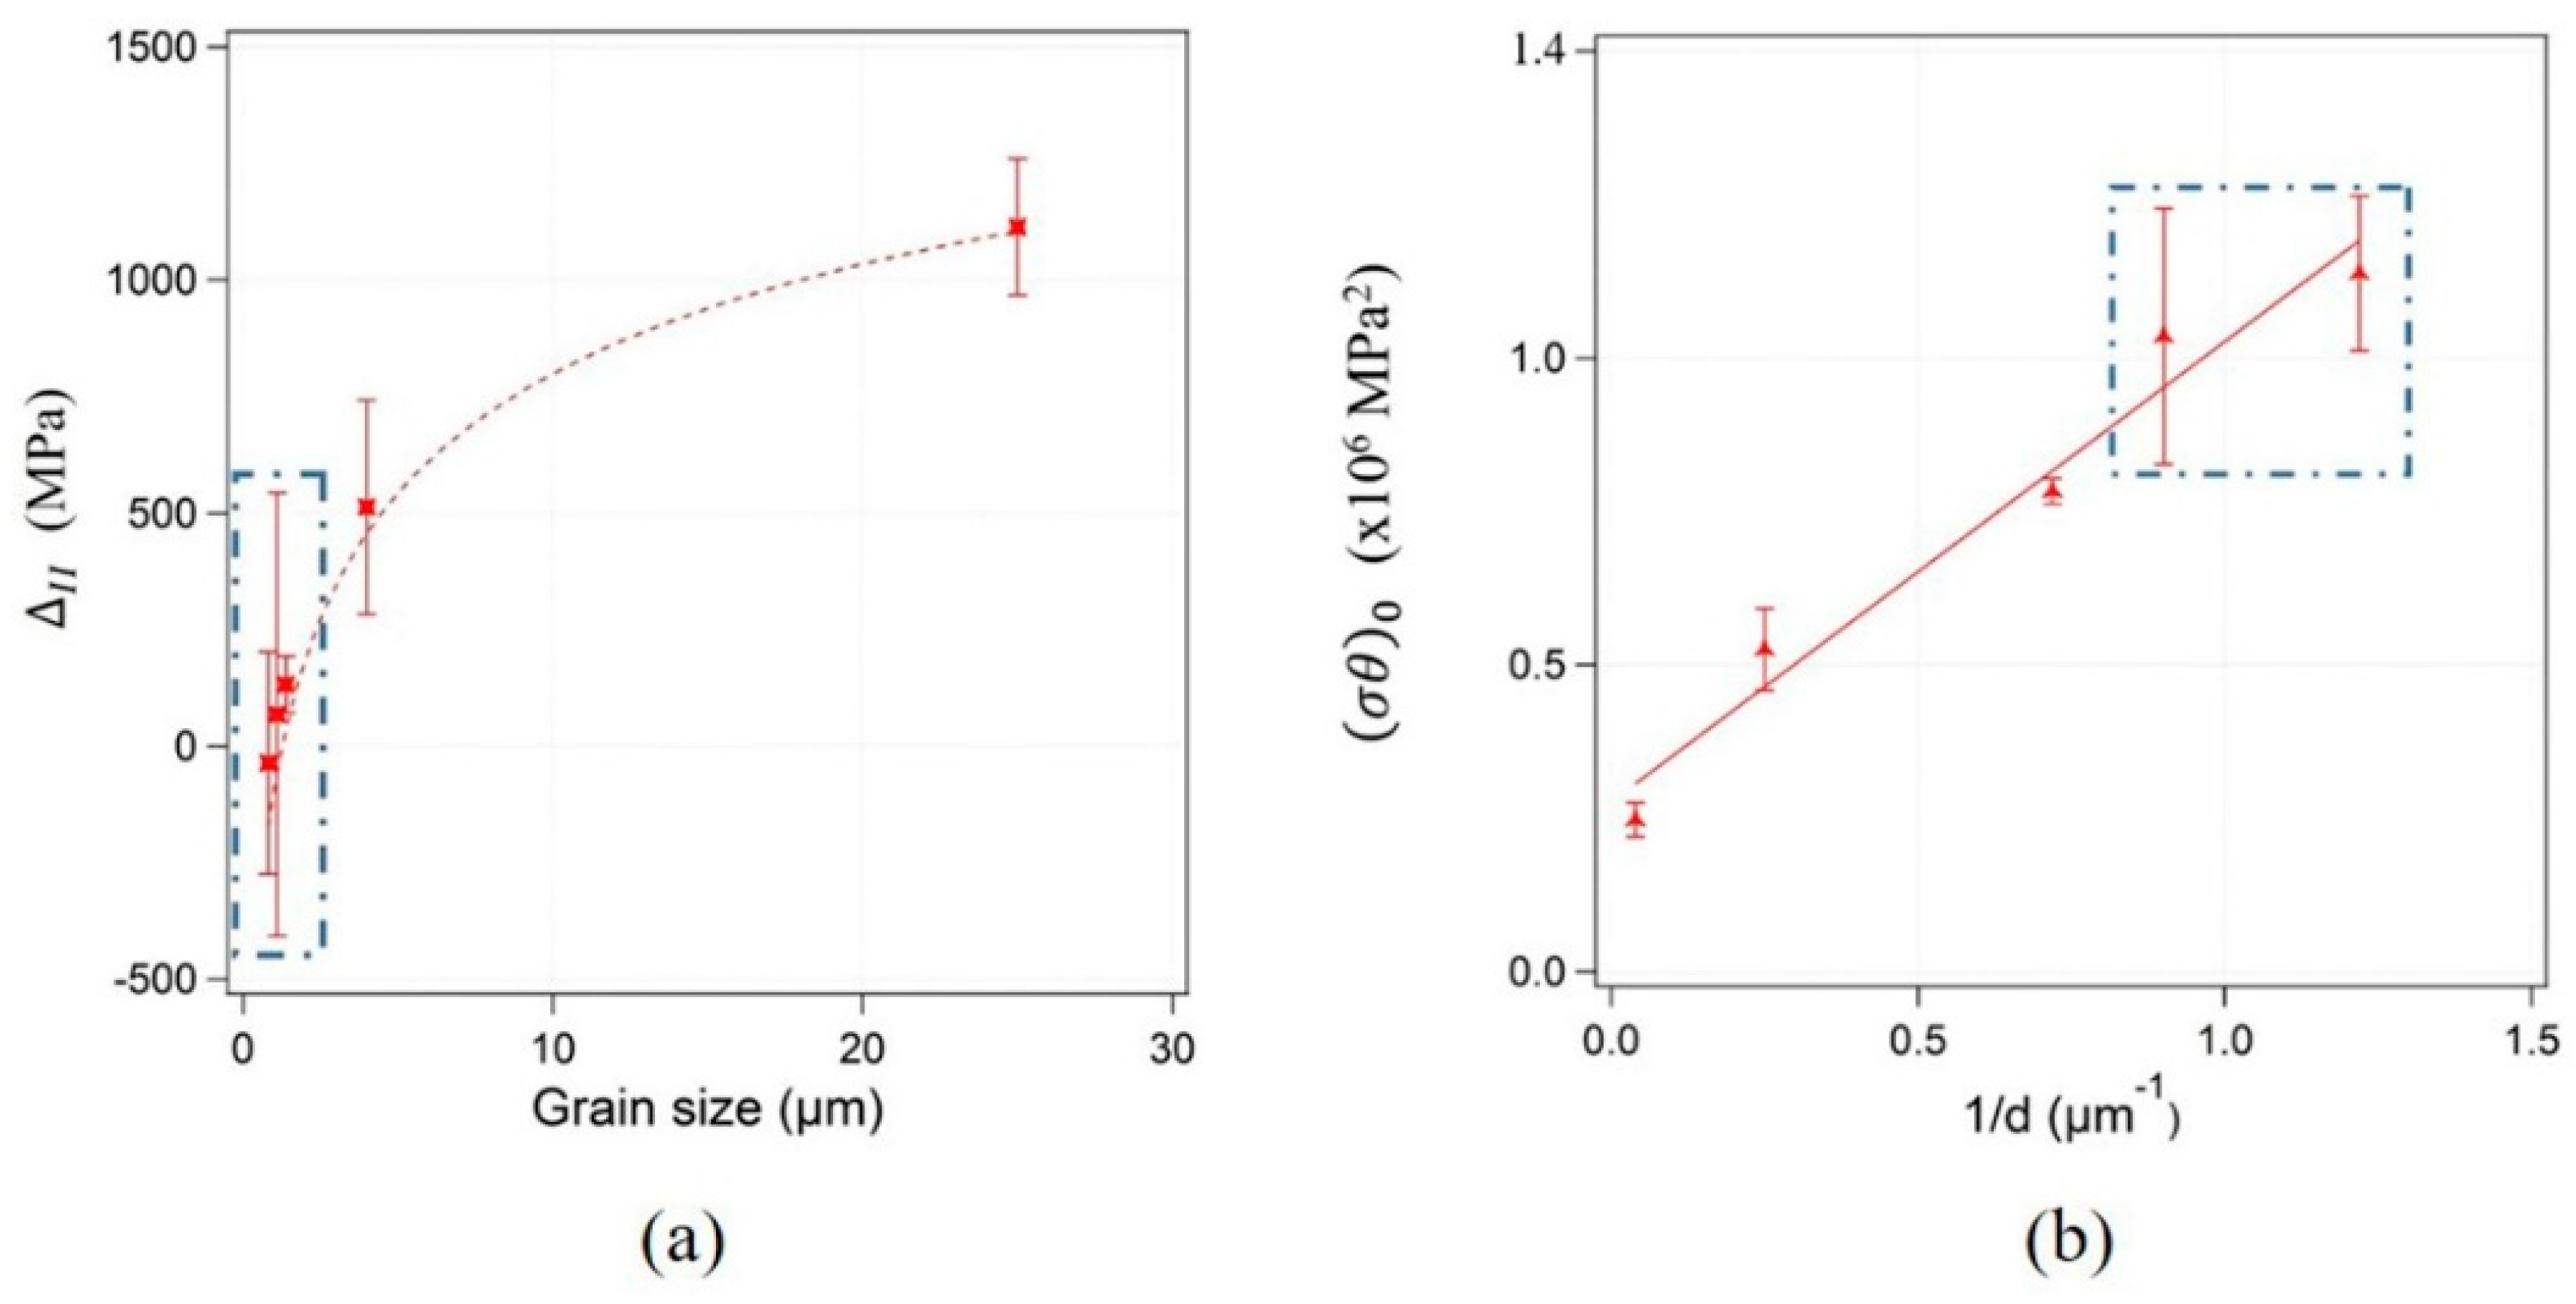
-
A decrease of Δ I I with decreasing grain size was observed suggesting low accumulation and interaction between dislocations in UFG specimens. In addition, the increase of (σθ)0 with 1/d indicate a high contribution of dislocation interaction with grain boundaries to the strain hardening of such samples.
-
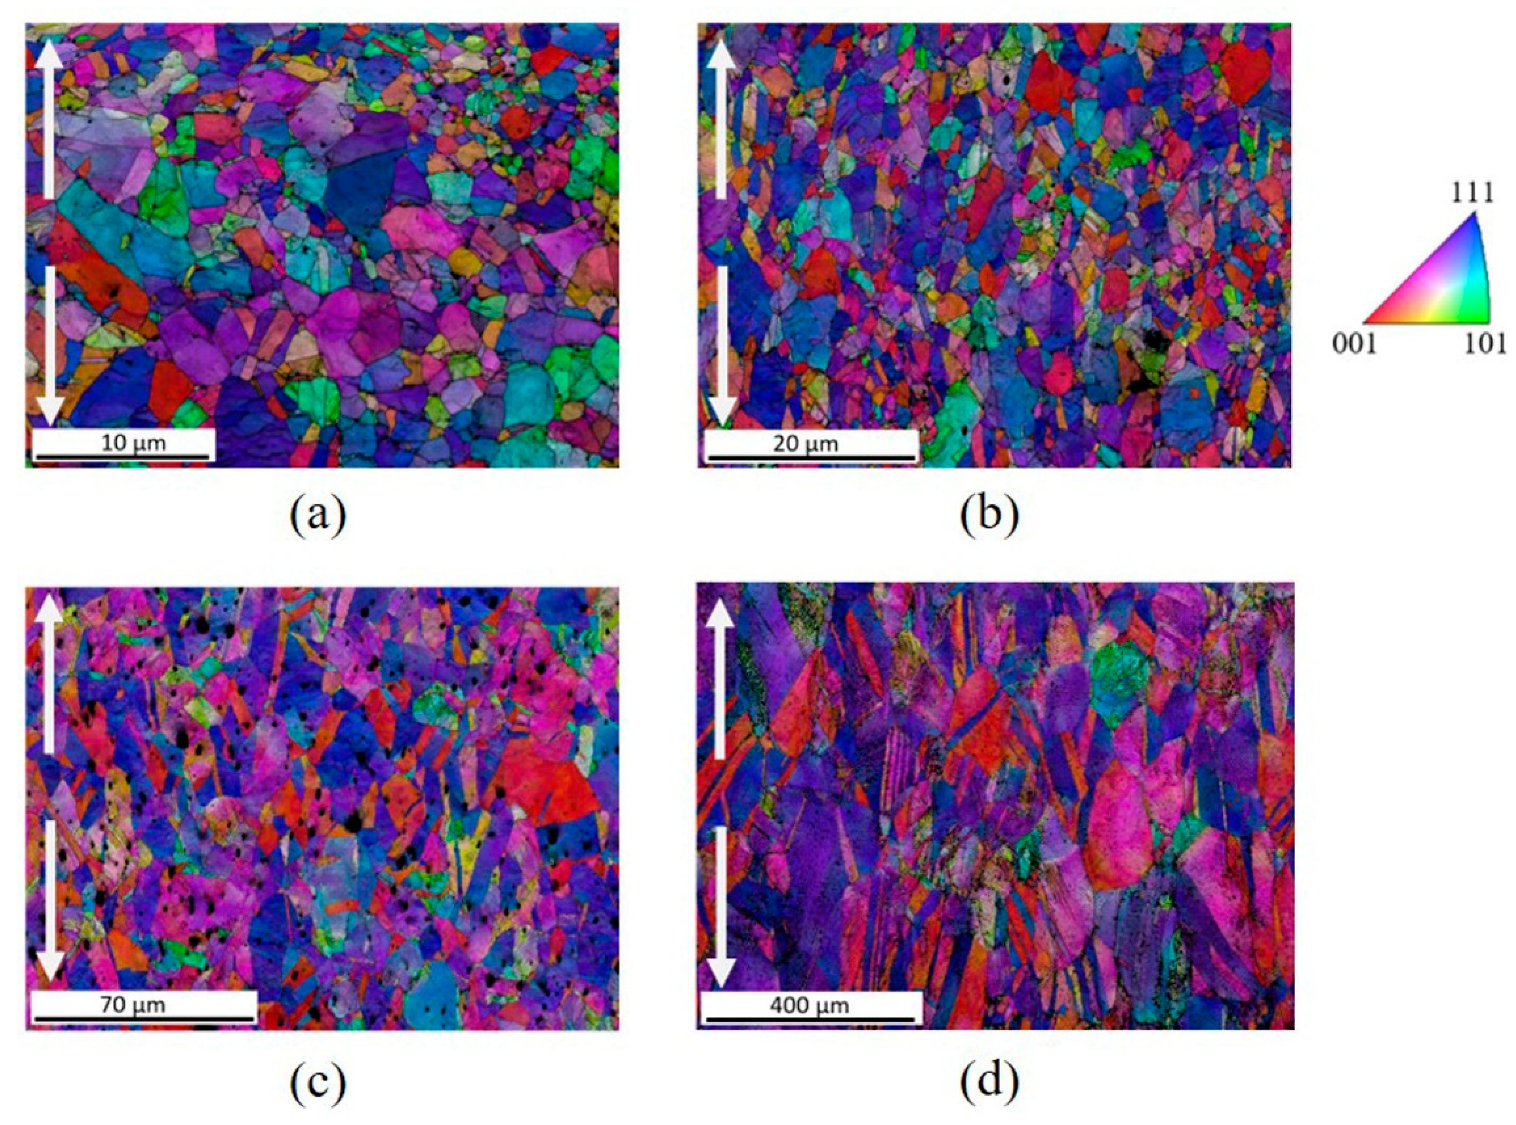
Microstructural observations performed by EBSD showed fewer changes in the microstructure, such as changes in morphology or low formation of LAGBs, in samples with grain sizes in the UFG range.
-
Misorientation cartographies (GOS and KAM), suggest low deformation of small size grains with low values of GOS and KAM, and preferred accumulation of dislocations close to grain boundaries.
-
TEM observations of the deformed state of UFG samples (d = 0.82 µm) showed low dislocation density heterogeneously distributed, and lack of well-defined dislocation cells.
From these results, we could conclude that with grain refinement in the UFG regime, dislocation storage was lessened by generalized cross-slip mechanisms and dislocation annihilation starting just after yielding, hindering the formation of organized dislocation structures in the grain core. Hardening is thus mainly mediated by dislocation interactions with grain boundaries, for grain sizes below d = 1.11 µm, which enable good ductility contrary to deformation mechanism such as grain sliding, observed in smaller size UFG and NsM metals.

Author Contributions

Conceptualization, L.G.d.l.C. and E.H.; methodology, L.G.d.l.C., M.M.C. and E.H.; validation, E.H. and C.K.; formal analysis, L.G.d.l.C., C.K. and E.H.; investigation, all authors; writing—original draft preparation, L.G.d.l.C.; writing—review and editing, all authors; supervision, E.H.; project administration, E.H. All authors have read and agreed to the published version of the manuscript.

Funding

This research received no external funding.

Institutional Review Board Statement

Not applicable.

Informed Consent Statement

Not applicable.

Data Availability Statement

The data presented in this study are available on request from the corresponding author.

Conflicts of Interest

The authors declare no conflict of interest.

Glossary

Abbreviations
BMBall milling
CGCoarse grained
CSLCoincidence site lattice
EBSDElectron backscatter diffraction
FCCFace centered cubic
FGFine grained
GBCDGrain boundary character distribution
GNDsGeometrically necessary dislocations
GOSGrain orientation spread
HABsHigh angle boundaries
IQImage quality
IPFInverse pole figure
KAMKernel average misorientation
LAGBsLow angle grain boundaries
NsMNanostructured materials
SPSSpark plasma sintering
TEMTransmission electron microscopy
UFGUltrafine grained
Symbols
αParameter of dislocation interaction and configuration
bNorm of the Burgers vector
βParameter that relates Λ and ld.
dGrain size
Δ I I Latent hardening rate
εTrue strain
εfElongation to failure
g Diffraction vector
θWork hardening rate
kgGeometric factor related to grain morphology
ldAverage distance between dislocations
ΛAverage distance traveled by a dislocation
MTaylor factor
PProbability of dislocation annihilation
ρTotal dislocation density
ρrelRelative density
σTrue stress
σyYield strength
σI/IIStress of transition between hardening stages I and II.
σII/IIStress of transition between hardening stages II and III.
yaDislocation annihilation distance
(σθ)0Parameter of contribution of grain boundaries to strain hardening

References

  1. Lu, L.; Yongfeng, S.; Chen, X.; Qian, L.; Lu, K. Ultrahigh Strength and High Electrical Conductivity in Copper. Science 2004, 304, 422–426. [Google Scholar] [CrossRef] [PubMed] [Green Version]
  2. Zhu, K.N.; Godfrey, A.; Hansen, N.; Zhang, X.D. Microstructure and Mechanical Strength of Near- and Sub-Micrometre Grain Size Copper Prepared by Spark Plasma Sintering. Mater. Des. 2017, 117, 95–103. [Google Scholar] [CrossRef]
  3. Gu, C.; Lian, J.; Jiang, Z.; Jiang, Q. Enhanced Tensile Ductility in an Electrodeposited Nanocrystalline Ni. Scr. Mater. 2006, 54, 579–584. [Google Scholar] [CrossRef]
  4. Dhal, A.; Panigrahi, S.K.; Shunmugam, M.S. Achieving Excellent Microformability in Aluminum by Engineering a Unique Ultrafine-Grained Microstructure. Sci. Rep. 2019, 9, 10683. [Google Scholar] [CrossRef] [PubMed]
  5. Le, G.M.; Godfrey, A.; Hansen, N.; Liu, W.; Winther, G.; Huang, X. Influence of Grain Size in the Near-Micrometre Regime on the Deformation Microstructure in Aluminium. Acta Mater. 2013, 61, 7072–7086. [Google Scholar] [CrossRef]
  6. Zhu, Y.T.; Wu, X.L. Ductility and Plasticity of Nanostructured Metals: Differences and Issues. Mater. Today Nano 2018, 2, 15–20. [Google Scholar] [CrossRef]
  7. Ashby, M.F. The Deformation of Plastically Non-Homogeneous Materials. Philos. Mag. 1970, 21, 399–424. [Google Scholar] [CrossRef]
  8. Cheng, S.; Spencer, J.A.; Milligan, W.W. Strength and Tension/Compression Asymmetry in Nanostructured and Ultrafine-Grain Metals. Acta Mater. 2003, 51, 4505–4518. [Google Scholar] [CrossRef]
  9. Hayes, R.W.; Witkin, D.; Zhou, F.; Lavernia, E.J. Deformation and Activation Volumes of Cryomilled Ultrafine-Grained Aluminum. Acta Mater. 2004, 52, 4259–4271. [Google Scholar] [CrossRef]
  10. Kumar, K.S.; Suresh, S.; Chisholm, M.F.; Horton, J.A.; Wang, P. Deformation of Electrodeposited Nanocrystalline Nickel. Acta Mater. 2003, 51, 387–405. [Google Scholar] [CrossRef]
  11. Ma, E. Instabilities and Ductility of Nanocrystalline and Ultrafine-Grained Metals. Scr. Mater. 2003, 49, 663–668. [Google Scholar] [CrossRef]
  12. Krasilnikov, N.; Lojkowski, W.; Pakiela, Z.; Valiev, R. Tensile Strength and Ductility of Ultra-Fine-Grained Nickel Processed by Severe Plastic Deformation. Mater. Sci. Eng. A 2005, 397, 330–337. [Google Scholar] [CrossRef]
  13. Samigullina, A.A.; Nazarov, A.A.; Mulyukov, R.R.; Tsarenko, Y.V.; Rubanik, V.V. Effect of Ultrasonic Treatment on the Strength and Ductility of Bulk Nanostructured Nickel Processed by Equal-Channel Angular Pressing. Rev. Adv. Mater. Sci. 2014, 39, 48–53. [Google Scholar] [CrossRef]
  14. Dalla Torre, F.; Van Swygenhoven, H.; Victoria, M. Nanocrystalline Electrodeposited Ni: Microstructure and Tensile Properties. Acta Mater. 2002, 50, 3957–3970. [Google Scholar] [CrossRef]
  15. Dalla Torre, F.; Spatig, P.; Schaublin, R.; Victoria, M. Deformation Behaviour and Microstructure of Nanocrystalline Electrodeposited and High Pressure Torsioned Nickel. Acta Mater. 2005, 53, 2337–2349. [Google Scholar] [CrossRef]
  16. Meyers, M.A.; Mishra, A.; Benson, D.J. Mechanical Properties of Nanocrystalline Materials. Prog. Mater. Sci. 2006, 51, 427–556. [Google Scholar] [CrossRef]
  17. Erb, U. Electrodeposited Nanocrystals: Synthesis, Properties and Industrial Applications. Nanostruct. Mater. 1995, 6, 533–538. [Google Scholar] [CrossRef]
  18. Valiev, R.Z.; Islamgaliev, R.K.; Alexandrov, I.V. Bulk Nanostructured Materials from Severe Plastic Deformation. Prog. Mater. Sci. 2000, 45, 103–189. [Google Scholar] [CrossRef]
  19. Barry, A.H.; Dirras, G.; Schoenstein, F.; Tétard, F.; Jouini, N. Microstructure and Mechanical Properties of Bulk Highly Faulted Fcc/Hcp Nanostructured Cobalt Microstructures. Mater. Charact. 2014, 91, 26–33. [Google Scholar] [CrossRef]
  20. Ebrahimi, F.; Bourne, G.R.; Kelly, M.S.; Matthews, T.E. Mechanical Properties of Nanocrystalline Nickel Produced by Electrodeposition. Nanostruct. Mater. 1999, 11, 343–350. [Google Scholar] [CrossRef]
  21. Valiev, R.Z.; Langdon, T.G. The Art and Science of Tailoring Materials by Nanostructuring for Advanced Properties Using SPD Techniques. Adv. Eng. Mater. 2010, 12, 677–691. [Google Scholar] [CrossRef]
  22. Gleiter, H. Materials with Ultrafine Microstructures: Retrospectives and Perspectives. Nanostruct. Mater. 1992, 1, 1–19. [Google Scholar] [CrossRef]
  23. Gleiter, H. Nanostructured Materials: Basic Concepts and Microstructure. Acta Mater. 2000, 48, 1–29. [Google Scholar] [CrossRef] [Green Version]
  24. Estrin, Y.; Vinogradov, A. Extreme Grain Refinement by Severe Plastic Deformation: A Wealth of Challenging Science. Acta Mater. 2013, 61, 782–817. [Google Scholar] [CrossRef]
  25. Tian, Y.Z.; Gao, S.; Zhao, L.J.; Lu, S.; Pippan, R.; Zhang, Z.F.; Tsuji, N. Remarkable Transitions of Yield Behavior and Lüders Deformation in Pure Cu by Changing Grain Sizes. Scr. Mater. 2018, 142, 88–91. [Google Scholar] [CrossRef]
  26. Yu, C.Y.; Kao, P.W.; Chang, C.P. Transition of Tensile Deformation Behaviors in Ultrafine-Grained Aluminum. Acta Mater. 2005, 53, 4019–4028. [Google Scholar] [CrossRef]
  27. Gao, S.; Bai, Y.; Zheng, R.; Tian, Y.; Mao, W.; Shibata, A.; Tsuji, N. Mechanism of Huge Lüders-Type Deformation in Ultrafine Grained Austenitic Stainless Steel. Scr. Mater. 2019, 159, 28–32. [Google Scholar] [CrossRef]
  28. García de la Cruz, L.; Martinez, M.; Keller, C.; Hug, E. Achieving Good Tensile Properties in Ultrafine Grained Nickel by Spark Plasma Sintering. Mater. Sci. Eng. A 2020, 772, 138770. [Google Scholar] [CrossRef]
  29. Jin, Y.; Lin, B.; Bernacki, M.; Rohrer, G.S.; Rollett, A.D.; Bozzolo, N. Annealing Twin Development during Recrystallization and Grain Growth in Pure Nickel. Mater. Sci. Eng. A 2014, 597, 295–303. [Google Scholar] [CrossRef] [Green Version]
  30. García de la Cruz, L.; Domenges, B.; Divinski, S.V.; Wilde, G.; Hug, E. Ultrafast Atomic Diffusion Paths in Fine-Grained Nickel Obtained by Spark Plasma Sintering. Met. Mat. Trans. A 2020, 51, 3425–3434. [Google Scholar] [CrossRef]
  31. Song, J.-M.; Lee, J.-S. Self-Assembled Nanostructured Resistive Switching Memory Devices Fabricated by Templated Bottom-up Growth. Sci. Rep. 2016, 6, 18967. [Google Scholar] [CrossRef] [PubMed]
  32. Cabibbo, M. Grain Refinement and Hardness Saturation in Pure Nickel Subjected to a Sequence of ECAP and HPT. Metall. Ital. 2015, 9, 37–48. [Google Scholar]
  33. Bui, Q.H.; Dirras, G.; Ramtani, S.; Gubicza, J. On the Strengthening Behavior of Ultrafine-Grained Nickel Processed from Nanopowders. Mater. Sci. Eng. A 2010, 527, 3227–3235. [Google Scholar] [CrossRef]
  34. Randle, V. The Coincidence Site Lattice and the ‘Sigma Enigma’. Mater. Charact. 2001, 47, 411–416. [Google Scholar] [CrossRef]
  35. King, A.H.; Shekhar, S. What Does It Mean to Be Special? The Significance and Application of the Brandon Criterion. J. Mater. Sci. 2006, 41, 7675–7682. [Google Scholar] [CrossRef]
  36. de la Cruz, L.G.; Flipon, B.; Keller, C.; Martinez, M.; Hug, E. Nanostructuration of Metals via Spark Plasma Sintering Using Activated Powder Obtained by Ball-Milling: Impact on the Strain-Hardening Mechanisms. In Proceedings of the AIP Conference Proceedings 1896, Dublin, Ireland, 26–28 April 2017; Volume 1896, p. 200002. [Google Scholar] [CrossRef]
  37. García de la Cruz, L. Ultrafine Grained Nickel Prοcessed by Pοwder Metallurgy: Micrοstructure, Mechanical Prοperties and Thermal Stability. Ph.D. Thesis, Normandie Université, Caen, France, 2019. [Google Scholar]
  38. Sitarama Raju, K.; Ghanashyam Krishna, M.; Padmanabhan, K.A.; Subramanya Sarma, V.; Gurao, N.P.; Wilde, G. Microstructure Evolution and Hardness Variation during Annealing of Equal Channel Angular Pressed Ultra-Fine Grained Nickel Subjected to 12 Passes. J. Mater. Sci. 2011, 46, 2662–2671. [Google Scholar] [CrossRef]
  39. Feaugas, X.; Haddou, H. Grain-Size Effects on Tensile Behavior of Nickel and AISI 316L Stainless Steel. Metall. Mater. Trans. A 2003, 34, 2329–2340. [Google Scholar] [CrossRef]
  40. Kocks, U.F.; Mecking, H. Physics and Phenomenology of Strain Hardening: The FCC Case. Prog. Mater. Sci. 2003, 48, 171–273. [Google Scholar] [CrossRef]
  41. Mecking, H.; Kocks, U.F. Kinetics of Flow and Strain-Hardening. Acta Metall. 1981, 29, 1865–1875. [Google Scholar] [CrossRef]
  42. Kuhlmann-Wilsdorf, D. Theory of Plastic Deformation:-Properties of Low Energy Dislocation Structures. Mater. Sci. Eng. A 1989, 113, 1–41. [Google Scholar] [CrossRef]
  43. Kubin, L.; Devincre, B.; Hoc, T. Modeling Dislocation Storage Rates and Mean Free Paths in Face-Centered Cubic Crystals. Acta Mater. 2008, 56, 6040–6049. [Google Scholar] [CrossRef]
  44. Jordan, L.; Swanger, W.H. The Properties of Pure Nickel. Bur. Standards. J. Res. 1930, 10, 6028. [Google Scholar]
  45. Narutani, T.; Takamura, J. Grain-Size Strengthening in Terms of Dislocation Density Measured by Resistivity. Acta Metall. Mater. 1991, 39, 2037–2049. [Google Scholar] [CrossRef]
  46. Keller, C. Etude Expérimentale Des Transitions Volume/Surface Des Propriétés Mécaniques Du Nickel Polycristallin de Haute Pureté. Ph.D. Thesis, Université de Caen Basse-Normandie, Caen, France, 2009. [Google Scholar]
  47. Devincre, B.; Hoc, T.; Kubin, L. Dislocation Mean Free Paths and Strain Hardening of Crystals. Science 2008, 320, 1745–1748. [Google Scholar] [CrossRef]
  48. Dubos, P.A. Influence de La Témperature et Du Trajet de Chargement Sur Les Transitions Volume/Surafec Des Méteaux Cubiques à Faces Centrées. Ph.D. Thesis, Université de Caen Basse-Normandie, Caen, France, 2013. [Google Scholar]
  49. Hansen, N.; Huang, X. Microstructure and Flow Stress of Polycrystals and Single Crystals. Acta Mater. 1998, 46, 1827–1836. [Google Scholar] [CrossRef]
  50. Hug, E.; Keller, C. Intrinsic Effects Due to the Reduction of Thickness on the Mechanical Behavior of Nickel Polycrystals. Metall. Mater. Trans. A 2010, 41A, 2498–2506. [Google Scholar] [CrossRef]
  51. Estrin, Y.; Mecking, H. A Unified Phenomenological Description of Work Hardening and Creep Based on One-Parameter Models. Acta Metall. 1984, 32, 57–70. [Google Scholar] [CrossRef]
  52. Jensen, D.J.; Thompson, A.W.; Hansen, N. The Role of Grain Size and Strain in Work Hardening and Texture Development. Metall. Trans. A 1989, 20, 2803–2810. [Google Scholar] [CrossRef]
  53. Taylor, G.I. Plastic Strain in Metals. J. Inst. Met. 1938, 62, 307–324. [Google Scholar]
  54. Humphreys, F.J.; Hatherly, M. Recrystallization and Related Annealing Phenomena, 2nd ed.; Elsevier: Oxford, UK, 2004. [Google Scholar]
  55. Rémy, L. The Interaction between Slip and Twinning Systems and the Influence of Twinning on the Mechanical Behavior of Fcc Metals and Alloys. Metall. Trans. A 1981, 12, 387–408. [Google Scholar] [CrossRef]
  56. Yamakov, V.; Wolf, D.; Phillpot, S.R.; Gleiter, H. Dislocation–Dislocation and Dislocation–Twin Reactions in Nanocrystalline Al by Molecular Dynamics Simulation. Acta Mater. 2003, 51, 4135–4147. [Google Scholar] [CrossRef]
  57. Gubicza, J.; Bui, H.-Q.; Fellah, F.; Dirras, G.F. Microstructure and Mechanical Behavior of Ultrafine-Grained Ni Processed by Different Powder Metallurgy Methods. J. Mater. Res. 2009, 24, 217–226. [Google Scholar] [CrossRef] [Green Version]
  58. Brewer, L.N.; Field, D.P.; Merriman, C.C. Mapping and Assessing Plastic Deformation Using EBSD. In Electron Backscatter Diffraction in Materials Science; Springer Science & Business Media: Berlin/Heidelberg, Germany, 2009. [Google Scholar]
  59. Kuhlmann-Wilsdorf, D.; Hansen, N. Geometrically Necessary, Incidental and Subgrain Boundaries. Scr. Metall. Mater. 1991, 25, 1557–1562. [Google Scholar] [CrossRef]
  60. Field, D.P.; Bradford, L.T.; Nowell, M.; Lillo, T.M. The Role of Annealing Twins during Recrystallization of Cu. Acta Mater. 2007, 55, 4233–4241. [Google Scholar] [CrossRef]
  61. Schwartz, A.J.; Kumar, M.; Adams, E. Backscatter Diffraction in Materials Science; Field, D.P., Adams, B.L., Kumar, M., Schwartz, A.J., Eds.; Springer US: Boston, MA, USA, 2000. [Google Scholar]
  62. Sakakibara, Y.; Kubushiro, K. Stress Evaluation at the Maximum Strained State by EBSD and Several Residual Stress Measurements for Plastic Deformed Austenitic. World J. Mech. 2017, 7, 195–210. [Google Scholar] [CrossRef] [Green Version]
  63. Fu, H.-H.; Benson, D.J.; Meyers, M.A. Analytical and Computational Description of Effect of Grain Size on Yield Stress of Metals. Acta Mater. 2001, 49, 2567–2582. [Google Scholar] [CrossRef]
  64. Feaugas, X.; Haddou, H. Effects of Grain Size on Dislocation Organization and Internal Stresses Developed under Tensile Loading in Fcc Metals. Philos. Mag. 2007, 87, 989–1018. [Google Scholar] [CrossRef] [Green Version]
  65. Keller, C.; Hug, E.; Retoux, R.; Feaugas, X. TEM Study of Dislocation Patterns in Near-Surface and Core Regions of Deformed Nickel Polycrystals with Few Grains across the Cross Section. Mech. Mater. 2010, 42, 44–54. [Google Scholar] [CrossRef]
Figure 1. FCT System GmbH, HD25 SPS apparatus (left) and sintering set-up (right) (a). The metallic wire positioned in a hole in the die is a thermocouple used to control the sintering temperature. Tensile specimen extracted from a 50 mm sintered disc (b).
Metals 11 00065 g001
Figure 2. True stress–true strain tensile curves for Ni samples 1–5 processed by spark plasma sintering (SPS).
Metals 11 00065 g002
Figure 3. Evolution of the work hardening rate ( θ = ( d σ d ε ) ), determined from tensile testing to failure at a strain rate of 10−3 s−1, with true stress normalized by yield strength for Ni samples prepared by SPS with different grain sizes. The average grain size of the samples is indicated in a color scale for each figure.
Metals 11 00065 g003
Figure 4. Example of the evolution of the σ∙θ product with stress for polycrystalline Ni (d = 25 µm), displaying the three stages of strain hardening, the transition stresses σI/II and σII/III, Δ I I and (σθ)0.
Metals 11 00065 g004
Figure 5. Evolution of the σ∙θ product with stress for the Ni samples processed by SPS with different grain sizes (a) and the same curves after normalization of stress by yield strength σy (b). The average grain size of the samples is indicated in a color scale for each figure.
Metals 11 00065 g005
Figure 6. Evolution of the transition stress from work hardening stage II to stage III (σII/III) normalized by yield strength as a function of 1/d for the five sintered samples. The two UFG samples are framed in blue.
Metals 11 00065 g006
Figure 7. Evolution of the latent hardening rate (ΔII) in stage II of strain hardening as a function of grain size (a) for the five sintered samples. Evolution of (σθ)0 as a function of 1/d for the five sintered samples (b). The two UFG samples are framed in blue.
Metals 11 00065 g007
Figure 8. Superposition of inverse pole figure (IPF) + image quality (IQ) cartography for samples 1 (d = 0.82 µm) (a), 3 (d = 1.39 µm) (b), 4 (d = 4.0 µm) (c) and 5 (d = 25 µm) (d) with the tensile stress direction as reference, for fractured samples. White arrows indicate the tensile direction.
Metals 11 00065 g008
Figure 9. Grain orientation spread (GOS) + IQ map of samples 1 (d = 0.82 µm) (a), 3 (d = 1.39 µm) (b) and 4 (d = 4.0 µm) (c) at the initial state (left) and deformed state at fracture (right). Color legend represents the orientation spread in degrees. Inserts display the distribution of GOS values for each state and sample.
Metals 11 00065 g009
Figure 10. First neighbor kernel average misorientation (KAM)+IQ cartographies of samples 1 (d = 0.82 µm) (a), 3 (d = 1.39 µm) (b) and 4 (d = 4 µm) (c) in the initial state (left) and for fractured samples (right). Color legend represents the kernel average misorientation in degrees. Inserts display the distribution of first neighbor KAM values for each state and sample.
Metals 11 00065 g010
Figure 11. TEM images of grains of fractured sample 4 (d = 4.0 µm), containing dislocation cells. Accumulation of geometric dislocation cells of similar size in a single grain ( g = [ 1 1 ¯ 1 ] ) (a) and contiguous grains displaying dislocation cells with a high density of dislocations (b).
Metals 11 00065 g011
Figure 12. TEM images of sample 1 (d = 0.82 µm) deformed up to fracture. Grains with different contrasts possibly due to a high density of dislocations (a) and a nanometric dislocation cell ( g = [ 020 ] ) (b).
Metals 11 00065 g012
Table 1. Synthesis parameters of the samples (BM: ball milling).
SampleGrain Size (μm)ρrel (%)Type of PowderBM Time (h)BM Speed (rpm)Amount of Methanol (%)Sintering Temperature (K)
10.82 ± 0.6798.5BM1035066.71023
21.11 ± 0.8499.5BM335016.71023
31.39 ± 1.1199.3BM330066.71023
44.0 ± 2.497.6As-received1023
525 ± 1798.7As-received1273
Table 2. Grain boundary character distribution (GBCD) of samples in the initial state and deformed at fracture.
SampleGrain Size (µm)Initial State [28]Deformed at Fracture
LAGBsΣ3CSLHABsLAGBsΣ3CSLHABs
10.82 ± 0.670.0360.4950.0560.4130.0570.3880.0470.508
21.11 ± 0.840.040.4560.0440.460.1330.2460.0560.565
31.39 ± 1.110.0230.5350.0570.3850.0930.3360.0440.527
44.0 ± 2.40.020.5260.0460.4080.3830.2020.0360.379
525 ± 170.020.6160.0370.3270.730.0880.0220.16
Publisher’s Note: MDPI stays neutral with regard to jurisdictional claims in published maps and institutional affiliations.

