Article

Texture Memory in Hexagonal Metals and Its Mechanism

1
Frontier Research Center for Applied Atomic Sciences, Ibaraki University, Naka 319-1106, Ibaraki, Japan
2
Los Alamos Neutrron Science Center, Los Alamos National Laboratory, Los Alamos, NM 87545, USA
3
Graduate School of Science and Engineering, Ibaraki University, Hitachi 316-8511, Ibaraki, Japan
*
Author to whom correspondence should be addressed.
Metals 2021, 11(10), 1653; https://doi.org/10.3390/met11101653
Submission received: 11 September 2021 / Revised: 28 September 2021 / Accepted: 5 October 2021 / Published: 18 October 2021

Abstract

:
Texture memory is a phenomenon in which retention of initial textures occurs after a complete cycle of forward and backward transformations, and it occurs in various phase-transforming materials including cubic and hexagonal metals such as steels and Ti and Zr alloys. Texture memory is known to be caused by the phenomena called variant selection, in which some of the allowed child orientations in an orientation relationship between the parent and child phases are preferentially selected. Without such variant selection, the phase transformations would randomize preferred orientations. In this article, the methods of prediction of texture memory and mechanisms of variant selections in hexagonal metals are explored. The prediction method using harmonic expansion of orientation distribution functions with the variant selection in which the Burgers orientation relationship, {110}β//{0001}α-hex <1 1 ¯ 1>β// 2 1 ¯ 1 ¯ 0 α-hex, is held with two or more adjacent parent grains at the same time, called “double Burgers orientation relation (DBOR)”, is introduced. This method is shown to be a powerful tool by which to analyze texture memory and ultimately provide predictive capabilities for texture changes during phase transformations. Variation in nucleation and growth rates on special boundaries and an extensive growth of selected variants are also described. Analysis of textures of commercially pure Ti observed in situ by pulsed neutron diffraction reveals that the texture memory in CP-Ti is indeed quite well predicted by consideration of the mechanism of DBOR. The analysis also suggests that the nucleation and growth rates on the special boundary of 90° rotation about 2 1 ¯ 1 ¯ 0 α-hex should be about three times larger than those of the other special boundaries, and the selected variants should grow extensively into not only one parent grain but also other grains in α-hex(hexagonal)→β(bcc) transformation. The model calculations of texture development during two consecutive cycles of α-hexβα-hex transformation in CP-Ti and Zr are also shown.

1. Introduction

When materials transform from one phase to another and transform back to the initial phase, crystallographic textures in the initial phase are often retained to a great extent [1,2,3,4,5,6,7], and, in some cases, not only the textures but also the grain structures are reconstructed [8,9,10] despite diffusive transformation. These phenomena are called ‘texture memory’, and the latter are known as ‘austenite memory’ for fcc austenite (γ)→martensite (or bainite)→γ transformation in steel [8,9,10]. Since the texture memory occurs in various industrial heating processes such as austenization in steel [1,2,3] as well as bcc β-phase heat treatment in Ti and Zr alloys [4,5,6,7] and influences many properties of the materials, studies on texture memory have been a central subject for decades in industry as well as academic fields.
For phase transformation in cubic and hexagonal metals, there are two well-known orientation relationships: the Kurdjumov–Sachs (K-S) orientation relationship in steel between bcc α–ferrite (α-f) and γ, {111}γ//{110}α-f, < 1 1 ¯ 0>γ//< 1 1 ¯ 1 >α-f, [11] and the Burgers orientation relationship (BOR) in e.g. Ti and Zr and their alloys between the low temperature hexagonal (α-hex) and high temperature β phases, {110}β//{0001}α-hex, < 1 1 ¯ 1 >β// 2 1 ¯ 1 ¯ 0 α-hex, [12]. During phase transformation, orientations of parent phase grains are inherited to those of child phase grains by these orientation relationships. However, since multiple possible child orientations are allowed, of which the numbers are 24 for the K-S relation and 6 and 12 for BOR in α-hex→β and βα-hex, respectively, the texture in the initial phase would be largely smeared if all the variants were chosen at an equal rate. Nevertheless, texture memory occurs. Therefore, there must be some mechanisms that favor some orientation variants over others, i.e., variant selection, which has been thought to be responsible for the texture memory.
However, the mechanisms of variant selection are not thoroughly understood thus far [1,2,3,4,5,6,7], partly because of the difficulty of in situ observation of texture change during heat treatment at high temperatures, where oxidization of metal surfaces, grain growth and chemistry changes due to evaporation of elements take place easily. Recently, neutron and high-energy synchrotron X-ray diffractions by which bulk samples rather than only the sample surface can be characterized have become available for in situ high temperature texture measurements [4,5,7,13]. Additionally, electron back scattering diffraction (EBSD) analysis using scanning electron microscope (SEM) has enabled 2D [14,15] or even 3D micro-texture analysis [16,17,18], and thereby details of the texture changes during phase transformation have been revealed and the mechanisms behind them have gradually been clarified. The purpose of this articles is to explore the mechanisms of the texture memory in hexagonal metals, especially in pure Ti for which neutron diffraction data exist, and explain the observed texture evolution by the variant selection mechanism, which we call the double Burgers orientation relation (DBOR) where variants that hold BOR or near-BOR with two or more adjacent parent grains are selected.

2. Texture Memory in Ti and Zr Alloys

The texture memory in hexagonal metals such as commercially pure Ti (CP-Ti), Ti-6%Al-4%V and Zr-3%Nb is strong and often even strengthens their textures [4,5,6,7], which is one of the critical factors controlling various properties of the materials widely used in aerospace, chemical, biomedical, healthcare, and power generation industries [19,20,21]. Crystallographic textures that develop during thermomechanical processes in production cause large elastic, plastic, and thermal anisotropies [22] and are known to influence tensile strengths [22], fracture toughness [22,23,24], corrosion resistance, and biocompatibility [25,26] in the various industrial products.
The variant selection in hexagonal metals has been studied mostly for βα-hex transformation using β stabilized alloys, in which both product and parent phases of α-hex and β can be observed at room temperature. Furuhara and his coworkers [27] reported by transmission electron microscopy that α-hex particles nucleated on β grain boundaries satisfied DBOR, which reduced interphase boundary energy. DBOR has been observed by several other investigations using EBSD [4,28]. Related to this mechanism, it is also well known that when two adjacent β grains nearly share a common {110} plane (about 10° deviation allowed), α-hex variants often nucleate on the β grain boundary having the basal plane parallel to the common {110} [28]. Inclination from grain boundary planes is also known to influence the variant selection such that the low energy facets of α-hex such as {112}β// 1 1 ¯ 00 α-hex [29] or the common close-packed direction <111>β// 2 1 ¯ 1 ¯ 0 α-hex [27] tend to be parallel to β grain boundary planes. Shi et al. proposed that DBOR was the first rule to be obeyed, and the second and the third were those related to the low energy facets [30]. However, it is not yet clear whether these mechanisms observed for individual grains can explain the bulk texture evolution during βα-hex transformation, partly because the mathematical basis to compute transformation textures based on the proposed mechanisms has not been established.
Another variant selection mechanism proposed for βα-hex transformation in Zrcallloy-4 was based on an anisotropic elastic energy stored in neighbor parent grains. Transformation strain of martensite (α′-hex) can cause elastic strain not only in a single parent grain but also in multiple parent grains, and the elastic anisotropy of the neighbor grains can cause differences in the elastic energy for different variants, i.e., variant selection. The texture of α′-hex was calculated based on the mechanism, and the reconstructed β texture from the observed α′-hex texture by EBSD agreed well with the observed α′-hex texture [6].
In situ texture measurements are best suited to investigating the high-temperature β textures. Lonardelli et al. [4] and Wenk et al. [5] have observed in situ the texture variations in CP-Ti and Zr (Zrcalloy-4), respectively, during α-hexβα-hex transformation cycles using a pulsed neutron diffractometer HIPPO in Los Alamos Neutron Science Center (LANSCE) [31,32]. They reported that the texture of α-hex that consists of components near 1 ¯ 2 1 ¯ 5 10 1 ¯ 0 and 01 1 ¯ 3 2 1 ¯ 1 ¯ 0 (transverse direction (TD)-split c-axis components) transformed to the β texture with a maximum around {112}< 11 1 ¯ > (or components having <111> along the rolling direction (RD)) with varying strengths of the cubic component {001}<100>. The cubic component in CP-Ti was as intense as the {112}< 11 1 ¯ > component, whereas that in Zr was vanishingly small. These β textures were then observed to transform to α-hex textures with stronger near- 01 1 ¯ 3 2 1 ¯ 1 ¯ 0 components than the initial texture, exhibiting the texture memory effect (see later sections for more details).
For the mechanism of the texture formation during α-hexβ transformation, it has been proposed that the near- 01 1 ¯ 3 2 1 ¯ 1 ¯ 0 components selectively transform in accordance with BOR and grow into the other components for both CP-Ti [4] and Zr [5]. A strong variant selection by an unknown mechanism was also required to explain the transformation textures [4]. Daymond et al. proposed a variant selection mechanism caused by stresses due to the anisotropy of thermal expansion in Zr-2.5%Nb, and qualitative agreement between observed and predicted β textures was reported [7]. Interestingly, DBOR has to the best of our knowledge never been proposed in α-hexβ transformation, although DBOR has been suggested as a variant selection mechanism in βα-hex by many investigators. Therefore, open questions remain in the texture memory in hexagonal metals.
In the following sections, the mathematical basis to predict the α-hexβ→ and βα-hex transformation textures in hcp metals with variant selection, especially DBOR, is introduced. Then, we analyze the texture memory in α-hexβα-hex transformation in CP-Ti measured in situ via HIPPO in LANSCE [4,31,32], based on the mathematical basis described below.

3. Mathematical Basis of Transformation Texture Prediction for HCP Metals

3.1. Harmonic Equations for Transformation Texture Computation
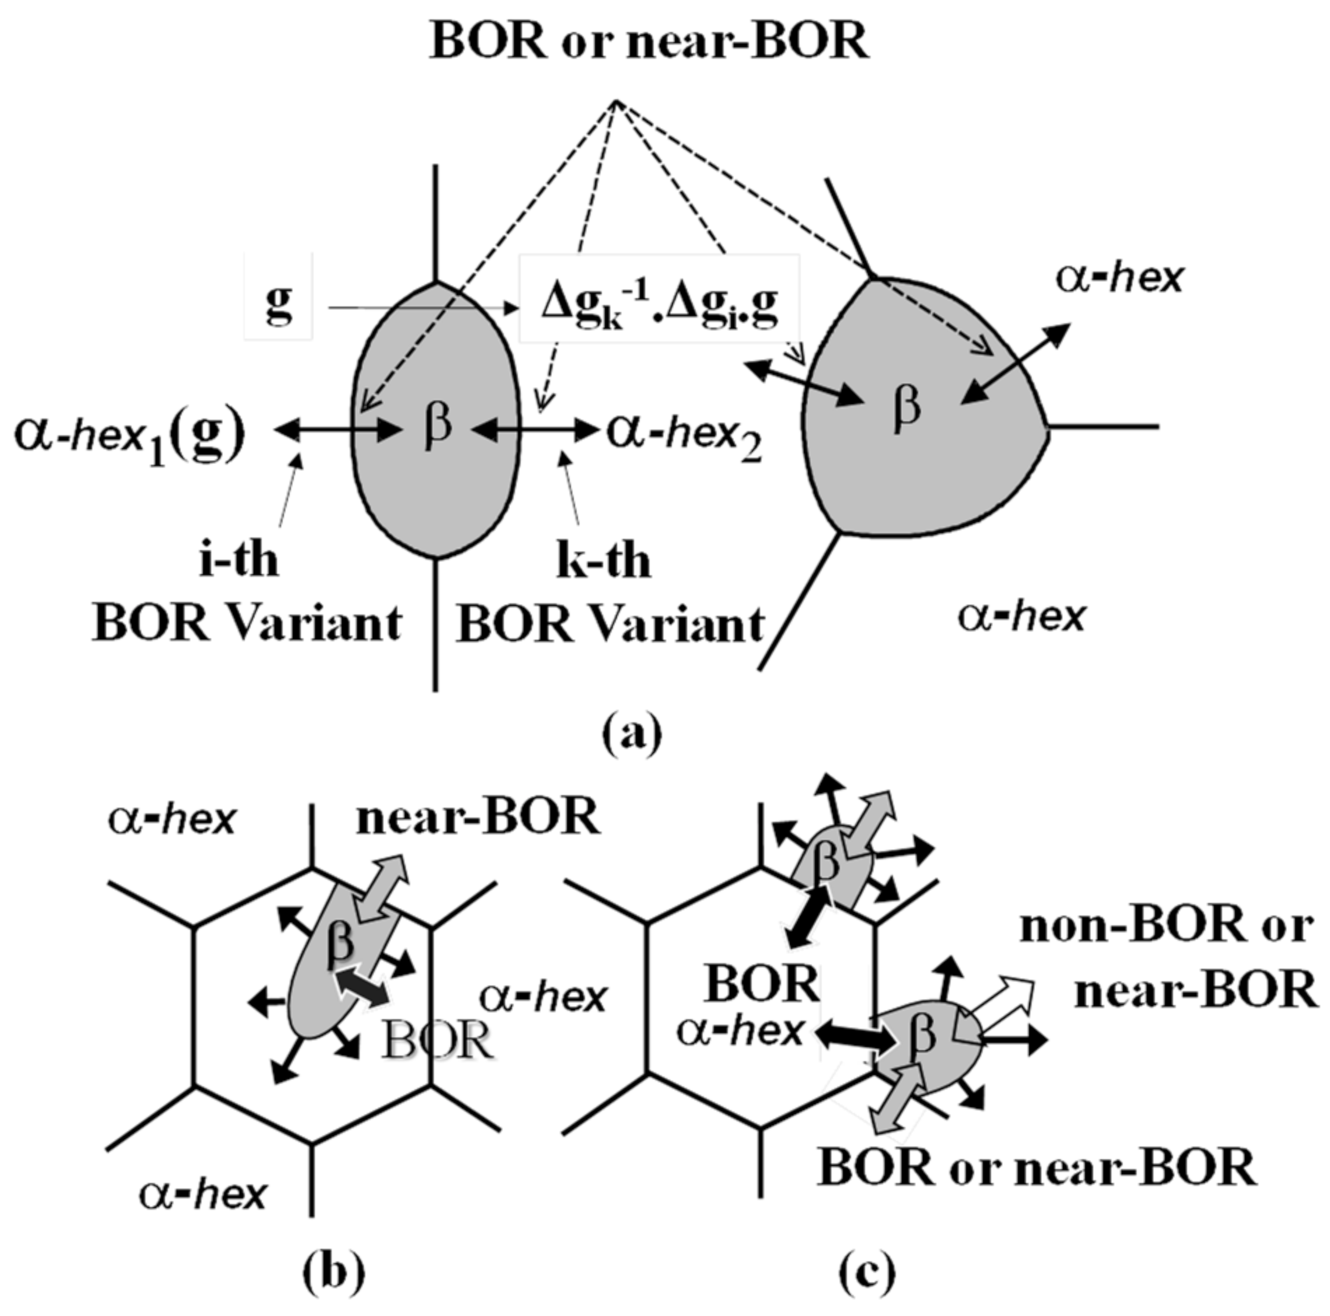
Let us start with a very simple case, α-hexβ transformation with only one variant. Given the rotation matrix for the orientation relationship, Δg, and the orientation distribution functions (ODF) of α-hex and β phases, fα-hex (g) and fβ(g), respectively, fβ(g) is given by
f β g = f α h e x Δ g 1 · g .
When the orientation relation has a distribution of wg) as well as variants and a variant selection, ρ(g), it follows that
f β g = w Δ g · ρ Δ g 1 · g · f α h e x Δ g 1 · g d Δ g .
with an appropriate symmetry operation, this equation gives transformation textures in which transformed components due to different variants are mixed as they naturally occur. The ODFs should have crystal and sample symmetries, wg) has the crystal symmetry of β phase, and ρ(g) has sample symmetry [33].
We expand the above functions by generalized (symmetric) harmonics defined by Bunge [34] as follows:
f α h e x g = λ = 0 μ = 1 M λ ν = 1 N λ C α h e x λ μ ν · T :.   λ μ v ( g ) ,
f β g = λ = 0 μ = 1 R λ ν = 1 N λ C β λ μ ν · T ⋮.   λ μ v ( g ) ,  
w g = λ = 0 μ = 1 R λ n = λ λ w λ μ n · T   λ μ n ( g ) ,  
ρ g = λ = 0 m = λ λ ν = 1 N λ ρ λ m ν · T   .   λ m ν ( g ) ,
where Ts are the generalized harmonic functions in which dots above indicate that symmetries of crystals and samples are included in the functions (three dots: β crystal symmetry, two dots: α-hex crystal symmetry, one dot: sample symmetry).
Then it follows that
C β λ μ ν = 1 2 · λ + 1 λ 1 = 0 m = λ 1 λ 1 ν 1 = 1 N λ 1 λ 2 = 0 ν 2 = 1 N λ 2 μ 1 = 1 M λ 1 s = λ λ w λ μ s · ρ λ 2 r ν 2 · C α h e x λ 1 μ 1 ν 1 · A   : λ 1 m μ 1 · ( λ 1 λ 2 m r | λ s ) { λ 1 λ 2 ν 1 ν 2 | λ ν } .
Here, s = m + r, s ≤ λ and A   : λ m μ , λ 1 λ 2 m r | λ s , and λ 1 λ 2 ν 1 ν 2 | λ ν are the symmetry coefficients, the Clebsh–Goldan coefficients, and the generalized Clebsh–Goldan coefficients, respectively [34]. It is also held that λ 1 λ 2 λ λ 1 + λ 2 . When there is no distribution in the orientation relation, Equation (7) can be written as
C β λ μ ν = λ 1 = 0 m = λ 1 λ 1 ν 1 = 1 N λ 1 λ 2 = 0 ν 2 = 1 N λ 2 μ 1 = 1 M λ 1 s = λ λ T   λ μ s Δ g · ρ λ 2 r ν 2 · C α h e x λ 1 μ 1 ν 1 · A   : λ 1 m μ 1 · ( λ 1 λ 2 m r | λ s ) { λ 1 λ 2 ν 1 ν 2 | λ ν } .
In the analysis in the later sections, Equation (8) was used with BOR and the truncation at the order of 28th for λ and λ1 and the 20th for λ2. The transformation texture for the reverse transformation from β to α-hex can be calculated in the same fashion.

3.2. DBOR

When a child phase nucleates on a grain boundary of a parent phase, the nucleus may hold an orientation relationship with not only one parent grain into which it grows but also one or more adjacent parent grains allowing a certain deviation from the orientation relation (up to around 10°) to further reduce interphase boundary energy. This hypothesis has been made for the transformation between α-f and γ in steel, called the double K-S relation (DKS) [3,35,36], and the texture prediction based on DKS has quantitatively explained various transformation textures such as those in hot-rolled steels [35,37] and texture memory effects in hot-rolled [3,14,36], cold-rolled [3], extruded [36], and ECAP(equal channel angular pressing)-processed [38] steels. DKS has been experimentally observed by 2D- [14,15] and 3D-EBSD [16,17] as well as 3D synchrotron X-ray measurement recently [39]. This concept is an extension of the mechanism proposed by Hutchinson and Kestens [2] and Yoshinaga et. al. [40], which have been published in the same narrow period. The mechanism called DKS is extended to include not only the rare case of grain boundaries in which the variants of the original orientations exactly satisfy the rule but also other boundaries for which many variants can hold the DKS relation with the deviation up to about 10°. Then DKS can be applied to both for α-f→γ and γ→α-f transformations explaining the observed texture memory as well as the transformation textures in hot-rolled steel, and, more importantly, this generalized mechanism allows us to accurately predict the transformation textures in steels of this kind.
Here, we adapt the mathematical scheme of DKS for fcc/bcc transformations [3,36] to DBOR for hexagonal metals exhibiting hcp/bcc transformations. Let us assume α-hexβ transformation for the mathematical formulation. A growing β nucleus satisfies DBOR when two neighboring parent grains satisfy g2 ≈ Δgk−1·Δgi·g1, as shown in Figure 1a. In this equation, g1 and g2 are the orientations of the two adjacent parent grains, α1 and α2, and Δgi and Δgk are possible BOR variants (rotation matrices) for α1 and α2. Note that if Δgi is crystallographically equivalent to Δgk, α1 and α2 have the same orientation; therefore, the grain boundary is absent, in which case it should be omitted.
It is also important to note that the grain boundaries on which nuclei can hold DBOR are always specific (or special) types of boundaries, as listed in Table 1, or close to them. We may consider different nucleation rates, ζ, for different types of special boundaries including ζ = 0 for the above “boundary-less” case.
The probability for the i-th variant to be chosen, ρi(g), may be proportional to the orientation density of the parent phase around Δgk−1·Δgi·g, since the i-th variant needs a parent grain of the orientation around Δgk−1·Δgi·g on the opposite side of the grain boundary to satisfy DBOR,
ρ i g k f α h e x Δ g k 1 · Δ g i · g .
Introducing the variable ω that determines the intensity of variant selection and the material conservation law, the probability function shown below can be derived:
ρ g = ω N k · ζ ¯ · k = 1 N k ζ k · f α h e x Δ g 1 · g k c · Δ g · g + ρ C g ,
ρ C g = 1 ω N i · N k · ζ ¯ · i = 1 N i k = 1 N k ζ k · f α h e x Δ g 1 · g k c · Δ g · g i h · g .
Here, g i h , g k c , Ni, and Nk are the rotational operators for the hexagonal and cubic crystal symmetries and the numbers of operators (12 and 24 for hexagonal and cubic symmetries), respectively. Note that the Δg· g i h ·g represents the i-th BOR variant for α-hexβ with the only orientation relation for BOR, Δg. Although the number of the symmetry operations in hexagonal crystals is 12, the number of variants in α-hexβ in BOR is 6 because of the symmetry of BOR; this redundancy is two for both α-hexβ and βα-hex. Therefore, the variant selection function ρ(g) has different values for the crystallographically equivalent 12 orientations in the parent α-hex phase and holds the symmetry of samples. In Equations (10) and (11), the nucleation rates ζk for the special boundaries, the type of which is determined by g k c , are included.
The first term of Equation (10) is the term for the selection by the DBOR mechanism, while the second term is for the case where the selection by DBOR does not occur, since when ω→0, the second term only determines the variant selection. The second term in Equation (11) means “no variant selection”. Therefore, roughly speaking, ω is the fraction of the parent phase which obeys DBOR during transformation, and for the rest, 1-ω transforms without variant selection.
Equations (10) and (11) can be expanded by the generalized spherical harmonics with the coefficients:
ρ λ m ν = ω N i · N k · ζ ¯ μ = 1 M λ C α h e x λ μ ν · i = 1 N i k = 1 N k ζ k · T :   λ μ m Δ g 1 · g k c · Δ g T :   λ μ m Δ g 1 · g k c · Δ g · g i h  
and
ρ 0 0 , 1 = 1 .

3.3. Extended Concept of Double BOR (EDBOR)

The above equations, Equations (10)–(13), for DBOR satisfy local as well as global material conservation during transformation. The local material conservation means that the volume of a parent crystal is conserved during the transformation and equal to the total volume of the related child grains by BOR, which occurs when nuclei grow by the migration of coherent interfaces, as shown Figure 1b, like martensite transformation. This is because Equation (11) ensures that the average of ρ(g) for all the 6 variants (12 equivalent parent orientations) is always unity,
1 N i i = 1 N i ρ g i h · g = 1 ,
and the global or whole material volume is also conserved during the transformation. Therefore,
C β 0 1 , 1 = 1   i n   E q u a t i o n s   7   a n d   8
The local volume conservation, which strictly occurs for martensite transformation, is a reasonably good approximation for diffusional transformation, and it has been successfully used in the predictions of various transformation textures in steels as mentioned above [3,35,36,37,38].
However, the growth of nuclei during diffusional or reconstructive transformation may not occur by the migration of coherent interfaces, rather it can occur towards neighbor grains to which growth fronts are incoherent or semi-coherent, as shown in Figure 1c, and the growth may not be confined within one parent grain [36]. This can be caused by higher mobility of the incoherent interphase boundaries [17]. In an oxide dispersed steel (ODS) steel, this type of growth explained the observed strong texture memory effect well [13,36].
To model this type of growth, the second term of Equations (10) and (11) should be modified. Since the second term is for the case where variant selection does not obey DBOR with no variant selection rule, Equation (10) may be rewritten with a “constant δ" as the second term as follows:
ρ g = ω N k · ζ ¯ · k = 1 N k ζ k · f α h e x Δ g 1 · g k c · Δ g · g + δ .
By using the constant δ, the growth is no longer limited within one parent grain. To further extend this idea for the case where a very strong variant selection occurs, non-linear probability proportional to the n-th power of f Δ g 1 · g k c · Δ g · g can be introduced as
ρ g = ω · 1 N k · ζ ¯ · k = 1 N k ζ k · f α Δ g 1 · g k c · Δ g · g n + δ .
For n = 1, its expansion coefficients by harmonics are expressed as
ρ λ m ν = ω N k · ζ ¯ μ = 1 M λ C α h e x λ μ ν k = 1 N k ζ k · T :   λ μ m Δ g 1 · g k c · Δ g ,  
ρ 0 0 , 1 = ω + δ .  
Now, the coefficients βCλμν obtained from Equations (7) or (8) are functions of ω and δ. Since the global volume conservation must also be fulfilled in this case, δ should be a function of ω determined by Equation (15). Since δ is constant, it follows that
βCλμν(ω, δ) = βCλμν(ω, 0) + δ βCλμν(0, 1).
Then, to satisfy Equation (15),
βC01,1(ω, δ) = βC01,1(ω, 0) + δ·βC01,1(0, 1) = 1.
Therefore, since βC01,1(0, 1) = 1, the value of δ is determined as
δ = 1 − βC01,1(ω, 0).
Hence, from Equations (20) and (22), it follows that
βCλμν(ω) = βCλμν(ω, 0) + βCλμν(0, 1) · (1 − βC01,1(ω, 0)).
Therefore, by computing βCλμν in two cases, a given value of ω and δ = 0 and ω = 0 and δ = 1 (no variant selection) using Equations (8) or (7), (18) and (19), the transformation texture that satisfies EDBOR (n = 1) as well as the global volume conservation can be obtained. For EDBOR of n > 1, a theorem for the product of two harmonics [33], shown below, can be used to calculate the expansion coefficients of the ρ(g):
T . λ 1 m ν 1 g T . λ 2 r ν 2 g = λ = λ 2 λ 1 λ 2 + λ 1 ν = 1 N λ λ 1 λ 2 m r | λ s λ 1 λ 2 ν 1 ν 2 | λ ν T . λ s ν g ,
where s = m + r.
For example, when n = 2, using the expansion coefficients of 1 N k · ζ ¯ k ζ k · f Δ g 1 · g k c · Δ g · g ,
Σ f λ m ν = 1 N k · ζ ¯ μ = 1 M λ C a h e x λ μ ν k = 1 N k ζ k · T :   λ μ m Δ g 1 · g k c · Δ g ,  
it follows that
ρ λ s ν = ω · λ 1 = 0   λ 2 = 0   m = λ 1 λ 1 ν 1 = 1 N λ 1 ν 2 = 1 N λ 2 λ 1 λ 2 m r | λ s λ 1 λ 2 ν 1 ν 2 | λ ν · Σ f λ 1 m ν 1 · Σ f λ 2 r ν 2
here, s = m + r, and |λ1λ2| ≤ λ ≤ |λ1 + λ2|.
Then, the rest is the same as Equations (20)–(23). In this study, Equations (12), (13), (18), (19) and (26) were used with the truncation at the 20th order to roughly simulate the allowed deviation of Δ g 1 around 10°. DBOR and EDBOR for the reversed transformation from β to α-hex were formulated in the same fashion.
It should be emphasized that for DBOR and EDBOR, the variant selection is determined by the texture of parent phases, and the stronger the texture of parent phases, the stronger the variant selection occurs for the transformation. For simple DBOR in Section 3.2, an ideal case explained above is attained with ω = 1. However, for EDBOR, this physical meaning of ω would be lost, especially for n = 2 or higher. For DKS in steel, the value of ω has been reported to vary from 0.5 to even greater than unity [3,35,36,37,38]. Therefore, the value of ω is dependent on grain structures, on which the probability by which DBOR variants can exist is dependent, and, of course, the order of n in EDBOR.

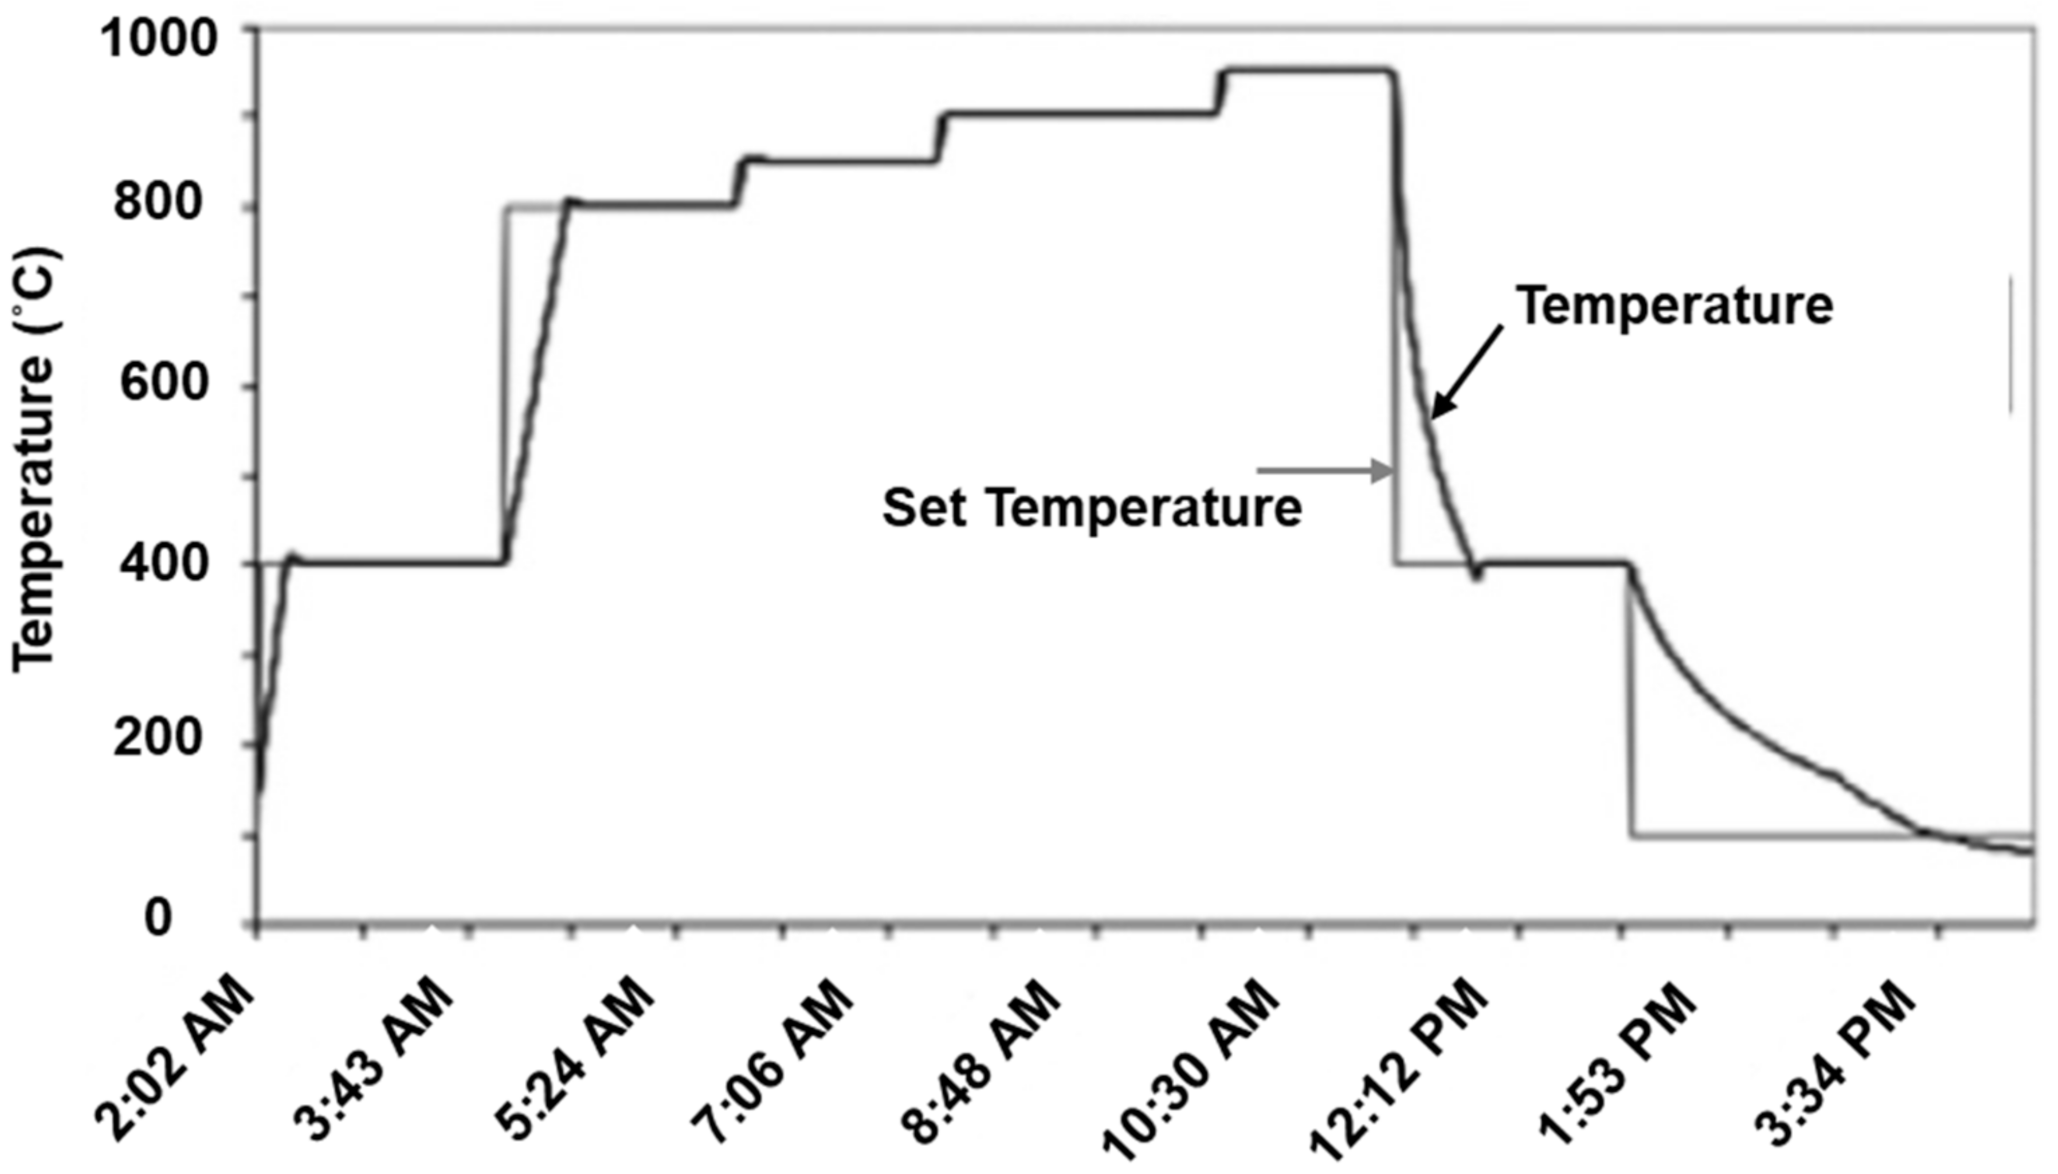
4. Experimental Procedure

Texture change of cold-rolled CP-Ti (ASTM grade 2) was observed in situ during an α-hexβα-hex heating cycle by a time-of-flight pulsed neutron diffractometer HIPPO in LANSCE [4,31,32]. Details are given in [4] and only a summary of the experiment is provided here. A 5 × 5 × 5 mm3 cube sample cut from the 5 mm thick cold-rolled sheet was slowly heated up to β transformation temperature of 950 °C in vacuum step-wise, as shown in Figure 2, and textures were measured at each heat step. In this study, the data taken at 800 °C before phase transformation, at 950 °C for high temperature β, and at 400 °C for final α after the heating cycle, were used. No diffraction of α-hex phase was observed at 950 °C. The grain structure before transformation was relatively fine around 20 μm in grain size. However, grains were coarsened to about 1 mm during the heating.
The neutron diffraction spectra were analyzed by the Rietveld method [41] implemented in the software package MAUD [42]. During the Rietveld analysis, textures were analyzed based on a discrete E-WIMV method [43] implemented in MAUD. These obtained data have been already published, and thus the readers may refer to the literature for further details [4]. The recalculated pole figures from the E-WIMV representation of ODFs were used to obtain harmonic-expanded ODFs [34] to utilize the above method for transformation texture prediction. A method described in [34] and the Standard ODF software [44] were used for the harmonic expansion for α-hex and β phases using 10 and 4 complete pole figures, respectively. During the harmonic expansion, the orthorhombic sample symmetry was applied. The expansion was truncated at the 28th and 22nd orders for α-hex and β, respectively, which was determined considering sharpness of the observed textures. The crystal coordinates and Euler angles used in this study were those defined by Bunge et. al., i.e., x-axis// 10 1 ¯ 0 and y-axis// 1 ¯ 2 1 ¯ 0 for α-hex [34].

5. Experimental Results and Prediction by DBOR

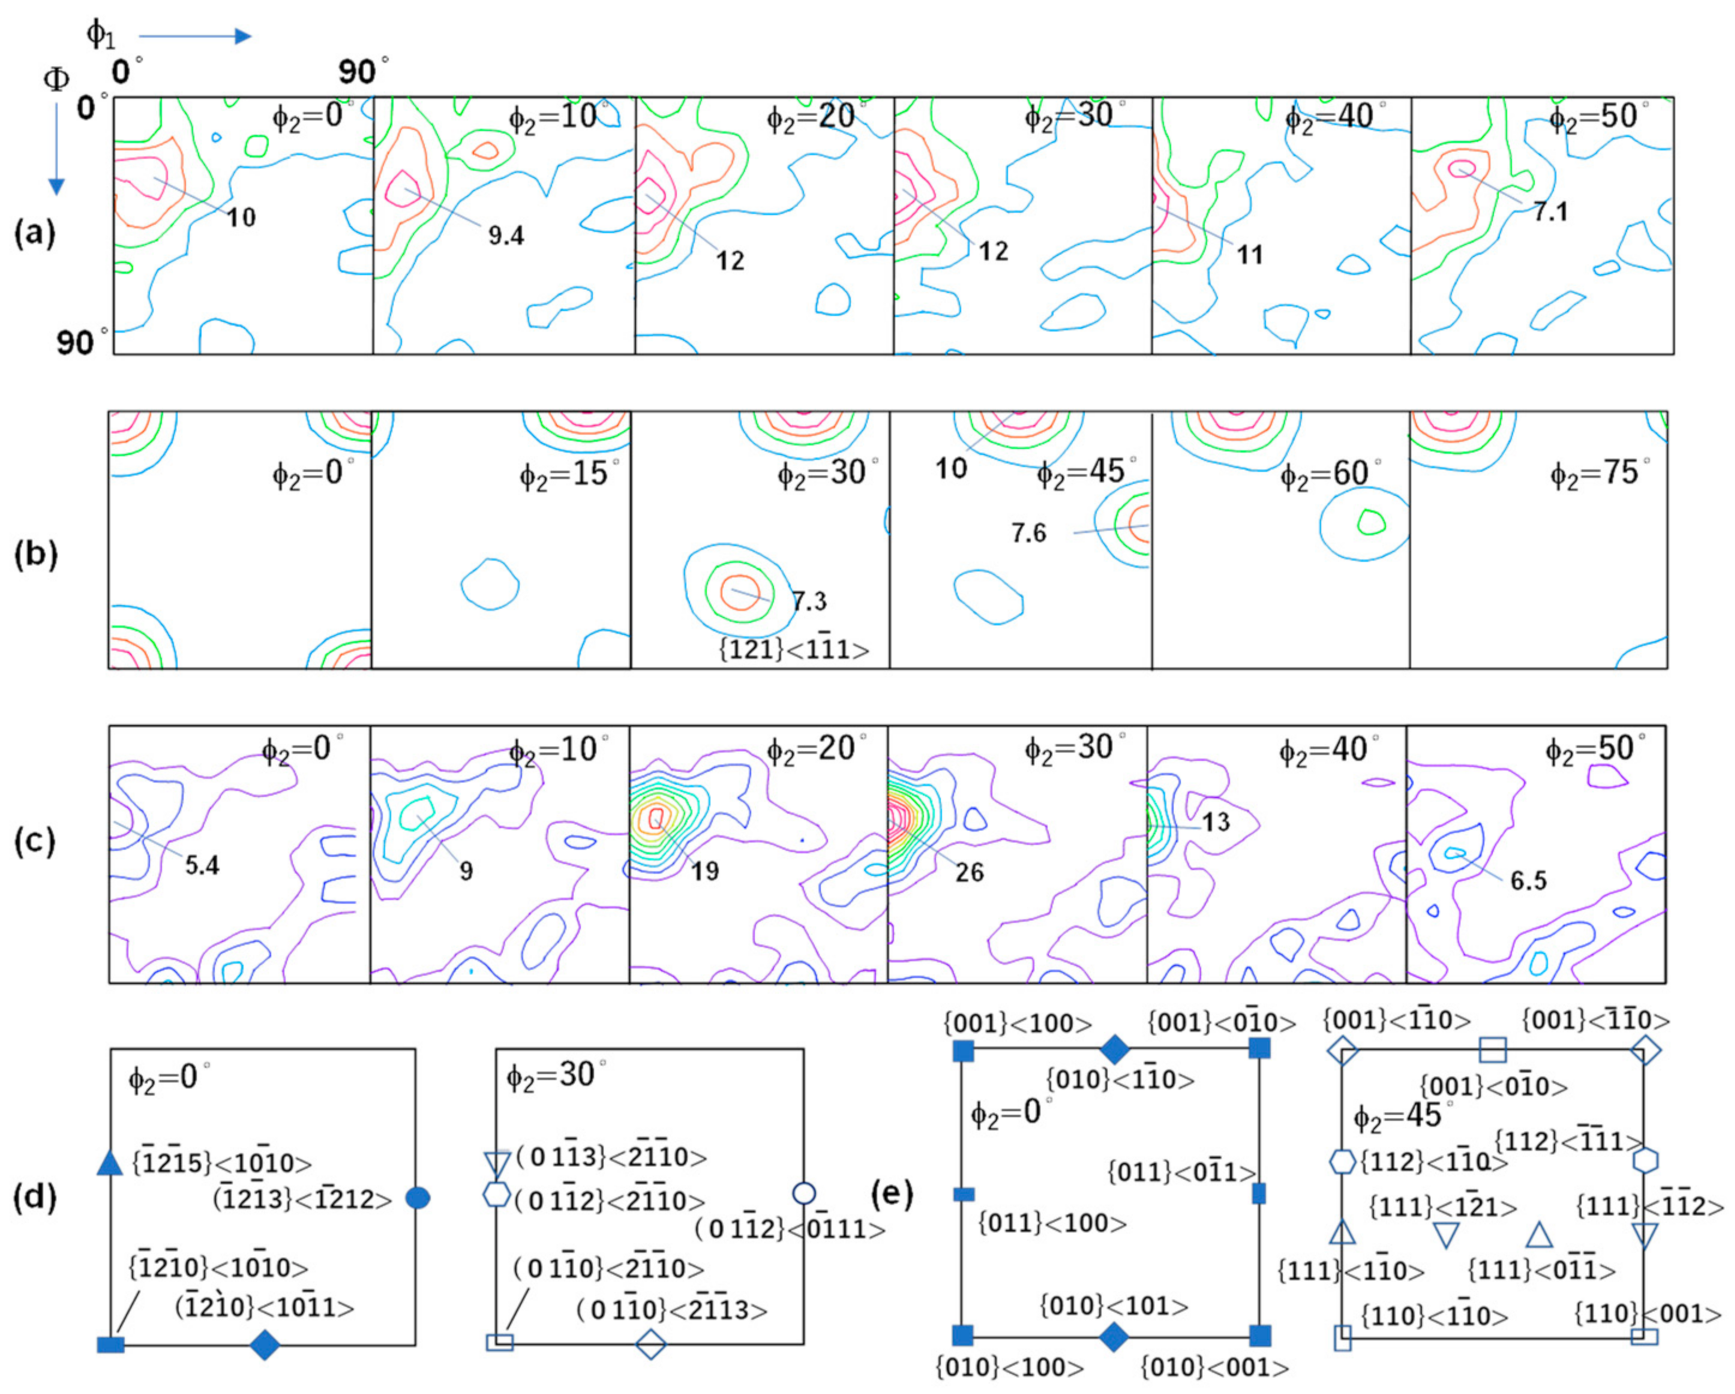
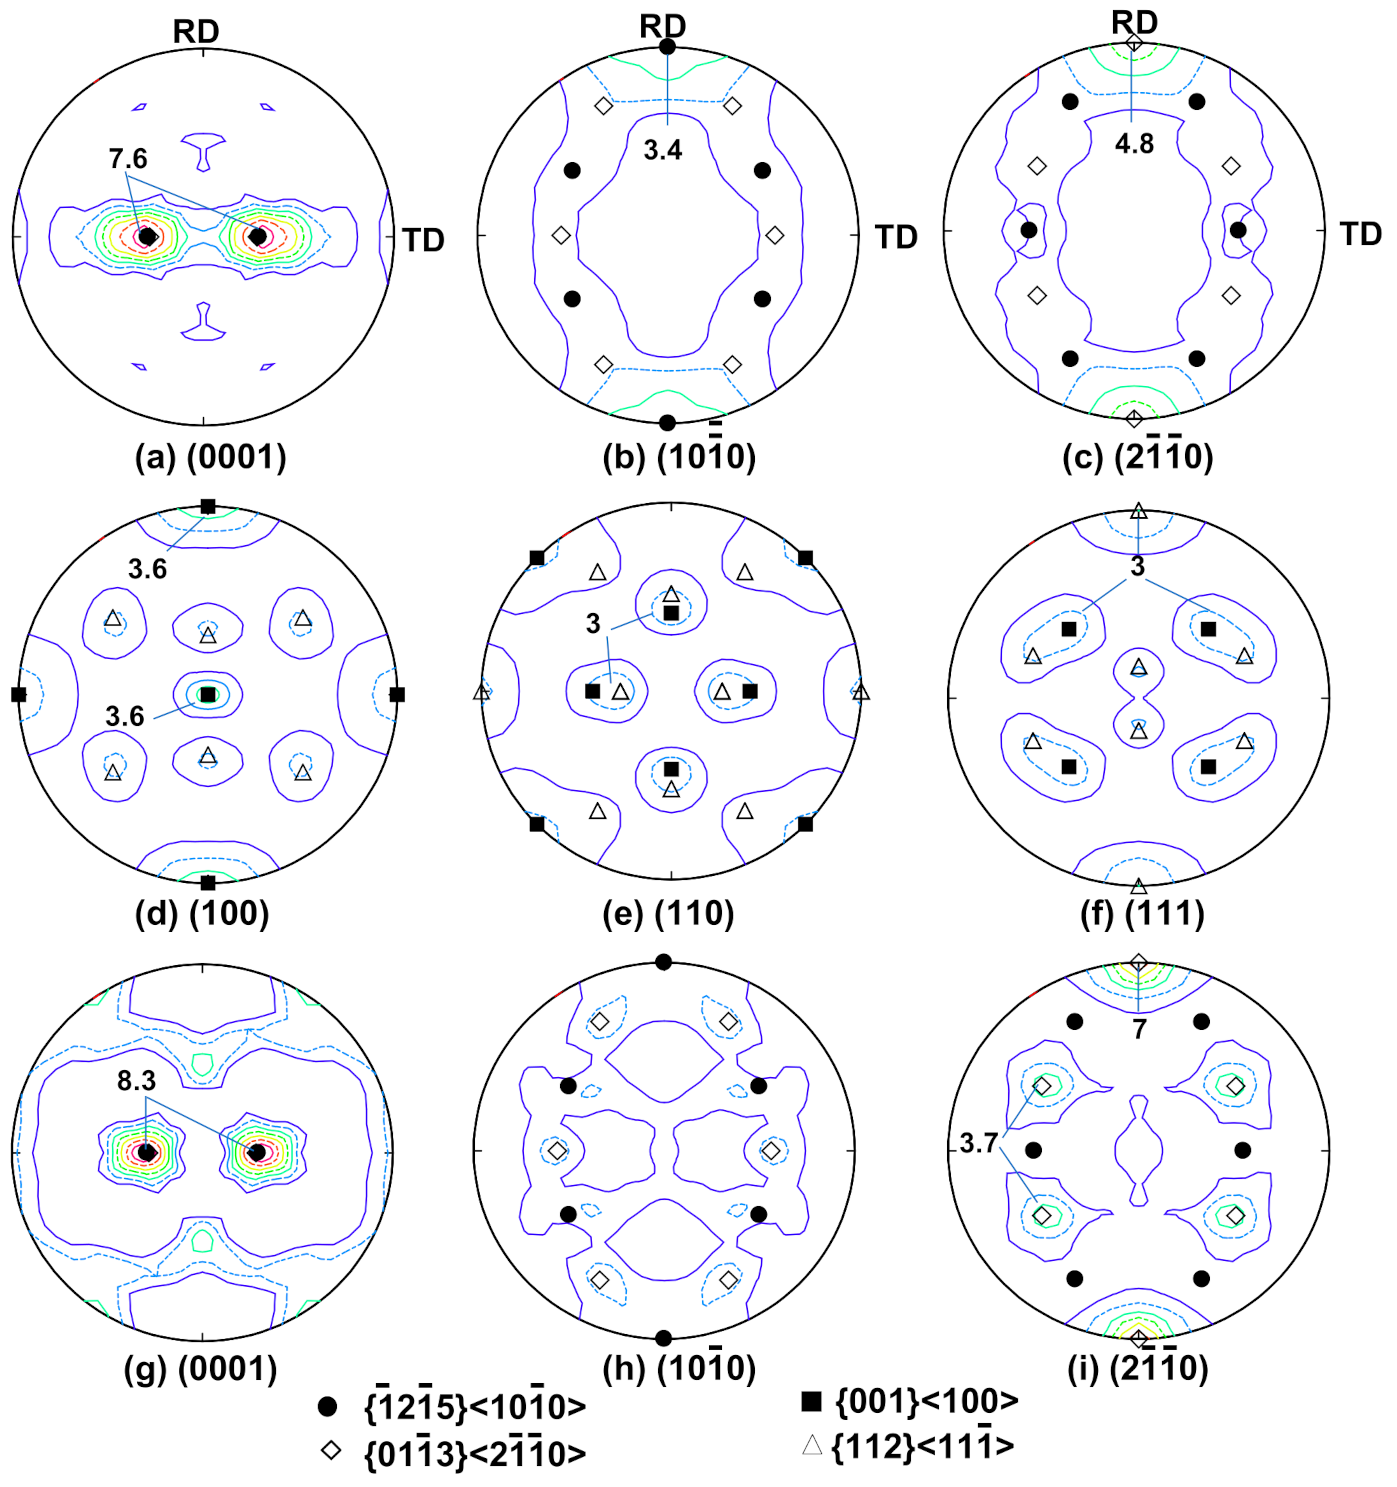
5.1. Experimental Results

Figure 3 and Figure 4 show the ODF sections and recalculated pole figures of α-hex and β phases observed at 800, 950, and 400 °C. It is seen that the initial texture before transformation at 800 °C is composed of TD-split c-axis components, of which the inclination angle of the c-axis from ND is about 35°. As seen in Figure 3a, these TD-split components form a fiber lying from 1 ¯ 2 1 ¯ 5 10 1 ¯ 0 to 01 1 ¯ 3 2 1 ¯ 1 ¯ 0 as often observed for recrystallized Ti after cold-rolling [22]. The intensity of the 1 ¯ 2 1 ¯ 5 10 1 ¯ 0 component, which is in general dominant in cold-rolled states [4], was slightly weaker than the 01 1 ¯ 3 2 1 ¯ 1 ¯ 0 component. The recrystallized α-hex then transformed to β, the texture of which consists of only two components, the cubic {001}<100> and {112}< 11 1 ¯ > orientations. The cubic component was the strongest in ODF density, while the {112}< 11 1 ¯ > component had a larger volume because of multiplicity.
As seen in Figure 3c and Figure 4g–i, the final α-hex texture had sharper and stronger TD-split c-axis components than the initial α texture, for which the inclination angle was also about 35°. Thus, the texture memory effect was clearly observed. However, the TD split components in the final α-hex were more dominated by 01 1 ¯ 3 2 1 ¯ 1 ¯ 0 than 1 ¯ 2 1 ¯ 5 10 1 ¯ 0 unlike the initial α-hex. In addition, there were “RD”-split c-axis components around 1 ¯ 2 1 ¯ 3 1 2 ¯ 12 , for which the inclination angle from ND was about 45°. Another sub-component was also seen around 1 ¯ 2 1 ¯ 0 10 1 ¯ 1 , in which the c-axis lay in the sheet plane along the direction of 45° to RD.

5.2. Prediction Results by DBOR

5.2.1. α-hexβ Transformation

β textures were computed using the observed α texture before transformation shown in Figure 3a and Figure 4a–c and the mathematical method explained above, and they were compared to the observed β texture. As shown in Figure 5, root mean square (RMS) minimization was performed between the observed and predicted ODFs changing the value of ω as a parameter. For simple DBOR by Equations (10) and (11), the RMS deviation (rm) showed a minimum around ω = 0.7. However, the reduction in the deviation (difference in rm between arrows a and b in Figure 5) was not significant. In contrast, the deviation was significantly reduced by EDBOR (see arrows c and d in Figure 5).
Following the determination of ω, via EDBOR n = 1, the influence of nucleation rates ζ for special boundaries was investigated. As listed in Table 1, there are five kinds of special grain boundaries of DBOR in α-hexβ transformation. For each type of grain boundary, the change in the rm at the optimum ω was calculated by changing ζ independently from one to two. This change δrm/δζ, which is the gradient of rm when increasing each weight factor, is listed in Table 1. The δrm/δζ for 10.5° small-angle boundaries was small and negative, those for 60, 60.8 and 63.3° boundaries were close to each other considering their number ratios (1:2:1) and positive, and those for 90° boundaries were largely negative. Therefore, when decreasing ζ for the small-angle boundaries, rm slightly increased, and when increasing ζ for the 90° boundaries, rm significantly reduced, as shown in Figure 5. Therefore, the determined optimum ratios of ζ for 10.5, 60, 60.8, 63.3, 90° boundaries are 1:1:1:1:3; note that only rough optimization of ζ was performed since a full optimization would require many more observations.
In Figure 6a–d, the change in φ2 = 45° sections of ODF by the above optimization is shown. Although the prediction without variant selection resulted in a significantly weaker texture than the observed one, DBOR predicted the proper intensity of the texture. With equal values of ζ for all the types of special boundary, the {001}<100> cubic component was predicted to be somewhat weaker than the observation (see Figure 6b). However, by increasing the value of ζ for the 90° special boundary, the intensity of the cubic component increased, and the optimal prediction was obtained by EDBOR n = 2, as shown in Figure 6d–h (see also arrow d in Figure 5). The predicted ODF and pole figures agreed remarkably well with the observed ones as shown in Figure 3b and Figure 4d–f.
Variant selection probabilities ρ(g) for typical parent orientations for the optimal predictions by EDBOR n = 1 and 2 are shown in Figure 7. Note that the value of ρ(g) is unity without variant selection, and the averaged ρ for variants, ρ ¯ , is also unity when the local volume is conserved. The child orientations of variants are listed in Table 2. It is seen in Figure 7 that the ρ for the 01 1 ¯ 3 2 1 ¯ 1 ¯ 0 and 01 1 ¯ 2 2 1 ¯ 1 ¯ 0   parent orientations to transform to the child orientations gβ1s, which were around {112}< 11 1 ¯ > and {001}<100>, respectively (see Table 2), was relatively large. Furthermore, the ρ ¯ for these parent orientations was 1.5 to 1.7, meaning these orientations grow beyond the limit of the local volume conservation. However, the values of ρ as well as ρ ¯ of the 1 ¯ 2 1 ¯ 5 10 1 ¯ 0 parent orientation were all smaller than unity. Therefore, the variants from the 01 1 ¯ 3 2 1 ¯ 1 ¯ 0 and 01 1 ¯ 2 2 1 ¯ 1 ¯ 0 parent orientations, known as the growth components, preferentially nucleated and grew over multiple parent grains, whereas the volume inherited from the 1 ¯ 2 1 ¯ 5 10 1 ¯ 0 orientation shrank. The predicted total volume of the child orientations of 01 1 ¯ 3 2 1 ¯ 1 ¯ 0 was 1.5 to 1.7 times of the volume of the parent orientation, whereas that of 1 ¯ 2 1 ¯ 5 10 1 ¯ 0 was only 0.77 times of the volume of the parent orientation.

5.2.2. βα-hex Transformation

Textures of α-hex were computed using the observed β texture at 950 °C and the mathematical method explained above, and they were compared to the observed α-hex texture at 400 °C after the heating cycle. As shown in Figure 8, RMS minimization was performed as explained above, and the δrm/δζ for four kinds of special grain boundaries in α-hex transformation listed in Table 1 was also calculated using EDBOR n = 1. Agreement between predicted and observed α-hex textures was greatly improved by DBOR as well as EDBOR by choosing proper values of ω. The values of δrm/δζ were positive for 10.5° small-angle boundaries, negative for the other types of boundaries, and smallest for 49° boundaries considering the ratio of grain boundary numbers, 1:1:1:2 for 10.5°, 49.5°, ∑3, and 60°<110>. Therefore, the agreement was improved by decreasing ζ for the small-angle boundaries and increasing ζ for the 49.5° boundaries. Hence, the optimum prediction was obtained with the ratio of ζ, roughly 0:3:1:1 for 10.5°, 49.5°, ∑3, and 60°<110> boundaries, and, unlike the α-hexβ transformation, EDBOR did not greatly improve the prediction in comparison to DBOR (see arrows b and c in Figure 8). It is noteworthy that with all the ζs as unity (as well as even ω = 1), DBOR gave a good agreement to the observed α-hex texture, as shown by open squares in Figure 8.
Figure 9a–d illustrate how DBOR and EDBOR improve the prediction. Without variant selection, the predicted α-hex texture was significantly weaker than the observed texture, indicating strong variant selection operating in βα-hex transformation in CP-Ti. With the variant selection by DBOR and EDBOR, the intensity of the texture greatly increased and became closer to the observed one. It was also seen that the difference between the predictions by DBOR and EDBOR was negligible, as mentioned above (see Figure 9b,c). As seen in Figure 9c–h, the optimum prediction reproduced all the important features of the observed texture of α-hex after the heating cycle. The same was true for the prediction based on the “predicted β texture” in Figure 6d–h, as seen in Figure 9d.
Variant selection probabilities ρ(g) for the optimal predictions by DBOR and EDBOR n = 1 are shown in Figure 10; 12 variants in βα-hex reduced to 3 and 7 child orientations for {001}<100> and {112}< 11 1 ¯ > because of their symmetries, respectively. Since the multiplicity of the child orientations was not the same for all the child orientations of {112}< 11 1 ¯ >, the values of ρ for all of the 12 variants are shown for {112}< 11 1 ¯ > in Figure 10, whereas the multiplicity was the same, 4, for all the child orientations of {001}<100>. The probabilities of selecting variants gα-hex1 of {001}<100> and gα-hex1 and gα-hex2 of {112}< 11 1 ¯ >, the orientations of which lie around 01 1 ¯ 3 2 1 ¯ 1 ¯ 0 and 01 1 ¯ 2 2 1 ¯ 1 ¯ 0 , were relatively large, particularly for gα-hex1 for both parent orientations. EDBOR n = 1 predicted larger values of ρ ¯ than unity for these parent orientations, suggesting selective growth beyond grain boundaries surrounding the parent grains; the total volume of child grains was 1.2 to 1.6 times the volume of the parent grains (see ρ ¯ in Figure 10b). However, since the values of ρ for the major components in α-hex (e.g., gα-hex1 and 2) were close to each other for DBOR and EDBOR n = 1, both predictions resulted in very similar α-hex textures.

6. Discussion

The DBOR scheme excellently reproduced both of α-hexβ and βα-hex transformation textures in CP-Ti observed in situ by pulsed neutron diffraction. Although the parameters of DBOR, ω and ζ, were determined by RMS fitting, relatively small numbers of the parameters were required to be adjusted for the reproduction of all the areas of ODFs in the observed textures. For βα-hex, simple DBOR even with all the parameters being unity could reproduce the observed texture well, which clearly suggests the applicability of the DBOR scheme to texture memory in hexagonal metals. Here, we discuss how nucleation that satisfies DBOR occurs in phase transformation in hexagonal metals and how these nuclei grow.

6.1. Special Boundary for DBOR

DBOR nucleation occurs on the special boundaries listed in Table 1 as aforementioned. For βα-hex transformation, it has been previously observed that grain boundary α-hex nucleates satisfying DBOR, and Widmanstätten α-hex of the same orientation grows on both sides of the special boundaries [45,46], which is closely related to the slip transmission across grain boundaries. It was also reported from EBSD observation that the allowed misorientation from DBOR was less than about 15°, and less misoriented variants tended to be chosen first [46], which supports the DBOR concept of variant selection in this study and our choice of a deviation around 10° from the exact DBOR.
For α-hexβ transformation, there are five types of special boundaries at which β grains on either side rotate to one another by 10.5 to 90°about the c-axis or the axes near 2 1 ¯ 1 ¯ 0 . For the 10.5° and 60° boundaries, the rotation axes are exactly the c-axis and 2 1 ¯ 1 ¯ 0 , respectively. For the other 60.8, 63.3, and 90° boundaries, the rotation axes are inclined from 2 1 ¯ 1 ¯ 0 by about 5 to 17°. Therefore, they are mostly the rotations about the 2 1 ¯ 1 ¯ 0 axis. To the best of our knowledge, there seems to be no previous report on the special boundaries in α-hexβ. For βα-hex transformation, as reported by Shi et al. [46], there are four types of special boundaries at which β grains on either side rotate to one another by 10.5 to 60° about either <110> or <111>. One of the four types is of the rotation about <111> by 60°, i.e., the twin-related ∑3 boundary. On all the special boundaries, there is one variant that exactly satisfies DBOR. In addition, when allowing about 10° deviation from the exact DBOR, there is another variant nearly satisfying DBOR, since BOR has three and six pairs of variants that rotate to each other by 10.5° for both α-hexβ and βα-hex, respectively.

6.2. Special Boundary in Texture-Free Structures

Then, the first question to ask is how frequently the potential nucleation sites for DBOR exist in materials and whether this frequency is sufficient to influence the transformation texture. The probability with which the nuclei fulfil DBOR on plane boundaries can be calculated by evaluating how frequently parent grains of orientations around Δ g k 1 · Δ g i · g exist in grain structures as introduced in Equation (9) (see also Figure 1a). Therefore, given the orientations of parent grains g1 and g2 on either side of a grain boundary, the deviation from DBOR ΔgBOR in α-hexβ can be evaluated by the rotation
Δ g B O R = Δ g k 1 · Δ g i · g 1 · g 2 1 = Δ g 1 · g k c · Δ g · g i h · g 1 · g 2 1 ,
which is basically the same expression as that reported in [46].
In grain structures without textures, the probability for a plane boundary to have at least one DBOR variant is about 13 and 19% for α-hexβ and βα-hex transformations, respectively assuming Δ g B O R <10°; we randomly generated 2 × 10⁴ orientation pairs of the parent grains, g1 and g2, and calculated Δ g B O R . If we allow a few degrees more for the deviation, the probabilities increase somewhat. However, they are still small compared to the probability for DKS in steel, which is about 60% calculated in a similar way.
On triple junctions, the probability increases twice for the growth by migration of coherent interfaces such as martensite as shown in Figure 1b, and it increases three times (3C2) when the nuclei can grow by coherent as well as incoherent (or semi-coherent) interphase boundaries as shown Figure 1c. However, even for triple junctions, DBOR nucleation can occur only on about 50% of them, which contrasts with the fact that DKS can occur almost always on triple junctions in steel as observed experimentally [16].

6.3. Influence on Special Boundary by Strong Texture

For strong textures in parent structures, the probability may change greatly. For example, in the α-hexβ transformation shown in Figure 3, the TD-split c-axis components inclined from ND by 30 or 45° with 2 1 ¯ 1 ¯ 0 in RD (nearly 01 1 ¯ 3 2 1 ¯ 1 ¯ 0 and 01 1 ¯ 2 2 1 ¯ 1 ¯ 0 ) are composed of two symmetric components inclined in the opposite directions, between which there are the 60 or 90° special boundaries (Type II or V), respectively (see Table 2). The DBOR variants on these special boundaries form the {112}< 11 1 ¯ > and {001}<100> components in β. Furthermore, in the β structure, the {112}< 11 1 ¯ > components are also composed of two symmetry components, between which there are the 60° special boundaries (Type III) in βα-hex; the symmetry components are described in more detail in Section 6.7. Moreover, between the {112}< 11 1 ¯ > and {001}<100> components, there are boundaries close to type IV special boundaries (deviated by about 16°). The DBOR variants on these special boundaries form the 01 1 ¯ 3 2 1 ¯ 1 ¯ 0 and 01 1 ¯ 2 2 1 ¯ 1 ¯ 0 components as well as the other major components observed in the final α-hex structure as listed in Table 2 (bold letters with * or **). Therefore, the presence of strong textures can largely increase the density of the special boundaries, and this is the case for the rolled and annealed CP-Ti sheets observed in this study.

6.4. Influence of Special Boundary in α-hex→β on Heating

This influence on special boundaries by textures can be evaluated by defining a probability ratio of these special grain boundaries relative to the texture-free material, TF (texture factor), as
T F = 1 N k · k = 1 N k f α h e x Δ g 1 · g k c · Δ g · g ,
for α-hexβ transformation as depicted in Figure 1a; for βα-hex, TF is defined in a similar way by changing fα-hex to fβ and g k c to g k h . TF is the ratio of the probability of existence of the special boundaries surrounding the parent gains of the orientation g to that for texture-free materials, and, of course it is included in the formulation of ρ(g) in DBOR and EDBOR (Equations (10) and (16)). Therefore, ρ(g) contains the information for this influence by textures.
For instance, the ρ ¯ for α-hexβ transformation in Figure 7a is 1.7 and 0.77 for 01 1 ¯ 3 2 1 ¯ 1 ¯ 0 and 1 ¯ 2 1 ¯ 5 10 1 ¯ 0 , respectively. From these values and the values of ω = 0.6 and δ = 0.39 for the prediction, TFs are obtained from Equation (16) to be 2.2 and 0.63 for the above parent orientations, respectively, neglecting the influence of ζ. Therefore, the probability of having DBOR variants on the grain boundaries around 01 1 ¯ 3 2 1 ¯ 1 ¯ 0 and 1 ¯ 2 1 ¯ 5 10 1 ¯ 0 grains are about 29% (13% × 2.2) and 8.2% (13% × 0.63) on plain boundaries, respectively, two to three times more on triple junctions and even more for grain corners. Therefore, most of the recrystallized components around 01 1 ¯ 3 2 1 ¯ 1 ¯ 0 are surrounded by grain boundaries with potential nucleation sites for DBOR, whereas the 1 ¯ 2 1 ¯ 5 10 1 ¯ 0 components are scarcely surrounded by such boundaries. This probability was evaluated and reflected as volume change (the violation of local volume conservation) in the EDBOR prediction so that a better prediction could be attained as explained above.
In [4], it has been suggested that only the growth components around 01 1 ¯ 3 2 1 ¯ 1 ¯ 0 should transform with an unknown variant selection in α-hexβ. This is exactly the case that the above analysis by EDBOR suggests. As shown in Figure 7, all the variants of the 01 1 ¯ 3 2 1 ¯ 1 ¯ 0 parent grains, which transform to {001}<100> and {112}< 11 1 ¯ >, are preferentially chosen to nucleate and grow to ρ ¯ = 1.5–1.7 times of the volume of the 01 1 ¯ 3 2 1 ¯ 1 ¯ 0 parent grains, while the variants from the 1 ¯ 2 1 ¯ 5 10 1 ¯ 0 grains are less frequently chosen for their total volume to shrink to ρ ¯ = 0.77 times of the volume of the parent grains. Therefore, it is very likely that upon heating to β temperature, the DBOR variants are preferentially selected because of lower interphase boundary energy nucleating earlier on the special boundaries around the 01 1 ¯ 3 2 1 ¯ 1 ¯ 0 as well as 01 1 ¯ 2 2 1 ¯ 1 ¯ 0   grains and preferentially growing into not only the parent grains but also other grains such as the 1 ¯ 2 1 ¯ 5 10 1 ¯ 0 grains. This growth process is consistent with the metallographical analysis of CP-Ti in that, whereas the grain size of α-hex before transformation is only about 20 μm, that of β is very large at around 1 mm [4].

6.5. Influence of Special Boundary in β→α-hex on Cooling

For βα-hex transformation, the ρ ¯ for the prediction by EDBOR n = 1 in Figure 10b is 1.2 and 1.6 for 100 001 and 112 < 11 1 ¯ >, respectively. From these values and the values of ω = 0.7 and δ = 0.17 for the prediction, TFs are obtained as 1.5 and 2.0 for the above orientations, respectively, neglecting the influence of ζ. Therefore, the probability of having DBOR variants on the grain boundaries in the observed β is about 40 (~19 × 2) and close to 100% on plain boundaries and triple junctions, respectively, large enough values to apply the DBOR mechanism to the texture prediction.
Since both 001 100 and 112 < 11 1 ¯ > parent grains are surrounded by many boundaries with potential nucleation sites for DBOR as explained above, and the parent grain size is as large as 1 mm, an extensive growth of the child phase into multiple parent grains (by migration of incoherent interfaces) would not occur as in the α-hexβ transformation. Therefore, EDBOR does not predict more accurately than the simple DBOR as seen in Figure 8 and Figure 9, which is in good agreement with the observation that migrating interfaces of βα-hex transformation are coherent ones like martensite transformation [29,45]. Since the value of ω for the optimum DBOR prediction is from 0.7 to 0.8 and close to unity, the nucleation and growth should be dominated by DBOR variants as expected.

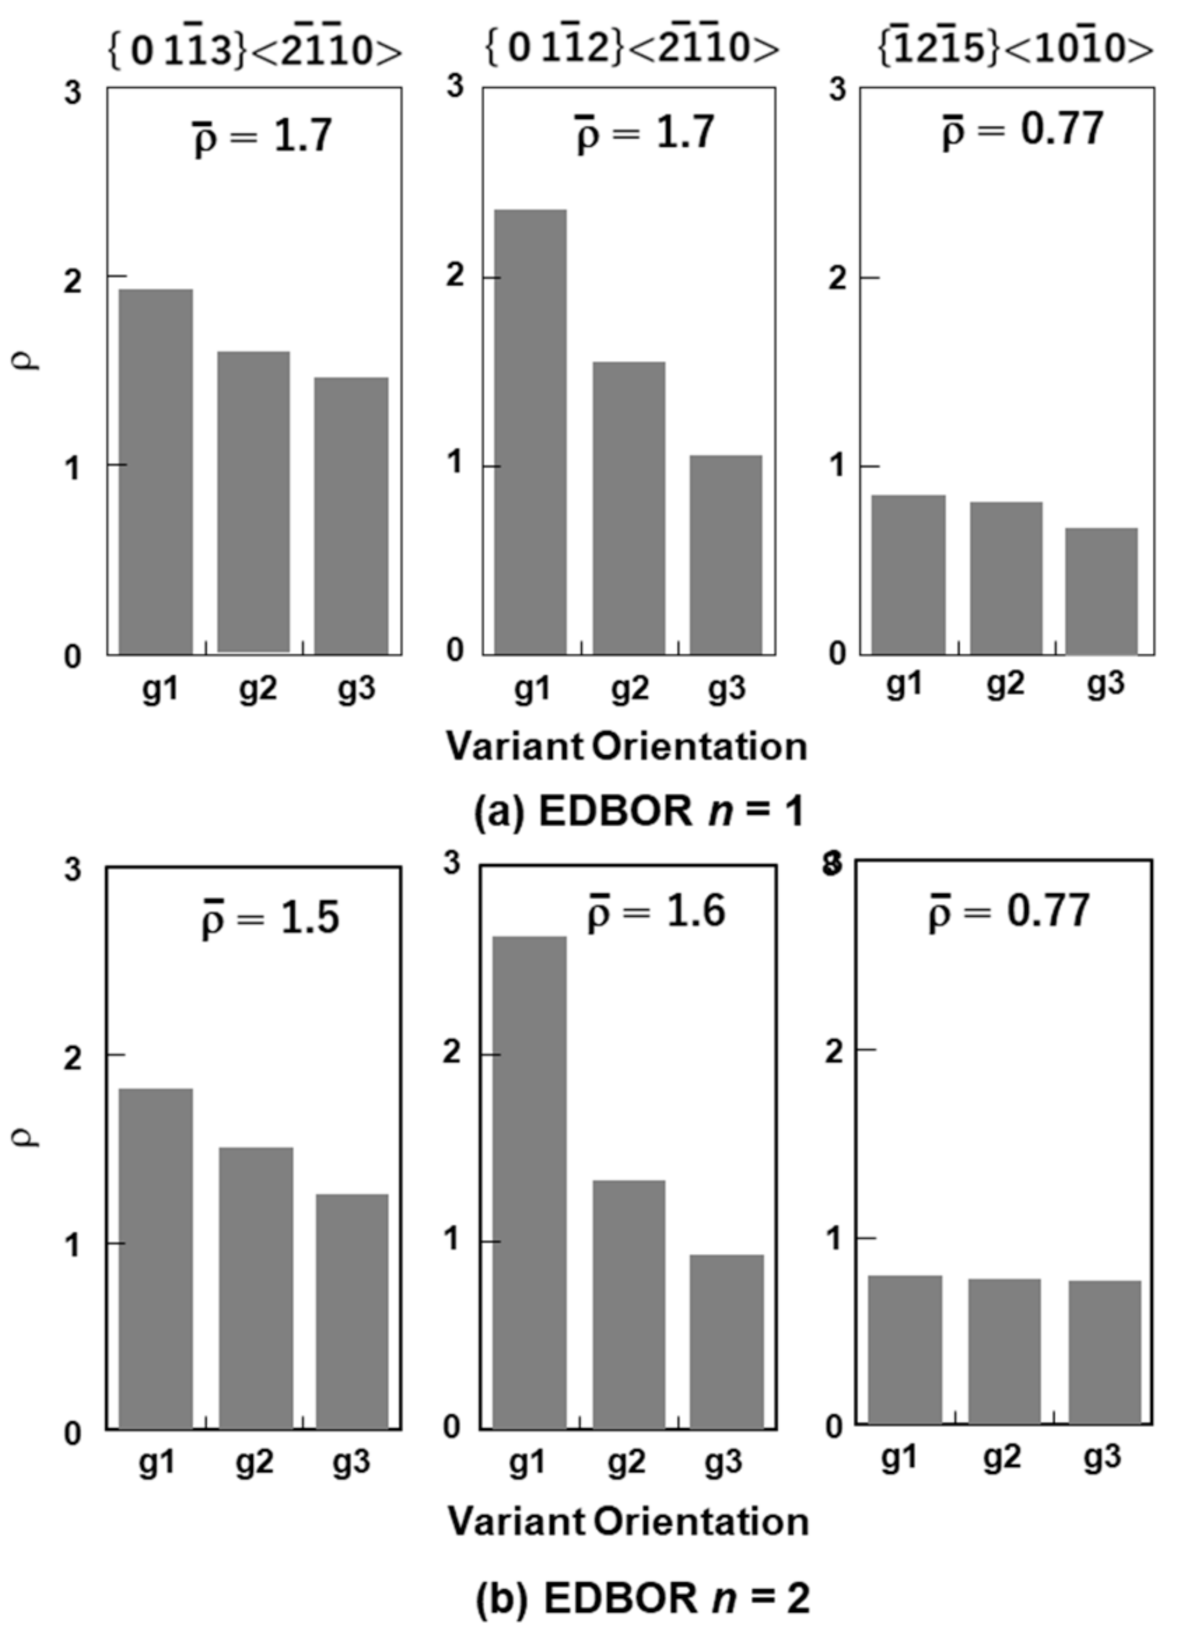
6.6. Coexistence of Differently Oriented Laths in β→α-hex

It is worth noting that when one variant exactly satisfies DBOR on a grain boundary, there is one more variant that nearly satisfies DBOR with the deviation of 10.5°, since 6 and 12 variants in BOR of βα-hex and βα-hex transformations are 3 and 6 pairs of closely orientated variants of 10.5° rotation about <110> and the c-axis, respectively. Therefore, the 10.5° rotated variant can coexist with the exact DBOR variant as reported in [29], which have different lath orientations. An example is gα1 01 1 ¯ 3 2 1 ¯ 1 ¯ 0 1 = 0°, Φ = 30°, and φ2 = 30°) and gα2 (φ1 = 0°, Φ = 30°, and φ2 = 19.5°) nucleating on the type III boundary between the sample–symmetry pair of {112}< 11 1 ¯ > (see Figure 11), which are rotated by 10.5° about the c-axis to each other (see Table 2). Moreover, more disoriented variants can also coexist. On the same type III boundary, the gα1 01 1 ¯ 3 2 1 ¯ 1 ¯ 0 and gα3 01 1 ¯ 0 < 2 1 ¯ 1 ¯ 0 >, which are rotated by 60° about 2 1 ¯ 1 ¯ 0 to each other, satisfy DBOR and can nucleate at the same place. Therefore, these DBOR variants can nucleate and grow either on the opposite sides of the grain boundary or on the same side to coexist as differently oriented laths as previously reported [19,45].

6.7. Common {110} Plane Variants in β→α-hex

Another point to be mentioned is nearly common parallel {110} planes of adjacent β grains, which have been repeatedly reported as the planes to which the basal plane of α-hex tend to be parallel [19,23,29,30,45,46]. In the observed texture of β, the sample–symmetry pair of {112}< 11 1 ¯ > has three common {110} planes, of which plane normals (<110>) are in the directions inclined by 30 and 90° from ND to TD, shown as gray triangles in Figure 11a. These symmetry pair share the <111> direction in RD as shown in Figure 11b. Then, the DBOR variants gα-hex1 and gα-hex3 fulfil the common {110} plane rule on these {110} planes. In the directions shown by arrow a in Figure 11, the {001}<100> and {112}< 11 1 ¯ > components nearly also share {110} planes. Then, there are near-DBOR variants, gα-hex1, of the {001}<100> component and gα-hex1 and gα-hex2 of the {112}< 11 1 ¯ > components (see Table 2), which satisfy the common {110} plane rule. However, although there are another pair of nearly parallel {110} planes in the directions rotated by about 50° from ND to RD (arrow b in Figure 11) for {001}<100> and {112}< 11 1 ¯ > components, which deviate by about 10° from each other, no DBOR variant exists sharing these nearly common {110} planes. This is because the <111> directions perpendicular to the common {110} of the two components, which should be parallel to 2 1 ¯ 1 ¯ 0 in BOR, deviate by about 21 or 90° (not multiples of 60°) from each other as shown in Figure 11b. Hence, the common {110} plane rule does not apply to this case, and this should be the reason why the intensities of the <0001>α poles in these directions (about 50° from ND to RD) are not strong in the final α-hex textures as shown in Figure 4g and Figure 9f, whereas the {110} poles in the directions are relatively strong in the observed β texture. Therefore, the common {110} plane rule is not sufficient to determine the variant selection, since the common {110} plane rule is a part of the DBOR rules that should determine the variants.

6.8. Influence of ζ, Nucleation Rates, and Macro Zones

Of interest are nucleation rates on the special boundaries. The frequency of nucleation is in general different in different types of nucleation site because of the different densities and chemical energy of the site (e.g., grain boundary energy), shape of embryos, and so on. The classical theory of nucleation describes the total nucleation rate as the sum of nucleation rates at different potential nucleation sites as given by [47,48]
N ˙ = j Z j · k · T h · e x p Δ G j * + Q j k · T
where j denotes the type of nucleation site, and Zj, k, and h are the number density of the potential nucleation site, Boltzmann constant, and Plank’s constant, respectively. Δgj* is the change in Gibbs free energy dependent on internal energy change by the phase transformation, grain boundary energy that is gained by removing it, interphase interfacial energy, and shape of embryos. Qj is the activation energy of jumping atoms across interphase boundaries. The ρ(g) approximates the nucleation rates in Equation (29) as a function of variant orientation. The decrease in the interfacial energy by having coherent or semi-coherent interfaces by DBOR decreases Δgj* and increases the nucleation rate, as approximated by Equations (10), (16) and (17).
The ρ(g) mainly calculates the influence of parent textures on Zj in Equation (29), while the weight factor of ζ accounts for other influence than the parent texture such as those due to uneven spatial distribution of texture components such as macro-zones [19] and grain boundary energy in Δgj*. For the macro-zone in α-hex, it was observed (by 3D-EBSD) in CP-Ti, which had a similar texture to the observed texture in this study, that the densities of small-angle grain boundary and the boundary around 90° rotation about 2 1 ¯ 1 ¯ 0 (type V) were substantially larger than those of the random distribution (by about two and seven times, respectively) [18]. This observation is roughly consistent with the above discussion. However, the number density of boundary around 60° about 2 1 ¯ 1 ¯ 0 (type II and close to types III and IV) was surprisingly lower than the random distribution (from 0.6 to 0.9 times), which should be much larger than unity based on the above analysis.
The number density of boundaries, for which the rotation between crystals on both sides is ΔR, can be evaluated from textures as a ratio of that in the random boundaries,
G B D · R = 1 N i · i = 1 N i f Δ R · Δ g i h · g · f g d g .  
Since f Δ R · Δ g i h · g   f g for small-angle boundaries (ΔR→0), it is true that
G B D s m a l l   a n g l e = f g 2 d g .
The value of Equation (31) for the observed α-hex texture in Figure 3a and Figure 4a–c is about 3.5, which is only a half of the reported number density of small-angle boundaries, although the texture observed in this study was a little stronger than that of the material used in [18]. This indicates the presence of the macro-zone in which similarly oriented grains cluster together; texture analysis assumes random spatial distribution of texture components. Another point is that the reported number density of the boundary around 60° about 2 1 ¯ 1 ¯ 0 , which should be larger than the random density (see Table 2), was smaller than the random density as explained above. Thus, considering the high density of small-angle boundaries together, it is very likely that the grains with the major orientation 01 1 ¯ 3 2 1 ¯ 1 ¯ 0 particularly congregate into a macro-zone so that the density of special boundaries of type II and near-types III and IV (between the sample–symmetry pair of 01 1 ¯ 3 2 1 ¯ 1 ¯ 0 ) decreases, whereas that of small-angle boundaries increases as reported in [18]. Therefore, the values of ζ in the optimum prediction are large only for the type V boundaries (ζ = 3) (see Table 2), which is in good agreement with the reported ratio of number densities between near-type II and type V boundaries (about 2.7) [18]. The value of ζ for the small-angle boundaries can be large due to its higher number density in contrast to that expected from the texture. However, its small grain boundary energy [49,50] can cancel out the effect.
For βα-hex transformation, since the energy of the small-angle boundary in bcc metal is also relatively small as compared to high-angle boundaries [50], ζ for the type I special boundary may be as small as predicted (ζ→0), although the nucleation of α-hex on the type I special boundary has been observed experimentally [29]. The value of ζ for the type II special boundary was determined to be three times larger than that for the other high-angle special boundaries. This indicates that the energy of the type II boundary can be larger than that of the type III (∑3) and the type IV (60° about <110>) boundaries, in which low energy boundaries have been reported to exist [50]. However, the grain boundary energy is not only dependent on relative orientation between adjacent grains but also boundary plane inclination. More research would be required on the grain boundary characterization of high-temperature β to discuss this result further.

6.9. Simulation of Further Heating Cycles

Whether the strength of textures decreases or increases after several consecutive heating cycles over the β transus is a question that one would like to ask to control the anisotropy of properties in products of hexagonal metals. Thus, the texture evolution during such heat treatment has been simulated using the optimum conditions described above; EDBOR n = 2 (ω = 0.18) and DBOR (ω = 0.8) for α-hexβ and βα-hex with ζ listed in Table 2, respectively.
Two simulations are shown in Figure 12 and Figure 13. One is a continuation of the heating cycle in the present experiment, and the observed α texture shown in Figure 3c and Figure 4g–i was used as the starting texture of the second cycle. As seen in Figure 12, the textures of β as well as α-hex phases greatly developed and were strengthened by the second heating cycle; the final α-hex texture was calculated using the computed β texture. Although the textures consisted of texture components similar to the observed textures, the intensity maxima in the pole figures of β and α-hex phases during and after the second heating cycle were as large as about 16 and 100 times the random intensity, respectively.
The other was two consecutive heating cycles of a model texture of a recrystallized Zr sheet. The model texture was based on an in situ observation of textures of α-hex Zr at 750 °C by Wenk et al. [5]. The reported model α-hex structure composed of a mixture of three Gaussian components of orientations (0°, 30°, 0°), (0°, 30°, 30°), and (0°, 0°, 0°) in Euler angles, the volume ratio of which was 60%:30%:10% [5], respectively, was used as the starting α-hex texture. A Gaussian distribution of 20° half-width was used for each component [34]. Although this texture was similar to the observed texture for CP-Ti in Figure 3a and Figure 4a–c, the texture was somewhat weaker, and it had a relatively fewer components with 2 1 ¯ 1 ¯ 0 in RD. Transformation calculations were then applied as explained above. In contrast to the case of CP-Ti, the texture of α-hex was slightly weakened after the first heating cycle, and then a similar but slightly strengthened α-hex texture appeared after the second heating cycle, as shown in Figure 13. It is also noteworthy that these simulated texture changes well resemble those observed experimentally [5]. Therefore, the texture memory phenomenon in hexagonal metals is largely dependent on the strength and type of the initial textures, and there should be a critical intensity or severity of initial textures above which the texture significantly develops by repeating heating cycles to above the β transus.

7. Conclusions

Texture memory and its formation mechanisms in hexagonal metals have been investigated via a prediction method with variant selection mechanisms and in situ observation of textures by pulsed neutron diffraction. The conclusions are as follows.
(1)
Mathematical methods for the prediction of transformation textures in hexagonal metals using harmonic expansion have been described, and a variant selection mechanism has also been formulated in which nucleation and growth preferentially occur when variants satisfy BOR with two adjoining parent grains at the same time (DBOR) for both α-hexβ and βα-hex transformations. Different nucleation and growth rates for different potential nucleation sites for DBOR, which are five and four types of special grain boundaries in α-hexβ and βα-hex transformations, respectively, are included in the formulation.
(2)
The variant selection by DBOR has been extended to describe the selected DBOR variants to grow not only into one parent grain (the local material conservation) but also into multiple parent grains with non-linear probabilities (EDBOR).
(3)
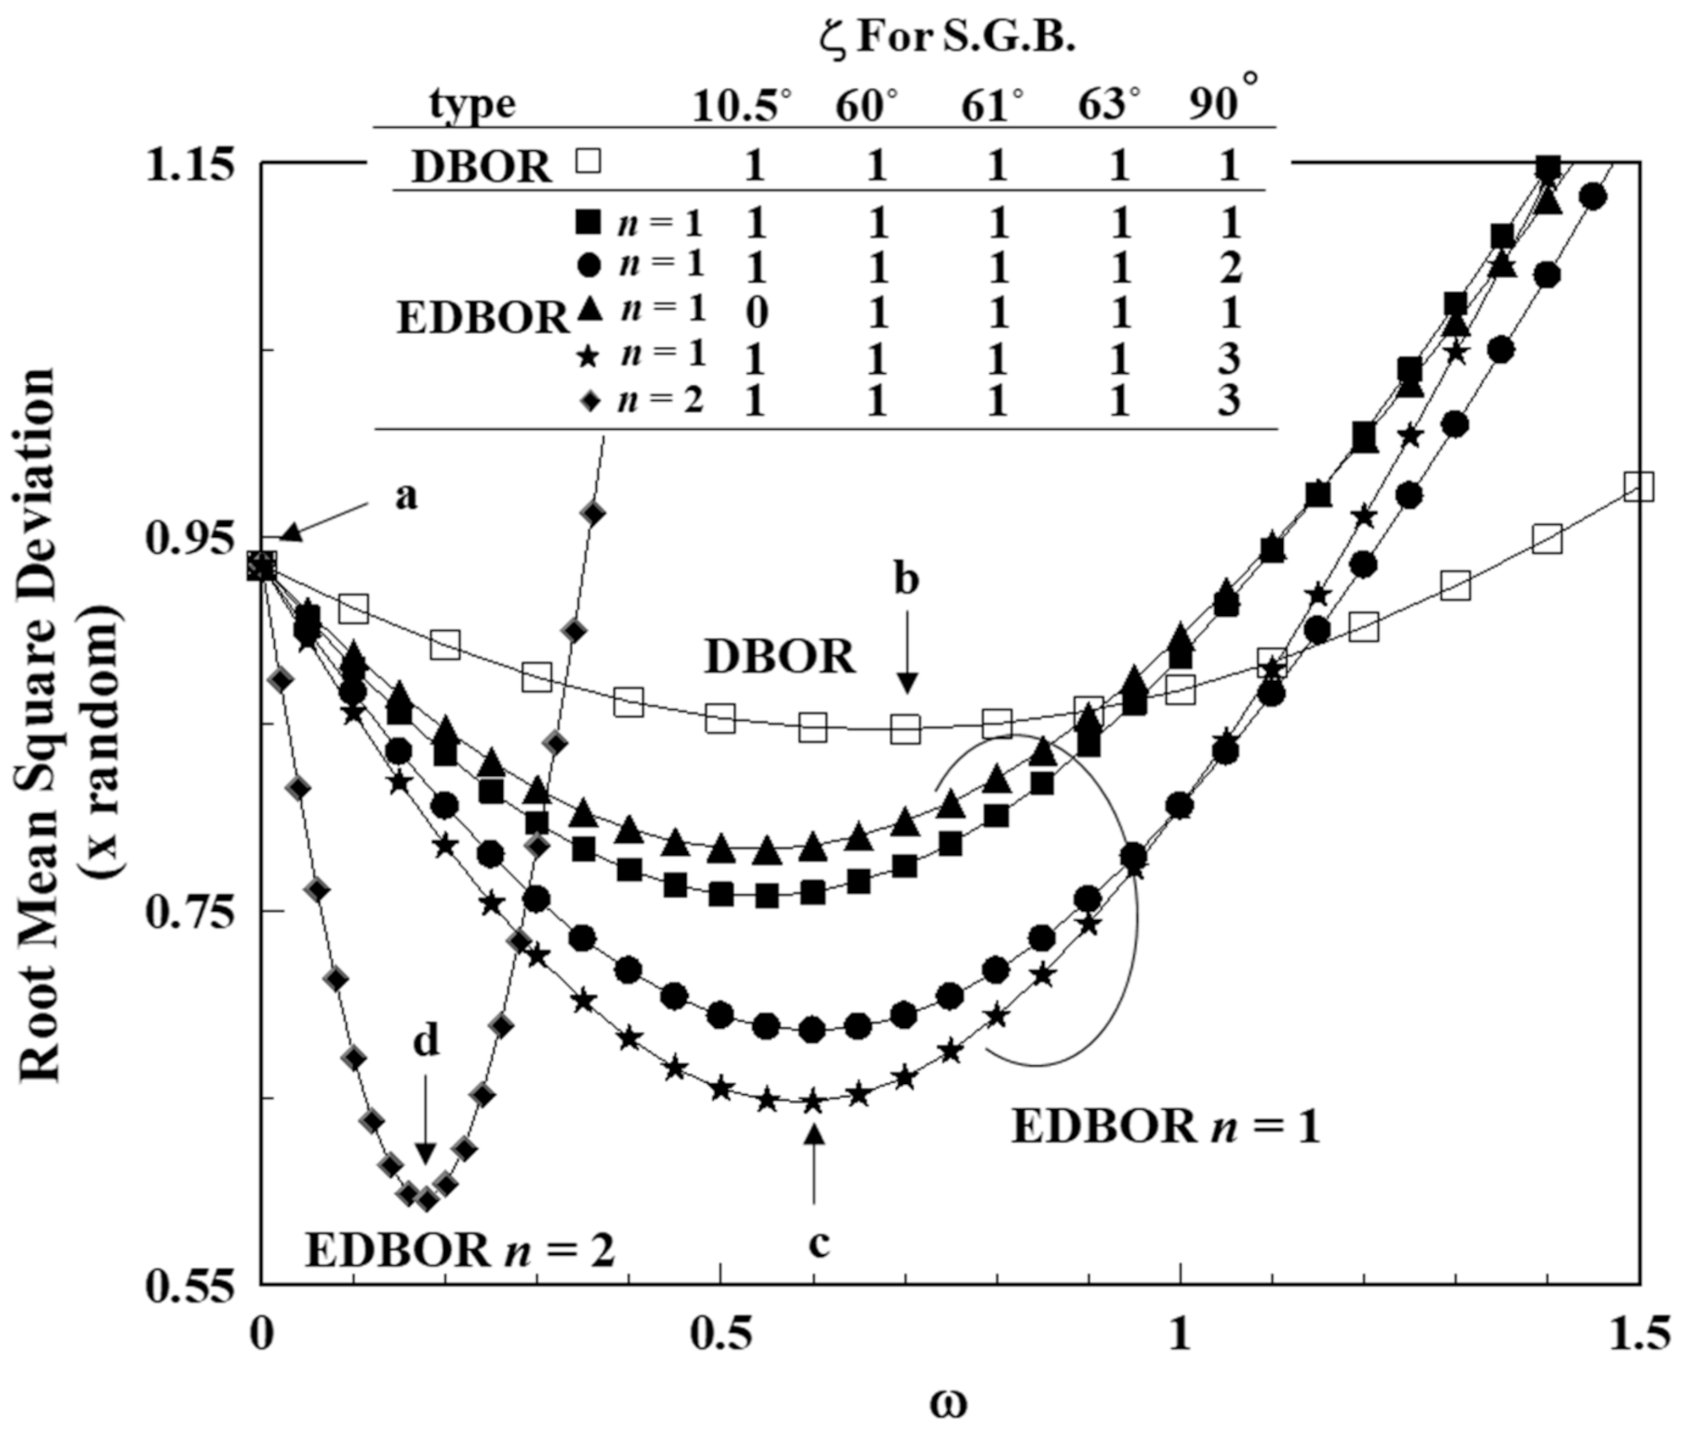
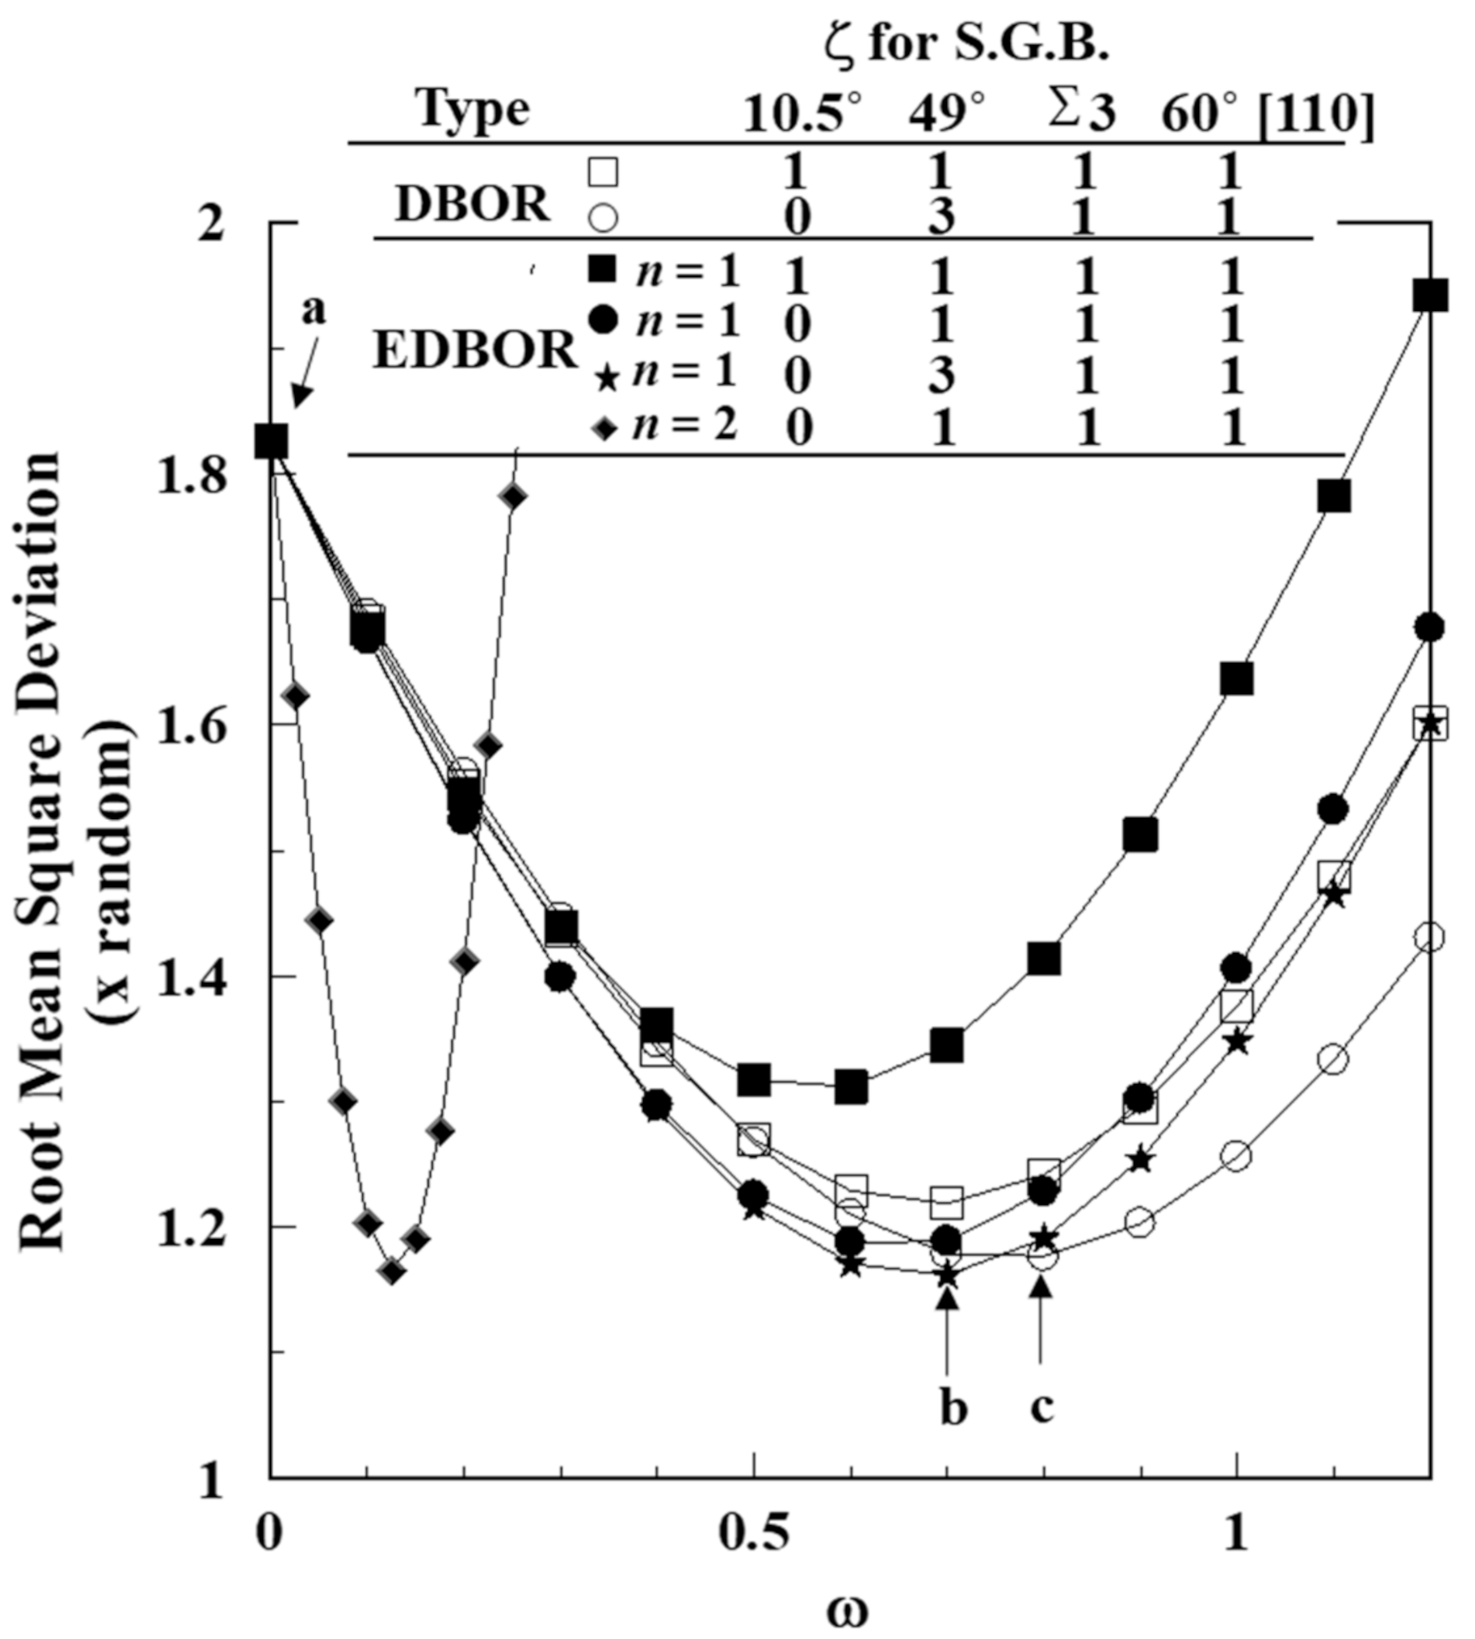
The special boundaries where DBOR is satisfied in α-hexβ transformation are of 10.5° rotation about the c-axis and 60°, 60.8°, 63.3°, and 90° rotations about <2 1 ¯ 1 ¯ 0 or axes near to it. Those in βα-hex transformation are of 10.5°, 49°, 60° rotations about <110> and 60° rotation about <111> (∑3). In texture-free materials, the probability of the existence of these special boundaries is as small as about 13 and 19% in α-hexβ and βα-hex, respectively. However, textures of parent phases can increase this probability, and this is the case for the α-hexβα-hex transformation in CP-Ti rolled sheets.
(4)
The analysis of in situ observed bulk textures of CP-Ti rolled sheets by pulsed neutron diffraction revealed that the texture memory in CP-Ti can be thoroughly explained by the DBOR mechanism. The transformation texture formation in α-hexβ obeys to EDBOR n = 2 (squared probability) in which the nucleation and growth rate for the special boundary of 90° rotation about 2 1 ¯ 1 ¯ 0 is three times larger than that for the other special boundaries, while the transformation in βα-hex obeys DBOR well with the local material conservation. The higher rate for the special boundary of 90° rotation is ascribed to a higher number density of this special boundary in CP-Ti, which relates to the macro-zone formation.
(5)
For βα-hex transformation, the nucleation and growth rates for the special boundaries with rotations of 10.5° and 49° about <110> are predicted to be as small as zero and three times larger than those for the other high-angle special boundaries, which can be ascribed to lower and higher grain boundary energies for these special boundaries than the others, respectively. However, even with all the parameters of ω and ζ being unity (or ideal), DBOR could predict the texture change in βα-hex transformation well.
(6)
By considering the DBOR mechanism, several well-known phenomena in CP-Ti, such as the preferential transformation of the growth components around 01 1 ¯ 3 2 1 ¯ 1 ¯ 0 in α-hexβ, the coexistence of differently oriented laths, and the common {110} plane variants in βα-hex, can be well understood.
(7)
The model calculations of repeating the α-hexβα-hex heating cycles suggest that there should be a critical strength of the texture above which the texture develops significantly by repeating the heating cycles.

Author Contributions

Conceptualization, T.T.; methodology, T.T.; investigation, T.T. and Y.O.; data curation, S.C.V.; funding acquisition, S.S. All authors have read and agreed to the published version of the manuscript.

Funding

This research received no external funding.

Institutional Review Board Statement

Not applicable.

Informed Consent Statement

Not applicable.

Acknowledgments

We gratefully acknowledge H.-R. Wenk’s kind permission on behalf of the authors of Lonardelli et al. The work has benefitted from the use of the Los Alamos Neutron Science Center (LANSCE) at Los Alamos National Laboratory. Los Alamos National Laboratory is operated by Triad National Security, LLC, for the National Nuclear Security Administration of the U.S. Department of Energy under contract number 89233218NCA000001.

Conflicts of Interest

The authors declare no conflict of interest.

References

  1. Ray, R.K.; Jonas, J.J. Transformation textures in steels. Int. Mater. Rev. 1990, 35, 1–36. [Google Scholar] [CrossRef]
  2. Hutchinson, B.; Kestens, L. Origins of texture memory in steels. Ceram. Trans. 2009, 201, 281–290. [Google Scholar]
  3. Tomida, T.; Wakita, M.; Yasuyama, M.; Sugaya, S.; Tomota, Y.; Vogel, S.C. Memory effects of transformation textures in steel and its prediction by the double Kurdjumov–Sachs relation. Acta Mater. 2013, 61, 2828–2839. [Google Scholar] [CrossRef]
  4. Lonardelli, I.; Gey, N.; Wenk, H.-R.; Humbert, M.; Vogel, S.C.; Lutterotti, L. In situ observation of texture evolution during αβ and βα phase transformations in titanium alloys investigated by neutron diffraction. Acta Mater. 2007, 55, 5718–5727. [Google Scholar] [CrossRef]
  5. Wenk, H.-R.; Lonardelli, I.; Williams, D. Texture changes in the hcp-bcc-hcp transformation of zirconium studied in situ by neutron diffraction. Acta Mater. 2004, 52, 1899–1907. [Google Scholar] [CrossRef]
  6. Humbert, M.; Gey, N. Elasticity-based model of the variant selection observed in the β to α phase transformation of a Zircalloy-4 sample. Acta Mater. 2003, 51, 4783–4790. [Google Scholar] [CrossRef]
  7. Daymond, M.R.; Holt, R.A.; Cai, S.; Mosbrucker, P.; Vogel, S.C. Texture inheritance and variant selection through an hcp–bcc–hcp phase transformation. Acta Mater. 2010, 58, 4053–4066. [Google Scholar] [CrossRef]
  8. Kimmins, S.T.; Gooch, D.J. Austenite memory effect in 1 Cr–1 Mo–0 75V (Ti, B) steel. Met. Sci. 1983, 17, 519–532. [Google Scholar] [CrossRef]
  9. Nakada, N.; Tsuchiyama, T.; Takaki, S.; Hashizume, S. Variant selection of reversed austenite in lath martensite. ISIJ Int. 2007, 47, 1527–1532. [Google Scholar] [CrossRef] [Green Version]
  10. Li, X.; Li, K.; Cai, Z.; Pan, J. Review of austenite memory effect in HAZ of B containing 9% Cr martensitic heat resistant steel. Metals 2019, 9, 1233. [Google Scholar] [CrossRef] [Green Version]
  11. Kurdjomov, G.; Sachs, G. Über den mechanismus der stahlhärtung. Z. Phys. 1930, 64, 325–343. [Google Scholar] [CrossRef]
  12. Burgers, W.G. On the process of transition of the cubic-body-centered modification into the hexagonal-close-packed modification of zirconium. Physica 1934, 1, 561–586. [Google Scholar] [CrossRef]
  13. Vakhitova, E.; Sornin, D.; Wright, J.; Tomida, T.; Francois, M.J. In situ synchrotron analysis of phase transformation at high temperatures in ODS ferritic steel. Mater. Sci. 2020, 55, 5600–5612. [Google Scholar] [CrossRef]
  14. Lischewski, I.; Gottstein, G. Nucleation and variant selection during the α–γ–α phase transformation in microalloyed steel. Acta Mater. 2011, 59, 1530–1541. [Google Scholar] [CrossRef]
  15. Hata, K.; Wakita, M.; Fujiwara, K.; Kawano, K.; Tomida, T.; Sugiyama, M.; Fukuda, T.; Kakeshita, T. In situ EBSD analysis on the crystal orientation relationship between ferrite and austenite during reverse transformation of an Fe-Mn-C alloy. Mater. Trans. 2016, 57, 1514–1519. [Google Scholar] [CrossRef] [Green Version]
  16. Hata, K.; Fujiwara, K.; Kawano, K.; Sugiyama, M.; Fukuda, T.; Kakeshita, T. Reconstruction of the three-dimensional ferrite–austenite microstructure and crystallographic analysis in the early stage of reverse phase transformation in an Fe–Mn–C alloy. ISIJ Int. 2018, 58, 323–333. [Google Scholar] [CrossRef] [Green Version]
  17. Hata, K.; Fujiwara, K.; Kawano, K.; Sugiyama, M.; Fukuda, T.; Kakeshita, T. Three-dimensional EBSD analysis and TEM observation for interface microstructure during reverse phase transformation in low carbon steels. ISIJ Int. 2018, 58, 742–750. [Google Scholar] [CrossRef] [Green Version]
  18. Kelly, M.N.; Glowinski, K.; Nuhfer, N.T.; Rohrer, G.S. The five parameter grain boundary character distribution of α-Ti determined from three-dimensional orientation data. Acta Mater. 2016, 111, 22–30. [Google Scholar] [CrossRef] [Green Version]
  19. Banerjee, D.; Williams, J.C. Perspectives on titanium science and technology. Acta Mater. 2013, 61, 844–879. [Google Scholar] [CrossRef]
  20. Niinomi, M. Recent research and development in titanium alloys for biomedical applications and healthcare goods. Sci. Technol. Adv. Mater. 2003, 4, 445–453. [Google Scholar] [CrossRef] [Green Version]
  21. Griffiths, M.; Winegar, J.E.; Buyers, A. The transformation behaviour of the β-phase in Zr–2.5 Nb pressure tubes. J. Nucl. Mater. 2008, 383, 28–33. [Google Scholar] [CrossRef]
  22. Singh, A.K.; Schwarzer, R.A. Texture and anisotropy of mechanical properties in titanium and its alloys. Z. Metallkd 2000, 91, 702–716. [Google Scholar]
  23. Shih, D.S.; Lin, F.; Starke, E.A., Jr. Titanium Science and Technology; Lütjering, G., Zwicker, U., Bunk, W., Eds.; DGM Verlagsges: Oberursel, Germany, 1984; pp. 2099–2106. [Google Scholar]
  24. Peters, M.; Gysler, A.; LÜtjering, G. Influence of texture on fatigue properties of Ti-6Al-4V. Metall. Mater. Trans. 1984, 15, 1597–1605. [Google Scholar] [CrossRef]
  25. Martin, É.; Azzi, M.; Salishchev, G.A.; Szpunar, J. Influence of microstructure and texture on the corrosion and tribocorrosion behavior of Ti–6Al–4V. Tribol. Int. 2010, 43, 918–924. [Google Scholar] [CrossRef]
  26. Lee, T.; Mathew, E.; Rajaraman, S.; Manivasagam, G.; Singh, A.K.; Lee, C.S. Tribological and corrosion behaviors of warm- and hot-rolled Ti-13Nb-13Zr alloys in simulated body fluid conditions. Int. J. Nanomed. 2015, 10, 207–212. [Google Scholar]
  27. Furuhara, T.; Takagi, S.; Watanabe, H.; Maki, T. Crystallography of grain boundary a precipitates in a β titanium alloy. MMTA 1996, 27, 1635–1646. [Google Scholar] [CrossRef]
  28. Stanford, N.; Bate, P.S. Crystallographic variant selection in Ti-6Al-4V. Acta Mater. 2004, 52, 5215–5224. [Google Scholar] [CrossRef]
  29. Bhattacharyya, D.; Viswanathan, G.B.; Denkenberger, R.; Furrer, D.; Fraser, H.L. The role of crystallographic and geometrical relationships between alpha and beta phases in an alpha/beta titanium alloy. Acta Mater. 2003, 51, 4679–4691. [Google Scholar] [CrossRef]
  30. Shi, R.; Dixit, V.; Viswanathan, G.B.; Fraser, H.L.; Wang, Y. Experimental assessment of variant selection rules for grain boundary α in titanium alloys. Acta Mater. 2016, 102, 197–211. [Google Scholar] [CrossRef]
  31. Wenk, H.-R.; Lutterotti, L.; Vogel, S. Texture analysis with the new HIPPO TOF diffractometer. Nucl. Instrum. Methods Phys. Res. A 2003, 515, 575–588. [Google Scholar] [CrossRef]
  32. Vogel, S.C.; Lutterotti, L.; Von Dreele, R.B.; Wenk, H.-R.; Williams, D.J. Texture measurements using the new neutron diffractometer HIPPO and their analysis using the Rietveld method. Powder Diffr. 2004, 19, 65–68. [Google Scholar] [CrossRef] [Green Version]
  33. Bunge, H.J.; Humbert, M.; Welch, P.I. Texture transformation. Textures Microstruct. 1984, 6, 81–96. [Google Scholar] [CrossRef] [Green Version]
  34. Bunge, H.J. Quantitative Texture Analysis; Bunge, H.J., Esling, C., Eds.; Deutsche Gesellschaft fur Metallkunde: Oberurse, Germany, 1982. [Google Scholar]
  35. Tomida, T.; Wakita, M.; Yoshida, M.; Imai, N. Quantitative prediction of transformation texture in hot-rolled steel sheets by multiple KS relation. Ceram. Trans. 2008, 200, 325–332. [Google Scholar]
  36. Tomida, T.; Vakhitova, E.; Sornin, D.; Wright, J.; François, M.; Onuki, Y.; Hirano, T.; Hoshikawa, A.; Ishigaki, T.; Sato, S. Texture memory in Si-Mn and ODS steels observed in situ by pulsed neutron and synchrotron X-ray diffractions and prediction by double Kurdjumov-Sachs relation: A concept for intense variant selection. Metall. Mater. Trans. A 2021, 52, 1368–1381. [Google Scholar] [CrossRef]
  37. Tanaka, Y.; Tomida, T.; Mohles, V. Quantitative prediction of deformed austenite and transformed ferrite texture in hot-rolled steel sheet. Mater. Sci. Eng. 2015, 82, 012057. [Google Scholar] [CrossRef] [Green Version]
  38. Tomida, T.; Wakita, M.; Vogel, S.; Sandim, H.R.Z. Quantitative prediction of transformation texture in steel by double Kurdjumov-Sachs relation. Mater. Sci. Eng. 2015, 82, 12060. [Google Scholar]
  39. Sharma, H.; Sietsma, J.; Offerman, S.E. Preferential nucleation during polymorphic transformations. Sci. Rep. 2016, 6, 30860. [Google Scholar] [CrossRef] [Green Version]
  40. Yoshinaga, N.; Inoue, H.; Kawasaki, K.; Kestens, L.; Cooman, B.C.D. Factors affecting texture memory appearing through a→g→a transformation in IF steels. Mater. Trans. 2007, 48, 2036–2042. [Google Scholar] [CrossRef] [Green Version]
  41. Rietveld, H.M. A profile refinement method for nuclear and magnetic structures. J. Appl. Cryst. 1969, 2, 65–71. [Google Scholar] [CrossRef]
  42. Lutterotti, L.; Matthies, S.; Wenk, H.-R.; Schultz, A.S.; Richardson, J.W., Jr. Combined texture and structure analysis of deformed limestone from time-of-flight neutron diffraction spectra. J. Appl. Phys. 1887, 81, 594–600. [Google Scholar] [CrossRef]
  43. Matthies, S.; Pehl, J.; Wenk, H.-R.; Lutterotti, L.; Vogel, S.C. Quantitative texture analysis with the HIPPO neutron TOF diffractometer. J. Appl. Cryst. 2005, 38, 462–475. [Google Scholar] [CrossRef]
  44. Inoue, H.; Inakazu, N. Determination of orientation distribution functions from incomplete pole figures by iterative series expansion method. J. Jpn. Inst. Met. 1994, 58, 892–898. [Google Scholar] [CrossRef] [Green Version]
  45. Bhattacharyya, D.; Viswanathan, G.B.; Fraser, H.L. Crystallographic and morphological relationships between β phase and the Widmanstätten and allotriomorphic α phase at special β grain boundaries in an α/β titanium alloy. Acta Mater. 2007, 55, 6765–6778. [Google Scholar] [CrossRef]
  46. Shi, R.; Dixit, V.; Fraser, H.L.; Wang, Y. Variant selection of grain boundary α by special prior β grain boundaries in titanium alloys. Acta Mater. 2014, 75, 156–166. [Google Scholar] [CrossRef]
  47. Christian, J. The Theory of Transformations in Metals and Alloys; Pergamon Press: Oxford, UK, 1981. [Google Scholar]
  48. Aaronson, H.I.; Enomoto, M.; Lee, J.K. Mechanisms of Diffusional Phase Transformations in Metals and Alloys; CRC Press: Boca Raton, FL, USA, 2010. [Google Scholar]
  49. Wang, J.; Beyerlein, I.J. Atomic structures of symmetric tilt grain boundaries in hexagonal close packed (hcp) crystals. Modell. Simul. Mater. Sci. Eng. 2012, 20, 024002. [Google Scholar] [CrossRef]
  50. Ratanaphan, S.; Olmsted, D.L.; Bulatov, V.V.; Holm, E.A.; Rolletta, A.D.; Rohrera, G.S. Grain boundary energies in body-centered cubic metals. Acta Mater. 2015, 88, 346–354. [Google Scholar] [CrossRef] [Green Version]
Figure 1. Schematic representations of (a) nucleation of DBOR variants and (b) growth by coherent interfaces and (c) semi-coherent or incoherent interfaces of selected variants by DBOR in α-hexβ transformation. EDBOR growth can occur by mobile semi-coherent and incoherent interfaces.
Metals 11 01653 g001
Figure 2. Heating pattern of in situ observation of textures in CP-Ti by HIPPO [4]. The data used in this study are those at 800 °C before transformation, at 950 °C after α-hexβ transformation, and at 400 °C after the heating cycle.
Metals 11 01653 g002
Figure 3. ODF sections of observed textures of CP-Ti, (a) initial α-hex at 800 °C, (b) β at 950 °C, (c) α-hex after transformation cycle at 400 °C, and (d,e) important orientations in α-hex and β, respectively. Contour levels are 2, 4, 6.
Metals 11 01653 g003
Figure 4. Pole figures of observed textures of CP-Ti, (ac) initial α-hex at 800 °C, (df) β at 950 °C, and (gi) α-hex at 400 °C after transformation cycle. Contour levels are 1, 2, 3.
Metals 11 01653 g004
Figure 5. Change in root mean square deviation between observed and predicted ODFs by changing ω and ζ. See inset table for calculation conditions.
Metals 11 01653 g005
Figure 6. (ad) ODF φ2 = 45° sections for predictions of β textures (a) without and (bd) with variant selection. The conditions of prediction in Figure 6a–d are indicated by arrows a-d in Figure 5, respectively. (e) and (fh) ODF sections and pole figures for the optimum prediction by EDBOR n =2 shown in Figure 6d. Contour levels are (ad) and (fh) 1, 2, 3… and (e) 2, 4, 6…, respectively.
Metals 11 01653 g006
Figure 7. Variant selection probability, ρ, for parent orientations 01 1 ¯ 3 2 1 ¯ 1 ¯ 0 , 01 1 ¯ 2 2 1 ¯ 1 ¯ 0 and 1 ¯ 2 1 ¯ 5 10 1 ¯ 0 in optimum predictions by (a) EDBOR n = 1 and (b) EDBOR n = 2, shown in Figure 6c–h for α-hexβ transformation. The conditions for optimum predictions are indicated by arrows c and d in Figure 5. See Table 2 for variant orientations.
Metals 11 01653 g007
Figure 8. Change in root mean square deviation between observed and prediction ODFs by changing ω and ζ for βα-hex transformation. See inset table for calculation conditions.
Metals 11 01653 g008
Figure 9. (ad) ODF φ2=30° sections for predictions of β textures (a) without and (bd) with variant selection. The conditions of prediction in Figure 9a–c are indicated by arrows a-c in Figure 8, respectively. (e,f) ODF sections and pole figures for the optimum prediction by DBOR shown in Figure 9c. (ac) and (eh) Predictions based on the observed β texture in Figure 3b and Figure 4d–f and (d) prediction based on the predicted β texture in Figure 6d–h. Contour levels are (ae) 2, 4, 6… and (fh) 1, 2, 3…
Metals 11 01653 g009
Figure 10. Variant selection probability, ρ, for parent orientations {001}<100> and {112}< 11 1 ¯ > in the optimum prediction by (a) DBOR and (b) EDBOR n = 1 for βα-hex transformation in Figure 9b,c,e–h. The conditions for optimum prediction are indicated by (a) arrow b and (b) arrow c in Figure 8. See Table 2 for variant orientations.
Metals 11 01653 g010
Figure 11. Orientations of (a) (110) and (b) (111) poles of {001}<100> and {112}< 11 1 ¯ > components in β structure. Two components in a {112}< 11 1 ¯ > sample–symmetry pair are distinguished by black and white triangles. Gray triangles represent common poles of the symmetry pair.
Metals 11 01653 g011
Figure 12. Pole figures of predicted (a) β and (b) α-hex textures in the second heating cycle based on the observed texture shown in Figure 3c and Figure 4g–i.
Metals 11 01653 g012
Figure 13. Pole figures of model (a) α-hex→ (b) β→ (c) α-hex→(d) β→ (e) α-hex heating cycles. Contour levels are 1,2,3…
Metals 11 01653 g013
Table 1. Special boundaries for DBOR and δrm/δζ and optimum ζ for predictions by EDBOR n = 1 scheme.
Phase TransformationTypeRotation Between Adjacent GrainsNumber Ratioδrm/δζ (10−2)Optimum ζ
AngleAxis Deviation   from   < 2 1 ¯ 1 ¯ 0 >
α-hexβI10.5°c-axis90°1−0.41
II60°< 2 1 ¯ 1 ¯ 0 > 22.91
III60.8°<7 4 ¯ 3 ¯ 1 > 10.4°44.91
IV63.3°< 4 2 ¯ 2 ¯ 1 > 17.6°23.41
V90°<7 4 ¯ 3 ¯ 0 > 5.3°2−7.23
βα-hexI10.5°<110>12.70
II49.5°<110>1−7.13
III60°<111>1−3.41
IV60°<110>2−7.91
Table 2. Orientations of major components in observed textures and their BOR and DBOR variants on the special boundaries. Three angles separated by slashes are Euler angles, φ1/Φ/φ2. Bold letters indicate DBOR variants, and ** and * indicate exact and near-DBOR variants on typical grain boundaries, respectively. Note that the number of BOR variants reduces to three or 7 by symmetry of parent orientations.
Typeα-hex→ββ→α-hex
Parent O.R. 01 1 ¯ 3 < 2 1 ¯ 1 ¯ 0 >
0°/31°/30°
01 1 ¯ 2 < 2 1 ¯ 1 ¯ 0 >
0°/43°/30°
1 ¯ 2 1 ¯ 5 < 10 1 ¯ 0 >
0°/33°/0°
{001}<100>
0°/0°/0°
112 < 11 1 ¯ >
90°/35°/45°
Typical special G.B.2° from II between TD-split pair 4° from V between TD-split pairNone 16° from IV between {001}<100> & {112}<111>III between symmetry pair & 16° from IV between {001}<100> & {112}<111>
Child O.R. of BORgβ1 112 <   11 1 ¯ > * 001   <   100 > * 113 21 1 ¯ gα-hex1 01 1 ¯ 2 < 2 1 ¯ 1 ¯ 0 > * 01 1 ¯ 3 < 2 1 ¯ 1 ¯ 0 > *,**
gβ2 014 100 853 < 1 1 ¯ 1 ¯ > 111 < 0 1 ¯ 1 ¯ > gα-hex2 1 ¯ 210 < 10 1 ¯ 1 > 0°/30°/19.5° *
gβ3 447 < 43 4 ¯ > 376 <3 3 ¯ 2 > 114 < 31 1 ¯ > gα-hex3 01 1 ¯ 2 < 0 1 ¯ 11 > 01 1 ¯ 0 < 2 1 ¯ 1 ¯ 0 > **
gα-hex4 1 ¯ 213 < 1 2 ¯ 12 >
gα-hex50°/90°/19.5°
gα-hex659°/83°/0.5°
gα-hex759°/83°/10°
**: Exact DBOR variant, *: near-DBOR variant, bold letter: DBOR variants.
Publisher’s Note: MDPI stays neutral with regard to jurisdictional claims in published maps and institutional affiliations.

