
Property Improvement of Additively Manufactured Ti64 by Heat Treatment Characterized by In Situ High Temperature EBSD and Neutron Diffraction

 ,
,
Abstract
:
1. Introduction
2. Experimental Methods
2.1. Neutron Diffraction
2.2. EBSD
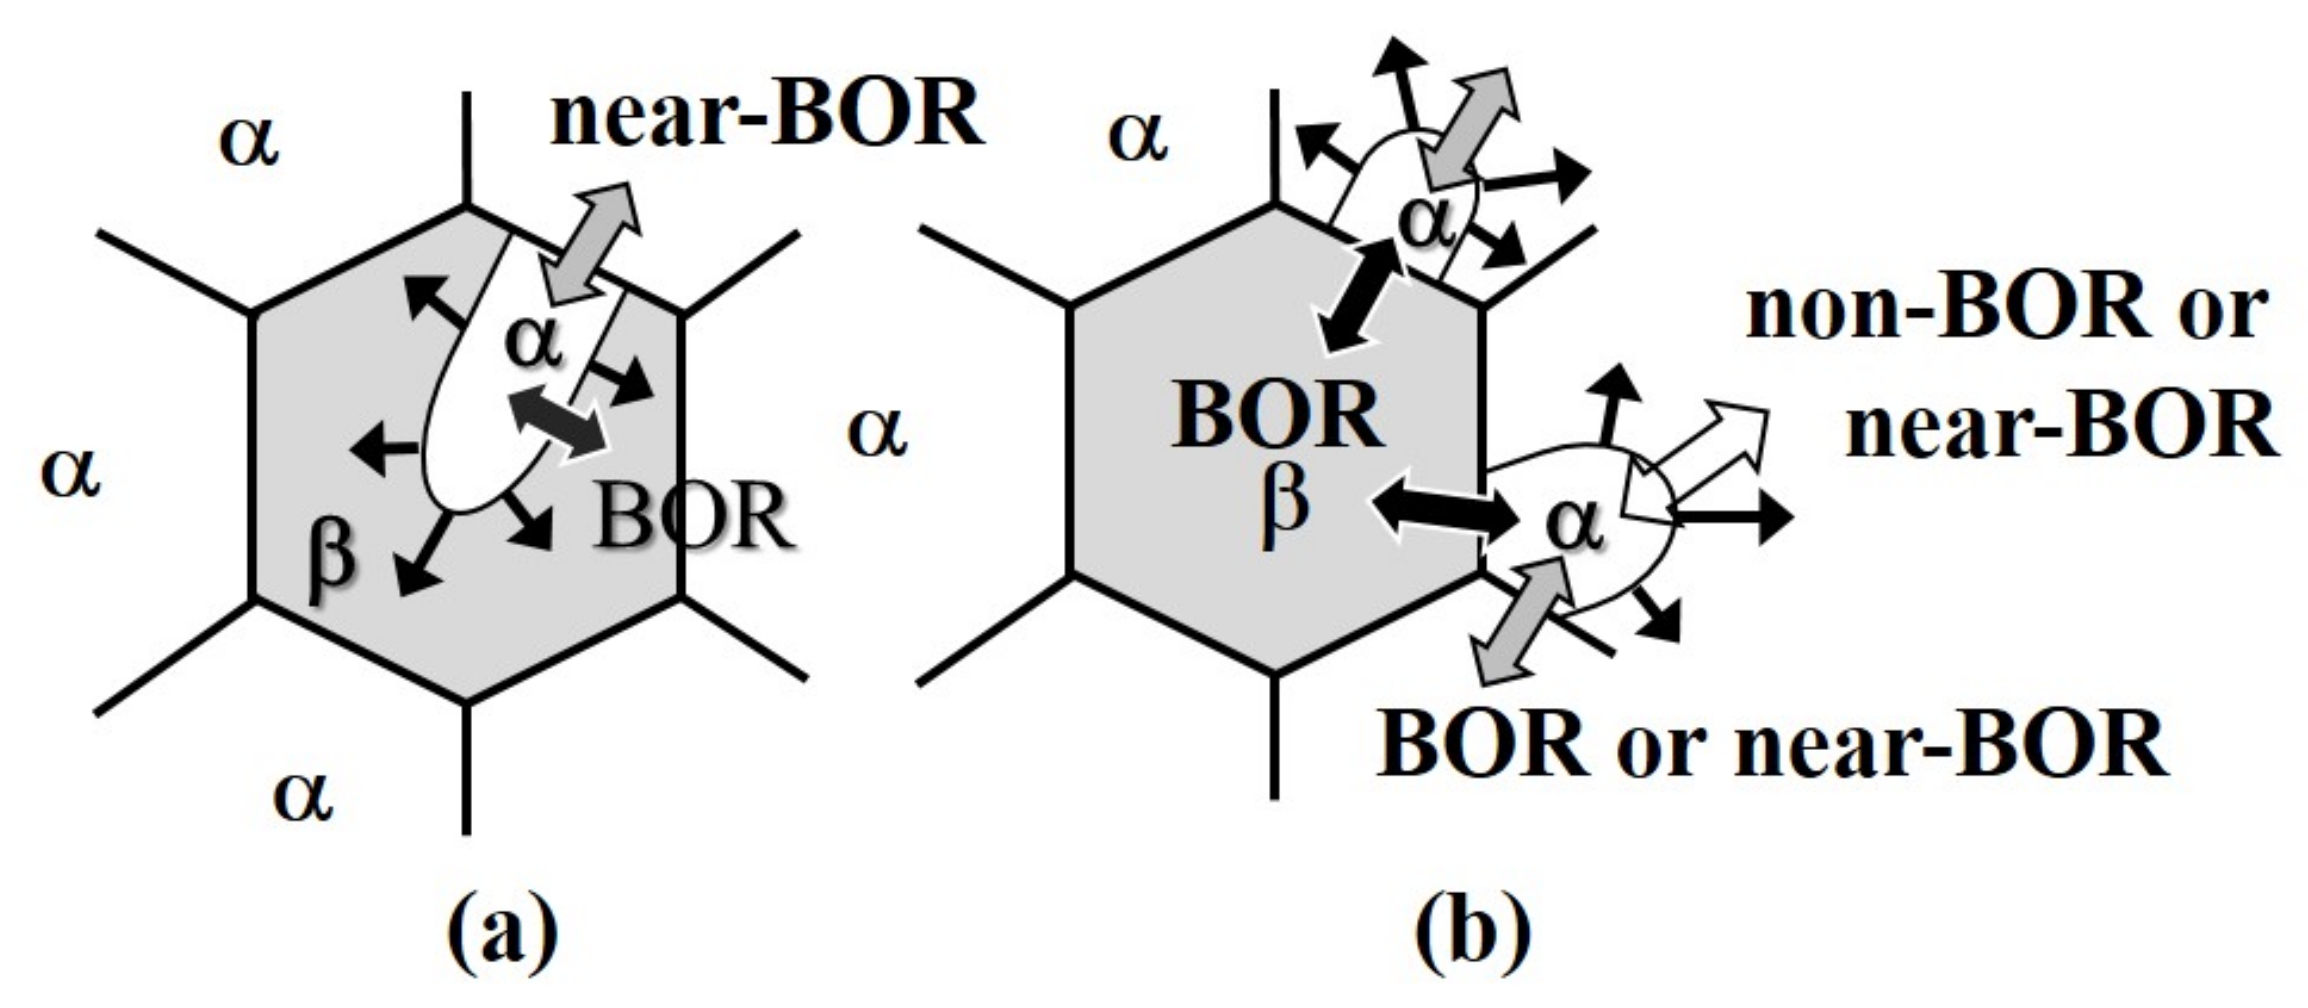
3. Model for Transformation Texture Formation
4. Results and Discussion
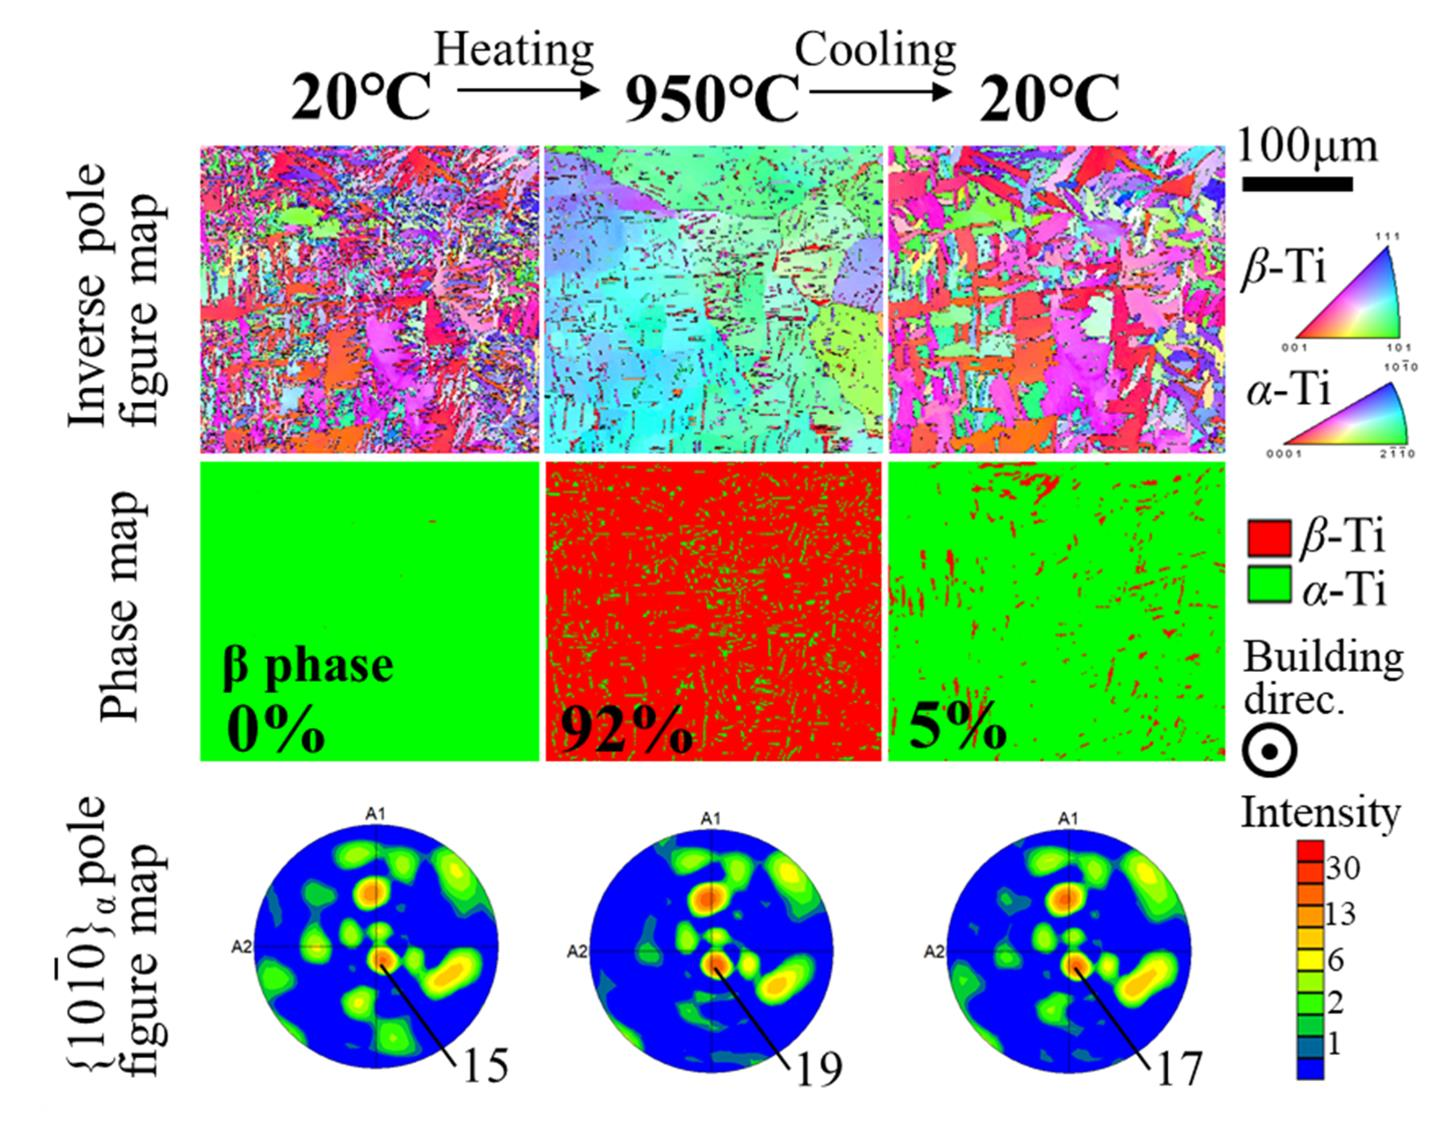
Microstructure Evolution
5. Conclusions
- (i)
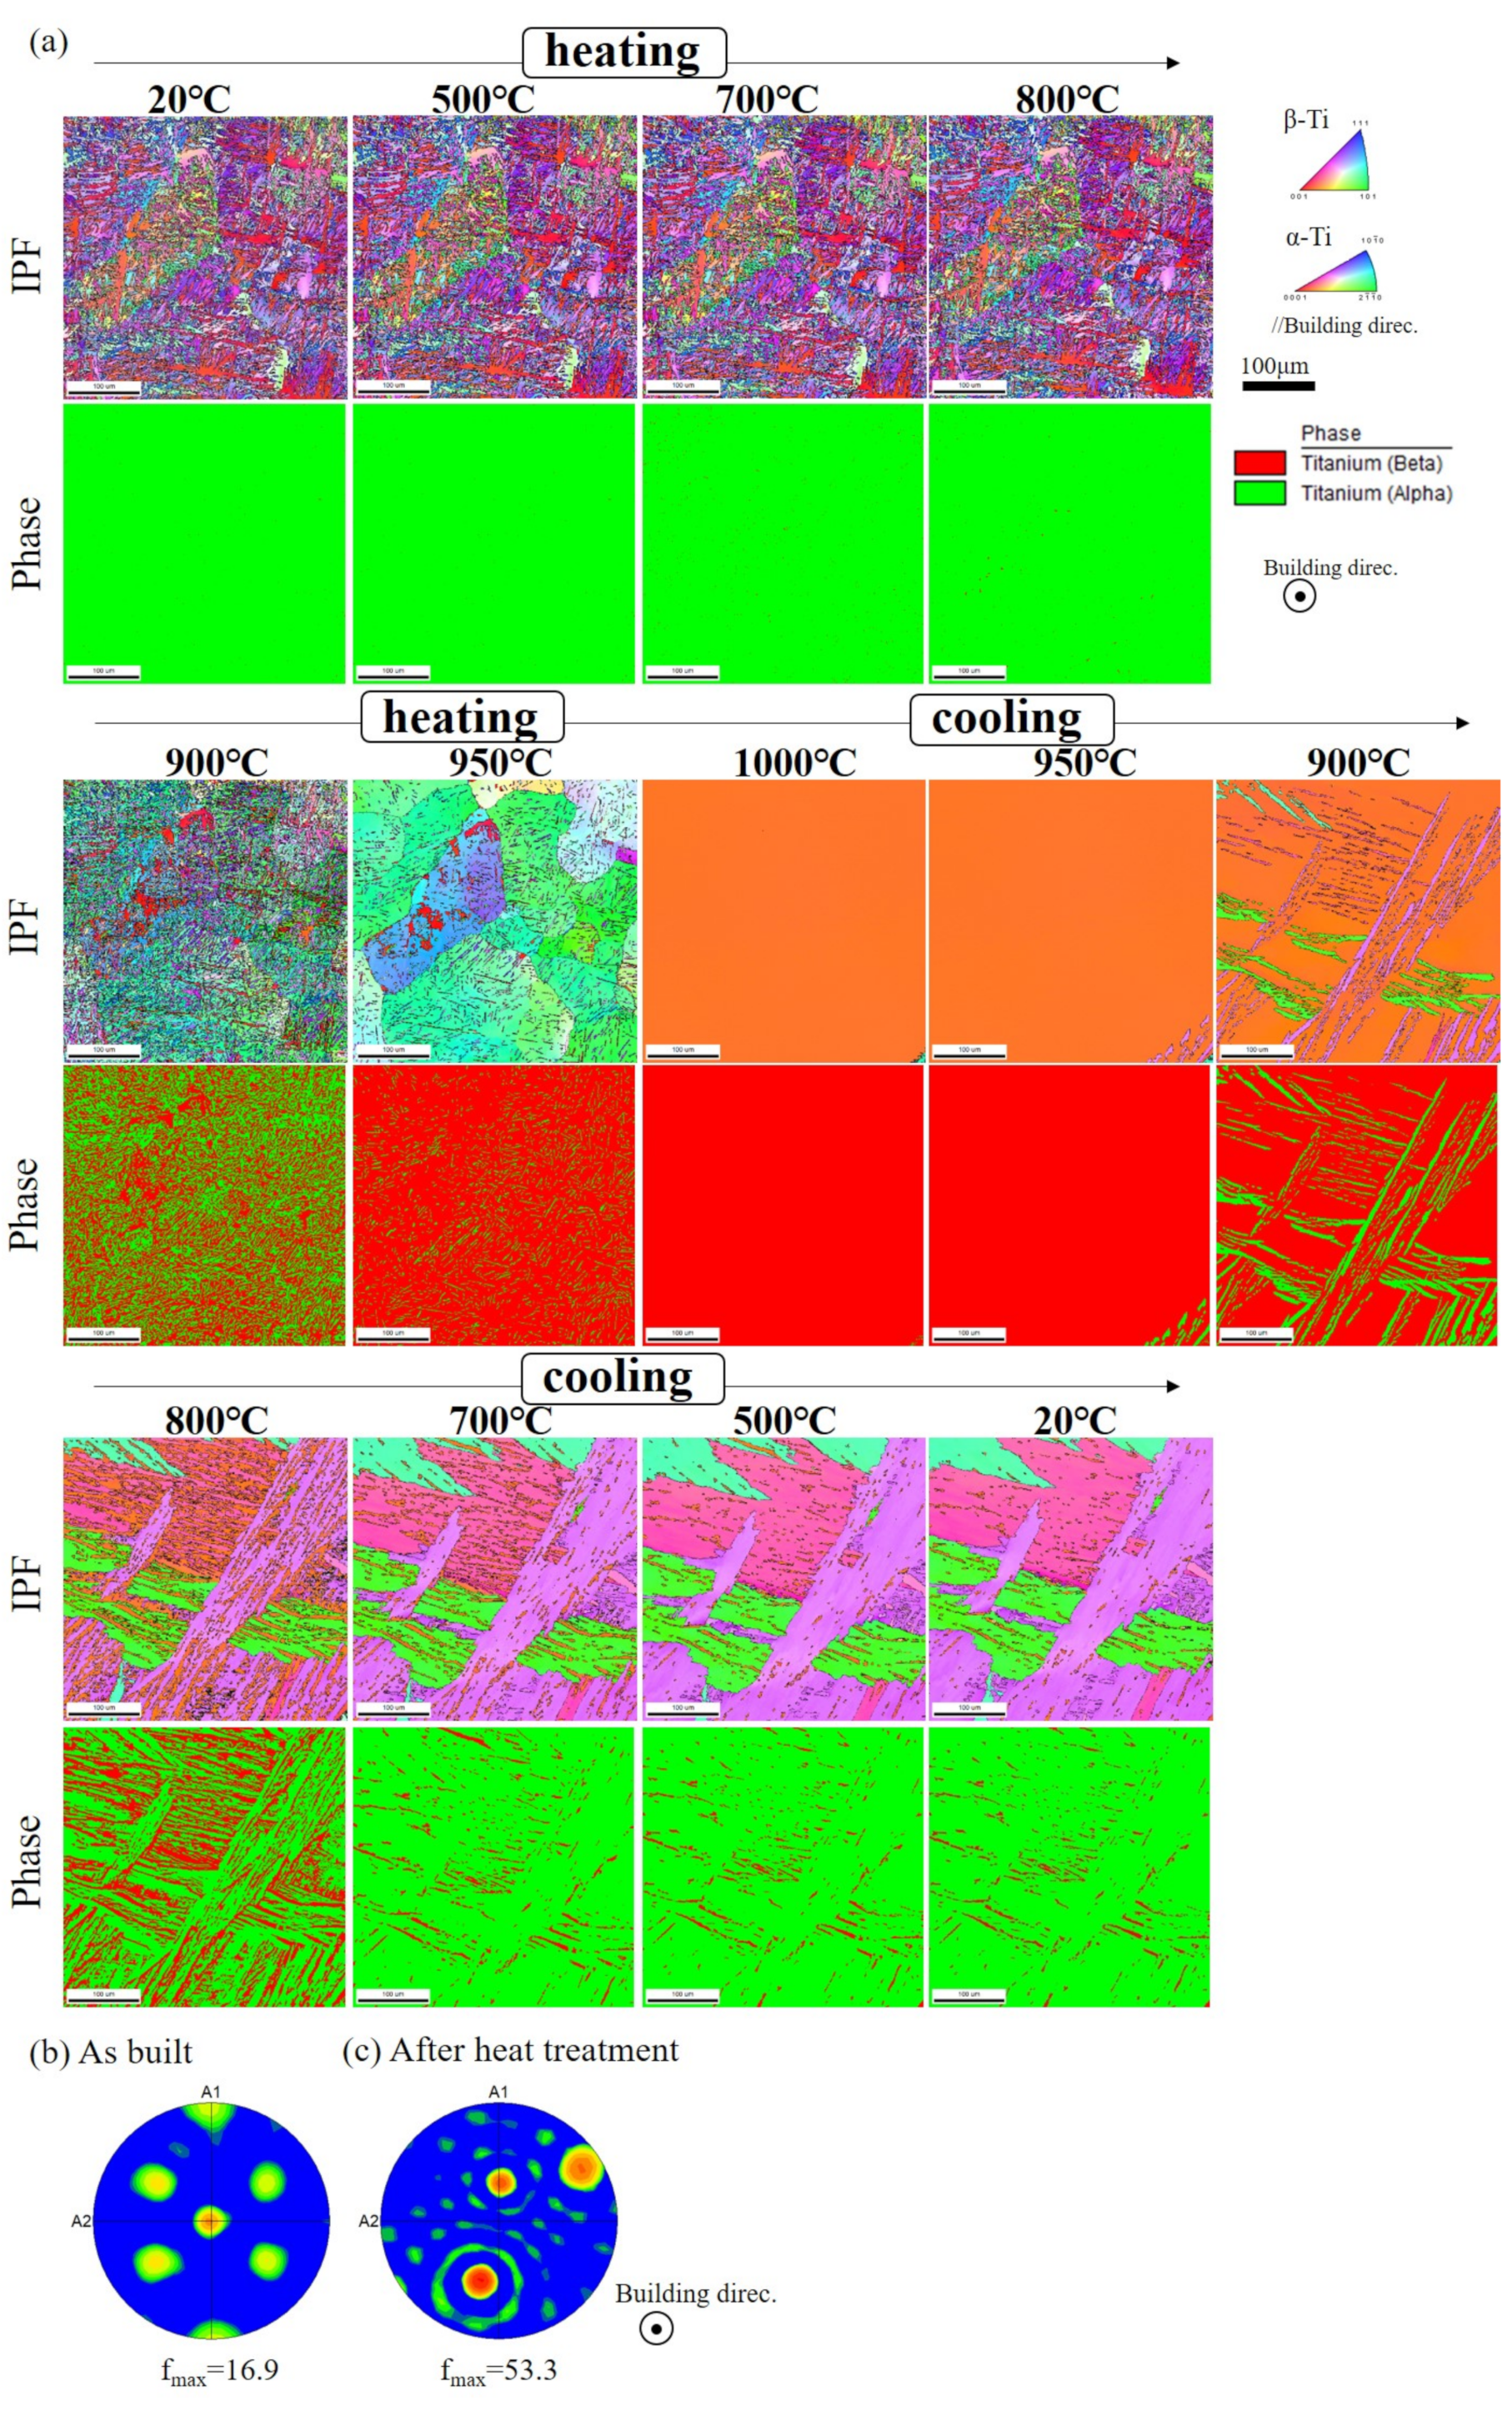
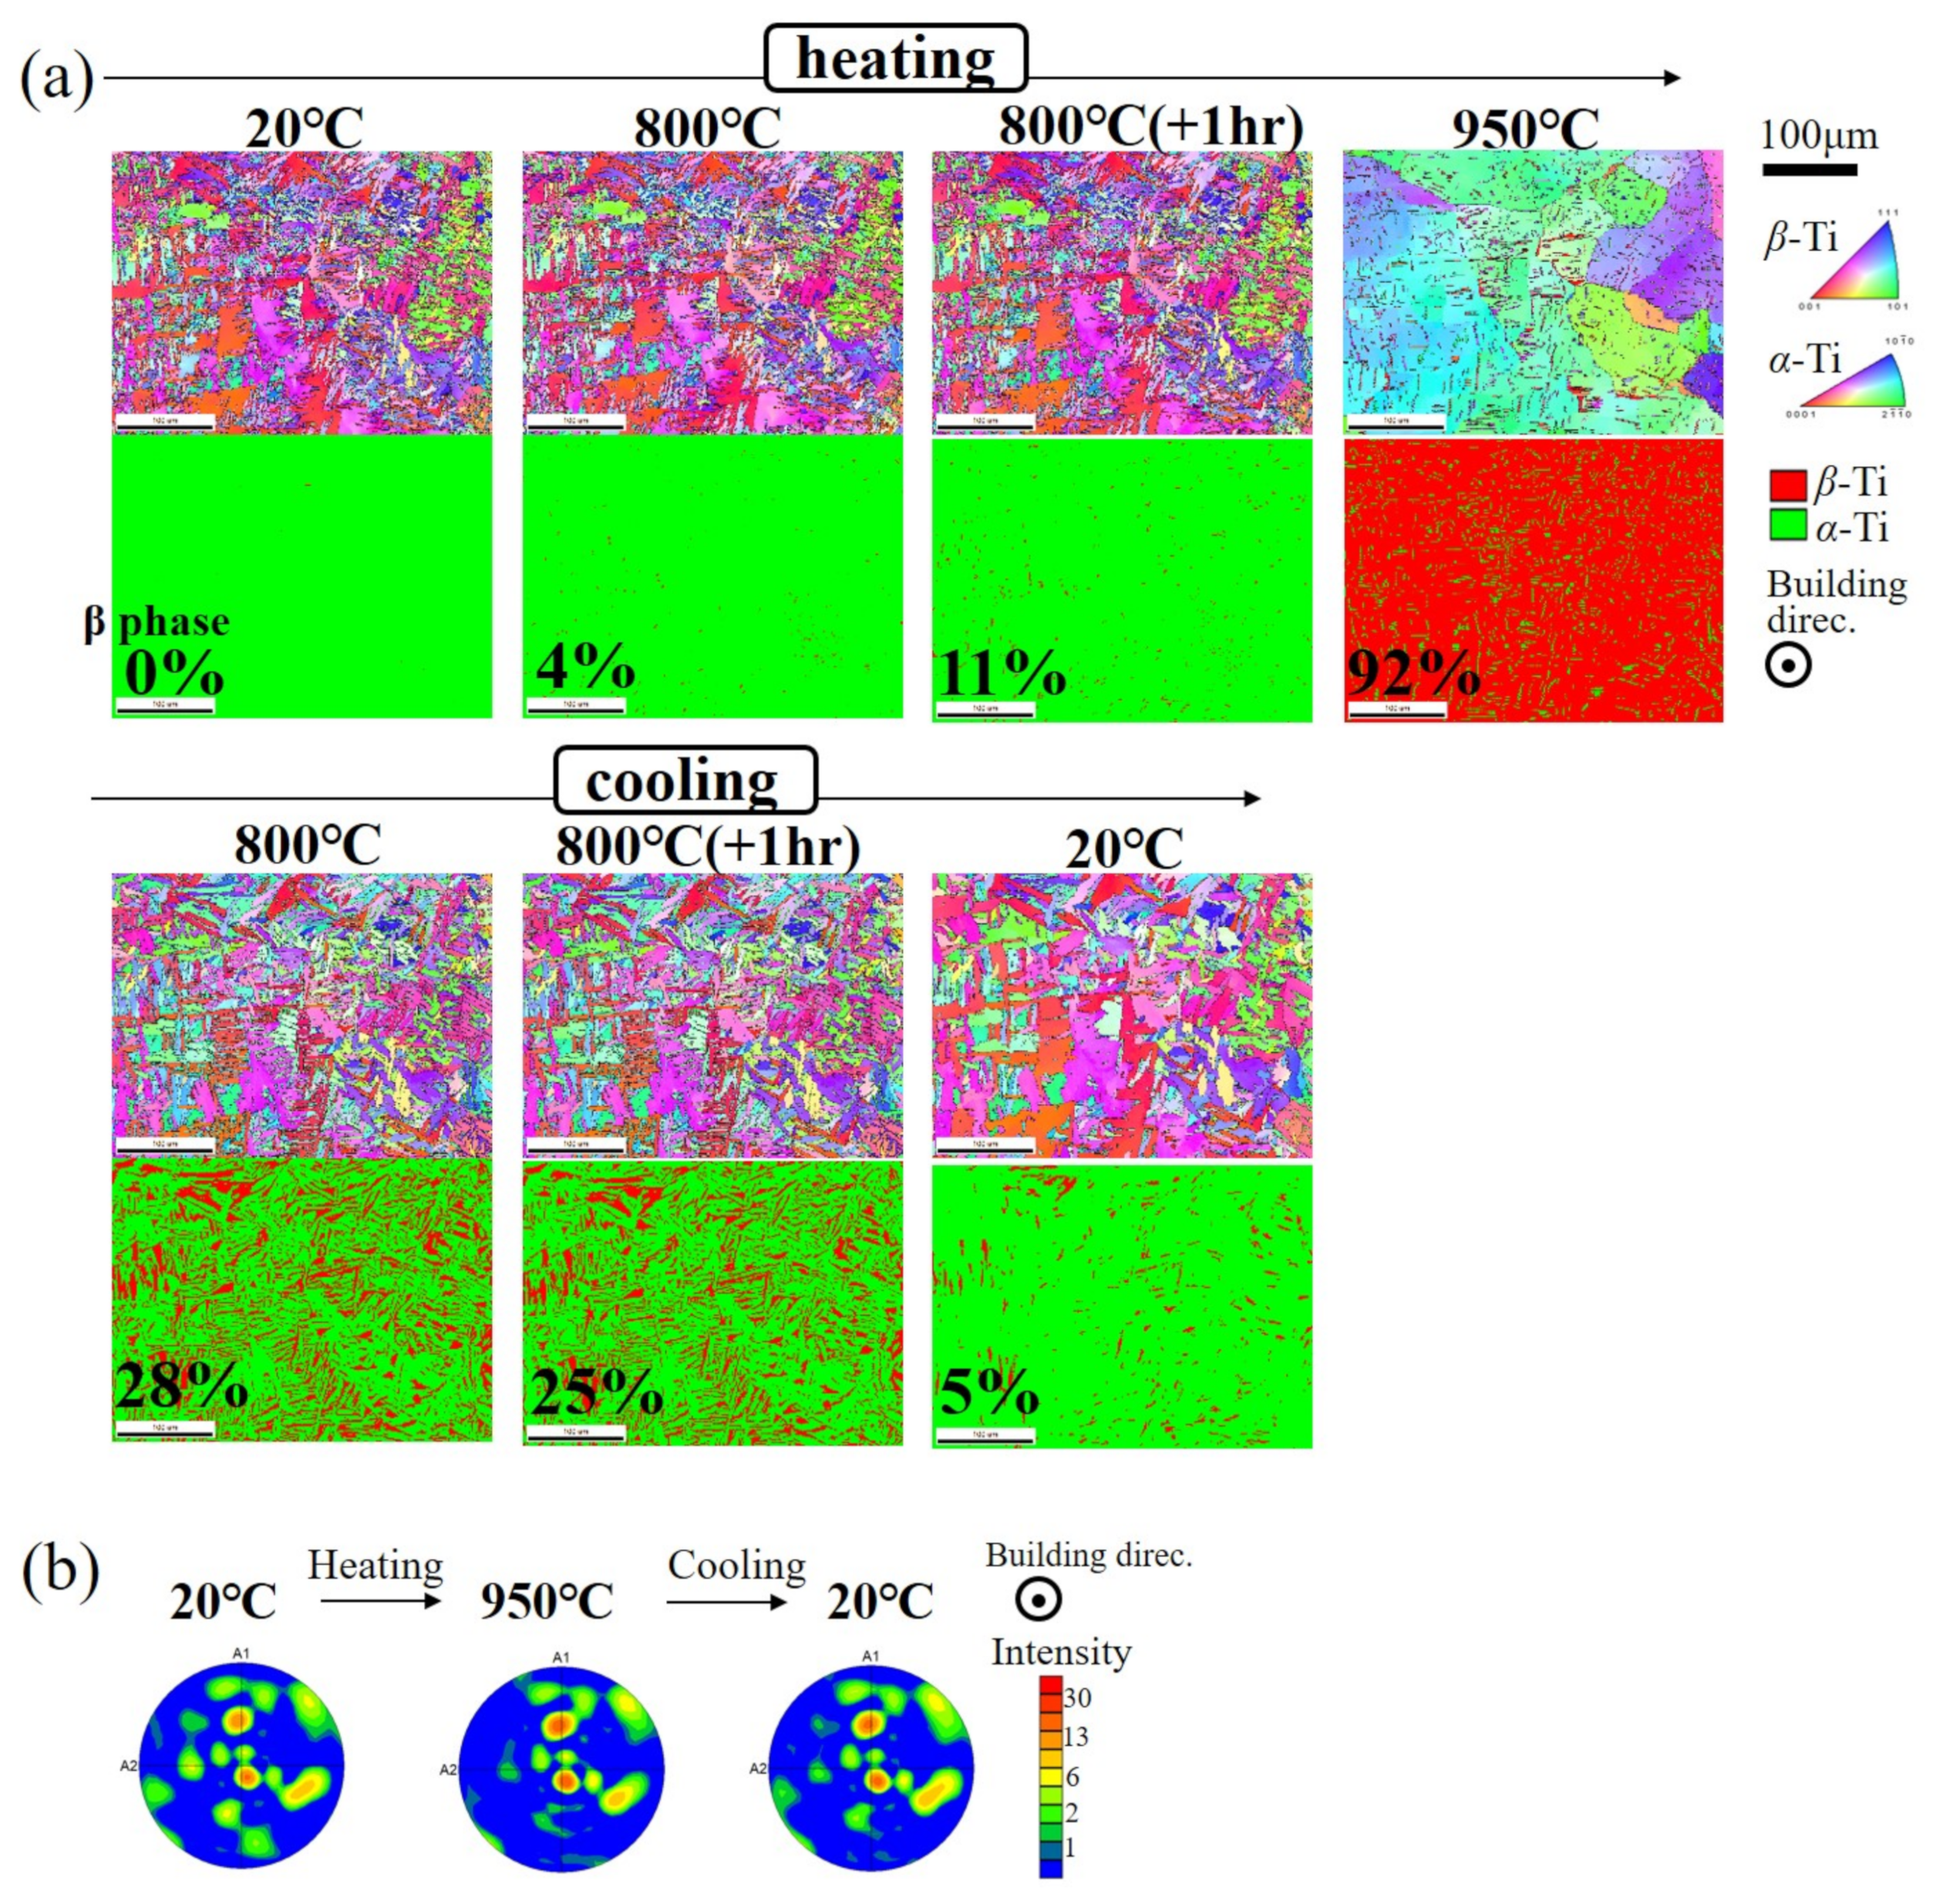
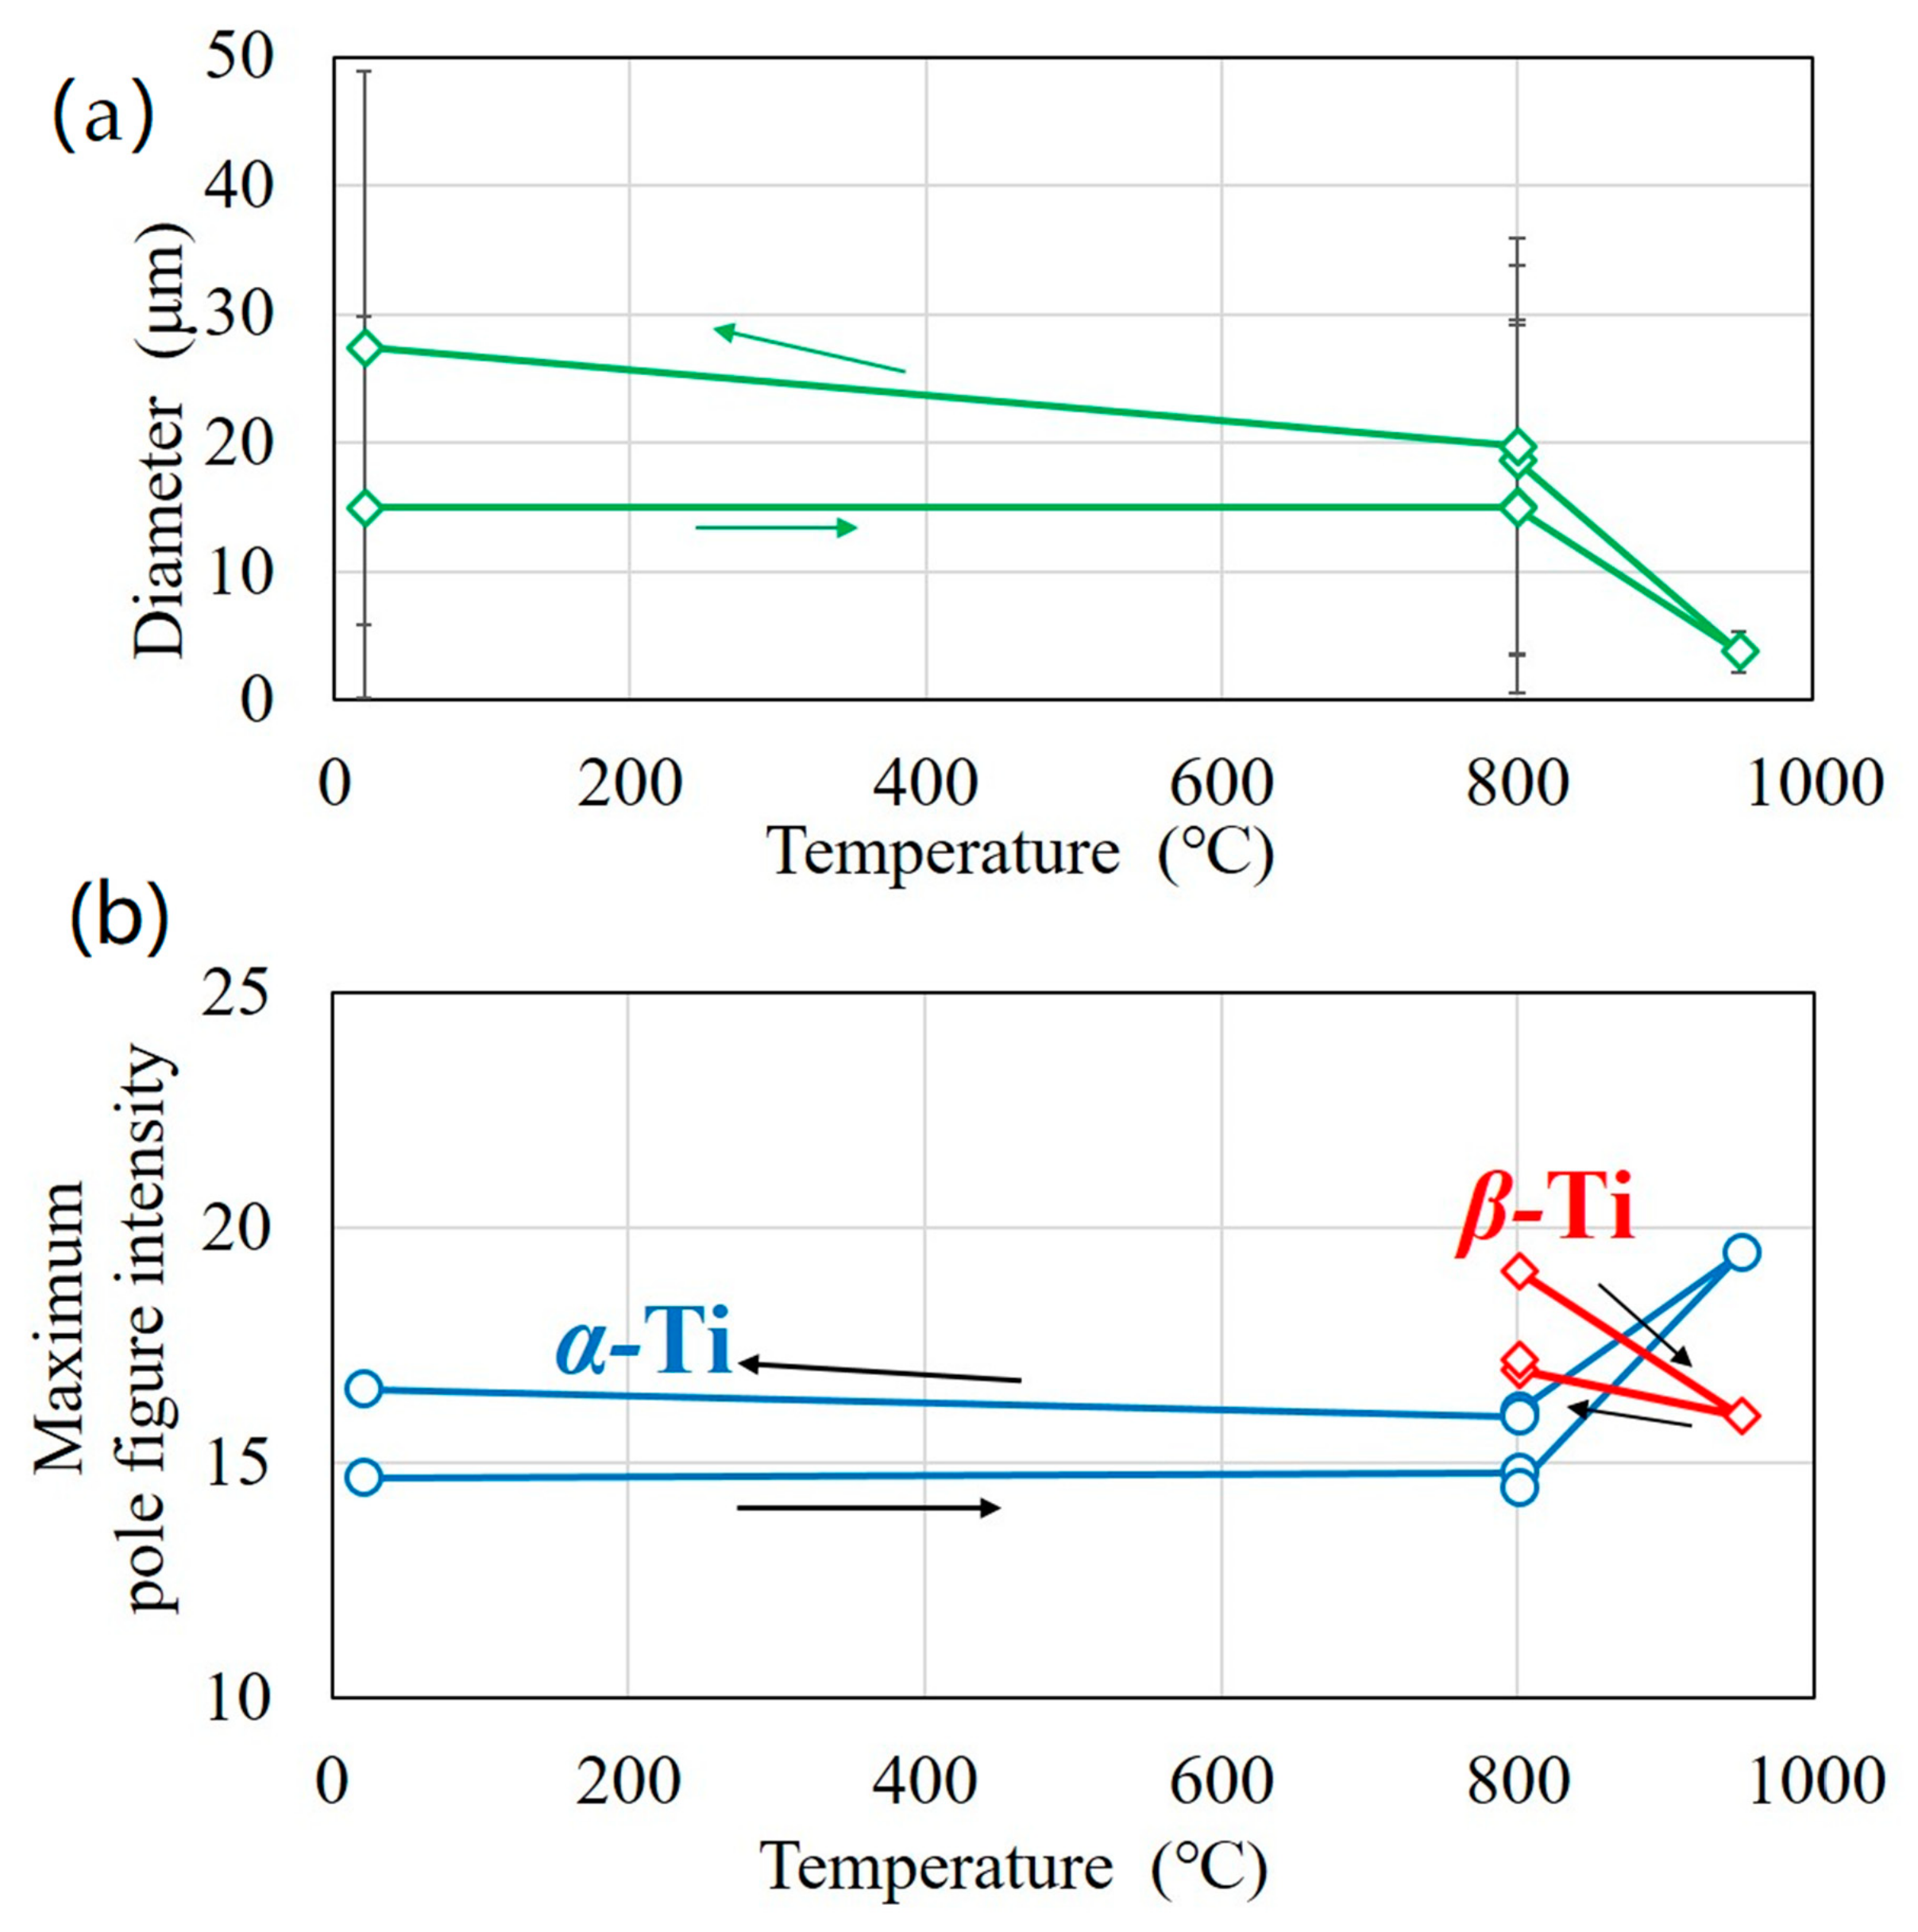
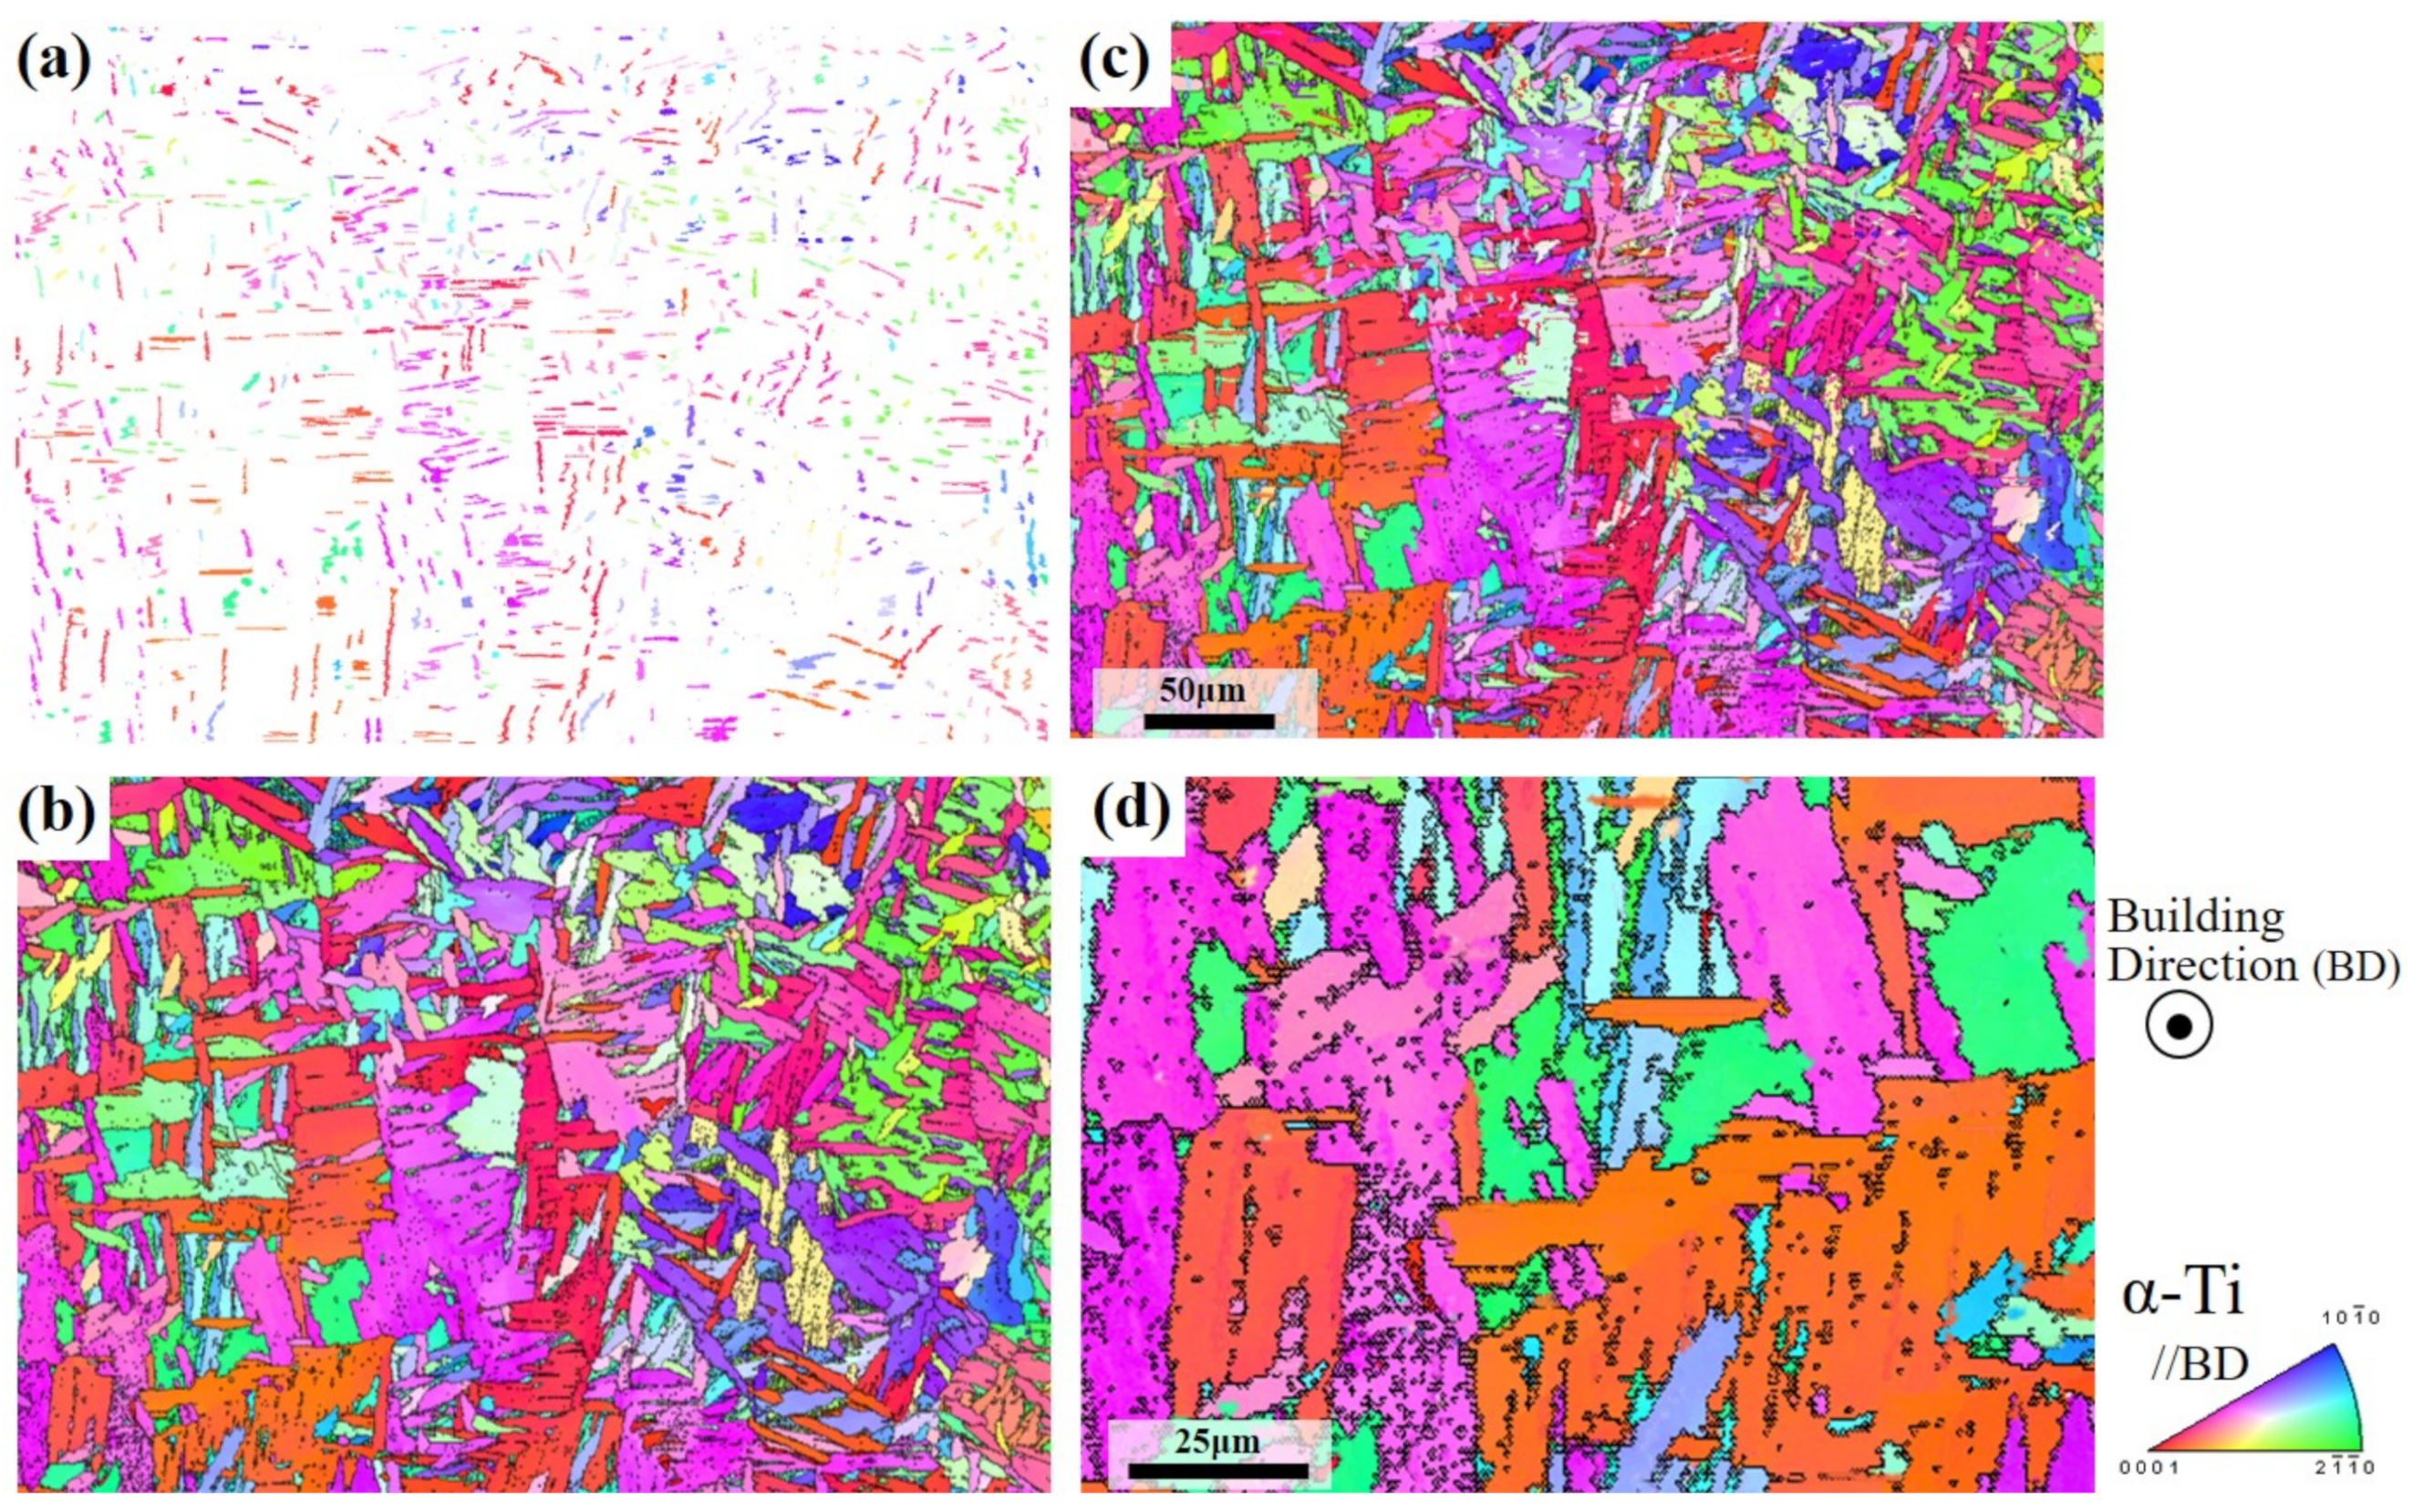
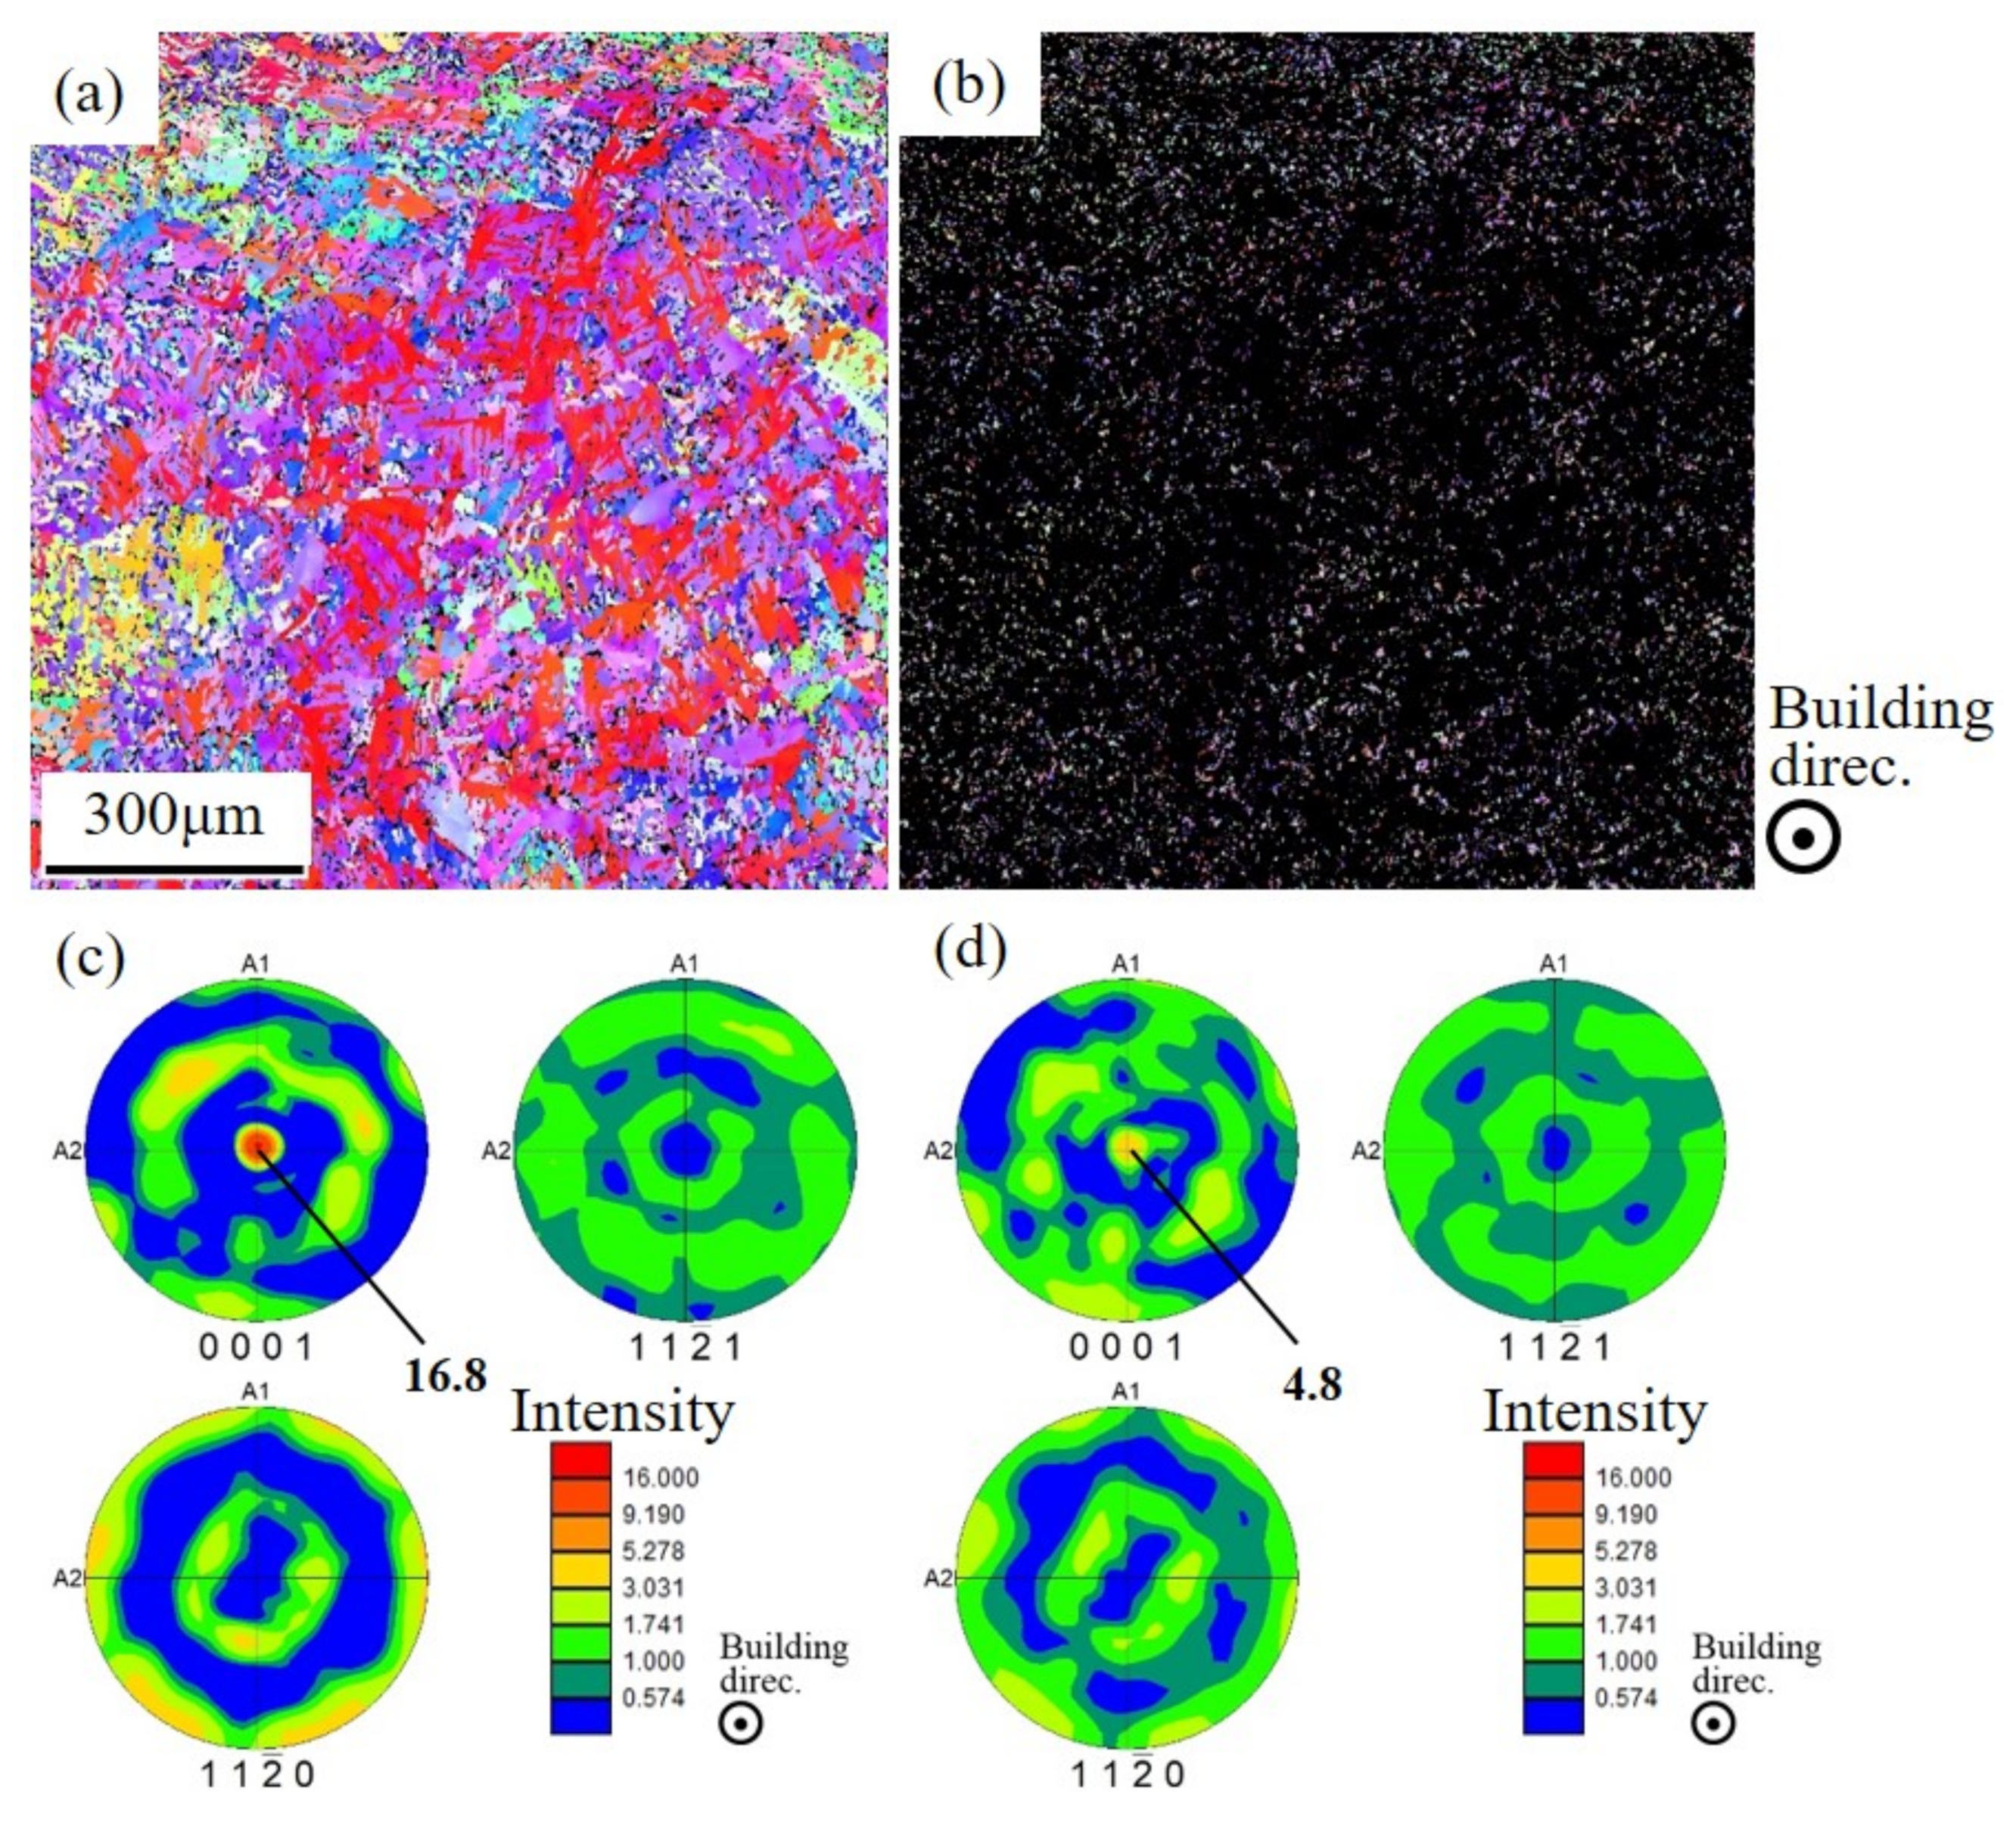
- The rapid solidification phenomena, which is a typical AM powder bed outcome, dictates a unique fine microstructure in as-built material. A heating cycle, analyzed utilizing EBSD, reveals that the smaller grains, which exhibit a weak texture, disappear in the early stage of heating, while the relatively large grains remain at high temperature. Even after cooling from 950 °C, most of the grains remain and coarsen by grain growth, while fine grains as shown in the as-built material are not frequently observed possibly due to a slow cooling rate. Thus, the phase texture develops slightly after a heat treatment with the maximum temperature of 950 °C, where several percentages of phase remain.
- (ii)
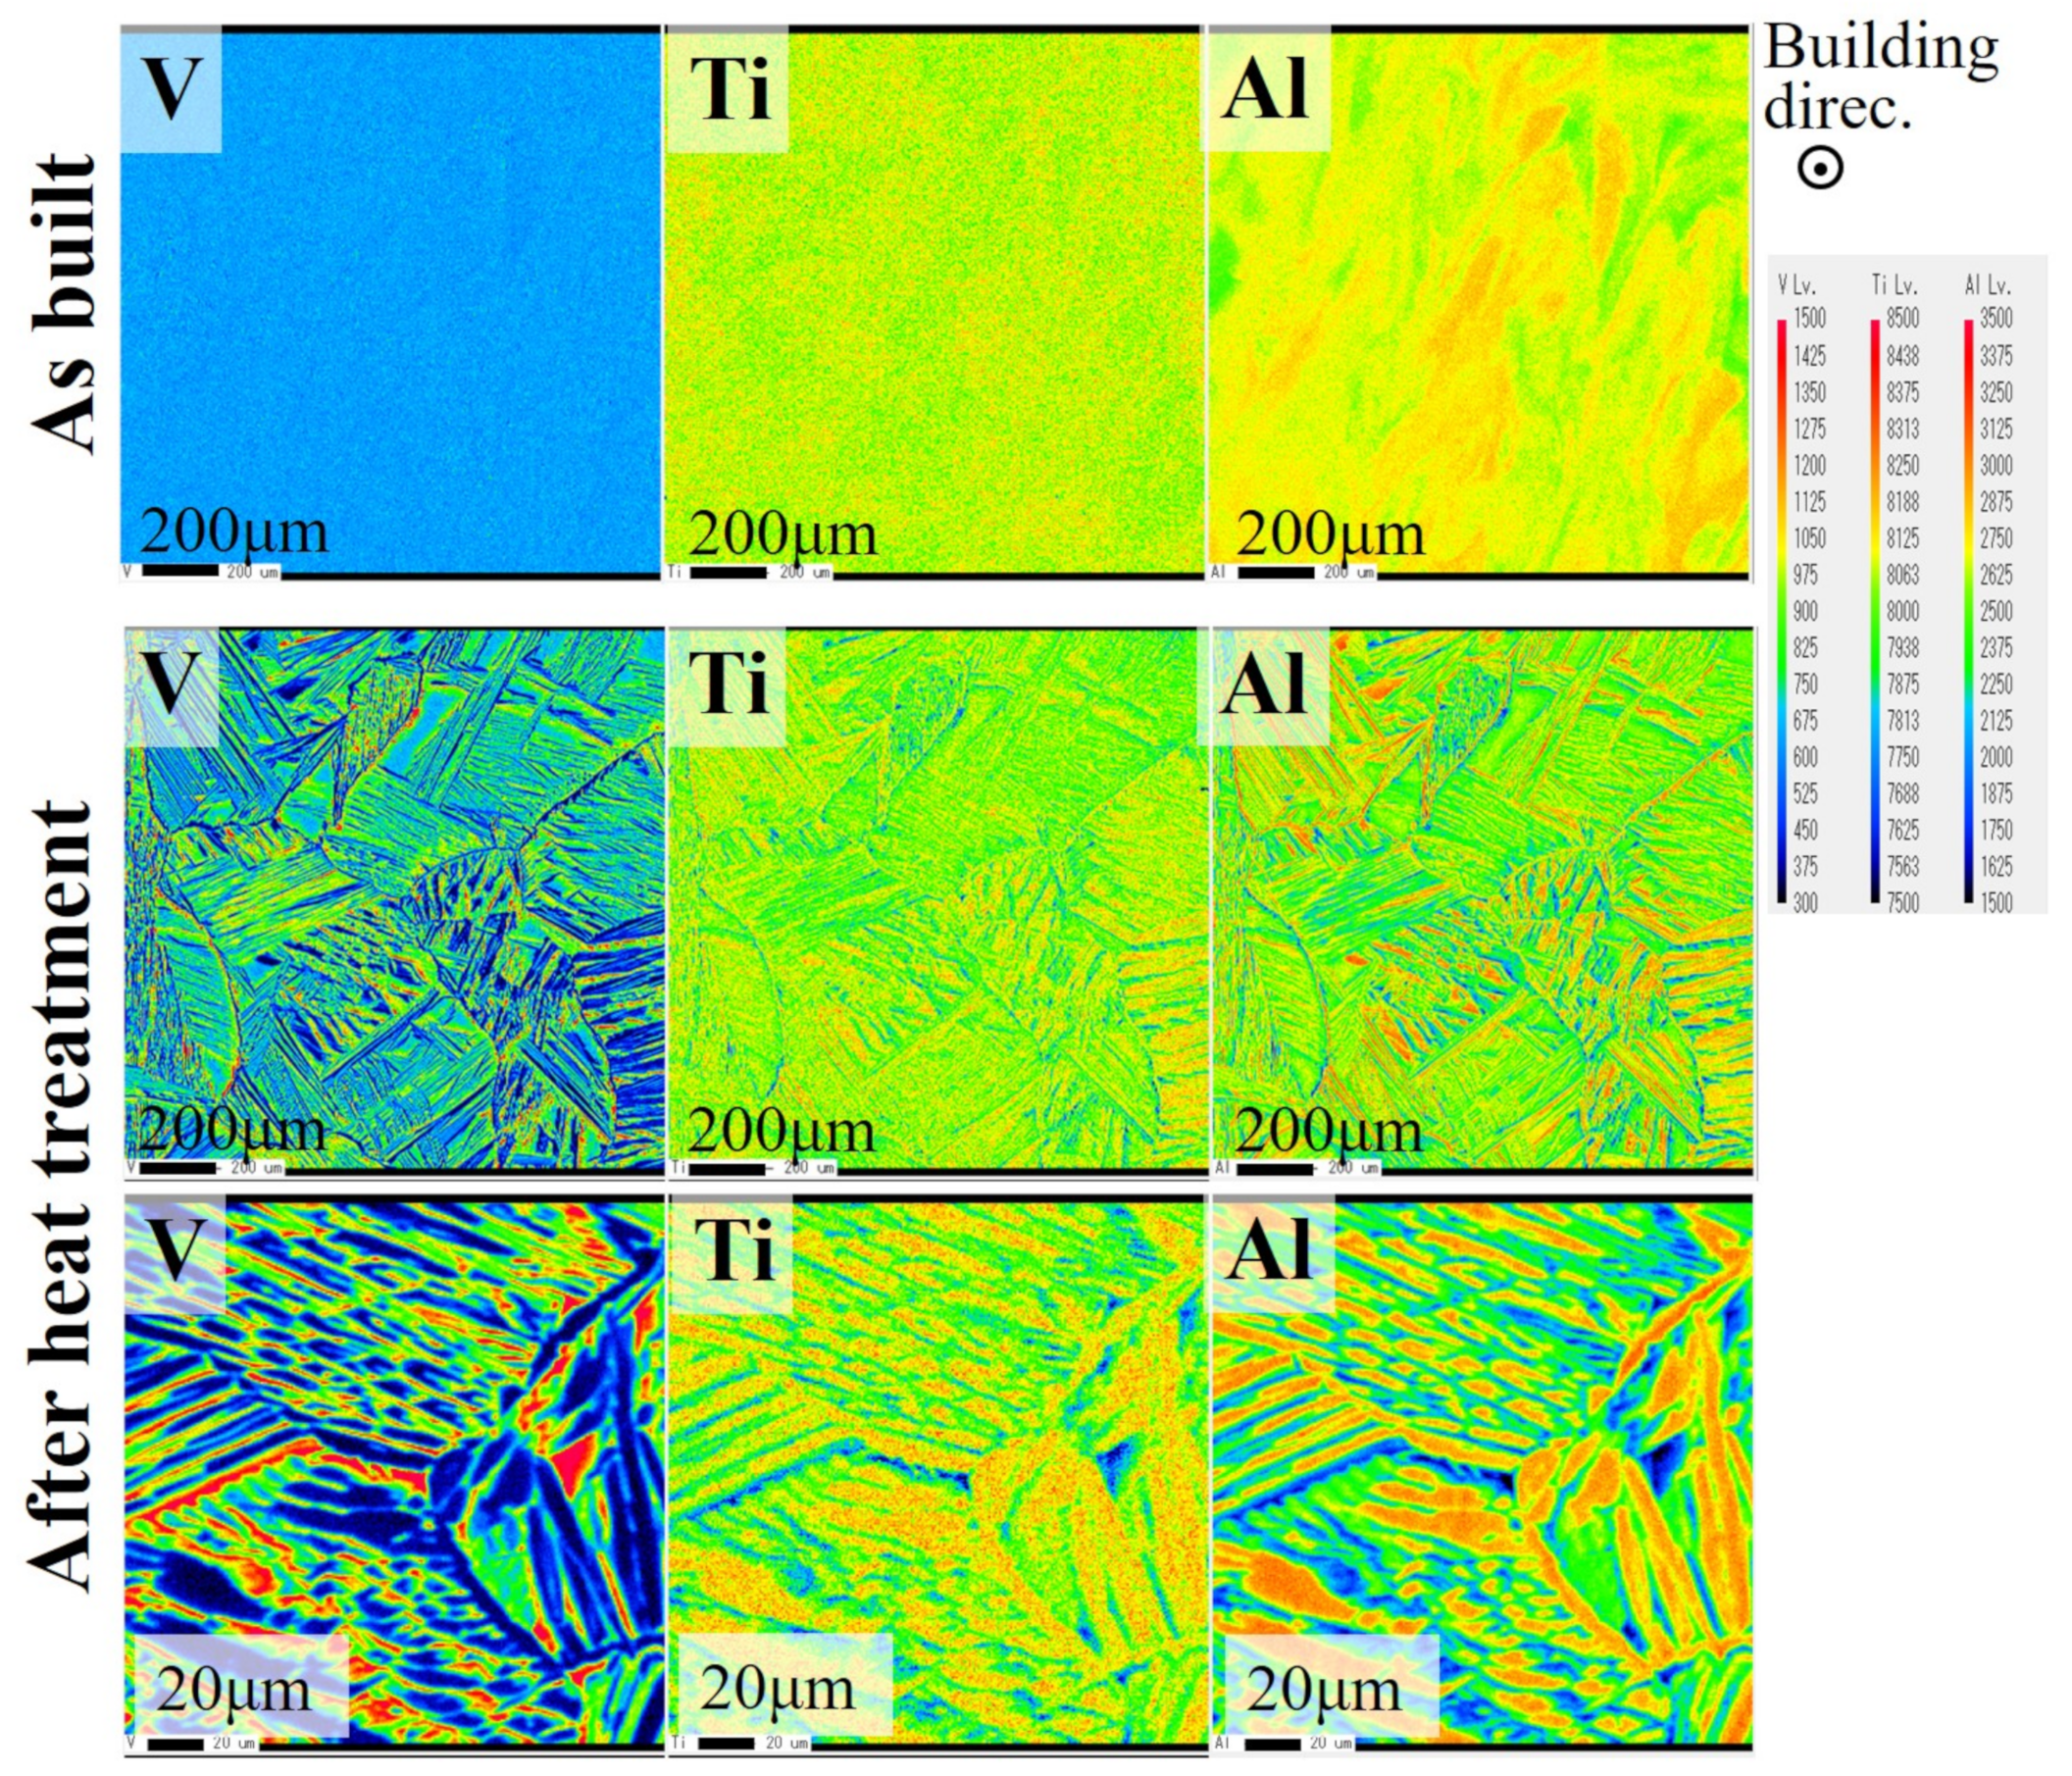
- Vanadium concentrates in the phase after heat treatment, which is not observed in the as-built material. The slow cooling in the heat cycle is considered to allow for the vanadium atoms to diffuse and stabilize the phase, leading to a suppression of nucleation and a few weight percentage points of the retained phase at room temperature.
Author Contributions
Funding
Acknowledgments
Conflicts of Interest
References
- Flower, H. Metal-based composite materials. In High Performance Materials in Aerospace; Springer: Berlin/Heidelberg, Germany, 1995; pp. 227–245. [Google Scholar]
- Tomlin, M.; Meyer, J. Topology optimization of an additive layer manufactured (ALM) aerospace part. In Proceedings of the 7th Altair CAE Technology Conference, Gaydon, UK, 10–12 May 2011; pp. 1–9. [Google Scholar]
- Olakanmi, E.; Cochrane, R.; Dalgarno, K. Progress in materials science a review on selective laser sintering/melting (SLS/SLM) of aluminium alloy powders: Processing, microstructure, and properties. J. Prog. Mater. Sci. 2015, 74, 401–477. [Google Scholar] [CrossRef]
- Liu, S.; Shin, Y.C. Additive manufacturing of Ti6Al4V alloy: A review. Mater. Des. 2019, 164, 107552. [Google Scholar] [CrossRef]
- De Formanoir, C.; Michotte, S.; Rigo, O.; Germain, L.; Godet, S. Electron beam melted Ti–6Al–4V: Microstructure, texture and mechanical behavior of the as-built and heat-treated material. Mater. Sci. Eng. A 2016, 652, 105–119. [Google Scholar] [CrossRef]
- Tan, X.; Kok, Y.; Toh, W.Q.; Tan, Y.J.; Descoins, M.; Mangelinck, D.; Tor, S.B.; Leong, K.F.; Chua, C.K. Revealing martensitic transformation and α/β interface evolution in electron beam melting three-dimensional-printed Ti-6Al-4V. Sci. Rep. 2016, 6, 1–10. [Google Scholar] [CrossRef] [PubMed] [Green Version]
- Tan, X.; Kok, Y.; Tan, Y.J.; Vastola, G.; Pei, Q.X.; Zhang, G.; Zhang, Y.W.; Tor, S.B.; Leong, K.F.; Chua, C.K. An experimental and simulation study on build thickness dependent microstructure for electron beam melted Ti–6Al–4V. J. Alloys Compd. 2015, 646, 303–309. [Google Scholar] [CrossRef]
- Pesach, A.; Tiferet, E.; Vogel, S.C.; Chonin, M.; Diskin, A.; Zilberman, L.; Rivin, O.; Yeheskel, O.; El’ad, N.C. Texture analysis of additively manufactured Ti-6Al-4V using neutron diffraction. Addit. Manuf. 2018, 23, 394–401. [Google Scholar] [CrossRef]
- Bhattacharyya, D.; Viswanathan, G.; Vogel, S.; Williams, D.; Venkatesh, V.; Fraser, H. A study of the mechanism of α to β phase transformation by tracking texture evolution with temperature in Ti–6Al–4V using neutron diffraction. Scr. Mater. 2006, 54, 231–236. [Google Scholar] [CrossRef]
- Lonardelli, I.; Gey, N.; Wenk, H.R.; Humbert, M.; Vogel, S.; Lutterotti, L. In situ observation of texture evolution during α→ β and β→ α phase transformations in titanium alloys investigated by neutron diffraction. Acta Mater. 2007, 55, 5718–5727. [Google Scholar] [CrossRef]
- Sundman, B.; Jansson, B.; Andersson, J.O. The thermo-calc databank system. Calphad 1985, 9, 153–190. [Google Scholar] [CrossRef]
- Al-Bermani, S.; Blackmore, M.; Zhang, W.; Todd, I. The origin of microstructural diversity, texture, and mechanical properties in electron beam melted Ti-6Al-4V. Metall. Mater. Trans. A 2010, 41, 3422–3434. [Google Scholar] [CrossRef]
- Vogel, S.; Takajo, S.; Kumar, M.; Caspi, E.; Pesach, A.; Tiferet, E.; Yeheskel, O. Ambient and High-Temperature Bulk Characterization of Additively Manufactured Ti-6Al-4V Using Neutron Diffraction. JOM 2018, 70, 1714–1722. [Google Scholar] [CrossRef]
- Semiatin, S.; Levkulich, N.; Tiley, J. Effect of Cooling Rate on Microstructure Evolution and Plastic Flow of Ti-6Al-4V. Metall. Mater. Trans. A 2021, 52, 2238–2260. [Google Scholar] [CrossRef]
- Semiatin, S.; Knisley, S.; Fagin, P.; Barker, D.; Zhang, F. Microstructure evolution during alpha-beta heat treatment of Ti-6Al-4V. Metall. Mater. Trans. A 2003, 34, 2377–2386. [Google Scholar] [CrossRef]
- Ter Haar, G.M.; Becker, T.H. Selective laser melting produced Ti-6Al-4V: Post-process heat treatments to achieve superior tensile properties. Materials 2018, 11, 146. [Google Scholar] [CrossRef] [PubMed] [Green Version]
- Chong, Y.; Bhattacharjee, T.; Tsuji, N. Bi-lamellar microstructure in Ti–6Al–4V: Microstructure evolution and mechanical properties. Mater. Sci. Eng. A 2019, 762, 138077. [Google Scholar] [CrossRef]
- Jovanović, M.T.; Tadić, S.; Zec, S.; Mišković, Z.; Bobić, I. The effect of annealing temperatures and cooling rates on microstructure and mechanical properties of investment cast Ti–6Al–4V alloy. Mater. Des. 2006, 27, 192–199. [Google Scholar] [CrossRef]
- Ahmed, T.; Rack, H. Phase transformations during cooling in α+ β titanium alloys. Mater. Sci. Eng. A 1998, 243, 206–211. [Google Scholar] [CrossRef]
- Katzarov, I.; Malinov, S.; Sha, W. Finite element modeling of the morphology of β to α phase transformation in Ti-6Al-4V alloy. Metall. Mater. Trans. A 2002, 33, 1027–1040. [Google Scholar] [CrossRef]
- Obasi, G.; Birosca, S.; Prakash, D.L.; Da Fonseca, J.Q.; Preuss, M. The influence of rolling temperature on texture evolution and variant selection during α→ β→ α phase transformation in Ti–6Al–4V. Acta Mater. 2012, 60, 6013–6024. [Google Scholar] [CrossRef]
- Gey, N.; Humbert, M.; Philippe, M.; Combres, Y. Investigation of the α-and β-texture evolution of hot rolled Ti-64 products. Mater. Sci. Eng. A 1996, 219, 80–88. [Google Scholar] [CrossRef]
- Stanford, N.; Bate, P. Crystallographic variant selection in Ti–6Al–4V. Acta Mater. 2004, 52, 5215–5224. [Google Scholar] [CrossRef]
- Van Bohemen, S.; Kamp, A.; Petrov, R.; Kestens, L.; Sietsma, J. Nucleation and variant selection of secondary α plates in a β Ti alloy. Acta Mater. 2008, 56, 5907–5914. [Google Scholar] [CrossRef]
- Bhattacharyya, D.; Viswanathan, G.; Denkenberger, R.; Furrer, D.; Fraser, H.L. The role of crystallographic and geometrical relationships between α and β phases in an α/β titanium alloy. Acta Mater. 2003, 51, 4679–4691. [Google Scholar] [CrossRef]
- Takajo, S.; Brown, D.W.; Clausen, B.; Gray, G.; Knapp, C.M.; Martinez, D.T.; Trujillo, C.P.; Vogel, S.C. Spatially resolved texture and microstructure evolution of additively manufactured and gas gun deformed 304L stainless steel investigated by neutron diffraction and electron backscatter diffraction. Powder Diffr. 2018, 33, 141–146. [Google Scholar] [CrossRef]
- Tiferet, E.; Ganor, M.; Zolotaryov, D.; Garkun, A.; Hadjadj, A.; Chonin, M.; Ganor, Y.; Noiman, D.; Halevy, I.; Tevet, O.; et al. Mapping the tray of electron beam melting of Ti-6Al-4V: Properties and microstructure. Materials 2019, 12, 1470. [Google Scholar] [CrossRef] [PubMed] [Green Version]
- Wenk, H.R.; Lutterotti, L.; Vogel, S. Texture analysis with the new HIPPO TOF diffractometer. Nucl. Instrum. Methods Phys. Res. 2003, 515, 575–588. [Google Scholar] [CrossRef]
- Vogel, S.C.; Hartig, C.; Lutterotti, L.; Von Dreele, R.B.; Wenk, H.R.; Williams, D.J. Texture measurements using the new neutron diffractometer HIPPO and their analysis using the Rietveld method. Powder Diffr. 2004, 19, 65–68. [Google Scholar] [CrossRef] [Green Version]
- Rietveld, H.M. A profile refinement method for nuclear and magnetic structures. J. Appl. Crystallogr. 1969, 2, 65–71. [Google Scholar] [CrossRef]
- Lutterotti, L.; Matthies, S.; Wenk, H.R.; Schultz, A.; Richardson, J., Jr. Combined texture and structure analysis of deformed limestone from time-of-flight neutron diffraction spectra. J. Appl. Phys. 1997, 81, 594–600. [Google Scholar] [CrossRef]
- Wenk, H.R.; Lutterotti, L.; Vogel, S. Rietveld texture analysis from TOF neutron diffraction data. Powder Diffr. 2010, 25, 283–296. [Google Scholar] [CrossRef] [Green Version]
- Nowell, M.M.; Field, D.P.; Wright, S.I.; Dingley, D.; Scutts, P.; Suzuki, S. Orientation Imaging of Recrystallization, Grain Growth and Phase Transformations using In-Situ Heating. Microsc. Microanal. 2005, 11, 1494–1495. [Google Scholar] [CrossRef] [Green Version]
- Takajo, S.; Merriman, C.; Vogel, S.; Field, D. In-situ EBSD study on the cube texture evolution in 3 wt.% Si steel complemented by ex-situ EBSD experiment—from nucleation to grain growth. Acta Mater. 2019, 166, 100–112. [Google Scholar] [CrossRef]
- Tomida, T.; Vogel, S.C.; Onuki, Y.; Sato, S. Texture Memory in Hexagonal Metals and Its Mechanism. Metals 2021, 11, 1653. [Google Scholar] [CrossRef]
- Burgers, W. On the process of transition of the cubic-body-centered modification into the hexagonal-close-packed modification of zirconium. Physica 1934, 1, 561–586. [Google Scholar] [CrossRef]
- Bunge, H.; Humbert, M.; Welch, P. Texture transformation. Textures Microstruct. 1984, 6, 81–95. [Google Scholar] [CrossRef] [Green Version]
- Bunge, H.J.; Esling, C. Quantitative texture analysis. In Deutsche Gesellschaft fur Metallkunde, v+ 551, 24 x 17 cm, illustrated(DM 168. 00; DGM Informationsgesellschaft: Oberursel, Germany, 1982. [Google Scholar]
- Inoue, H. Standardization of Measurement and Representation in Texture Analysis. Mater. Jpn. 2001, 40, 589–591. (In Japanese) [Google Scholar] [CrossRef]
- Tomida, T.; Wakita, M.; Yasuyama, M.; Sugaya, S.; Tomota, Y.; Vogel, S. Memory effects of transformation textures in steel and its prediction by the double Kurdjumov–Sachs relation. Acta Mater. 2013, 61, 2828–2839. [Google Scholar] [CrossRef]
- Zeng, L.; You, C.; Wang, C.; Zhang, X.; Liang, T. Simultaneously enhancing the strength and ductility of lamellar Ti–6Al–4V alloy via designing hierarchical 3D nanolayered structure. Mater. Lett. 2020, 261, 127020. [Google Scholar] [CrossRef]
- Safdar, A.; Wei, L.Y.; Snis, A.; Lai, Z. Evaluation of microstructural development in electron beam melted Ti-6Al-4V. Mater. Charact. 2012, 65, 8–15. [Google Scholar] [CrossRef]
- Gil, F.; Ginebra, M.; Manero, J.; Planell, J. Formation of α-Widmanstätten structure: Effects of grain size and cooling rate on the Widmanstätten morphologies and on the mechanical properties in Ti6Al4V alloy. J. Alloys Compd. 2001, 329, 142–152. [Google Scholar] [CrossRef]
- Zhang, S.; Li, J.; Kou, H.; Yang, J.; Yang, G.; Wang, J. Effects of thermal history on the microstructure evolution of Ti-6Al-4V during solidification. J. Mater. Process. Technol. 2016, 227, 281–287. [Google Scholar] [CrossRef]
- Senkov, O.; Valencia, J.; Senkova, S.; Cavusoglu, M.; Froes, F. Effect of cooling rate on microstructure of Ti-6Al-4V forging. Mater. Sci. Technol. 2002, 18, 1471–1478. [Google Scholar] [CrossRef]
- Filip, R.; Kubiak, K.; Ziaja, W.; Sieniawski, J. The effect of microstructure on the mechanical properties of two-phase titanium alloys. J. Mater. Process. Technol. 2003, 133, 84–89. [Google Scholar] [CrossRef]
- Neikter, M.; Åkerfeldt, P.; Pederson, R.; Antti, M.L.; Sandell, V. Microstructural characterization and comparison of Ti-6Al-4V manufactured with different additive manufacturing processes. Mater. Charact. 2018, 143, 68–75. [Google Scholar] [CrossRef]
- Zeng, L.; Bieler, T. Effects of working, heat treatment, and aging on microstructural evolution and crystallographic texture of α, α′, α′′ and β phases in Ti–6Al–4V wire. Mater. Sci. Eng. A 2005, 392, 403–414. [Google Scholar] [CrossRef]
- Wang, X.; Chou, K. EBSD study of beam speed effects on Ti-6Al-4V alloy by powder bed electron beam additive manufacturing. J. Alloys Compd. 2018, 748, 236–244. [Google Scholar] [CrossRef]


| Element | Al | V | O | C | H | Fe | Ti |
|---|---|---|---|---|---|---|---|
| Original powder (ASTM F2924) | 5.50–6.75 | 3.5–4.5 | <0.2 | <0.08 | <0.0015 | <0.3 | Balance |
| Used powder | 6.5 ± 0.13 | 3.86 ± 0.04 | 0.34 ± 0.01 | 0.031 ± 0.001 | 0.0027 ± 0.0008 | 0.27 ± 0.05 | 89.0 ± 0.22 |
| Properties | Young’s Modulus /GPa | Proof Stress /MPa | Tensile Strength /MPa | Elongation /% | Reduction of Area /% | Number of Materials |
|---|---|---|---|---|---|---|
| ASTM F2914 requirements | min.825 | min.895 | min.10 | min.15 | ||
| Average and standard deviation | 118.8 ± 3.8 | 1036 ± 17 | 1122 ± 22 | 9.8 ± 3.8 | 11.5 ± 5.6 | 12 |
| Phase Transformation | Type | Rotation between Adjacent Grains | Number Ratio | ||
|---|---|---|---|---|---|
| Angle | Axis | Deviation from 〈110〉 | |||
| → | I | 10.5° | c-axis | 90° | 1 |
| II | 60° | 〈20〉 | 0° | 2 | |
| III | 60.8° | 〈71〉 | 10.4° | 4 | |
| IV | 63.3° | 〈41〉 | 17.6° | 2 | |
| V | 90° | 〈70〉 | 5.3° | 2 | |
| → | I | 10.5° | 〈110〉 | - | 1 |
| II | 49.5° | 〈110〉 | - | 1 | |
| III | 60° | 〈111〉 | - | 1 | |
| IV | 60° | 〈110〉 | - | 2 | |
Publisher’s Note: MDPI stays neutral with regard to jurisdictional claims in published maps and institutional affiliations. |
© 2021 by the authors. Licensee MDPI, Basel, Switzerland. This article is an open access article distributed under the terms and conditions of the Creative Commons Attribution (CC BY) license (https://creativecommons.org/licenses/by/4.0/).
Share and Cite
Takajo, S.; Tomida, T.; Caspi, E.N.; Pesach, A.; Tiferet, E.; Vogel, S.C. Property Improvement of Additively Manufactured Ti64 by Heat Treatment Characterized by In Situ High Temperature EBSD and Neutron Diffraction. Metals 2021, 11, 1661. https://doi.org/10.3390/met11101661
Takajo S, Tomida T, Caspi EN, Pesach A, Tiferet E, Vogel SC. Property Improvement of Additively Manufactured Ti64 by Heat Treatment Characterized by In Situ High Temperature EBSD and Neutron Diffraction. Metals. 2021; 11(10):1661. https://doi.org/10.3390/met11101661
Chicago/Turabian StyleTakajo, Shigehiro, Toshiro Tomida, El’ad N. Caspi, Asaf Pesach, Eitan Tiferet, and Sven C. Vogel. 2021. "Property Improvement of Additively Manufactured Ti64 by Heat Treatment Characterized by In Situ High Temperature EBSD and Neutron Diffraction" Metals 11, no. 10: 1661. https://doi.org/10.3390/met11101661