1. Introduction
Powder bed fusion (PBF) additive manufacturing (AM), or 3D printing, is a recent advanced manufacturing process that has been widely used in various industries. During PBF, an energy beam fully and rapidly fuses the powder in a selective path instructed by a program that interpret the parts designer’s instruction in 3D computer-aided design (CAD) models [
1,
2]. Through geometry optimization of the parts made by PBF techniques, lighter and more complex precision parts can be produced [
3]. In a laser based PBF technique or selective laser melting (SLM), a high energy laser beam scans the powder layer based on a sliced model of a CAD file. This results in rapid melting and solidification of the metallic powder. The fabrication bed will then move down by a certain distance, and another layer of the metal powder will be deposited and the high-power laser beam scans continuously layer by layer to achieve the final part [
4,
5]. The non-fused metal powder remains in the build chamber and can be collected and reused for the next manufacturing project. By using this laser beam welding process, it is possible to achieve a fully dense structure [
6,
7].
Ti-6Al-4V alloy is a printable alloy and is extensively used in PBF-AM for a wide range of applications due to its high strength to weight ratio, biocompatibility, and high corrosion resistance [
8]. However, wear resistance of titanium alloys was proved to be poor due to their low shear strength and low work hardening, as well as weak surface oxides protection due to friction heat [
9,
10] and poor abrasion resistance [
11,
12]. To improve the wear resistance of a Ti-6Al-4V alloy, different surface modification techniques can be used. Ion implantation is an important technique to improve the surface hardness and wear resistance of samples. Ion implantation can provide a gradual transition layer (typically less than 1 μm thickness) by altering the chemical and mechanical properties of the near surface material. This can reduce the risk of delamination of the discontinuous layer resulted from the poor adhesion strength [
13].
Ion-implantation is a low temperature process used to modify surfaces. Ions are accelerated to the desired energy and penetrate the surface of the target material. The depth of the modified surface is determined by ion-solid interactions as a function of acceleration energy and the mass of the ion and the atoms in the target. This enables the change of the chemical and physical properties of the modified layer, which can be employed to enhance wear resistance [
14,
15].
Ion implantation of Ca, P, C, CO, and N successfully increases the wear resistance of titanium alloys [
16,
17,
18]. These processes improve wear and/or corrosion resistance of the titanium alloy surface by forming a hard wear-resistant material on the surface. Due to its abundance in nature, the ability to improve surface properties, and the direct formation of the stable phase without subsequent treatment, N ion implantation has been studied extensively. There are few articles discussing the ion implantation of Ti-6Al-4V and its influence on wear performance. In a comprehensive review by Rautray et al. [
18], it is generally believed that a significant improvement of wear resistance can be achieved by N ion implantation on Ti-alloys. In this review, a particular example from Boampong et al. [
19] on the effect of ion implantation on improving wear resistance has been discussed in detail. Boampong et al. [
19] applied a dose of 2 × 10
17 N
+ ions/cm
2 at an energy of 100 keV to Ti-6Al-4V alloy and conducted sliding wear tests on the ion implanted samples with ultra-high molecular weight polyethylene (UHMWPE) pins as counter material. They observed that TiN precipitate formed on the Ti-6Al-4V surface can stabilize the outer oxide layer and thus reduce the removal of oxide particles from the surface, which can reduce the wear of both Ti-6Al-4V plate and UHMWPE pin. However, the precise mechanism that retards the onset of abrasive wear is not yet clear.
Fabre et al. [
20] have conducted Ti-6Al-4V/UHMWPE wear testing based on a range of N
+ fluences at an energy of 40 keV. The fluence of 2 × 10
17 N
+ ions/cm
2 was found optimal for wear resistance associated with the formation of Ti
2N. Higher fluences cause the formation of the harder, but less wear resistant TiN phase. It should be noted that the conditions (particularly the accelerating voltage) in Fabre et al.’s work [
20] are different from that used in Boampong et al.’s [
19] work (Boampong et al. used Zymet Z-100 device and 100 keV voltage, while the device in Fabre et al.’s [
20] work is Varian DF4 and the voltage is 40 keV). In addition, the authors [
19,
20] used UHMWPE and ion implanted or unmodified Ti-6Al-4V as wear couple in their sliding wear tests. However, the material properties for ceramic or metal are quite different to polymer material, and adhesive and abrasive wear behaviours during wear tests of Ti-6Al-4V/ceramic or Ti-6Al-4V/metal should be very different from those of Ti-6Al-4V/polymer wear test [
2]. Whether Boampong et al. [
19] or Fabre et al. [
20]’s findings could be extended to current Ti-6Al-4V sliding over a metallic counterface is uncertain. A further confusion may need to be pointed out. In a recent overview [
21] of the topic on surface modification of Ti-alloys, the condition of the dose of 1 × 10
17 N
+ ions/cm
2 has been referred to as the best condition, citing Rautray et al.’s review [
18]. This dose is half the dose mentioned in [
19,
20] which was stated as the best N
+ ions dose condition. The limited studies and data reviewed above may have suggested that N ion implantation should provide wear resistance, but when a dosage of ≤2 × 10
17 N
+ ions/cm
2 is applied, the effect is not significant. A dosage of significantly higher than 2 × 10
17 N
+ ions/cm
2 should result in a significant effect on increasing wear resistance. Furthermore, although ion implantation is a well-established surface engineering process, wear testing of ion implanted SLMed Ti-6Al-4V samples have seldom been conducted.
Therefore, two aspects of wear of ion implanted Ti-6Al-4V samples have not been fully understood. The first is the detail of wear mechanisms of the ion implanted Ti-6Al-4V samples in contact with a metallic counterface; the second is the lack of understanding, comparing SLM samples to the more conventionally processed Ti-6Al-4V samples with the latter having considerably lower hardness. Thus, through a comprehensive series of wear testing and analysis, this study aims to understand the tribological behaviours of the Ti-6Al-4V samples processed by SLM and further surface treated by N ion implantation. We are specifically focusing on how the coating performance is affected by the substrate hardness and how the coating may fail as wear testing progresses.
2. Materials and Methods
Ti-6Al-4V alloy was manufactured using the SLM process with an AM400 Renishaw machine (Wotton-under-Edge, UK). These additively manufactured specimens were processed using optimum machine parameters to achieve nearly fully dense specimens. The main process parameter and their values are listed in
Table 1. The spherical Ti-6Al-4V powders for SLM process were obtained from Renishaw with powder size distribution of 20–45 μm. The melting point of the powder was 1605–1660 °C, with a relative density of 4.43 (H
2O = 1). The powder comprised titanium mass fraction up to 90% alloyed with aluminium up to 6.75% and vanadium up to 4.5%, along with other minor elements.
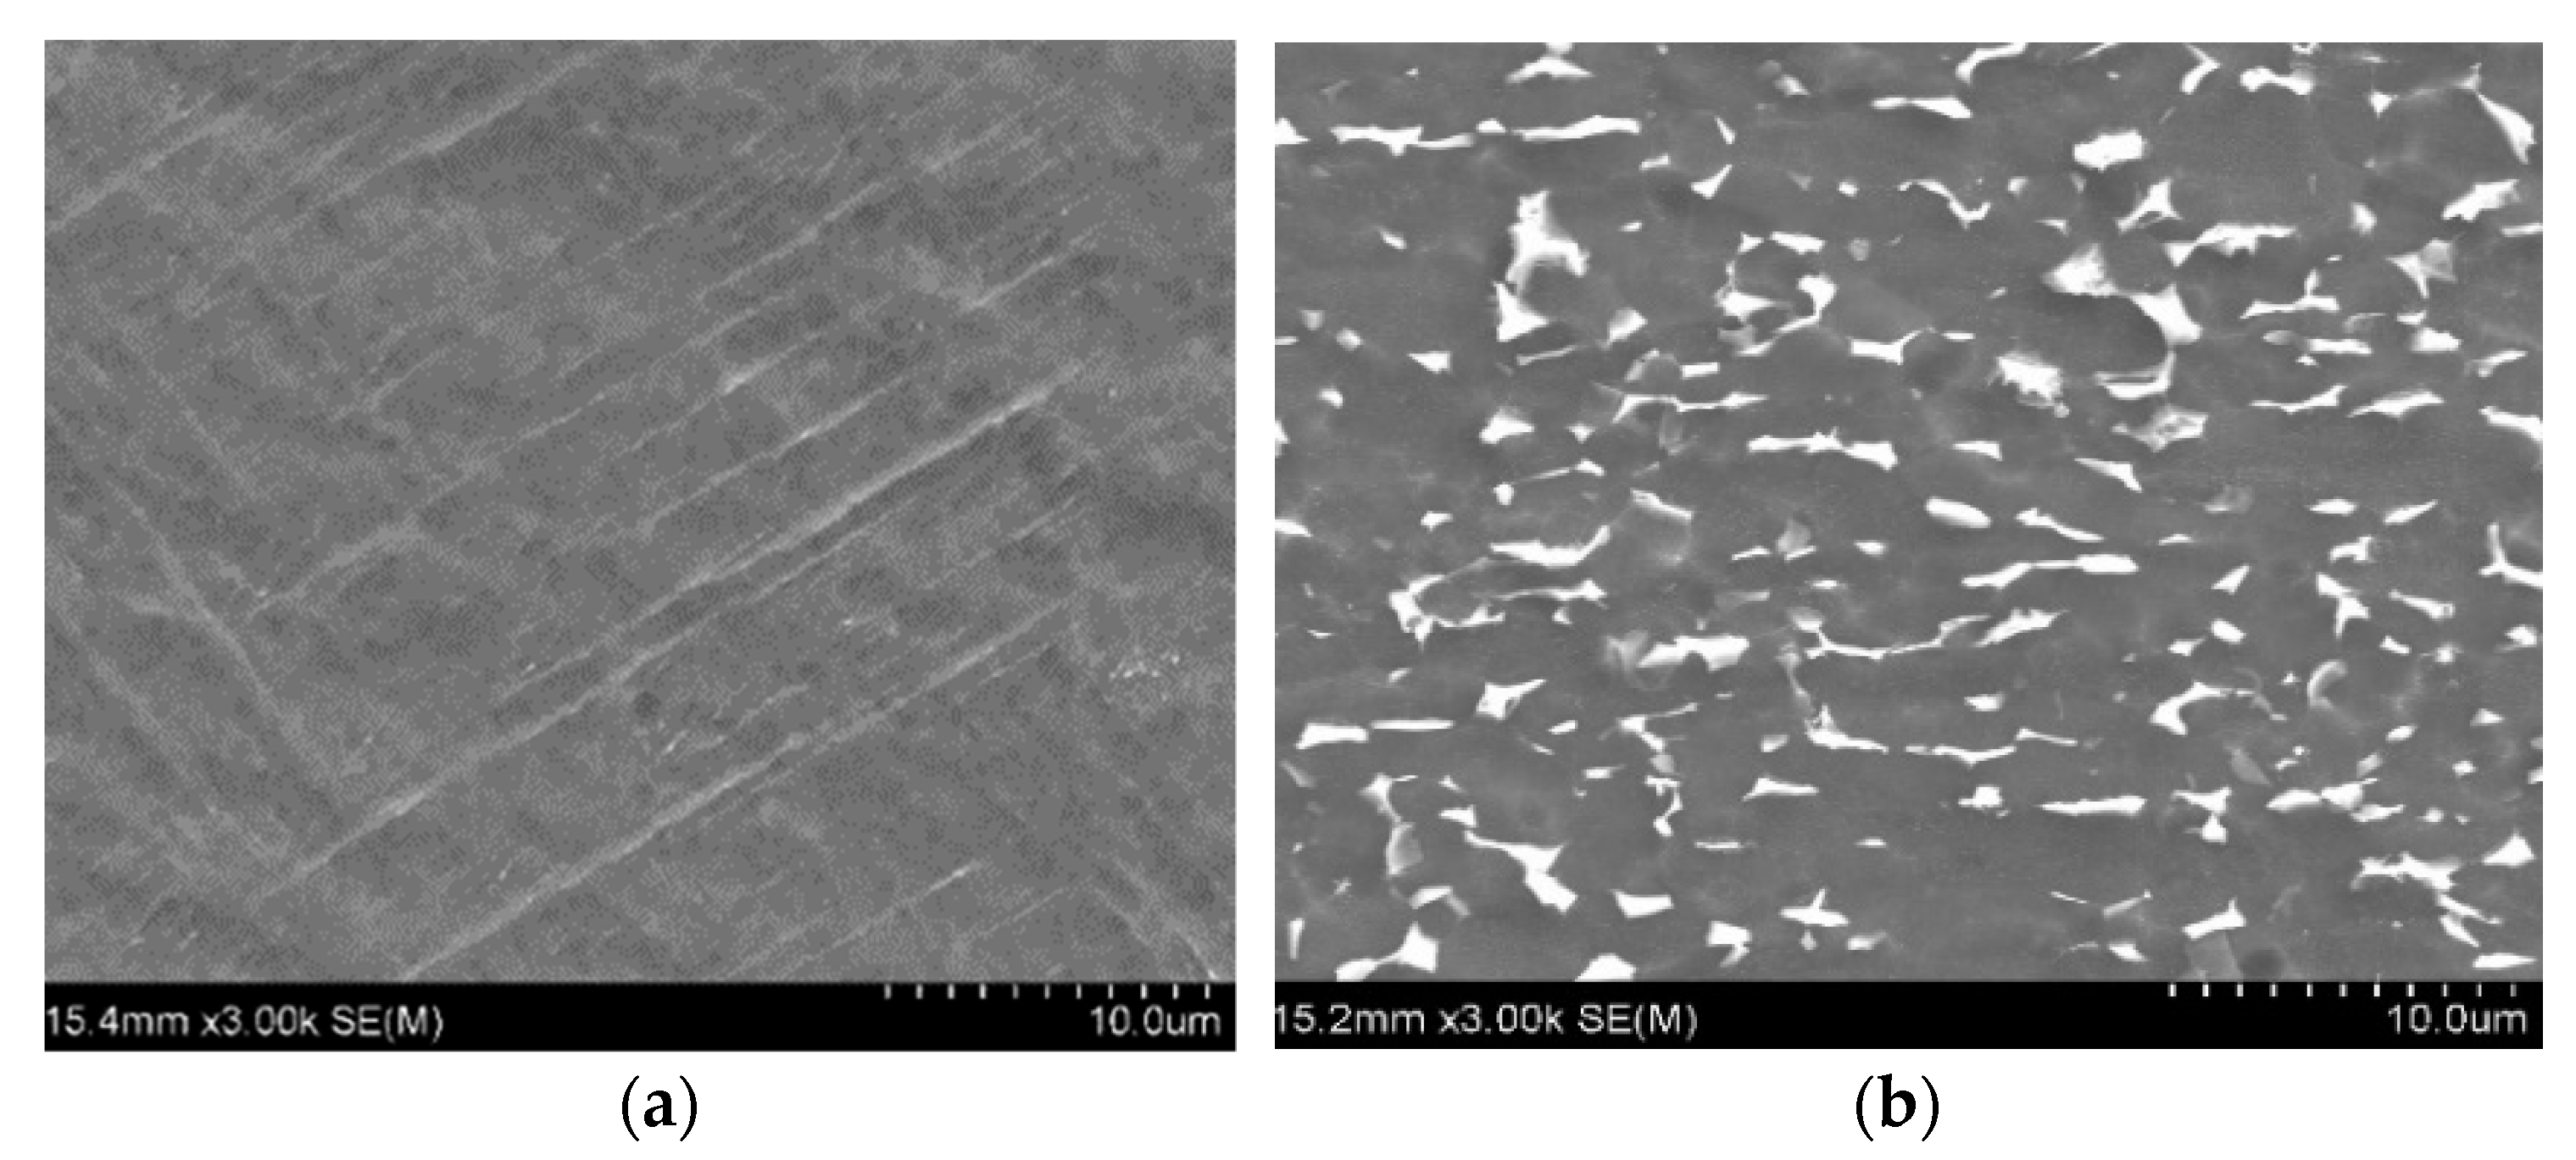
Conventionally processed (CP) specimens were sectioned from an annealed titanium grade 5 plate according to ASTM B265 standard. The microstructures of the SLM and CP Ti-6Al-4V samples are shown in
Figure 1. A martensite α’ acicular structure can be observed in SLM specimens, while a “short fibrous” β in α matrix structure was observed for CP specimens. Samples were polished and tested with a Leco LM-800AT microhardness tester using a load of 1kgf. The average of 10 measurements showed a microhardness of 428 ± 17 HV for SLM specimens, and 324 ± 8 HV for CP specimens.
A Linear Reciprocating Tribometer (Ducom TR-282, Bohemia, NY, USA) was used with ball on plate configuration to conduct dry sliding wear tests. The samples were tightly fixed into the equipment sample bed, the counter material is grasped by the holder and be driven by a motor to reciprocally move on the sample surface. A 10 mm diameter WC-Co (WC: 92%, Co: 8%, 90–92 HRC) ball was used as counter material for all sliding wear tests. The real time coefficient of friction (COF) was automatically recorded by the device during the tests. By observing the COF curve, it is convenient to identify the wear surface changes during the wear tests. Before surface treatment (ion-implantation), all specimens were ground by SiC grinding papers until grit-2400 to achieve an average surface roughness (Ra) of ~0.05 µm measured using a Taylor Hobson Talysurf stylus profilometer (Taylor Hobson, Berwyn, PA, USA).
For ion-implantation surface treatment, polished samples were cut into 12 mm × 10 mm × 5 mm pieces in order for them to be ion-implanted by GNS Science, New Zealand [
22,
23]. N
2+ and N
+ were implanted at an energy of 70 keV to a nitrogen fluence of 6 × 10
17 at/cm
2 (For N
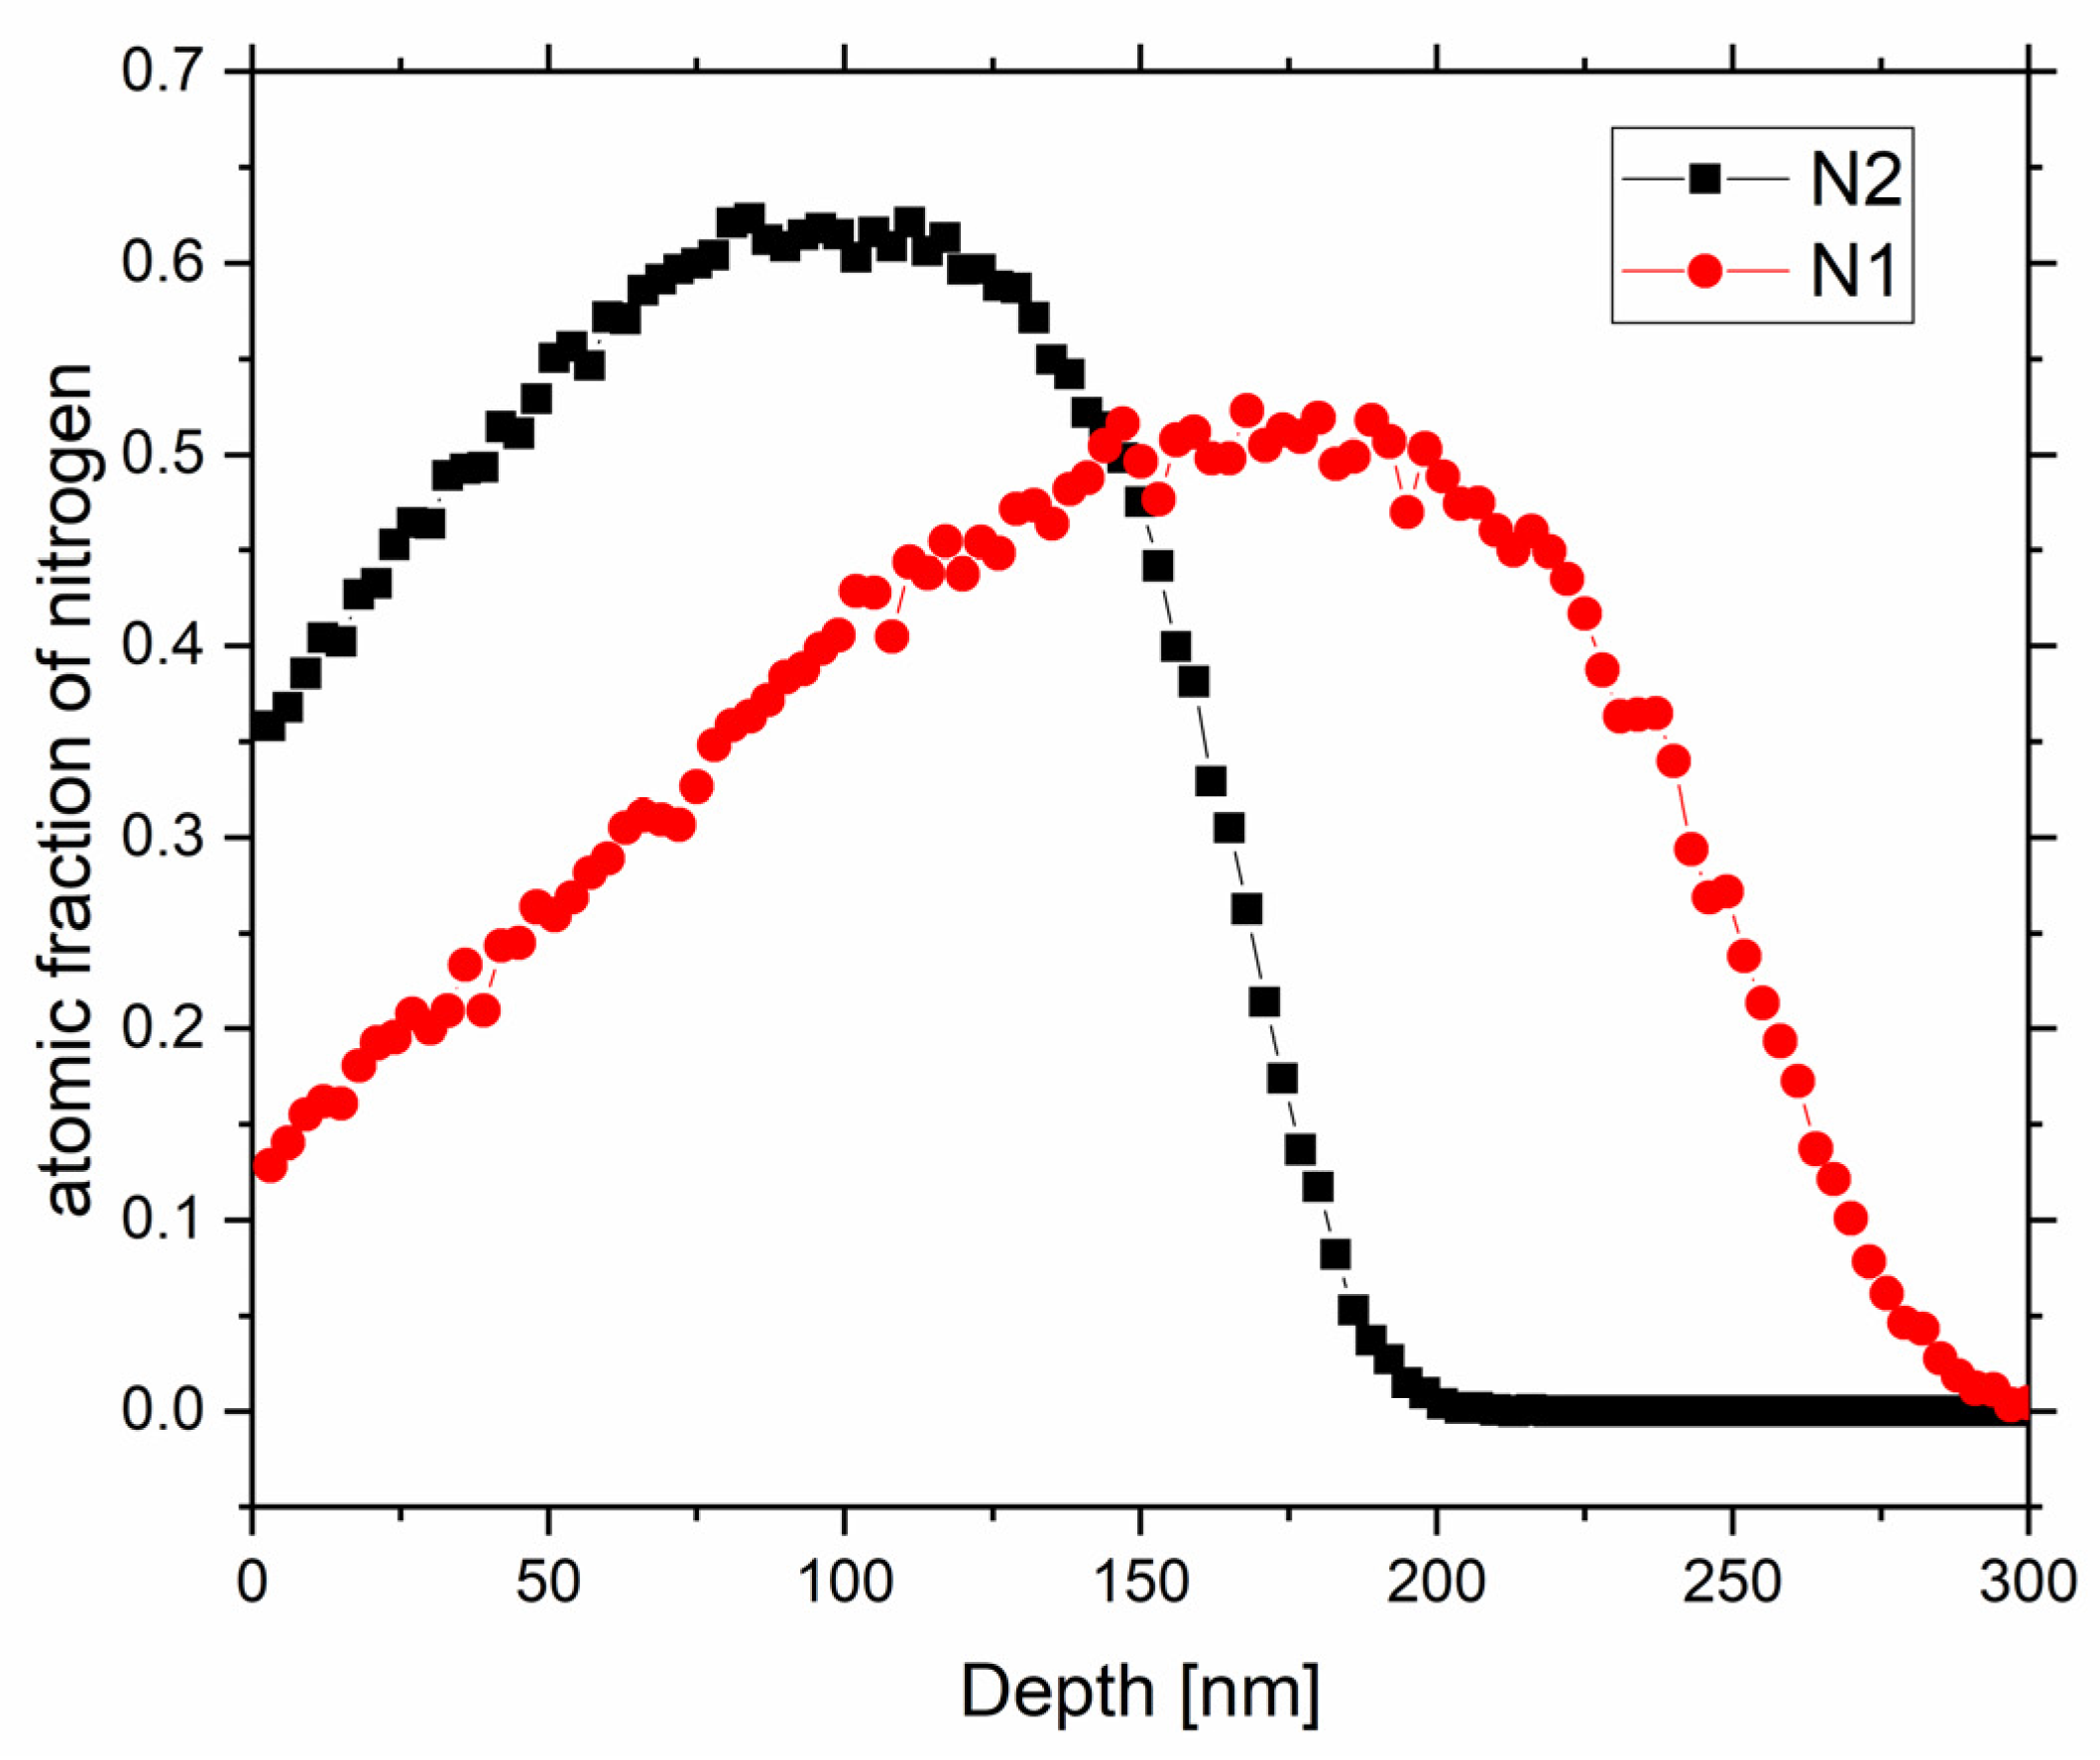
2+ this corresponds to an effective energy of 35 keV). The fluence is measured by a charge counter and homogeneity of the implantation is ensured by scanning the ion beam. The target was cooled to a temperature of −15 °C to avoid heating of the Ti-6Al-4V alloy during ion implantation. The nitrogen distribution in the substrate was simulated by the Monte-Carlo based Dynamic Transport and Range of Ions in Matter (DTRIM) program [
24]. The 300 nm thick target was separated into 100 channels of 3 nm thickness. In both cases 6 × 10
5 atoms in an area of 10 × 10 nm
2 was simulated. The angle of incidence was perpendicular to the substrates surface. The used acceleration energy was 70 keV (N1) and 35 keV (N2). Additional element-specific input parameters are provided in
Table 2. The obtained depth distributions are shown in
Figure 2, where N1 refers to N
+ ion implantation and N2 refers to N
2+ ion implantation.
To test the difference of the two ion-implanted methods, nanoindentation was used. Nanoindentation was conducted by a TI 950 Triboindenter (Bruker, MA, USA), and five test places evenly distributed on the sample surface were selected for each test sample. For each place, six loads were applied (1000 μN, 2000 μN, 4000 μN, 6000 μN, 8000 μN, and 10,000 μN) on six points, respectively. The hardness of the material is measured by how deep (hn-i) the indenter penetrates under a specific maximum load (Pmax). The average value of hn-i by 5 times tests under each applied Pmax was obtained for each test sample.
All sliding wear tests were conducted using 1 N load, 2 Hz and 40 m total wear distance with a sliding stroke of 10 mm. After testing, the samples were first checked by an Olympus SZX9 stereomicroscope to roughly know the shape of the track or the coating status, and then wear volumes (WV) were estimated. Wear volume measurements were carried out by taking 15 cross sectional profiles evenly distributed along each wear track using the Taylor Hobson stylus profilometer. The cross-sectional profiles were then converted to cross-sectional areas using ImageJ software. The software can also measure the depth and width of a profile at the same time. The average value of these cross-sectional areas was then multiplied by the wear track length to achieve the WV of the track. The wear rate (WR) is then calculated by dividing the wear volume by the sliding distance. Wear tracks were examined using a Hitachi SU-70 field emission scanning electron microscope (FE-SEM) to investigate the wear mechanisms and fracture of the coat layer.
3. Results and Discussions
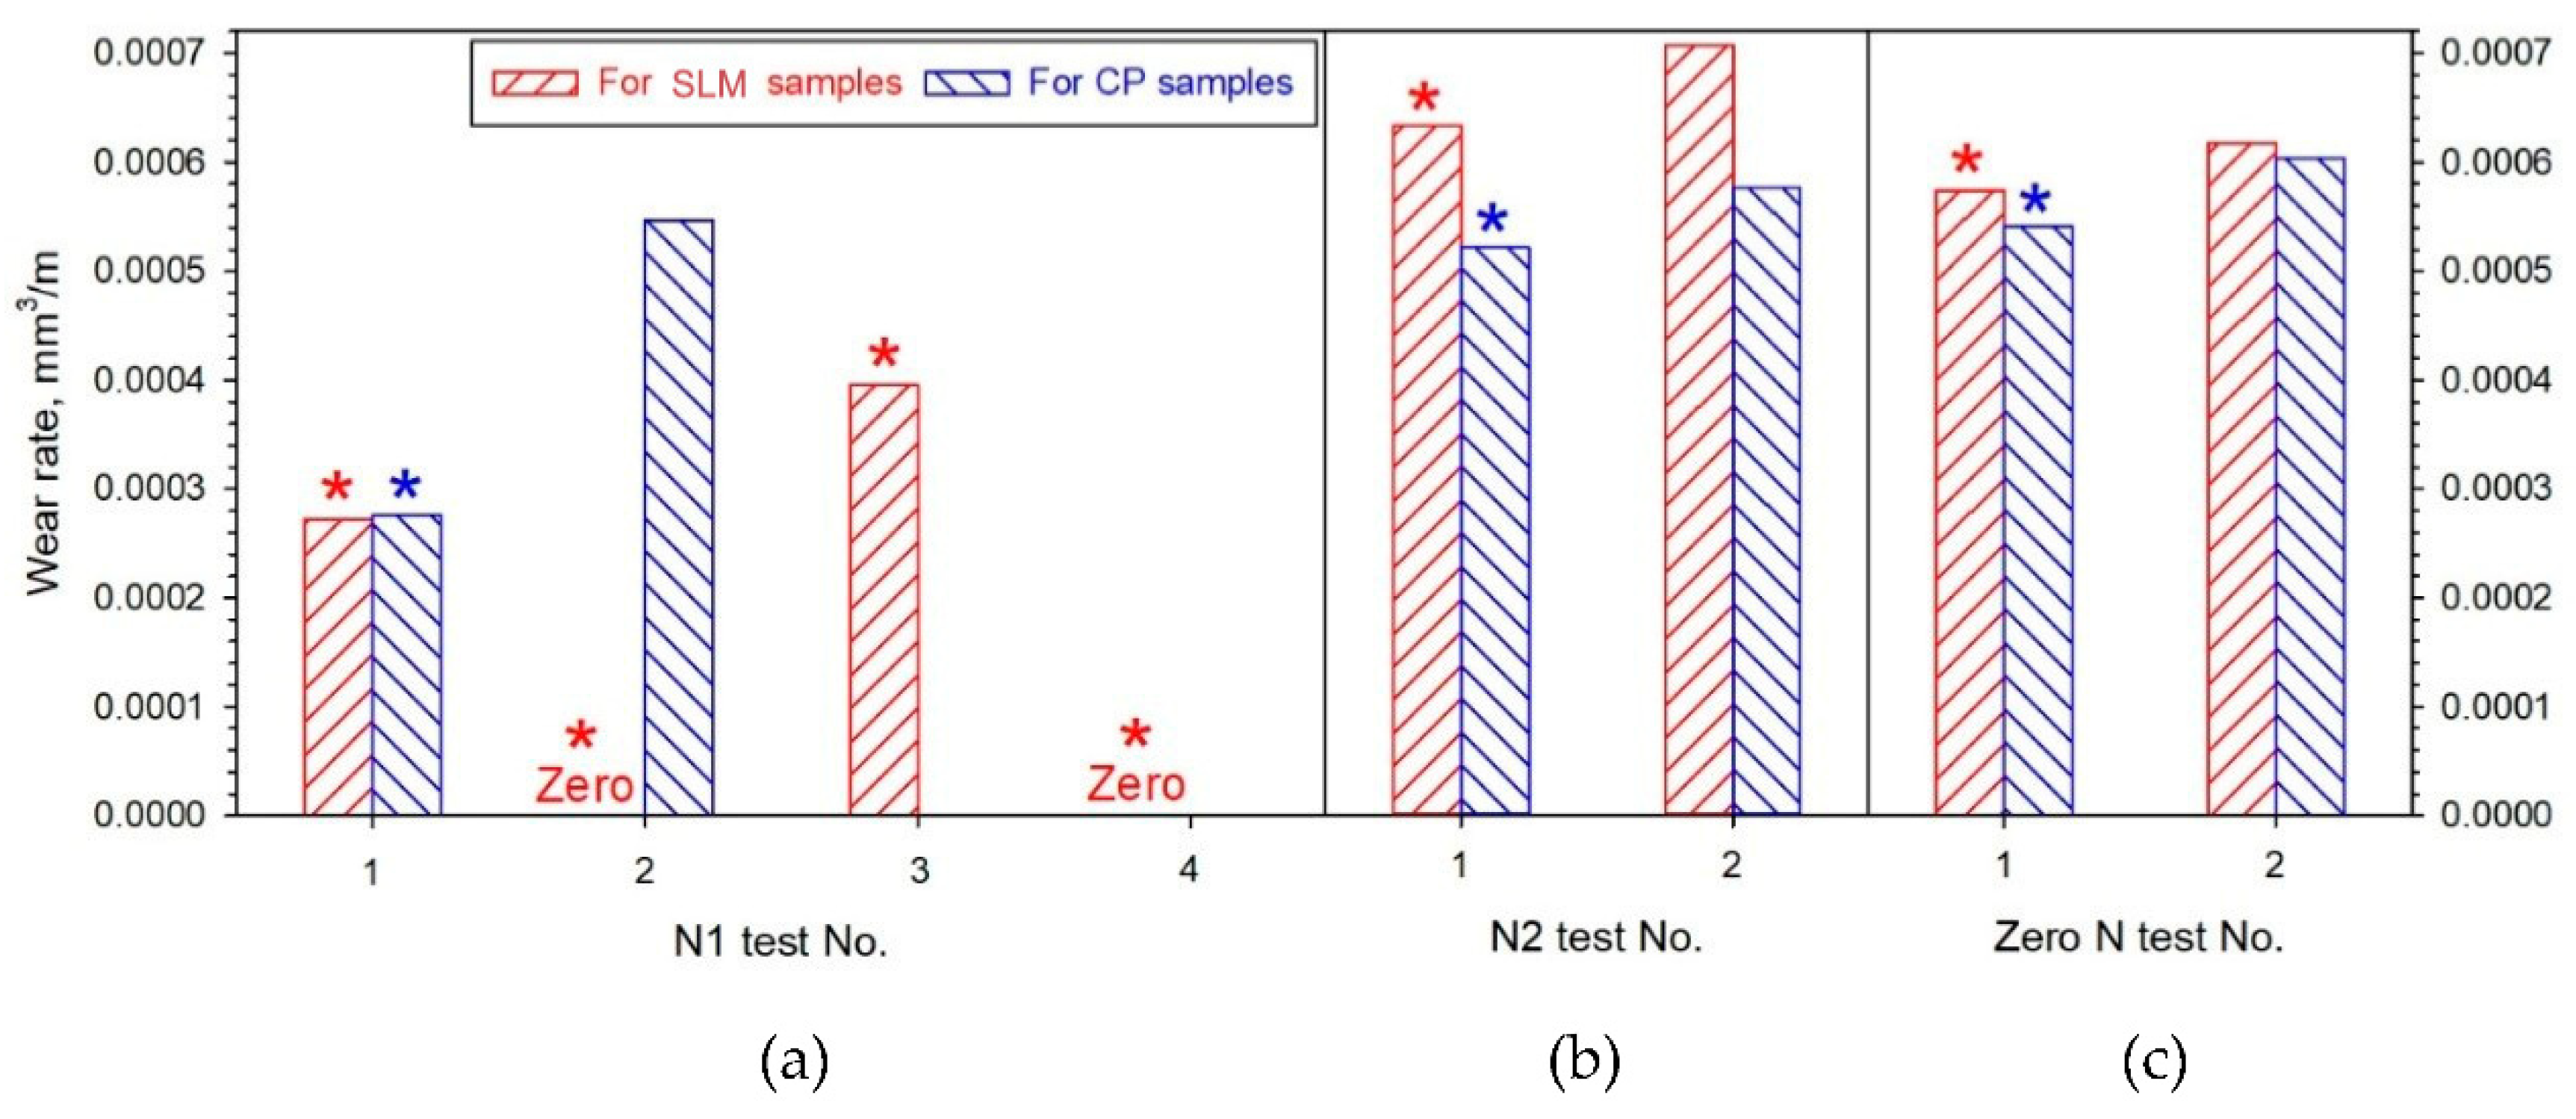
Wear rate data are presented in
Figure 3. For each N-sample condition, we planned to conduct duplicate tests. However, for the N1-SLM condition, the second test resulted in zero wear rate, meaning a non-measurable loss. Thus, two more tests were conducted for this condition. Again, measurable amount of wear was detected in one test and non-measurable wear loss was found in the other, as shown in
Figure 3a. For all other conditions, as shown in
Figure 3, notable wear has taken place for the set wear distance, and wear loss could readily be measured for each sample of duplicate tests for each condition.
Comparing data for CP samples in
Figure 3a to data in
Figure 3c suggests that the protection to wear by N1 implantation treatment is not very significant for CP samples, as the averaged wear rate value ((0.00028 + 0.00055)/2 = 0.00042 mm
3/m) for CP-N1 samples is only slightly lower than that ((0.00052 + 0.0006)/2 = 0.00056 mm
3/m) of non-implanted samples. Referring back to the four tests of N1-SLM samples with the average wear rate value of 0.00017 mm
3/m (= (0.00027 + 0 + 0.0004 + 0)/4), compared to (0.00058 + 0.00062)/2 = 0.00060 mm
3/m for non-implanted SLM samples (
Figure 3c), it can be suggested that a protection is detected from N1 treatment. Two tests out of four recorded zero wear rate and two others have detected wear for N1 treated SLM samples. A suggestion for this could be that with this treatment and for the testing period (1000 s) used, protection by the implantation layer can last before or after the 1000 s period. If the protection is lost well within the 1000 s, severe wear has then occurred, and a significant wear rate has resulted. On the other hand, protection can last more than 1000 s and thus wear rate is zero.
Comparing data in
Figure 3b to data in
Figure 3c suggests that the N2 implantation condition does not provide protection under the wear testing condition used. This non-protection could however be from two possibilities. The first is that the N2 condition is the same as non-implantation condition, meaning that the implanted N does not provide a sufficient hardening effect to reduce wear. The second is the protection period being too short to have affected the overall wear loss in the test period. These possibilities for the measured data presented in
Figure 3 will be explored in detail later when the COF graphs recorded during testing and the hardness profiles from nanoindentation measurement on the samples are presented and discussed.
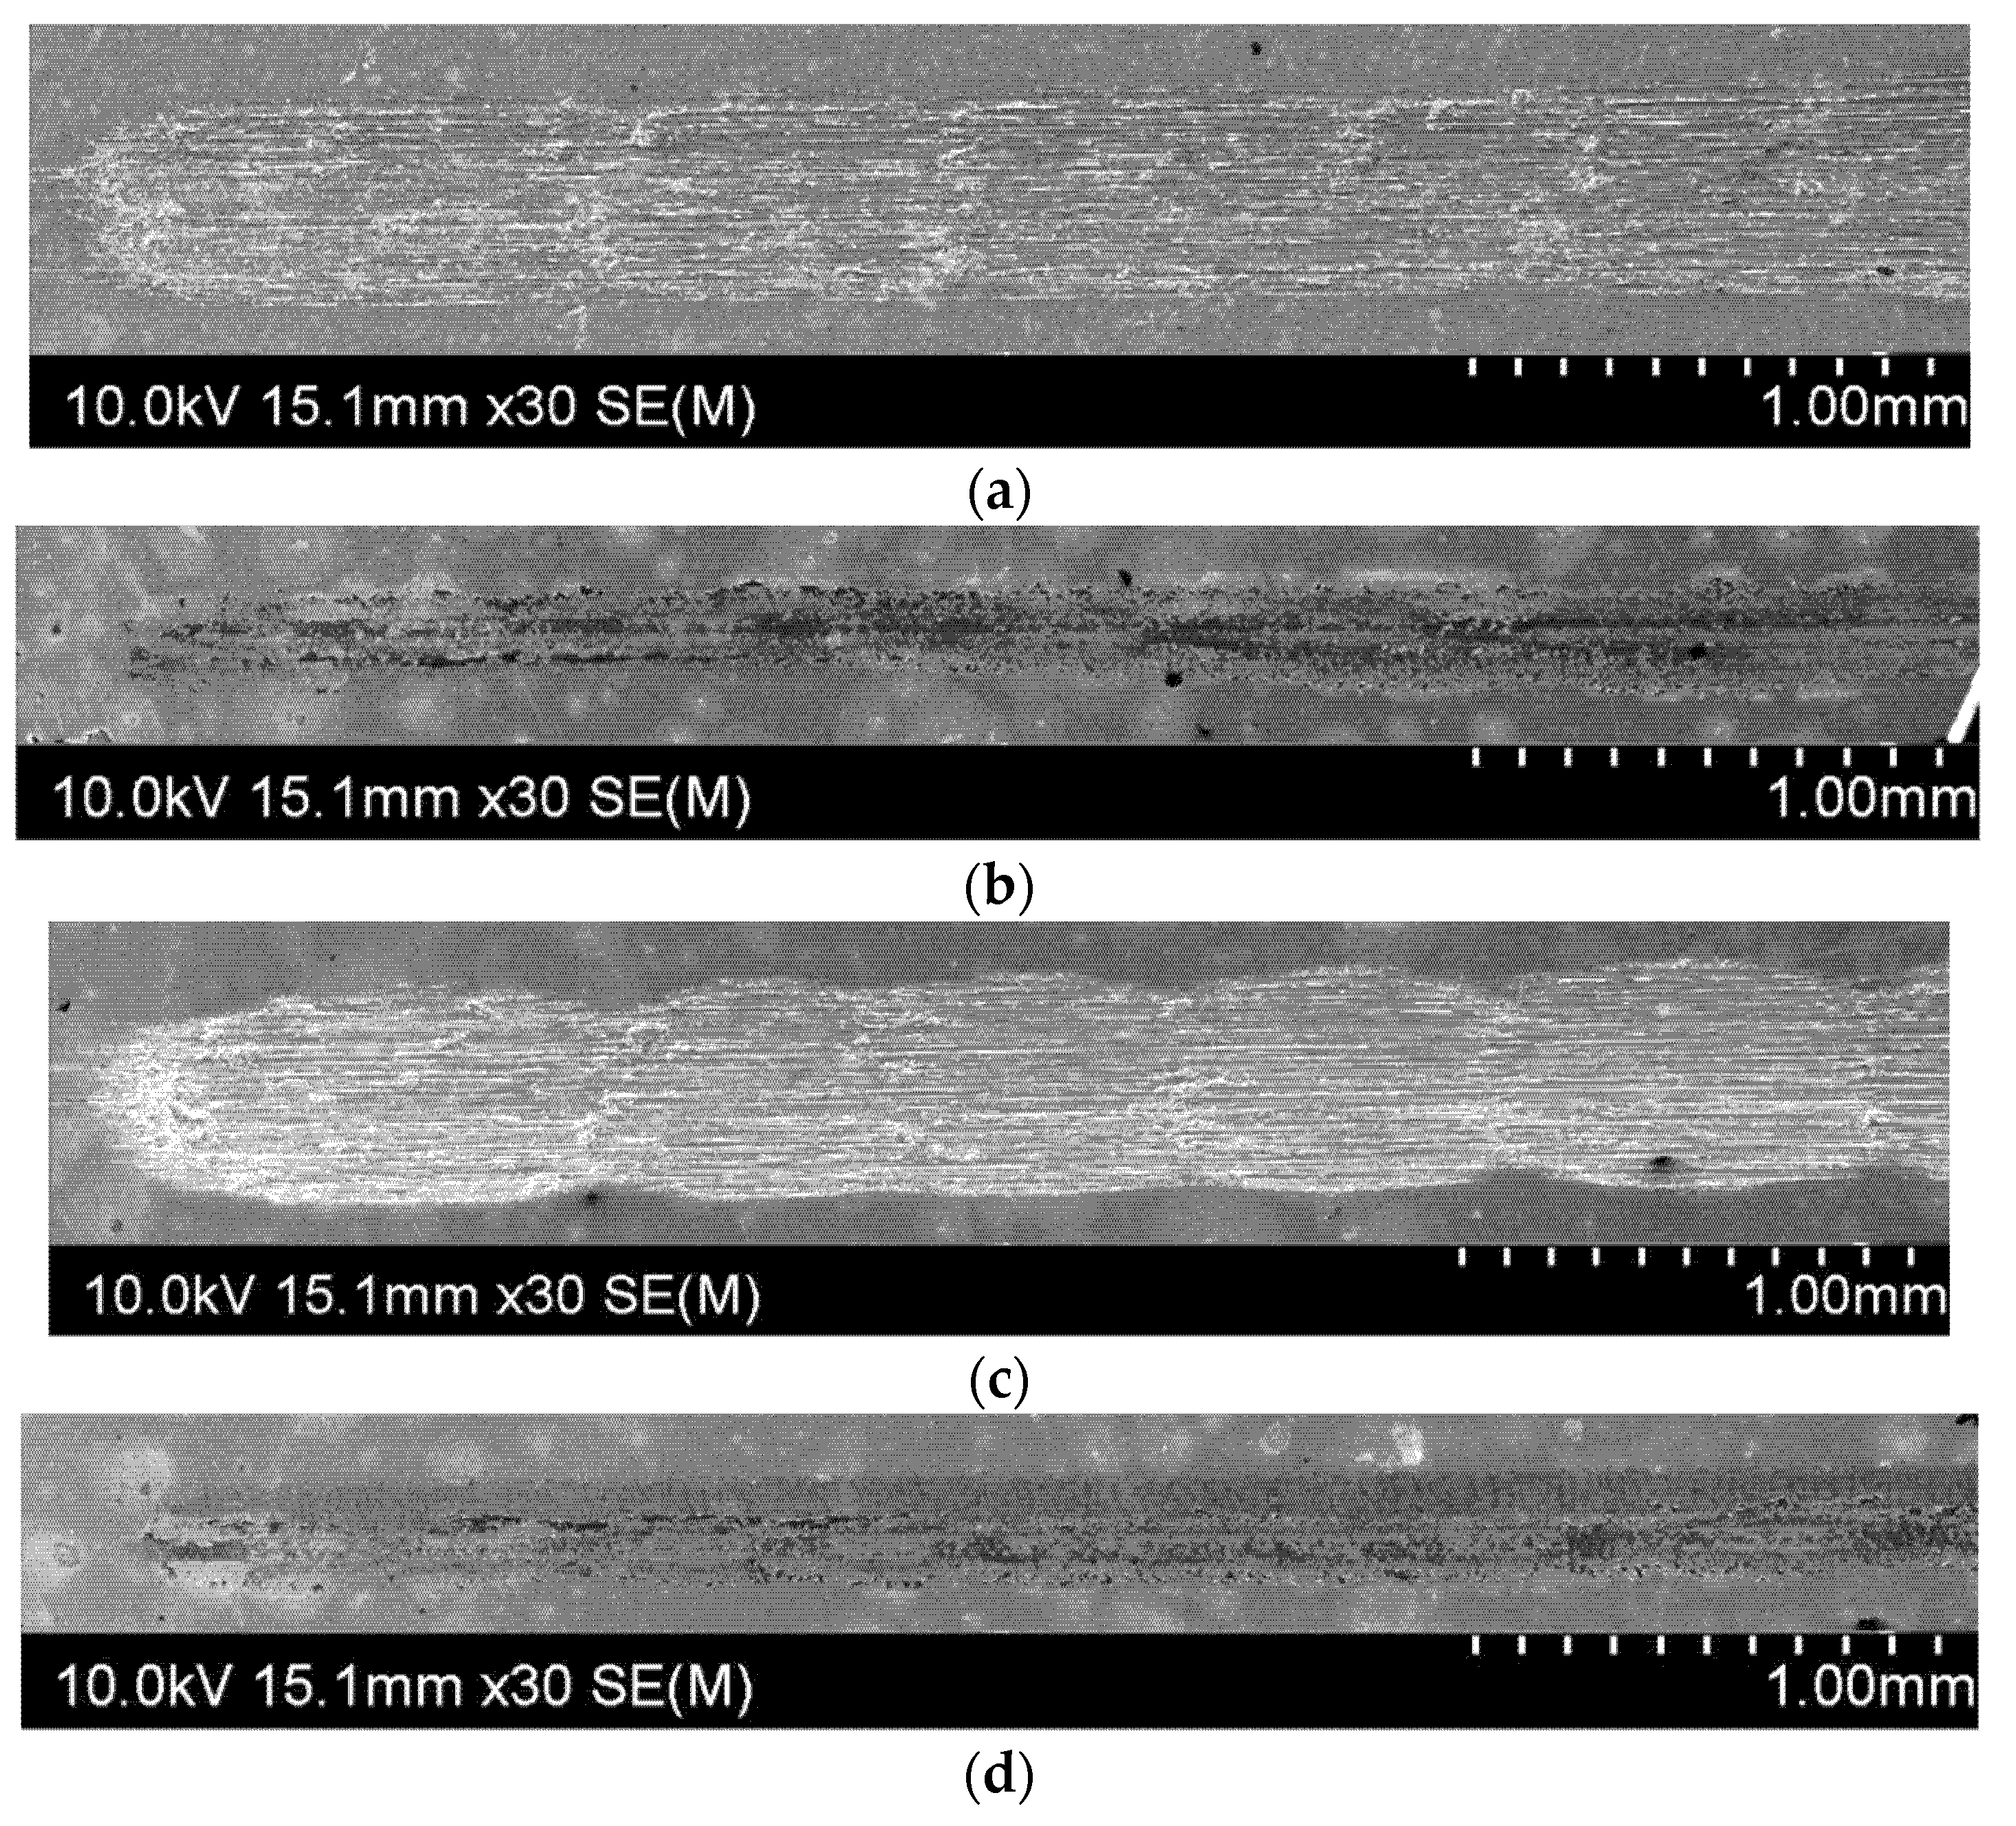
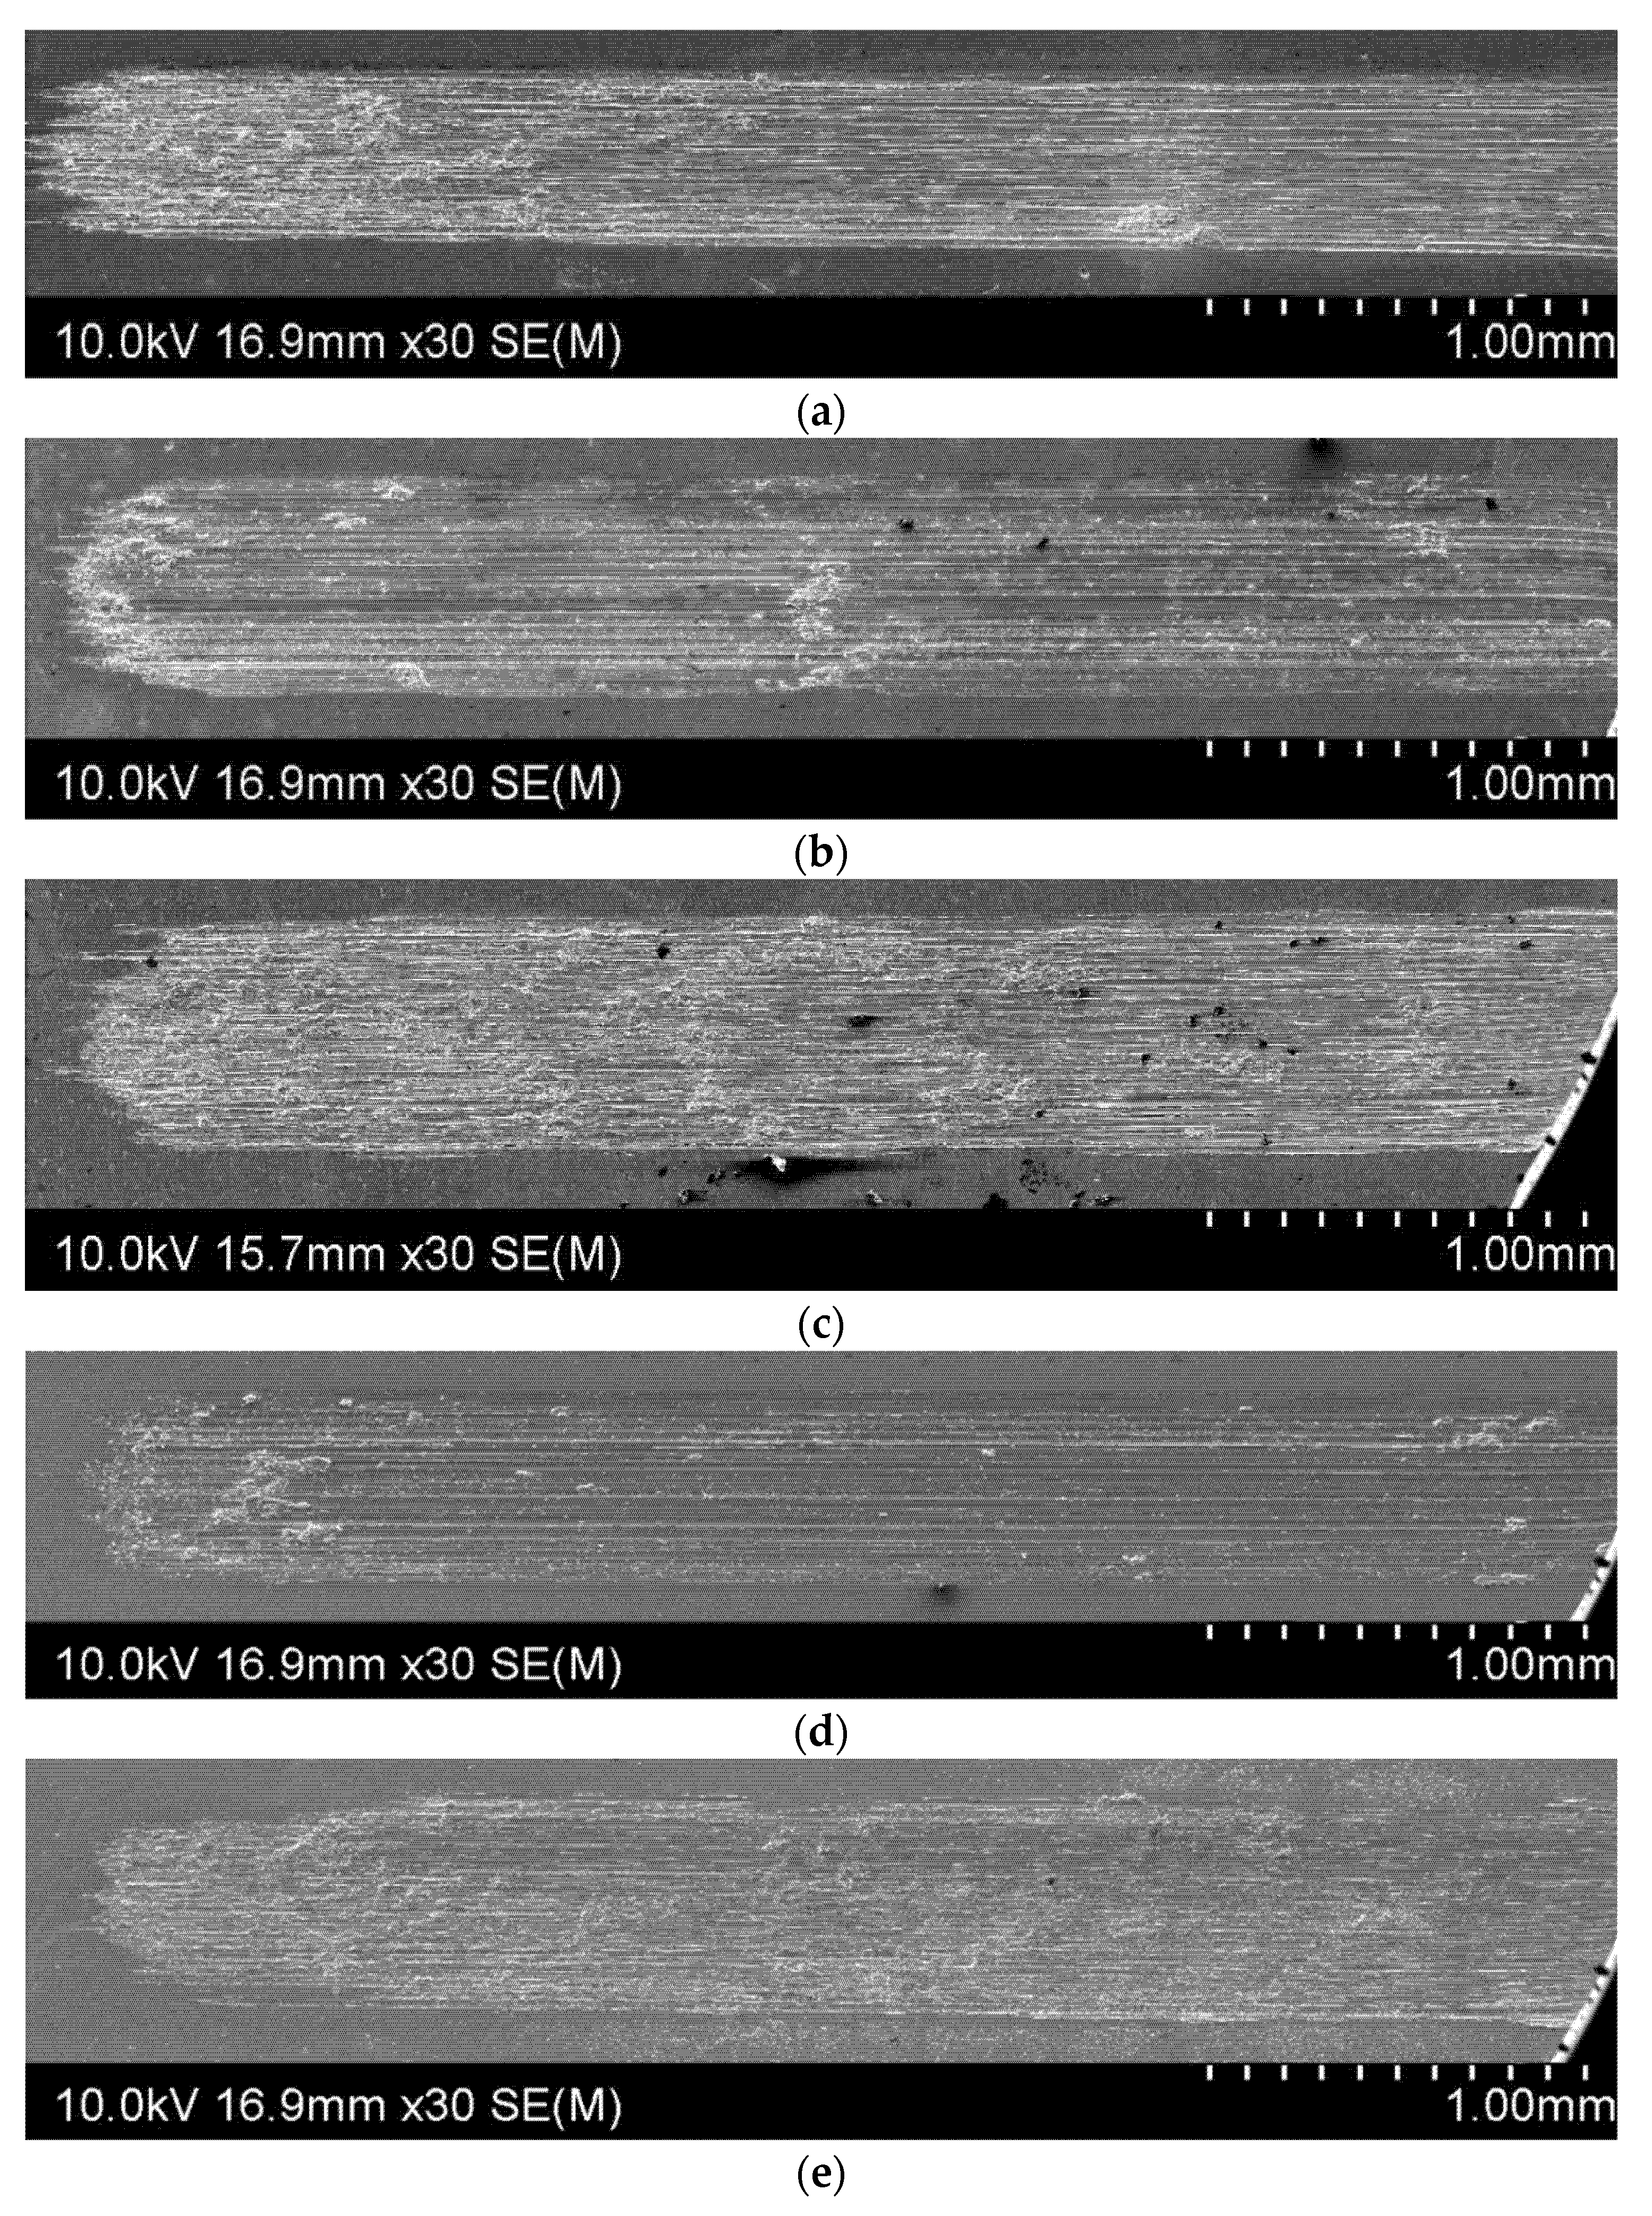
Following the sequence of the four wear rate data (with sample 2 and sample 4 being zero) for SLM-N1 tests in
Figure 3a, the four tracks in the same sequence are shown in
Figure 4 correspondingly, displaying the two (
Figure 4a,c) clearly worn and the other two (
Figure 4b,d) having worn little. For the two little worn tracks, tiny and darker pieces decorate and distribute along the tracks. These represent wear debris during the initially light wear period before the severe wear had started. This indicates the existence of protection by N1 treatment.
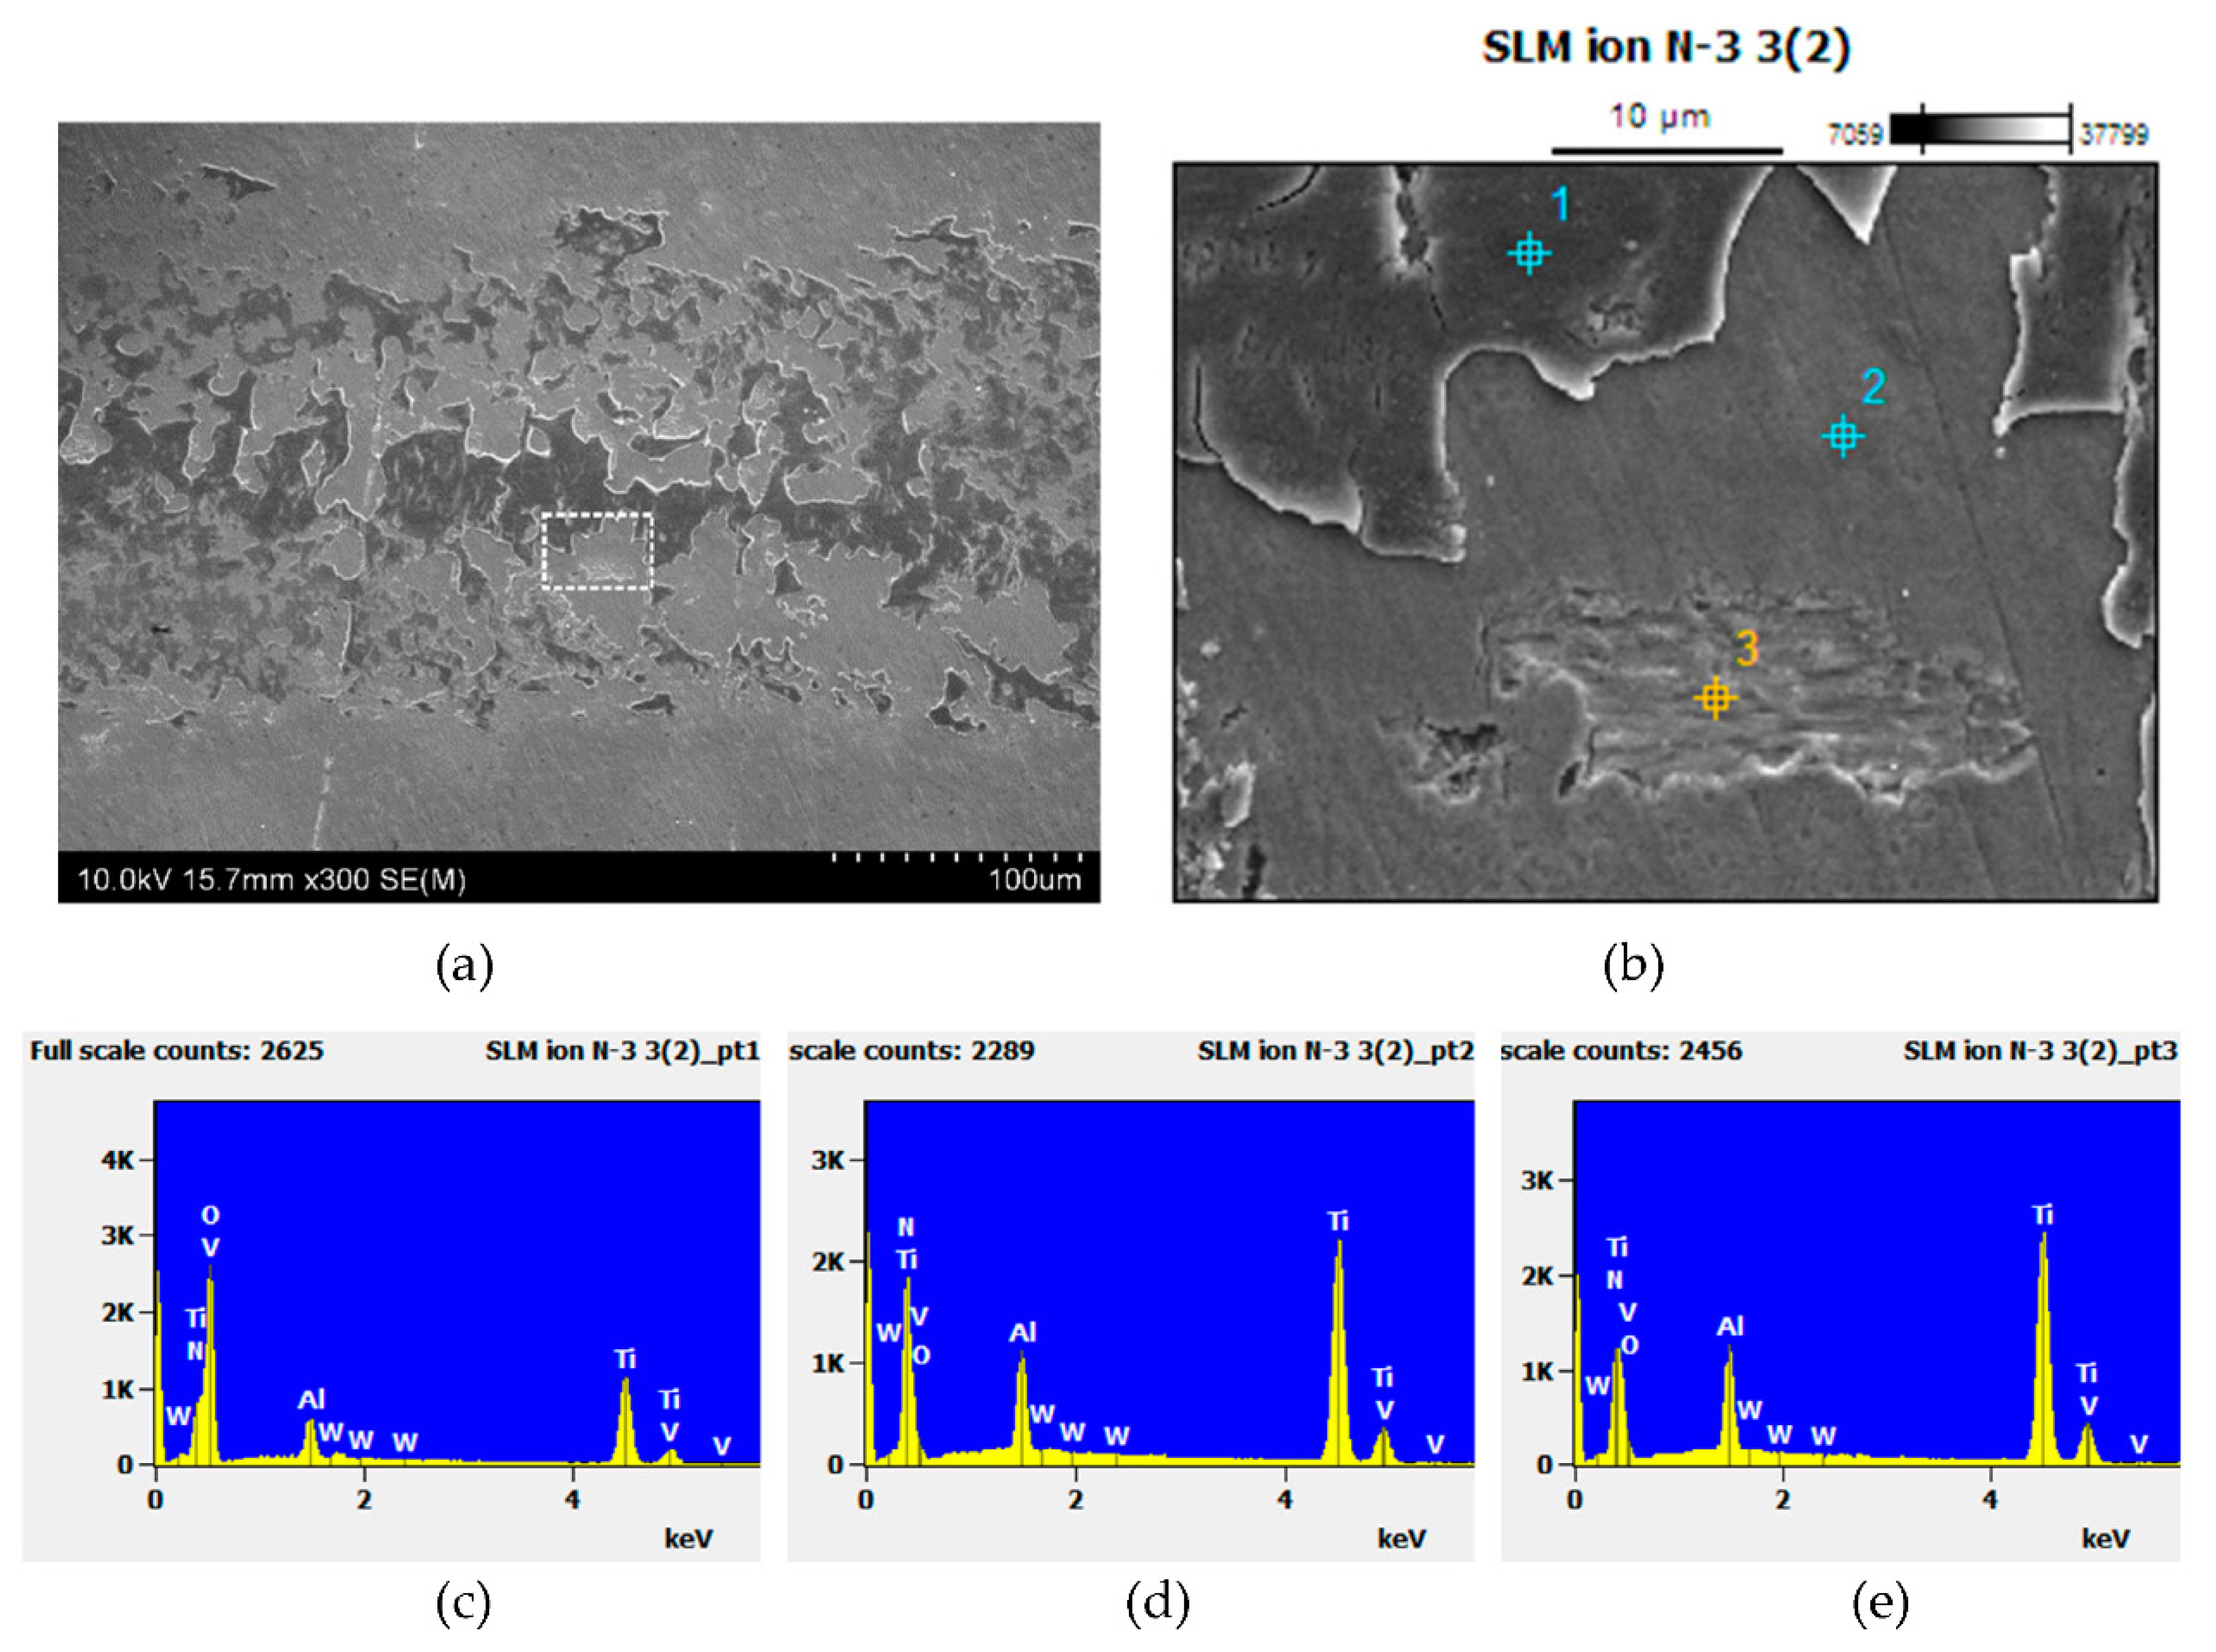
The tiny and darker wear debris is examined further, and SEM images taken in track 4 of SLM-N1 samples, which is a zero wear rate track, are shown in
Figure 5.
Figure 5a displays the discontinuous and thin debris patches in an area of the track.
Figure 5b shows locally and in high magnification the area covered by debris (feature of blue point 1), the area clear of debris (feature of blue point 2) and a small area clearly worn (feature of yellow point 3). Supporting this can be seen by the corresponding three EDS spot analyses in
Figure 5c–e. Debris, point 1 in
Figure 5b and spectrum in
Figure 5c, containing a high oxygen peak is consistent with the initial debris being oxygen rich. EDS spectrum for point 2 and EDS spectrum for point 3 in
Figure 5d,e, respectively, are largely the same except for the peak of N. The N peak in Point 2 is quite strong and the peak in Point 3 is significantly weaker, although the peak has been made slightly uncertain due to the Ti peak. The very weak N peak in Point 3 is consistent with the local area/spot having been worn and, thus, the initially N rich top layer having been lost.
For all other non-SLM-N1 tracks, the appearances of the first of the two tested tracks are shown in
Figure 6 and their corresponding wear loss data are indicated (with *) in
Figure 3. Only the track CP-N1 is seen noticeably narrower than others in
Figure 6, consistent with the lower wear rate in comparison to the wear rate data of N2 and non-treated samples plotted in
Figure 3. Although the individual wear rate may differ from one to another, overall the tracks displayed in
Figure 6 are similar and are similar to track 1 and track 3 of the SLM-N1 samples in
Figure 4. This means that for all these other samples, severe wear had well started before the end of the test period. In other words, N1 for CP samples and N2 for both SLM and CP samples had provided only very low or basically no protection to wear, given the test condition that have been used.
The amount of wear loss that has been measured and the appearance of the wear track that can be observed, as presented and described above for each track, have shown the end result of each test. In an attempt to identify how ion implantation may have provided wear protection, COF traces are plotted in
Figure 7 for examination. In this present case, all traces of tests are presented.
Figure 7a,b are for test 1 and test 2, respectively, of SLM-N1 and CP-N1 samples.
Figure 7c is for the two further SLM-N1 tests.
Figure 7d,e are for test 1 and test 2, respectively, of SLM-N2 and CP-N2 samples.
Figure 7f,g are for non-treated SLM and CP samples also for test 1 and test 2 in sequence.
In
Figure 7a, both N1 test 1 samples had lost protection by the end of the test period and the severe wear process started similarly at ~600 s for both, although for CP-N1, there was a dip of the trace earlier at ~250 s. A feature in the COF traces is the amount of “noise” in the traces before and after the change at ~600 s. About stick-slip according to Dong’s study [
11], “noisy” COF signals are closely resulted from the strong adhesion feature of titanium. It can be suggested that a change of a less noisy to a noisy COF signal after the dip of a COF curve is the result of the implantation layer loss and thus the loss of wear protection. Returning to the discussion on trace N1 curves in
Figure 7a, before ~600 s, the amount of noise is small and after the dip at ~600 s, the noise has become significantly higher. Thus, it can be reasonably certain that the protection has started to decline after the COF dip at ~600 s and severe wear of Ti64 started.
For test 2 (
Figure 7b), the trace of SLM-N1 test 2 is quite smooth despite of a dip at ~400 s. This relatively smooth COF trace corresponding to zero wear loss (
Figure 3a,b) supports the suggestion of the relatively smooth region of a COF trace and in this case the whole trace being relatively smooth to be an indication of zero wear process. The N implantation has provided a strong protection for the test period (1000 s) for this sample. On the other hand, for CP-N1 test 2, the protection had lost early and at ~200 s severe wear had started and thus the final wear loss is high (0.00055 mm
3/m), comparable to the averaged wear rate value (0.00056 mm
3/m) of the two tests using CP samples without implantation treatment (
Figure 7f,g). This is consistent with the severely worn track appearances of CP samples, without or with N implantation, in
Figure 6.
The higher amount of loss for CP-N1 test 2 than that of CP-N1 test 1 shown in
Figure 3 is also consistent with the dip of the COF trace for the CP-N1 sample in test 2 (
Figure 7b) earlier than that of the CP-N1 sample in test 1 (
Figure 7a). Although the trace is not very smooth before the dip, a large dip in the COF trace of SLM-N1 test 3 at ~450 s (
Figure 7c) also corresponds to the loss of protection and thus a relatively high amount of wear loss for the sample (
Figure 3a). On the other hand, the smooth trace without a dip for SLM-N1 test 4 (
Figure 7c) is consistent with the zero wear rate of the sample (
Figure 3a).
As shown in
Figure 7d–g, COF traces for samples of N2 and non-treated conditions are similar in that for a major part of the test period, after ~200 s, the traces are highly noisy. The amount of noise and the COF values for CP non-treated samples can be seen higher. The noisy traces corresponding to the high amount of wear loss for each test presented in
Figure 3b,c suggest that N2 treatment has provided little protection for the test period. Overall, the COF traces are in agreement with the obtained wear loss data and the COF graphs show that N1 treatment has provided protection particularly for SLM samples, but N2 treatment has provided little protection against wear.
The distance to the surface that hardness may be affected by N implantation is up to 300 nm, as the N concentrations profiles have shown in
Figure 2. Thus, hardness profiles have been obtained by using nanoindentation. For comparison purpose, measurements were also made using a 2 μm thick TiN PVD coated CP sample [
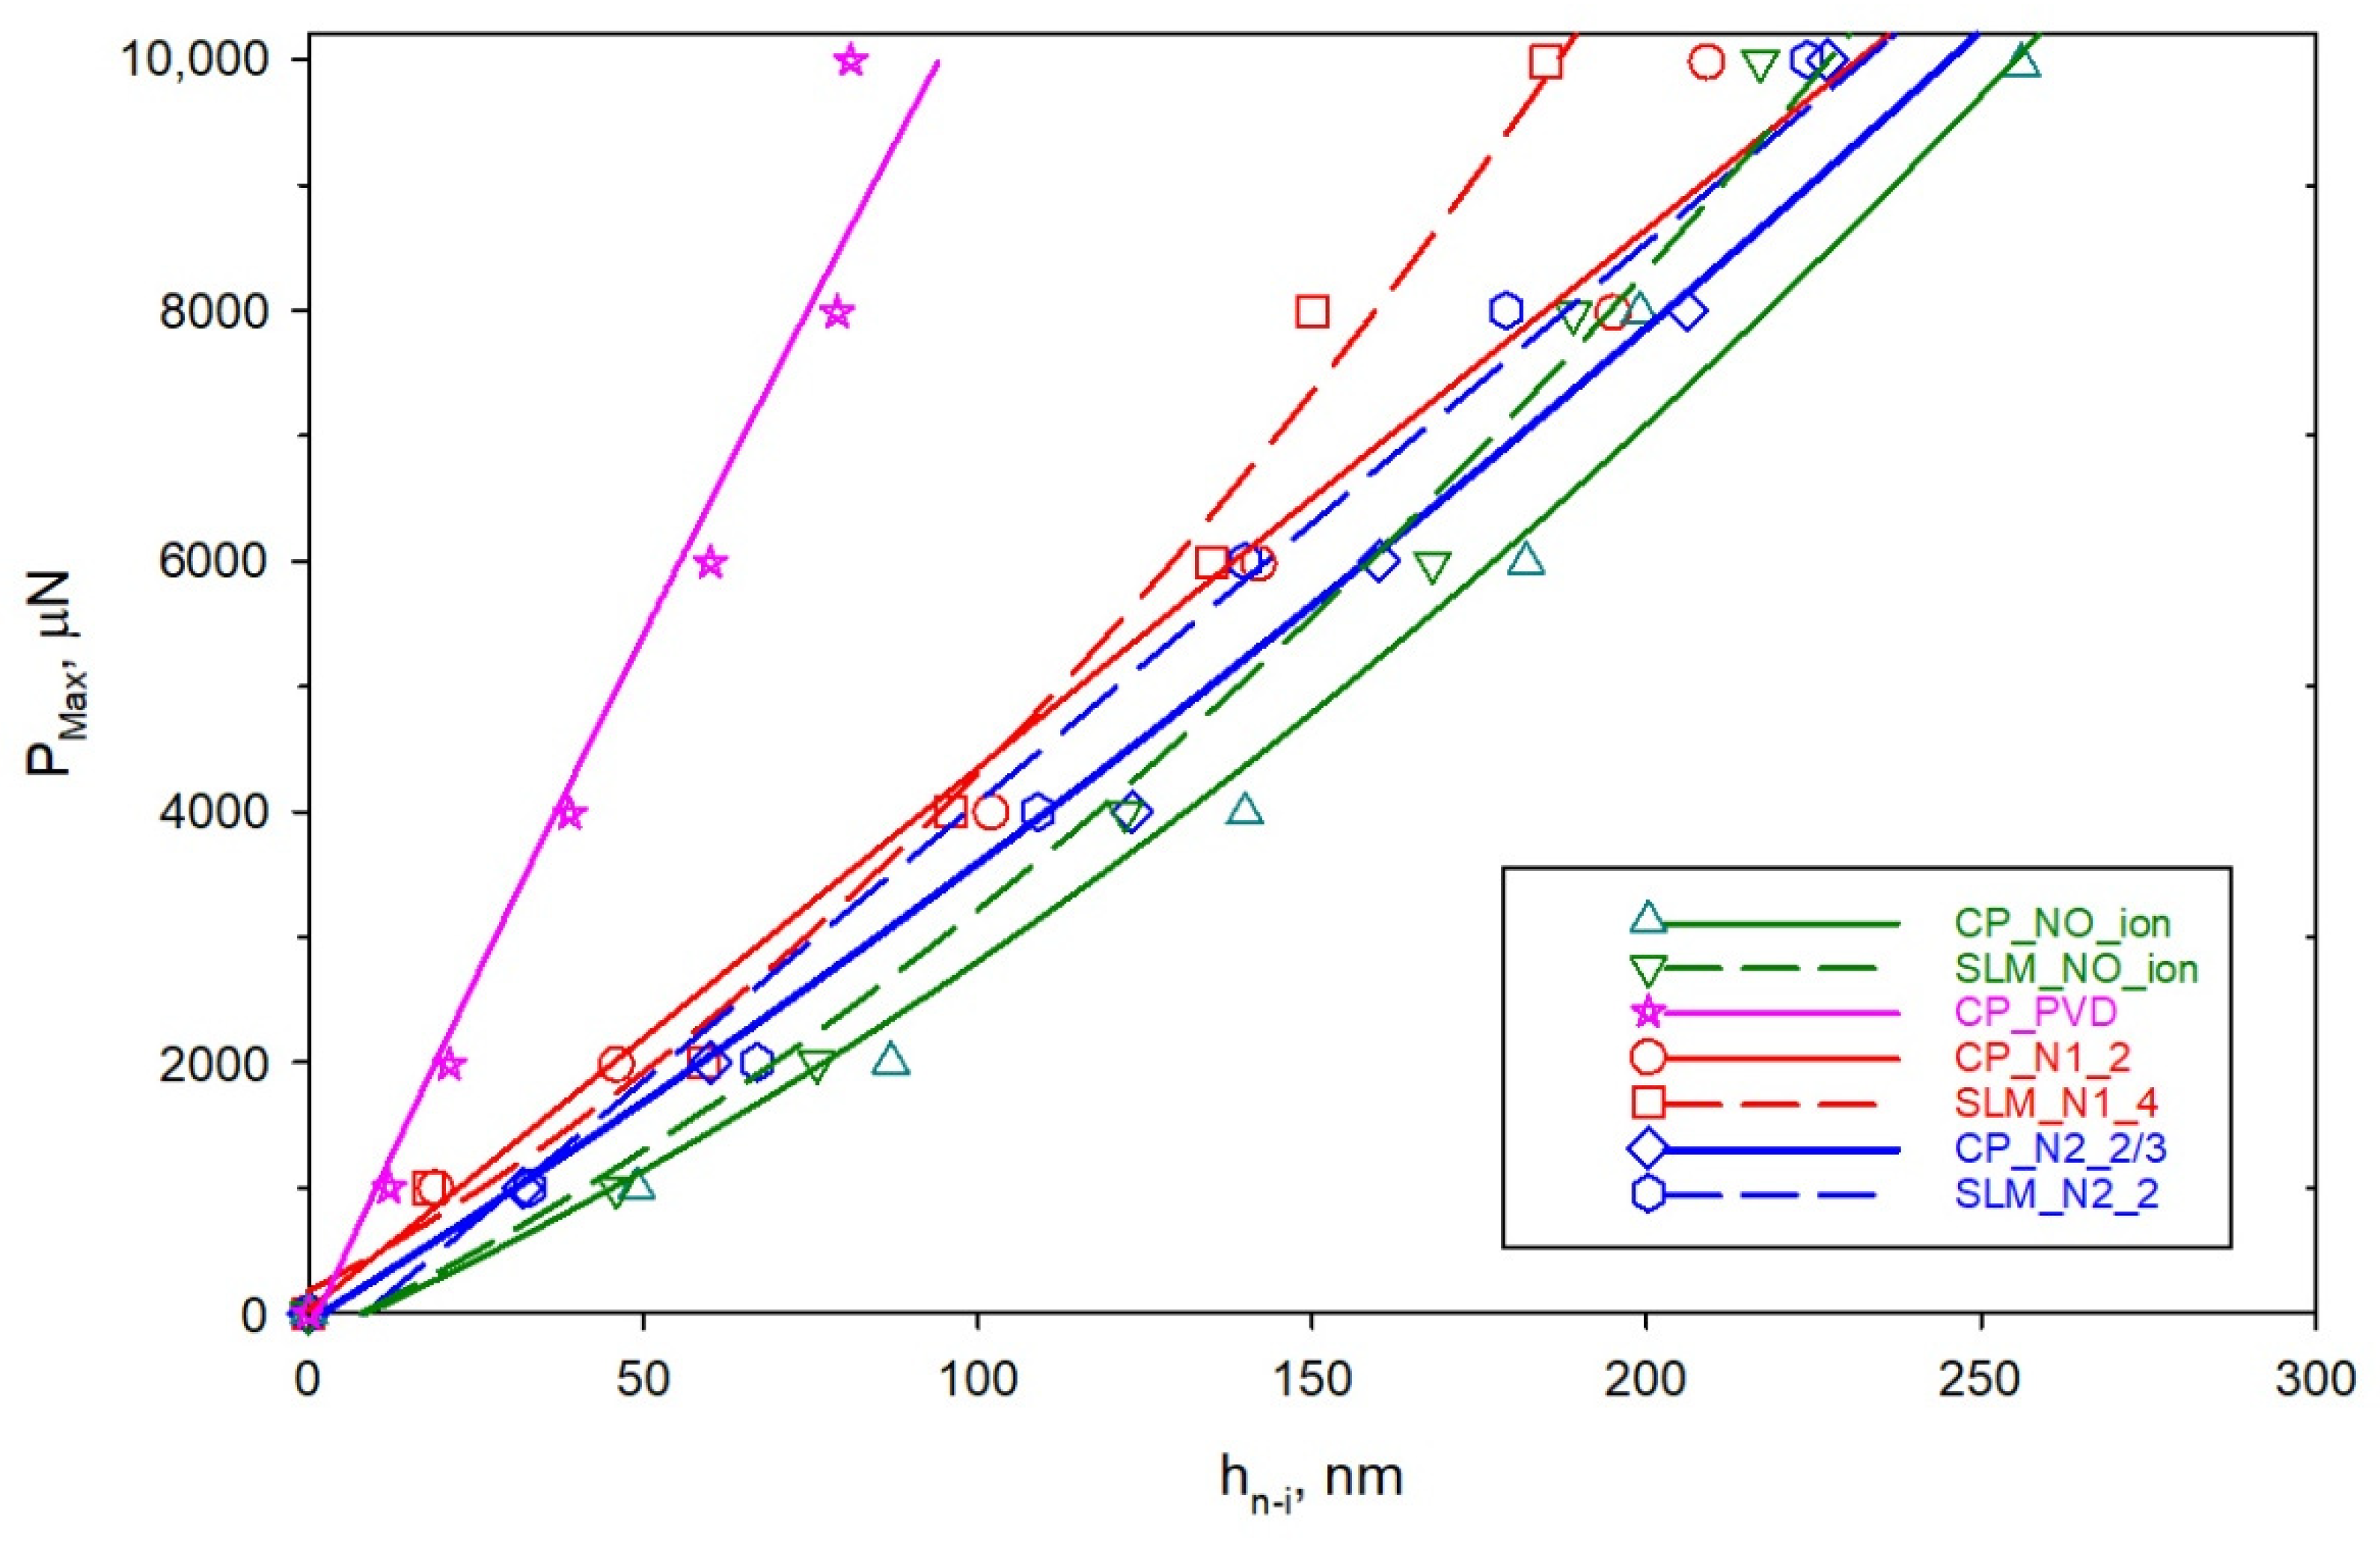
25]. Hardening data and profiles for various samples based on nanoindentation tests are presented in
Figure 8. The hardness of a material is measured by how deep (h
n-i) the indenter penetrates under a specific maximum load (P
max). For a given material surface, as the load increases, the indenter penetrates deeper. Thus, the higher the Δ P
max/Δh
n-i the harder the material is.
The distinctive feature in
Figure 8 is that, for P
Max up to 10,000 μN, the P
max-Δh
n-i curve for the PVD TiN coated sample is away from the rest P
max-Δh
n-i curves. As the curve is very steep meaning P
max/Δh
n-i is very high in comparison to others, hardness of the PVD TiN coating is viewed considerably higher than all the other surfaces. Carefully observing can further identify that, within the other group of curves, the one for non-treated CP sample is one with the lowest P
max/Δh
n-i (slope of the curve). A slightly higher average slope for the non-treated SLM sample than non-treated CP sample can also be identified. This is reasonable as microhardness of SLM (being 428 HV on average) is significantly higher than that of CP samples (being 324 HV on average). The P
max–Δh
n-i curves for three other samples (CP N1, SLM N2 and CP N2) are close to one for the SLM non-treated sample (and far away from the PVD curve), meaning that the increase in hardness after the N treatment is very small. For the SLM N1 sample curve, in comparison to all non-PVD coated samples, slightly higher P
max/Δh
n-i values in 5000–10,000 μN load region are observed.
From the discussion above on nanoindentation data in
Figure 8, it can be suggested that N1 implantation on CP samples and N2 implantation on both SLM and CP samples have had an insignificant effect on surface hardening. Thus, as shown in
Figure 3,
Figure 4,
Figure 5 and
Figure 6, N1 treatment for CP samples and N2 treatment for both SLM and CP samples have provided little wear protection. However, hardening effect by N1 implantation on SLM samples can be detected. For this reason, as also shown in
Figure 3,
Figure 4,
Figure 5,
Figure 6 and
Figure 7, wear protection by N1 treatment on SLM samples has been registered.
The results presented above shed light into the wear mechanisms of ion implanted Ti-6Al-4V samples, that hasn’t been investigated and well understood in previous studies. The results also show the differences in wear resistance and behaviour of N+ and N2+ ion implanted Ti-6Al-4V samples manufactured by conventional casting as well as SLM additive manufacturing technique.


