Article

Structural-Phase State, Mechanical Properties, Acoustic and Magnetic Characteristics in the Sustainable Deformation Localization Zones of Power Equipment Made of Structural and Heat Resistant Steels

1
Laboratory for Advanced Control Methods of Mining Engineering Systems, The Federal Research Center of Coal and Coal-Chemistry SB RAS, 650065 Kemerovo, Russia
2
Department of Mechanical Engineering Technology, T. F. Gorbachev Kuzbass State Technical University, 650000 Kemerovo, Russia
3
Strength Physics Laboratory, Institute of Strength Physics and Materials Science SB RAS, 634055 Tomsk, Russia
4
Department of Physics, Chemistry and Theoretical Mechanics, Tomsk State University of Architecture and Civil Engineering, 634003 Tomsk, Russia
*
Author to whom correspondence should be addressed.
Metals 2021, 11(10), 1638; https://doi.org/10.3390/met11101638
Submission received: 20 September 2021 / Accepted: 8 October 2021 / Published: 14 October 2021
(This article belongs to the Special Issue Kinetics of Plastic Deformation in Metallic Materials)

Abstract

:
The paper presents the results of the analysis of the microstructure, mechanical properties, acoustic and magnetic characteristics of the metal of pipelines that are part of heat and power equipment, after long-term operation, made of structural and heat-resistant steels in the zones of localization of plastic deformation. Samples of 0.2 C steel and 0.12C-1Cr-1Mo-1V steel were studied in the initial state, as well as after operation for 219 and 360 thousand hours, respectively. As a result of the studies carried out for each sample, the phase composition was determined (qualitatively and quantitatively), and the following parameters of the fine structure were calculated: volume fractions of structural components of steel (pearlite and ferrite), scalar ρ and excess ρ± dislocation density, curvature-torsion of the crystal lattice χ, amplitude of internal stresses (shear stress and long-range stresses). All quantitative parameters of the structure are determined both in each structural component of steel, and in general for each sample. The structure of the metal of all specimens after deformation before the formation of zones of stable localization of deformations consists of a ferrite-pearlite mixture, and for specimens after operation before fracture only of unfragmented and fragmented ferrite. Ferrite, which occupies the bulk of the material, is present both unfragmented and fragmented. For all samples, the ratios ρ ≥ ρ±, χ = χpl, σL ≥ σd were calculated, which indicate whether there is a danger of the initiation of microcracks in metal samples. For specimens without operation and after operation without damage in zones of stable localization of deformations, these conditions are met, and for specimens after operation until destruction, they are not met. It was found that the structural-phase state in the zones of localization of deformations has a direct effect on the characteristics of non-destructive tests. Thus, for all investigated samples, the values of such parameters as the delay time of the surface acoustic wave, the attenuation coefficient, the amplitude of the received signal, and the intensity of magnetic noise in the zones of deformation localization were established.

1. Introduction

Organization of protection of the vital interests of the individual and society from accidents at hazardous production facilities is one of the important tasks of modern production, the achievement of which is impossible without reliable diagnostics of equipment and a reliable assessment of the residual resource [1,2,3,4,5,6,7,8,9,10,11,12].
Complex physicochemical processes occur in the metal of power equipment during long-term operation under the influence of high temperatures and pressure and lead to a change in the structural-phase state, nucleation, accumulation of microdefects and then to the destruction of equipment elements [13,14,15,16,17,18,19].
The amount of equipment that has exhausted its park resource is increasing every year. According to official statistics, 49% of such equipment was installed at the beginning of 2019. However, for certain groups of equipment and enterprises, the figure reached 95%. The largest number of accidents and accidents at hazardous production facilities was found in the Siberian Federal District. The analysis of the causes of accidents and accidents that occurred over the past 5 years when using equipment operating under excess pressure showed that steam and hot water pipelines are one of the most dangerous types of equipment operating under excess pressure, despite the absence of such hazardous factors, as the presence of explosive, fire hazardous and toxic environments [20].
Methods and equipment for non-destructive testing associated with the study of the structural state are currently being developed [21,22,23]. A number of criteria for the limiting state of the base and deposited metal, as well as welded joints, were developed based on the dependences of the characteristics of non-destructive testing methods with quantitative indicators of the structural-phase state [24,25]. However, these criteria require clarification, since associated with the limiting state of the equipment. Increasing the reliability and accuracy of the assessment is impossible without analyzing the structural-phase state and mechanical characteristics of the metal of long-term power equipment. The detection of a characteristic pre-fracture zone or zone of localization of deformations is an important aspect [26]. One of the main advantages of this approach is the fundamental possibility of detecting the site of future destruction of the sample long before necking. In this case, the place of future destruction coincides with the zone of deformation localization. The purpose of this work is to identify deformation localization zones by physical methods of non-destructive testing as the basis for a fundamentally new approach to determining the sites of pre-failure and to assessing the residual life of long-term power equipment.

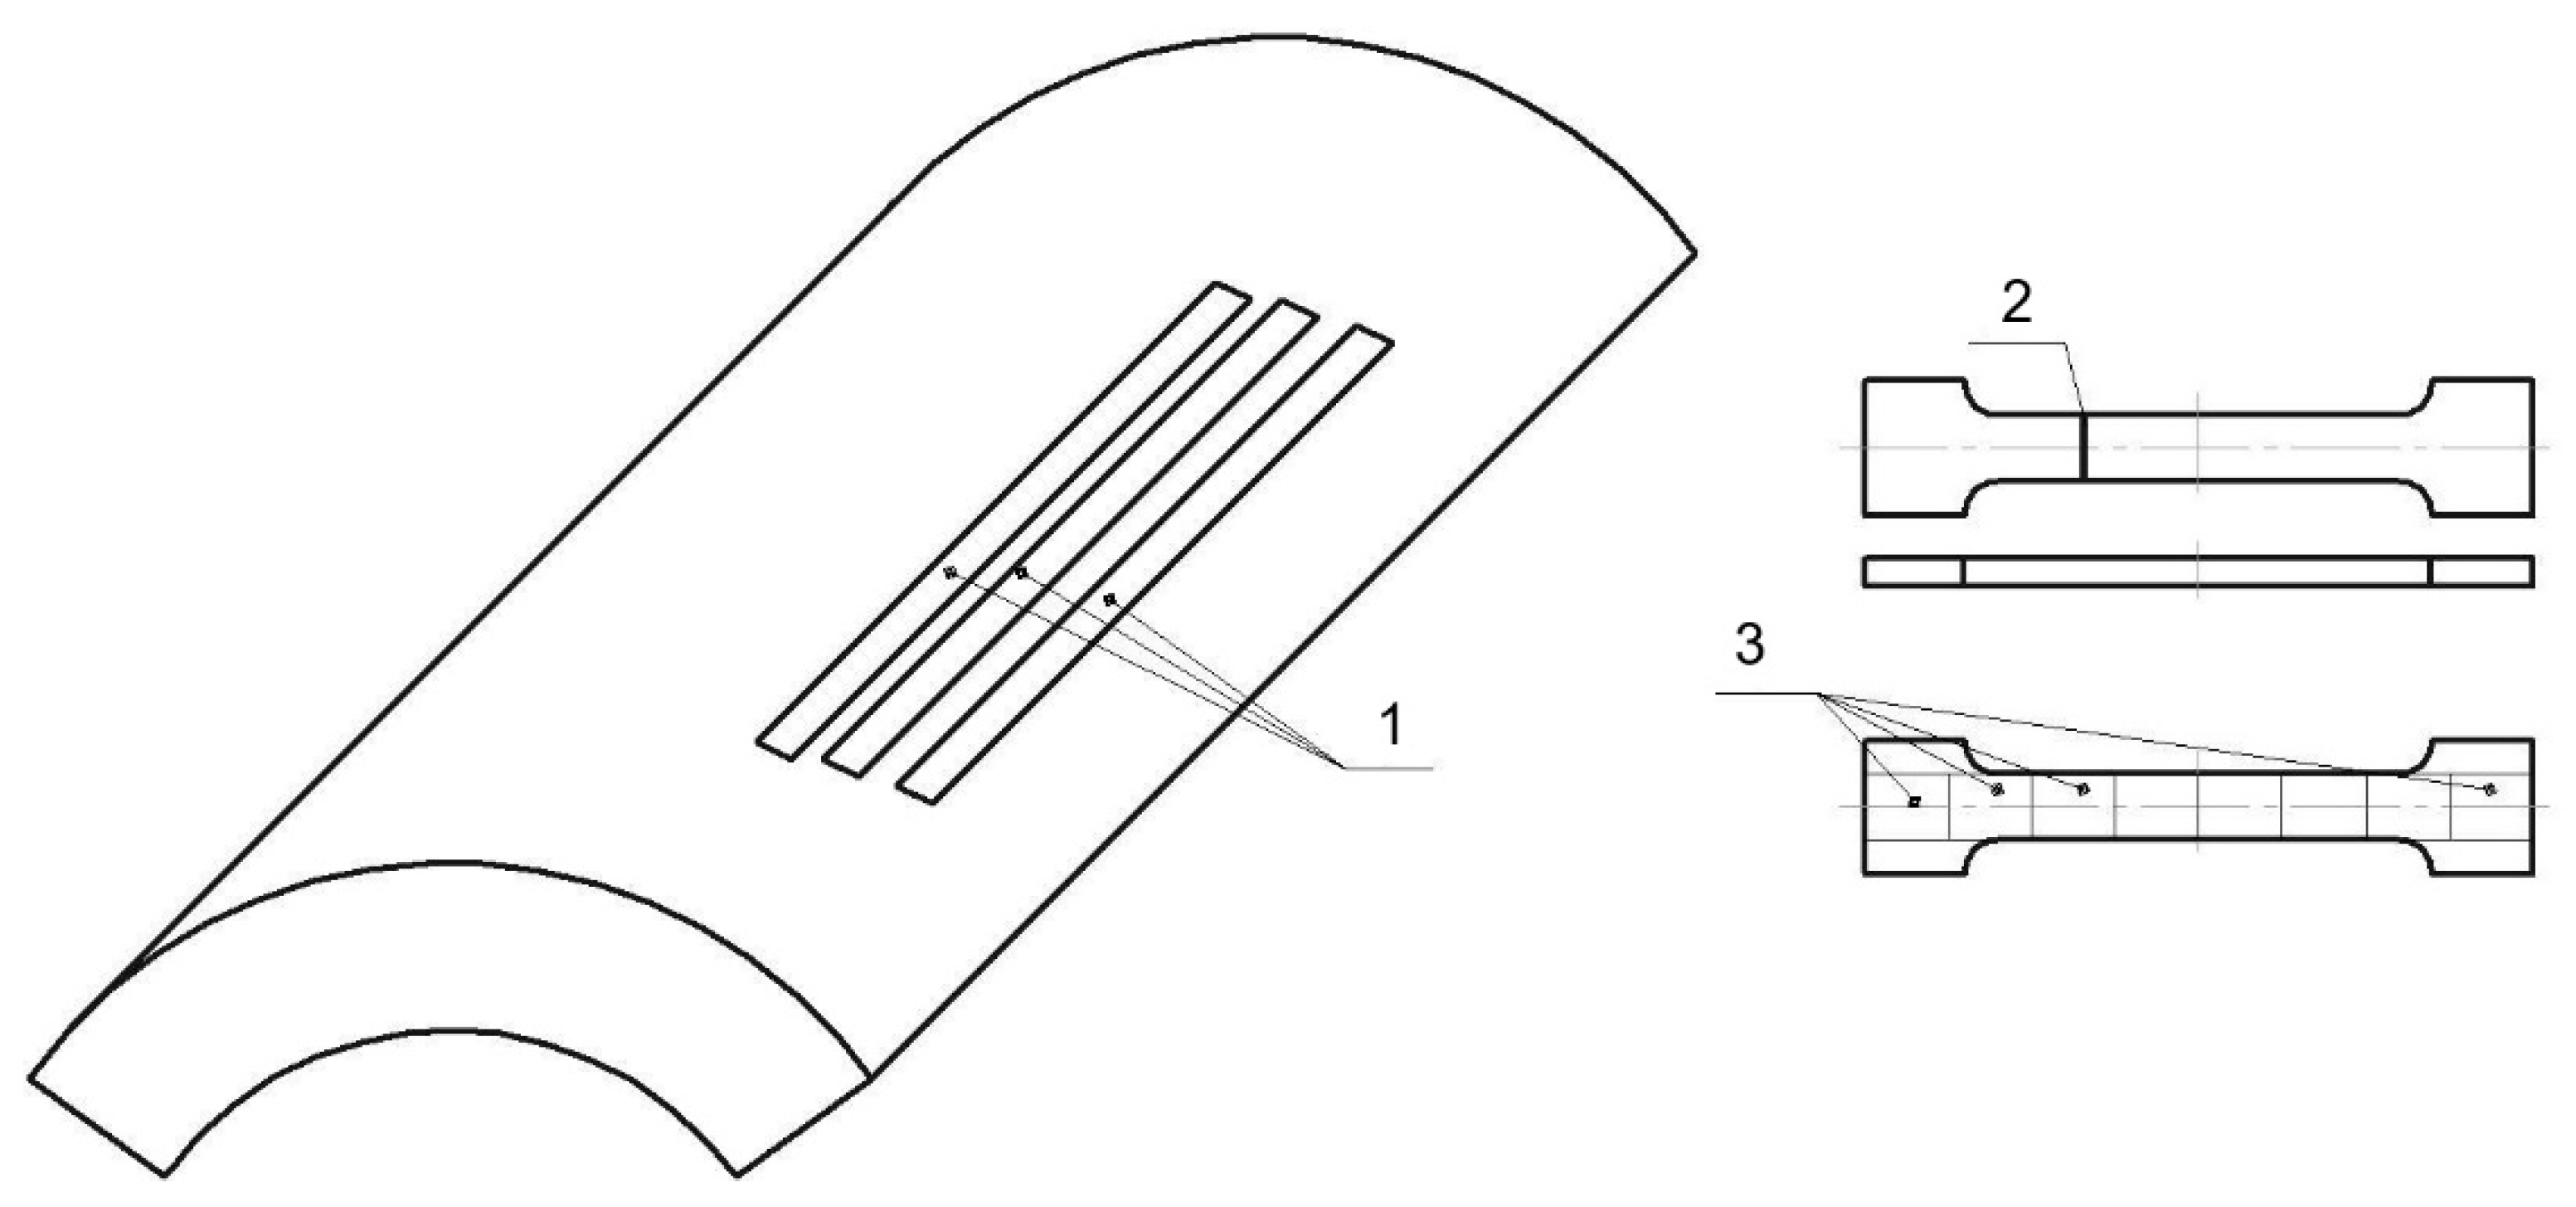
2. Materials and Methods

To carry out the stated studies, samples were used that were cut from the drainage pipe of the front screen of a heat power plant without operation, after operation for 219 thousand hours without destruction and for 242 thousand hours before destruction, the material was 0.2 C steel (operating parameters: medium—steam-water mixture, temperature 320 °C and pressure 1.6 MPa). As well as samples from the bend of the steam line before the exhaust valve also without operation, after operation for 260 thousand hours without destruction and for 263 thousand hours before destruction, the material is 0.12C-1Cr-1Mo-1V steel (operating parameters: medium—steam-water mixture, temperature 545–565 °C and pressure 14 MPa.). The chemical composition of the investigated steel is given in Table 1.
We used the shape of the samples—“dog-bone” with the dimensions of the working part 40 mm × 6 mm × 2 mm (Figure 1—1).
The microstructure was analyzed using a Neophot-21 optical microscope (Carl Zeiss Jena, Germany) with a UCMOS03100KPA digital technical video camera, and the mechanical characteristics were determined under uniaxial tension at a constant rate on a Walter + Bai AG LFM-125 testing machine (Walter+Bai AG, Löhningen, Switzerland) at room temperature. The moving speed of the movable gripper was 0.4 mm/min. (quasi-static tests). Simultaneously with stretching, the deformation localization patterns were recorded by the digital image correlation (DIC) method [27,28], which was realized using a PL-B781F video camera (Pixelink, Canada) under illumination with a SNF-xxx-635-30-KB laser. For comparison, the same experiments were performed on similar samples cut from pipes of the same standard sizes that were not in operation (non-operational state).
To study the structure of the metal in the zones of localized deformation, we used the method of transmission electron microscopy (TEM) on thin foils using an EM-125 electron microscope (Sumy electronic devices plant, Ukraine) and an accelerating voltage of 125 kV [29,30]. The working magnification in the microscope column was 25,000 times.
As a result of the studies carried out for each sample, the phase composition was determined (qualitatively and quantitatively), and the following parameters of the fine structure were calculated: volume fractions of structural components of steel, scalar ρ (parameter, that controls changes in dislocation substructures at certain degrees of deformation) and excess ρ± dislocation density, curvature-torsion of the crystal lattice χ, amplitude of internal stresses (shear stress and long-range stresses). All quantitative parameters of the fine structure are determined both in each structural component of steel, and in general for each sample [31,32,33,34].
The samples before and after plastic deformation were tested by non-destructive methods: spectral-acoustic (measuring and computing complex “ASTRON” (designed to measure acoustic characteristics with Rayleigh waves) [20,26]) and magneto-noise methods (structure and stress analyzer “Introscan” (NPF Diagnostics LLC, Belarus) (designed to assess the magnitude of the intensity of magnetic noise) [26]). At the same time, such characteristics as the delay time and velocity of surface acoustic waves, the attenuation coefficient, the amplitude of the received signal, and the intensity of magnetic noise were determined (Figure 1, Figure 2 and Figure 3).

3. Results

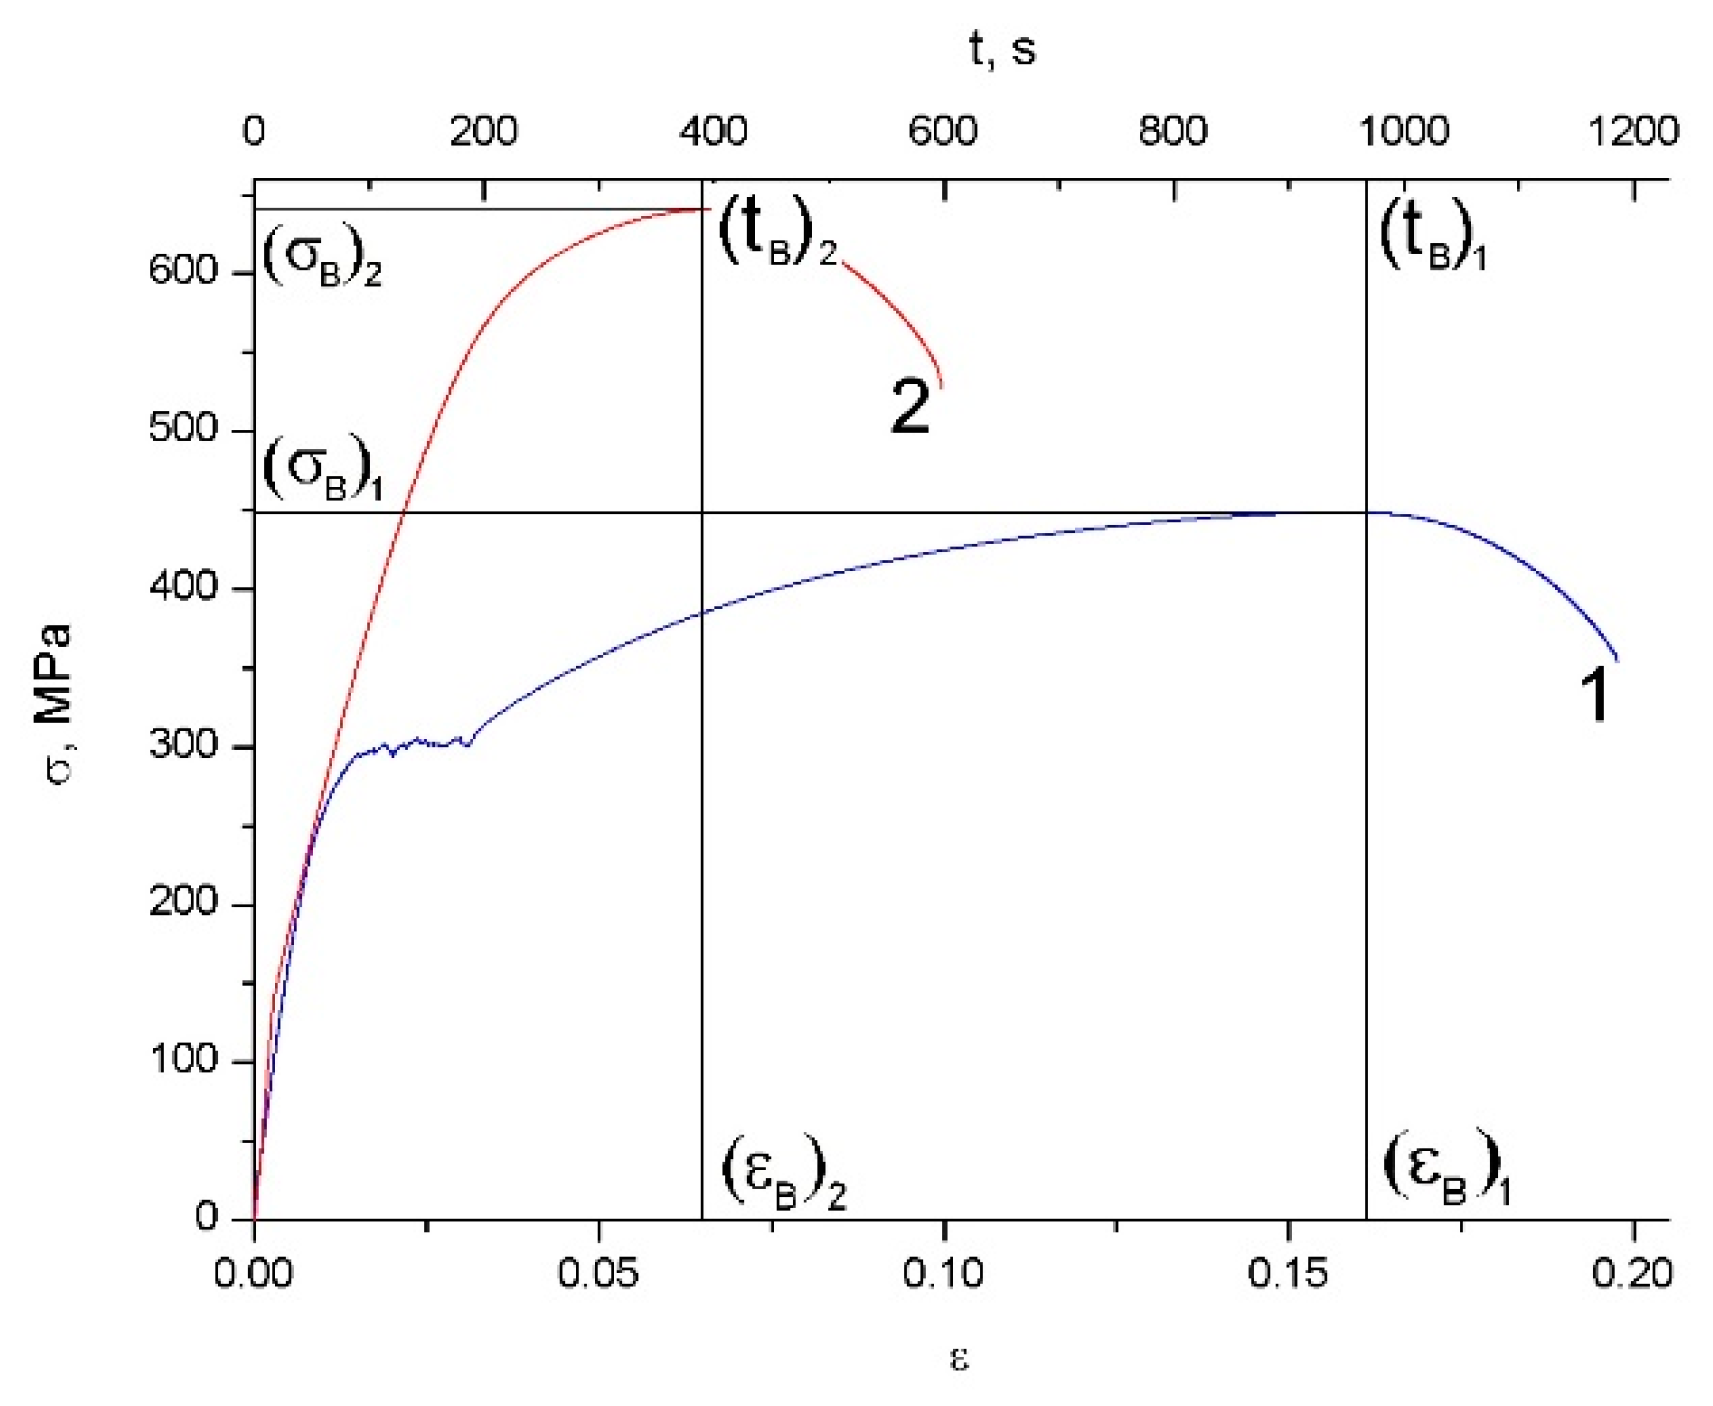
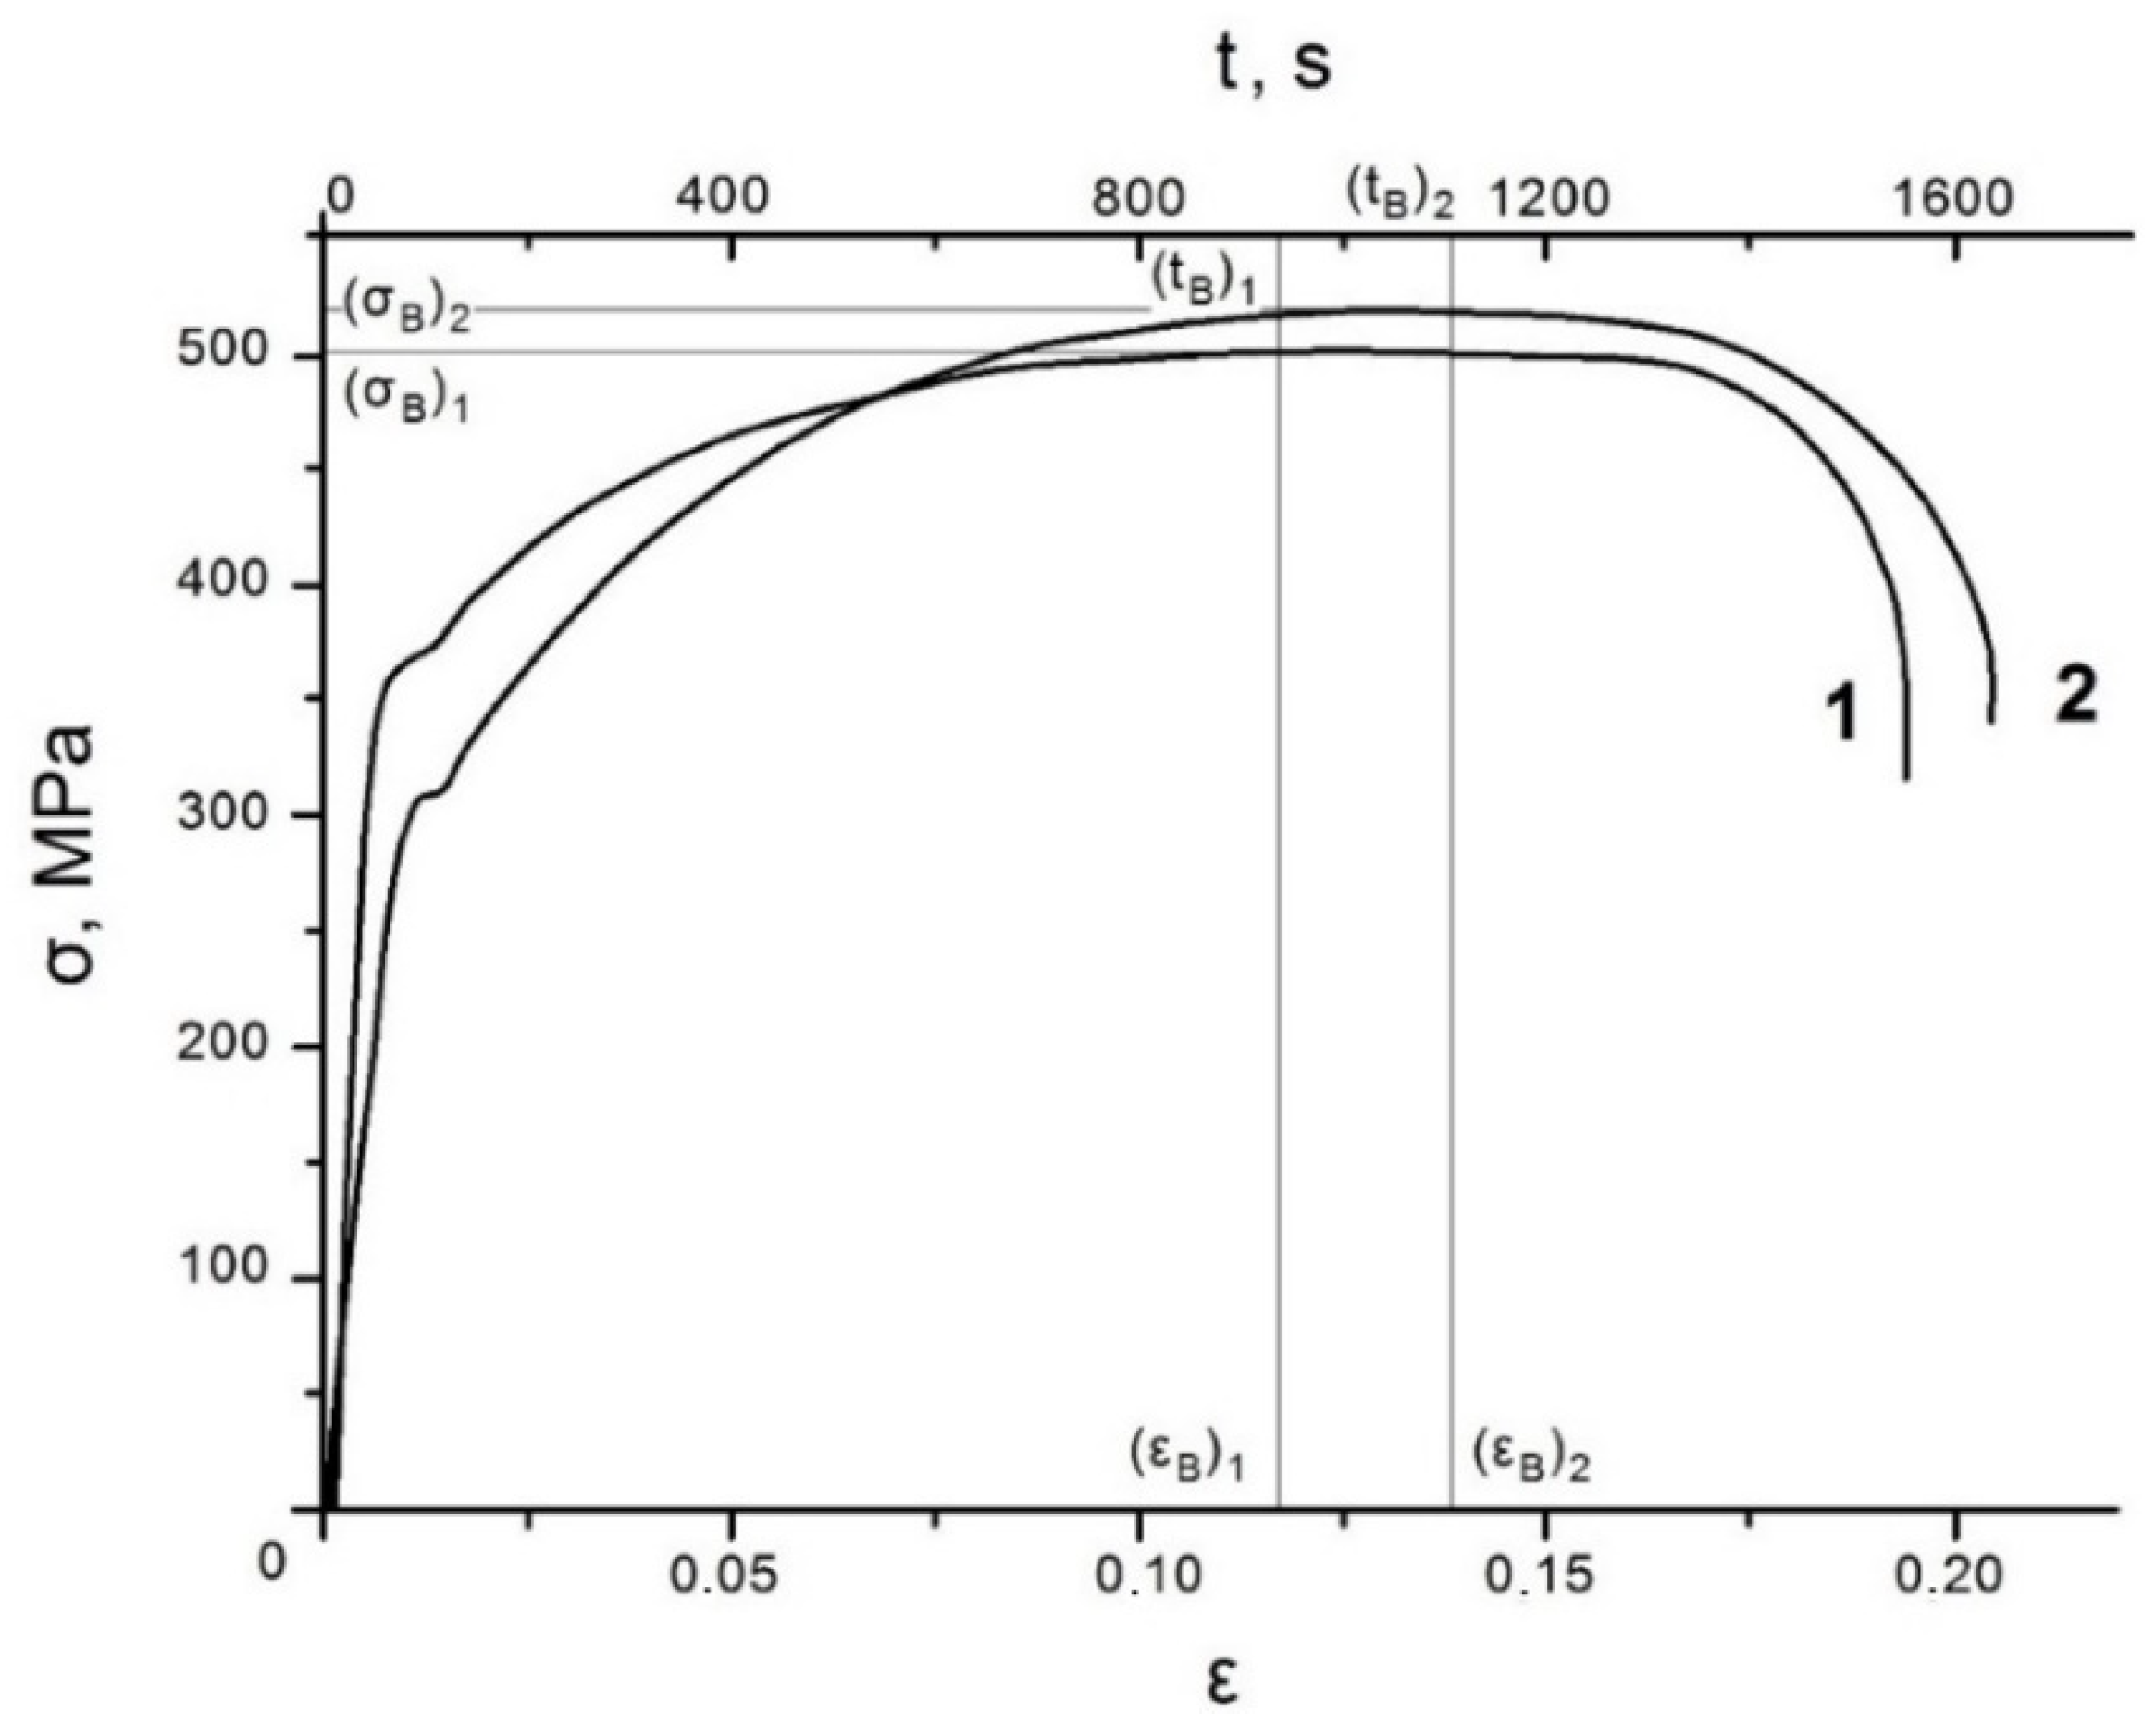
3.1. Mechanical Test Results of Samples of Power Equipment Made of Structural and Heat Resistant Steels

An analysis of the experimental data showed that long-term operation led to more than a twofold decrease in steel ductility from 22 ± 1.9% to 9.7 ± 1.1% and a significant change in the form of the loading diagram (Figure 2).
The yield area typical for low-carbon steels is observed in the initial state in the diagram. After operation, it is not observed; therefore, the elastoplastic transition in this state is carried out without the formation of Chernov–Luders bands.
Analysis of the results of mechanical tests of samples made of 0.12C-1Cr-1Mo-1V steel showed that long-term operation led to a decrease in the ductility of steel from 30 ± 1.9% to 22 ± 1.1%. At the same time, the strength indicators remained at the same level. The time interval from the beginning of the test to the stable localization of deformation from the state without operation to the fractured state has decreased.
For samples made of 0.12C-1Cr-1Mo-1V steel (Figure 3), the indices a1 and a2 for the state without operation and the state after operation without destruction do not differ significantly and are 0.44 and 0.81, respectively, while for the state after operation and destruction the values indicators a1 and a2 decreased to 0.34 and 0.51, respectively.

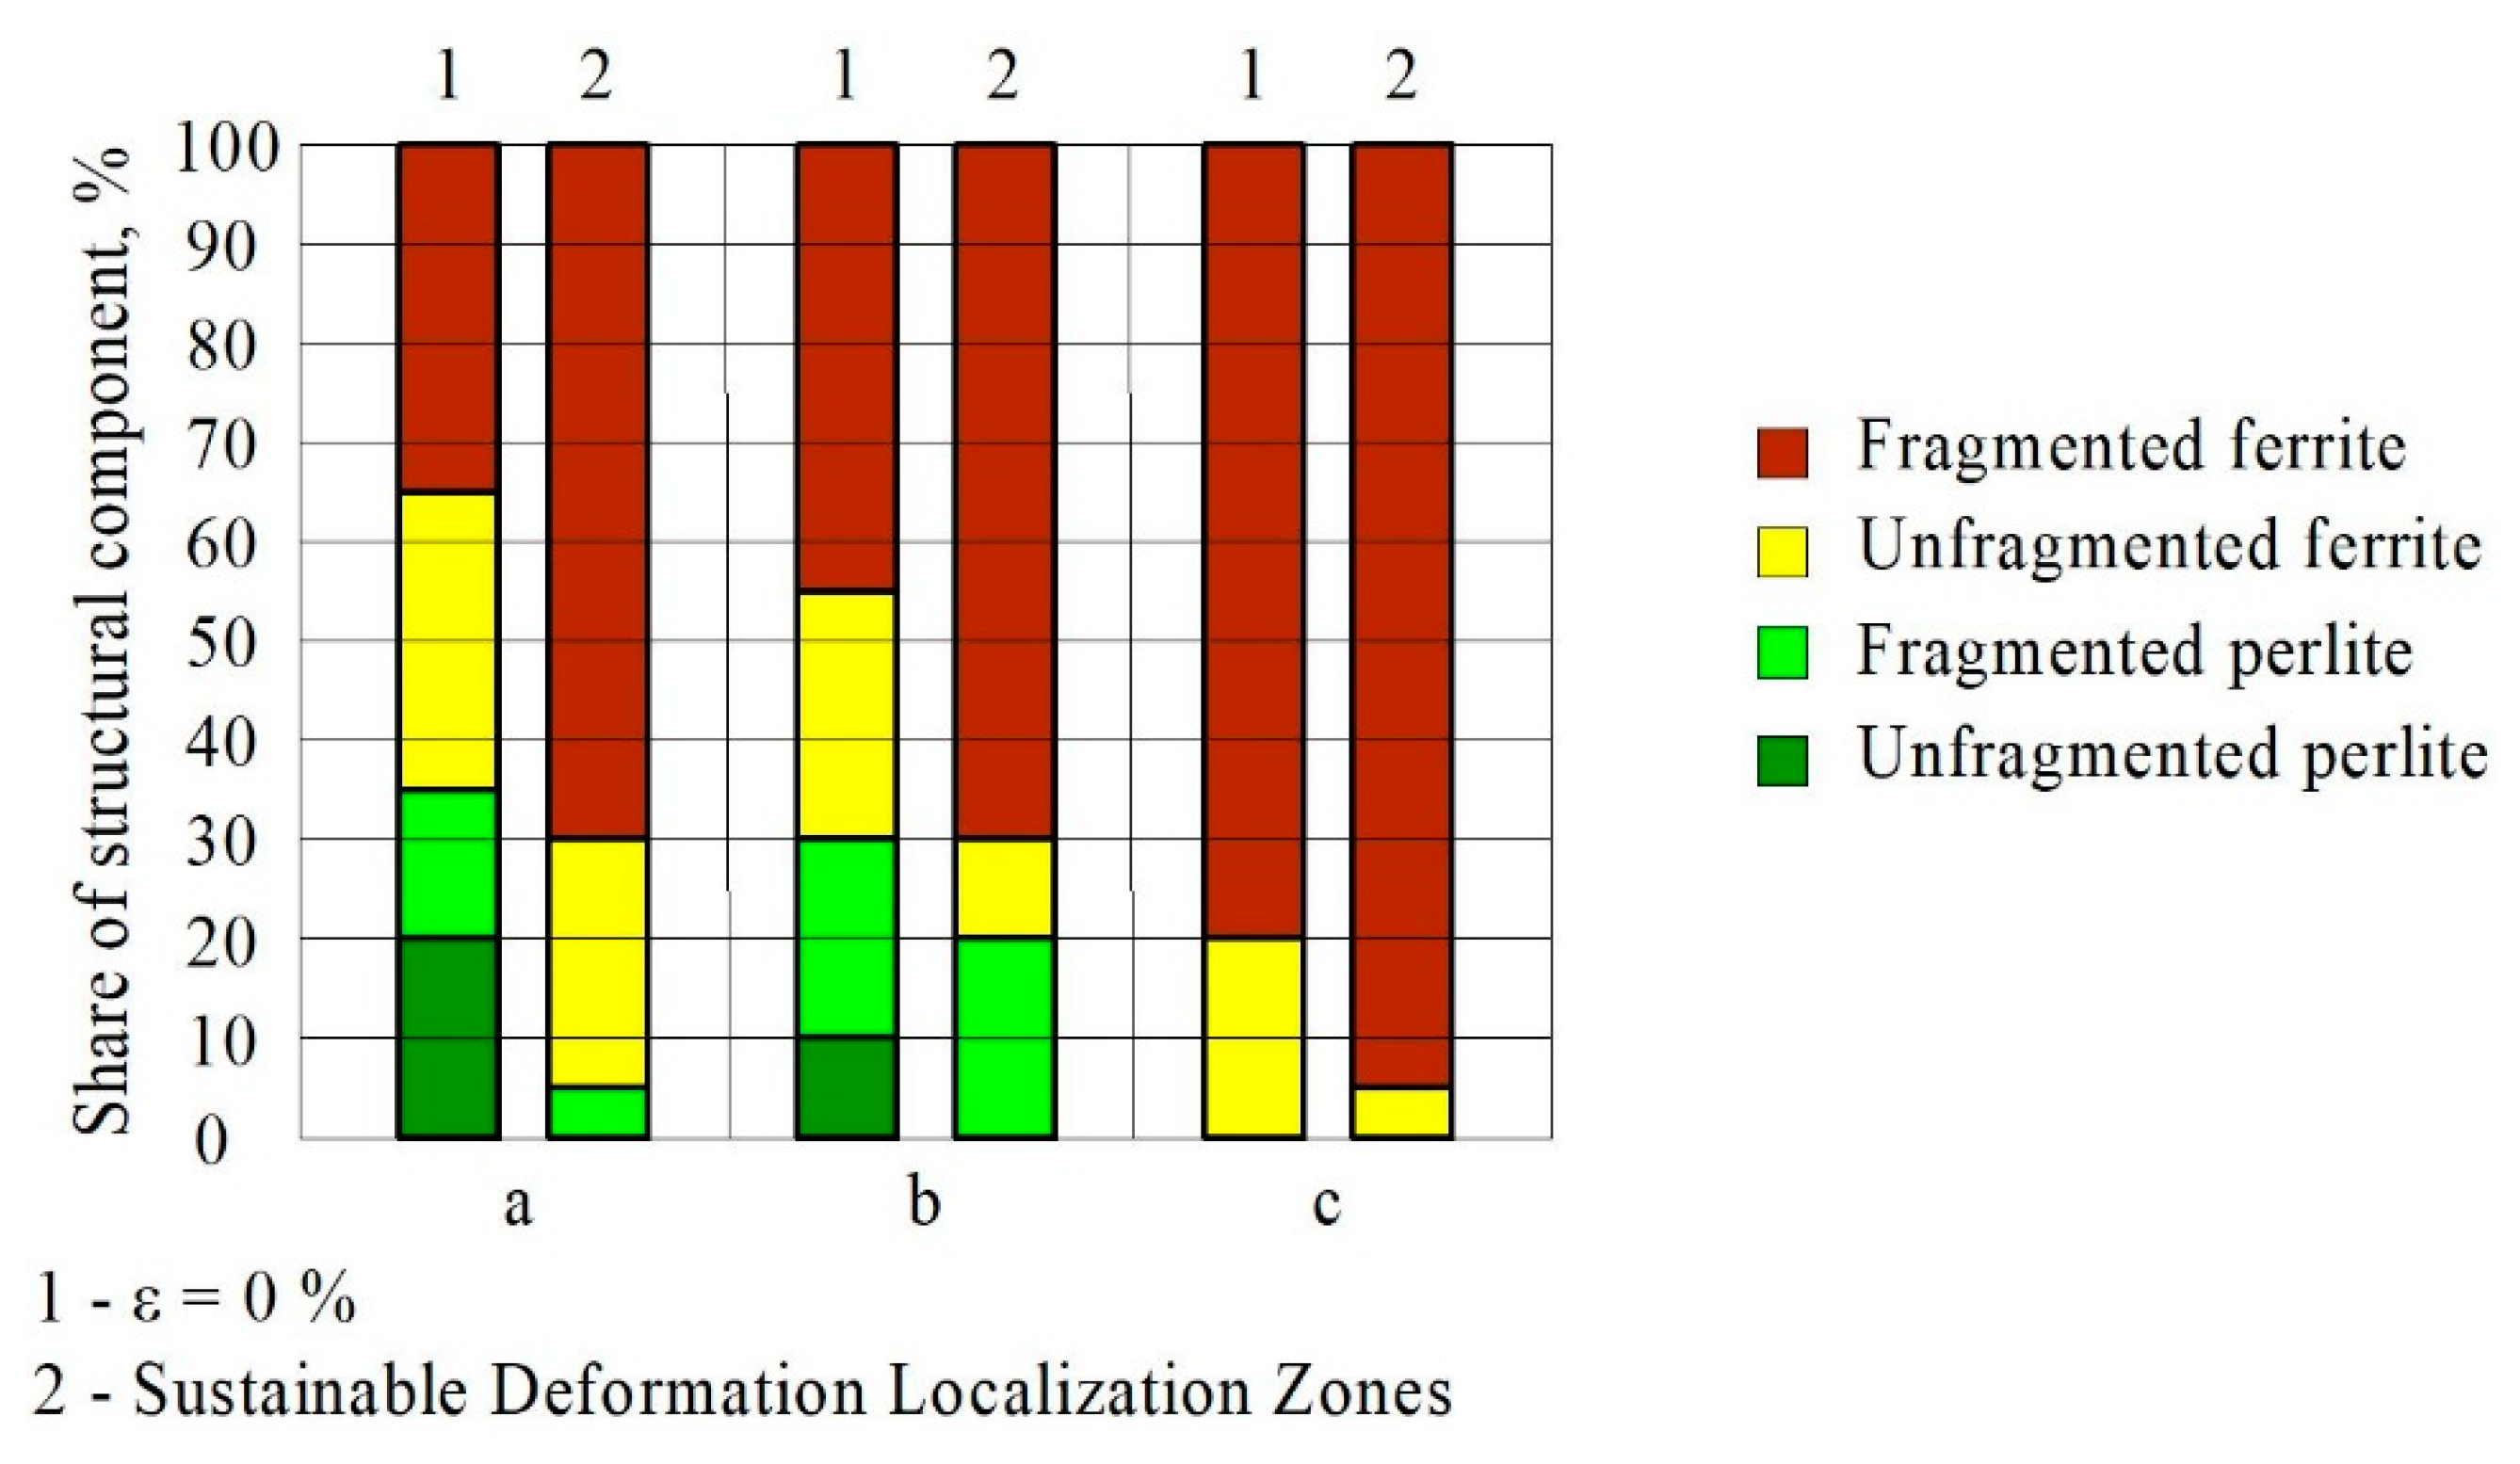
3.2. Structural-Phase State of Samples of Power Equipment Made of Structural and Heat-Resistant Steels before Deformation and in Zones of Stable Localization of Deformation

The matrix of 0.2 C steel is a α-phase—a solid solution of carbon and alloying elements (see Table 1) in α-Fe with a bcc crystal lattice in the initial state. The morphological components of the α-phase are lamellar perlite and ferrite. The volume fraction of lamellar perlite is 85%, ferrite—15% (Figure 4a). Typical images of the ferritic-pearlitic structure are shown in Figure 5.
Analysis of the research results showed that the metal matrix of 0.2 C steel sample after operation, but without destruction, is the phase—a solid solution of carbon and alloying elements in α-Fe with a bcc crystal lattice, as well as in the sample of the initial state. Lamellar pearlite and ferrite are also morphological components of the phase. The volume fraction of lamellar pearlite is 85%, ferrite—15%, as in the sample in initial state (Figure 4b). Typical images of the ferrite-pearlite structure are shown in Figure 6. From Figure 6, it follows that the structure of the metal in the zone of localized deformation of an undisturbed specimen is represented by lamellar pearlite, which is present in the form of unfragmented (also 25%) and fragmented (also 60%), as in the initial state. Ferrite is also presented unfragmented (5%) and partially fragmented (10%). The average value of the size of fragments in pearlite has slightly decreased and is equal to 0.7 μm, in ferrite it has not changed, i.e., is equal to 0.5 μm.
The metal matrix of the 0.2 C steel sample after long-term operation and destruction is also the α-phase—a solid solution of carbon and alloying elements in α-Fe with a bcc crystal lattice, as in the samples of the initial state and in the undisturbed sample. Lamellar pearlite and ferrite are also morphological components of the phase. The volume fraction of lamellar pearlite is also 85%, ferrite—15% (Figure 4c).
Lamellar perlite is also present in the form of unfragmented (Figure 7) and fragmented. Unfragmented lamellar pearlite is defective and even partially destroyed. Destroyed cementite plates were not detected in the original and undisturbed samples. This is the first difference in the structure of the metal of the destroyed sample. The volume fraction of unfragmented lamellar pearlite is also 25% of the volume of the material.
Consequently, in the structure of the metal of the sample after prolonged operation and destruction in the zone of localized deformation, fragmented lamellar pearlite is present as a set of the following structures: (1) dislocation fragments (45%) with an average size of 0.4 μm, inside which cementite particles of a rounded configuration are present on dislocations, along the boundaries of the fragments—lamellar particles of cementite; (2) microcrystalline structure (10%)—micrograins (or dislocation-free fragments), surrounded by cementite interlayers, the average size of which is ~0.2 μm, and (3) nanocrystalline structure (5%) with a dislocation-free grains (fragments) size of 55 nm, at the joints which revealed particles of cementite.
All ferrite grains are partially fragmented in the fractured sample compared to the original and non-fractured samples.
The matrix of 0.12C-1Cr-1Mo-1V steel in a state without operation in deformation localization zones is an-phase—a solid solution of carbon and alloying elements in α-Fe with a bcc crystal lattice. The morphological components of the α-phase are pearlite (5%) and ferrite—95% (the fraction of fragmented ferrite is 70%) (Figure 8a). The dislocation substructure in ferrite interlayers is reticulate (Figure 9). Deformation led not only to the destruction of cementite plates, but also to an increase in the scalar dislocation density in ferrite interlayers and further polarization of the dislocation structure. Now the value ρ = 3.43 × 1010 cm−2. The amplitude of the curvature-torsion of the ferrite crystal lattice is χ = 560 cm−1, the excess dislocation density ρ± = 2.24 × 1010 cm−2, but the condition ρ > ρ± is preserved in pearlite.
The matrix of 0.12C-1Cr-1Mo-1V steel in the state after operation (260 thousand hours) without destruction, as well as for the state without operation in the zones of localization of deformation, is the phase—a solid solution of carbon and alloying elements in α-Fe with a bcc crystal lattice. The morphological components of the α-phase are pearlite (22%) and ferrite—78% (fragmented ferrite 63%) (Figure 8b). In the zone of localized deformation, pearlite is almost completely destroyed (Figure 10). The volume fraction of cementite in pearlite grains is 4.8%.
The dislocation substructure in ferrite interlayers is mesh. The scalar dislocation density is 3.25 × 1010 cm−2. The dislocation structure in pearlite grains is polarized. Amplitude of curvature-torsion χ = 455 cm−1, excess density of dislocations ρ± = 1.82 × 1010 cm−2, i.e., as before, ρ > ρ±. The average amplitude of shear stress σL = 360 MPa, and the average amplitude of long-range (local) stresses has a value of σd = 270 MPa, i.e., also σL > σd. This means that the bending-torsion of the crystal lattice of ferrite in pearlite grains is also created by the dislocation structure and is of a purely plastic nature.
After operation, the structure of 0.12C-1Cr-1Mo-1V steel underwent significant changes: the proportion of the pearlite component decreased significantly, and the average size of pearlite colonies decreased by half. The tendency towards a decrease in the content of pearlite in the destroyed state manifested itself even more clearly. The structure of the steel in this state is a mixture of ferrite with a small content of carbides (Figure 11), the volume fraction of which is 100% (the fraction of fragmented ferrite is 95%) (Figure 8c).

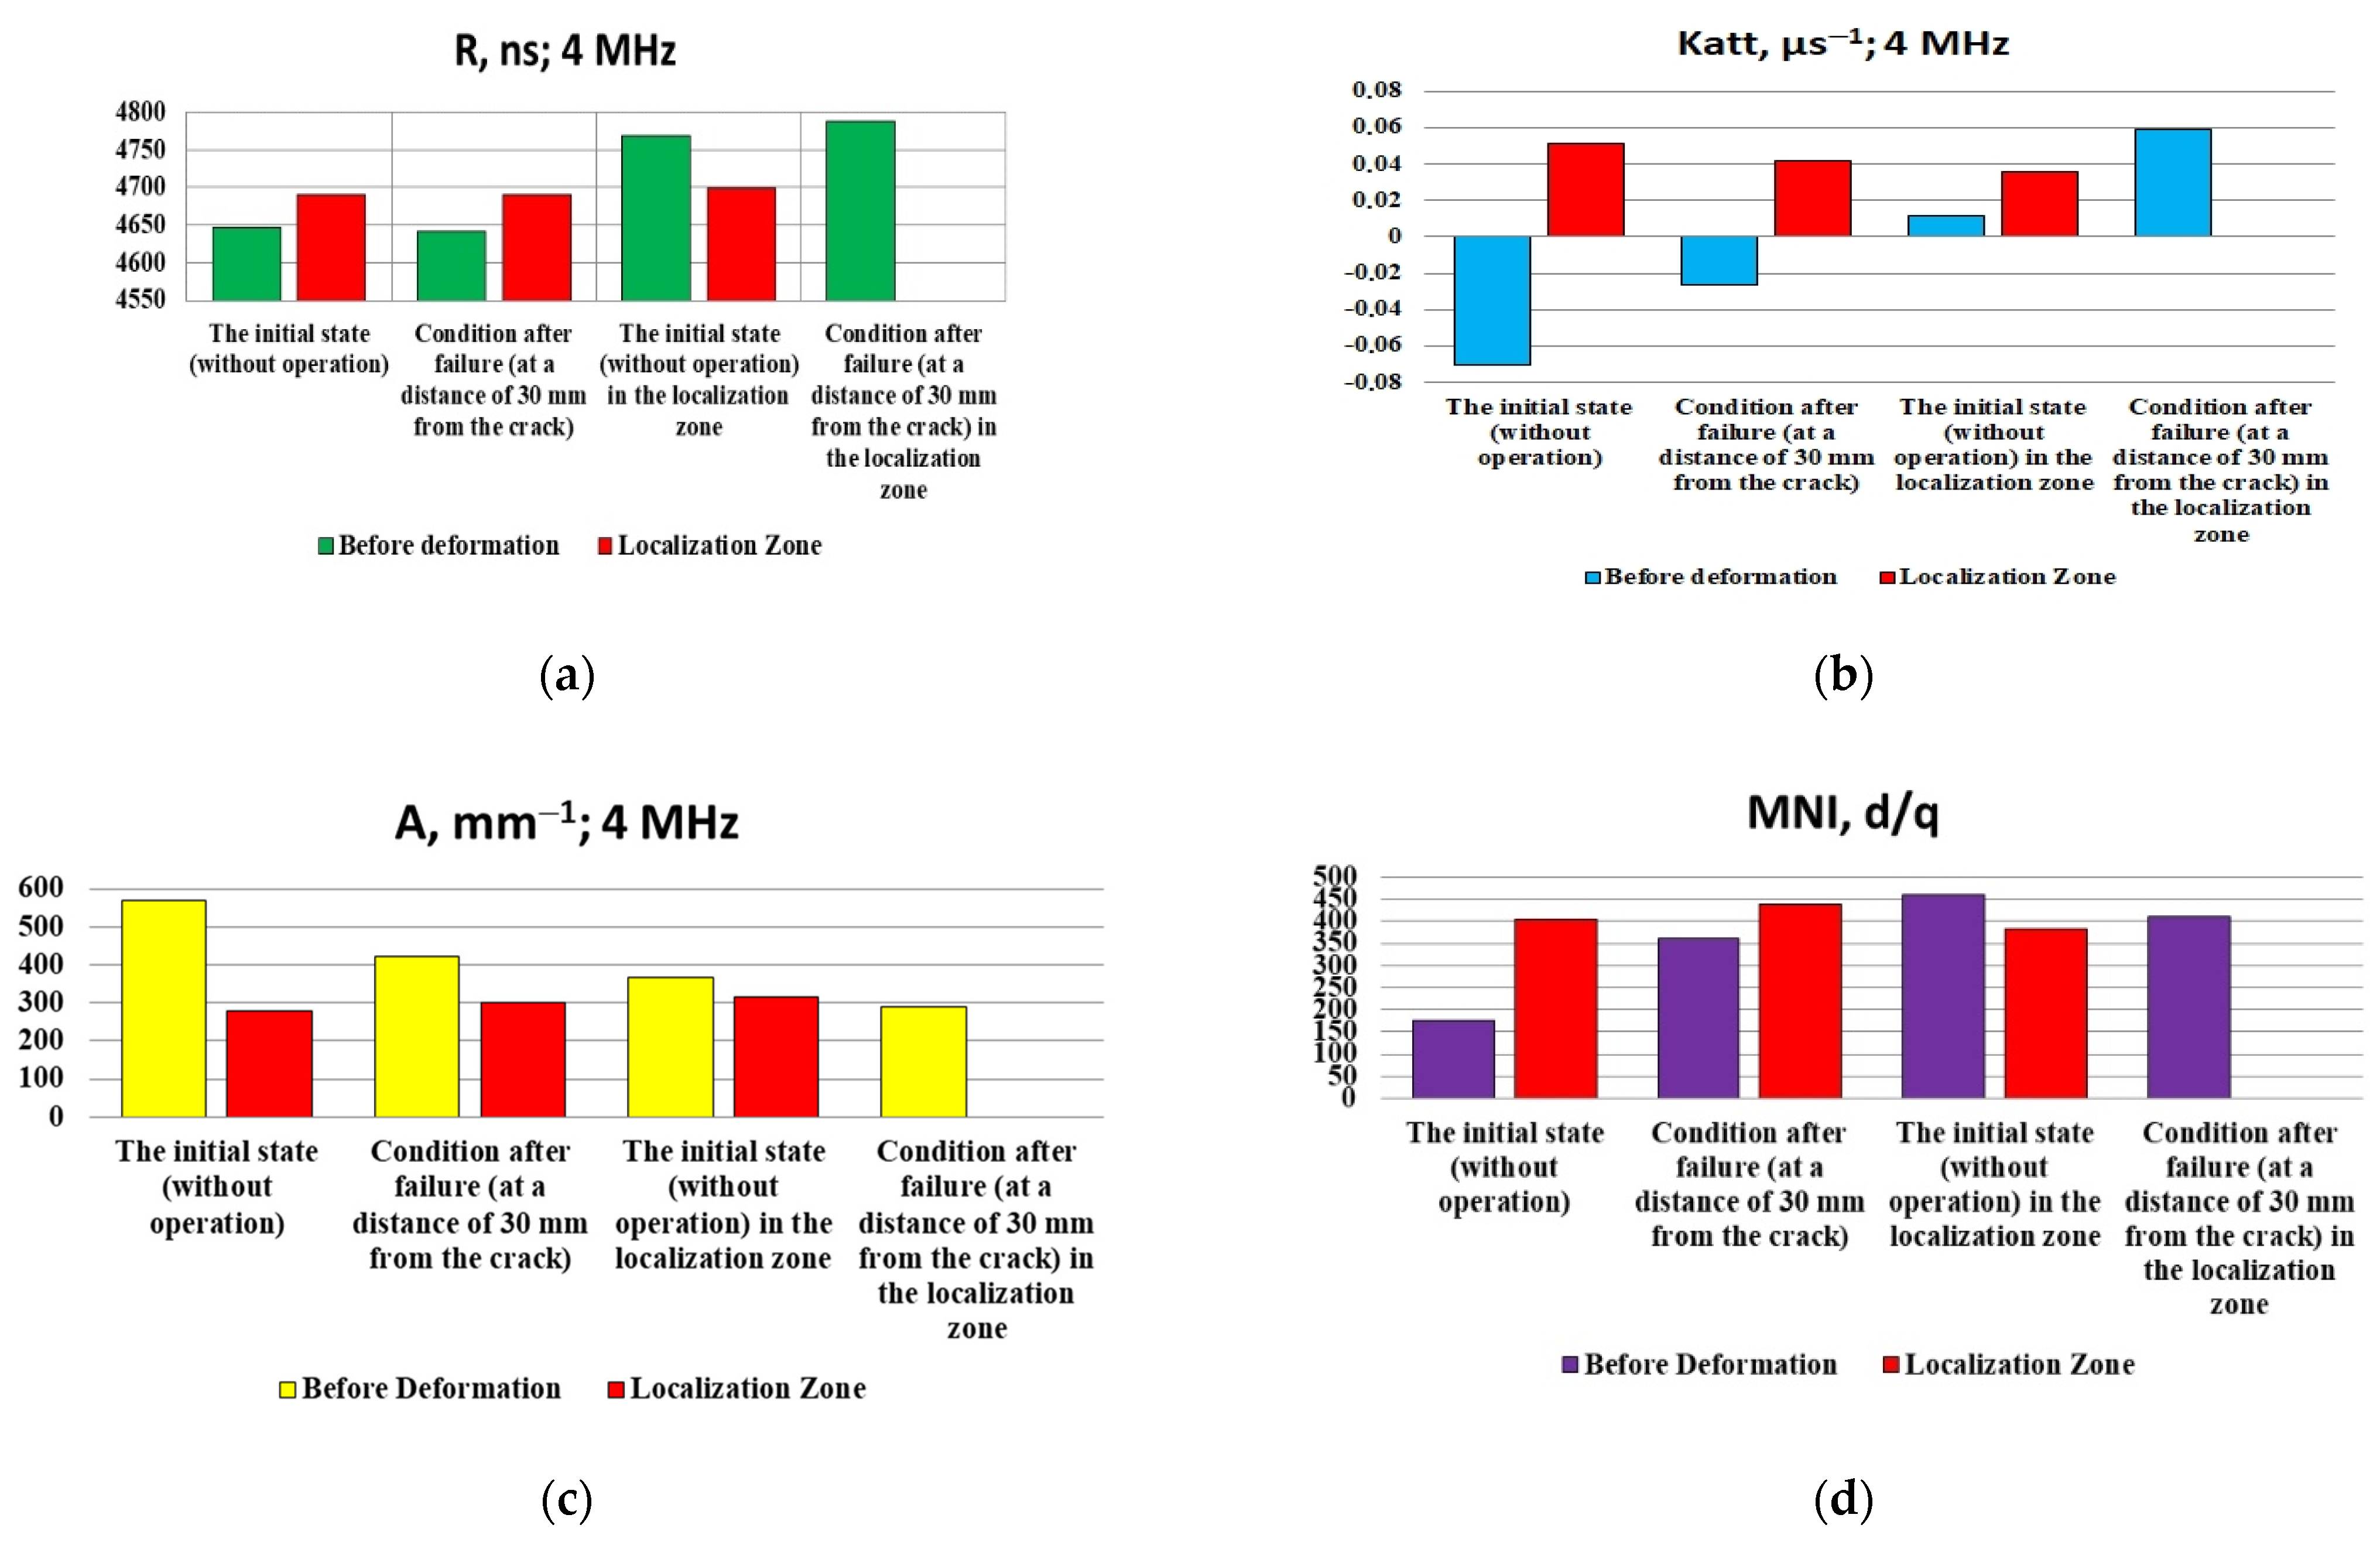
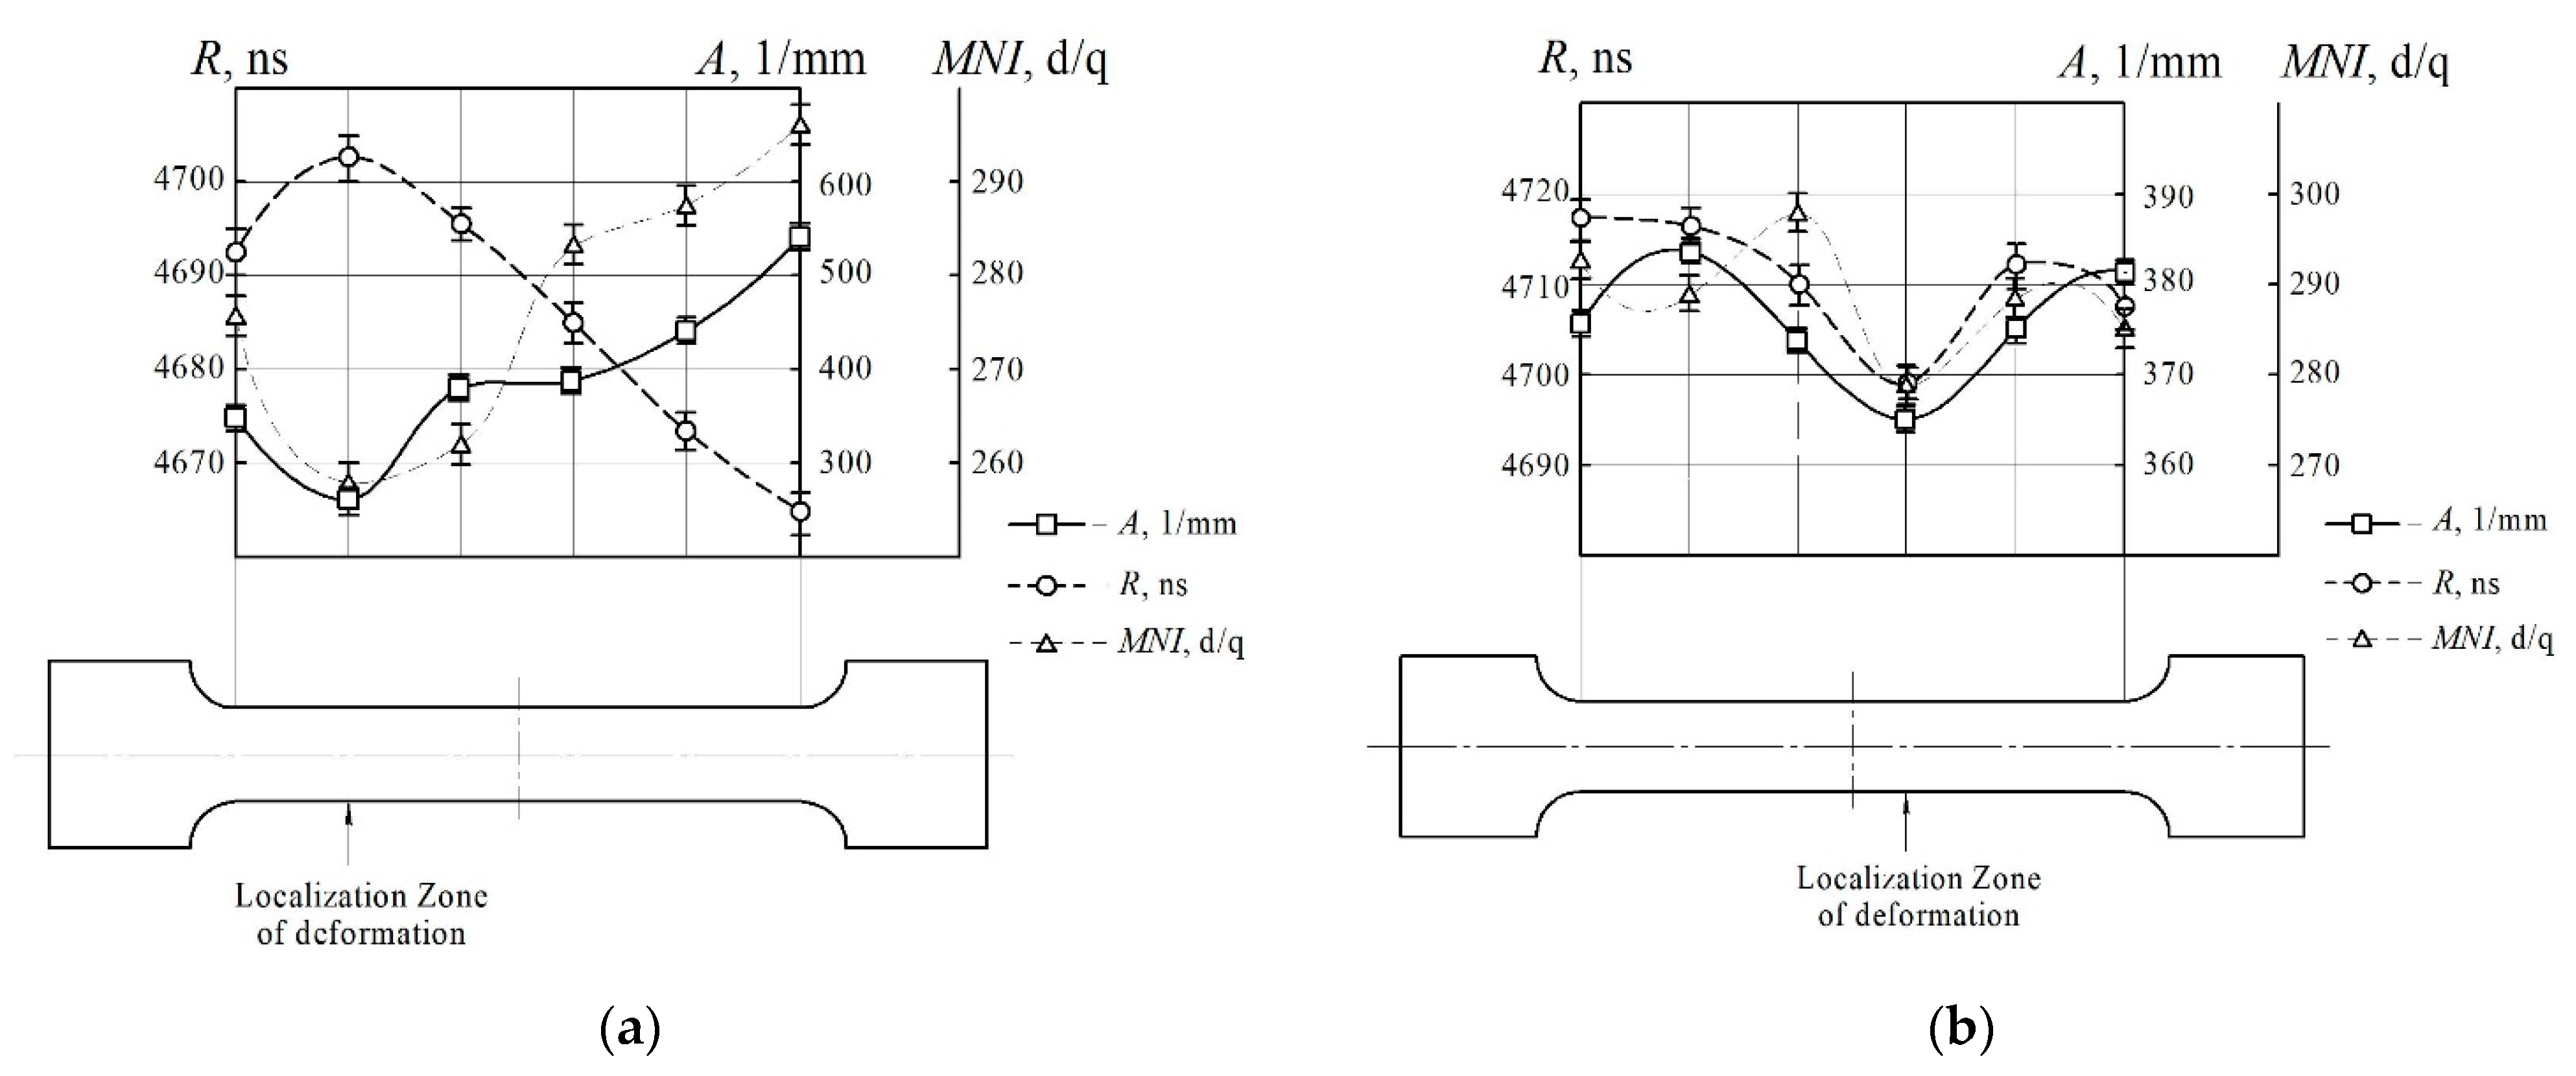
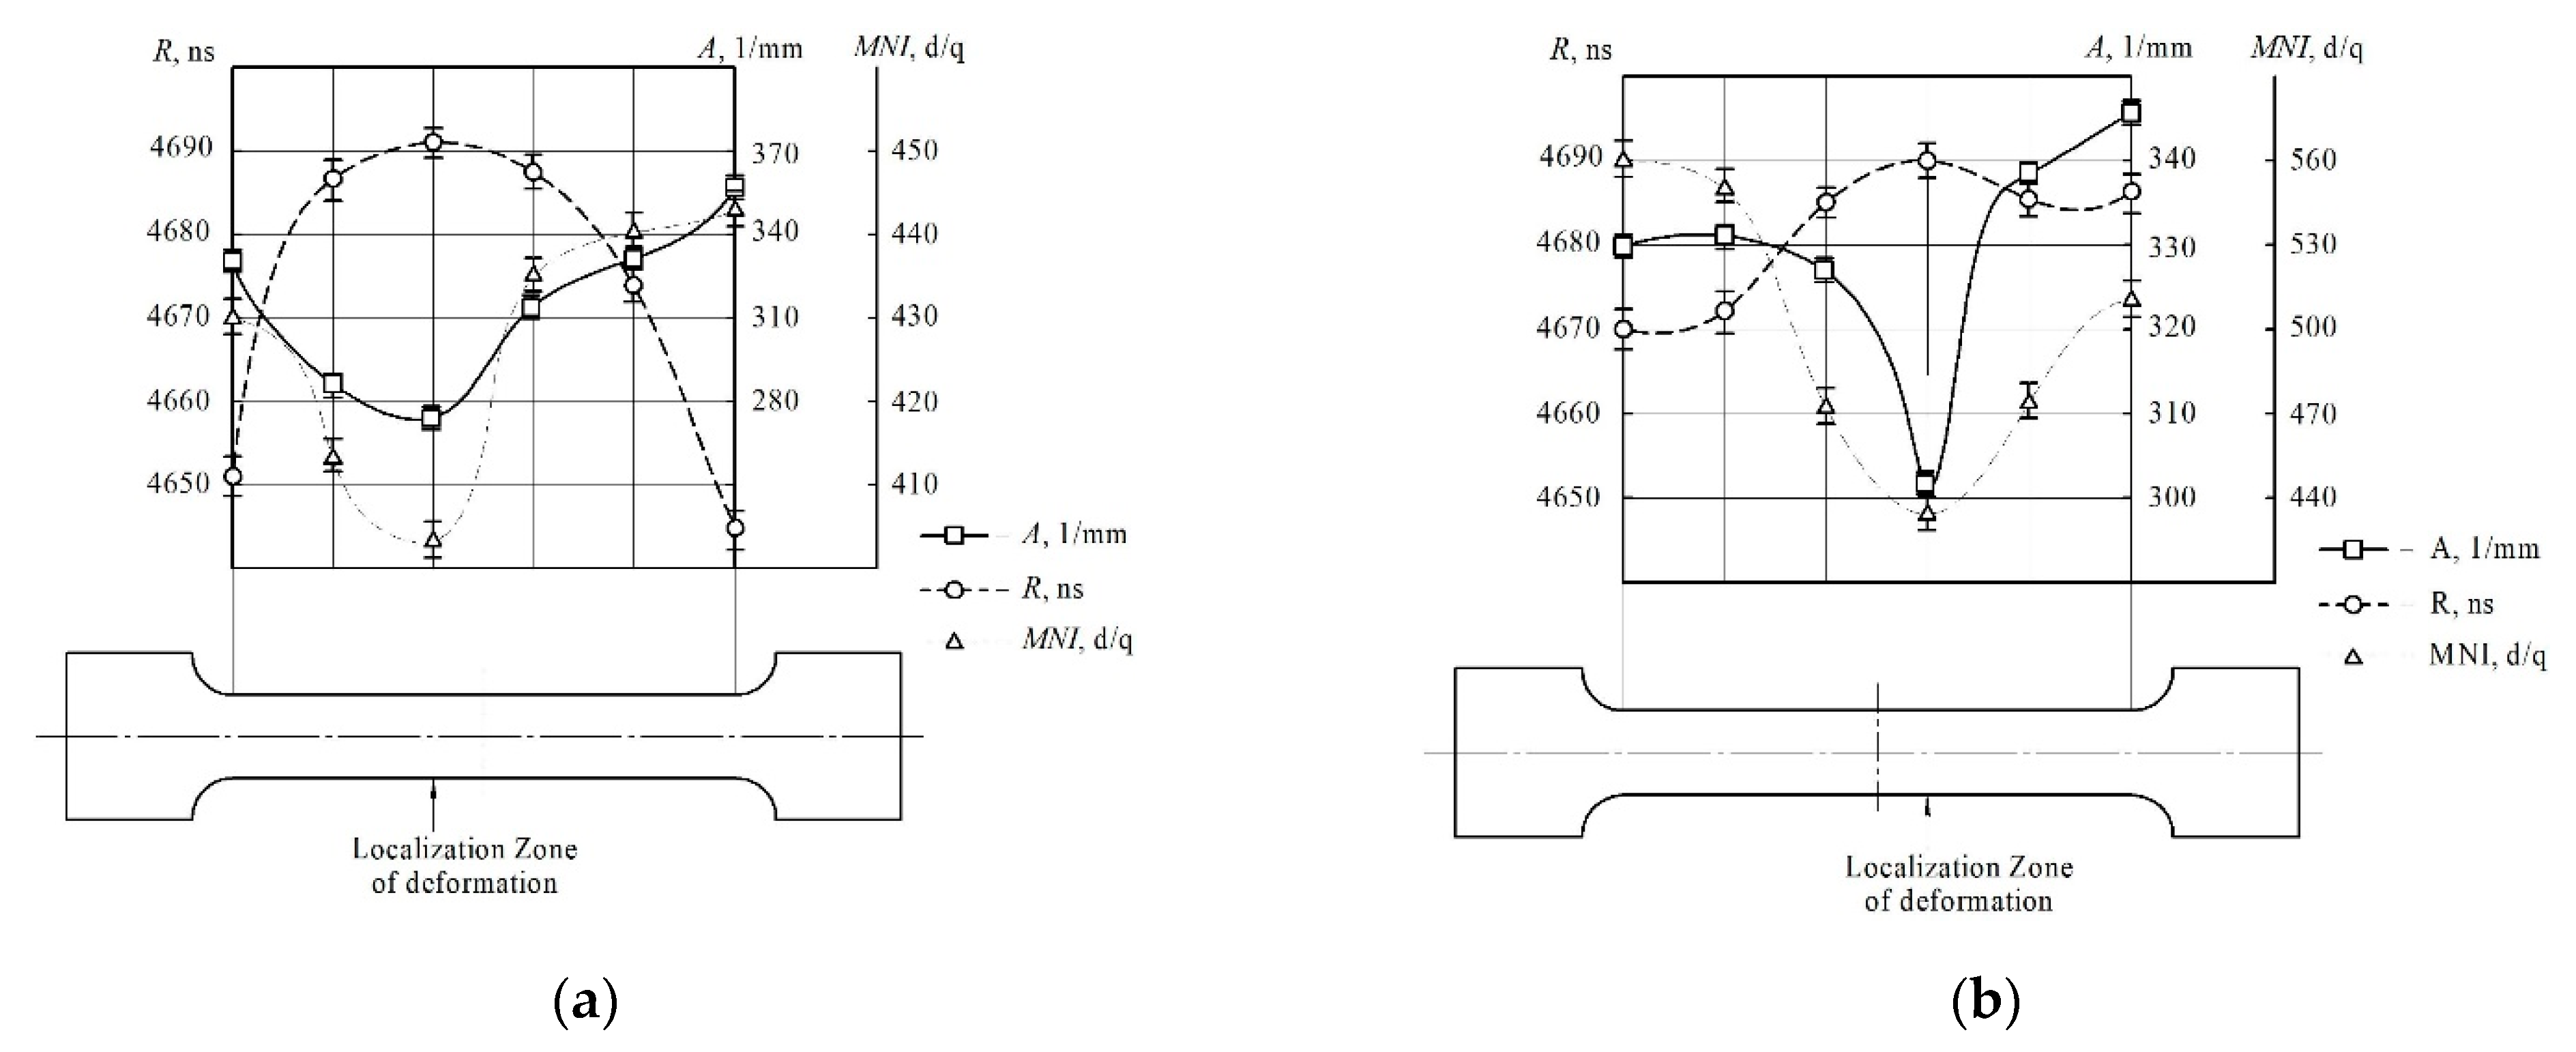
3.3. Acoustic and Magnetic Characteristics of Metal Samples of Power Equipment Made of Structural and Heat-Resistant Steels before Deformation and in Zones of Stable Deformation Localization

The possibility of cutting metal from an object is not always available during technical diagnostics and industrial safety expertise; therefore, often the only source of information about the state of the metal is non-destructive testing [35,36,37,38]. Currently, control methods are being developed and implemented, the measured characteristics of which are sensitive to changes in structure and mechanical characteristics. One of these methods is the spectral-acoustic control method [20,21,22,23,26].
The values of the characteristics of non-destructive testing for specimens of different states of low-carbon steel before deformation varied within: delay time of a surface acoustic wave from 4650 ± 3 ns to 4750 ± 3 ns (Figure 12a); attenuation coefficient of the surface acoustic wave 0.001 ± 0.002 μs−1 to 0.2 ± 0.003 μs−1 (Figure 12b); the amplitude range of the received signal of the surface acoustic wave is from 387 ± 11 mm−1 to 172 ± 12 mm−1 (Figure 12c) and the intensity of magnetic noise is 290 ± 31 to 350 ± 19 units (Figure 12d). The characteristics of non-destructive tests for all investigated states of specimens made of 0.2 C steel in the zones of localization of deformation had similar values: the delay time of the surface acoustic wave was 4700 ± 3 ns (Figure 12a); attenuation coefficient of the surface acoustic wave 0.006 ± 0.003 μs−1 (Figure 12b); the amplitude of the received signal of the surface acoustic wave is 227 ± 12 mm−1 (Figure 12c) and the intensity of magnetic noise is 275 ± 31 units (Figure 12d), which indicates the invariability of the characteristics of non-destructive tests in zones of stable localization of deformation.
Similar results during testing by non-destructive methods were established for samples of heat resistant 0.12C-1Cr-1Mo-1V steel (Figure 13).

4. Discussion

4.1. Discussion of the Results of Mechanical Tests of Samples of Power Equipment Made of Structural and Heat-Resistant Steels

Analysis of the mechanical tests results of power equipment samples made of structural steels showed that at the initial stage of loading there is no movement of localized deformation sites, and the plastic flow is formed relatively uniformly throughout the sample volume until a zone of stable deformation localization appears. This zone with an almost constant coordinate is formed before reaching the maximum value of the stress σB. With further stretching, the magnitude of local deformations in this region increases, while in the rest of the sample volume it practically does not change. Destruction is ultimately realized at a given point in the sample. The time of formation of a stable zone of localization of deformation tloc is correlated with the time of reaching the maximum stress value tB and with the total time of stretching of the specimen before fracture tcrac.
This evolution of deformation localization patterns, which is associated with the appearance of stable deformation localization zones, manifests itself both in the initial state and in any other state, including after prolonged operation. Thus, it is always possible to determine the time of occurrence of tloc, where further necking is formed and destruction occurs, it can always be determined. Table 2 shows the tloc values for all tested samples. So, after long-term operation, the average value of the formation time of a stable localization zone decreased by more than three times in comparison with the initial state.
The difference in the time intervals tloc is due to fluctuations in the plasticity for each of the considered states of the studied samples, which is expressed, for example, by the relative elongation before fracture δ. Since loading is carried out at a constant speed vload, then there is a direct relationship between the test time and the deformation of the sample.
ε l o c = v l o a d t l o c l 0 ,
where l0 is the original length of the sample. Then the ratio of the time intervals tloc and tcraca1 shows the fraction of uniform deformation from the entire deformation of the material before fracture.
a 1 = t l o c t c r a c = ε l o c δ ,
After normalizing for a time tuts that corresponds to the maximum stress σuts, it is possible to determine the fraction of the homogeneous deformation before the beginning of the falling part of the loading curve a2.
a 2 = t l o c t u t s = ε l o c ε u t s ,
It follows from Table 2 that the average values of the parameters a1 and a2 differ significantly for the analyzed states of the material. The maximum differences were noted for the parameter a2, which also shows the smallest variation in each series of tested samples (0.82 ± 0.06 for the initial state and 0.51 ± 0.11 for the state after use).
The formation of a stable localization zone is associated with the onset of the collapse of the autowave of localized plastic deformation in the framework of the autowave theory of deformation [9,10,11], namely, with the movement of the autowave into the fracture neck. The collapse of an autowave of localized deformation is characterized by the exponents tloc, εloc, and the parameter a2 in this work. It can be seen (Table 2) that in the initial state, the collapse starts much later than in the state after long-term operation. In this case, the duration of the collapse in both states is equal. Thus, uniform deformation of the material in the initial state without the risk of the formation of stress localization zones will be observed even if in the stress concentration areas, the deformation is several percent during stress tests. The maximum deformation value in this case is determined by the parameter a2 = 0.82. In the state after long-term operation, the parameter a2 decreased to 0.51, that is, by 40%.
At the same time, individual patterns of the formation of stable localization zones in 0.2 C steel and the conclusions drawn on the basis of these patterns are applicable to 0.12C-1Cr-1Mo-1V steel. For example, the criteria a1 and a2, which characterize the resources of the consumed plasticity before fracture and before the beginning of neck formation, respectively, can be used to assess the resource of long-term operating power equipment.

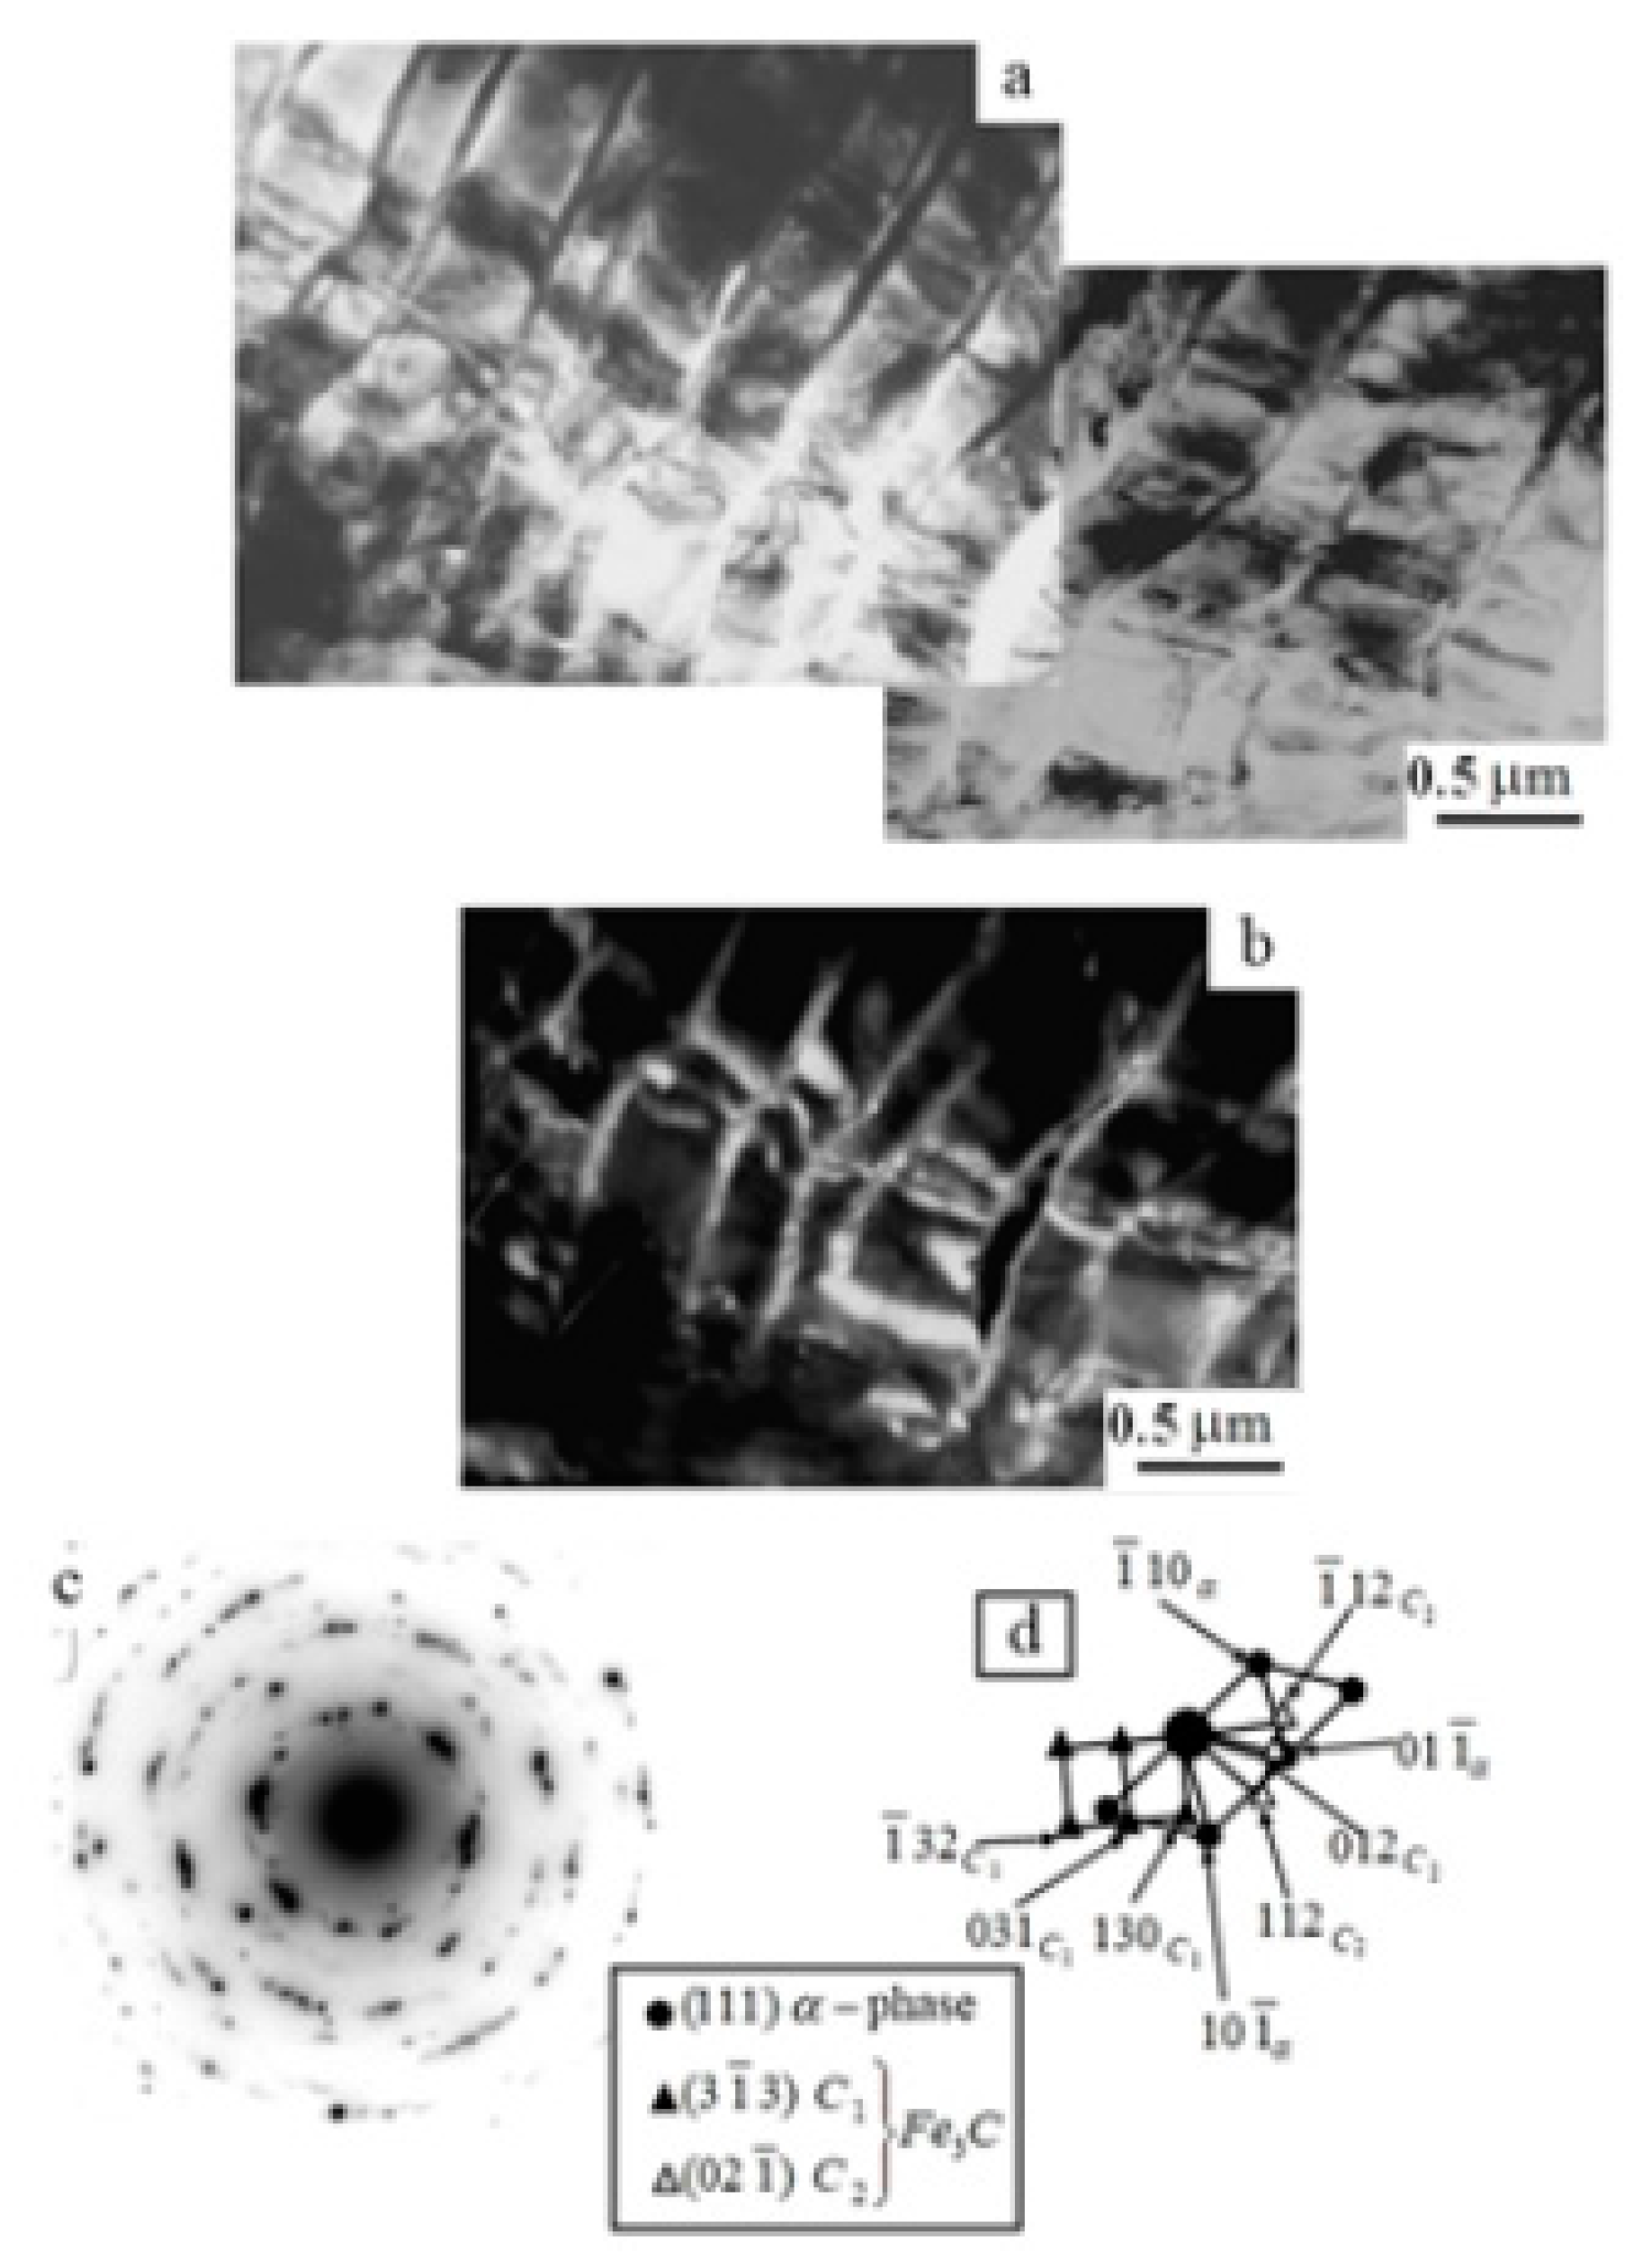
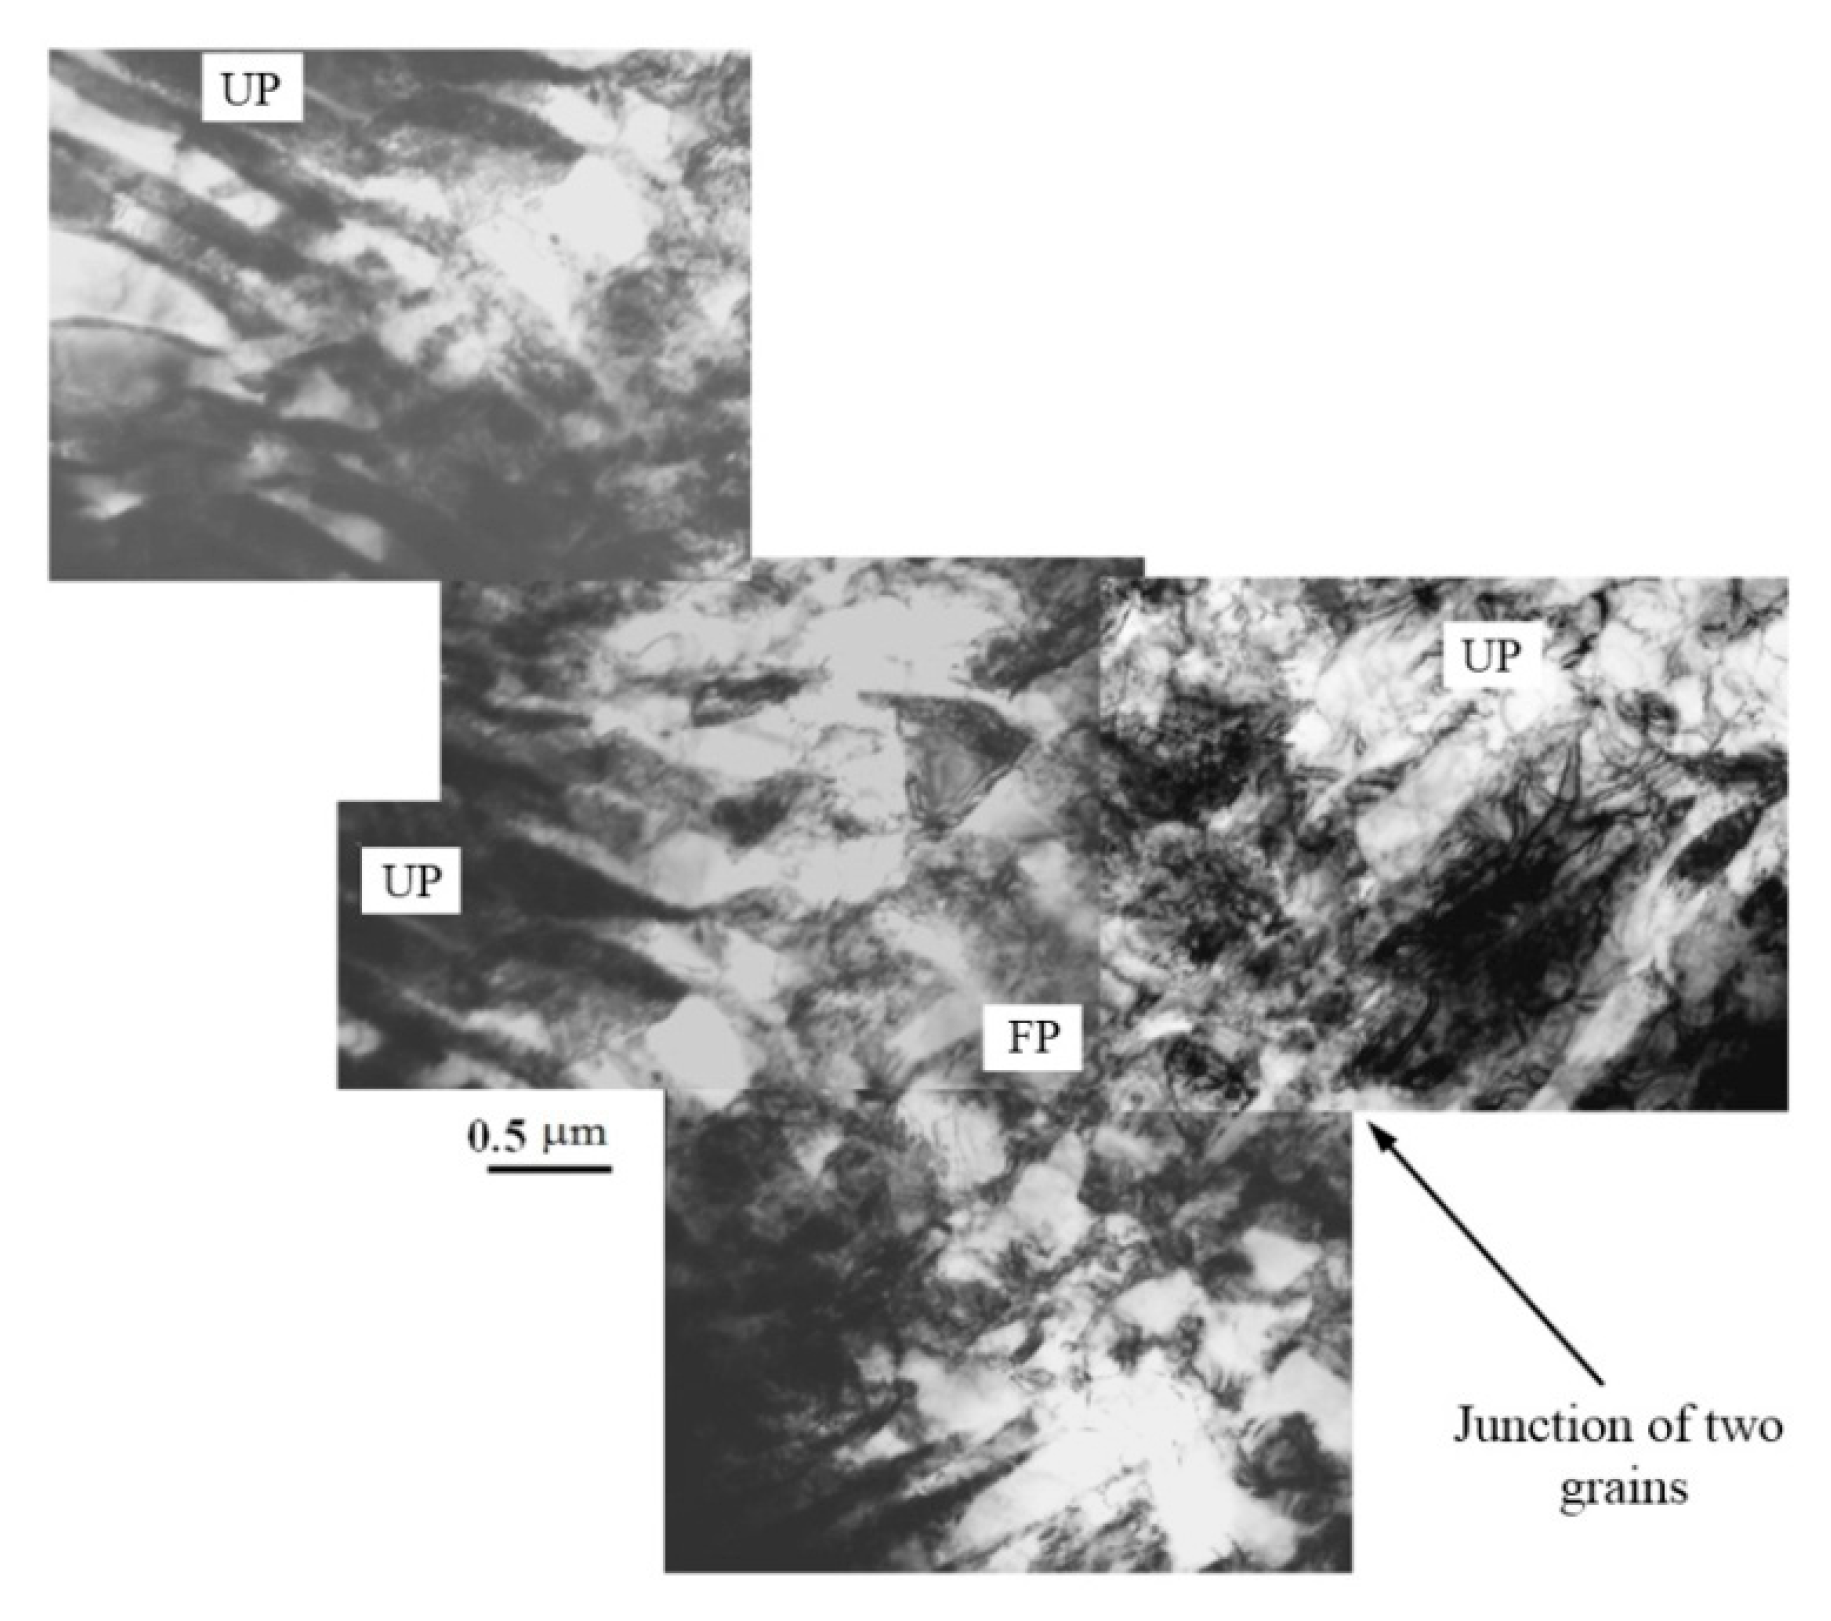
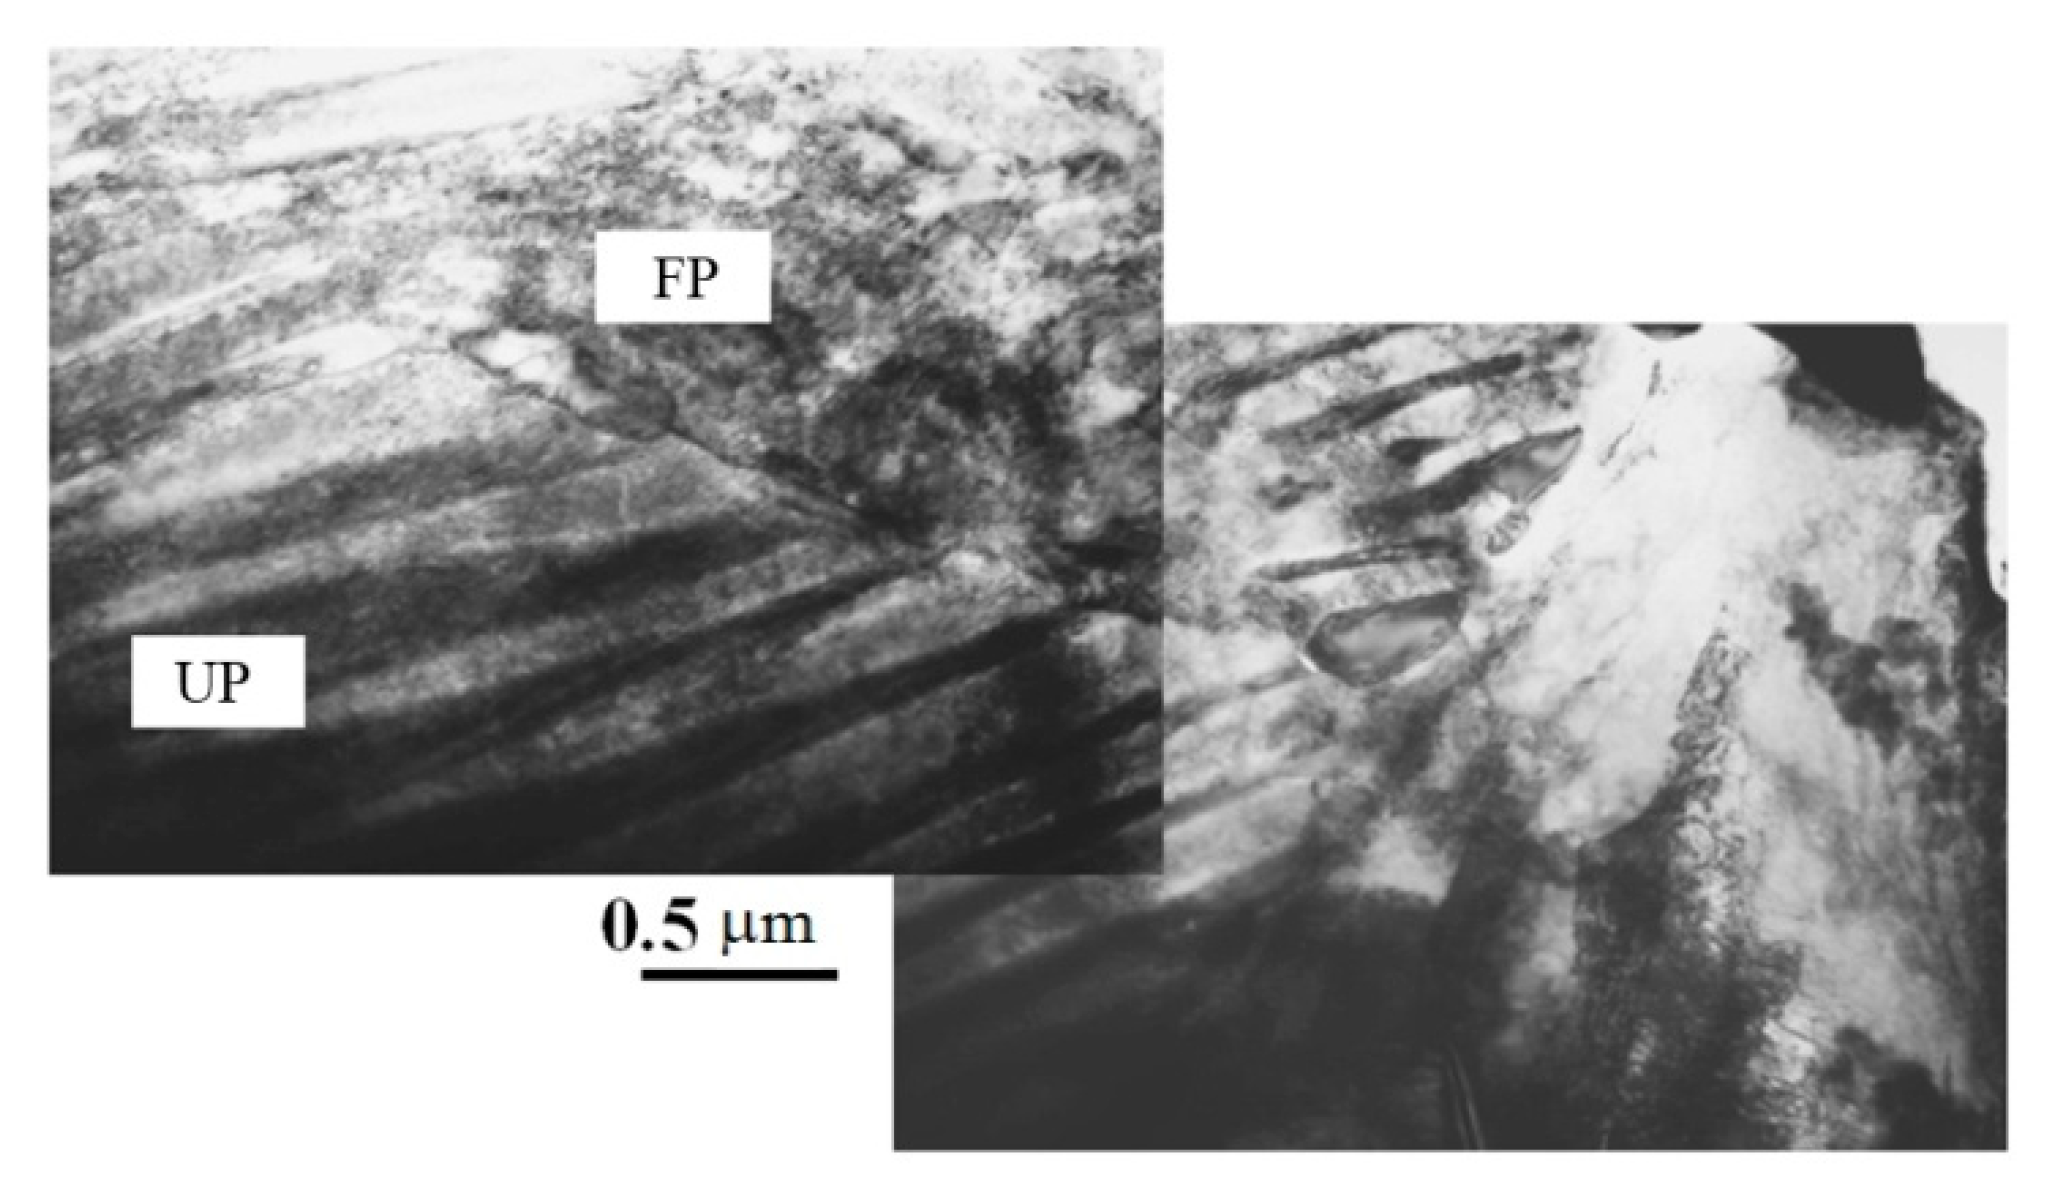
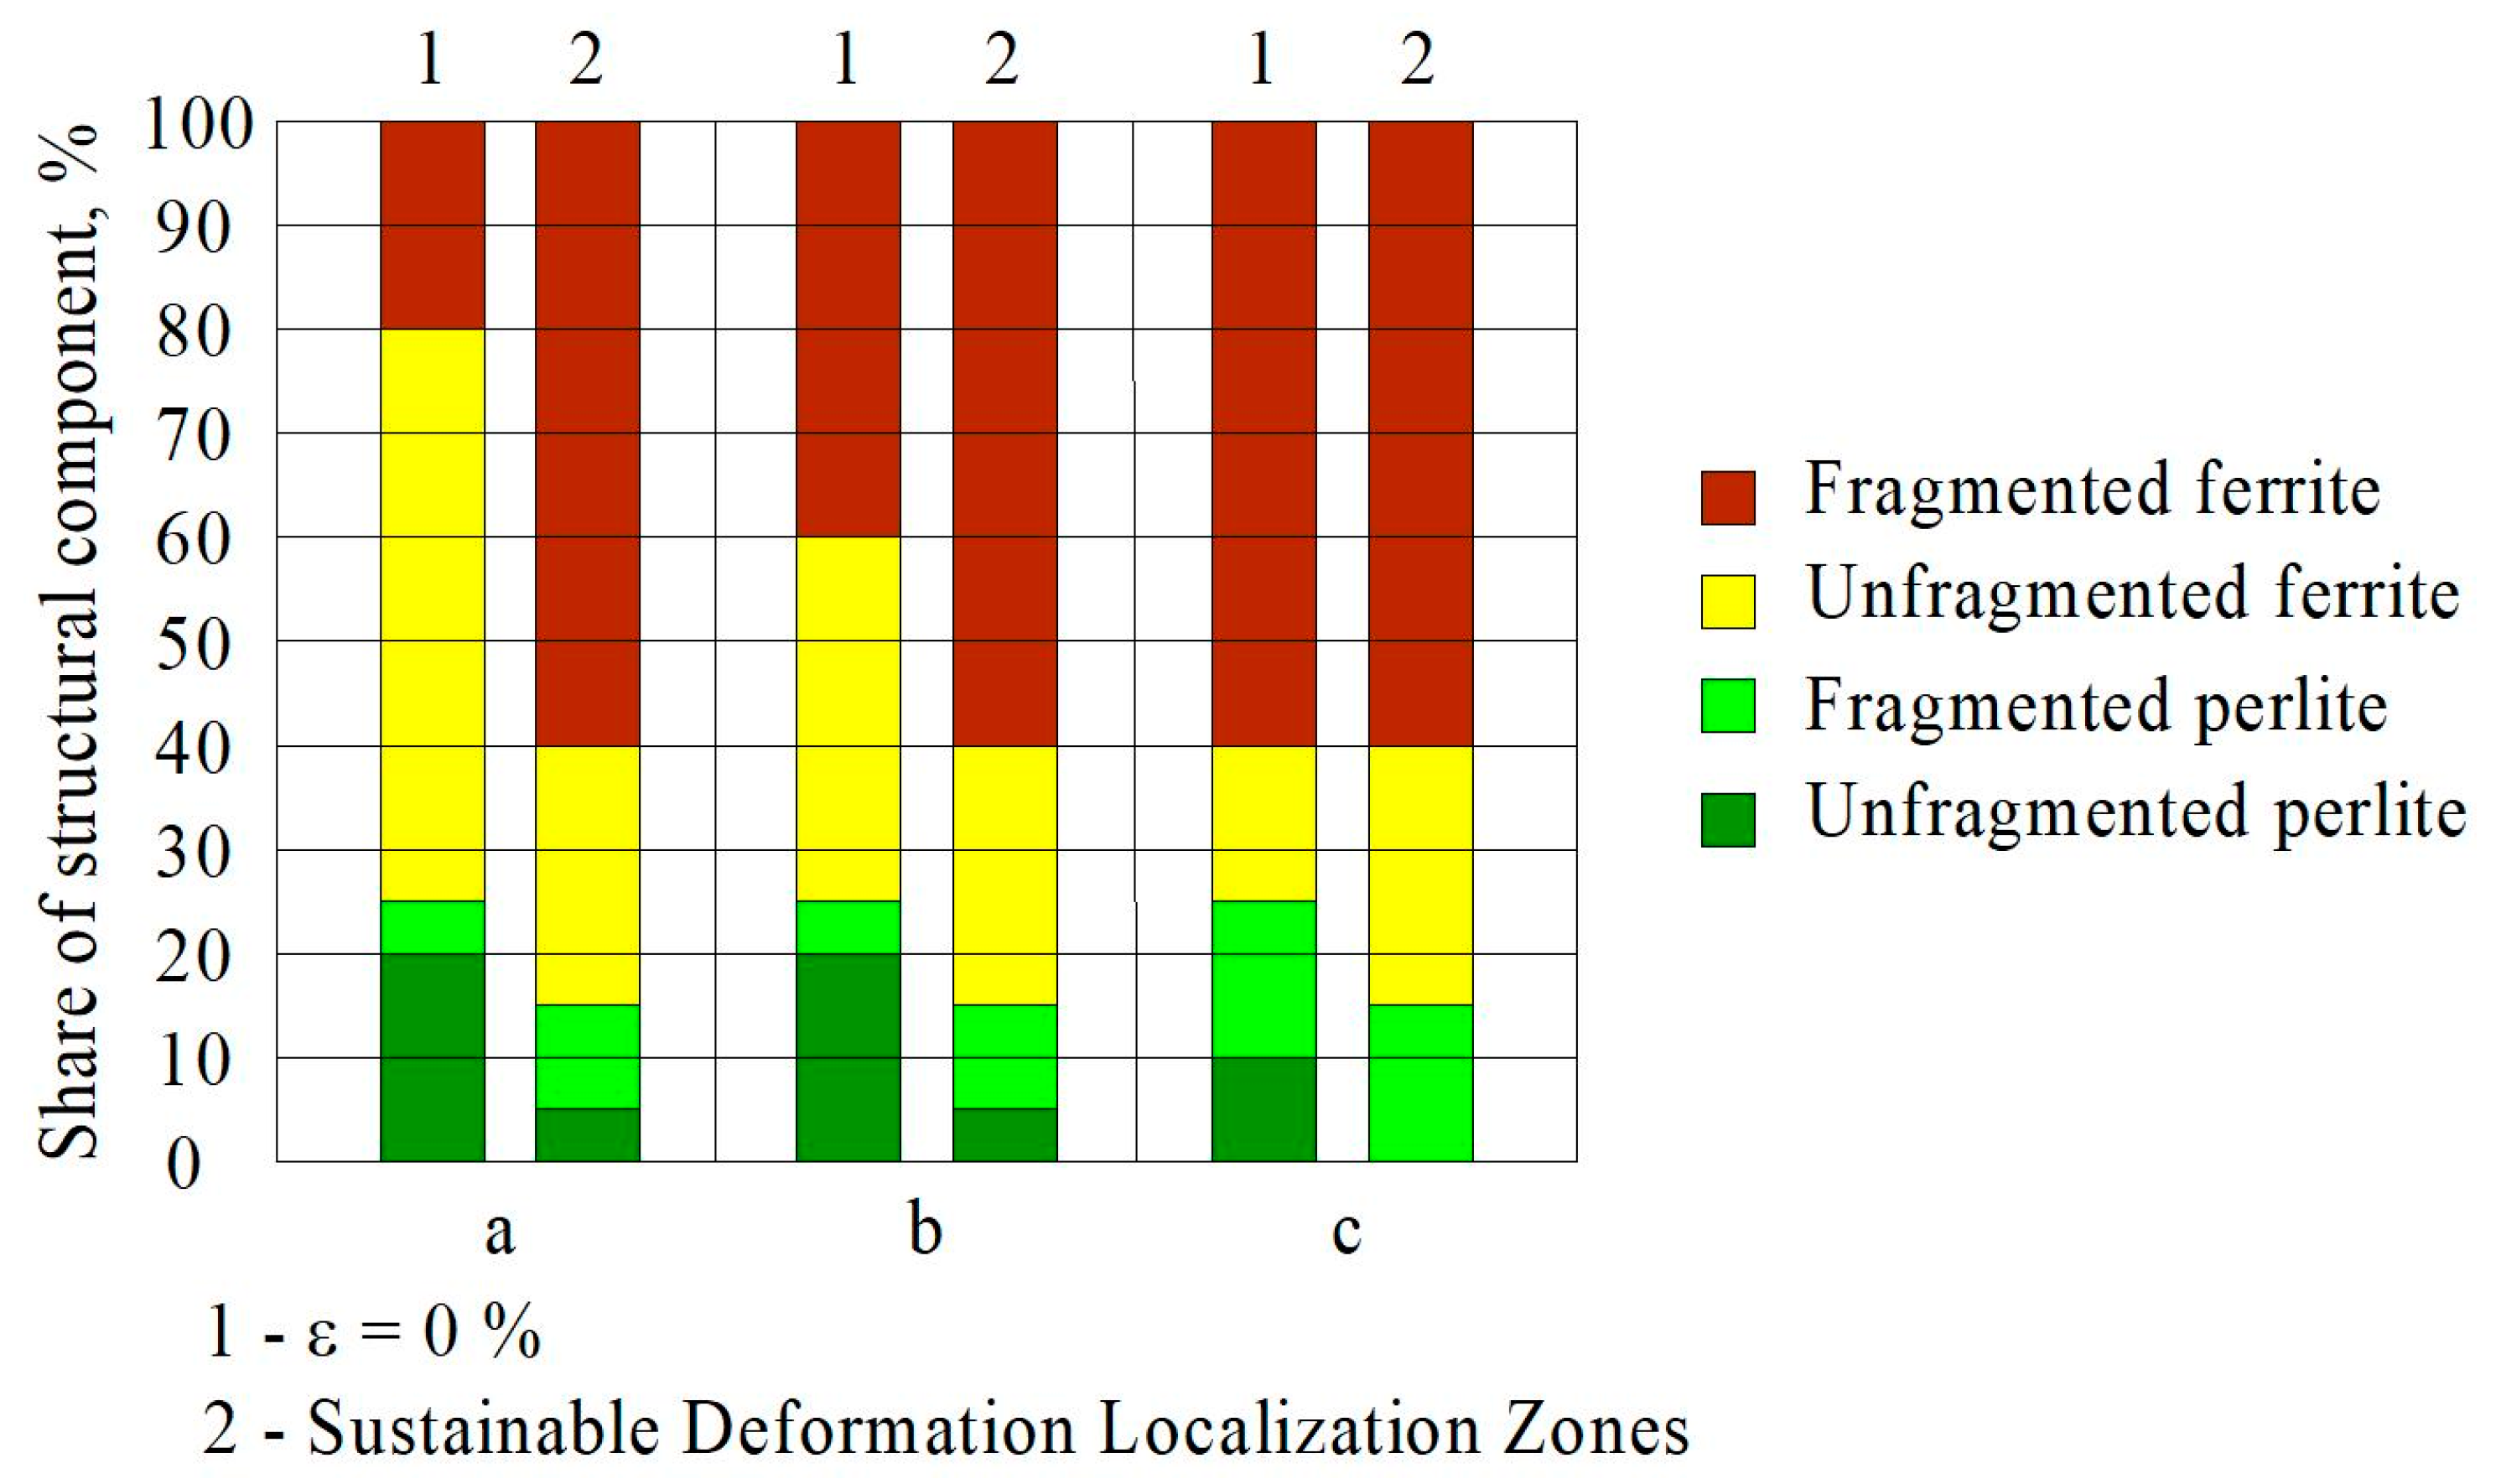
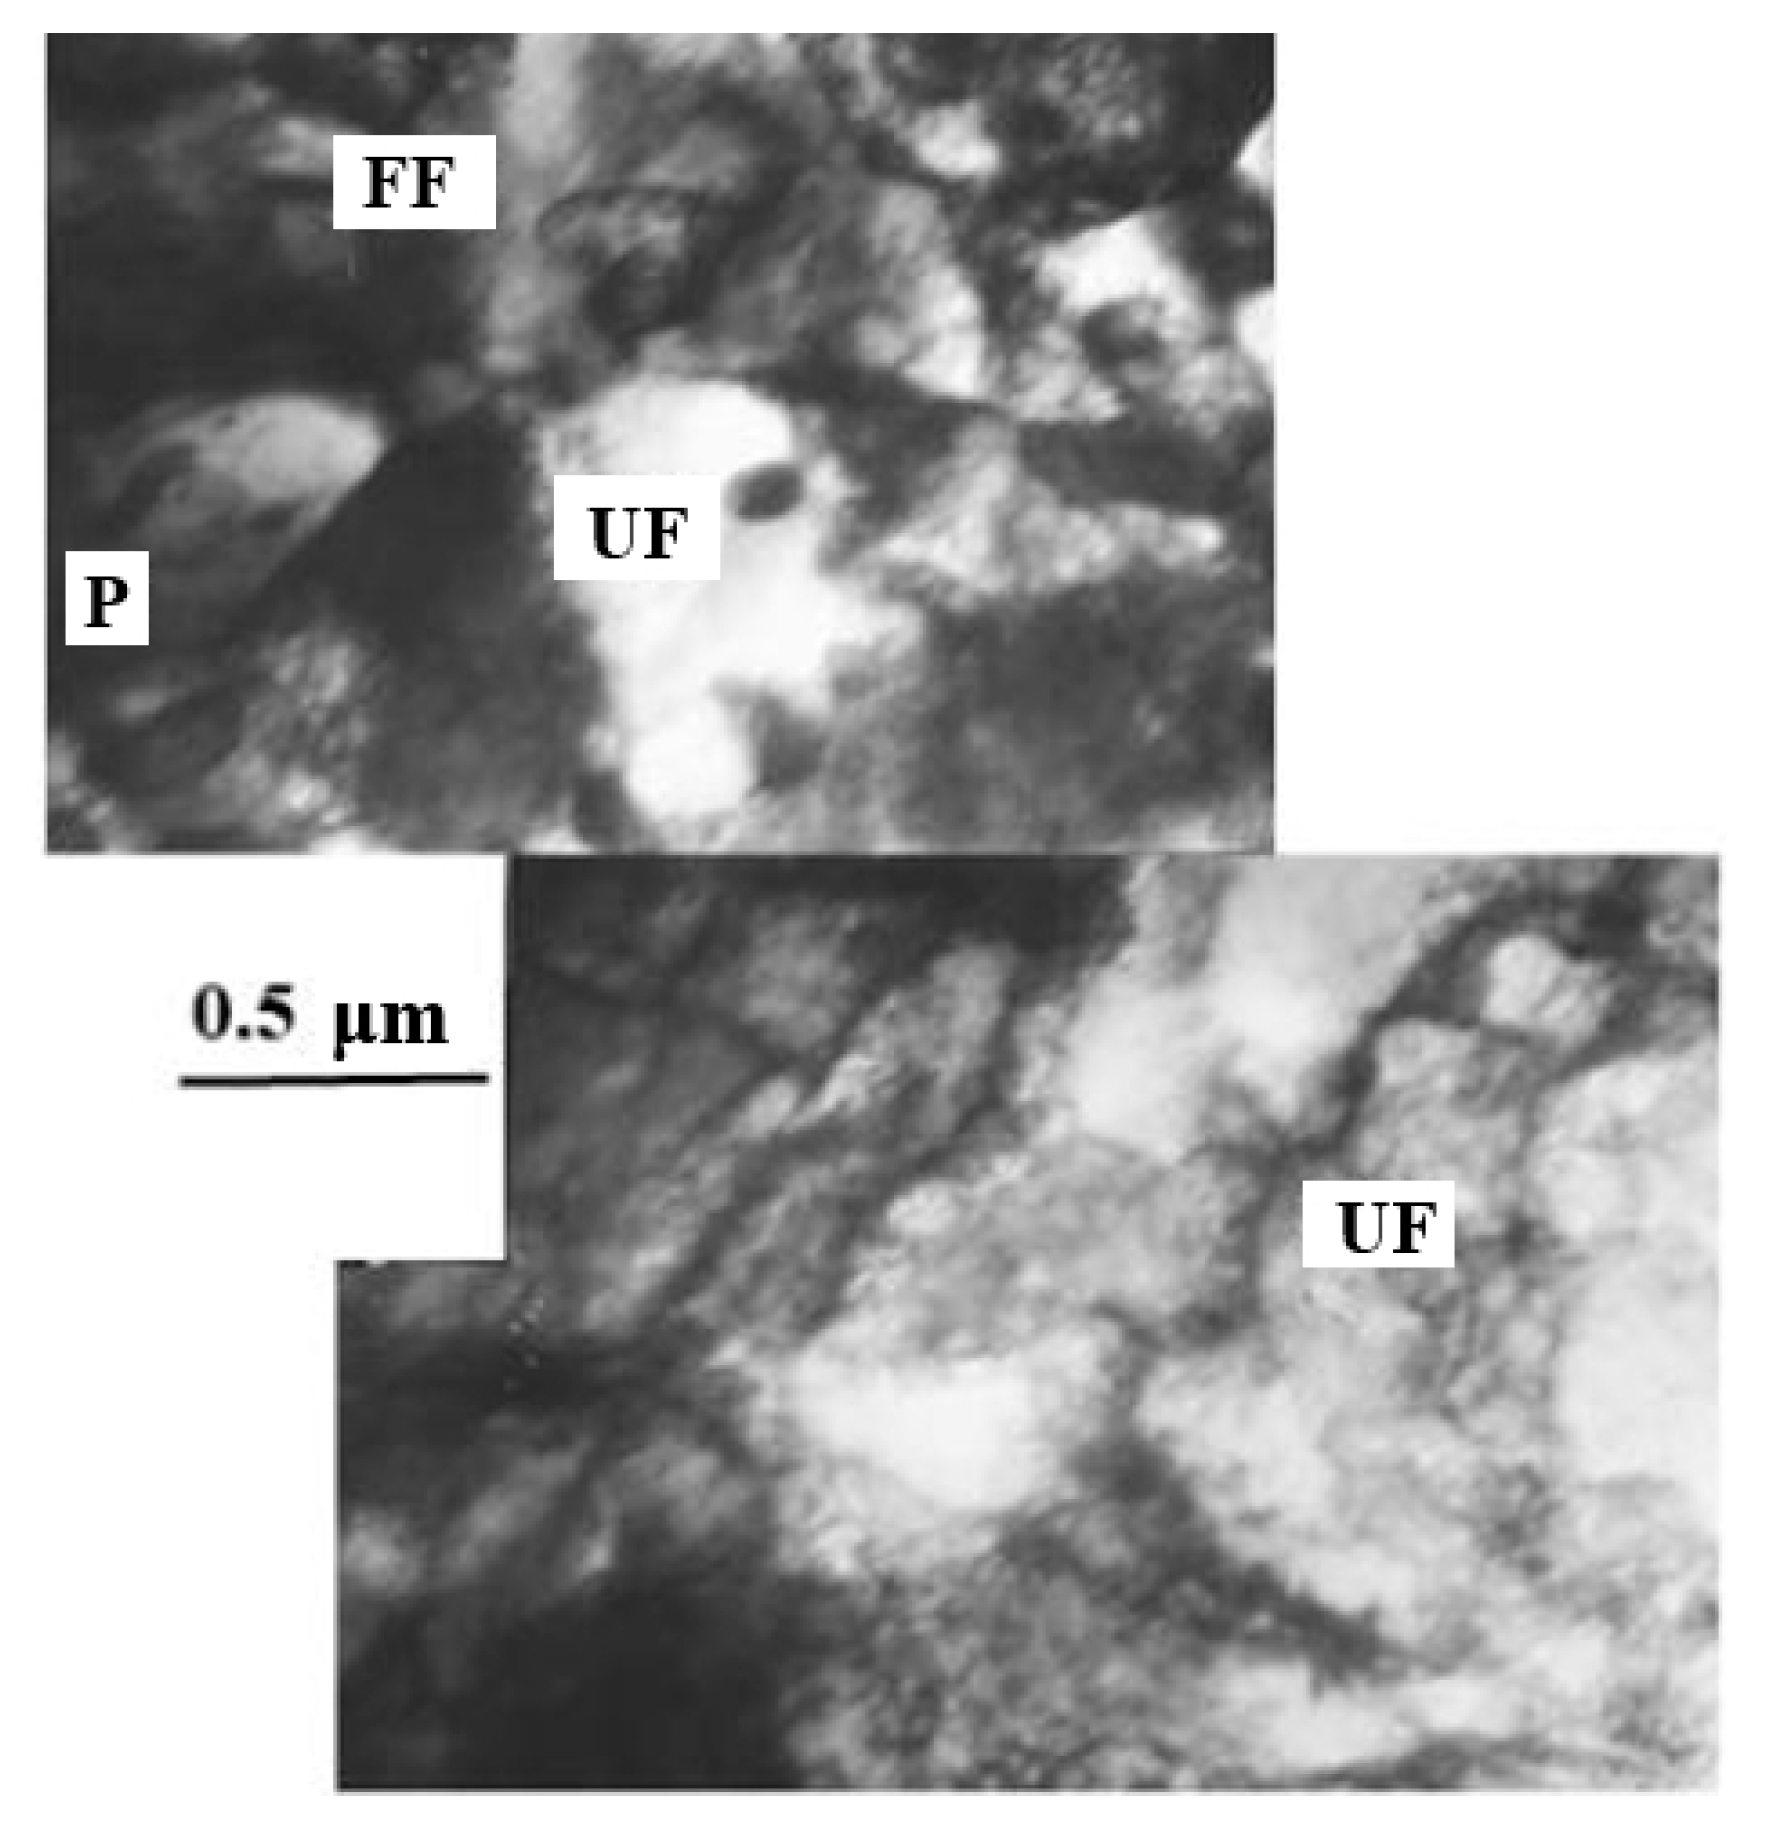
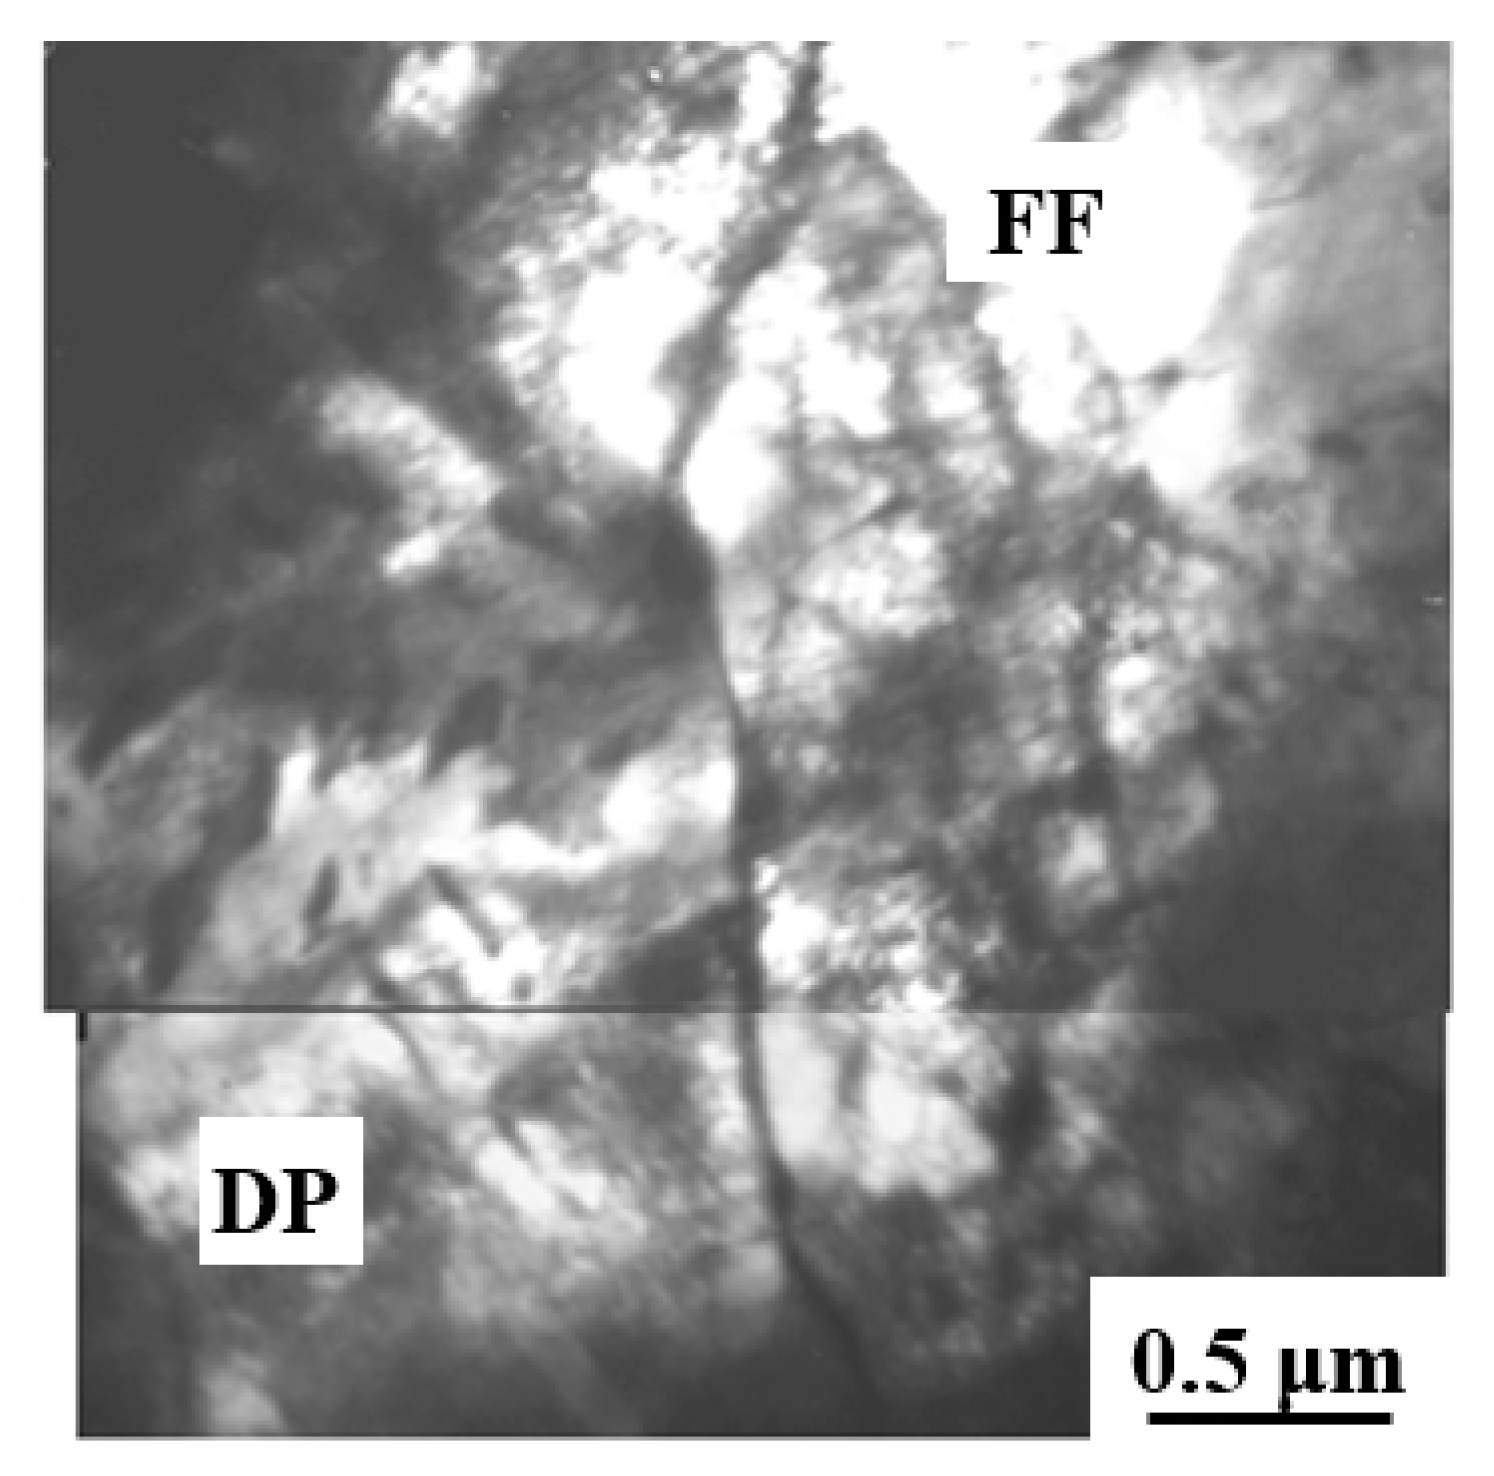
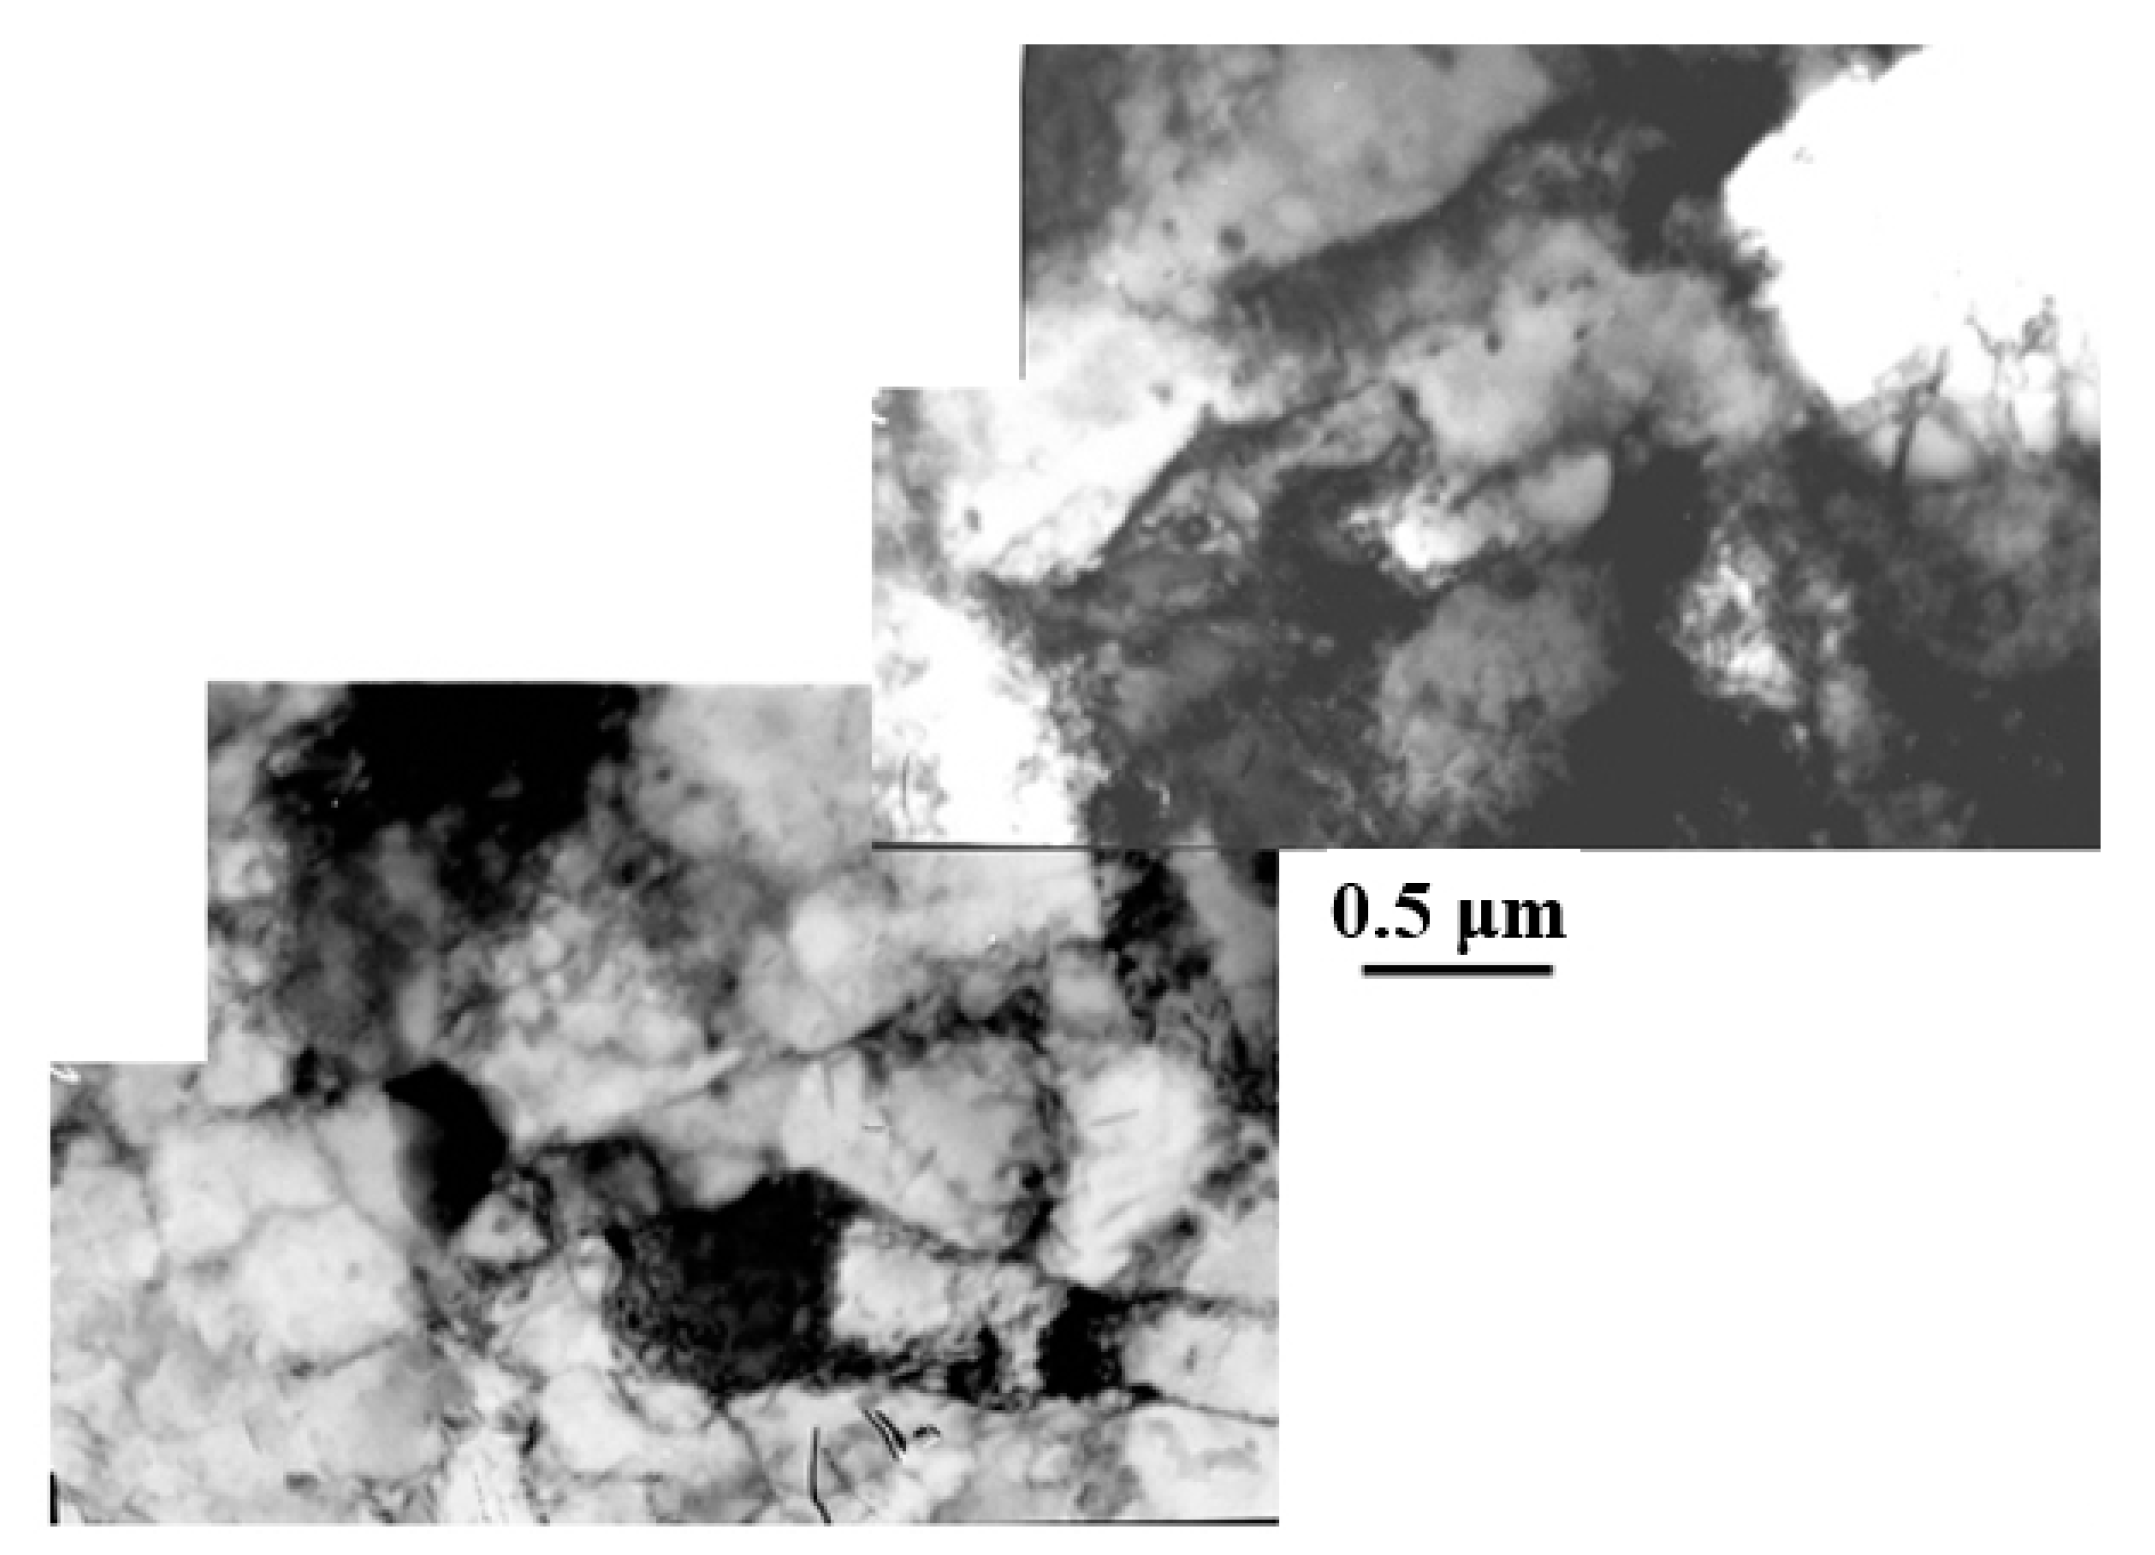
4.2. Discussion of the Results of Studying the Structural-Phase State of Samples of Power Equipment Made of Structural and Heat-Resistant Steels before Deformation and in Zones of Stable Localization of Deformation

Analysis of the microstructure of the samples after deformation until the appearance of stable localization of deformation showed that the greatest changes occurred precisely in these zones of the material under uniaxial tension. It was found that at the initial stage of loading in the exploited metal there is no formation of moving fronts of localized deformation associated with the propagation of Chernov–Luders bands, but long before the appearance of a visible fracture neck, a stable zone of localization of macrostrain appears [39,40,41]. The position of such a zone coincides with the place where further destruction occurs.
Analysis of the results of studies by transmission electron microscopy showed that pearlite and ferrite are distinguished by the presence of a dense dislocation structure. Dislocations fill crystals uniformly, forming curved and mixed lines similar to a three-dimensional grid. The average values of the scalar dislocation density (ρ) in each morphological component of the structure, as well as for the material as a whole, are given in Table 3 for the studied samples.
It can be seen from Table 3 that when analyzing the transformation of the value of ρ in the zone of localized deformation in the samples in the direction of “initial” → “undestroyed” → “destroyed”, a decrease in the value of is traced, although insignificant in all morphological components of the structure, as well as in general material. In addition, the value of ρ is always somewhat less in unfragmented pearlite than in fragmented one. The opposite picture is observed in ferrite.
A relatively high scalar dislocation density formed in all morphological components of all samples forms internal stresses in the material (shear stresses σL). It follows from Table 4 that the values of the σL amplitudes in all samples are quite similar. However, σL has a maximum value in the initial sample in all morphological components of the structure.
When quantifying such parameters of the metal microstructure of 0.12C-1Cr-1Mo-1V steel samples as the dislocation density (scalar and excess) and the amplitudes of the internal stress fields (tangential and moment) (Table 5) in the deformation localization zones, the conditions ρ > ρ± and σL > σd, are performed only for the non-operational state. However, they are not carried out in the zones of localization of deformation for states after operation (260 thousand hours) without destruction and after operation (263 thousand hours) and destruction (Table 5).
The general regularity of the formation of deformation localization zones for heat-resistant steels is the achievement of critical values of the fragmented substructure, and the identification of deformation localization zones for equipment is justified both for newly commissioned equipment and for equipment in the process of long-term operation.

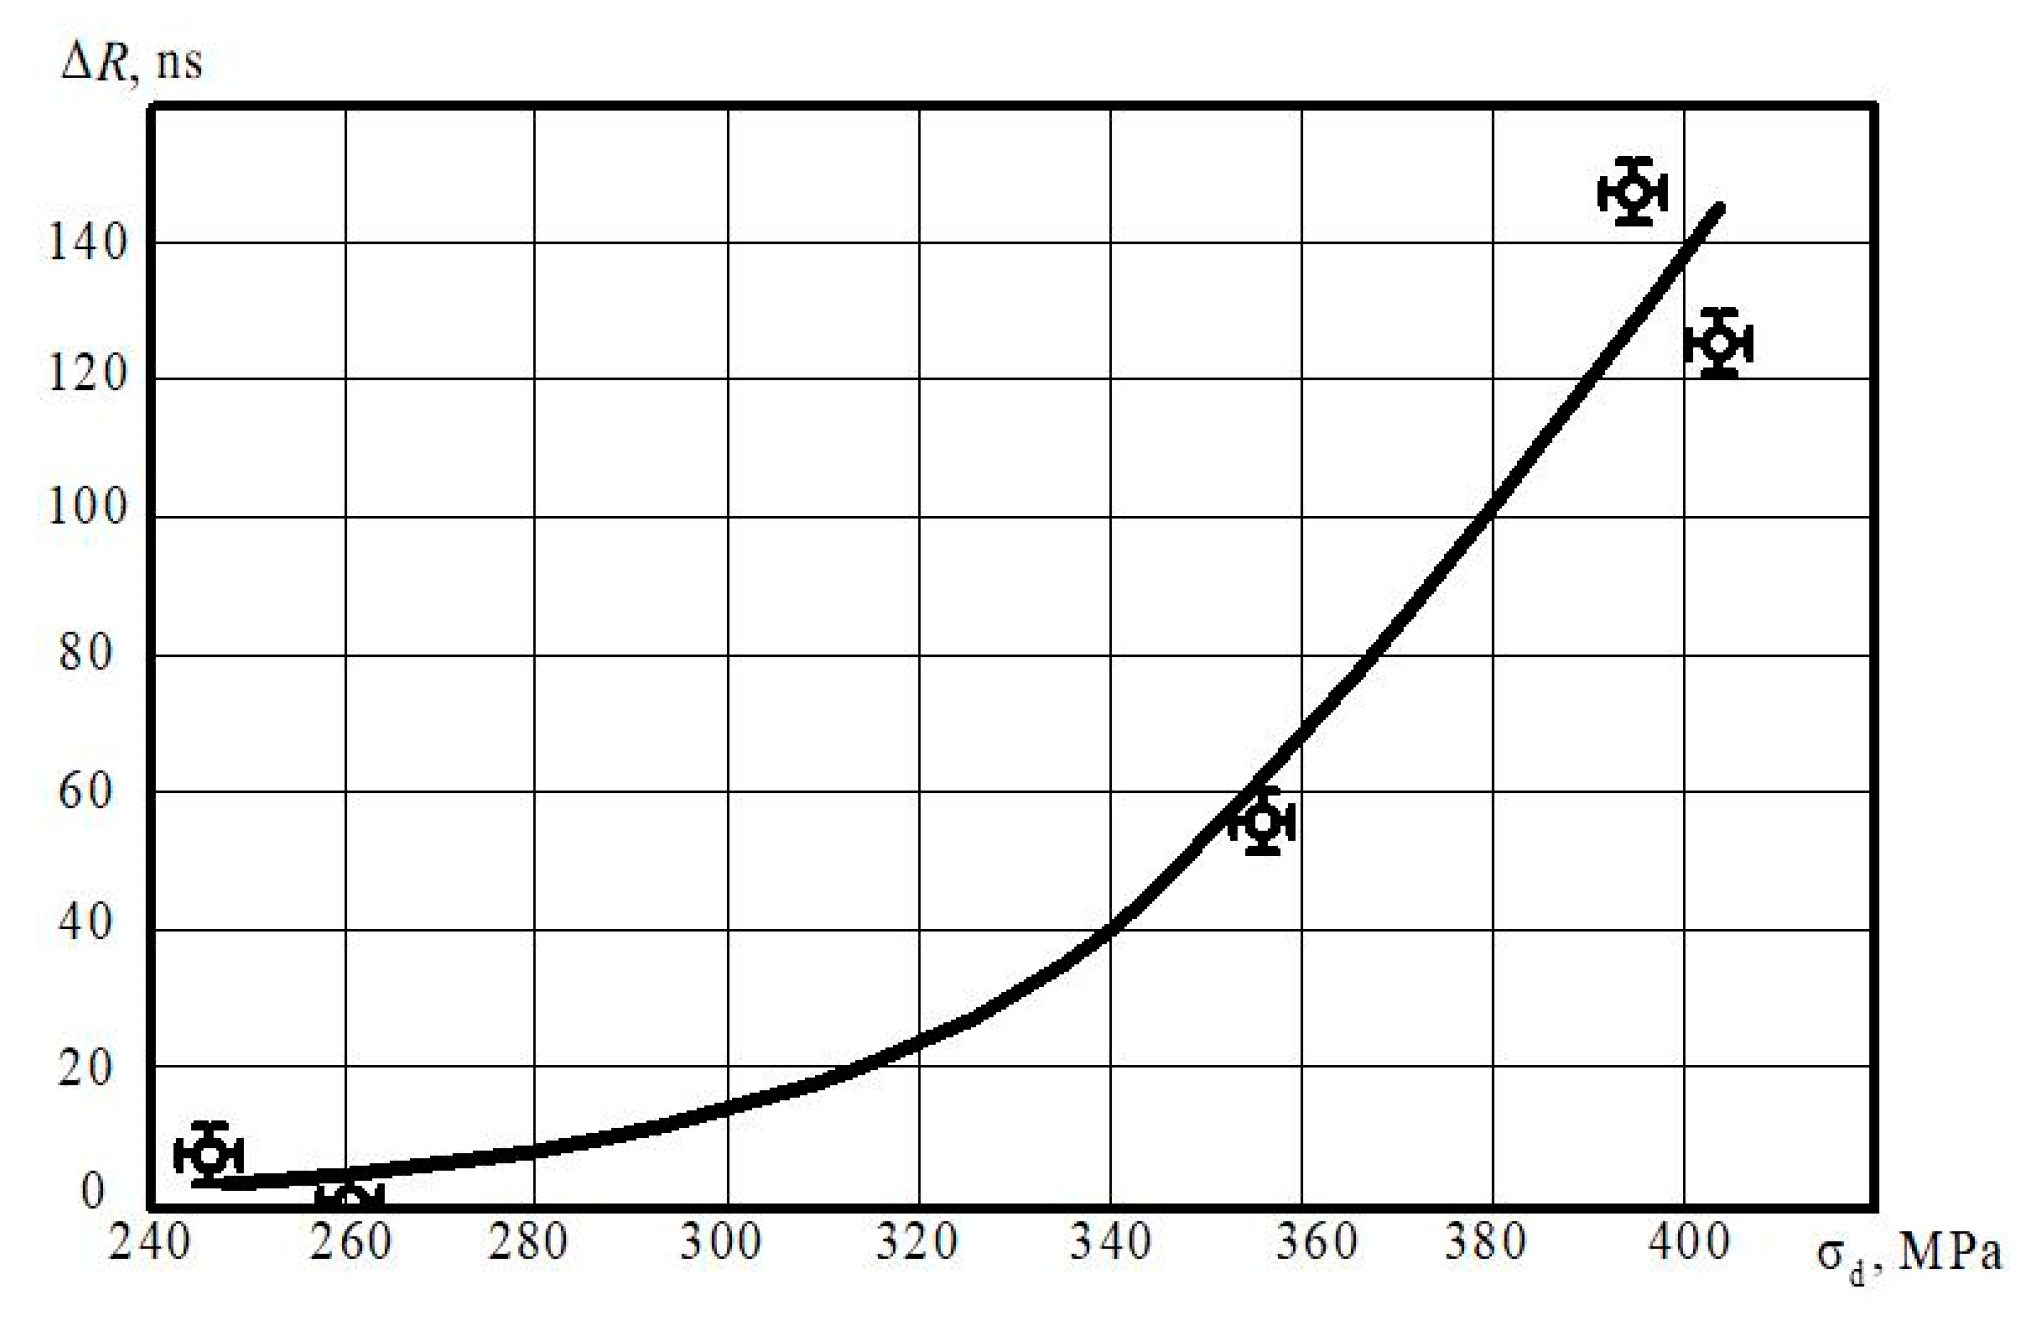
4.3. Discussion of the Results of Measuring the Acoustic and Magnetic Characteristics of the Metal of Samples of Power Equipment Made of Structural and Heat-Resistant Steels before Deformation and in Zones of Stable Localization of Deformation

The nature of the change in the acoustic and magnetic characteristics of non-destructive tests on the surface of the studied samples of structural and heat-resistant steel reveals the fundamental possibility of detecting zones of stable deformation [42] (Figure 14 and Figure 15).
Consequently, the possibility of detecting localized deformation zones by spectral-acoustic control method in structural and heat-resistant steels is presented.

4.4. Statistical Processing of the Results

All research results were statistically processed and the dependences of the parameters of the structural state and mechanical characteristics on the results of non-destructive tests in the metal of samples made of Structural and Heat Resistant Steels, including in the zones of localization of deformations, were plotted.
Thus, with an increase in the amplitude of the moment (long-range) fields of internal stresses (σd, MPa) from 245 to 405 MPa, an increase in the delay time of the surface acoustic wave (R, ns) by 145 ns is observed (Figure 16). The velocity of propagation of the surface acoustic wave (V, m/s) describes better the change in the value of the curvature-twist of the crystal lattice (χ, cm−1) than the attenuation coefficient of the surface acoustic wave (Katt, μs−1) (Figure 17).
The established dependencies have high values of the correlation coefficient. In the real practice of carrying out diagnostic work during the examination of industrial safety, there is no possibility of deep examination of the metal using electron microscopy methods or the use of speckle photography and digital image correlation during the operation of power equipment. The results of non-destructive tests obtained during equipment shutdowns for control tests and repair and restoration work are one of the possible types of information [43,44,45,46,47,48,49,50,51]. The dependences of structural and deformation indicators on acoustic and magnetic characteristics (Table 6) were selected using statistical processing of research results based on a comparison of the obtained values of the correlation coefficients for equipment made of low carbon 0.2 C steel and heat resistant 0.12C-1Cr-1Mo-1V steel.

5. Conclusions

  • The studies of the structural-phase state of the metal of the samples were carried out without operation, after operation without destruction and with destruction from structural and heat resistant steels in the zone of stable localization of macrodeformations. A connection between the processes of localization of macrodeformations and the evolution of the substructural state for structural and heat resistant steels is established. On the basis of the presented results and their discussion, on the one hand, it can be argued that information on the localization of macrodeformation, together with the data of the spectral-acoustic method, can be used to assess the residual life of a long-term operating power equipment.
  • The structure of the metal of all specimens made of structural and heat-resistant steels after deformation before the formation of zones of stable localization of deformations consists of a ferrite-pearlite mixture, and for specimens after operation before fracture only of unfragmented and fragmented ferrite. Ferrite, which occupies the bulk of the material, is present both unfragmented and fragmented. For all samples, the ratios ρ > ρ±, χ = χpl, σL > σd were calculated, which indicate whether there is a danger of the initiation of microcracks in metal samples. For specimens without operation and after operation without damage in zones of stable localization of deformations, these conditions are met, and for specimens after operation until destruction, they are not met.
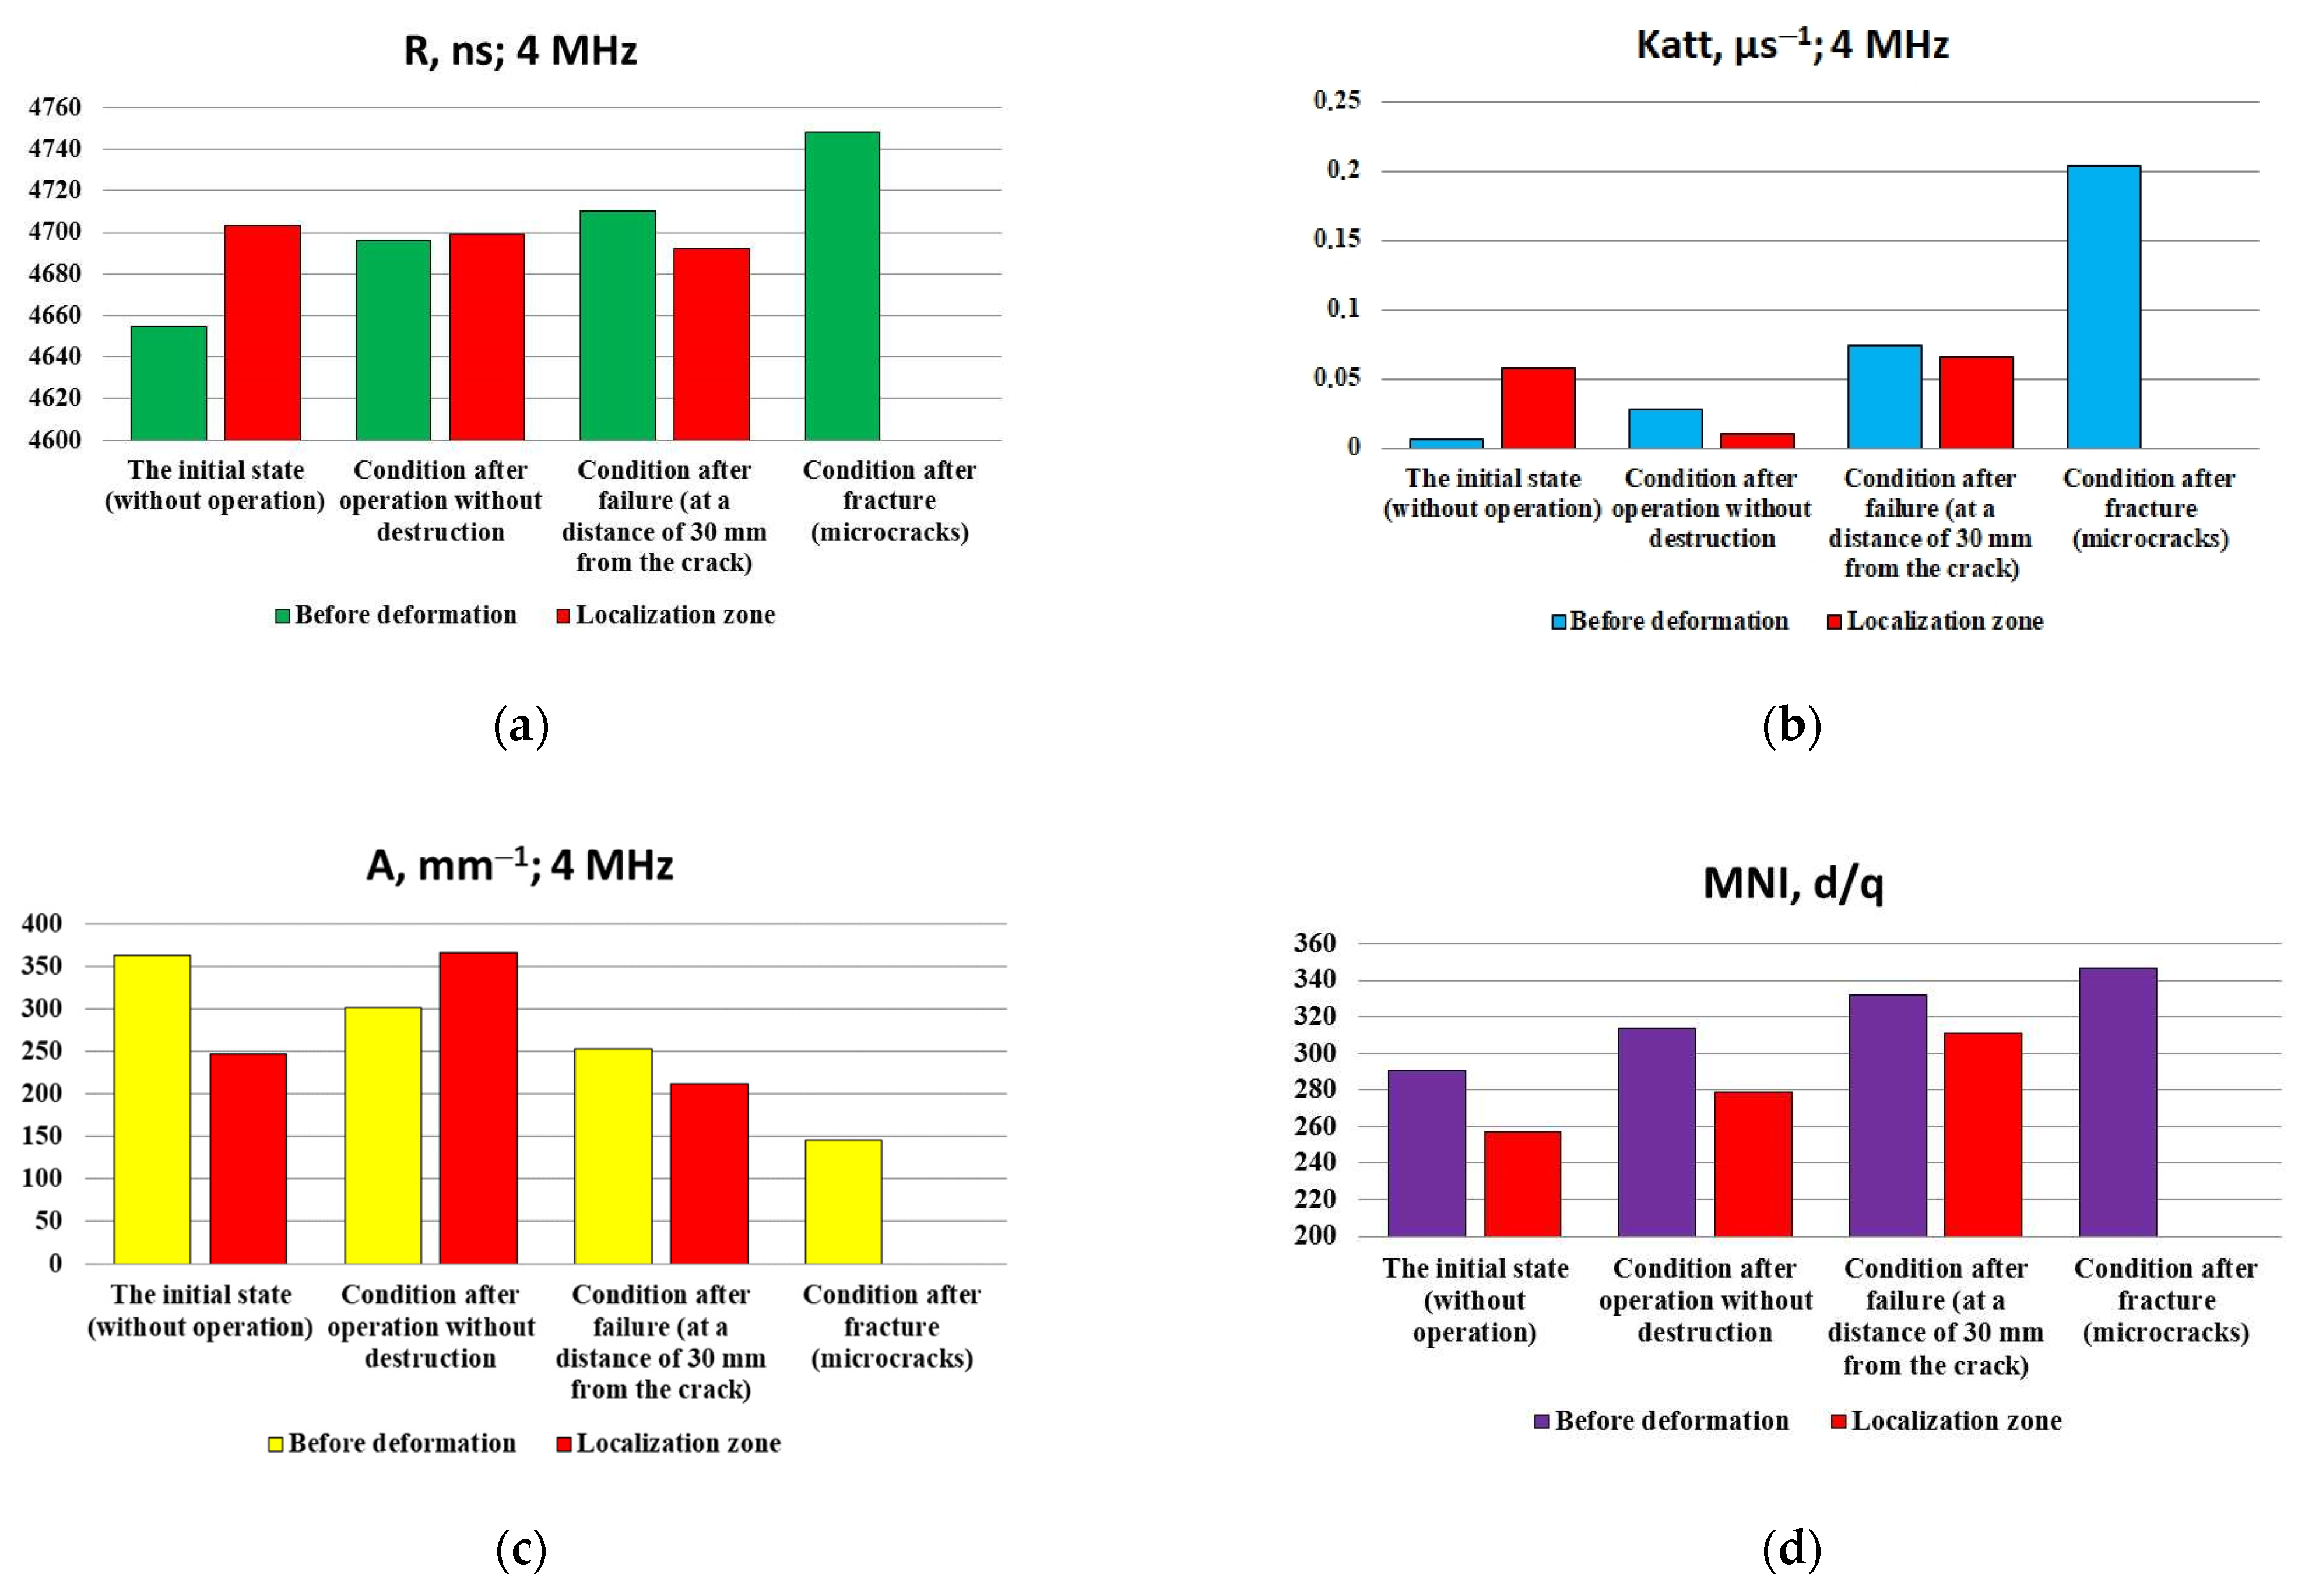
  • The structure of the metal in the zones of localization of deformations directly affects the characteristics of non-destructive tests. The characteristics of non-destructive tests for all investigated states of samples made of structural and heat-resistant steels in the zones of localization of deformation had similar values: the delay time of the surface acoustic wave was 4700 ± 5 ns; attenuation coefficient of the surface acoustic wave 0.006 ± 0.003 μs−1 and 0.004 ± 0.002 μs−1; the amplitude range of the received signal of the surface acoustic wave is 227 ± 12 mm−1 and 302 ± 14 mm−1 and the intensity of magnetic noise is 275 ± 31 units and 400 ± 19 units for structural and heat-resistant steels, respectively. The possibility of detecting zones of localized deformation by the spectral-acoustic control method in structural and heat-resistant steels has been found.

Author Contributions

Conceptualization, N.A. and A.S.; methodology, V.D.; software, N.A.; validation, V.D., A.S. and N.P.; formal analysis, N.A.; investigation, E.N.; resources, N.P.; data curation, A.S.; writing—original draft preparation, N.A.; writing—review and editing, L.Z.; visualization, E.N.; supervision, A.S.; project administration, N.A.; funding acquisition, A.S. All authors have read and agreed to the published version of the manuscript.

Funding

This research was funded by the Government research assignment for ISPMS SB RAS, project FWRW-2021–0011, the Russian Foundation for Basic Research, project number 20-31-70001 and the President of the Russian Federation to support young candidates of sciences MK-1084.2020.8.

Institutional Review Board Statement

Not applicable.

Informed Consent Statement

Not applicable.

Data Availability Statement

Not applicable.

Conflicts of Interest

The authors declare no conflict of interest.

References

  1. Rezinskikh, V.F.; Zlepko, V.F.; Shtromberg, Y.Y. The main requirements for the control of metal heat power equipment. Therm. Eng. 1999, 46, 8–20. [Google Scholar]
  2. Chrysochoos, A.; Louche, H. An infrared image processing to analyse the calorific effects accompanying strain localization. Int. J. Eng. Sci. 2000, 38, 1759–1788. [Google Scholar] [CrossRef]
  3. Sun, H.B.; Yoshida, F.; Ohmori, M.; Ma, X. Effect of strain rate on Lüders band propagating velocity and Lüders strain for annealed mild steel under uniaxial tension. Mater. Lett. 2003, 57, 4535–4539. [Google Scholar] [CrossRef]
  4. Avril, S.; Pierron, F.; Sutton, M.A.; Yan, J. Identification of elasto-visco-plastic parameters and characterization of Lüders behavior using digital image correlation and the virtual field method. Mech. Mater. 2008, 40, 729–742. [Google Scholar] [CrossRef] [Green Version]
  5. Makhutov, N.A. Strength, service life, and safety of machine systems. J. Mach. Manuf. Reliab. 2014, 43, 217–232. [Google Scholar] [CrossRef]
  6. Tyutin, M.R.; Botvina, L.R.; Sinev, I.O. Changes in the physical properties and the damage of low- and medium-carbon steels during tension. Russ. Metall. 2018, 2018, 521–528. [Google Scholar] [CrossRef]
  7. Klevtsov, G.V.; Botvina, L.R. Microscopic and macroscopic plastic deformation as a criterion of the limiting state of a material during fracture. Strength Mater. 1984, 16, 473–479. [Google Scholar] [CrossRef]
  8. Syromyatnikova, A.S.; Gulyaeva, E.M.; Alekseeva, K.I. Estimation of the degree of plastic deformation and the remaining life of gas main pipes having operated for a long time. Russ. Metall. 2016, 2016, 996–998. [Google Scholar] [CrossRef]
  9. Korsunsky, A.M.; Botvina, L.R.; Kim, K. Defect population statistics near and far from critical event. Int. J. Fract. 2004, 128, 139–145. [Google Scholar] [CrossRef]
  10. Smirnov, A.N.; Ozhiganov, E.A.; Danilov, V.I.; Gorbatenko, V.V.; Murav’ev, V.V. The dependence of local deformations and internal stress fields on welding technique for grade VSt3Sp structural steel: I. The influence of welding technique on the mechanical characteristics and acoustic emission parameters of grade VSt3Sp steel. Russ. J. Nondestruct. Test. 2015, 51, 705–712. [Google Scholar] [CrossRef]
  11. Barnett, M.R.; Nave, M.D.; Ghaderi, A. Yield point elongation due to twinning in a magnesium alloy. Acta Mater. 2012, 60, 1433–1443. [Google Scholar] [CrossRef]
  12. Wang, X.G.; Wang, L.; Huang, M.X. Kinematic and thermal characteristics of Lüders and Portevin-Le Châtelier bands in a medium Mn transformation-induced plasticity steel. Acta Mater. 2017, 124, 17–29. [Google Scholar] [CrossRef] [Green Version]
  13. Shklyarov, M.; Osmakov, V.; Edachev, G. Some features of selection of structurally free graphite in welded connections of steam pipes from carbon steel. Therm. Eng. 1999, 5, 360–365. [Google Scholar]
  14. Grote, K.; Antonsson, E. Handbook of Mechanical Engineering; Springer: New York, NY, USA, 2008. [Google Scholar]
  15. Kreith, F. The CRC Handbook of Thermal Engineering; CRC Press: Boca Raton, FL, USA, 2000. [Google Scholar]
  16. Segal, V.M.; Noskova, N.I.; Mulyukov, R.R.; Kopylov, V.I.; Chuvil’deev, V.N.; Nazarov, A.A.; Levit, V.; Smirnova, N.; Han, B.Q.; Mohamed, F.A.; et al. Severe Plastic Deformation: Toward Bulk Production of Nanostructured Materials; Nova Science Publishers, Inc.: New York, NY, USA, 2006. [Google Scholar]
  17. Zharkova, N.A.; Botvina, L.R.; Tyutin, M.R. Damage accumulation stages in a low-carbon steel during uniaxial tension. Russ. Metall. 2007, 2007, 223–229. [Google Scholar] [CrossRef]
  18. Tyutin, M.R.; Botvina, L.R.; Zharkova, N.A.; Petersen, T.B.; Hudson, J.A. Evolution of damage accumulation in low-carbon steel in tension condition. Strength Fract. Complex. 2005, 3, 73–80. [Google Scholar]
  19. Botvina, L.R.; Tyutin, M.R.; Levin, V.P.; Soldatenkov, A.P.; Prosvirnin, D.V.; Petersen, T.B. Residual strength, microhardness, and acoustic properties of low-carbon steel after cyclic loading. J. Mach. Manuf. Reliab. 2018, 47, 516–524. [Google Scholar] [CrossRef]
  20. Information Bulletin of the Federal Service for Environmental, Technological and Nuclear Supervision; No. 106; Federal Service for Environmental, Technological and Nuclear Supervision: Moscow, Russia, 2020; Volume 1, pp. 22–24.
  21. Khlybov, A.A. Studying the effect of microscopic medium inhomogeneity on the propagation of surface waves. Russ. J. Nondestruct. Test. 2018, 54, 385–393. [Google Scholar] [CrossRef]
  22. Mishakin, V.V.; Klyushnikov, V.A.; Kassina, N.V. Research on the fracture process of steels by the acoustic method and the pitch net method. J. Mach. Manuf. Reliab. 2014, 38, 443–447. [Google Scholar] [CrossRef]
  23. Mishakin, V.V.; Serebryany, V.N. Aplication of the acoustoelastic effect in the precise evaluation of the plastic strain value. Acoust. Lett. 1994, 17, 123. [Google Scholar]
  24. Ser’eznov, A.N.; Murav’ev, V.V.; Stepanova, L.N.; Barabanova, S.B.; Kozhemyakin, V.L.; Kabanov, S.I. Localizing acoustic-emission signals in metal structures. Russ. J. Nondestruct. Test. 1997, 33, 726–730. [Google Scholar]
  25. Muravyev, V.V.; Muravyeva, O.V.; Strizhak, V.A.; Pryakhin, A.V.; Balobanov, E.N.; Volkova, L.V. Evaluation of residual stresses in rims of wagon wheels using the electromagnetic-acoustic method. Russ. J. Nondestruct. Test. 2011, 54, 16–28. [Google Scholar] [CrossRef]
  26. Smirnov, A.N.; Ababkov, N.V.; Muravev, V.V.; Folmer, S.V. Criteria for the evaluation of the technical state of the long-lived metal of hpp equipment based on acoustic structuroscopy. Russ. J. Nondestruct. Test. 2015, 58, 94–100. [Google Scholar] [CrossRef]
  27. Danilov, V.I.; Orlova, D.V.; Zuev, L.B. On the kinetics of localized plasticity domains emergent at the pre-failure stage of deformation process. Mater. Des. 2011, 32, 1554–1558. [Google Scholar] [CrossRef]
  28. Gorbatenko, V.V.; Danilov, V.I.; Zuev, L.B. Elastoplastic transition in the material with sharp yield point. AIP Conf. Proc. 2015, 1683, 020058. [Google Scholar]
  29. Campbell, F. Elements of Metallurgy and Engineering Alloys; ASM International: Novelty, OH, USA, 2008. [Google Scholar]
  30. Brent, F.; James, H. Transmission Electron Microscopy and Diffractometry of Materials; Springer: New York, NY, USA, 2013. [Google Scholar]
  31. Vorob’ev, G.M.; Popova, V.I. Stereometric metallography in the-interpretation of polar figures for compressed iron. Sov. Phys. J. 1965, 8, 29–32. [Google Scholar]
  32. Gromov, V.E.; Morozov, K.V.; Alsaraeva, K.V.; Yur’ev, A.B.; Ivanov, Y.F. Structure, phase composition, and defect substructure of differentially quenched rail. Steel Transl. 2014, 44, 883–885. [Google Scholar] [CrossRef]
  33. Kozlov, E.V.; Popova, N.A.; Ignatenko, L.N.; Teplyakova, L.A.; Klopotov, A.A.; Koneva, N.A. Influence of the Substructure Type on the Carbon Redistribution in Martensitic Steel in the Course of Plastic Deformation. Russ. Phys. J. 2002, 45, 285–302. [Google Scholar] [CrossRef]
  34. Kozlov, E.V.; Popova, N.A.; Pekarskaya, E.E.; Koneva, N.A.; Zhdanov, A.N. Subgrain structure and internal stress fields in ufg materials: Problem of Hall-Petch relation. Mater. Sci. Eng. 2004, 387–389, 789–794. [Google Scholar] [CrossRef]
  35. Makhutov, N.A. A criterion base for assessment of strength, lifetime, reliability, survivability, and security of machines and man-machine systems. J. Mach. Manuf. Reliab. 2013, 42, 364–373. [Google Scholar] [CrossRef]
  36. Makhutov, N.A.; Abrosimov, N.V.; Gadenin, M.M. Provision of safety—The priority in the sphere of fundamental and applied research. Econ. Soc. Chang. Facts Trends Forecast 2013, 27, 39–61. [Google Scholar]
  37. Makhutov, N.A. Generalized regularities of deformation and fracture processes. Her. Russ. Acad. Sci. 2017, 87, 217–228. [Google Scholar] [CrossRef]
  38. Makhutov, N.A.; Fomin, A.V.; Ivanov, V.I.; Permyakov, V.N.; Vasil’ev, I.E. Integrated diagnostics of limit states and early warning of emergency conditions of structures. J. Mach. Manuf. Reliab. 2013, 42, 109–113. [Google Scholar] [CrossRef]
  39. Danilov, V.; Gorbatenko, V.; Zuev, L.; Orlova, D. Localized plastic deformation autowaves in materials with unstable phase structure. AIP Conf. Proc. 2018, 2051, 020059. [Google Scholar]
  40. Zuev, L.B. Chernov–Luders and Portevin–Le Chatelier deformations in active deformable media of different nature. J. Appl. Mech. Tech. Phys. 2017, 58, 328–334. [Google Scholar] [CrossRef]
  41. Danilov, V.I.; Gorbatenko, V.V.; Orlova, D.V.; Danilova, L.V.; Smirnov, A.N. Luders deformation in weld joints. Steel Transl. 2018, 48, 87–92. [Google Scholar] [CrossRef]
  42. Ababkov, N.V.; Smirnov, A.N.; Danilov, V.I.; Gorbatenko, V.V. Non-destructive testing and diagnostics of the material after long-term operation in thermal power equipment. AIP Conf. Proc. 2018, 2051, 020001. [Google Scholar]
  43. Botvina, L.R.; Tyutin, M.R. New acoustic parameter characterizing loading history effects. Eng. Fract. Mechanics. 2018, 202, 358–366. [Google Scholar] [CrossRef]
  44. Botvina, L.R.; Soldatenkov, A.P.; Levin, V.P.; Tyutin, M.R.; Demina, Y.A.; Petersen, T.B.; Dubov, A.A.; Semashko, N.A. Assessment of mild steel damage characteristics by physical methods. Russ. Metall. 2016, 2016, 23–33. [Google Scholar] [CrossRef]
  45. Botvina, L.R.; Soldatenkov, A.P.; Tyutin, M.R.; Petersen, T.B. Time dependences of acoustic signal characteristics during fracture of metal samples. Dokl. Earth Sci. 2015, 462, 475–478. [Google Scholar] [CrossRef]
  46. Wu, K.T.; Jen, C.K.; Kobayashi, M.; Blouin, A. Integrated piezoelectric ultrasonic receivers for laser ultrasound in non-destructive testing of metals. J. Nondestruct. Eval. 2012, 30, 1–8. [Google Scholar] [CrossRef]
  47. Labergere, C.; Rassineux, A.; Saanouni, K. Numerical simulation of continuous damage and fracture in metal-forming processes with 2D mesh adaptive methodology. Finite Elem. Anal. Des. 2014, 82, 46–61. [Google Scholar] [CrossRef]
  48. Yang, J.; Wang, G.Z.; Xuan, F.Z.; Tu, S.T.; Liu, C.J. Out-of-plane constraint effect on local fracture resistance of a dissimilar metal welded joint. Mater. Des. 2014, 55, 542–550. [Google Scholar] [CrossRef]
  49. Osovski, S.; Nachmany, Y.; Rittel, D.; Landau, P.; Venkert, A. On the dynamic character of localized failure. Scr. Mater. 2012, 67, 693–695. [Google Scholar] [CrossRef]
  50. Khokhlov, M.; Fischer, A.; Rittel, D. Multi-scale stereo-photogrammetry system for fractographic analysis using the scanning elec-tron microscope. Exp. Mech. 2012, 52, 975–991. [Google Scholar] [CrossRef]
  51. Pokluda, J.; Pippan, R.; Vojtek, T.; Hohenwarter, A. Near-threshold behaviour of shear-mode fatigue cracks in metallic materials. Fatigue Fract. Eng. Mater. Struct. 2014, 37, 232–254. [Google Scholar] [CrossRef]
Figure 1. Schematic representation of sections of pipe zones made of the investigated steels, in which the structure was studied: 1—samples for mechanical tests, 2—conditional zone of localization of deformations; 3—areas for measuring the parameters of non-destructive tests (delay time (R, ns), attenuation coefficient (Katt, 1/μs) and amplitude swing of the received signal (A, 1/mm) of the surface acoustic wave, magnetic noise intensity (MNI, d/q).
Metals 11 01638 g001
Figure 2. Loading diagrams for 0.2 C steel: 1—initial state; 2—after operation 219 thousand hours.
Metals 11 01638 g002
Figure 3. Loading diagrams of 0.12C-1Cr-1Mo-1V steel: 1—initial state; 2—after operation 260 thousand hours.
Metals 11 01638 g003
Figure 4. Shares of structural components in the metal of structural steel samples: (a)—condition without exploitation; (b)—condition after operation (219 thousand hours) without destruction; (c)—condition after operation (242 thousand hours) before destruction. The measurement error of each structural component is ±1.5%.
Metals 11 01638 g004
Figure 5. Image of unfragmented lamellar pearlite in the zone of localized deformation of the initial sample of 0.2 C steel. Transmission electron microscopy: (a)—bright-field image; (b)—dark-field image obtained in closely located [ 01 1 ¯ ] α-phase and cementite [ 012 ] reflexes; (c)—microdiffraction pattern and (d)—its indexed scheme.
Metals 11 01638 g005
Figure 6. Image of the structure of lamellar pearlite in the zone of localized deformation of an undisturbed specimen of 0.2 C steel (UP—unfragmented, FP—fragmented pearlite). Transmission electron microscopy.
Metals 11 01638 g006
Figure 7. Image of the structure of lamellar pearlite in the zone of localized deformation of a destroyed specimen of 0.2 C steel (UP—unfragmented, FP—fragmented pearlite). Transmission electron microscopy.
Metals 11 01638 g007
Figure 8. Shares of structural components in the metal of heat-resistant steel samples: (a)—condition without exploitation; (b)—condition after operation (260 thousand hours) without destruction; (c)—condition after operation (263 thousand hours) before destruction. The measurement error of each structural component is ±1.5%.
Metals 11 01638 g008
Figure 9. 0.12C-1Cr-1Mo-1V steel, initial state. Zone of localized deformation. Ferrite-perlite mixture (P—pearlite grain, UF—unfragmented ferrite grain, FF—fragmented ferrite grain). Transmission electron microscopy.
Metals 11 01638 g009
Figure 10. Condition after long-term operation (260 thousand hours) without destruction. Zone of localized deformation. Ferrite-pearlite mixture (DP—destroyed pearlite, FF—fragmented ferrite). Transmission electron microscopy.
Metals 11 01638 g010
Figure 11. Sample after long-term operation to destruction, 0.12C-1Cr-1Mo-1V steel. Zone of localized deformation. Fragmented ferrite. Transmission electron microscopy.
Metals 11 01638 g011
Figure 12. The results of measuring the acoustic and magnetic characteristics of the investigated specimens of low-carbon steel before deformation and in the zone of localization of deformation: (a) is the delay time of the surface acoustic wave (the measurement error of each structural component is ±2.5%); (b)—attenuation coefficient of the surface acoustic wave (the measurement error of each structural component is ±2.5%); (c)—the amplitude of the received signal of the surface acoustic wave (the measurement error of each structural component is ±2.5%); (d)—intensity of magnetic noise (the measurement error of each structural component is ±3.5%).
Metals 11 01638 g012
Figure 13. The results of measuring the acoustic and magnetic characteristics of the investigated samples of heat resistant 0.12C-1Cr-1Mo-1V steel before deformation and in the zone of localization of deformation: (a) is the delay time of the surface acoustic wave (the measurement error of each structural component is ±2.5%); (b)—attenuation coefficient of the surface acoustic wave (the measurement error of each structural component is ±2.5%); (c)—the amplitude of the received signal of the surface acoustic wave (the measurement error of each structural component is ±2.5%); (d)—intensity of magnetic noise (the measurement error of each structural component is ±3.5%).
Metals 11 01638 g013
Figure 14. Change in acoustic and magnetic characteristics along the surface of specimens of low-carbon steel: (a)—initial state; (b)—after operation without destruction.
Metals 11 01638 g014
Figure 15. Change in acoustic and magnetic characteristics along the surface of the investigated specimens of heat resistant 0.12C-1Cr-1Mo-1V steel: (a)—initial state; (b)—after operation without destruction.
Metals 11 01638 g015
Figure 16. Influence of the amplitude of moment (long-range) fields of internal stresses (σd, MPa) on the delay time of the surface acoustic wave (R, ns). The symbol means the field of values of the given quantity or the measurement error.
Metals 11 01638 g016
Figure 17. Influence of the value of the curvature-torsion of the crystal lattice (χ, cm−1) on the attenuation coefficient of the surface acoustic wave (Katt, μs−1) and the velocity of propagation of the surface acoustic wave (V, m/s). The symbol means the field of values of the given quantity or the measurement error.
Metals 11 01638 g017
Table 1. Chemical composition (wt.%) of the investigated steels.
SteelMass Fraction of Elements, %
CSiMnCrNiMoSPVaFe
0.2 C steel0.17–0.240.17–0.370.35–0.65till 0.25till 0.25till 0.25till 0.04till 0.035till 0.08~98
0.12C-1Cr-1Mo-1V0.08–0.150.17–0.370.4–0.70.9–1.2till 0.30.25–0.35till 0.025till 0.030.15–0.3~96
Table 2. The values of tloc, tcrac and tuts for 0.2 C steel the studied samples.
The Initial StateAfter Operation
No.1234Average12345Average
tloc, s77010707801070922 ± 170186300168168312227 ± 73
tuts, s960136795111731112 ± 198354468420366414404 ± 46
tcrac, s13421655118713761390 ± 195590793709651599688 ± 84
a10.520.670.700.820.69 ± 0.090.680.430.280.290.670.47 ± 0.20
a20.800.780.820.900.82 ± 0.050.520.640.400.460.750.51 ± 0.10
Table 3. The magnitude of the scalar density of dislocations in various morphological components of the fine structure and in the whole material (ρ × 10−10 cm−2).
Sample StatusUnfragmented PerliteFragmented PerliteUnfragmented FerritePartially Fragmented FerriteIn General, the Material
Dislocation FragmentsMicro-GrainNano-Grain
Initial2.502.65--2.722.452.60
Undestroyed2.282.20--2.502.252.24
Destroyed1.881.910.910-1.931.90
Table 4. Amplitude of shear stresses σL in various morphological components of the fine structure and in the whole material (MPa).
Sample StatusUnfragmented PerliteFragmented PerliteUnfragmented FerritePartially Fragmented FerriteIn General, the Material
Dislocation FragmentsMicro-GrainNano-Grain
Initial315325--330315320
Undestroyed300295--315300295
Destroyed2752751900-275250
Table 5. Quantitative parameters of the microstructure of the metal of the studied samples of 0.12C-1Cr-1Mo-1V steel in the zone of localization of deformation. Transmission electron microscopy.
ConditionMicrostructure Parameters
ρ, cm−2ρ±, cm−2χ, cm−1σL, MPaσd, MPa
Initial state3.41 × 10102.24 × 1010560368298
Condition after operation (260 thousand hours) without destruction3.0 × 10102.52 × 1010630330405
Condition after operation (263 thousand hours) and destruction2.07 × 10101.95 × 1010572277427
Table 6. Dependences of structural and deformation parameters on acoustic and magnetic characteristics.
0.2 C Steel0.12C-1Cr-1Mo-1V Steel
ρ = 2.7597 + 0.0003 A − 5.7679 × 10⁻⁶ A2ρ = −871.11 + 0.3777 R − 4.0809 × 10⁻⁵ R2
ρ± = −363.25 + 0.2004 V − 2.7421 × 10⁻⁵ V2ρ± = 10.81 − 0.00237432 V
χ = −3.3745 × 10⁻⁵ + 179.9686 V − 0.0239 V2χ = 27452.28 − 13.13 V + 0.0016 V2
σL = −2371.44 + 0.7080649 VσL = −28663.05 + 12.7609 R − 0.0014 R2
σd = 535.56 − 0.744254329 Aσd = −2.276 × 10⁻⁵ + 95.7175 R − 0.01 R2
a1 = 2.04 − 0.0049163803 MNIa1 = 0.52 − 3.1536 Katt − 64.692 Katt2, if Katt < 0;
a1 = 0.78 − 2.46726 × Katt, if Katt > 0
a2 = 2.25 − 0.005016609 MNIa2 = 0.75 − 4.355 Katt − 95.4879 Katt2, if Katt < 0;
a2 = 0.94 − 3.341855 × Katt, if Katt > 0
Publisher’s Note: MDPI stays neutral with regard to jurisdictional claims in published maps and institutional affiliations.

