Mathematical Modelling of Multiphase Flow and Inclusion Behavior in a Single-Strand Tundish


1
Department of Materials Science and Engineering, Royal Institute of Technology, 10044 Stockholm, Sweden
2
Westinghouse Electric Sweden AB, 72163 Västerås, Sweden
Metals 2020, 10(9), 1213; https://doi.org/10.3390/met10091213
Submission received: 2 August 2020
/
Revised: 7 September 2020
/
Accepted: 8 September 2020
/
Published: 9 September 2020
(This article belongs to the Special Issue Numerical Modelling in Steel Metallurgy)
Abstract
:A mathematical model was developed to study the effects of the flow control devices and the gas curtain on the steel cleanness in a single-strand tundish. The Eulerian–Lagrangian approach was applied to investigate the bubble flow and the behavior of the non-metallic inclusions in the system. Two modelling approaches were considered: (i) one-way coupling, where the influence of the micro-inclusion on the molten steel flow is neglected; and (ii) two-way coupling, where the momentum exchange between the molten steel and the bubbles is modelled. The model verification and validation (V&V) were carried out in order to establish confidence in the model predictions. Four different tundish configurations and the effect of various parameters, such as the inclusion size, the inclusion density and the gas flow rate, were investigated at the normal casting conditions. The results show that the flow control devices and the gas curtain reduce the extent of the dead volumes in the tundish and thus enhance the removal efficiency of the inclusions. Controlling the gas stirring intensity is important for tundish operation with the aim of removing the inclusions. Theoretical analysis suggests that small bubbles are preferable to increase the inclusion removal rate in industrial operations.
1. Introduction
The tundish, working as a buffer and distributor of liquid steel between the ladle and continuous casting molds, plays a key role in affecting the performance of casting and solidification, as well as the quality of final products, referred to as “Tundish Metallurgy”. With the continuing emphasis on superior steel quality, a modern steelmaking tundish is designed to provide maximum opportunity for the control of molten steel flow, heat transfer, mixing and inclusion removal. Considerable research efforts have been made in academia and industry over many decades to fully exploit and enhance the metallurgical performance of the tundish [1,2,3,4]. Tundish modelling studies can be categorized into three major groups: (i) physical modelling, (ii) mathematical modelling, and (iii) combined physical and mathematical modelling. These works have led to considerable improvements in our understanding of the various transport processes associated with tundish operations. A reliable mathematical model allows engineers to carry out full-scale predictions and useful engineering design and process calculations.
There exist typically two effective solutions in improving the inclusion removal efficiency in the tundish. They are: (i) installing flow control devices (FCD) such as dams, weirs, baffles, turbulence inhibitors, etc.; and (ii) injecting inert gas media such as Ar and N2. A large number of modelling studies have been carried out to predict and realize the best performance of the tundish in the steelmaking, including: (i) the study of configuration (e.g., FCD); (ii) the study of gas media (e.g., flow rate, bubble size and injection position); (iii) the study of inclusion particles (e.g., size, density and mass flow rate); and iv) the study of simulation models (e.g., fluid, turbulence, particle dispersion, isothermal/thermal, steady/transient). Table 1 lists the published modelling studies that consider gas bubbling and flow control in the tundish [5,6,7,8,9,10,11,12,13,14,15,16,17,18,19,20,21,22]. It shows that Computational Fluid Dynamics (CFD) has become a very useful and promising tool that can potentially predict accurately many phenomena of practical interest in the tundish. The main benefits of CFD include: (i) CFD modelling is wildly cheaper than making a costly prototype; (ii) engineers have the flexibility to quickly adjust CFD models, providing a better chance of ending up with an optimum product or solution; and (iii) CFD modelling allows the assessment of variables and data that cannot be accurately measured in experiments.
From the literature study, it is clear that there is a need for mathematical models that can predict the behaviors of micro-inclusions in the tundish. The reason is that today it is difficult to control the micro-inclusion characteristics during the casting process by using traditional methods. The three quality parameters (chemical compositions, temperature and micro-inclusions) are normally used for the control in the production of “clean steel” throughout the process. The chemical compositions are relatively simple to determine by taking a tundish sample, followed by chemical analysis. The second quality parameter is the temperature, which can be easily measured and controlled during the casting process. The third quality parameter pertains to inclusion characteristics. For the majority of steel companies, a means of rapid feedback of inclusion characteristics in the tundish is currently not available, and steel cleanness can therefore not be controlled online with respect to inclusion content.
However, modelling the growth and separation of inclusions in a gas-stirred tundish is a task that requires extensive, multidisciplinary research. The following mechanisms are believed to influence inclusion growth: (i) diffusion of oxygen to the surface of the inclusion; (ii) collision due to Brownian motion; (iii) collision due to velocity gradients and turbulence; and (iv) collision due to buoyancy differences, so-called Stokes collisions. There are three ways by which inclusions can leave the gas-stirred melt in the tundish: (i) by floating out and being absorbed by the top slag; (ii) by sticking to the refractory; and (iii) by bubble flotation and being absorbed by the top slag. A precise description of the large number of interactions is necessary in order to obtain a good representation of the evolution of the inclusion population during the tundish casting process.
In the author’s opinion, it is still very difficult to create an inclusion model based on fundamental transport equations that can be used to follow the inclusions throughout the entire steel casting process in the tundish. Therefore, as a first step of modelling development, research work in this paper was confined to describing only some features of inclusion behavior during the steady state casting process. To simplify the model, the growth and collision mechanisms of inclusions were not considered.
The present work focuses on understanding the effect of tundish configurations on steel cleanness by calculating the inclusion removal effectiveness of various combinations of weirs, dams and gas curtain blowing. The results are expected to be helpful in tundish design. A multi-phase framework is typically required for the modelling of gas stirring processes in the tundish. Such processes involve the interactions of liquid steel, gas bubbles and solid particles. The multi-phase algorithms are complex and can be unreliable in terms of either convergence behavior or in the extent to which the physics is captured. Therefore, a detailed sensitivity analysis of different parameters was performed in this study to address the interrelations between hydrodynamic parameters, influence of material properties and particle size on the CFD model predictions.
2. CFD Model
2.1. Model Description
CFD software STAR-CCM + v.13 from Siemens PLM [23] is used to simulate the fluid flow, the bubble column, and the inclusion removal. The assumptions made for the mathematical model are described below:
The model is based on a 3D standard set of the Navier–Stokes equations. The continuous phase is treated by a Eulerian framework (using averaged equations).
- Isothermal and steady-state liquid flow is considered.
- The motion of bubbles and inclusions is simulated by solving the force balance equations.
- The realizable k-ε model is used to describe the turbulence.
- The free surface is flat and is kept at a fixed level. The tundish slag layer is not included.
- The surface tension and wettability at slag/steel/inclusion interphase boundaries are not included.
2.1.1. Fluid Flow
The molten steel flow is defined as a three-dimensional flow with constant density. Equations (1) and (2) are the governing equations used to describe the continuous phase [24].
Continuity:
Momentum:
The liquid–bubble interaction is modelled using a source term SF which accounts for the momentum exchange between the bubbles and the liquid.
Realizable k-ε model [25]:
where k is the turbulent kinetic energy; ε is the turbulent energy dissipation rate; µ is the molecular viscosity; µt is the turbulent viscosity; Gk represents the generation of turbulent kinetic energy due to the mean velocity; YM represents the contribution of the fluctuating dilatation in compressible turbulence to the overall dissipation rate; υ is the kinematic viscosity; and σk and σε are the turbulent Prandtl numbers for k and ε, respectively.
The success of numerical prediction methods depends to a great extent on the performance of the turbulence model used. The realizable k-ε model is substantially better than the standard k-ε model for many applications, including (i) round jets; (ii) boundary layers under strong adverse pressure gradients or separation; (iii) rotation and recirculation; and iv) strong streamline curvature. The realizable k-ε model was implemented in STAR-CCM + with a two-layer approach, which enables it to be used with fine meshes that resolve the viscous sublayer [23,25].
2.1.2. Particle Dynamics
The bubbles and the inclusions are considered to have a spherical shape, which simplifies the calculation of the force exerted by the liquid on the discrete phases significantly. The transport equation for each particle is given as [23]:
where mi and Vp denote the mass and the velocity of particle. On the right side of Equation (6), the particle–fluid interaction forces are drag force Fd, pressure gradient force Fp, virtual mass forces Fvm, gravitational force Fg, lift force Fl and turbulent dispersion Ftd, respectively.
The effect of the bubble phase on the continuum is considered by incorporating the exchange of momentum as a source term in the momentum equations of the continuous phase. The effect of the inclusions on the continuum is neglected.
The drag force is defined as:
where Cd is the drag coefficient of the particle, vl and vp denote the velocity of the liquid and the particle.
The drag force is modelled using the Schiller–Naumann model defined as: (Re is the particle Reynolds number)
The sum of the forces due to the pressure gradient force and gravitational forces is written as:
The virtual mass force is defined as
where is the virtual mass coefficient.
where , the curl of the fluid velocity; Cls is the lift force coefficient.
A turbulent dispersion force is added to the model. The eddy velocity fluctuation is normally distributed with a zero mean and a standard deviation for the eddy velocity scale, which is calculated from the turbulence model. Since the kinetic energy of turbulence is solved at each point in the flow, the root mean square (RMS) fluctuating velocity components (v’) are estimated as:
2.1.3. Tracer Dispersion
To calculate the concentration of the additive tracer, the transport of a passive scalar is simulated by solving a filtered advection-diffusion equation. The passive scalar transport equations are solved at each time step once the fluid field is calculated [26].
where the effective diffusivity, Deff, is the sum of the molecular and turbulent diffusivity. The velocity field is solved from a steady-state simulation and remained constant during the calculation of the two passive scalars.
2.2. Computational Domain and Boundary Conditions
2.2.1. Computational Domain and Mesh
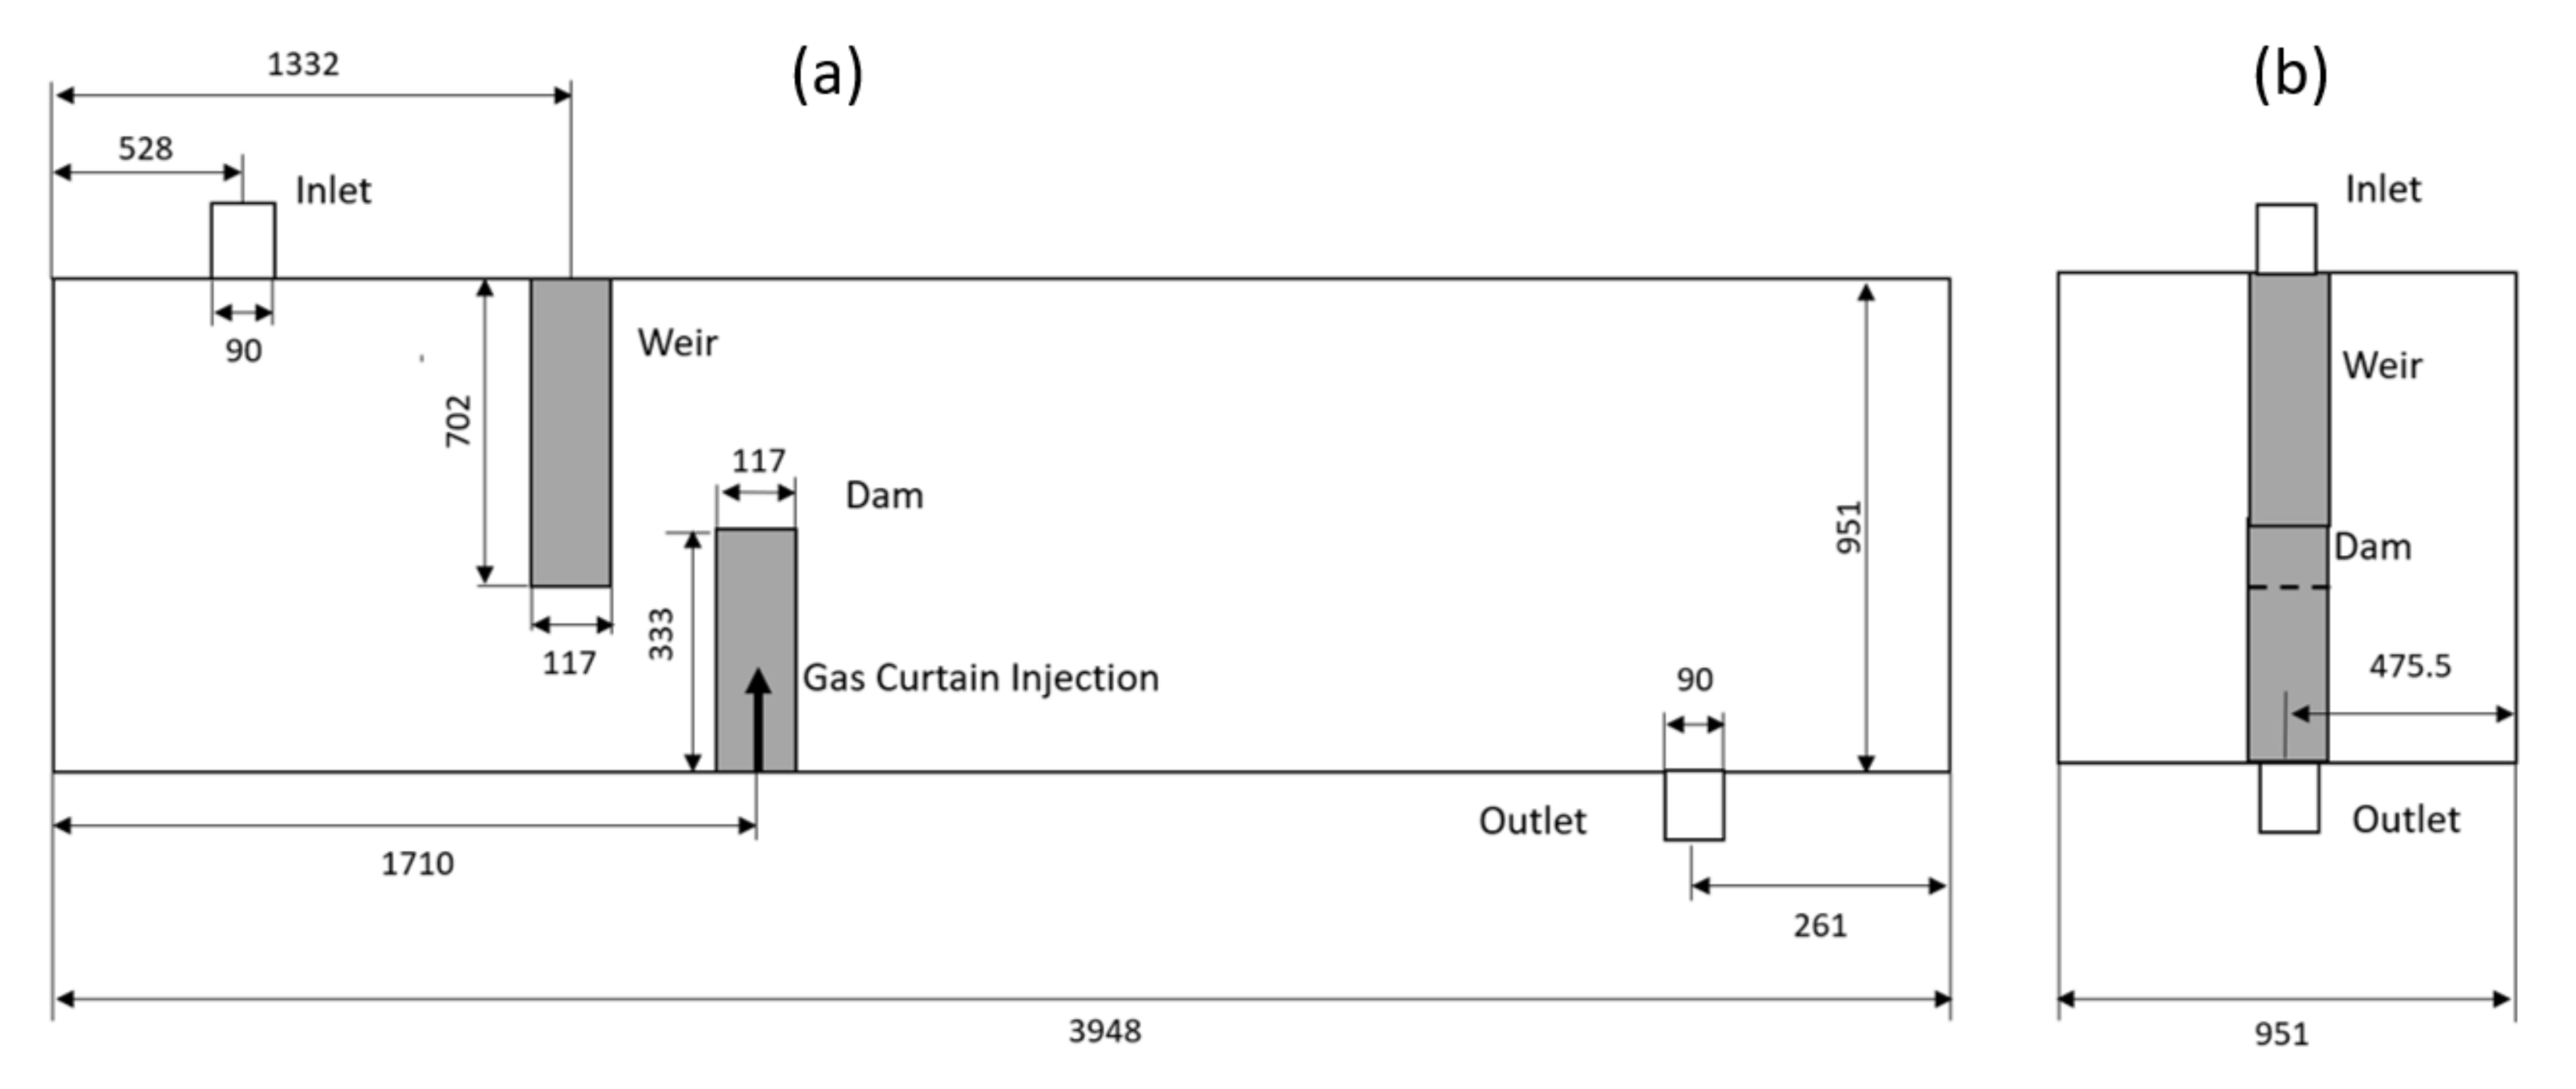
The geometrical dimensions of a single-strand slab tundish (30 tonne) with a dam, a weir and a gas curtain are illustrated in Figure 1. The multiphase computational modelling of the large metallurgical reactors still remains challengeable, as the accuracy of the model highly relies on the considered number of bubbles and inclusions. This, however, adds complexity to the modelling work and brings a heavy burden in numerical computations. At the first step of the model development, a simplified rectangular tundish is adopted to reduce the modelling complexity. Flow control devices such as the turbulence inhibitor, the stopper rod and the ladle nozzle are not included in the simulations. The numerical burden can be limited due to the reduced number of CFD cells.
Four cases with different tundish configurations are selected and comparatively studied. They are:
- Case 1-W + LD: tundish with weir and low dam;
- Case 2-W + HD: tundish with weir and high dam;
- Case 3-W + LD + G: tundish with weir, low dam and gas curtain;
- Case 4-W + HD + G: tundish with weir, high dam and gas curtain.
To create the geometry for CFD calculation, the first step is to build a 3D-CAD model. The volume mesh is generated in Star-CCM + V13.04 using the trimmer and prism layer meshing options. Three prism layers are generated next to all the walls. The surface mesh is generated first. Then the volume mesh is built based on the surface mesh by adjusting the growth rate and the biggest mesh size. A base mesh size of 0.006 m is used in this study. The input parameters for the simulation are listed in Table 2. The surface average y + value in the first layer of the mesh near the wall is 2. The final CFD model possesses a total of 4.5 million trimmer cells in the computing domain.
2.2.2. Boundary Conditions
Continuous Phase
No-slip conditions are applied on all solid surfaces for the liquid steel phase. A constant inlet velocity is used. At the tundish outlet, the outflow boundary condition is applied. A wall function is used to bridge the viscous sub-layer and to provide the near-wall boundary conditions for the average flow and the turbulence transport equations. The wall conditions are connected by means of empirical formulae to the first grid node close to the solid surfaces.
Inclusion Particle
In the calculation, a discrete random walk model is applied to simulate the stochastic effect caused by the turbulence eddies on the inclusion trajectories. To simplify the model, the inclusion particles are assumed to have a spherical shape. Agglomeration and collision of the inclusion particles are not considered. Those inclusion particles reaching the top surface and the outlet are regarded as removal while the rest are considered as rebound. In total, around 1500 inclusion particles are injected through the inlet. The particle density is calculated considering the most common inclusion component to be Al2O3, which is normally around 3500 kg m−3. Four different inclusion densities (2500, 3500, 4500 and 5500 kg m−3) are calculated to simulate the situation when it consists of other inclusion components other than alumina. Inclusion properties are listed in Table 2.
Gas Bubble
Argon gas is assumed to be average injected though the top of a porous beam where the dam is located. The properties for argon gas are given in Table 2. The escape boundary condition is applied to those bubbles that float to the top surface and flow to the outlets. The rebound boundary conditions are applied to the solid walls.
2.3. Solution Procedure
The discretized equations are solved in a segregated manner with the semi-implicit method for the pressure-linked equations (SIMPLE) algorithm. The second-order upwind scheme is used to calculate the convective flux in the momentum equations. The solution is judged to be converged when the residuals of all flow variables are less than 1 × 10⁻⁴, together with the stability of the velocity and the turbulence at the key monitor points. The flow fields are calculated in steady state. The transient calculation is used to solve the discrete phase equations. The under-relaxation parameters of flow calculations for the pressure, the velocity and the turbulence are 0.3, 0.7 and 0.8, respectively.
3. Verification and Validation
3.1. Sensitivity Study of Mesh
Best Practice Guidelines (BPG) relevant to all numerical simulations are important to ensure the accuracy and credibility of CFD predictions. ERCOFTAC BPG [27] is a comprehensive document that provides such guidelines for industrial simulations, many of which should also be applied in the tundish simulations. Odenthal et al. [28,29] reviewed the results of a CFD benchmark study on the water model of a continuous-casting tundish. The benchmark without any restrictions of the modelling strategy illustrates that CFD simulations result in comparable flow patterns when basic rules are considered. This work provides guidelines and reference for CFD engineers when setting up numerical models in the field of tundish flow studies.
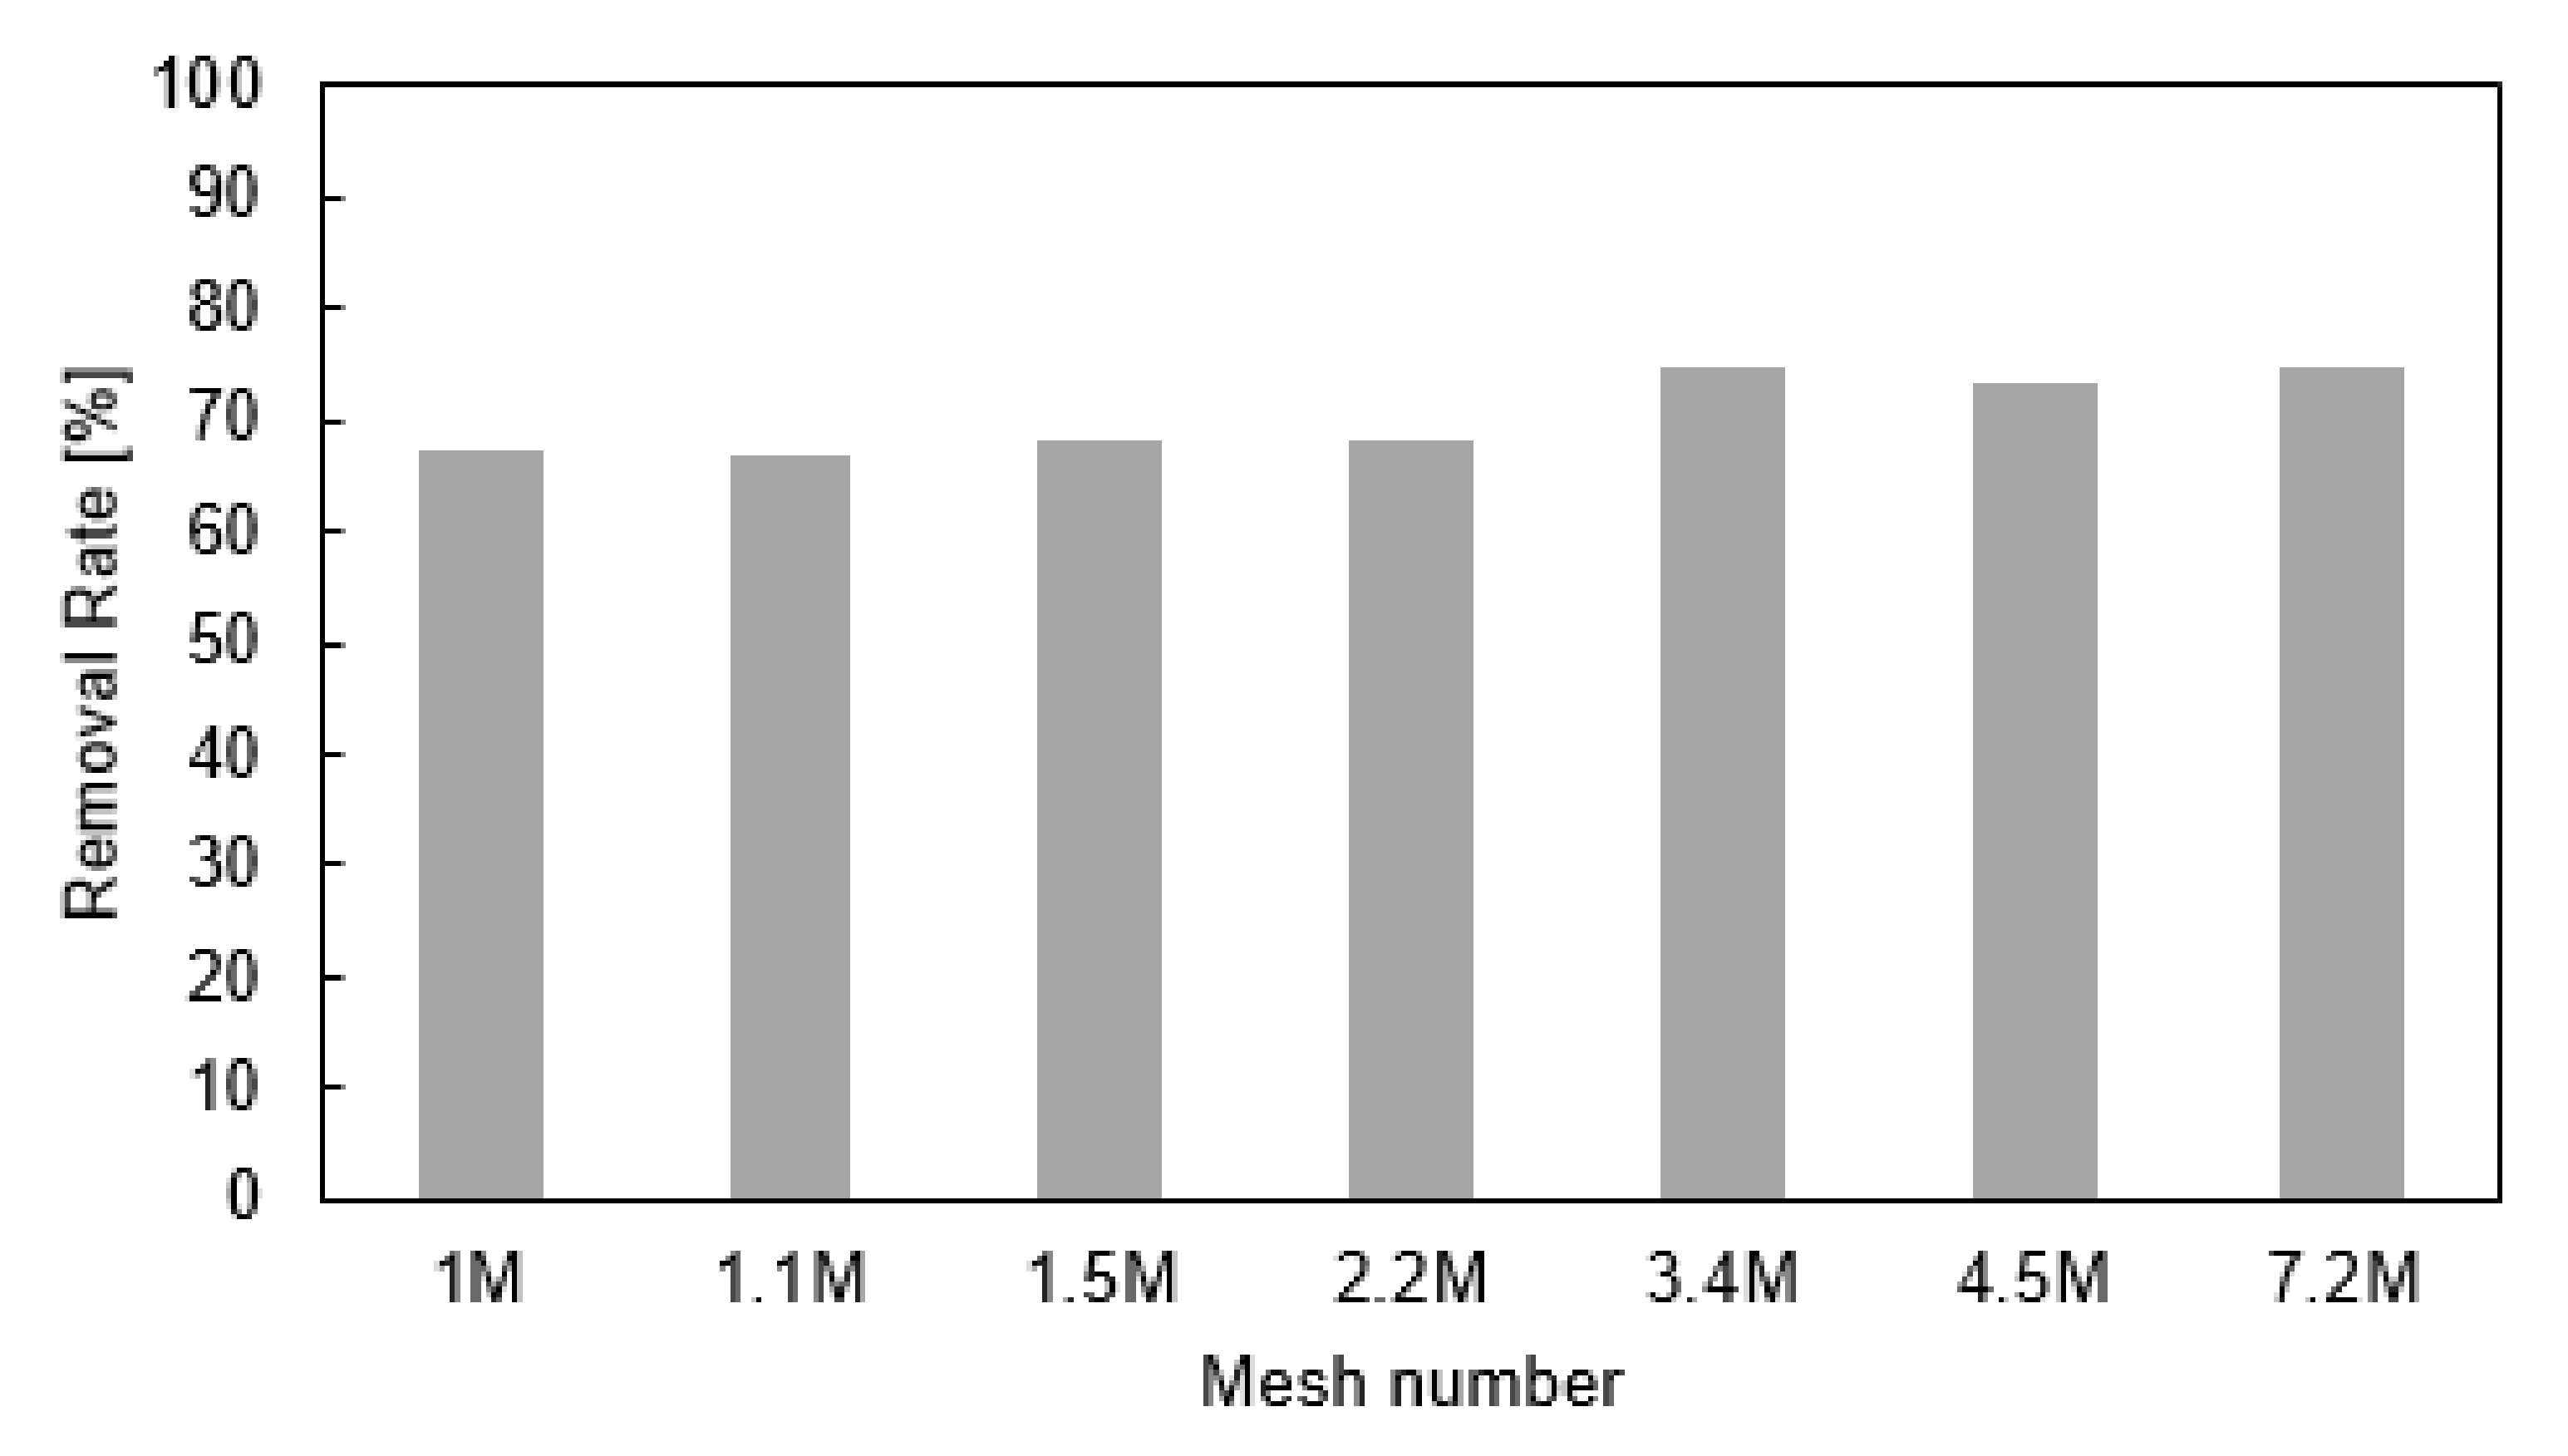
Use of an adequately refined and high-quality mesh is an important step in achieving accuracy in numerical simulations. As shown in Figure 2, a mesh independence study based on the inclusion removal rate is carried out to estimate the most appropriate mesh density. The inclusion removal rate improves with increasing mesh number. Moreover, grid independence occurs when the mesh number is larger than 3.4 million. The applied criterion in this study is a difference in inclusion removal rate of less than 2% based on the engineering judgement. The influence of the turbulence eddies on the particles is modelled with the fluctuations of the randomly generated flow velocities. These generated fluctuations may be inconsistent with the turbulent eddy size near the flat surface, which becomes zero in the vicinity of the surface. Therefore, the near wall mesh size is important in the solution of turbulent flow and inclusion removal. With respect to the computing load and the near wall resolution, the computations in this work are carried out with 4.5 million cell mesh, and the reference mesh size is 0.006 m.
3.2. Sensitivity Study of Particle Number
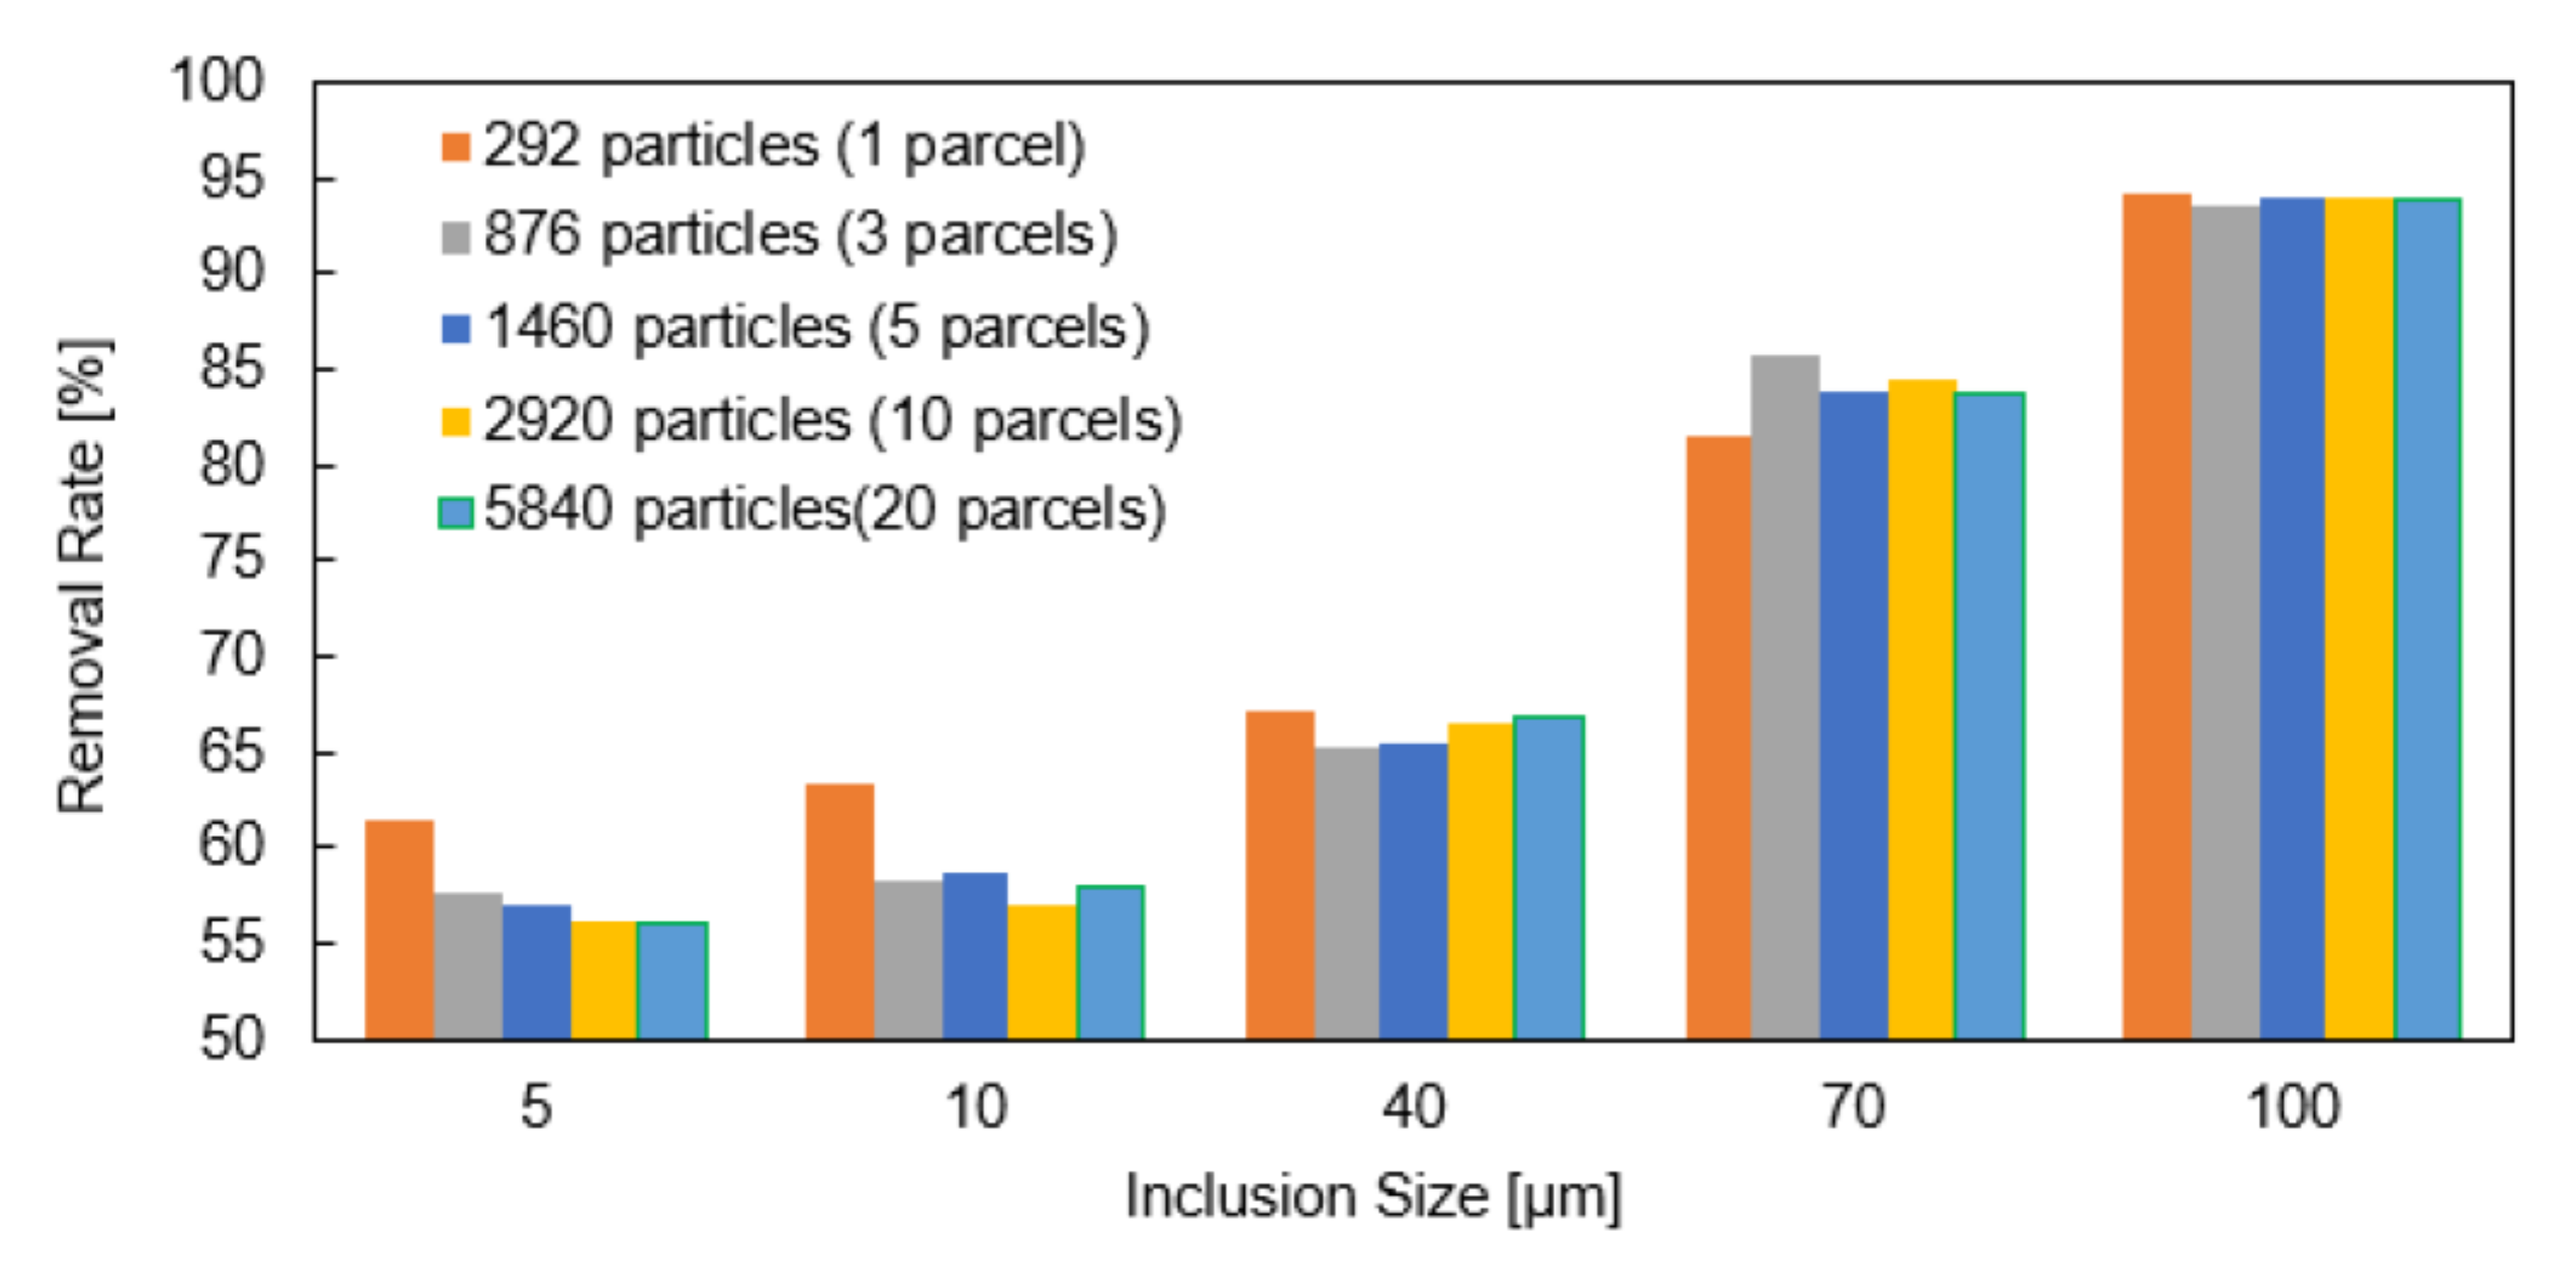
The sensitivity of the inclusion particle number is studied by setting a parcel stream of 1, 3, 5, 10 and 20 for each injection cell. This corresponds to a total injecting particle number of 292, 876, 1460, 2920, and 5840, respectively. As shown in Figure 3, the inclusion removal rate increases with the increase in particle size. Since the particles’ turbulent random motion is considered, higher result variance is observed in the group of small inclusions (5 µm). The results of the 1-parcel stream have a relatively big difference in comparison with the results of the other parcel streams. The increment of particle numbers reduces the results variance and thus increases the statistical accuracy. The injected inclusion numbers have a negligible effect on the removal rate of the bigger inclusions (100 µm).
3.3. Validation
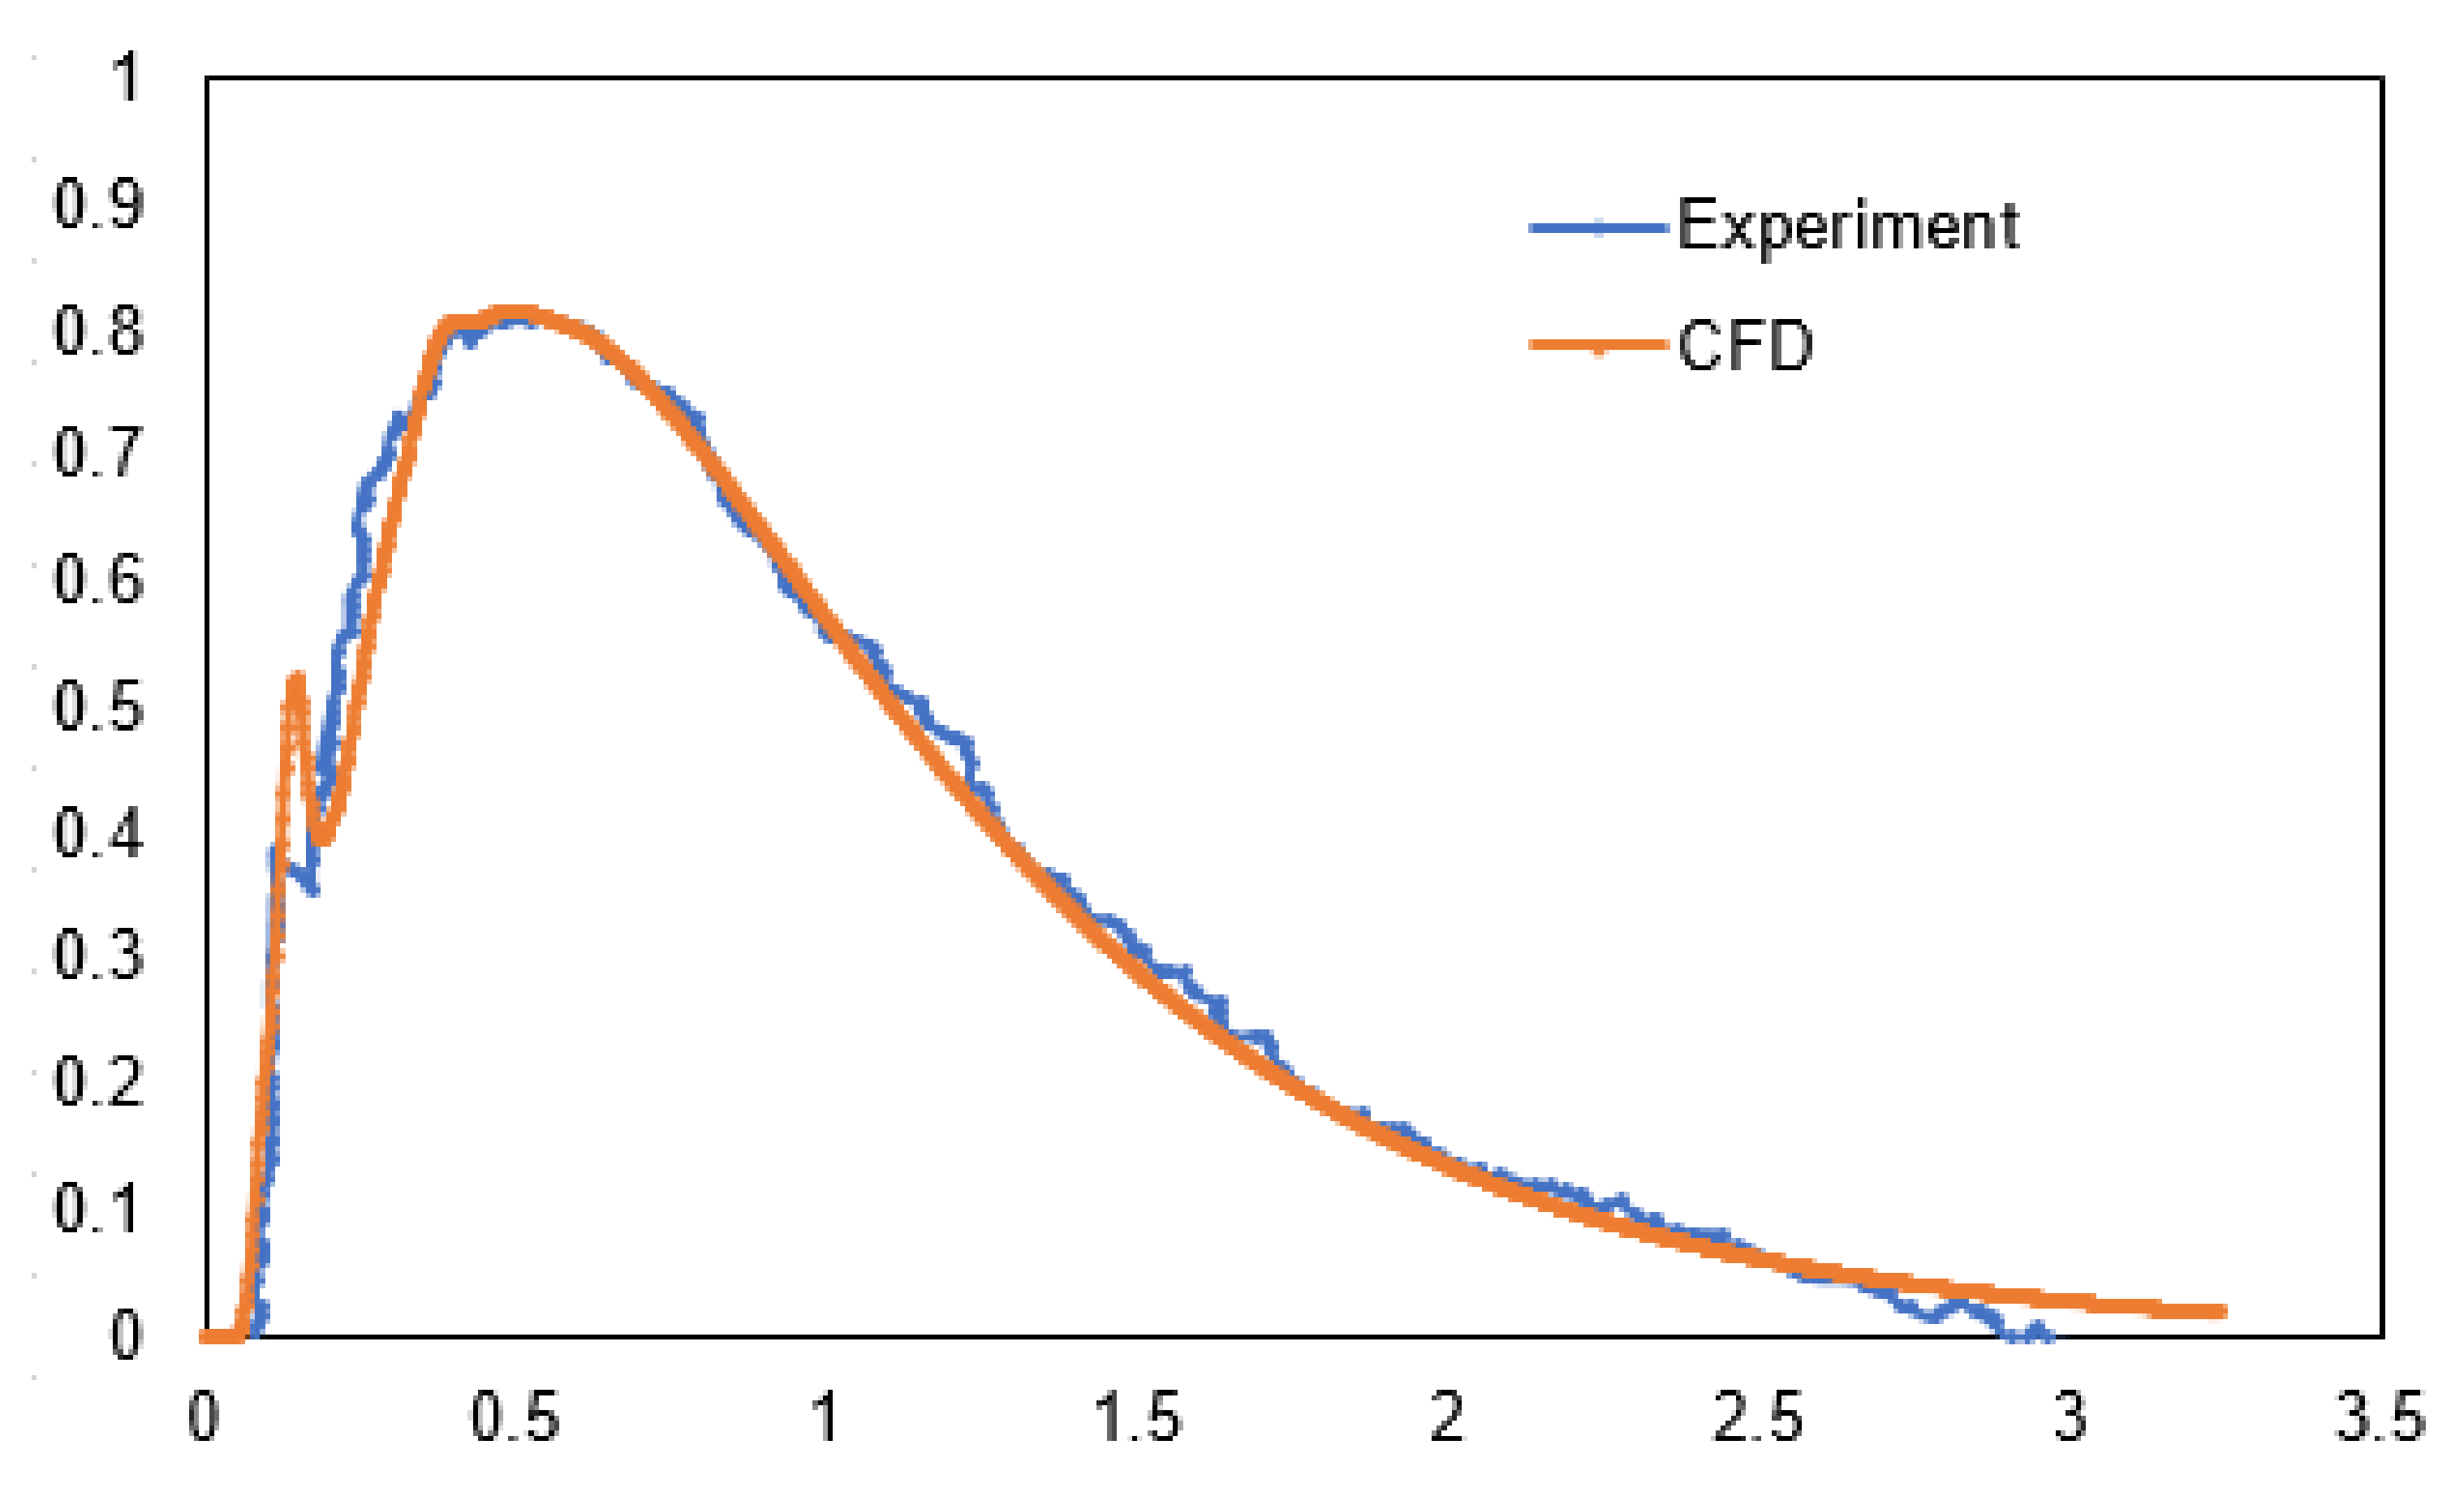
The mathematical model is validated against water model experiments reported in the scientific literature by Chen et al. [14]. A 1:2 scale water model is used to study the flow phenomena in a single-strand tundish with gas curtain. The experiment is carried out with the dispersion of NaCl tracer. The pulse stimulus-response technique is used to measure and obtain the RTD E-curves. When the assumed liquid level in the water model is reached and the flow is stabilized, the NaCl solution composed of 200 mL salt-saturated fluids and 800 mL water was infused through the tracer inlet in 2 s. The change of tracer concentration is registered continuously at the outlet. The time and the tracer concentration are transformed to the dimensionless value in order to compare the obtained flow characteristics.
Using the same geometric dimensions of the water model, the RTD curve obtained from the present CFD model is shown in Figure 4 along with the experimental observations (tundish with gas curtain). To solve the passive scalar equation, at t = 0~2 s, the mass fraction of tracer at the inlet is set to be equal to 1. When t > 2 s it is given as zero. The concentration of the tracer at the outlet was monitored from t = 0, and the RTD curves are obtained from the numerical calculation. The detailed input data for CFD calculations, including hydrodynamic parameters and material properties, can be found in [14]. There is good matching of the breakthrough time between the calculated and the measured results. The peak value also agrees well with the experiment. The slopes of E-curves after the peak are close to each other. Thus, the overall comparison between the simulation and the experiment is satisfactorily close.
4. Results
4.1. Fluid Flow
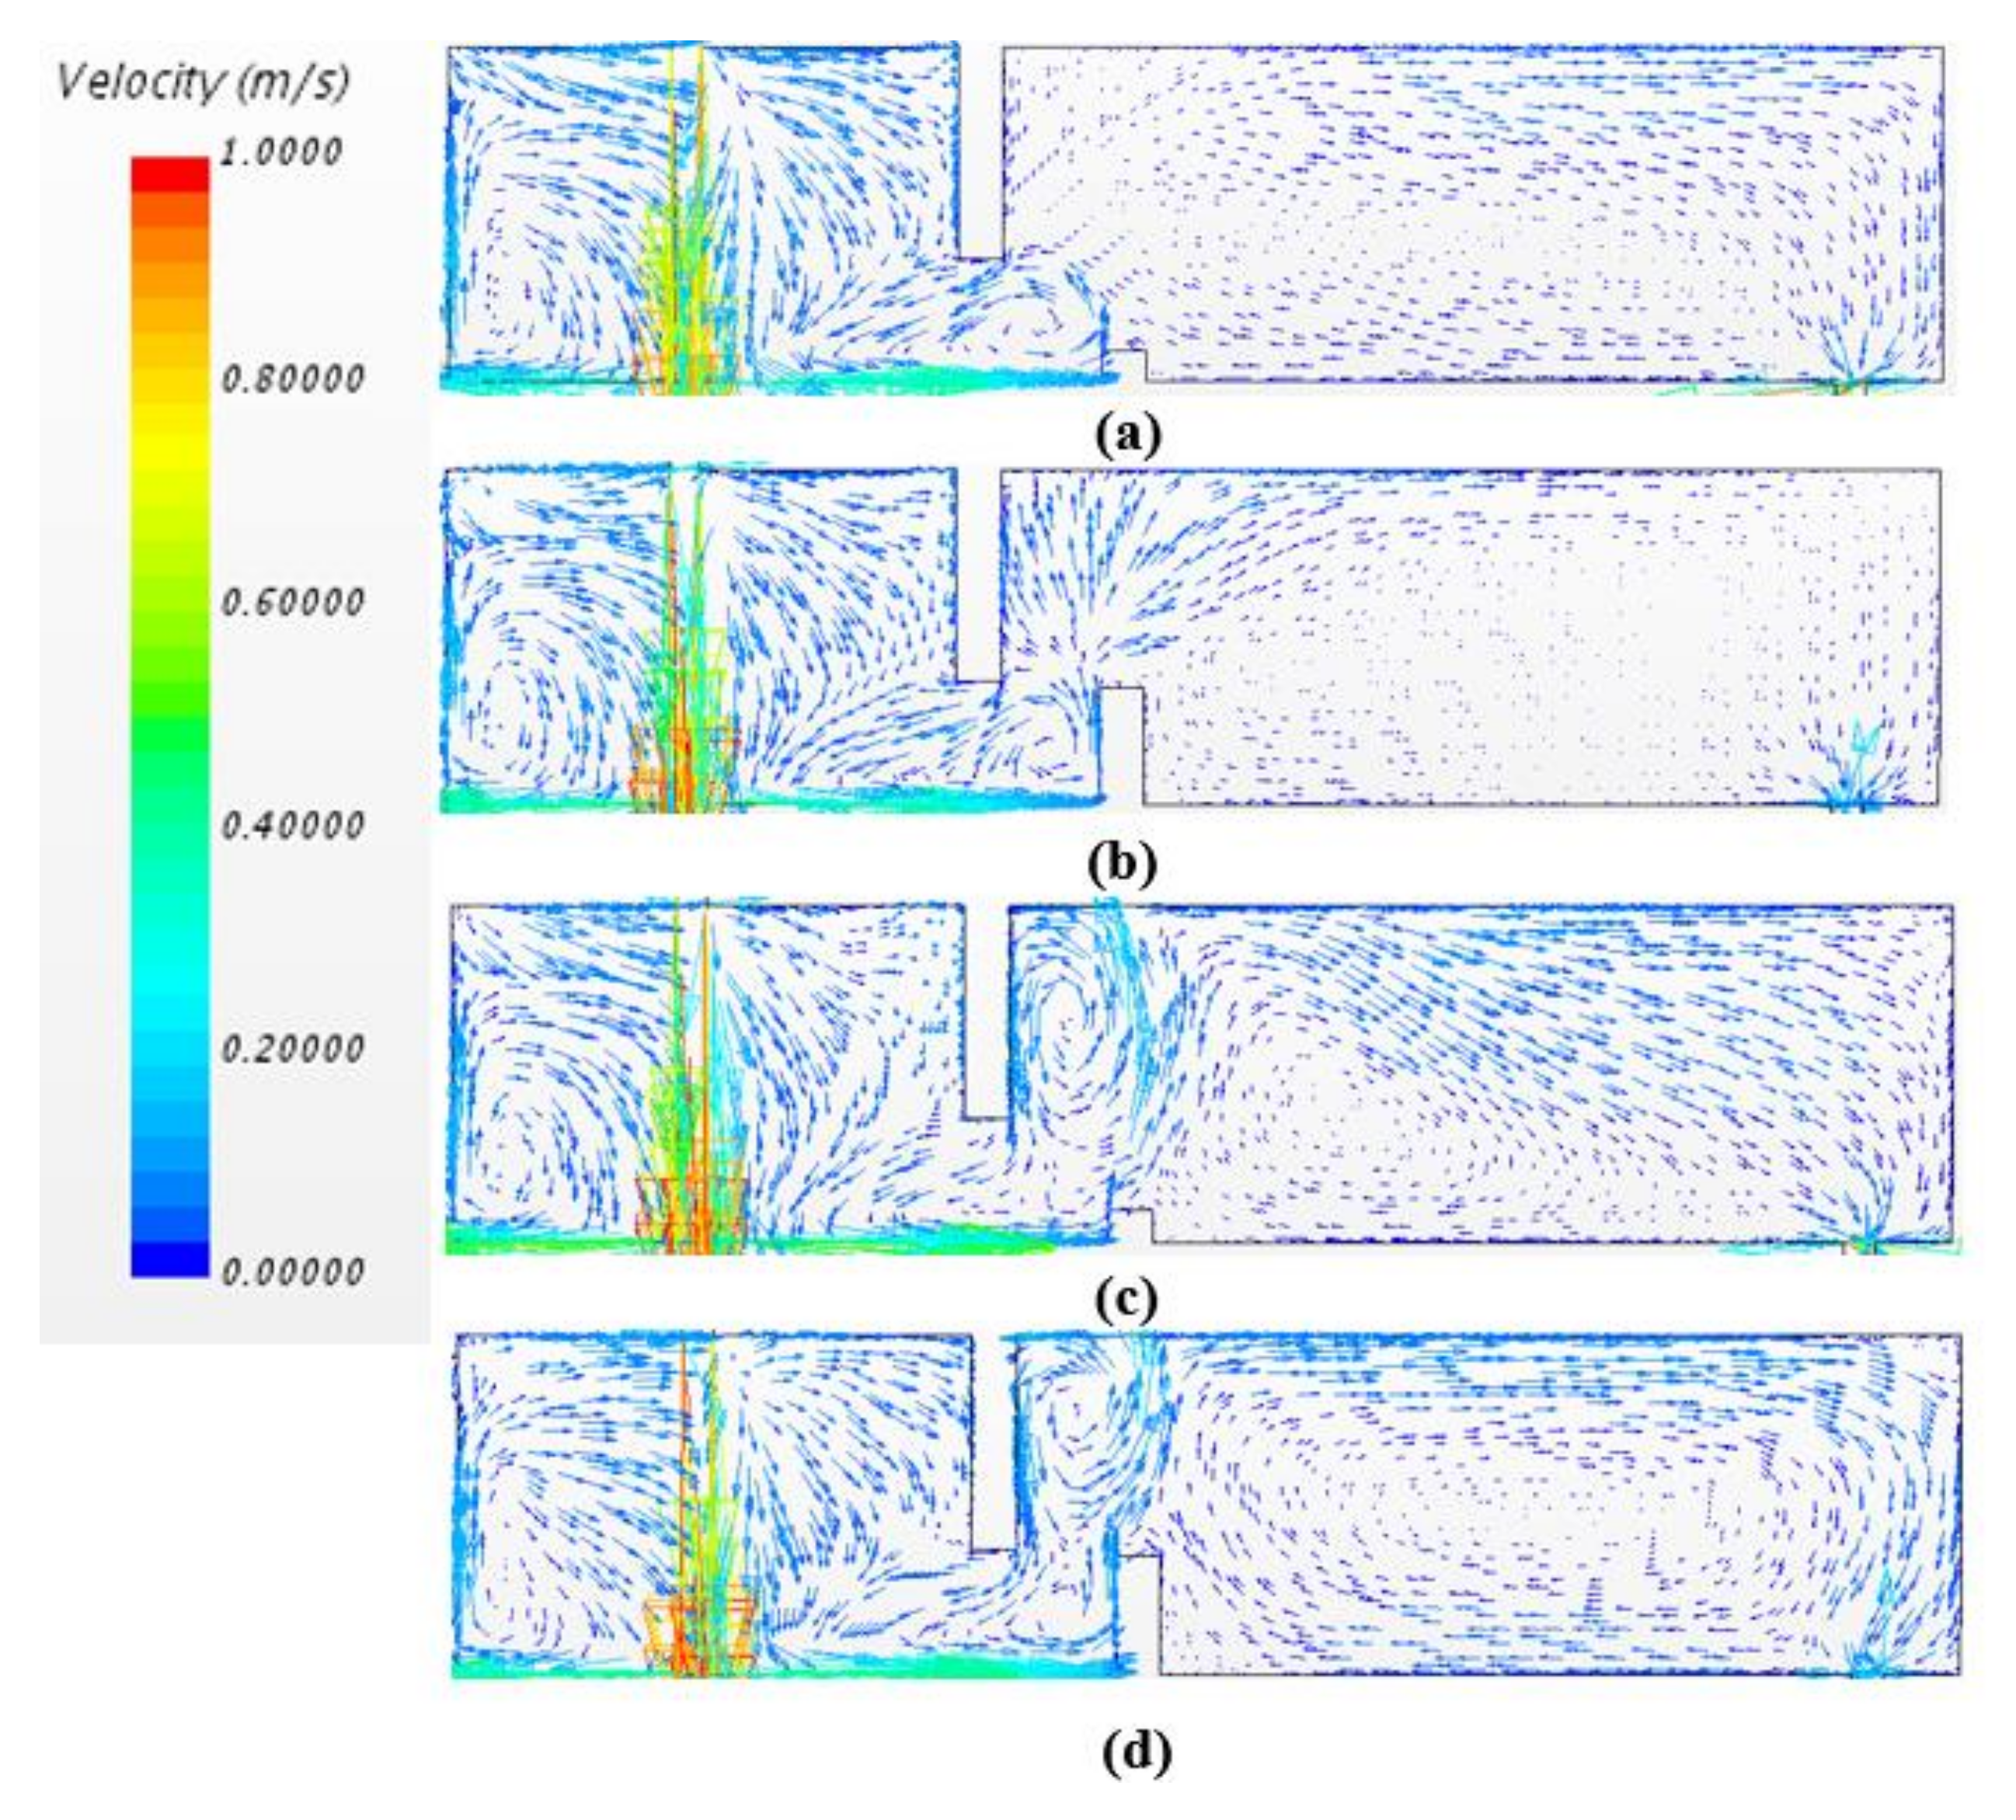
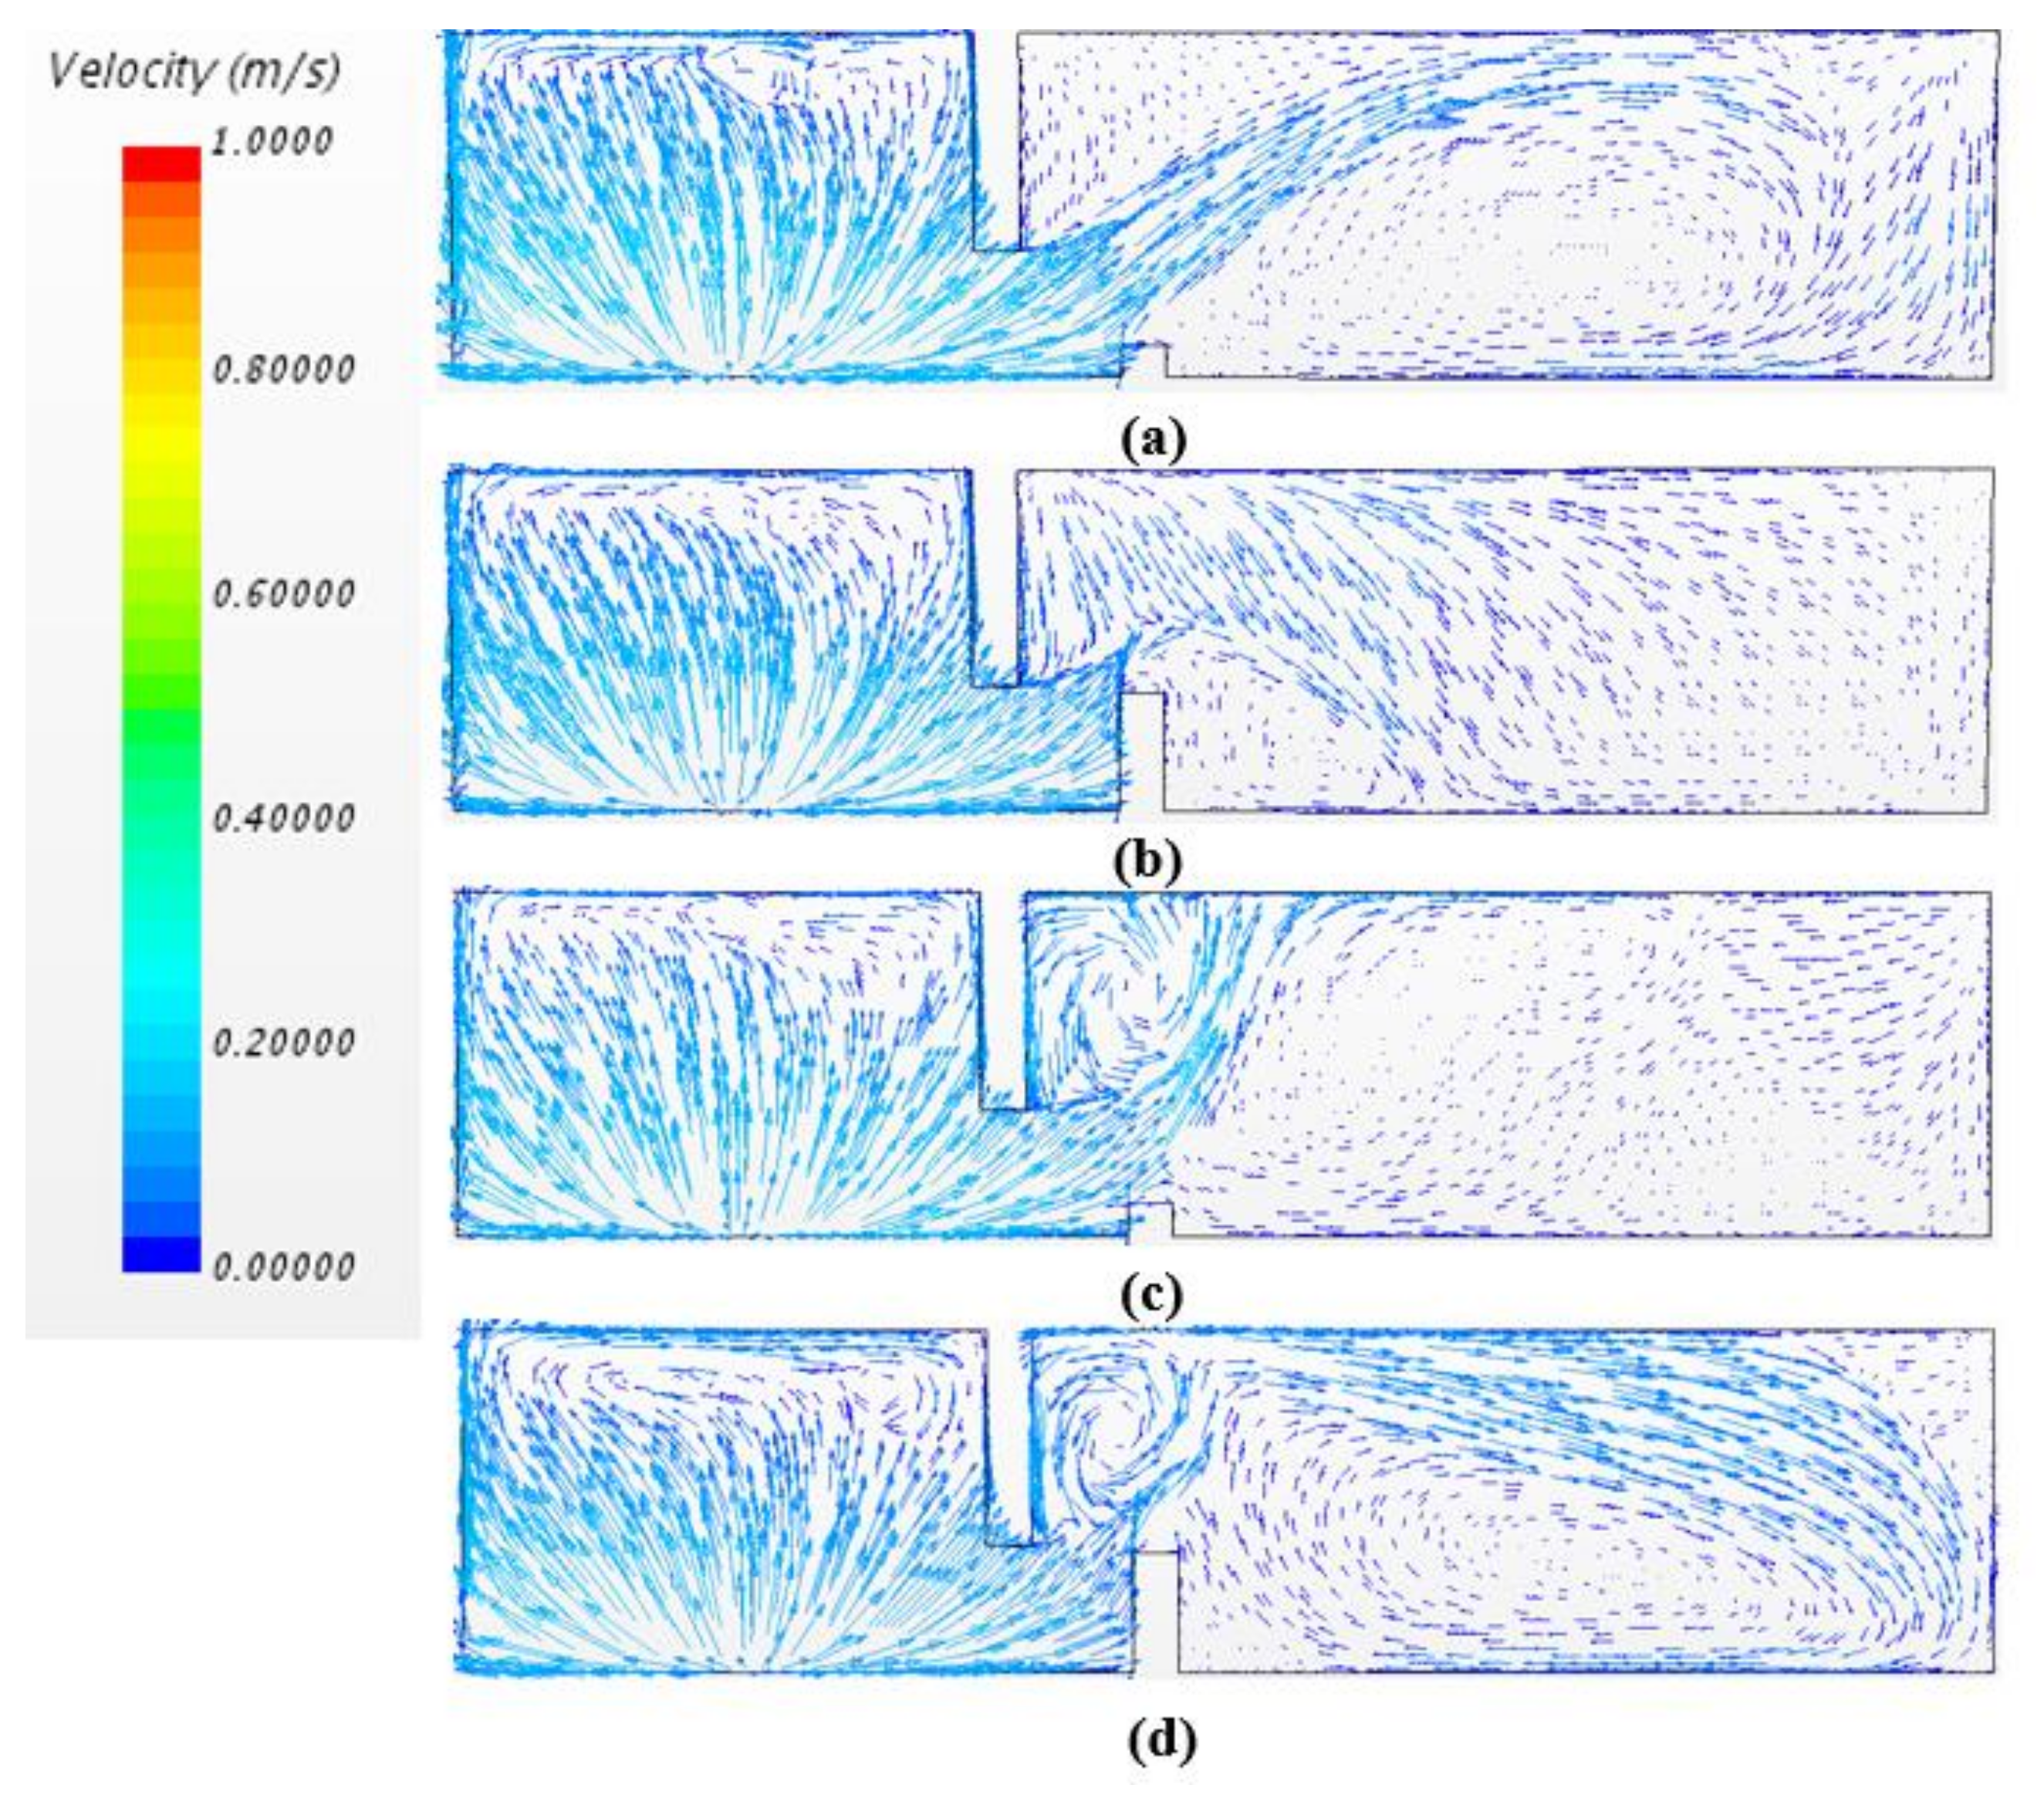
Figure 5 and Figure 6 show the predicted flow characteristics in the tundish. The flow patterns in the first chamber (the entry zone) show similar characteristics for all the four cases, independently of the arrangement of the flow control devices and the gas curtain. The entering liquid jet flows down to the bottom of the tundish, and spreads rapidly. The flow is driven along the front, back and left sidewall, then moves back to the incoming jet, forming counter flows near the inlet region. The turbulence zone caused by the incoming stream is confined within the region near the inlet owing to the presence of the weir. The high momentum flow moves underneath the weir and downstream towards the outlet direction.
The presence of a dam (Case 1 and Case 2) reorients the flow after the weir area in the second chamber (the outlet zone). It drives the flow vertically towards the top surface, which increases the contact possibility between the inclusions and the top slag layer. In addition, the interference of the dam impairs the flow recirculation in the second chamber of the tundish. When the flow passes over the weir and dam, the flow velocities are much smaller compared with the inlet region, which offers a higher plug volume caused by the support of the weir and dam and also limits the extension of the turbulence zone.
In terms of two gas injection cases, Case 3 and Case 4, the gas curtain not only generates small gas bubbles, which are beneficial for inclusion removal, but also act as a ‘dam’, which redirects the downstream flow after the weir. The presence of the gas curtain causes an increase in the steel velocity and yields two backflows at each side of the gas plume. One flows through the bubble region towards the weir, while the other proceeds opposite, along the top surface towards to the upper-right corner. Then, a part of steel flows along the right-side wall towards to the outlet. The horizontal velocity surge near the top surface is observed as a result of the gas curtain. A strong clockwise recirculation loop is observed in the right part, which is desirable for the inclusion removal due to the prolonged particle residence time.
4.2. Inclusion Study
4.2.1. Inclusion Tracking
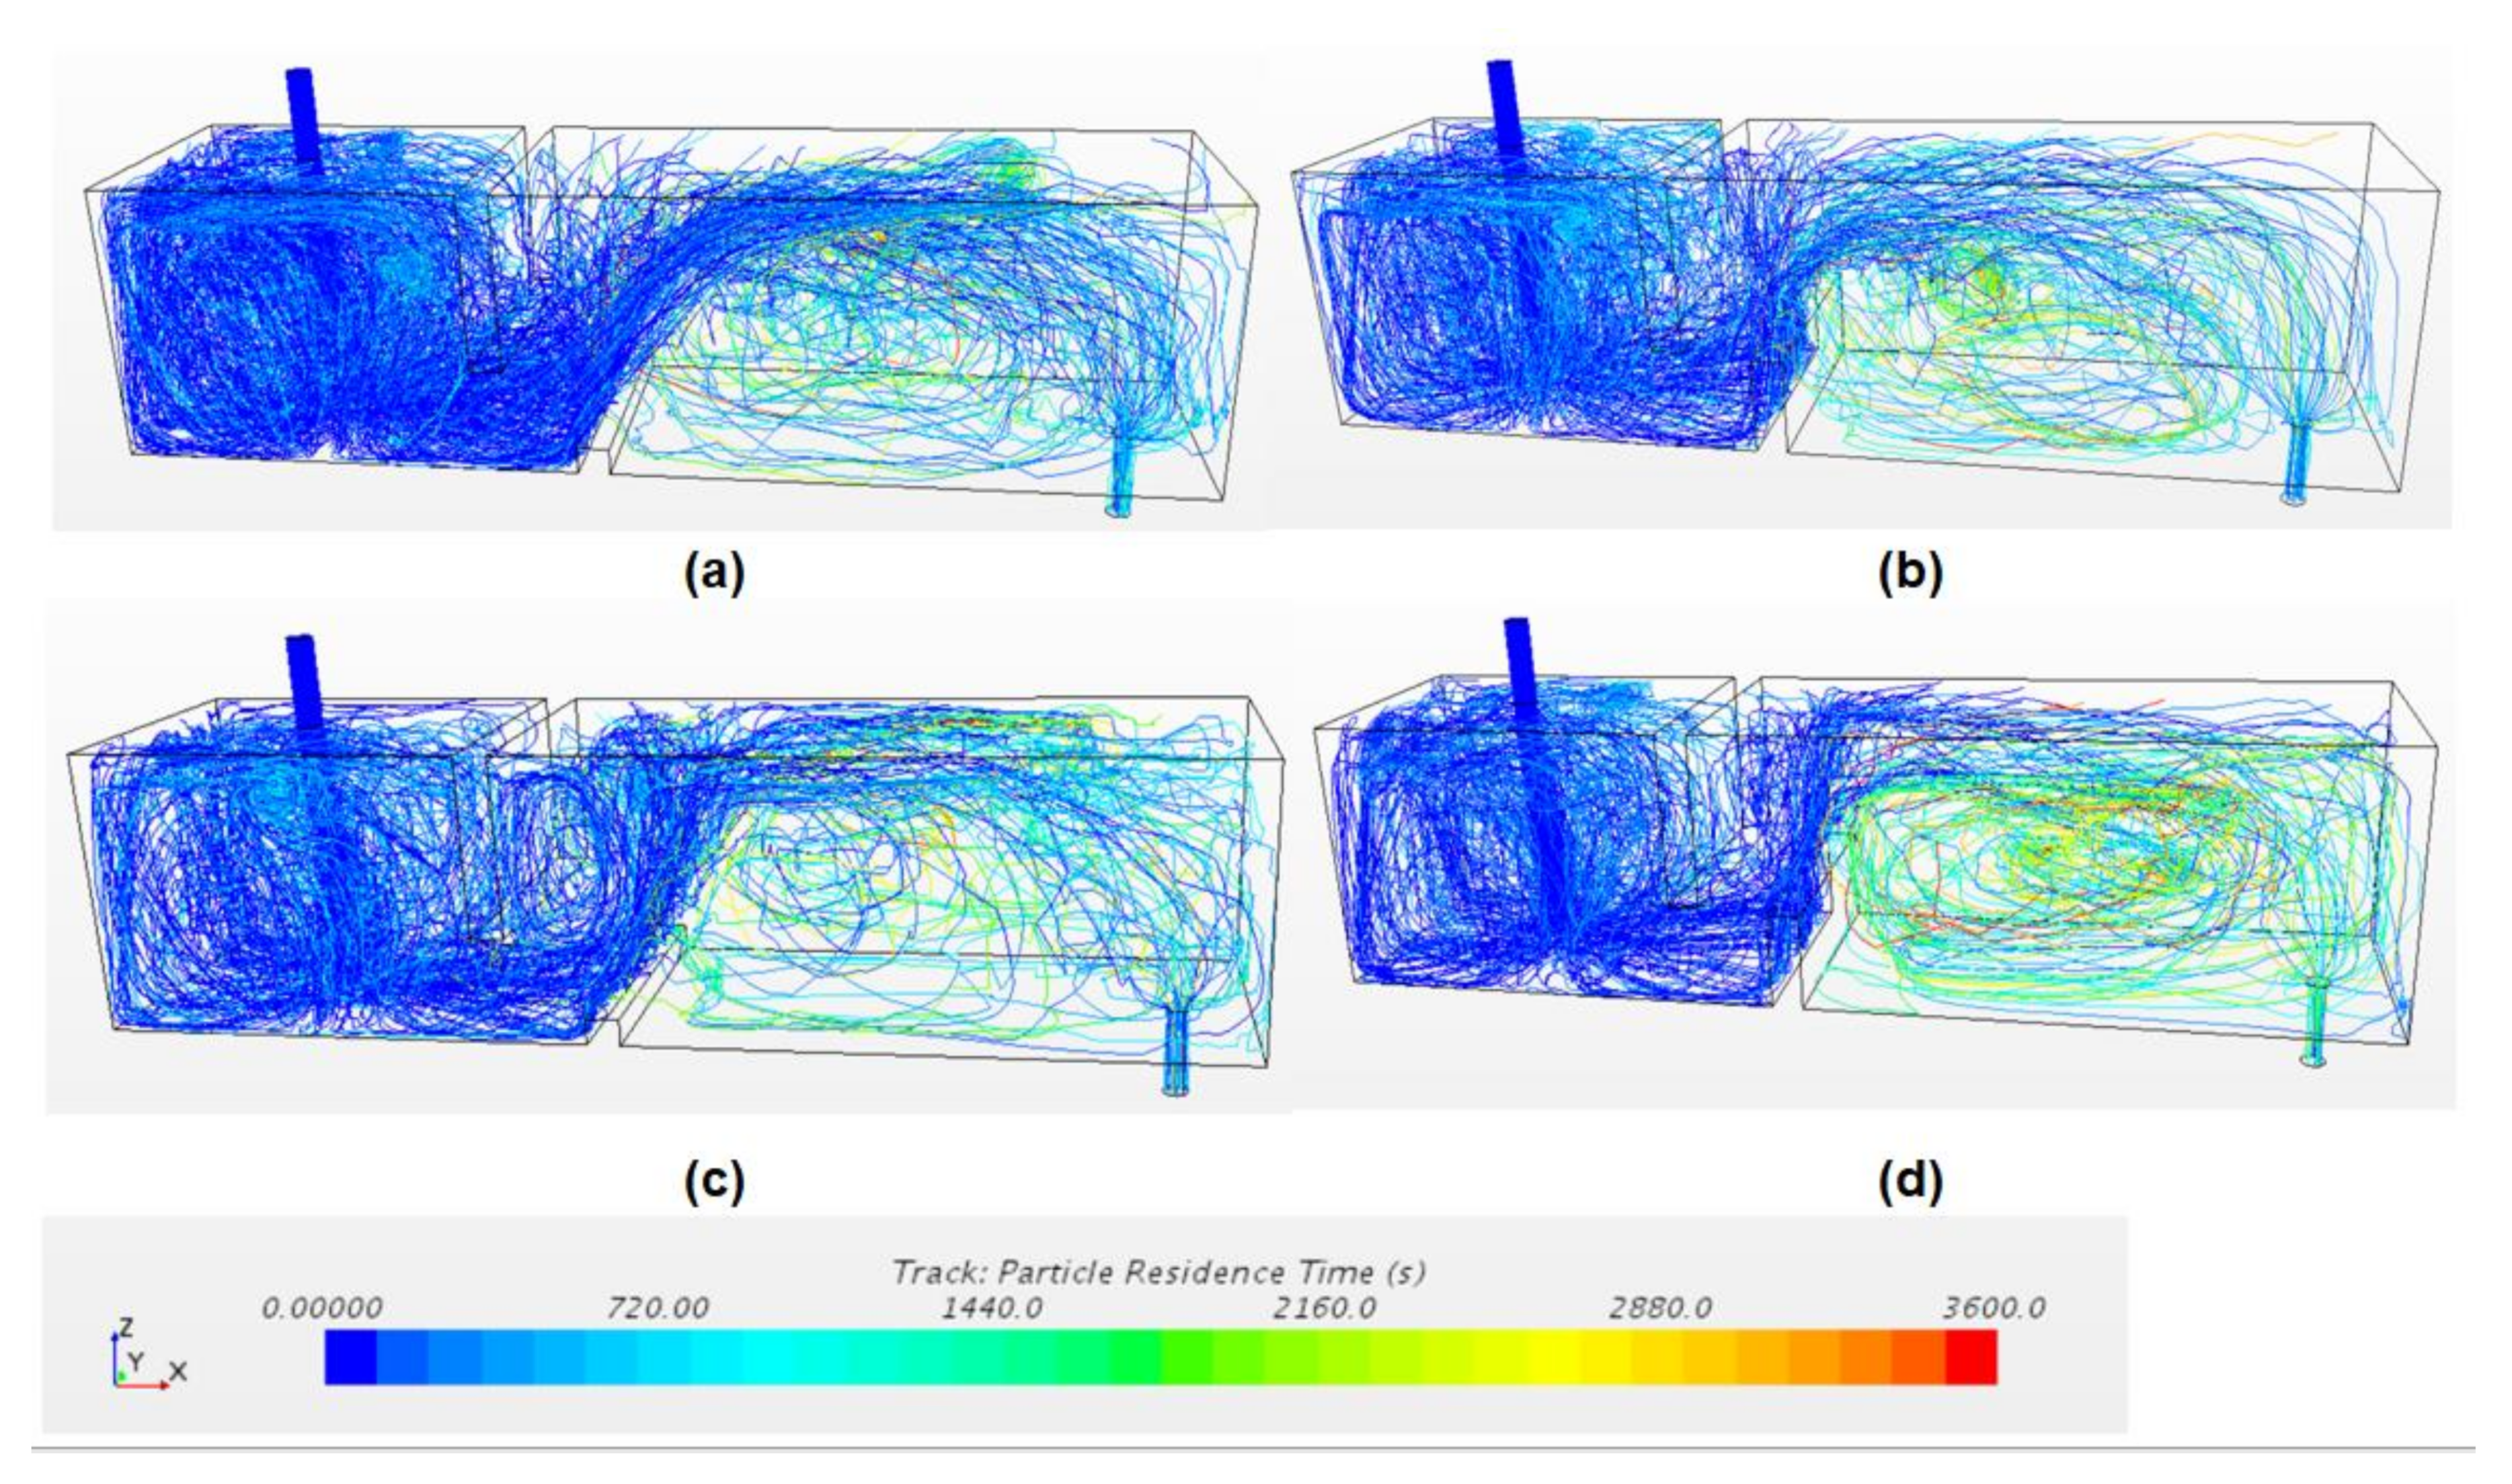
Figure 7 shows the representative trajectories behavior of non-metallic inclusions (density: 3500 kg m−3, size: 10 μm) within the tundish for the four cases. Inclusion particles are injected through the inlet plane simultaneously. For better visibility, trajectories are filtered and colored by particle residence time. A complex recirculation path of the inclusion particles was observed in the first chamber, where inclusions were trapped in the top surface. In Case 3 and Case 4, the existence of the gas curtain and the flow control devices drove inclusions to move longer distances, resulting in a prolonged inclusion retention time in comparison with Case 1 and Case 2.
4.2.2. Inclusion Size
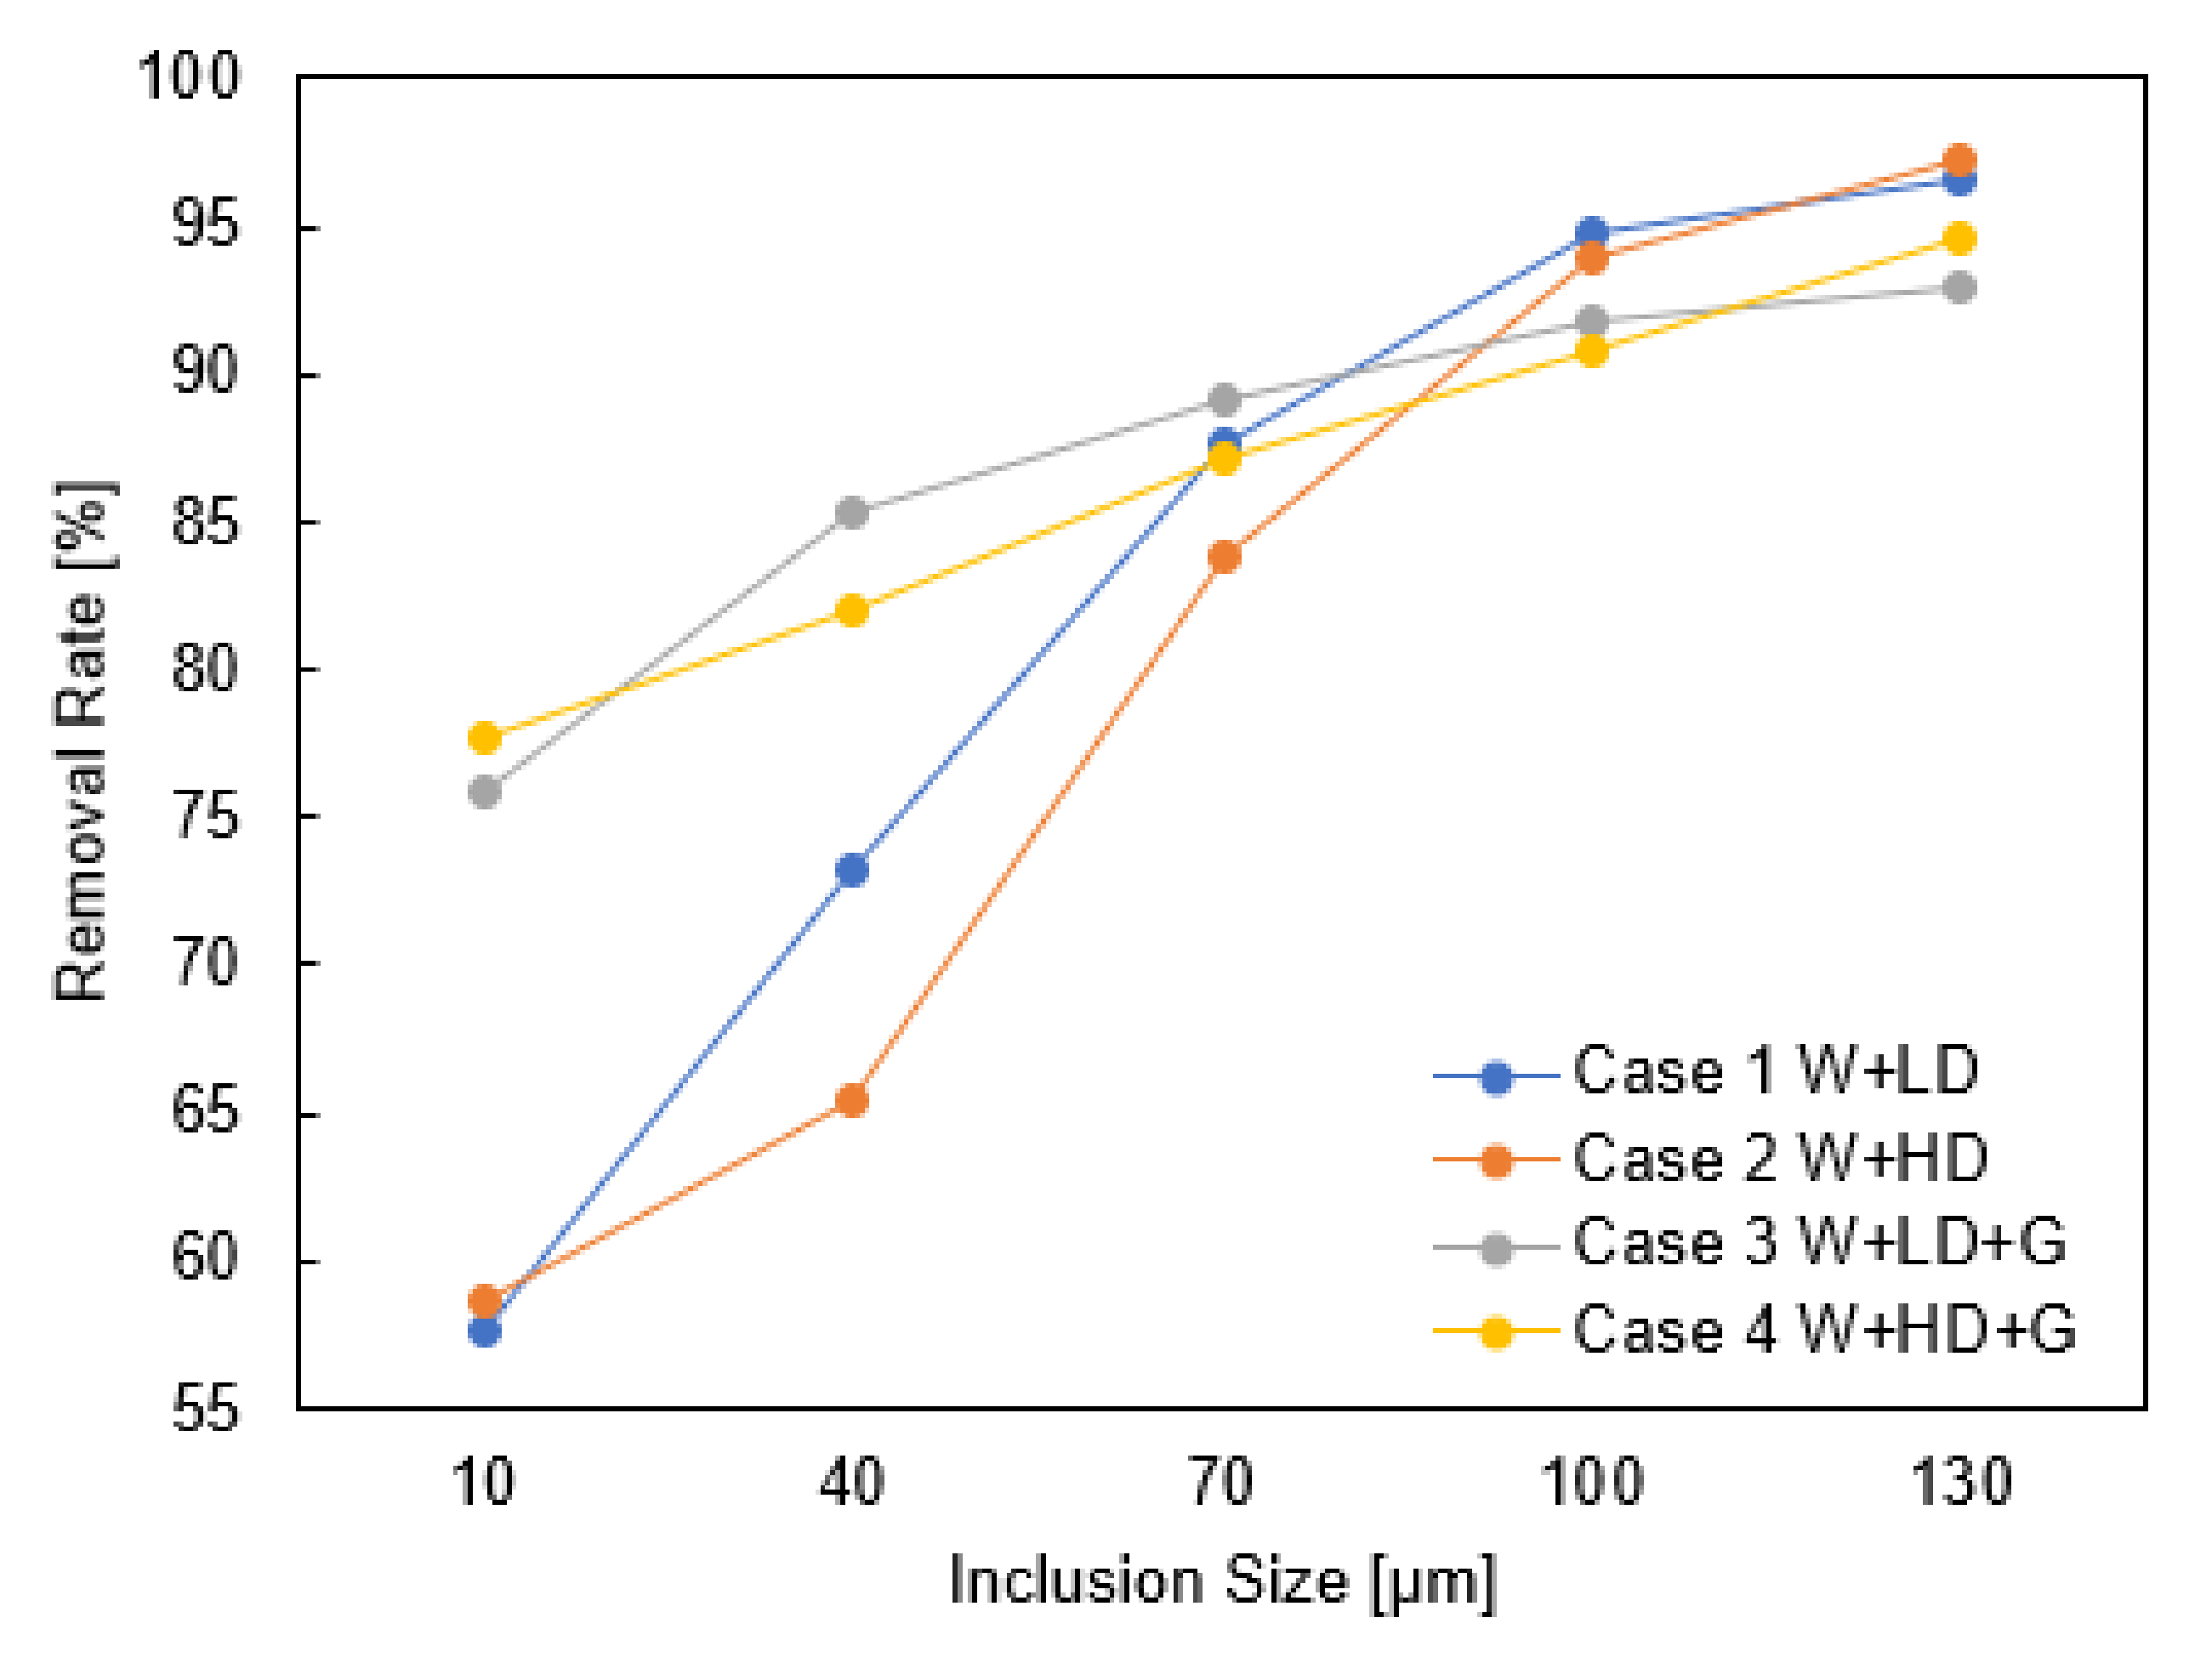
Figure 8 shows the comparison of the inclusion removal rate with the change of the particle size for the four tundish configurations. The selection of the range of the inclusion size is similar to a previously published work [5]. Independent of the arrangement of flow control devices and the gas curtain, the increase of inclusion size has a distinct positive effect on the inclusion removal. For Case 1 and Case 2, the number of inclusion particles captured by the slag layer ranges from 58% for inclusions with a size of 10 μm to 97% for inclusions with a size of 130 μm. The removal efficiency of Case 3 and Case 4 is improved by approximately 17% for Case 3 and Case 4 when the inclusion diameter is altered from 10 μm to 130 μm. This positive effect of inclusion size is due to the buoyancy force affecting the inclusions by the inertial forces from the liquid steel. It is interesting to note that Case 1 shows a better inclusion removal rate than Case 2, especially for the inclusion size group 40 μm and 70 μm. This is caused by the liquid steel flow pattern, as shown in Figure 6. The combination of the weir and the low dam forms a suitable release angle for the main stream of liquid steel, which increases the horizontal velocity near the top surface, leading to a longer flow distance. For Case 2, the high dam drives the liquid steel flows upwards, leading to a rapid increase in vertical momentum and a decrease in horizontal momentum. The liquid steel flows quickly downward towards to the outlet after passing across the dam, which decreases the inclusion removal rate.
The gas curtain serves as a barrier and promotes upward liquid flow. The formation of counter flows near the gas plume is considerably helpful for inclusion removal due to the increase of the inclusion retention time. The effect of gas stirring is more obvious for small inclusions (<40 μm), since they tend to attach and flow upwards to the liquid surface with the gas bubbles. In contrast, this causes more inclusion particles to flow out through the outlet nozzle, due to the interruption of the floatation preference of the big inclusions (>70 μm). Case 3 shows a slightly higher removal rate of 40 μm and 70 μm inclusions, and a slightly lower removal rate of 10 μm and 100 μm inclusions, in comparison with Case 4. This is the combined effect of the flow control device and the gas curtain.
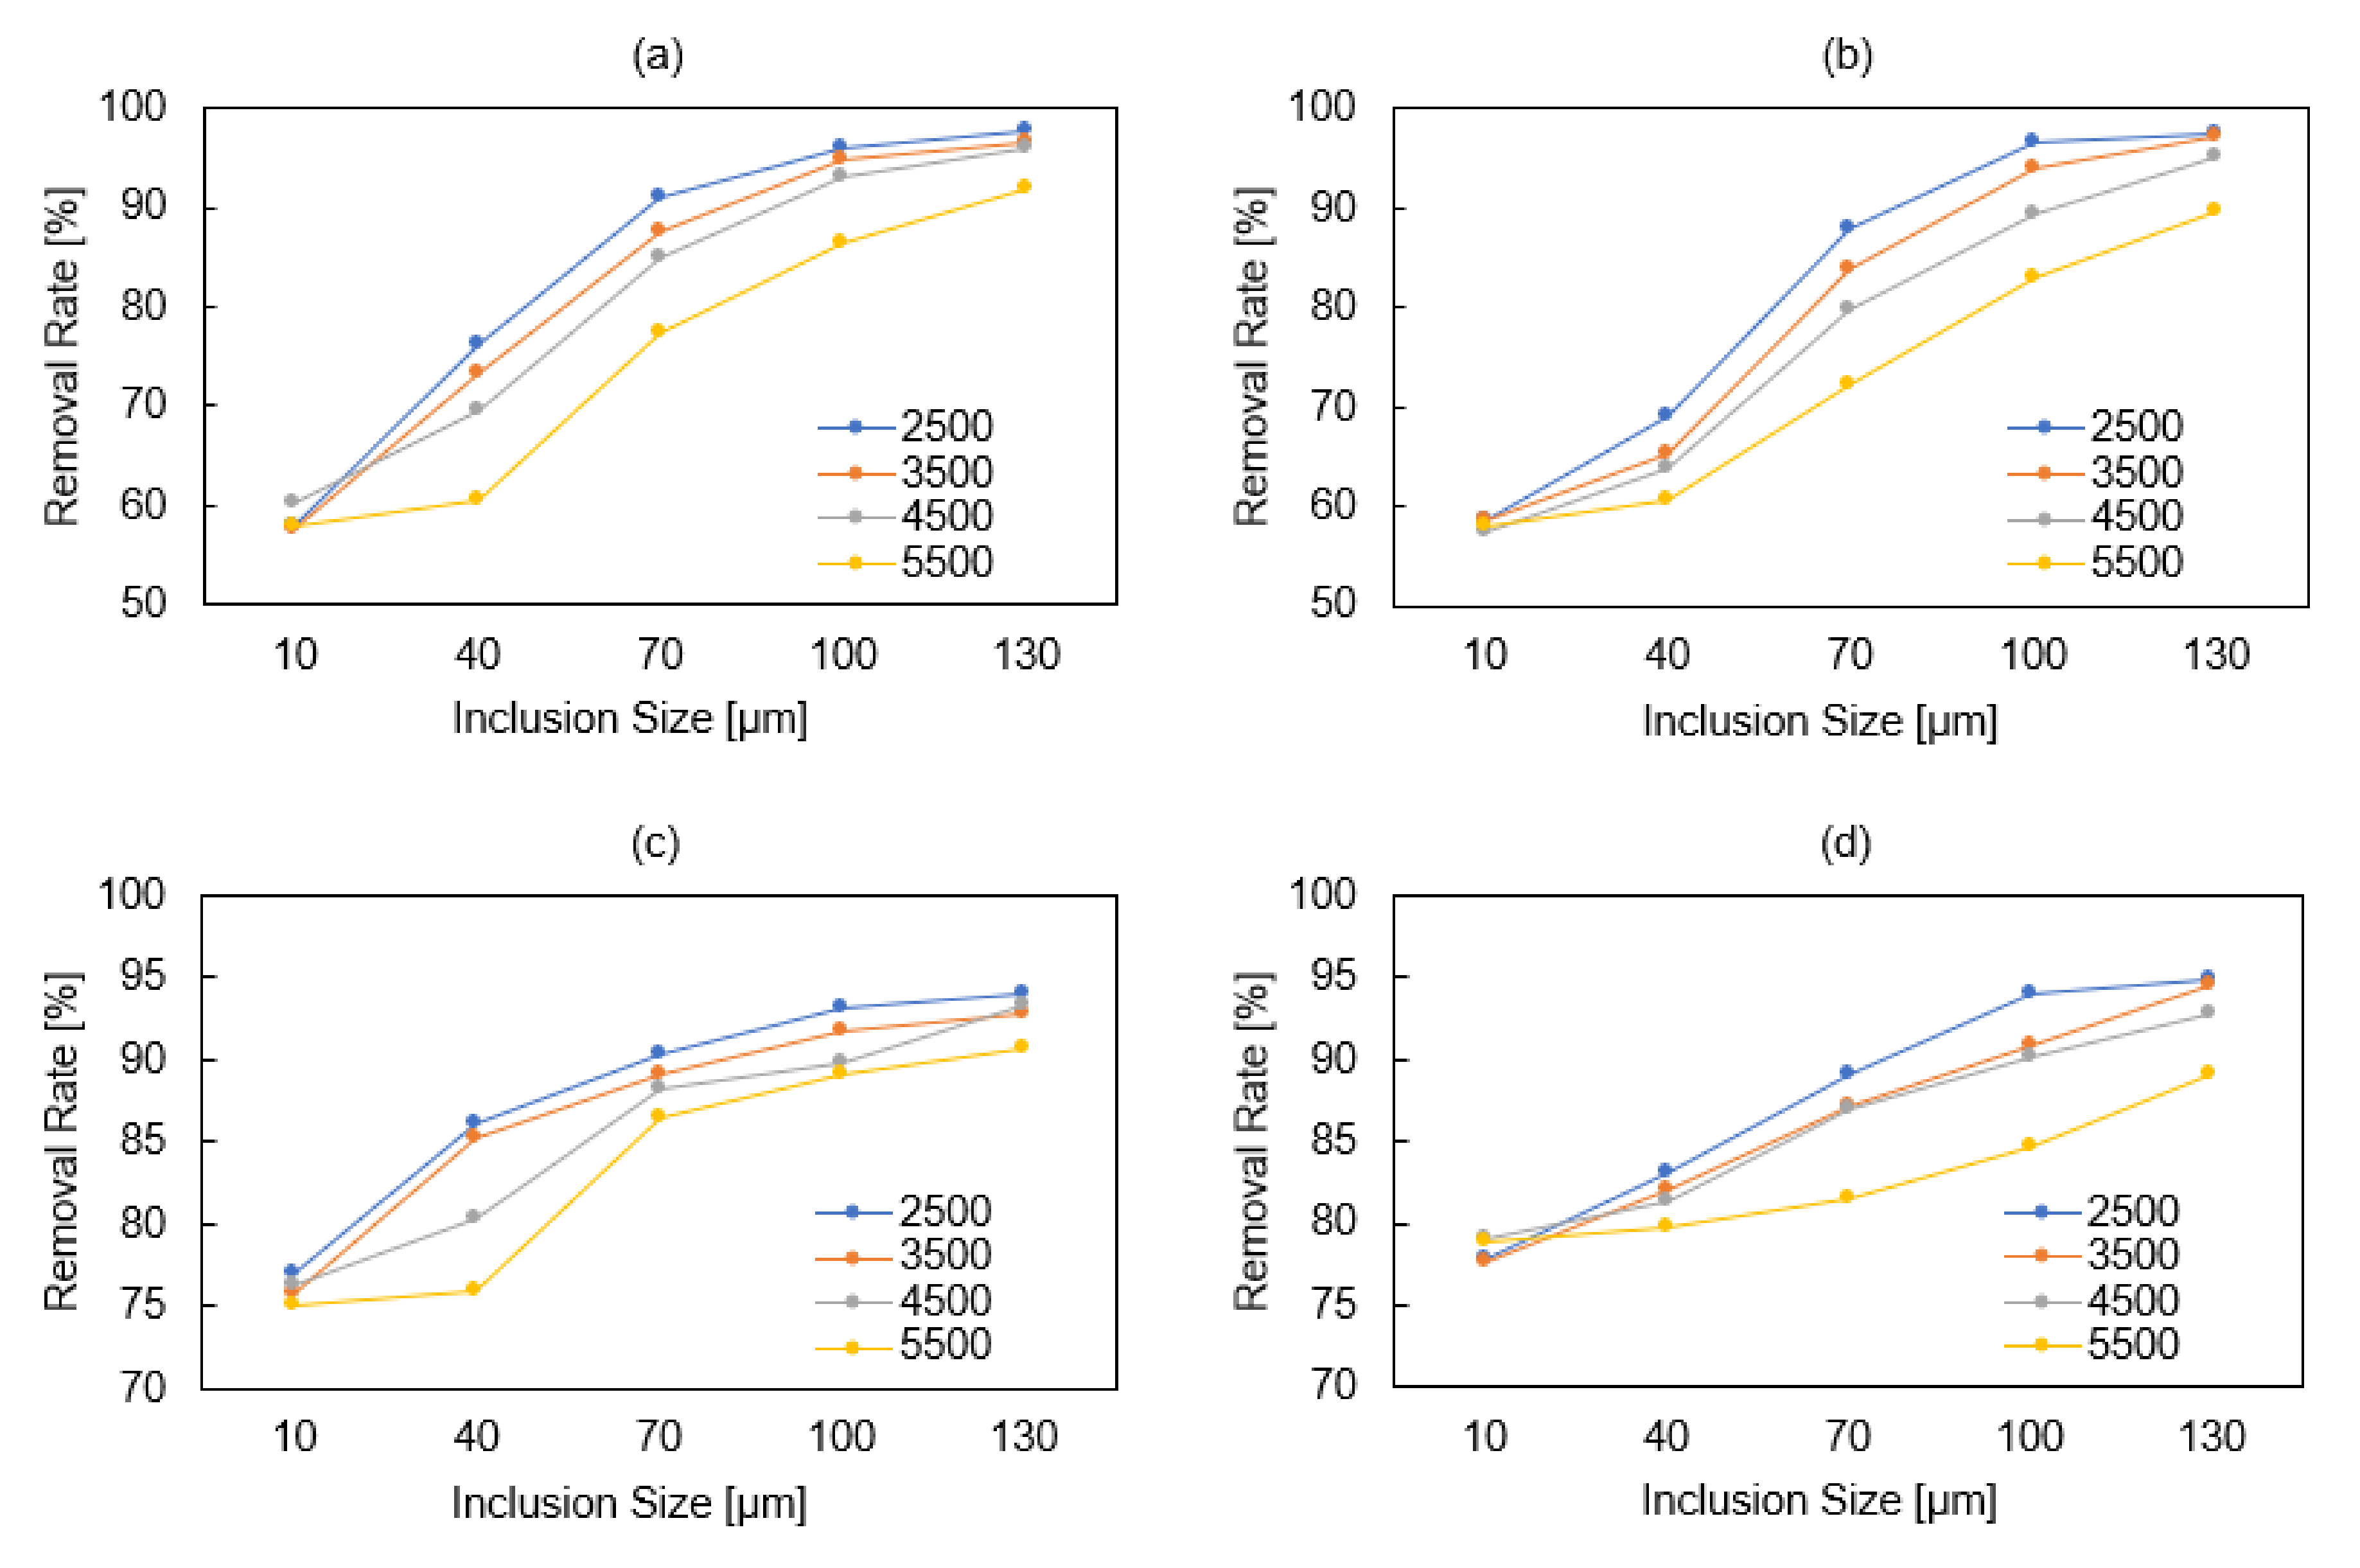
4.2.3. Inclusion Density
To study the relation between the inclusion density and the removal rate, density ranges of 2500~5500 kg m−3 are calculated for inclusion sizes in the range 10~130 μm. The modelling results are displayed in Figure 9. The increase in inclusion density makes gravity the dominant force in the particle movement. This consequently gives the inclusion less chance to appear near the top surface and to be removed. However, for groups with small inclusion size (10 μm, 40 μm), inclusion density has a minor effect on the removal rate. This conclusion is in accordance with the previous result from Miki [5]. Case 3 and Case 4 indicate a relatively higher inclusion removal rate than Case 1 and Case 2, especially for the smaller inclusions (10 μm). This is because the smaller particles are more inclined to be transported by the liquid steel flow. The introduction of a vertically upwards-blowing gas curtain increases the possibility of the smaller inclusions to be trapped by the top slag phase, which is therefore conducive to the better inclusion removal performance of the tundish.
4.3. Gas Flow Rate
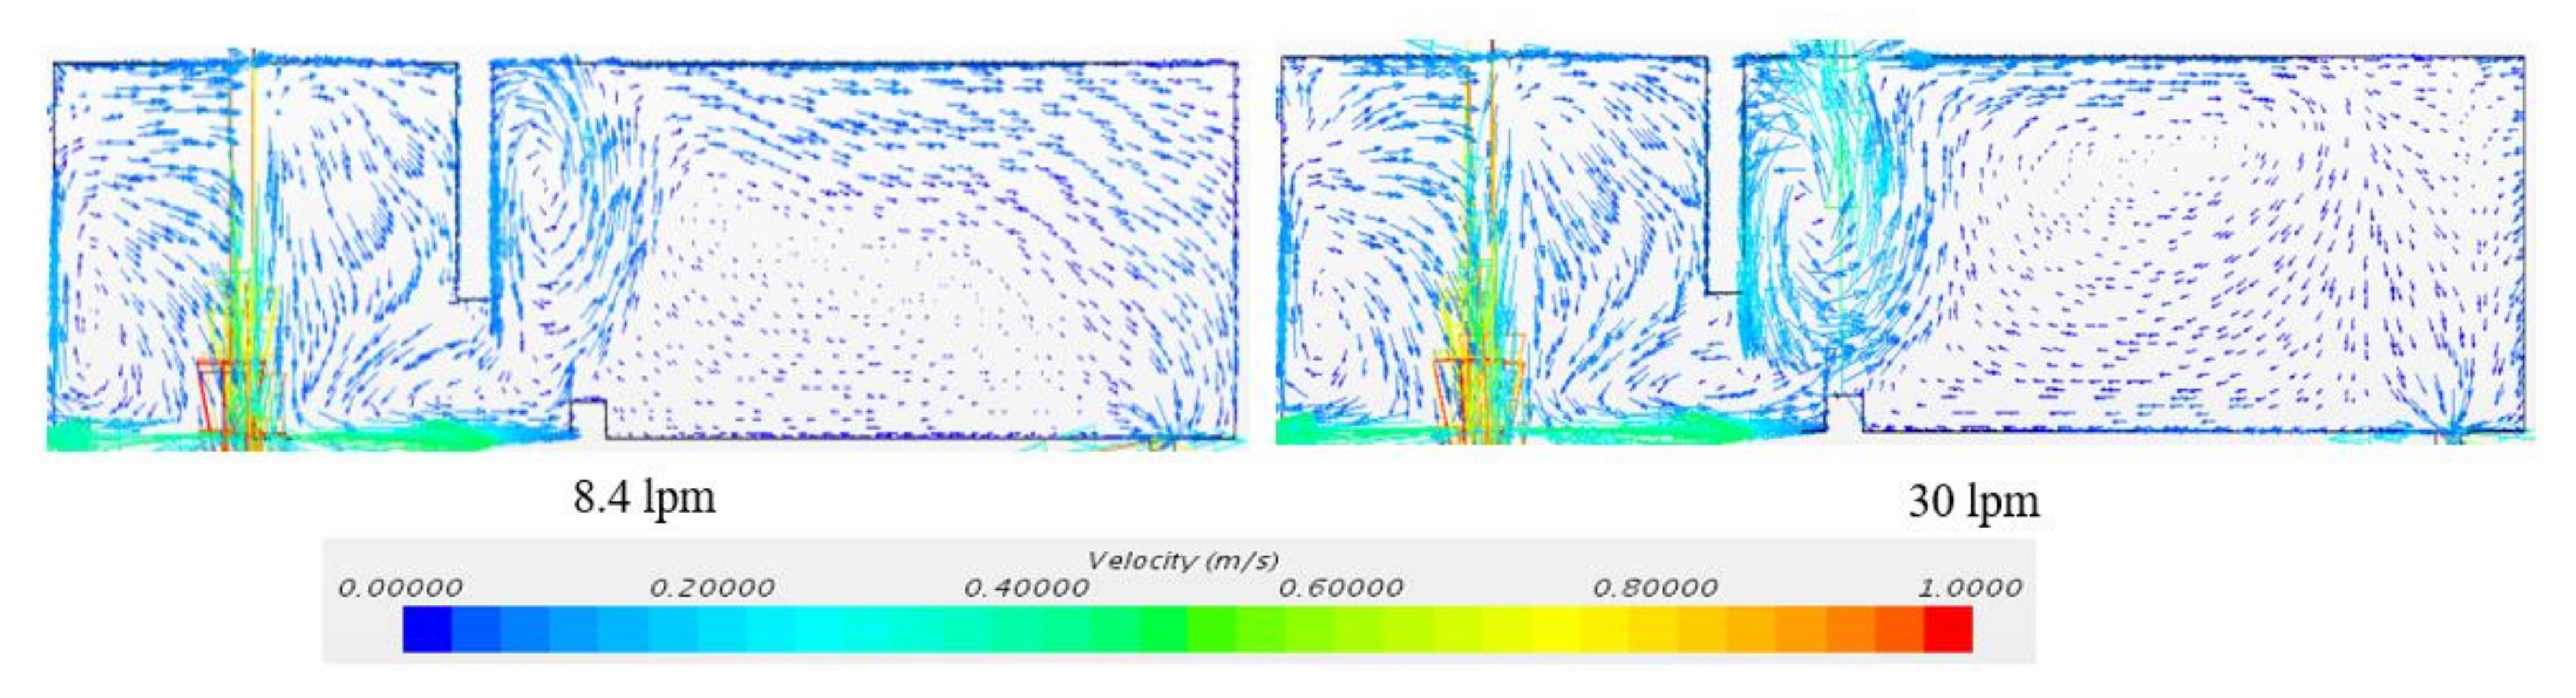
Figure 10 shows the flow patterns under two gas flow rates, 8.4 and 30 lpm respectively. The overall flow patterns are quite similar. The main difference is the strength of two counter flows formed on each side of the gas curtain. The increase of the gas flow rate leads to a higher steel velocity and a stronger recirculating flow. The high gas flow rate will bring a mix of the metal and the slag. This means that the inclusion will move back to the bath which is not desired during the process. Thus, the gas flow rate should be controlled in a proper level to prevent the strong mixing of the metal and the slag, and thus reach the best removal efficiency.
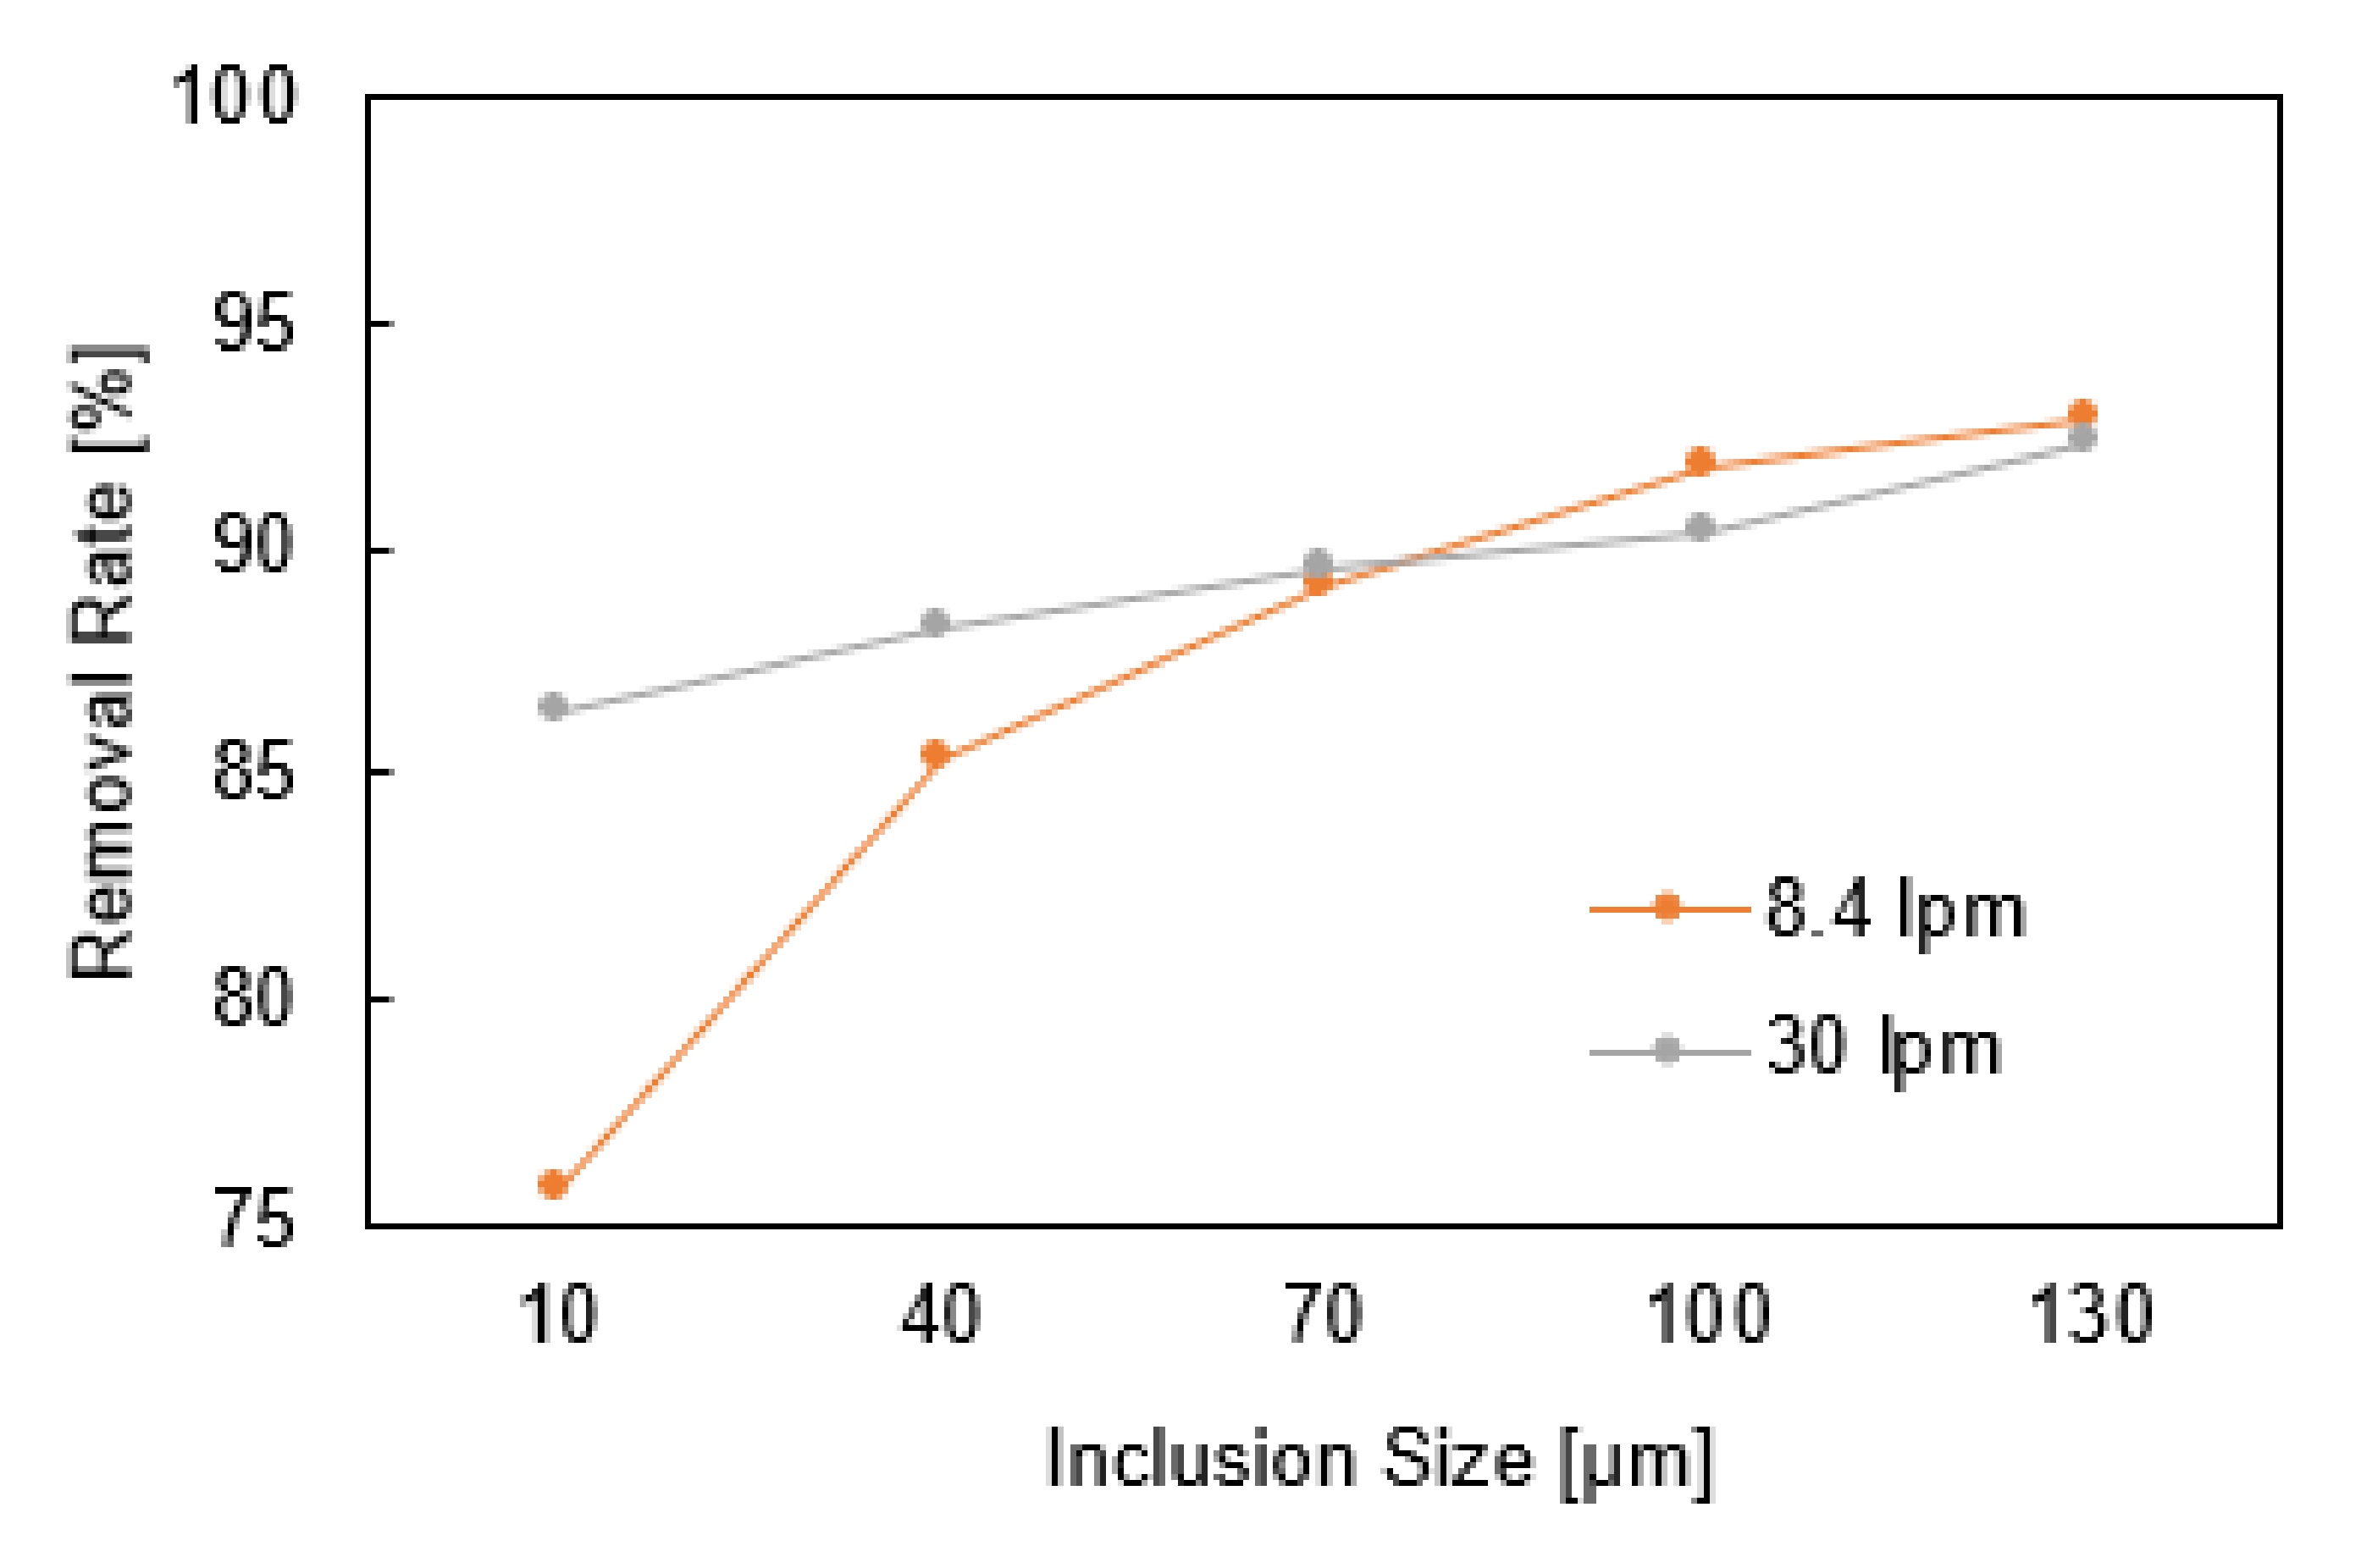
In Figure 11, inclusion removal rate is plotted as a function of inclusion size under two gas flow rates. A general trend illustrated in the figure is that the inclusion removal rate increases with the increased inclusion diameter. The increase of gas flow rate favors the removal rate for the smaller inclusions (10 μm). The stronger upward velocity of liquid steel creates higher drag force on the small inclusions. The small inclusions flow together with the liquid steel floating up to the surface region, leading to an increased possibility to be removed. The gas flow rate has a minor effect on the removal rate of the big inclusions (>70 μm) since the buoyancy force is dominant.
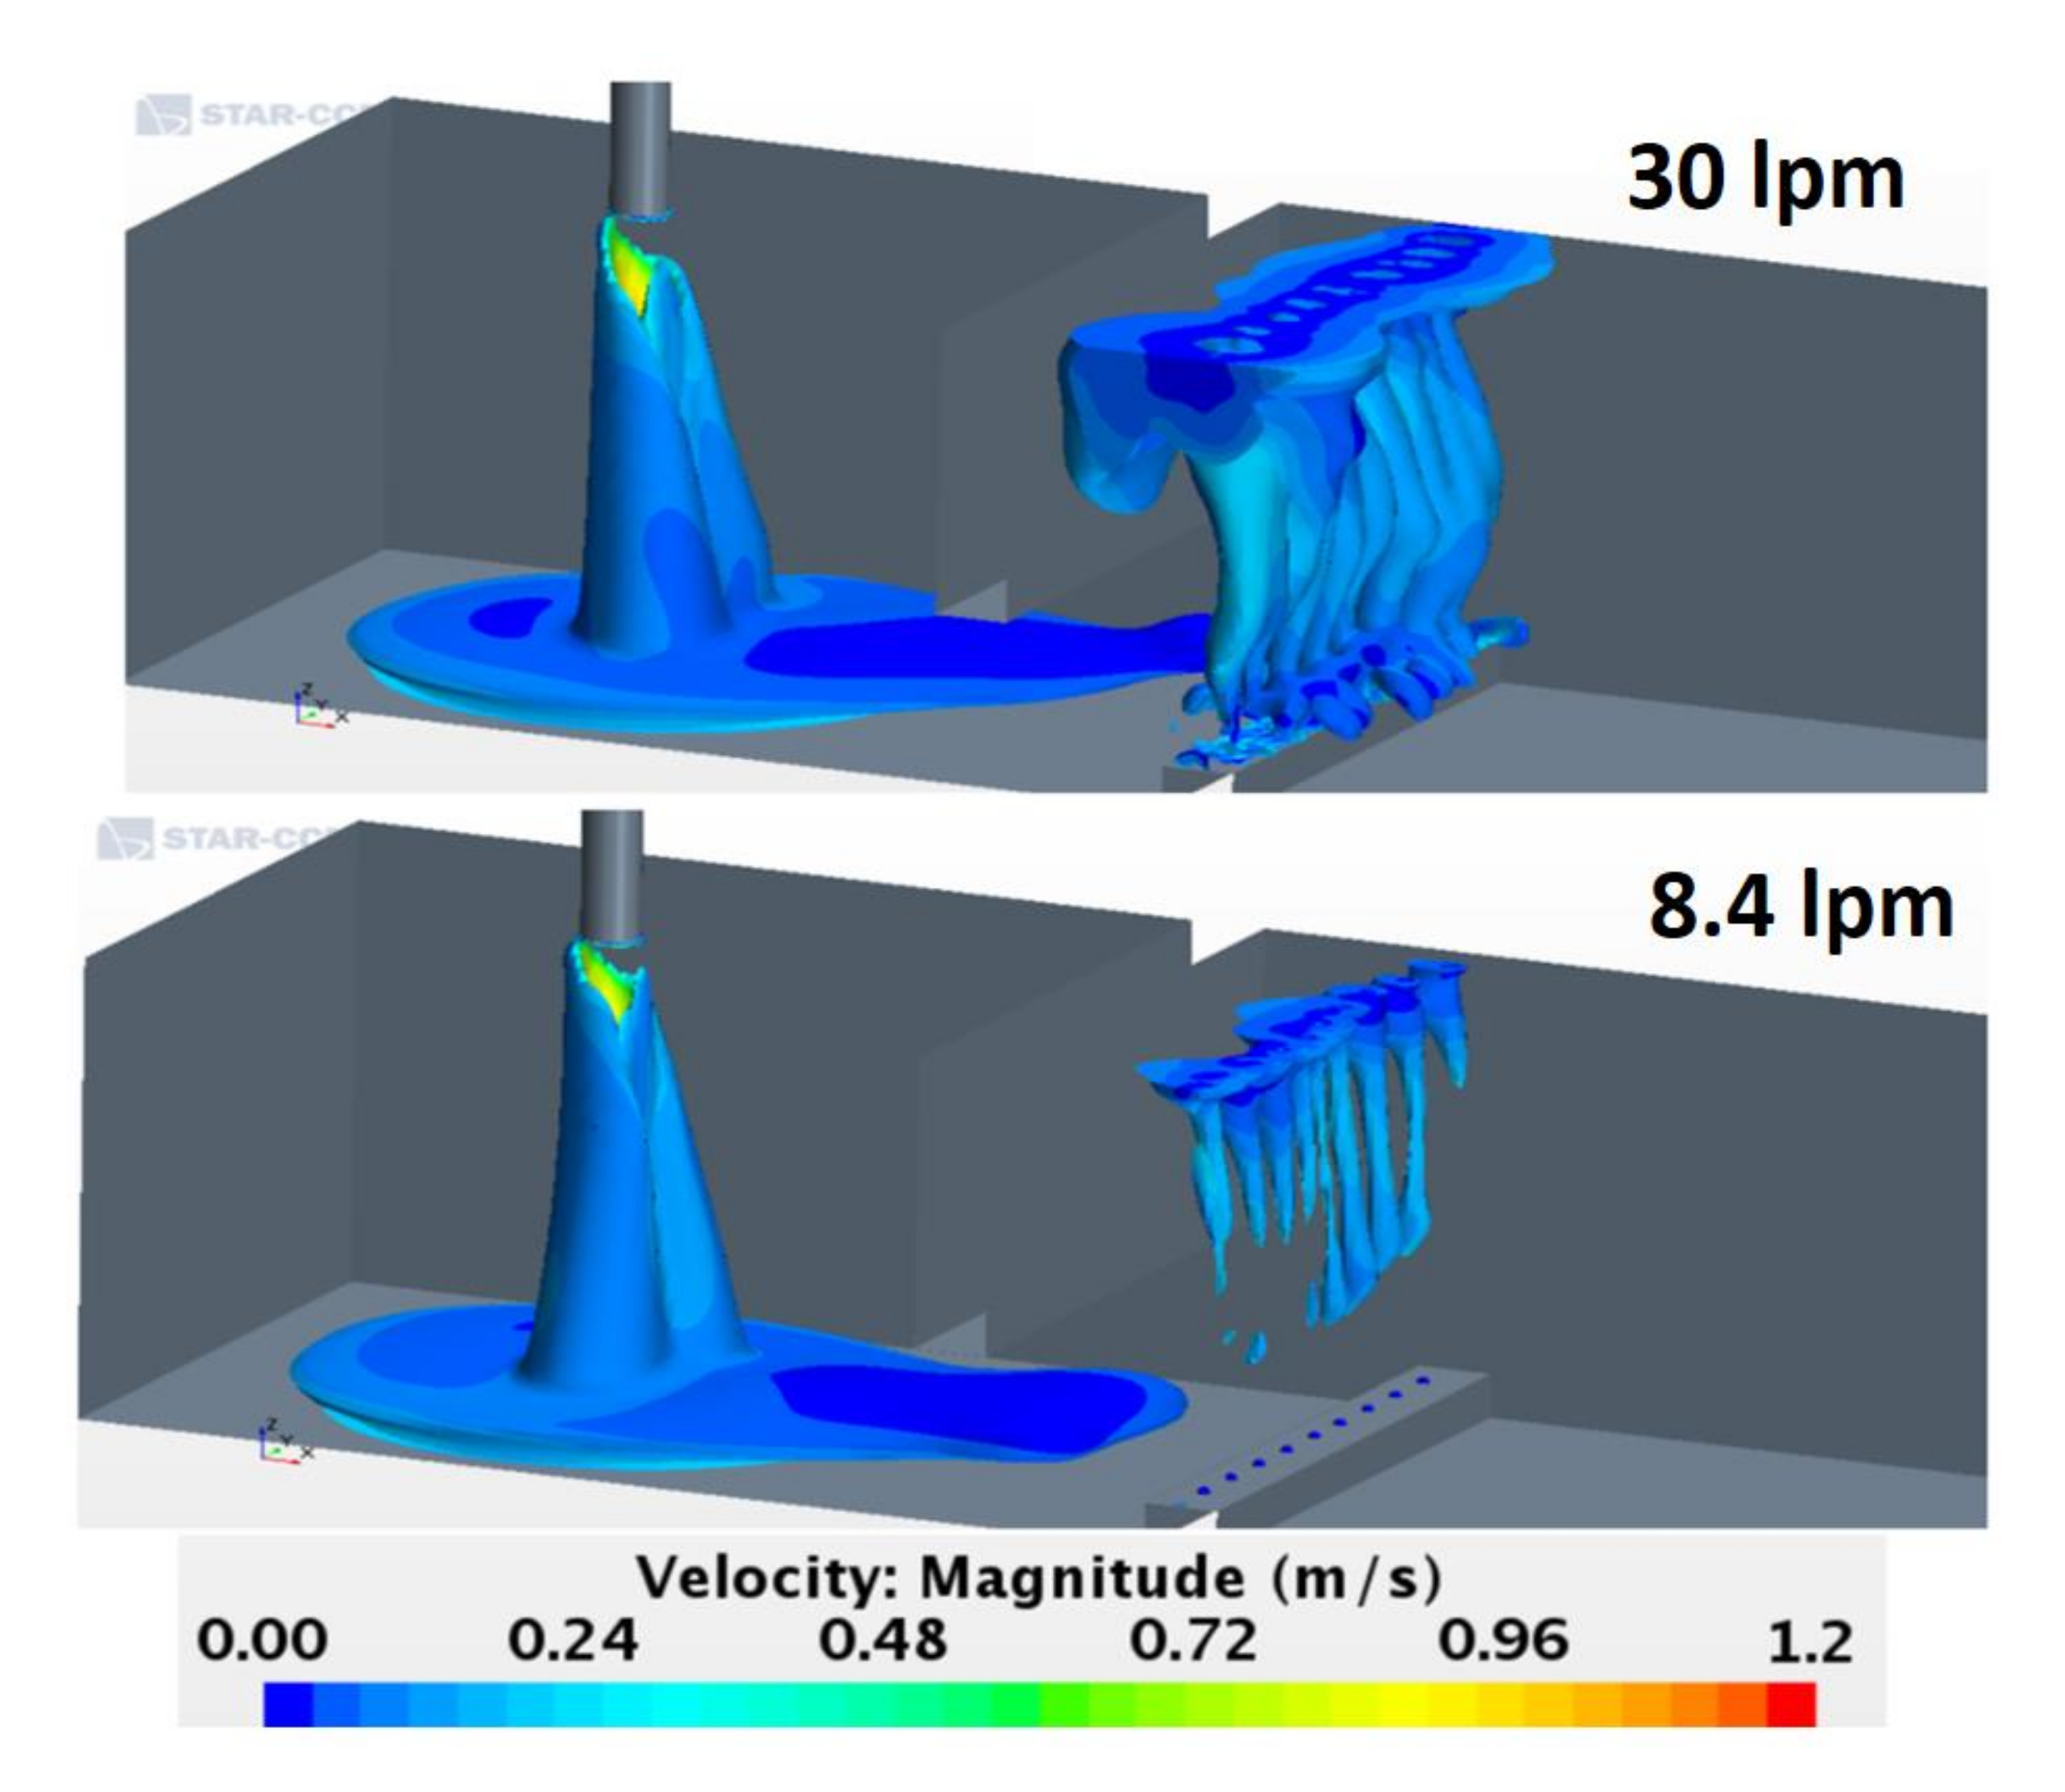
Figure 12 shows the 3-D isosurface of the turbulent kinetic energy at two gas flow rates (Case 3, k = 0.0035 J kg−1, Q = 8.4, 30 lpm), colored by the liquid steel velocity. The turbulence kinetic energy increases with increased gas flow rate. A high turbulent kinetic energy leads to the strong turbulent random motion of small particles, which is desirable for the removal of small inclusions (10 μm).
5. Discussion
When the tundish is stirred by inert gas bubbling, there is a chance that inclusions will attach to the surface. Alumina inclusions have a large contact angle with steel (~140°), which increases the possibility of inclusions attaching to a gas bubble that is rising in the steel. Miki et al. calculated inclusion removal by bubble flotation based on a common stream function for potential flow around the bubble [30]. A summary of the models for the description of the flotation of inclusions by bubbles has been published previously [31]. The inclusion removal rate can be expressed as:
where, ri is the inclusion radius, rb is the bubble radius, Reb is the Reynolds number for bubbles, Ci is the inclusion concentration, Nb is the number of bubbles, vr is the relative velocity between steel and gas, and b is the critical entrapment radius.
The theoretical analysis of Equation (13) indicates that the inclusion removal rate improves with increasing Reynolds number for bubbles. When increasing the gas flow rate, the local turbulence kinetic energy increases, leading to a higher Reynolds number of bubbles. A high inclusion removal rate of unit bubble volume is produced by small bubbles. In other words, if a big bubble is separated into several small bubbles, the inclusion removal rate is improved. This analysis suggests that small bubbles are preferable in real industrial operations. In addition, controlling the intensity of gas stirring is important for tundish operation. Stronger gas-stirring might create a big tundish open-eye. This leads to the emulsification of the slag into the melt, possibly generating large size defects. Oxygen and nitrogen from air can easily react with dissolved elements in liquid steel to form new harmful inclusions, referred to as the reoxidation process.
All simulation results are based on some assumptions, as mentioned in Section 2. It should be pointed out that the real situation is much more complex than the current system. For example, when modelling the inclusion removal at the top surface, many effects, such as inclusion deposition, inclusion distribution and inclusion force balance at the steel and slag interface, should be considered in order to make a more reliable prediction. The mathematical model needs to be continuously developed. The most important research task in the near future is to validate the CFD modelling results during tundish stirring with experimental data. The carefully performed plant trials could provide useful information.
6. Summary and Conclusions
The multiphase flow and the inclusion behavior in a single-strand tundish were investigated by means of CFD simulations. The following conclusions can be drawn from the results:
Best practice guidelines relevant to all numerical simulations is important to ensure accuracy and credibility of CFD predictions in tundish. The mesh size and the injected particle number are the important factors in achieving accuracy in numerical simulations.
The introduction of the flow control devices and the gas curtain changes the flow pattern of liquid steel. The gas curtain not only generates small gas bubbles, which are beneficial for inclusion removal, but also acts as a ‘dam’, which reorients the downstream flow after the weir. The tundish design with both the flow control devices and the gas curtain is predicted to have a longer inclusion residence time.
- Inclusions of higher particle diameter float easily to the top surface due to the buoyancy force. Inclusions of lower particle diameter tend to follow the liquid steel flow and pass through the outlets, which is critical for higher steel grades. Inclusions with lower particle diameters can be made to flow to the top surface through the introduction of the flow control devices and the gas curtain.
- The inclusion density has little effect on the inclusion removal rate when the inclusion size and density are in the ranges of 10~40 μm and 2500~5500 kg m−3, respectively.
- The gas curtain has a significant effect on the removal of small inclusions (10 μm), because they are inclined to float to the steel surface with the gas bubbles. A gas curtain generates a faster steel flow and a stronger recirculating flow, which is helpful for increasing the inclusion removal rate.
- The turbulence kinetic energy increases with increasing gas flow rate. A high turbulent kinetic energy is desirable for the removal of inclusions. To control the gas stirring intensity is important for the tundish operation. Theoretical analysis suggests that small bubbles are preferable in real industrial operation in order to increase the inclusion removal rate.
Funding
This paper was supported by the Swedish Foundation for Strategic Research (SSF)—Strategic Mobility Program (2019).
Acknowledgments
The author would like to acknowledge the Swedish Foundation for Strategic Research (SSF) for their financial support via Strategic Mobility Program (2019). The author would like to thank Dengfu Chen (Chongqing University) for his valuable contribution of the water model test data for the model validation.
Conflicts of Interest
The author declare no conflict of interest.
Nomenclature
| Ap | Area of Particle |
| b | Critical entrapment radius |
| Cd | Drag coefficient of particle |
| Cvm | Virtual mass coefficient |
| Cls | Lift force coefficient |
| Ci | Concentration of inclusion |
| Deff | Effective diffusivity |
| Fd | Drag force |
| Fp | Pressure gradient force |
| Fvm | Virtual mass forces |
| Fg | Gravitational force |
| Fl | Lift force |
| Ftd | Turbulent dispersion |
| g | Gravity |
| Gk | Turbulent kinetic energy |
| k | Turbulent kinetic energy |
| mi | Mass |
| Nb | Number of bubbles |
| ri | Inclusion radius |
| rb | Bubble radius |
| P | Pressure |
| Reb | Reynolds number for bubbles |
| Re | Particle Reynolds number |
| SF | Source term |
| u | Velocity of the flow field |
| vl | The velocity of liquid |
| vp | The velocity of particle |
| v’ | Fluctuating velocity component |
| vr | Relative velocity between steel and gas |
| υ | Kinematic viscosity |
| Vp | Velocity of particle i |
| YM | turbulence of the fluctuating dilatation |
| ε | Turbulent energy dissipation rate |
| µ | Molecular viscosity |
| µt | Turbulent viscosity |
| ρ | Density |
| σk | Turbulent Prandtl number for k |
| σε | Turbulent Prandtl number for ε |
| ω | The curl of the fluid velocity |
References
- Mazumdar, D.; Guthrie, R.I.L. The Physical and Mathematical Modelling of Continuous Casting Tundish System. ISIJ Int. 1999, 39, 524–547. [Google Scholar] [CrossRef]
- Chattopadhyay, K.; Isac, M.; Guthrie, R.I.L. Physical and Mathematical Modelling of Steelmaking Tundish Operations: A Review of the Last Decade (1999–2009). ISIJ Int. 2010, 50, 331–348. [Google Scholar] [CrossRef] [Green Version]
- Mazumdar, D. Review, Analysis, and Modeling of Continuous Casting Tundish Systems. Steel Res. Int. 2019, 90, 1800279. [Google Scholar] [CrossRef]
- Szekely, J.; Ilegbusi, O.J. The Physical and Mathematical Modeling of Tundish Operations; Springer Science and Business Media LLC: New York, NY, USA, 1989. [Google Scholar]
- Miki, Y.; Thomas, B.G. Modeling of inclusion removal in a tundish. Met. Mater. Trans. A 1999, 30, 639–654. [Google Scholar] [CrossRef]
- Zhang, L.; Taniguchi, S.; Cai, K. Fluid flow and inclusion removal in continuous casting tundish. Met. Mater. Trans. A 2000, 31, 253–266. [Google Scholar] [CrossRef]
- Rogler, J.P.; Heaslip, L.J.; Mehrvar, M. Physical Modelling of Inclusion Removal in a Tundish by Gas Bubbling. Can. Metall. Quart. 2005, 44, 357–368. [Google Scholar] [CrossRef]
- Ramos-Banderas, A.; Morales, R.; Barreto, J.D.J.; Solorio-Diaz, G. Modelling Study of Inclusions Removal by Bubble Flotation in the Tundish. Steel Res. Int. 2006, 77, 325–335. [Google Scholar] [CrossRef]
- Wang, J.; Zhu, M.-Y.; Zhou, H.-B.; Wang, Y. Fluid flow and interfacial phenomenon of slag and metal in continuous casting tundish with argon blowing. J. Iron Steel Res. Int. 2008, 15, 26–31. [Google Scholar] [CrossRef]
- Zhong, L.C.; Li, L.Y.; Wang, B.; Zhang, L.; Zhu, L.X.; Zhang, Q.F. Fluid flow behaviour in slab continuous casting tundish with different configurations of gas bubbling curtain. Ironmak. Steelmak. 2008, 35, 436–440. [Google Scholar] [CrossRef]
- Zheng, M.; Gu, H.-Z.; Huang, A.; Zhang, H.-X.; Deng, C.-J. Numerical Simulation and Industrial Practice of Inclusion Removal from Molten Steel by Gas Bottom Blowing in Continuous Casting Tundish. J. Min. Metall. Sect. B Metall. 2011, 47, 137–147. [Google Scholar]
- Seshadri, V.; Da Silva, C.A.; Da Silva, I.A.; Junior, E.D.S.A. A physical modelling study of inclusion removal in tundish using inert gas curtain. Tecnol. Metal. Mater. Miner. 2012, 9, 22–29. [Google Scholar] [CrossRef] [Green Version]
- Arcos-Gutierrez, H.; Barreto, J.D.J.; García-Hernández, S.; Ramos-Banderas, A. Mathematical Analysis of Inclusion Removal from Liquid Steel by Gas Bubbling in a Casting Tundish. J. Appl. Math. 2012, 2012, 1–16. [Google Scholar] [CrossRef] [Green Version]
- Chen, D.; Xie, X.; Long, M.; Zhang, M.; Zhang, L.; Liao, Q. Hydraulics and Mathematics Simulation on the Weir and Gas Curtain in Tundish of Ultrathick Slab Continuous Casting. Met. Mater. Trans. A 2013, 45, 392–398. [Google Scholar] [CrossRef]
- Chang, S.; Zhong, L.; Zou, Z. Simulation of Flow and Heat Fields in a Seven-strand Tundish with Gas Curtain for Molten Steel Continuous-Casting. ISIJ Int. 2015, 55, 837–844. [Google Scholar] [CrossRef] [Green Version]
- Devi, S.; Singh, R.K.; Paul, A. Role of Tundish Argon Diffuser in Steelmaking Tundish to Improve Inclusion Flotation with CFD and Water Modelling Studies. Int. J. Eng. Res. 2015, 4, 213–218. [Google Scholar]
- Liu, S.; Wang, B.; Yang, Z.; Feng, S.; Feng, K.; Xie, J.; Zhang, J. Numerical Simulation of the Multiphase Flow in the Single-Tundish System. In CFD Modeling and Simulation in Materials Processing; Springer International Publishing: Cham, Switzerland, 2016; pp. 67–74. [Google Scholar]
- He, F.; Zhang, L.-Y.; Xu, Q. Optimization of flow control devices for a T-type five-strand billet caster tundish: Water modeling and numerical simulation. China Foundry 2016, 13, 166–175. [Google Scholar] [CrossRef]
- Neves, L.; Tavares, R.P. Analysis of the mathematical model of the gas bubbling curtain injection on the bottom and the walls of a continuous casting tundish. Ironmak. Steelmak. 2016, 44, 1–9. [Google Scholar] [CrossRef]
- Aguilar-Rodriguez, C.E.; Ramos-Banderas, J.A.; Torres-Alonso, E.; Solorio-Diaz, G.; Hernández-Bocanegra, C.A. Flow Characterization and Inclusions Removal in a Slab Tundish Equipped with Bottom Argon Gas Feeding. Metallurgist 2018, 61, 1055–1066. [Google Scholar] [CrossRef]
- Silva, H.; Silva, C.; Alves Da Silva, I.; Barros, A. Study of Flow Modification and Inclusion Removal in Slag Tundish due to Bottom Gas Injection. Tecnol. Metal. Mater. Miner. 2018, 15, 167–174. [Google Scholar] [CrossRef]
- Qin, X.; Cheng, C.-G.; Li, Y.; Zhang, C.; Zhang, J.; Yan, J. A Simulation Study on the Flow Behavior of Liquid Steel in Tundish with Annular Argon Blowing in the Upper Nozzle. Metallurigst 2019, 9, 225. [Google Scholar] [CrossRef] [Green Version]
- Siemens. STAR-CCM + Version 13.04 User Guide; Siemens PLM Software: Munich, Germany, 2019. [Google Scholar]
- Patankar, S.V. Numerical Heat Transfer and Fluid Flow; Hemisphere Publishing Corporation, Taylor & Francis Group: New York, NY, USA, 1980; ISBN 0-89116-522-3. [Google Scholar]
- Shih, T.H.; Liou, W.; Shabbir, A.; Yang, Z.; Zhu, J. A New k-Eddy Viscosity Model for High Reynolds Number Turbulent Flows—Model Development and Validation. Comput. Fluids 1994, 24, 227–238. [Google Scholar] [CrossRef]
- Ghirelli, F.; Hermansson, S.; Thunman, H.; Leckner, B. Reactor residence time analysis with CFD. Prog. Comput. Fluid Dyn. 2006, 6, 241–247. [Google Scholar] [CrossRef]
- Casey, M.; Wintergerste, T.; European Research Community on Flow, Turbulence and Combustion. ERCOFTAC Best Practice Guidelines: ERCOFTAC Special Interest Group on “Quality and Trust in Industrial CFD”; ERCOFTAC: Montepellier, France, 2000. [Google Scholar]
- Odenthal, H.-J.; Javurek, M.; Kirschen, M. CFD Benchmark for a Single Strand Tundish (Part I). Steel Res. Int. 2009, 80, 264–274. [Google Scholar] [CrossRef]
- Odenthal, H.-J.; Javurek, M.; Kirschen, M.; Vogl, N. CFD Benchmark for a Single Strand Tundish (Part II). Steel Res. Int. 2010, 81, 529–541. [Google Scholar] [CrossRef]
- Miki, Y.; Shimada, Y.; Thomas, B.G.; Denissov, A. Model of inclusion removal during RH degassing of steel. Iron Steelmak. 1997, 24, 31–38. [Google Scholar]
- Sheng, D.-Y.; Söder, M.; Jonsson, P.; Jonsson, L. Modeling micro-inclusion growth and separation ingas-stirred ladles. Scand. J. Met. 2002, 31, 134–147. [Google Scholar] [CrossRef]
Figure 1.
Dimensions of single-strand tundish (unit: mm): (a) Frontal View; (b) Lateral View.

Figure 2.
Comparison of inclusion removal rate obtained by different mesh number (inclusion density: 3500 kg m−3; inclusion size: 40 µm; Case 1-W + LD).
Figure 2.
Comparison of inclusion removal rate obtained by different mesh number (inclusion density: 3500 kg m−3; inclusion size: 40 µm; Case 1-W + LD).

Figure 3.
Comparison of inclusion removal rate obtained by different injected particle number (inclusion density: 3500 kg m−3; Case 2-W + HD).
Figure 3.
Comparison of inclusion removal rate obtained by different injected particle number (inclusion density: 3500 kg m−3; Case 2-W + HD).

Figure 4.
RTD curve of water modelling and numerical modelling results (tundish with gas curtain).

Figure 5.
Velocity vectors at center longitudinal plane: (a) Case 1-W + LD, (b) Case 2-W + HD, (c) Case 3-W + LD + G, (d) Case 4-W + HD + G.
Figure 5.
Velocity vectors at center longitudinal plane: (a) Case 1-W + LD, (b) Case 2-W + HD, (c) Case 3-W + LD + G, (d) Case 4-W + HD + G.

Figure 6.
Velocity vectors at sidewall longitudinal plane: (a) Case 1-W + LD, (b) Case 2-W + HD, (c) Case 3-W + LD + G, (d) Case 4-W + HD + G.
Figure 6.
Velocity vectors at sidewall longitudinal plane: (a) Case 1-W + LD, (b) Case 2-W + HD, (c) Case 3-W + LD + G, (d) Case 4-W + HD + G.

Figure 7.
Trajectories of inclusion particles (inclusion density: 3500 kg m−3; inclusion size: 10 μm): (a) Case 1-W + LD, (b) Case 2-W + HD, (c) Case 3-W + LD + G, (d) Case 4-W + HD + G.
Figure 7.
Trajectories of inclusion particles (inclusion density: 3500 kg m−3; inclusion size: 10 μm): (a) Case 1-W + LD, (b) Case 2-W + HD, (c) Case 3-W + LD + G, (d) Case 4-W + HD + G.

Figure 8.
Comparison of the inclusion removal rate with the change of particle size (inclusion density: 3500 kg m−3).
Figure 8.
Comparison of the inclusion removal rate with the change of particle size (inclusion density: 3500 kg m−3).

Figure 9.
Comparison of inclusion removal rate with change of inclusion density: (a) Case 1-W + LD, (b) Case 2-W + HD, (c) Case 3-W + LD + G, (d) Case 4-W + HD + G.
Figure 9.
Comparison of inclusion removal rate with change of inclusion density: (a) Case 1-W + LD, (b) Case 2-W + HD, (c) Case 3-W + LD + G, (d) Case 4-W + HD + G.

Figure 10.
The effect of the gas flow rate on the flow pattern (Case 3-W + LD + G).

Figure 11.
The effect of the gas flow rate on the inclusion removal rate (inclusion density: 3500 kg m−3, Case 3-W + LD + G).
Figure 11.
The effect of the gas flow rate on the inclusion removal rate (inclusion density: 3500 kg m−3, Case 3-W + LD + G).

Figure 12.
Isosurface of turbulence kinetic at different gas flow rates. (Case 3-W + LD + G, k = 0.0035 J kg−1, Q = 8.4, 30 lpm).
Figure 12.
Isosurface of turbulence kinetic at different gas flow rates. (Case 3-W + LD + G, k = 0.0035 J kg−1, Q = 8.4, 30 lpm).


Table 1.
Summary of modelling investigations on inclusion removal performance in the tundish.
| Reference | Model 1 | Code | Tundish Design | Numerical Model | Parameters 2 | ||||||
|---|---|---|---|---|---|---|---|---|---|---|---|
| Strand | Fluid 3 | FCD 4 | Gas 5 | GFR 6 | Fluid 7 | Turb. 8 | Inc. 8 | ||||
| Miki (1999) [5] | M + P | FLUENT | 1 | Steel | D | - | - | E | k-ε | L | T, ID, IS |
| Zhang (2000) [6] | M + P | PHOENICS | 1 | S | W, D, SR | - | - | E | k-ε | L | C, IS, IB |
| Rogler (2005) [7] | P | - | 1 | Water | TI | Air, GP | 0.2–3 | - | - | - | C, GFR, IS, GBS, |
| Ramos-Banderas (2006) [8] | M + P | - | 1 | Water | TI, D | Air | 0.596 | E-E | k-ε | L | C, IS, IMFR |
| Wang (2008) [9] | M + P | TPS-3D | 1 | Water | W, D | Ar, GBC | 6 | E-E | k-ε | - | C, GSP |
| Zhong (2008) [10] | P | - | 2 | Water | TI, D, W | N2, GBC | 0.47 | - | - | - | C, GFR, GSP, RTD |
| Zheng (2011) [11] | M | CFX | 2 | Steel | TI, B | Ar, GBC | 0.342 | E-E | k-ε | L | C, GFR, GSP, RTD |
| Seshadri (2012) [12] | P | - | 2 | Water | TI | Ar, GBC | 5–15 | - | - | - | GFR, GSP, IS |
| Arcos-Gutierrez (2012) [13] | M | FLUENT | 2 | Steel | TI | Ar, GP | - | E-E | k-ε | L | IS |
| Chen (2013) [14] | M + P | FLUENT | 1 | S + W | W | Ar, GBC | 4.7 | E-E | k-ε | L | RTD, ID, GFR |
| Chang (2015) [15] | M + P | FLUENT | 7 | S + W | TI, B | Ar, GBC | 4.2 | E | k-ε | L | C, GSP, RTD |
| Devy (2015) [16] | M + P | FLUENT | 2 | S + W | D | Ar, GBC | - | E-E | k-ε | L | C, FCD, GSP, RTD |
| Liu (2016) [17] | M | FLUENT | 1 | Steel | D, W | Ar, GP | 5–25 | E-E | k-ε | - | C, GFR, RTD |
| He (2016) [18] | M + P | FLUENT | 5 | S + W | TI, B | - | - | E | k-ε | - | C, RTD |
| Neves (2017) [19] | M + P | CFX | 2 | Water | SR, D, W | Air, GBC | 50 | E-E | k-ε | - | C, RTD |
| Aguilar-Rodriguez (2018) [20] | M | FLUENT | 1 | Steel | - | Ar, GBC | 15–40 | VOF | k-ε | L | GFR, GSP, RTD |
| Silva (2018) [21] | M + P | CFX | 2 | S + W | TI | Air, GBC, GR, | 1–3 | E-E | k-ε | L | C, GFR, RTD |
| Qin (2019) [22] | M + P | FLUENT | 2 | S + W | SR | Ar, GP, UB | 2–5 | E-E | k-ε | L | CS, GFR, GBS |
1—M: Mathematical modelling; P: Physical modelling. 2—C: configurations; T: Thermal; ID: inclusion density; IS: inclusion size; IMFR: inclusion mass flow rate; GSP: gas stirring position; GFR: gas flow rate; RTD: residence time distribution; GBS: gas bubble size: CS: casting speed; IB: inclusion behavior; FCD: flow control devices. 3—W: water; S: steel. 4—FCD: flow control devices; TI: turbulence inhibitor; B: baffle; D: dam; W: weir; SR: stopper rod. 5—GBC: gas bubbling curtain; GR: gas ring; GP: gas pipe; BB: bottom blowing; UB: upper blowing. 6—GFR: gas flow rate (unit: Lpm); lpm: liter per minute. 7—E-E: Eulerian-Eulerian; VOF: volume of fluid. 8—Turb.: Turbulence; Inc.: Inclusion; L: Lagrangian.
Table 2.
Process parameters and physical properties used for CFD simulations.
| Parameter | Value | Dimension |
|---|---|---|
| Steel velocity | 1 | m s−1 |
| Steel density | 7020 | kg m−3 |
| Steel viscosity | 0.004 | Pa s |
| Reference Pressure | 101,325 | Pa |
| Inclusion velocity | 1 | m s−1 |
| Inclusion size | 5~130 | µm |
| Inclusion density | 2500~5500 | kg m−3 |
| Argon gas injection velocity | 0.1 | m s−1 |
| Argon gas density | 1.784 | kg m−3 |
| Argon gas diameter | 0.01 | M |
| Argon gas volume flow rate | 8.4, 30 | L min−1 |
© 2020 by the author. Licensee MDPI, Basel, Switzerland. This article is an open access article distributed under the terms and conditions of the Creative Commons Attribution (CC BY) license (http://creativecommons.org/licenses/by/4.0/).
Share and Cite
MDPI and ACS Style
Sheng, D.-Y. Mathematical Modelling of Multiphase Flow and Inclusion Behavior in a Single-Strand Tundish. Metals 2020, 10, 1213. https://doi.org/10.3390/met10091213
AMA Style
Sheng D-Y. Mathematical Modelling of Multiphase Flow and Inclusion Behavior in a Single-Strand Tundish. Metals. 2020; 10(9):1213. https://doi.org/10.3390/met10091213
Chicago/Turabian StyleSheng, Dong-Yuan. 2020. "Mathematical Modelling of Multiphase Flow and Inclusion Behavior in a Single-Strand Tundish" Metals 10, no. 9: 1213. https://doi.org/10.3390/met10091213
Note that from the first issue of 2016, this journal uses article numbers instead of page numbers. See further details here.