Article

Numerical and Experimental Investigation of Germanium Refining via Fractional Crystallization Based Innovative Rotary Cooling Device

by
Danilo C. Curtolo
1,†,
Semiramis Friedrich
1,*,†,
Michael Noack
2,† and
Bernd Friedrich
1,‡
1
IME Institute for Process Metallurgy and Metal Recycling—RWTH Aachen University, Intzestr. 3, 52056 Aachen, Germany
2
VB-tec GmbH, Broicher Str. 227c, 52146 Wuerselen, Germany
*
Author to whom correspondence should be addressed.
These authors contributed equally to this work.
This author is the Principal Investigator.
Metals 2020, 10(7), 973; https://doi.org/10.3390/met10070973
Submission received: 17 June 2020 / Revised: 14 July 2020 / Accepted: 16 July 2020 / Published: 18 July 2020
(This article belongs to the Special Issue 10th Anniversary of Metals: Metallurgy and Metal Technology)

Abstract

:
This paper focuses on the principle study and application of a fractional crystallization methodology using a rotating and internally gas cooled crystallizer (so called cooled finger, developed at IME/RWTH Aachen) first applied to the refining of germanium. For this purpose, a series of experimental trials were performed using a model metal—Aluminum—to gather the temperature profile needed for the numerical simulation that provides an initial process window used for the purification of germanium in a vacuum resistance furnace. The results of the simulation showed good agreement with the experimental results and the conducted trials based on that process window enabled the single step purification of germanium from an initial purity of 98.8% up to 99.9%.

1. Introduction

1.1. High Purity Germanium and Its Application

Being always considered as a key strategic metal for most countries, the supply and price of Germanium are often controlled in the form of stockpiles. Around 60% of Germanium comes from zinc refining sources, and the rest mostly originated from fly-ash processing [1]. The total world-wide supply of Germanium ranges around 100 tons per year.
Germanium is mainly preferred due to its intrinsic material properties. It is defined as a semiconductor material in its pure metallic form, being able to perform at high frequencies and low operating voltages. Additionally, in crystal or glass form it is transparent to most of infrared light spectrum, allowing its use in infrared systems. It has also excellent glass properties such as high refractive index and low chromatic dispersion. Another property of Germanium dioxide is to catalyze the polymerization process without giving undesirable color to the plastic products [2].
The ultra-pure metallic form of Germanium is widely used due to its inherent semiconductor behavior, being one of its most important application in industry [3,4]. When As, Sb, Ga, In, or P are added as dopants, the Germanium can be used in certain high-frequency and high-power electronics applications. Moreover, Germanium can also be employed in space solar cells due to its high energy conversion [5,6]. Therefore, the utilization of Germanium as semiconductor represents one of its most important industrial use and also its biggest potential for the future. Certain applications, such as on thin-film technologies for SiGe chips, as well as other Ge-based semiconductors have the potential to increase the demand of ultra-pure Germanium [7].

1.2. Purification of Germanium by Fractional Crystallization

Germanium is produced in its initial purity form via a long hydro-metallurgical process chain, consisting of concentrating the germanium oxide via an oxidation process, chlorination of this concentrated oxide and distillation of pure GeCl 4 , then oxidizing it again with pure distilled water to form a highly pure GeO 2 , and later reduce it in H 2 atmosphere at high temperatures, where Ge reaches around 5N (99.999%) purity. From this point onwards, mostly all of the existing methodologies to refine germanium are based on the general principle of fractional crystallization, mostly via zone melting process, which works basically by moving a molten zone along the bar. In this process, the impurities are segregated at the solidification interface of the molten zone, and are transported away to the sides of the bar [8].
The fractional crystallization principle is based on the different solubility between an impurity in the molten and solid phase of a base metal. This relation is called distribution coefficient (k) [9]. The “k” coefficient defines the purification degree that can be theoretically achieved in a system at equilibrium. This distribution coefficient can be taken from the binary phase diagram at a constant temperature, calculated as the relationship of the concentration of the impurity element in the solid phase ( C S ) to its concentration on the molten phase ( C L ) of the base metal, represented in the Equation (1) [10].
k = C S / C L
where, k is a dimensionless factor, C S is the solute concentration in the solid, and C L is the solute concentration in the liquid.
The lower the k coefficient is than unity, the bigger the removal efficiency is via fractional crystallization. On the other hand, impurities with k higher than one will tend to remain in the solid phase and be partially incorporated in the crystallized material. If an impurity has a k coefficient close to unity, it is not possible to be effectively removed via fractional crystallization. In Table 1, the theoretical k coefficients of most impurities present in germanium are shown [8,11,12]. It can be seen from this table that most impurities present in Germanium have their k value much lower than unity, facilitating their removal by fractional crystallization. However, impurities such as B and Si have their k much bigger than one. Moreover, the impurities Al, Ga, Sn, and P have their distribution coefficient around 0.1, which can lead to a slower removal rate.
While the equilibrium distribution coefficient gives a very good indication on the expected results, it considers only a complete diffusion of the expelled solid into the liquid phase. A more detailed approach can be obtained by the effective distribution coefficient (k e f f ), represented by the Equation (2). This approach was first developed by Burton, Prim and Slichter (known as BPS model), and describes the effect of growth rate and the diffusion layer thickness on the effective distribution coefficient [13,14].
k e f f = k 0 k 0 + ( 1 k 0 ) · e [ V δ / D ]
where, k 0 = C S / C 0 is the equilibrium distribution coefficient, V the solid growth rate, δ the thickness of the diffusion layer, and D the solute diffusion coefficient in the liquid.

1.2.1. Main Influencing Parameters for Fractional Crystallization

The growth rate during crystallization can be controlled by the supercooling at the solid/liquid interface as well as by the heat transfer from this interface into the crystal. The heat balance at the interface at one dimension (x) can be formulated according to Equation (3) [15].
λ s · δ T δ x s = λ m · δ T δ x m + ρ · V · L
where λ s and λ m are the thermal conductivity of solid and melt, ( δ T / δ x ) is the temperature gradient along the growth direction for the solid and the melt at the solid/liquid interface, V the growth rate, ρ the density, and L the latent heat.
As seen in the Equation (2), the k e f f can be decreased with the reduction in the crystal growth rate, which can be achieved by controlling the cooling at the solid-liquid interface (Equation (3)). This decrease in growth rate will therefore lead to a higher purification. While this is a technically viable parameter, it directly impacts the productivity of the process. A more efficient and elegant approach is to indirectly decrease the thickness of the diffusion layer ( δ ) in Equation (2). This can be effectively achieved by promoting a forced convection in the area surrounding the growth front. In the crystallization technique developed at IME, an applied rotation assists in decreasing the diffusion layer thickness, while keeping a reasonably high growth rate [16].

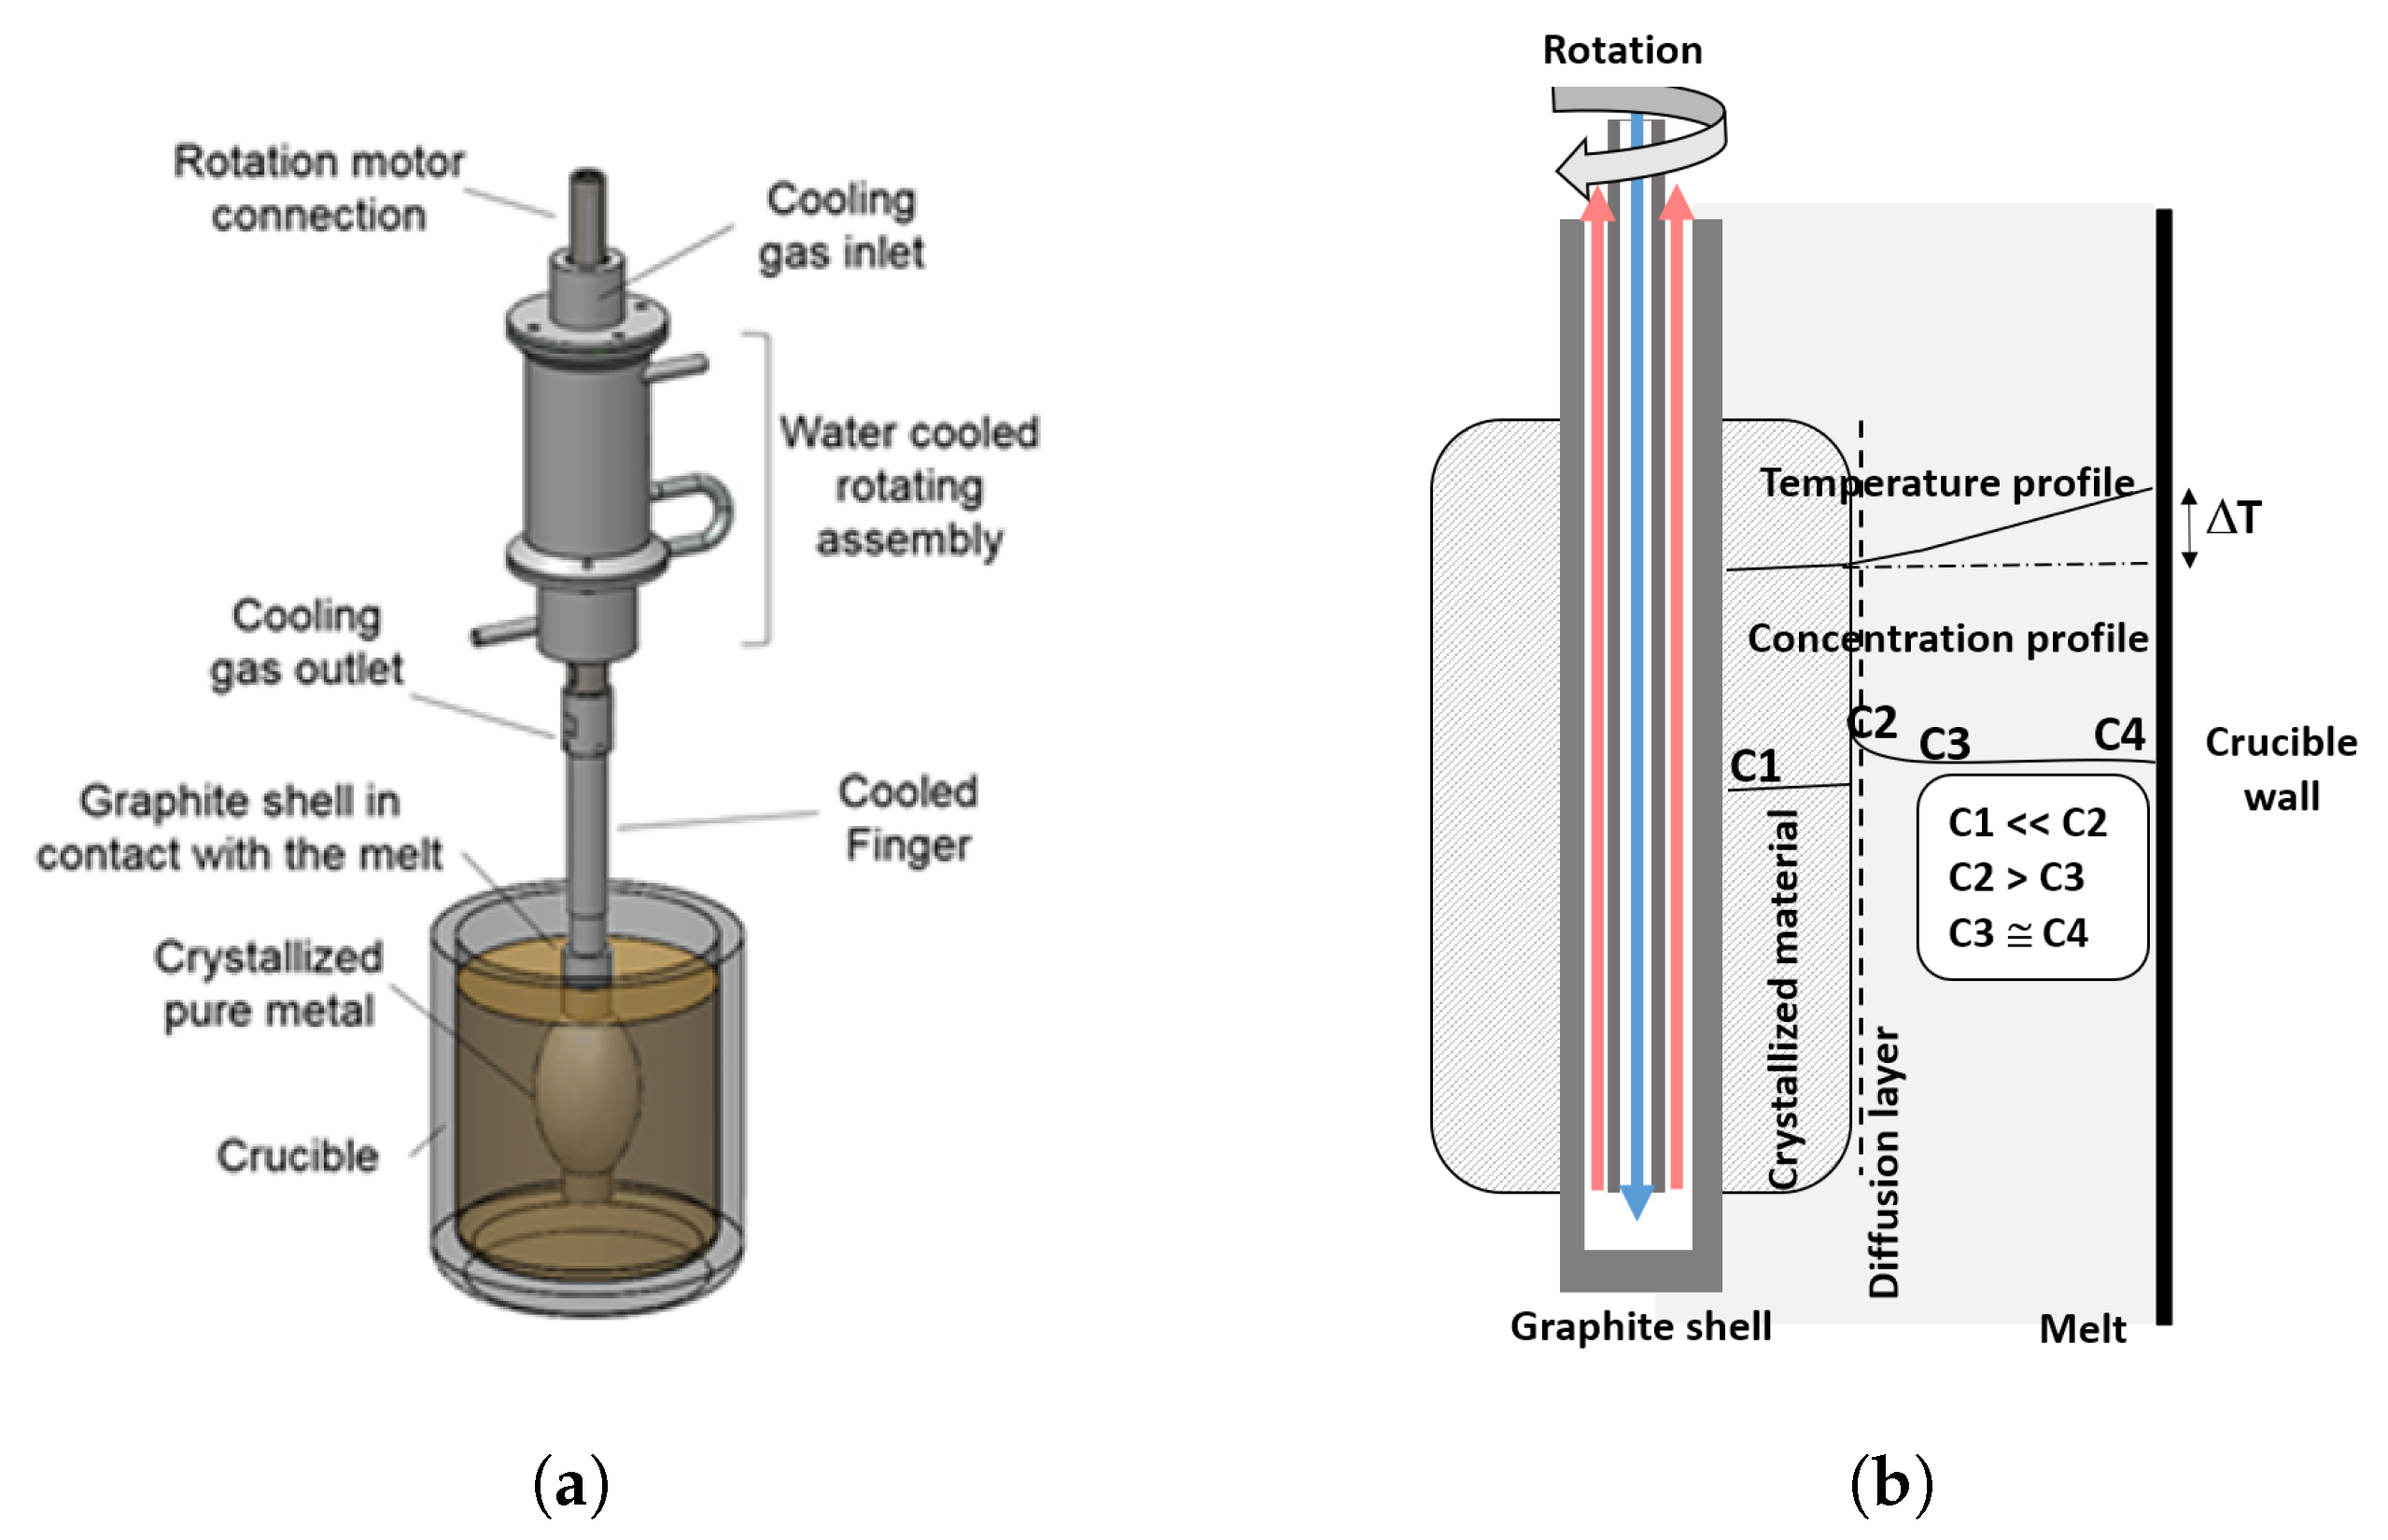
1.2.2. Cooled Finger as an Innovative Fractional Crystallization Based Technique

With a proven record of success when applied for aluminum [16], the cooled finger technique shows a great potential to replace the zone melting as a technology also for the purification of Germanium, with significant decrease in the processing time and costs, while achieving similar purification results. In this process, a rotational gas-cooled crystallizer (cooled finger) is inserted into a molten high-grade metallic bath. A simplified sketch of the cooled finger process can be seen in the Figure 1a [17]. It consists of a rotating crystallization unit, cooled by a controllable flow of compressed air. The steel tube is protected by a high purity graphite shell to prevent contamination.
As illustrated in details in Figure 1b, the cooling gas flow within the cooled finger generates a small temperature gradient (ΔT) between the cooled wall of the crystallizer and the adjacent melt. In this region a growth front is formed and moves radially in direction of the crucible wall. A diffusion boundary layer is formed ahead of this growth front, where the expelled impurities are concentrated and can only move out of this region by diffusion. In the cooled finger process, the rotational mechanism promotes two important aspects: (1) a homogeneous mixture of the melt, decreasing the temperature gradient and therefore reducing the growth rate. (2) Assists on the thickness reduction of the impurity diffusion boundary layer, which will assure a fast expelling of the segregated impurities out of the diffusion layer. As seen in Equation (2), both the reduction in the thickness of the diffusion boundary layer and the growth rate will ultimately lead to an increase in the achieved purification level.
Moreover, the cooled finger has a much larger segregation interface area i.e., growth front than the current competing methodologies, such as zone melting. This ultimately leads to a higher productivity at similar solid growth rate.
The use of cooled finger for the fractional crystallization of germanium can represent an alternative way to recycle the metallic germanium scraps, being them either post-consumer scraps such as broken IR lenses, wafer residues, etc., or pre-consumer scraps such as the heads and tails from the zone melting process. When analyzing the process chain of high purity germanium production, there is a clear gap in the run-around-scrap cycle, where the above mentioned high quality metallic scraps follows the same costly and long hydrometallurgical route as the scraps containing few pppms of germanium content.

2. Materials and Methods

Before starting with Ge-trials, a series of preliminary investigations were conducted, focused on ultra-pure aluminum (4N8- 99.998%) as model-metal in an open system furnace. The goal was to rapidly obtain data for the convergence of the preliminary modeling via SolidWorks and CrysVUn. The reason for choosing aluminum as model-metal was its convenient handling and possibility to work in an open furnace system, which allowed more flexibility for gathering all the relevant process information necessary to build the numerical model. Since neither SolidWorks nor CrysVUn numerical models can incorporate the influence of rotation, the model validation trials conducted with the model metal aluminum were performed without rotation.
Later, the converged models were adjusted to a cooled finger setup designed and installed in a vacuum resistance furnace for the purification of Germanium. At the end, the cooled finger experimental results for Germanium were compared with the ones obtained by the modeling.

2.1. Cooled Finger Trials with the Model-Metal

The development of the cooled finger thermal model requires—as input data—the temperature distribution profile along the vertical axis of the cooled finger as well as the temperature profile across the melt. For that, two sets of experimental setup were developed for the crystallization of aluminum as model metal. Each setup was tested separately and the temperature data obtained were calibrated among both trials. This was done by placing a reference thermocouple at the exact same position in both trials, that could later be calibrated and consequently, minimize the measurement deviation between the thermocouples used in these trials (Type k).
The experiments showed in Figure 2 provided the online measurement of the horizontal and vertical temperature gradient across the crucible. For the determination of the horizontal temperature gradient, two sets of thermocouples were placed in each side of the cooled finger. Within each set, two thermocouples were distanced 20 mm apart, with the first thermocouple placed 30 mm from the surface of the graphite shell (see Figure 2a). The whole setup were then immersed in the crucible containing molten aluminum kept at 700 ° C. Once the setup was inside the crucible, the cooling gas flow was set to 50 L·min 1 . The crystallized material was grown until the tip of the first thermocouple touched the surface of the crystallized aluminum. At this point the trial was interrupted and the cooled finger was removed from the melt (see Figure 3a). The exact moment in which the trial should be interrupted was pre-determined based on the known average growth rate obtained in previous trials conducted with the same process parameters.
The temperature profile data were then compared among the thermocouples and based on their distance apart, a horizontal temperature gradient between the crystallization interface and the melt was possible to be determined (the results is shown in Section 3.1). Since two sets of thermocouples (right and left) were used, any differences in the measured temperature can be compensated. Such difference could be derived by any misalignment between the crystallization unit and the crucible and/or between the crucible and the heaters.
While the horizontal temperature profile provides valuable information for the numerical modeling of growth rate, the vertical temperature profile allows the determination of the cooling profile of the cooled finger. To obtain the vertical temperature profile experimentally, a setup consisting of three thermocouples was designed (Figure 3b). These thermocouples were placed between the graphite shell and the cooled finger steel tube. The lowest thermocouple (T C ) was installed 110 mm below the melt level, at the point, where the crystallized material reaches its higher diameter. Two other thermocouples were installed 30 mm apart each other (see Figure 3b).
Similar to the previous trial, the setup was immersed into molten aluminum bath at 700 ° C and kept statically with a cooling gas flow rate of 50 L·min 1 . After 20 min of crystallization, the setup was pulled out (see Figure 3b). The temperature profile of all three thermocouples were measured to draw the temperature distribution along the cooled finger crystallization unit. A fourth thermocouple was placed in the melt adjacent to the crucible wall with circa 50 mm distance from the cooled finger and 110 mm below the melt surface. This was used to calibrate the temperature data obtained between both trials, reducing the errors normally attributed to different thermocouples.

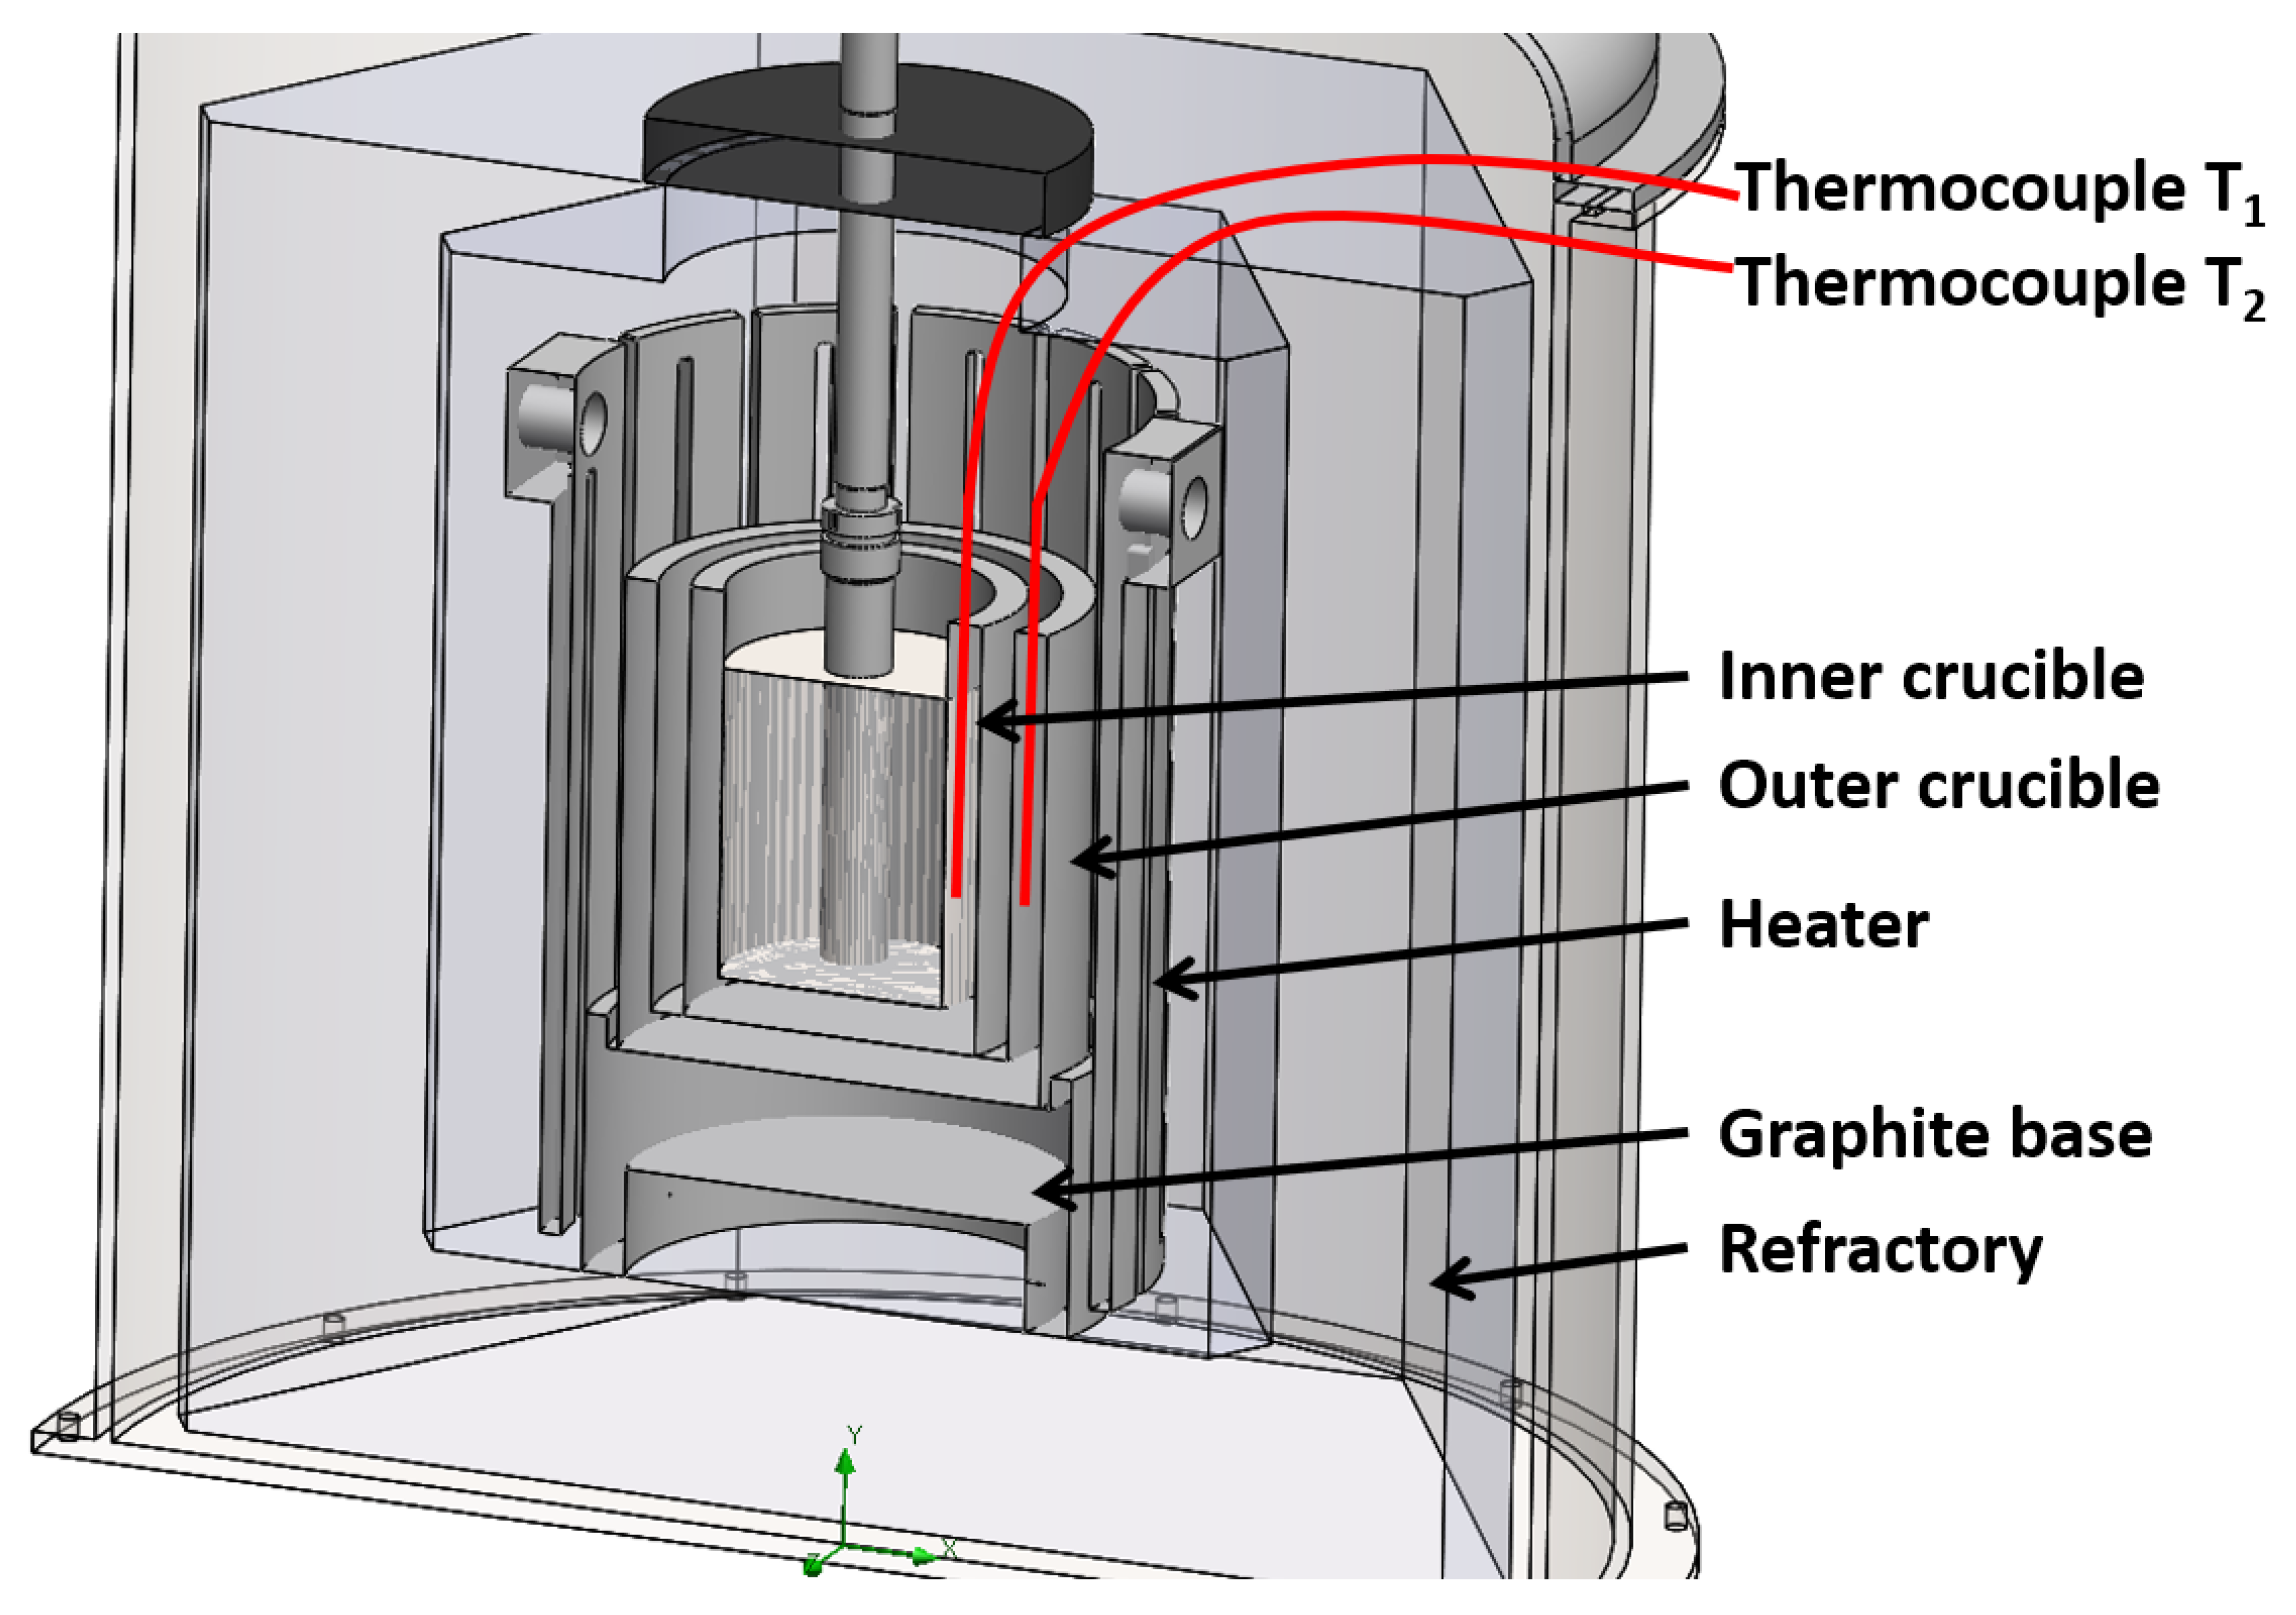
2.2. Modeling by CrysVUn and SolidWorks

The thermal modeling software CrysVUn [18] is a program for global numerical simulation of crystal growth in furnaces with axial or translational symmetry, based on the Finite Volume method and an unstructured grid. The modeling, conducted in this work, provided information for making predictions about the physical values and variables in a complex system and for controlling the crystallization process in the furnace.
This tool was applied here to compute relevant thermal parameters related to the quite slow crystallization process, including latent heat and time dependency. However, the CrysVUn software is not specialized to simulate fast material flows like the cooling gas flowing within the cooled finger. To compensate this deficit, the software SolidWorks was used to calculate the heat exchange conditions promoted by the cooling gas flow within the cooled finger.

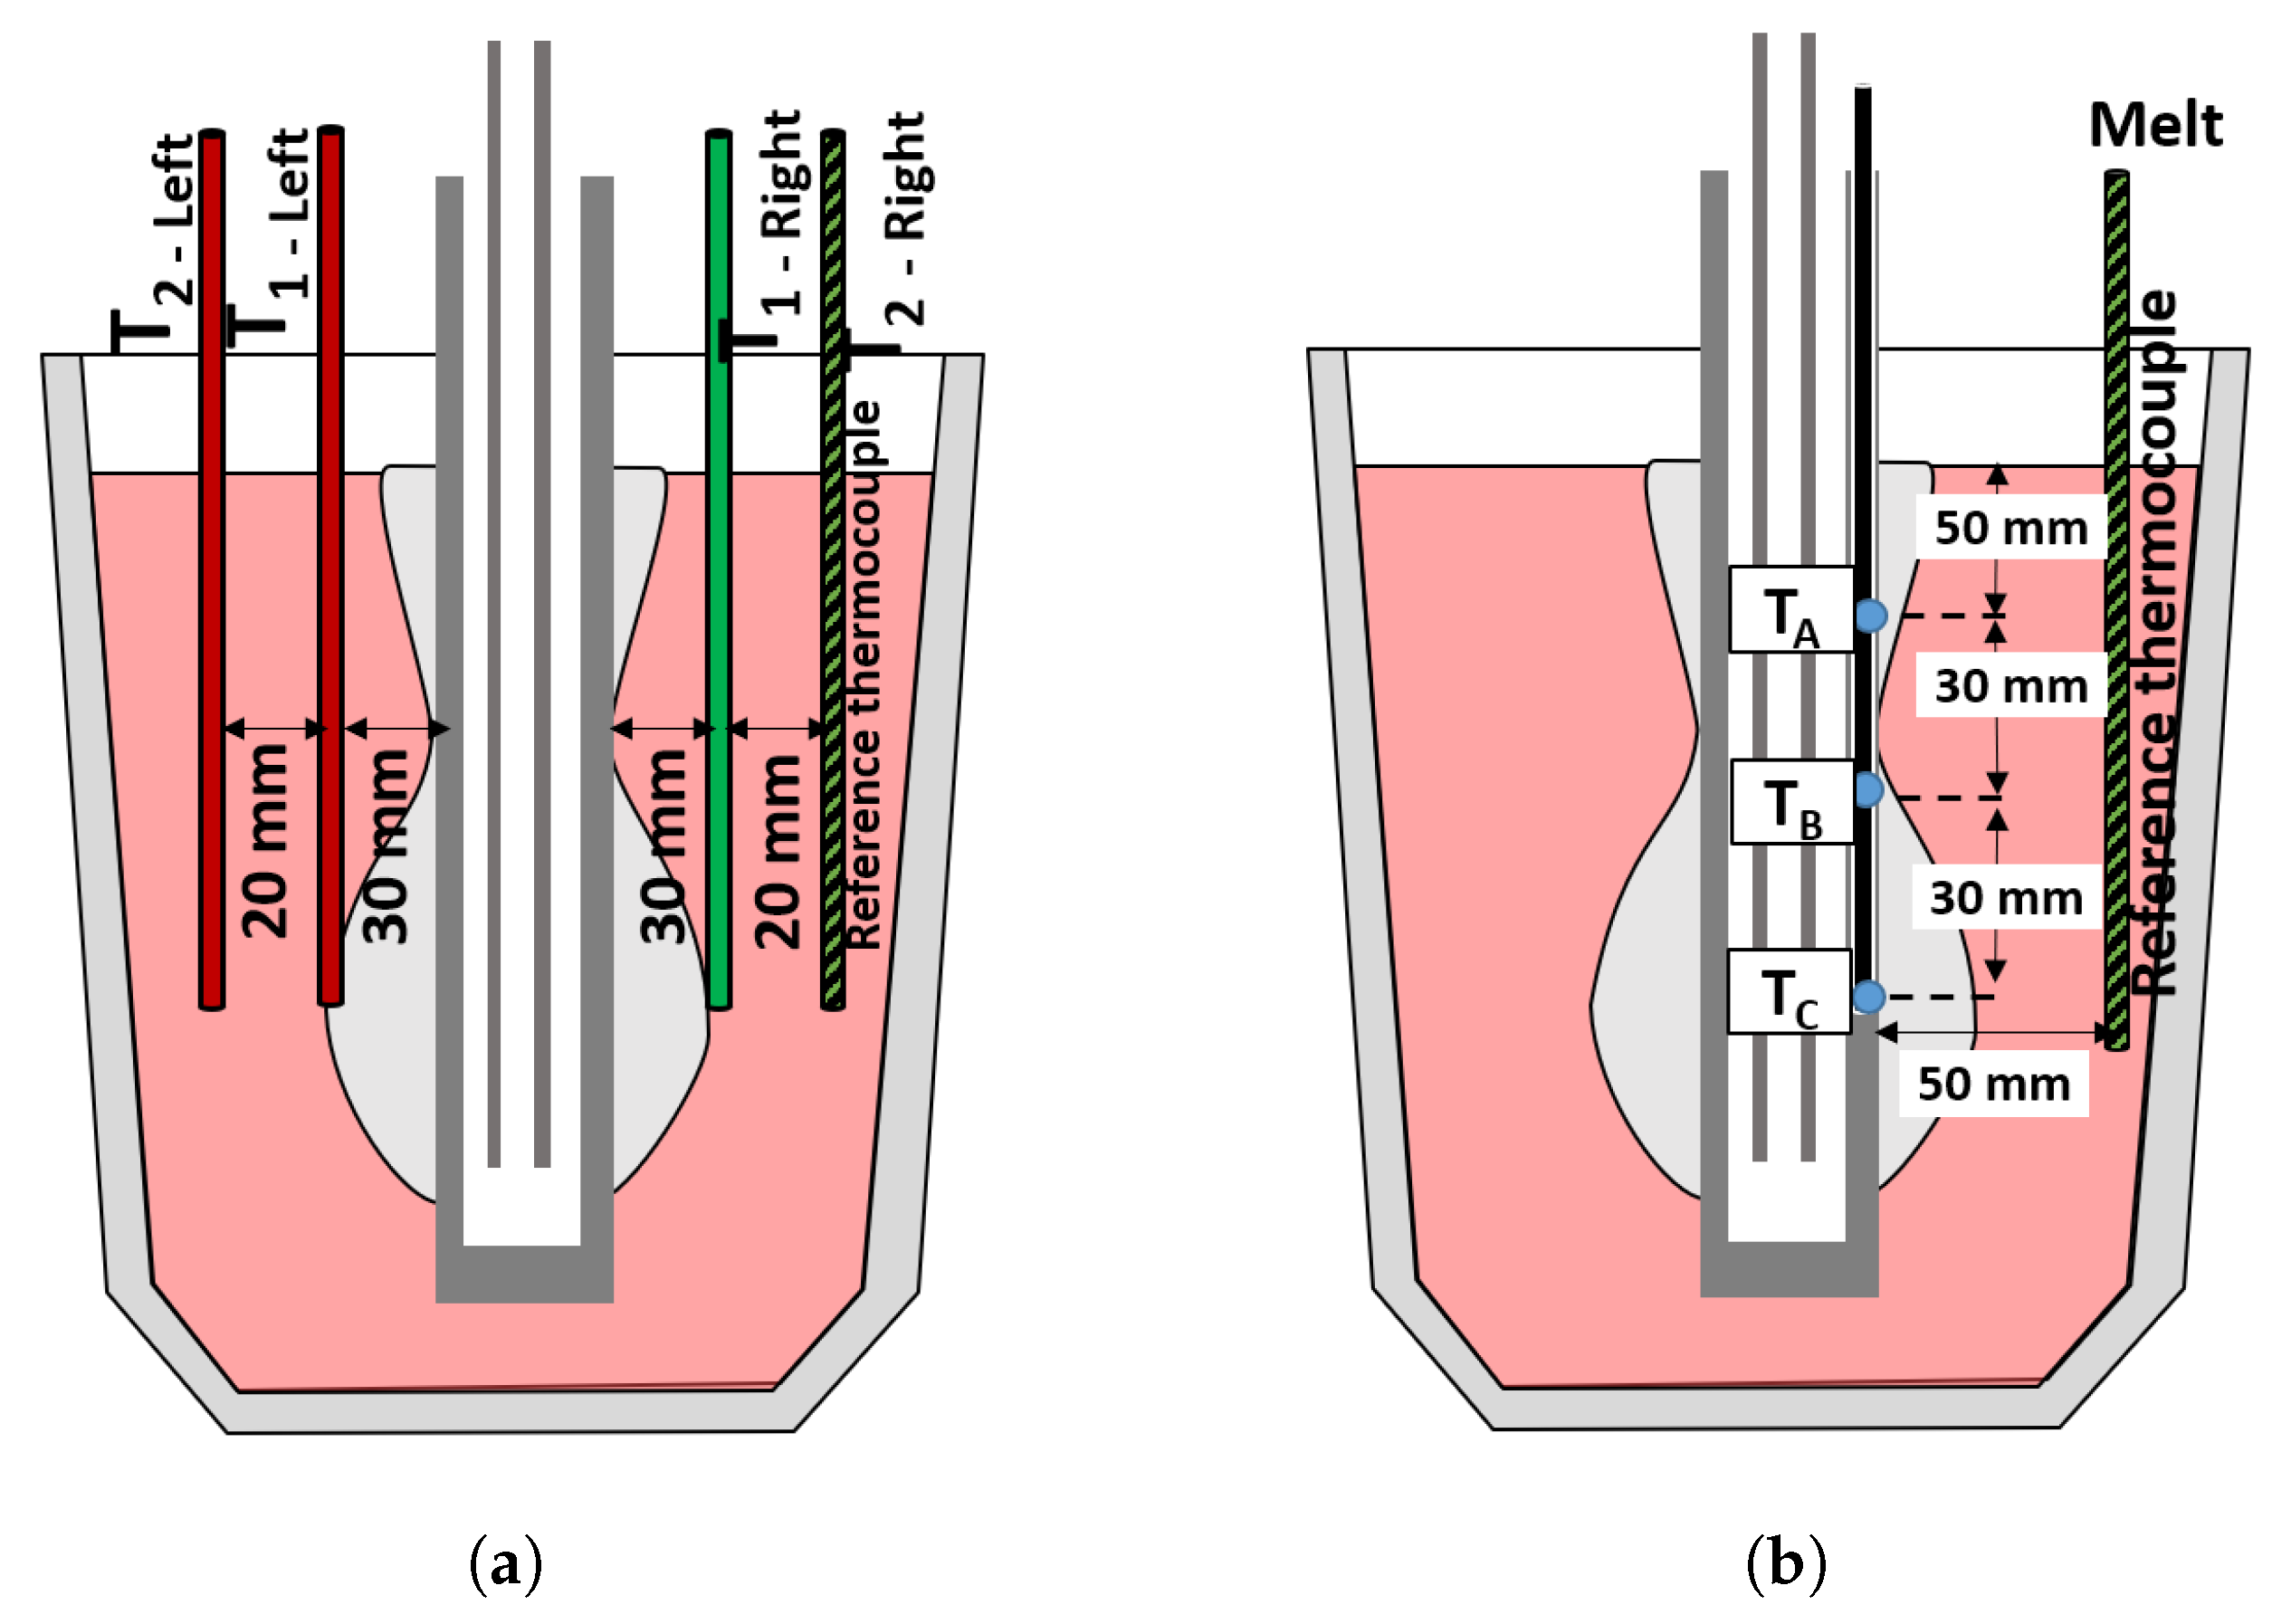
2.3. Experimental Setup and Investigation on the Purification of Germanium via Cooled Finger

The work conducted in the preliminary trials of model metal as well as the numerical investigation provided valuable data to optimize the design of the cooled finger placed in a vacuum furnace, as seen in Figure 4. Moreover, such data assisted in the development of the first process window. This set of process parameters (temperature and cooling gas flow rate) enabled a high degree of confidence in the trials results.
The crucible was positioned in such a way that the center of the heater (hot zone) faced the same level where the cooled finger has its coldest point.
As Ge expands during solidification, a crucible-in-crucible configuration was chosen to protect the furnace in case the crucible cracks while germanium solidifies. Furthermore, the outer graphite crucible wall acted additionally as a heat susceptor and assisted in the heat distribution along the vertical axis. As the fractional crystallization of any metal is very sensitive to small changes in temperature gradient and disturbances in the growth front, such changes can ultimately affects the end purity obtained in the crystallized product. Therefore, a fine adjustment of the process parameters is necessary, specially regarding the cooling gas flow rate, furnace temperature, and rotation.
For this, three sets of trials were conducted. The first set aimed to determine the correct gas flow rate by adjusting the gas flow until a suitable growth rate could be achieved. This investigated interval of cooling gas flow (from 160 to 175 L·min 1 ) is derived from the CrysVUn simulation. The second set of trials were performed to adjust the furnace temperature to provide better thermal gradient conditions in order to sustain higher rotation rates. This is specially important as the rotation tends to homogenize the melt, therefore decreasing the temperature gradient. The last set of trials showed the influence of rotation on the purification of germanium. This last investigation was conducted because it could not be realized within the scope of the simulation. For all those investigation, a total of 7 experiments were conducted with the parameters as depict in the Table 2.
As starting material, germanium with a purity of 98.9% (1N9) was used, whose chemical analysis is represented in Table 3). This material consisted of heads and tails of zone refined germanium bars. Such material quality, which would usually be recycled via the hydro-metallurgical processing chain i.e., chlorination, oxidation, and reduction, was instead selected to be purified by fractional crystallization as an alternative and cost-efficient methodology.
For each trial, a sample of the crystallized product was analyzed by ICP-OES and compared with the composition of the initial material. Moreover, the average growth rate for each trial was calculated through dividing the thickness of the crystallized mass by the crystallization time.

3. Result and Discussions

3.1. Cooled Finger Trials with Model-Metal, Aluminum

The trials performed with the model metal provided valuable data on the horizontal and vertical temperature gradient, which were used for the construction of the numerical modeling and for the determination of the process window to be used in the germanium crystallization. For both trials, the crystallization took place in a A20 crucible holding 5.6 kg of aluminum. During the trials, the temperature of each thermocouple were recorded and later plotted as a function of time, as seen in the graphs from Figure 5a,b, respectively.
For the determination of the horizontal gradient, the temperature values within the grey area (see Figure 5a) were considered. These values correspond to the moment shortly before the growth front reaches the outer thermocouple (see Figure 2a).
The difference between the temperature gradients (ΔT) from the left (0.03 ° C/mm) and right (0.06 ° C/mm) side of the cooled finger can be attributed to slight misalignment between the cooled finger and the middle of the crucible as well as the crucible and the furnace heaters. Therefore, it was considered for the modeling an average value of ΔT as 0.045 °C/mm. Additionally, the melt temperature measured near the crucible wall (50 mm apart from the cooled finger) was 661.3 °C. This value was later used to calibrate the thermocouple values obtained from the vertical temperature gradient trial. Moreover, this temperature was also used as the input conditions for the melt temperature conditions within the SolidWorks simulation.
The vertical temperature curve along the trial can be seen in the Figure 5b. For the determination of the vertical temperature gradient, the values obtained in the first 3 min were considered (gray area in Figure 5b). The reason that a later interval was not considered is to diminish the influence of the thermal conductivity within the crystallized material. In this way, it is assured that the measured temperature gradient corresponds to the values in the proximity of the cooled finger surface. The results show a very low temperature gradient of 0.053 °C/mm between the upper and middle thermocouple, and a high temperature gradient of 0.51 °C/mm between the middle and bottom thermocouple. The values correlates to expectation, since the temperature at the lowest measurement point should be significant lower because of the proximity in which the gas cooling is released inside the cooled finger (see Figure 2b).
However, this 10-factor difference between Δ T ( A B ) and Δ T ( B C ) can be interpreted as being influenced by the direct contact of the thermocouple with the high temperature conductive steel rod, and consequently being directly impinged by the cooling gas flow coming from the inner gas distribution tube. The combination of both horizontal and vertical temperature data were then plotted as a heat map in relation to the measurement location along the cooled finger (see Figure 6).
Although this data converges well with the observable results, the lack of enough data points makes the interpolated values of temperature (specially the ones on the upper-right quadrant) only possible to be interpreted qualitatively, without considering the absolute accurate temperature value. This data will be later used to draw a convergence with the thermal models developed.
From this diagram, it can be observed that the gas distributor located in the center of the cooled finger plays a significant role in the temperature distribution surrounding the cooled finger and the melt. The modification of the position or shape of this gas distribution can be hence conducted in future design optimizations. Such optmizations will improve the cooling distribution along the cooled finger surface, allowing a homogeneous crystallization and purification, improving the obtained yield and quality of the crystallized product.

3.2. Model by CrysVUn and SolidWorks

The simulation conducted in the software SolidWorks aimed at evaluating the temperature distribution throughout the melt phase as well as the temperature profile of the gas flow inside the cooled finger. The compiled results of the thermal simulation are illustrated in Figure 7, where the indicated points corresponds to the same position measured by the experimental trials with model metal (see Figure 6). These obtained values had a good correlation with the measured temperature.
The horizontal temperature gradient obtained by the simulation via SolidWorks was 0.048 °C/mm. This value matches the one obtained from the experimental part (0.045 °C/mm). On the other hand, the values for vertical temperature gradients obtained were: 0.003 °C/mm between the upper and middle section of the cooled finger, and 0.056 °C/mm between the middle and bottom section. The latter two values had a much higher deviation from the experimental results, attributing to the supposition that some of the thermocouples had a partial contact with the cooled steel wall of the cooled finger during the experiments. This ultimately caused the measured temperature to be reduced a couple of degrees. This effect can be seen in the simulation results from Figure 7, where there is a difference of 18 °C between the measured points from the steel (638.67 °C) and the adjacent graphite shell (656.64 °C).
The simulation performed using the software CrysVUn did not contemplate the in- and outgoing of the cooling gas inside the cooled finger. To overcome this issue, an approach was developed to use alternative possibilities implemented in CrysVUn, namely the application of special boundary conditions. In particular, the inner surface temperature of the stainless steel ingoing cooling gas feeding line was set to Dirichlet boundary conditions reflecting the assumed thermal situation f(T) for this surface. The temperature of the ingoing gas feeding line was determined from the basic simulation performed in the software SolidWorks TM (see Figure 7), validated with experimental results performed using aluminum as a model metal.
It has been demonstrated that the amount of negative heating power (cooling power) can be easily calculated by the formula Δ Q = c v · m · Δ T , whereas cv is the heat capacity of the used cooling media (air), m is the mass of the air flowing through the cooled finger and ΔT is the temperature difference between inflowing and outflowing air. With this information, the heat extraction generated by this gas flow was calculated. This value of heat was then fed back to the CrysVUn software in the form of a “negative” heater over the surface of the cooled finger.
For the given setup and experimental conditions used, the total cooled finger cooling power needed to achieve a reasonable crystallization rate, is in the range of about 390 W for aluminum and 1320 W for germanium crystallization, considering the heater supplying a heat input of 3900 W and 9600 W, respectively. These values corresponds with a cooling gas flow rate of approximately 50 L/min for aluminum and 175 L/min for germanium crystallization.
A preliminary simulation of aluminum crystallization has been shown in Figure 8a. The radial temperature gradient ΔT between the crystal phase boundary and the inner crucible wall is about 1.6 °C, which is in rather good agreement with the result of the SolidWorks simulation (Figure 7), indicating a temperature gradient between these points of about 0.9 °C. The small difference is a consequence of considering the latent heat in the CrysVUn model, which results in a slightly higher melt temperature.
Furthermore, it is important to highlight that, in the absence of external electromagnetic fields, marangoni induced effects and under constant normal gravity, the convection is mainly driven by density gradients caused by axial temperature gradients. Through assumption that these gradients are negligible, coupled with the fact that the cooled finger is rotating, then any convection inside the melt is overcompensated by the mechanical mixing of the melt, caused by the cooled finger rotation. Due to the above mentioned assumptions, convection was not considered in the CrysVUn modeling.

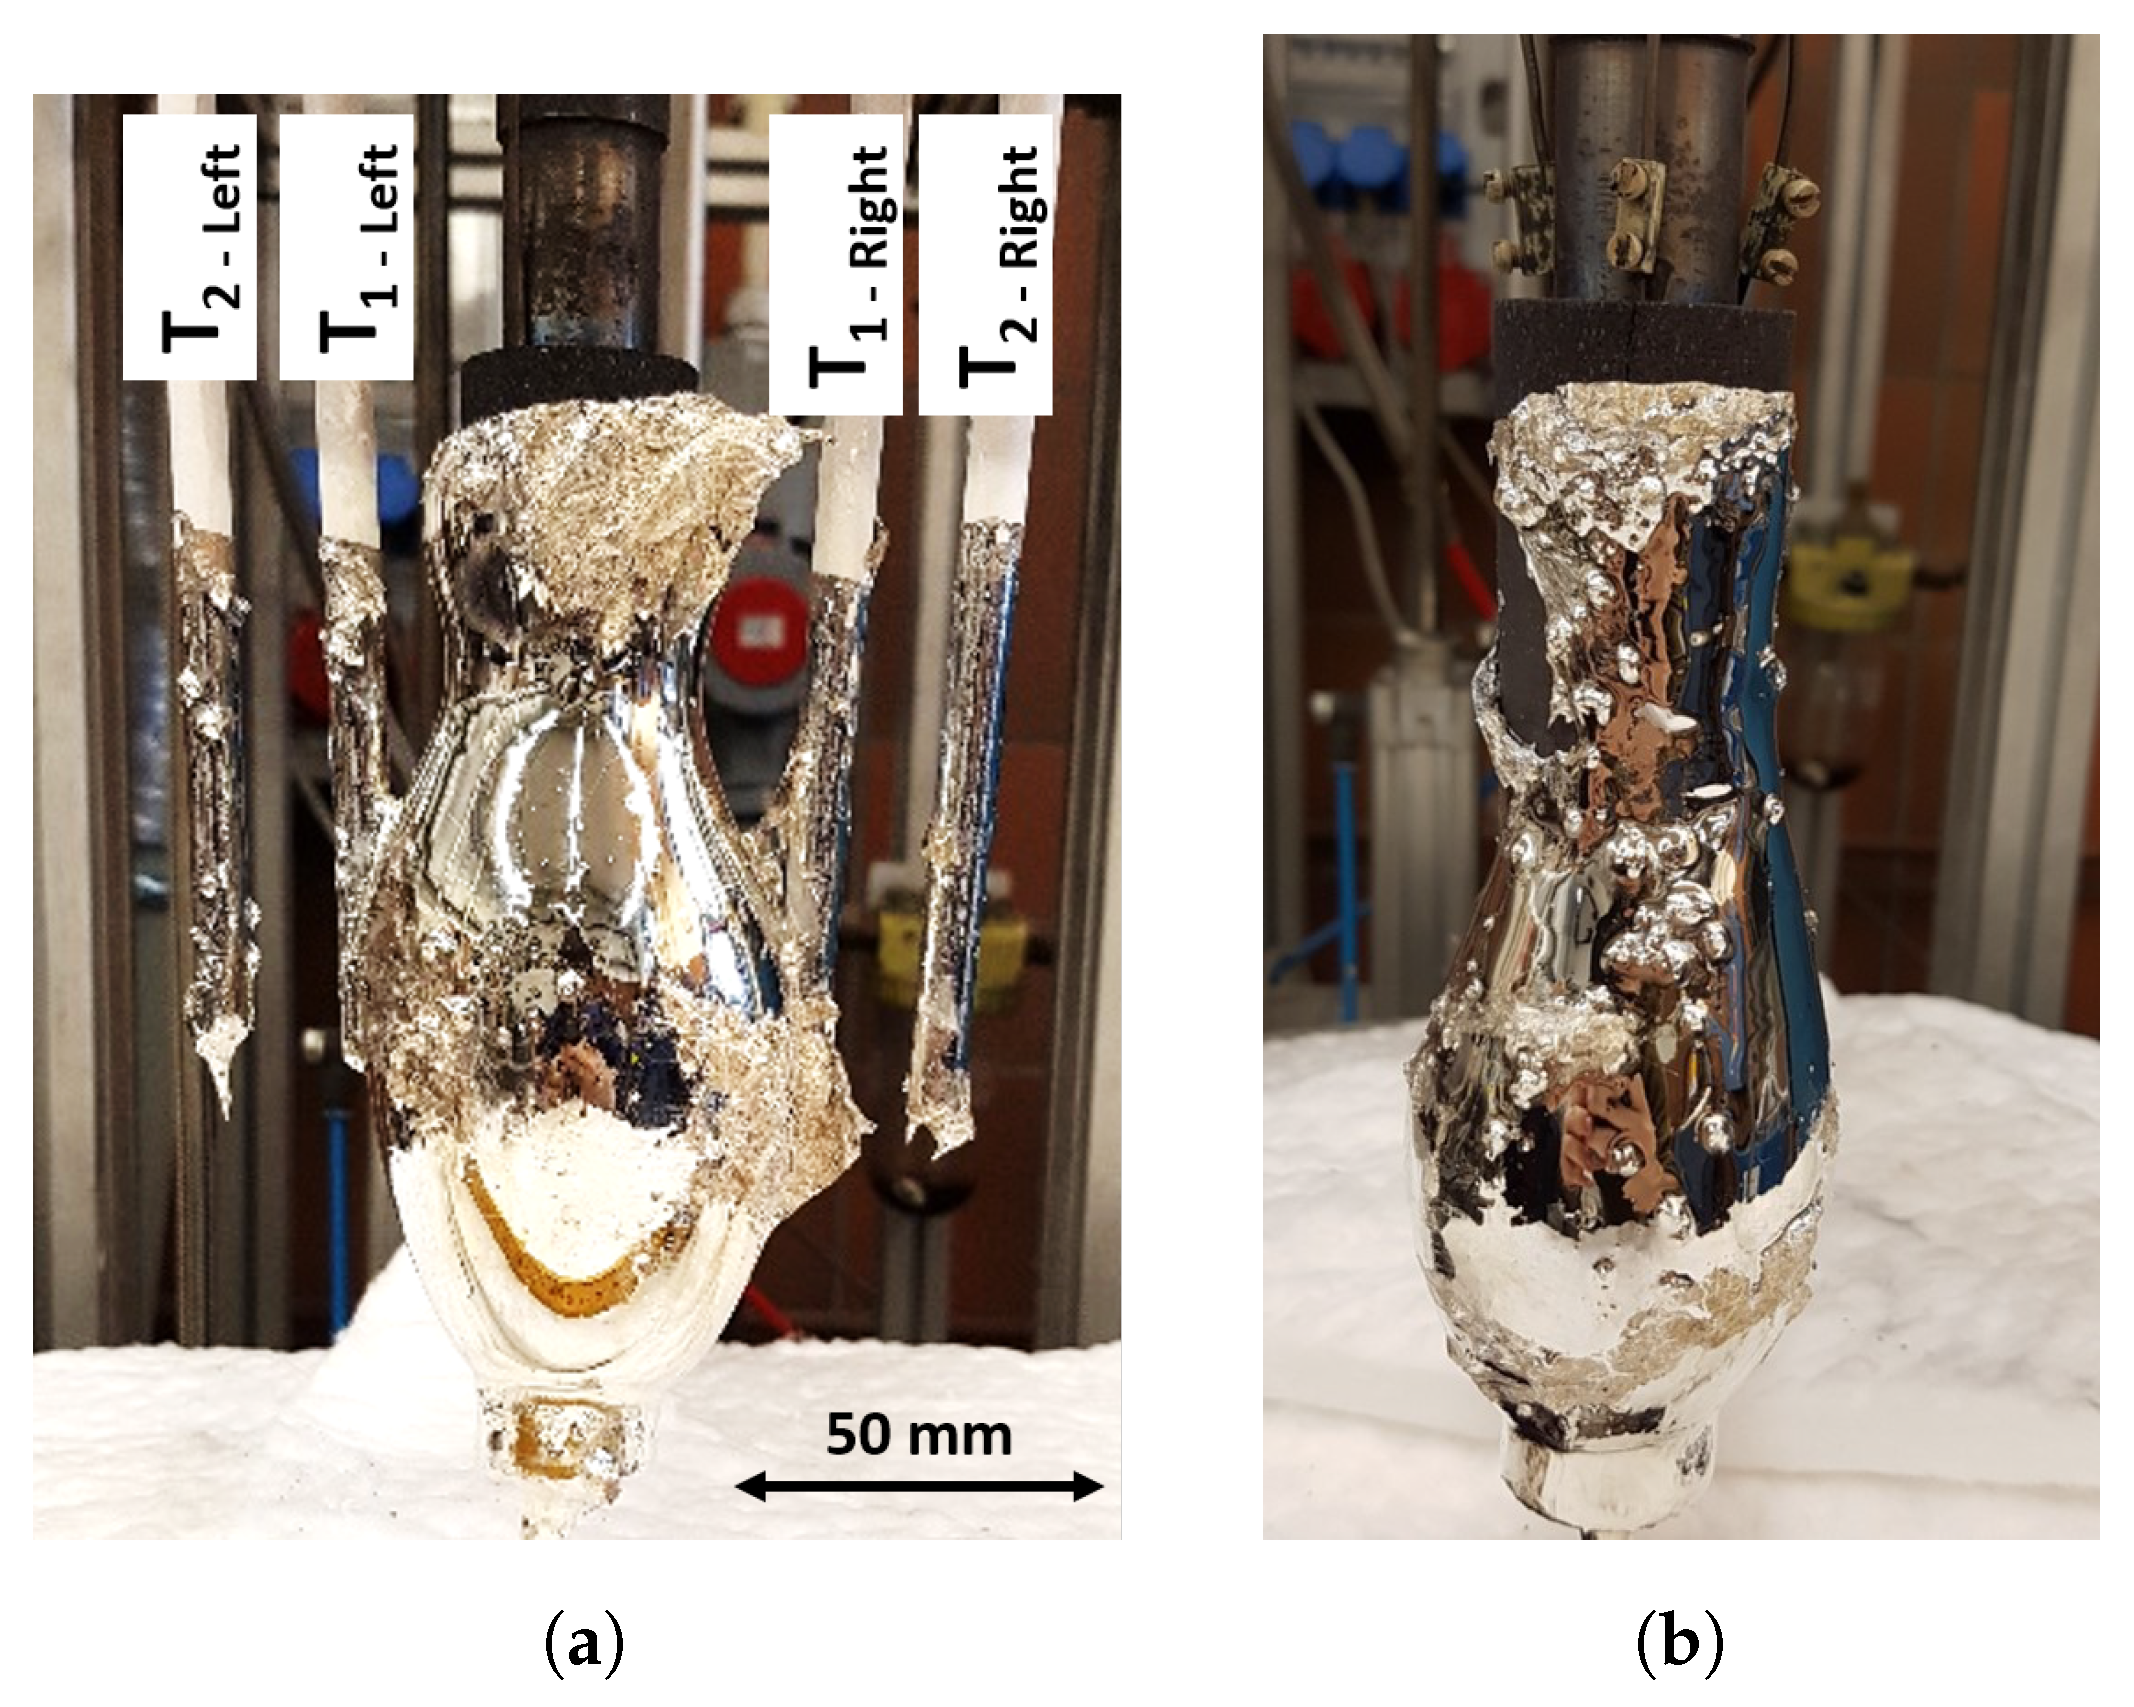
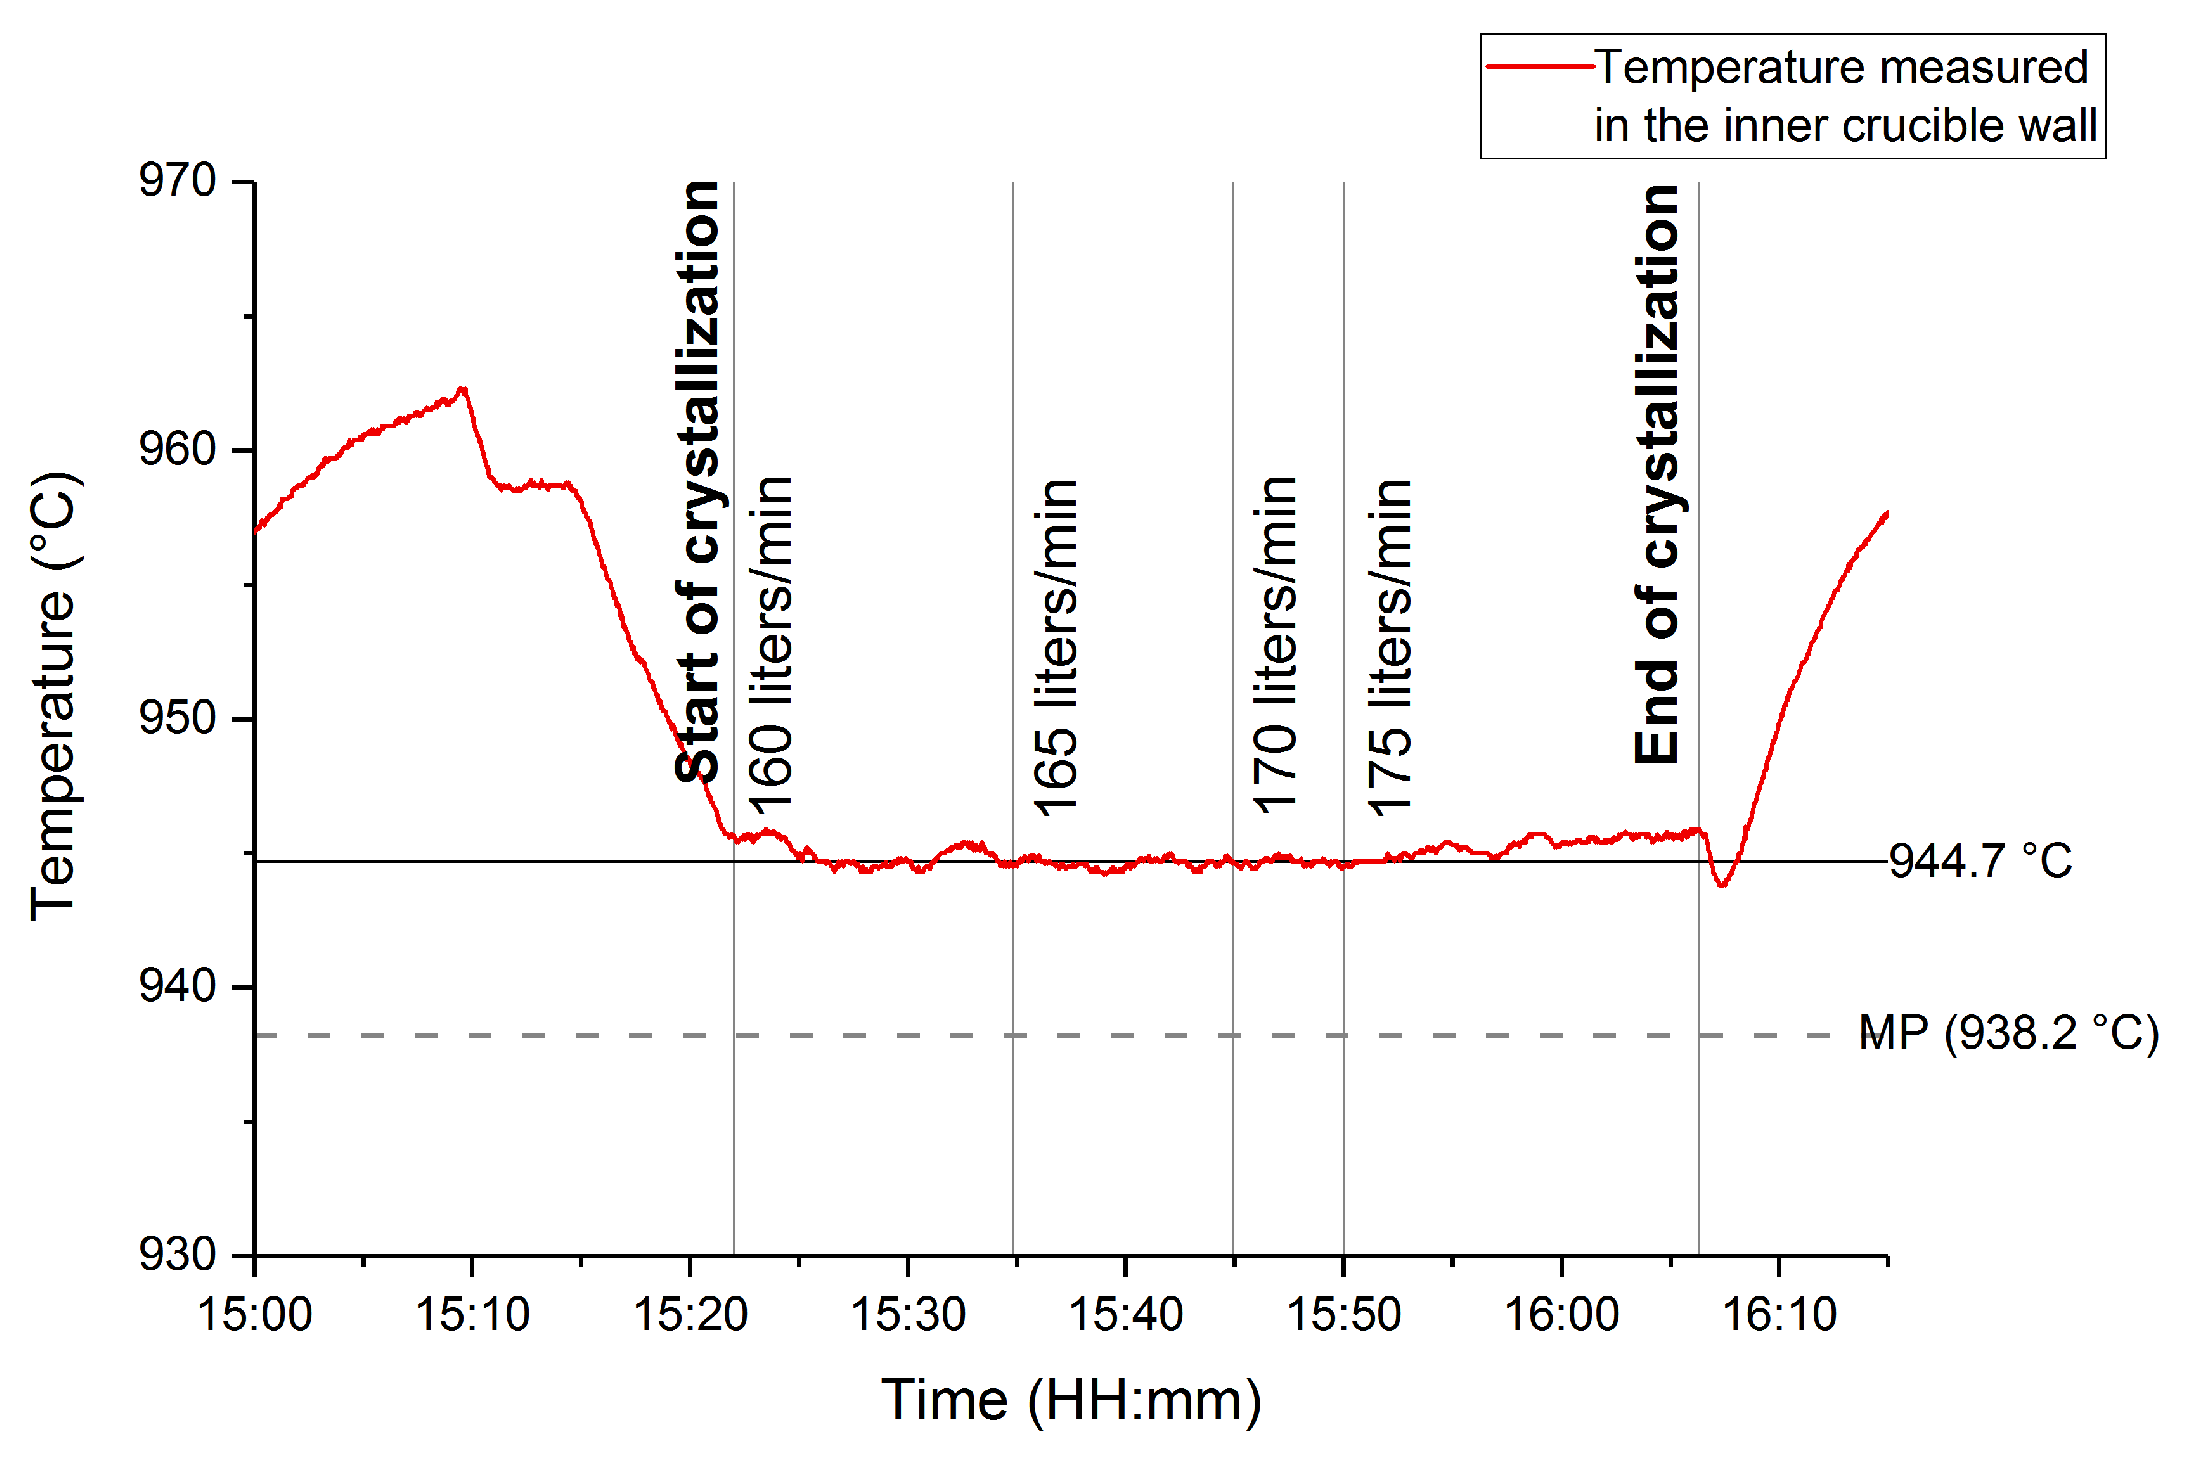
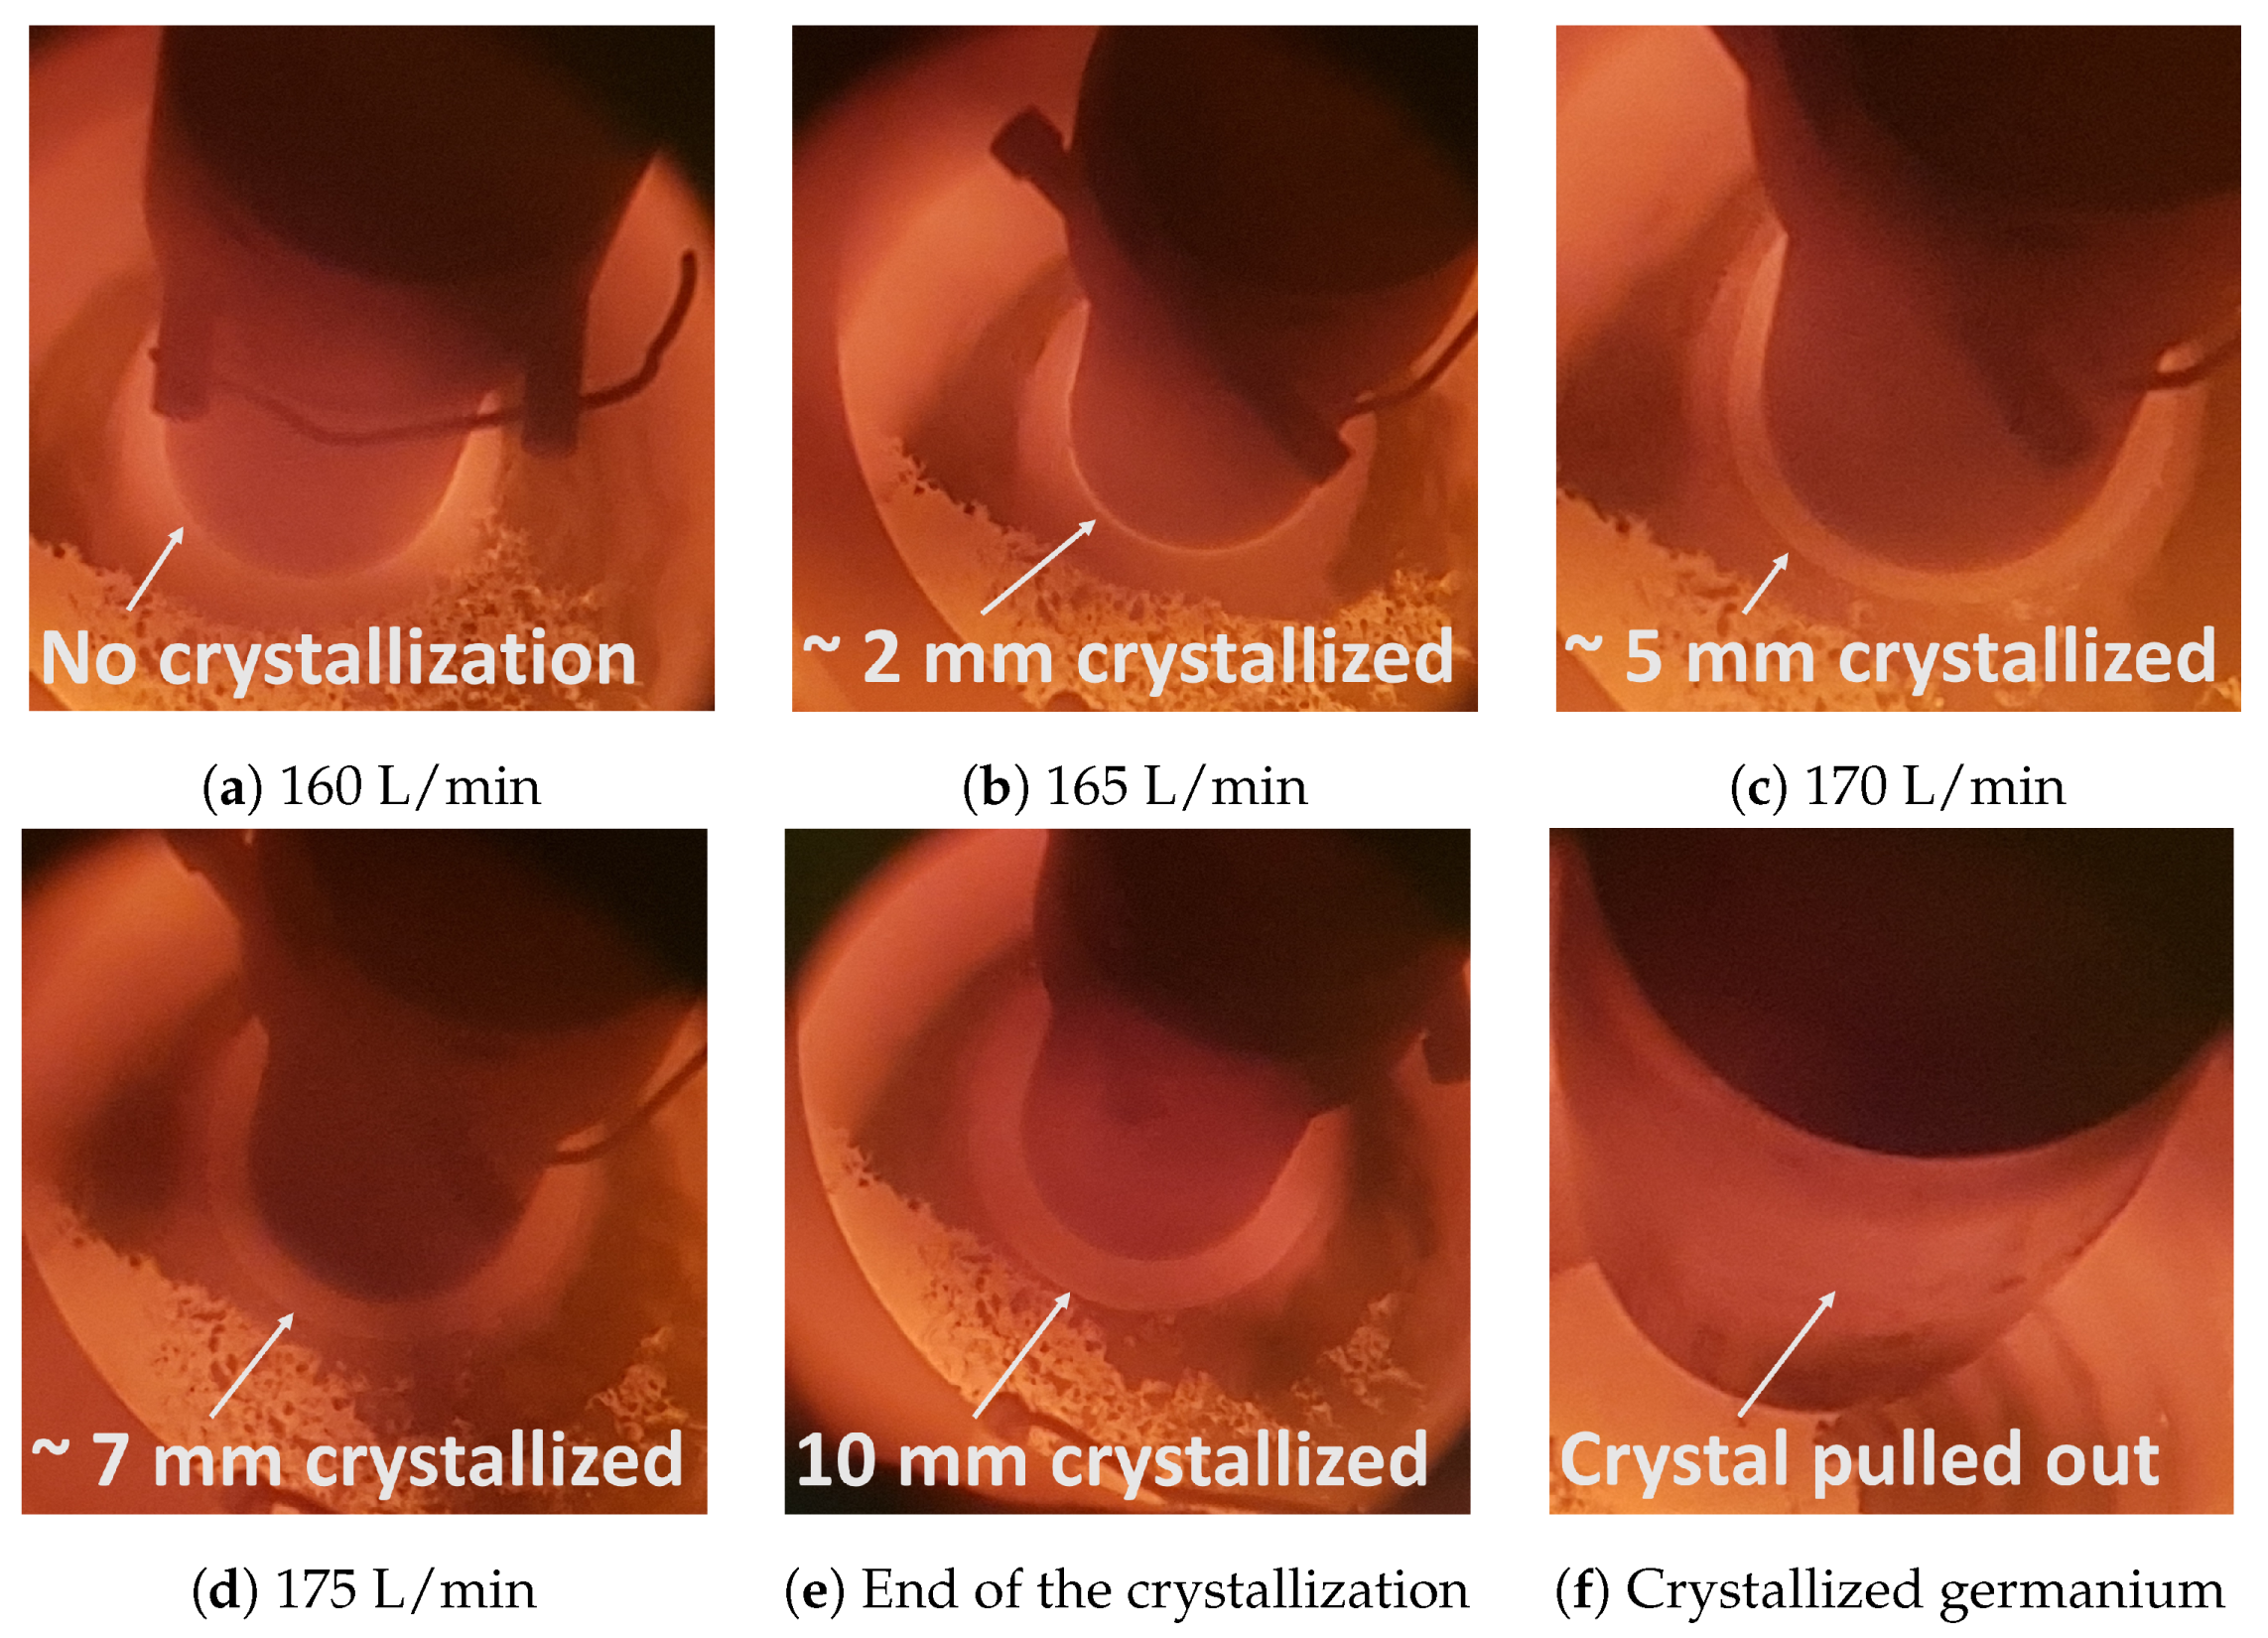
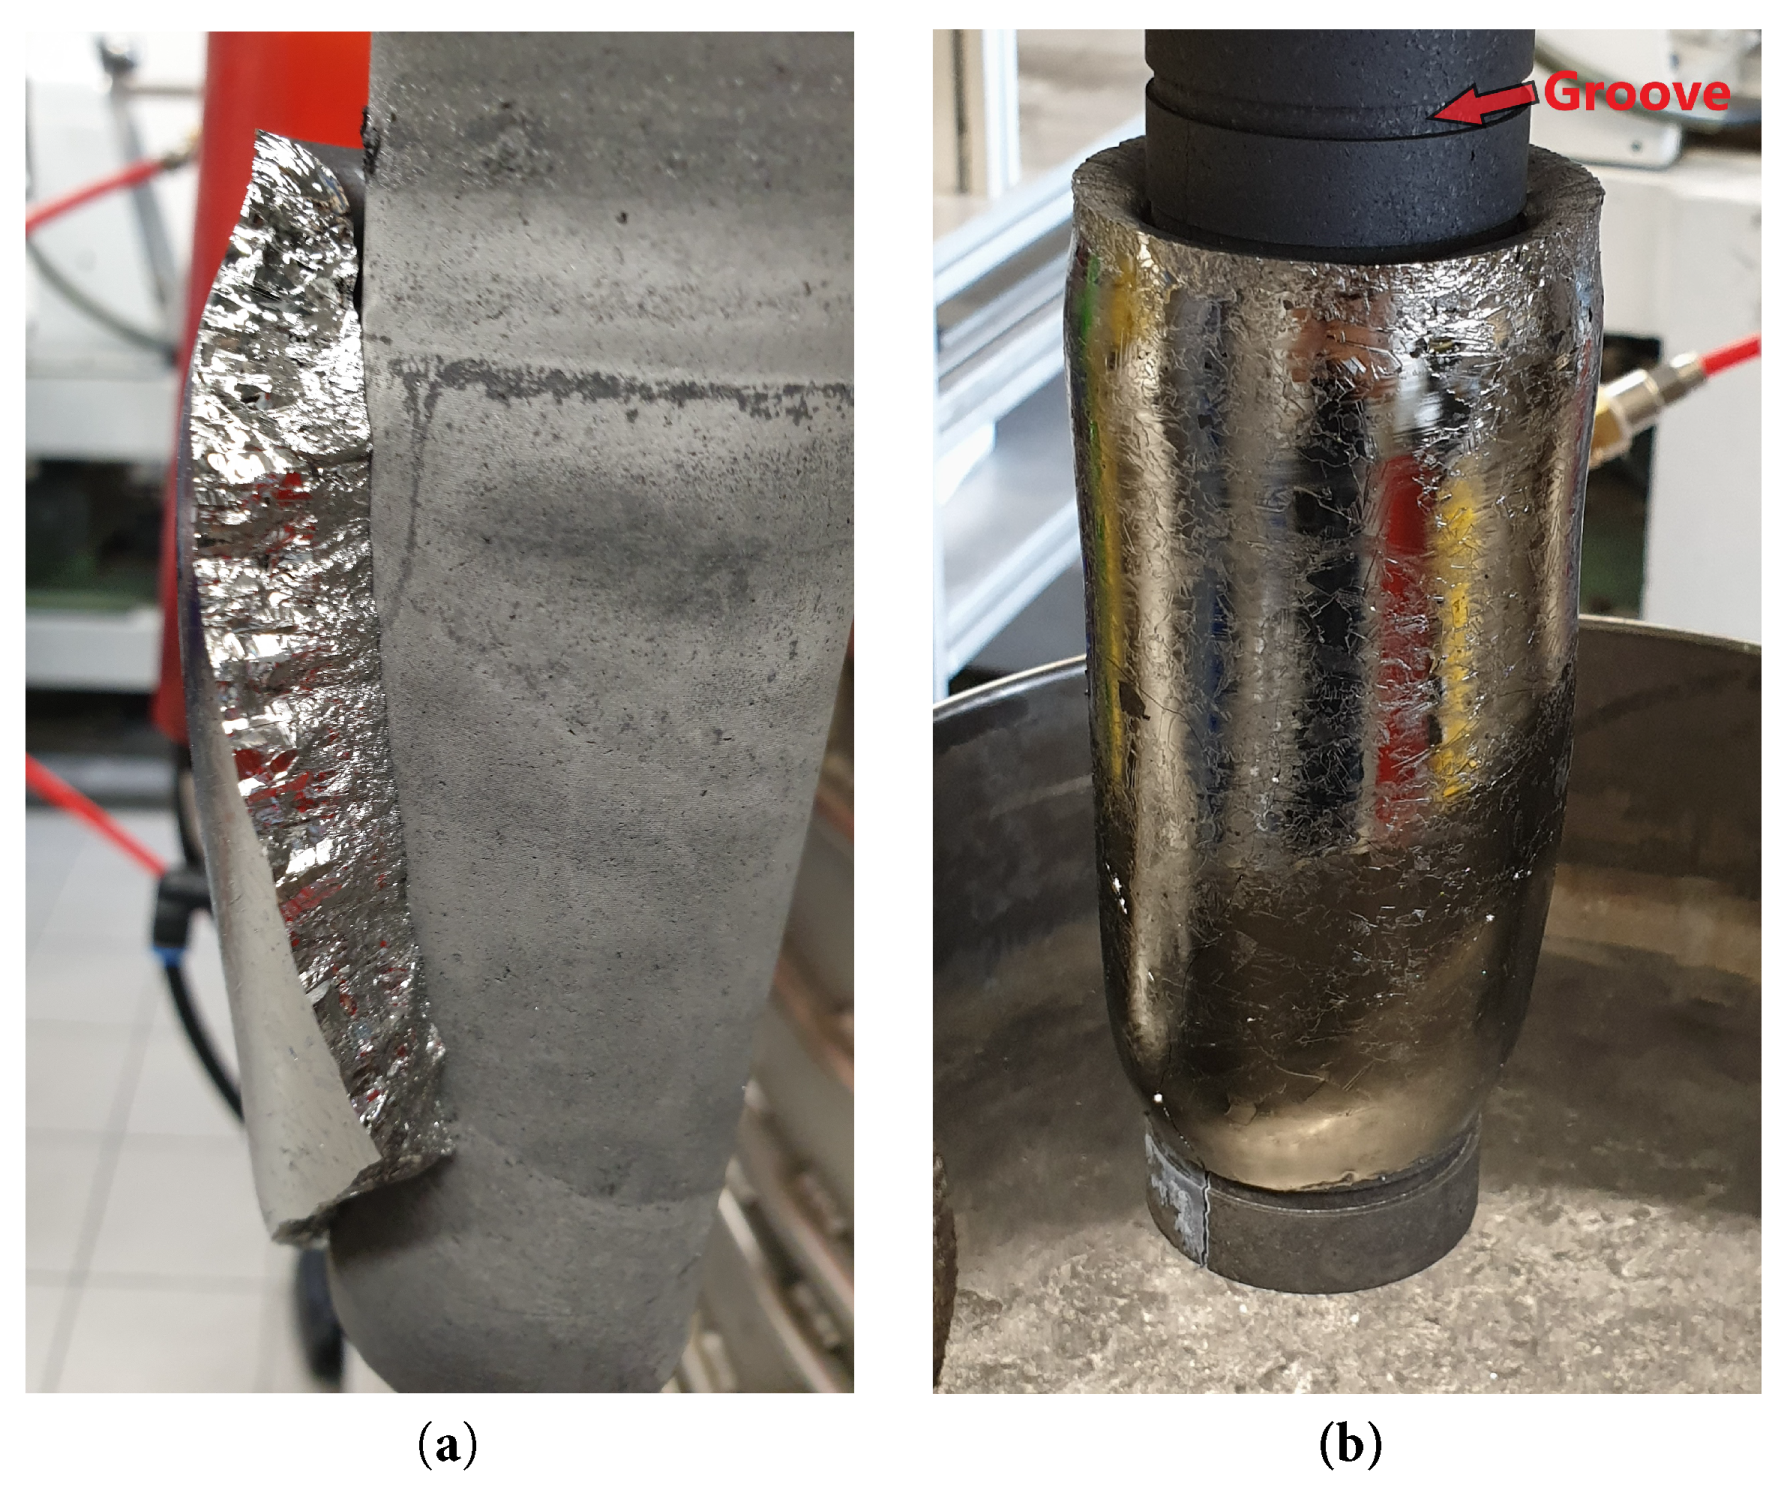
3.3. Experimental Purification of Germanium via Cooled Finger Crystallization

The temperature was continually measured by a thermocouple placed inside the wall of the inner crucible (see Figure 4) and the temperature profile plotted in the graph of Figure 9. This graph as well the pictures depicted in Figure 10 shows that, despite the chosen set of initial process parameters (initial melt temperature of 1000 °C, cooling gas flow of 160 L/min, and 10 rpm as rotation rate), no crystallization was observed after 10 min at the crystallization plateau.
The plateau showed in Figure 9 is formed at the beginning of the crystallization when the latent heat is extracted from the melt upon the phase transformation from liquid to solid. When the temperature gradient is not high enough, the crystallization growth front moves very slowly, reaching a stagnation point. To avoid it, the cooling was therefore stepwise increased until a sufficient growth thickness was achieved with 175 L/min. From this point, the crystallized material was let to further grow for 15 min before it was removed.
The thermal gradient employed to sustain the growth of germanium over the surface of the graphite shell while it is rotating, generates high thermal stresses in the crystallized structure. As a consequence of this structural stresses, when the cooled finger is pulled out of the melt, the crystallized material cracked and sometimes fell down to the crucible. This undesired effect was seen at the first attempt (see Figure 11a) and was solved by creating thin and flat grooves over the graphite surface. Theses grooves provided enough support to hold the crystallized material attached to the graphite shell (see Figure 11b).
With the improved shell design and the cooling gas parameter fixed at its previously determined value of 175 L/min, the next set of trials was performed in order to evaluate the effect of heat input temperature and the rotation rate.
The results show the effect of temperature and rotation on the growth rate as well as the reduction of the main impurities present in the initial material, as seen in Table 4.
Because the crystallization is very sensitive to small changes in thermal gradient, it is also heavily influenced by the furnace temperature. A difference of 5 °C in the temperature of the melt increased the growth rate of germanium from 0.4 mm/min at 1005 °C (trial Ge_2B) to 0.6 mm/min at 1000 °C (trial Ge_2A). Both experiments were carried out at 175 L/min gas flow and 10 rpm rotational speed.
As a critical process parameter, the rotation rate—at the microstructural level—acts to reduce the diffusion boundary layer during the fractional crystallization process. At the macrostructure level, the increased mixing due to the higher rotation reduces the temperature gradient in the melt, resulting in a lower growth rate. In order to observe this effect experimentally, a test (trial Ge_3) was carried out with the process parameters of 175 L/min, initial melt temperature of 1000 °C at a speed three times higher (30 rpm). As predicted, this study showed a slower growth rate of 0.27 mm/min as well as 497 g of crystallized germanium.
Overall, the effect of fractional crystallization was clearly seen in the conducted trials. Most of the impurities with low distribution coefficient (see Table 1) were drastically decreased in the crystallized product. Such were the cases of e.g., In, Ga, P, Fe, Cr, and Ni. On the other hand, impurities with distribution coefficients higher than unity (B and Si) showed an increased content in the crystallized germanium. In total, the sum of reduced impurities in germanium amounted to 90%, increasing the purity of the germanium from 1N8 up to 3N in a single processing step. It is expected that by further processing the purified germanium with subsequent crystallization steps, its purity can be further increased.

4. Assessment and Conclusions

The use of numerical simulation coupled with a series of preliminary trials using aluminum as model metal proved to be highly beneficial to develop a process window for germanium purification via cooled finger. The trials with aluminum as model metal in an open resistance furnace allowed an efficient handling of all the measurement components e.g., several thermocouples in order to obtain the necessary information used to feed the numerical modeling.
The numerical modeling were split into two different software platforms that complemented each other: SolidWorks and CrysVUn. While CrysVUn provides several aspects of the crystallization process, the SolidWorks assisted into calculation of thermal extraction by cooling gas flow in the cooled finger. The results of the simulation showed good agreement with the experimental investigation and supplied enough information on the start process window used during germanium purification via cooled finger in a vacuum resistance furnace.
The purification trials conducted with germanium allowed not only the purification of the initial material from 98.8%. up to 99.9%, but also further improvement of the process window to achieve a better purification rate. The best purification results were then achieved by a melt temperature of 1005 ° C, with a cooling rate of 175 L/min and a rotation of 10 rpm.
By comparing the obtained purification results with the theoretical expectation (as described by Equation (2)) as well the values of growth rate (shown in Table 4), there is what seems to be a contradiction. According to the theory, the trial Ge_3 should achieve the highest purification, followed by the trials Ge_2B, and Ge_2A. However, the highest purification occurred in the trial Ge_2A, followed by the trials Ge_2B, and Ge_3.
The reason for this effect is related to changes in the chemical composition of the melt between each crystallization trial. Due to the conservation of mass, the expelled impurities from the first crystallization trial remains in the leftover melt, effectively increasing its impurity content. This increased impurity content of the melt will then influence the achievable end purification of the subsequent trials.
It is therefore important to emphasize that the main goals behind the investigation of the process parameters were their effect on the growth rate obtained in the process, as well as to achieve a convergence with the results from the simulation. Both of which were successfully achieved. The purification results, while extremely important and main reason for conducting a fractional crystallization, are depicted only in a qualitatively manner, as a means of proving that the cooled finger process can achieve suitable levels of Ge purification and is a viable candidate to replace other fractional crystallization methods. A wider and more profound investigation correlating the cooled finger process parameters in relation to the obtained purification was already conducted by our research group using aluminum as model metal and is referenced in citation [16] of this paper.

Author Contributions

B.F. is the principal investigator. S.F., D.C.C. conceived and designed the experiments. D.C.C. performed the cooled finger experiments. D.C.C. and M.N. performed the numerical simulations, D.C.C. and S.F. analyzed the data. D.C.C., S.F., and B.F. edited the manuscript. All authors have read and agreed to the published version of the manuscript.

Funding

This research was conducted in the framework of an AIF-ZIM (German Federation of Industrial Research Associations—Central Innovation Program for SMEs) project application, financed by the German federal ministry for economic affairs and energy (BMWI).

Acknowledgments

The authors would like to thank the Federal ministry for economic affairs and energy (BMWI) for financing the project as part of an AIF-ZIM (German Federation of Industrial Research Associations—Central Innovation Programme for SMEs) project application. Also, the authors thank the CNPQ-Brazilian National Council for Scientific and Technological Development for the financial support of the Brazilian scholarship holder D. Curtolo.

Conflicts of Interest

The authors declare no conflict of interest.

References

  1. Jorgenson, J.D. Germanium Recycling in the United States in 2000; Technical report; U.S. Department of the Interior, U.S. Geological Survey: Reston, VA, USA, 2006.
  2. Claeys, C.; Simoen, E. Germanium Based Technologies; Elsevier: Oxford, UK, 2007; p. 449. [Google Scholar]
  3. Guberman, D.E. Mineral Commodity Summaries, January 2017; Technical report; U.S. Geological Survey: Reston, VA, USA, 2017.
  4. Butterman, B.W.C.; Jorgenson, J.D. Germanium; Technical report; U.S. Department of the Interior, U.S. Geological Survey: Reston, VA, USA, 2005.
  5. Moskalyk, R.R. Review of germanium processing worldwide. Miner. Eng. 2004, 17, 393–402. [Google Scholar] [CrossRef]
  6. Bracht, H. Self- and Dopant Diffusion in Silicon, Germanium, and Their Alloys. In Silicon, Germanium, and Their Alloys—Growth, Defects, Impurities and Nanocrystals; Kissinger, G., Pizzini, S., Eds.; Taylor & Francis Group, LLC: Boca Raton, FL, USA, 2015; Chapter 6. [Google Scholar]
  7. Singh, R.; Oprysko, M.; Harame, D. Silicon Germanium. Technology, Modeling, and Design; IEEE Press: Piscataway, NJ, USA, 2004; pp. 1–7. [Google Scholar]
  8. Curtolo, D.C.; Friedrich, S.; Friedrich, B. High Purity Germanium, a Review on Principle Theories and Technical Production Methodologies. J. Cryst. Process Technol. 2017, 7, 65–84. [Google Scholar] [CrossRef] [Green Version]
  9. Pfann, W.G. Principles of Zone-Melting. JOM 1952, 4, 747–753. [Google Scholar] [CrossRef]
  10. Zhang, X.; Friedrich, S.; Liu, B.; Huang, T.; Friedrich, B. Computation-assisted analyzing and forecasting on impurities removal behavior during zone refining of antimony. J. Mater. Res. Technol. 2020, 9, 1221–1230. [Google Scholar] [CrossRef]
  11. Weiser, K. Theoretical calculation of distribution coefficients of impurities in germanium and silicon, heats of solid solution. J. Phys. Chem. Solids 1958, 7, 118–126. [Google Scholar] [CrossRef]
  12. Trumbore, F. Solid Solubilities of Impurity Elements in Germanium and Silicon. Bell Syst. Tech. J. 1960, 39, 205–303. [Google Scholar] [CrossRef]
  13. Burton, J.A.; Prim, R.C.; Slichter, W.P. The Distribution of Solute in Crystals Grown from the Melt. Part II. Experimental. J. Chem. Phys. 1953, 21, 1991–1996. [Google Scholar] [CrossRef]
  14. Burton, J.A.; Prim, R.C.; Slichter, W.P. The Distribution of Solute in Crystals Grown from the Melt. Part I. Theoretical. J. Chem. Phys. 1953, 21, 1987–1991. [Google Scholar] [CrossRef]
  15. Friedrich, J.; Ammon, W.V.; Müller, G. CZ Growth of Silicon crystals. In Handbook of Crystal Growth, 2nd ed.; Elsevier B.V.: Oxford, UK, 2015; pp. 59–60. [Google Scholar] [CrossRef]
  16. Curtolo, D.; Friedrich, S.; Bellin, D.; Nayak, G.; Friedrich, B. Definition of a First Process Window for Purification of Aluminum via “Cooled Finger” Crystallization Technique. Metals 2017, 7, 341. [Google Scholar] [CrossRef]
  17. Friedrich, S.; Curtolo, D.; Friedrich, P.B. Investigation of Temperature Effect on Impurities distribution coefficient in Molten Aluminum through Theoretical Calculation and Experimental Fractional Crystallization. In Proceedings of the EMC European Metallurgical Conference, Leipzig, Germany, 25–28 June 2017; pp. 889–896. [Google Scholar]
  18. Kurz, M.; Pusztai, A.; Müller, G. Development of a new powerful computer code CrysVUN + + especially designed for fast simulation of bulk crystal growth processes. J. Cryst. Growth 1999, 198–199, 101–106. [Google Scholar] [CrossRef]
Figure 1. (a) Simplified sketch and (b) the process schematics of a cooled finger fractional crystallization unit.
Metals 10 00973 g001
Figure 2. Experimental setup for the measurement of the (a) horizontal and (b) vertical temperature gradient needed for the construction of the numerical model. Both trials were conducted without rotation and with a cooling gas flow of 50 L·min 1 .
Metals 10 00973 g002
Figure 3. (a) Crystallized aluminum with the thermocouples in ceramic protective tubes, used for determination of horizontal temperature gradient, and (b) crystallized aluminum for the trial to measure the vertical temperature gradient.
Metals 10 00973 g003
Figure 4. Experimental setup used for the purification of germanium via cooled finger installed in a vacuum resistance furnace.
Metals 10 00973 g004
Figure 5. (a) Horizontal temperature profile between the thermocouples placed on the left (red) and right (green) side of the cooled finger and (b) Vertical temperature profile between the thermocouples placed inside of the cooled finger graphite shell.
Metals 10 00973 g005
Figure 6. Combined temperature profile based on the vertical- and horizontal measurements of temperature, applying software Origin.
Metals 10 00973 g006
Figure 7. Results obtained by the SolidWorks simulation, showing the crystallized fraction (left side) and the temperature profile of both solid and gas phases (right side).
Metals 10 00973 g007
Figure 8. Simulation results obtained by the software CrysVUn for (a) aluminum and (b) for germanium.
Metals 10 00973 g008
Figure 9. Influence of the gas cooling rate in the crystallization of germanium.
Metals 10 00973 g009
Figure 10. Influence of the gas cooling rate in the crystallization of germanium.
Metals 10 00973 g010
Figure 11. Influence of the graphite shell design for the attachment of the crystallized germanium. (a) Damaged product—flat graphite shell showing a piece of the crystallized germanium, (b) Fully intact product—improved graphite shell with the germanium fully attached.
Metals 10 00973 g011
Table 1. Distribution coefficients of impurities in germanium.
ElementsDistribution Coefficient kElementsDistribution Coefficient k
Li2.0 × 10 3 Au1.3 × 10 5
Cu1.5 × 10 5 Zn4.0 × 10 4
Ag4.0 × 10 7 Tl2.5 × 10 5
Si3.5Pt5.0 × 10 6
Sn2.0 × 10 2 Pb1.0 × 10 4
Cd1.0 × 10 5 B11
Al7.0 × 10 3 Ga2.0 × 10 2
In8.0 × 10 4 P8.0 × 10 2
As2.0 × 10 2 Sb3.0 × 10 3
Bi4.5 × 10 5 O1.2
Fe3.0 × 10 5 Ni3.0 × 10 6
Table 2. Experimental parameters used in the germanium crystallization.
GoalTrial Nr.TemperatureCooling Gas FlowRotation
[ ° C][L/min at 3 bar][rpm]
Gas cooling1_A97016010
1_B97016510
1_C97017010
1_D97017510
Temperature2_A100017510
2_B100517510
Rotation3100017530
Table 3. Initial chemical analysis of germanium, via ICP-OES (ppm).
Initial materialAlSiGaPInFeBZnCrNiSum of all elements
2125938001500510021159133011311,106
Table 4. Chemical analysis of germanium crystallization trials.
Chemical Analyze (ppm)
SampleCrystallized Mass [g]Growth Rate [mm/min]AlSiGaPInFeBZnCrNiSumPurity
Initial212593800150051002115913301131110698.8%
Ge_2A8460.615205543192401560.517.50010883N
Ge_2B5470.417218.559920542204816.50011663N
Ge_34970.2736.5350726.529136367200015482N8

