The Adsorption Behavior of Moisture on Smelter Grade Alumina during Transportation and Storage—for Primary Aluminum Production

 ,
,
Abstract
:1. Introduction
2. Experimental
2.1. Experimental Design and Sample Preparation
2.2. Water Vapor Adsorption Tests
3. Results and Discussion
3.1. Properties of Tested Alumina Samples
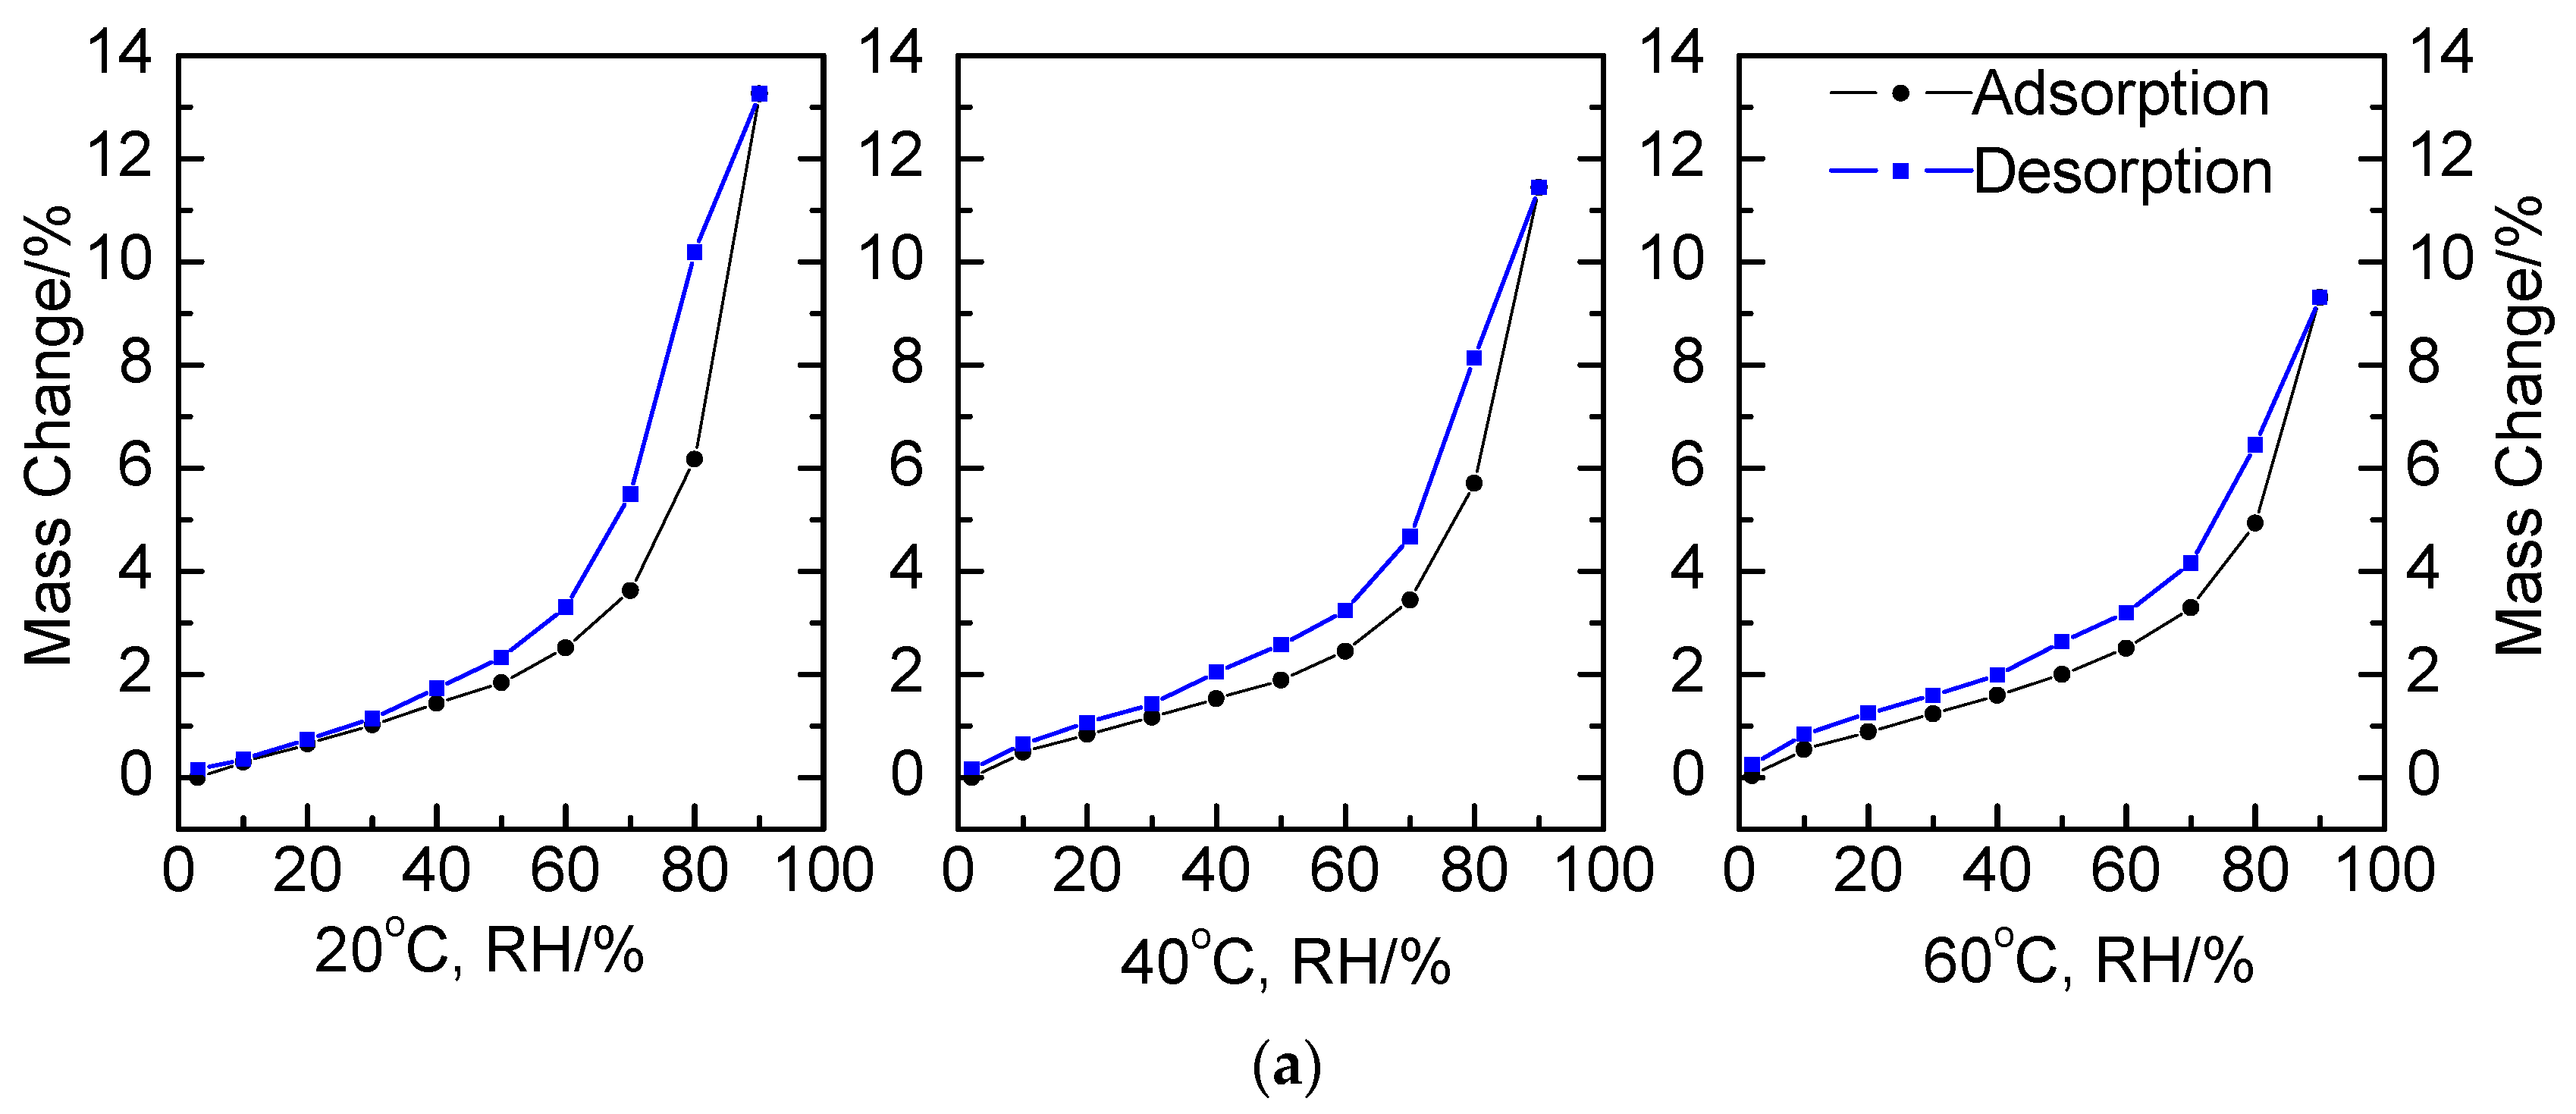
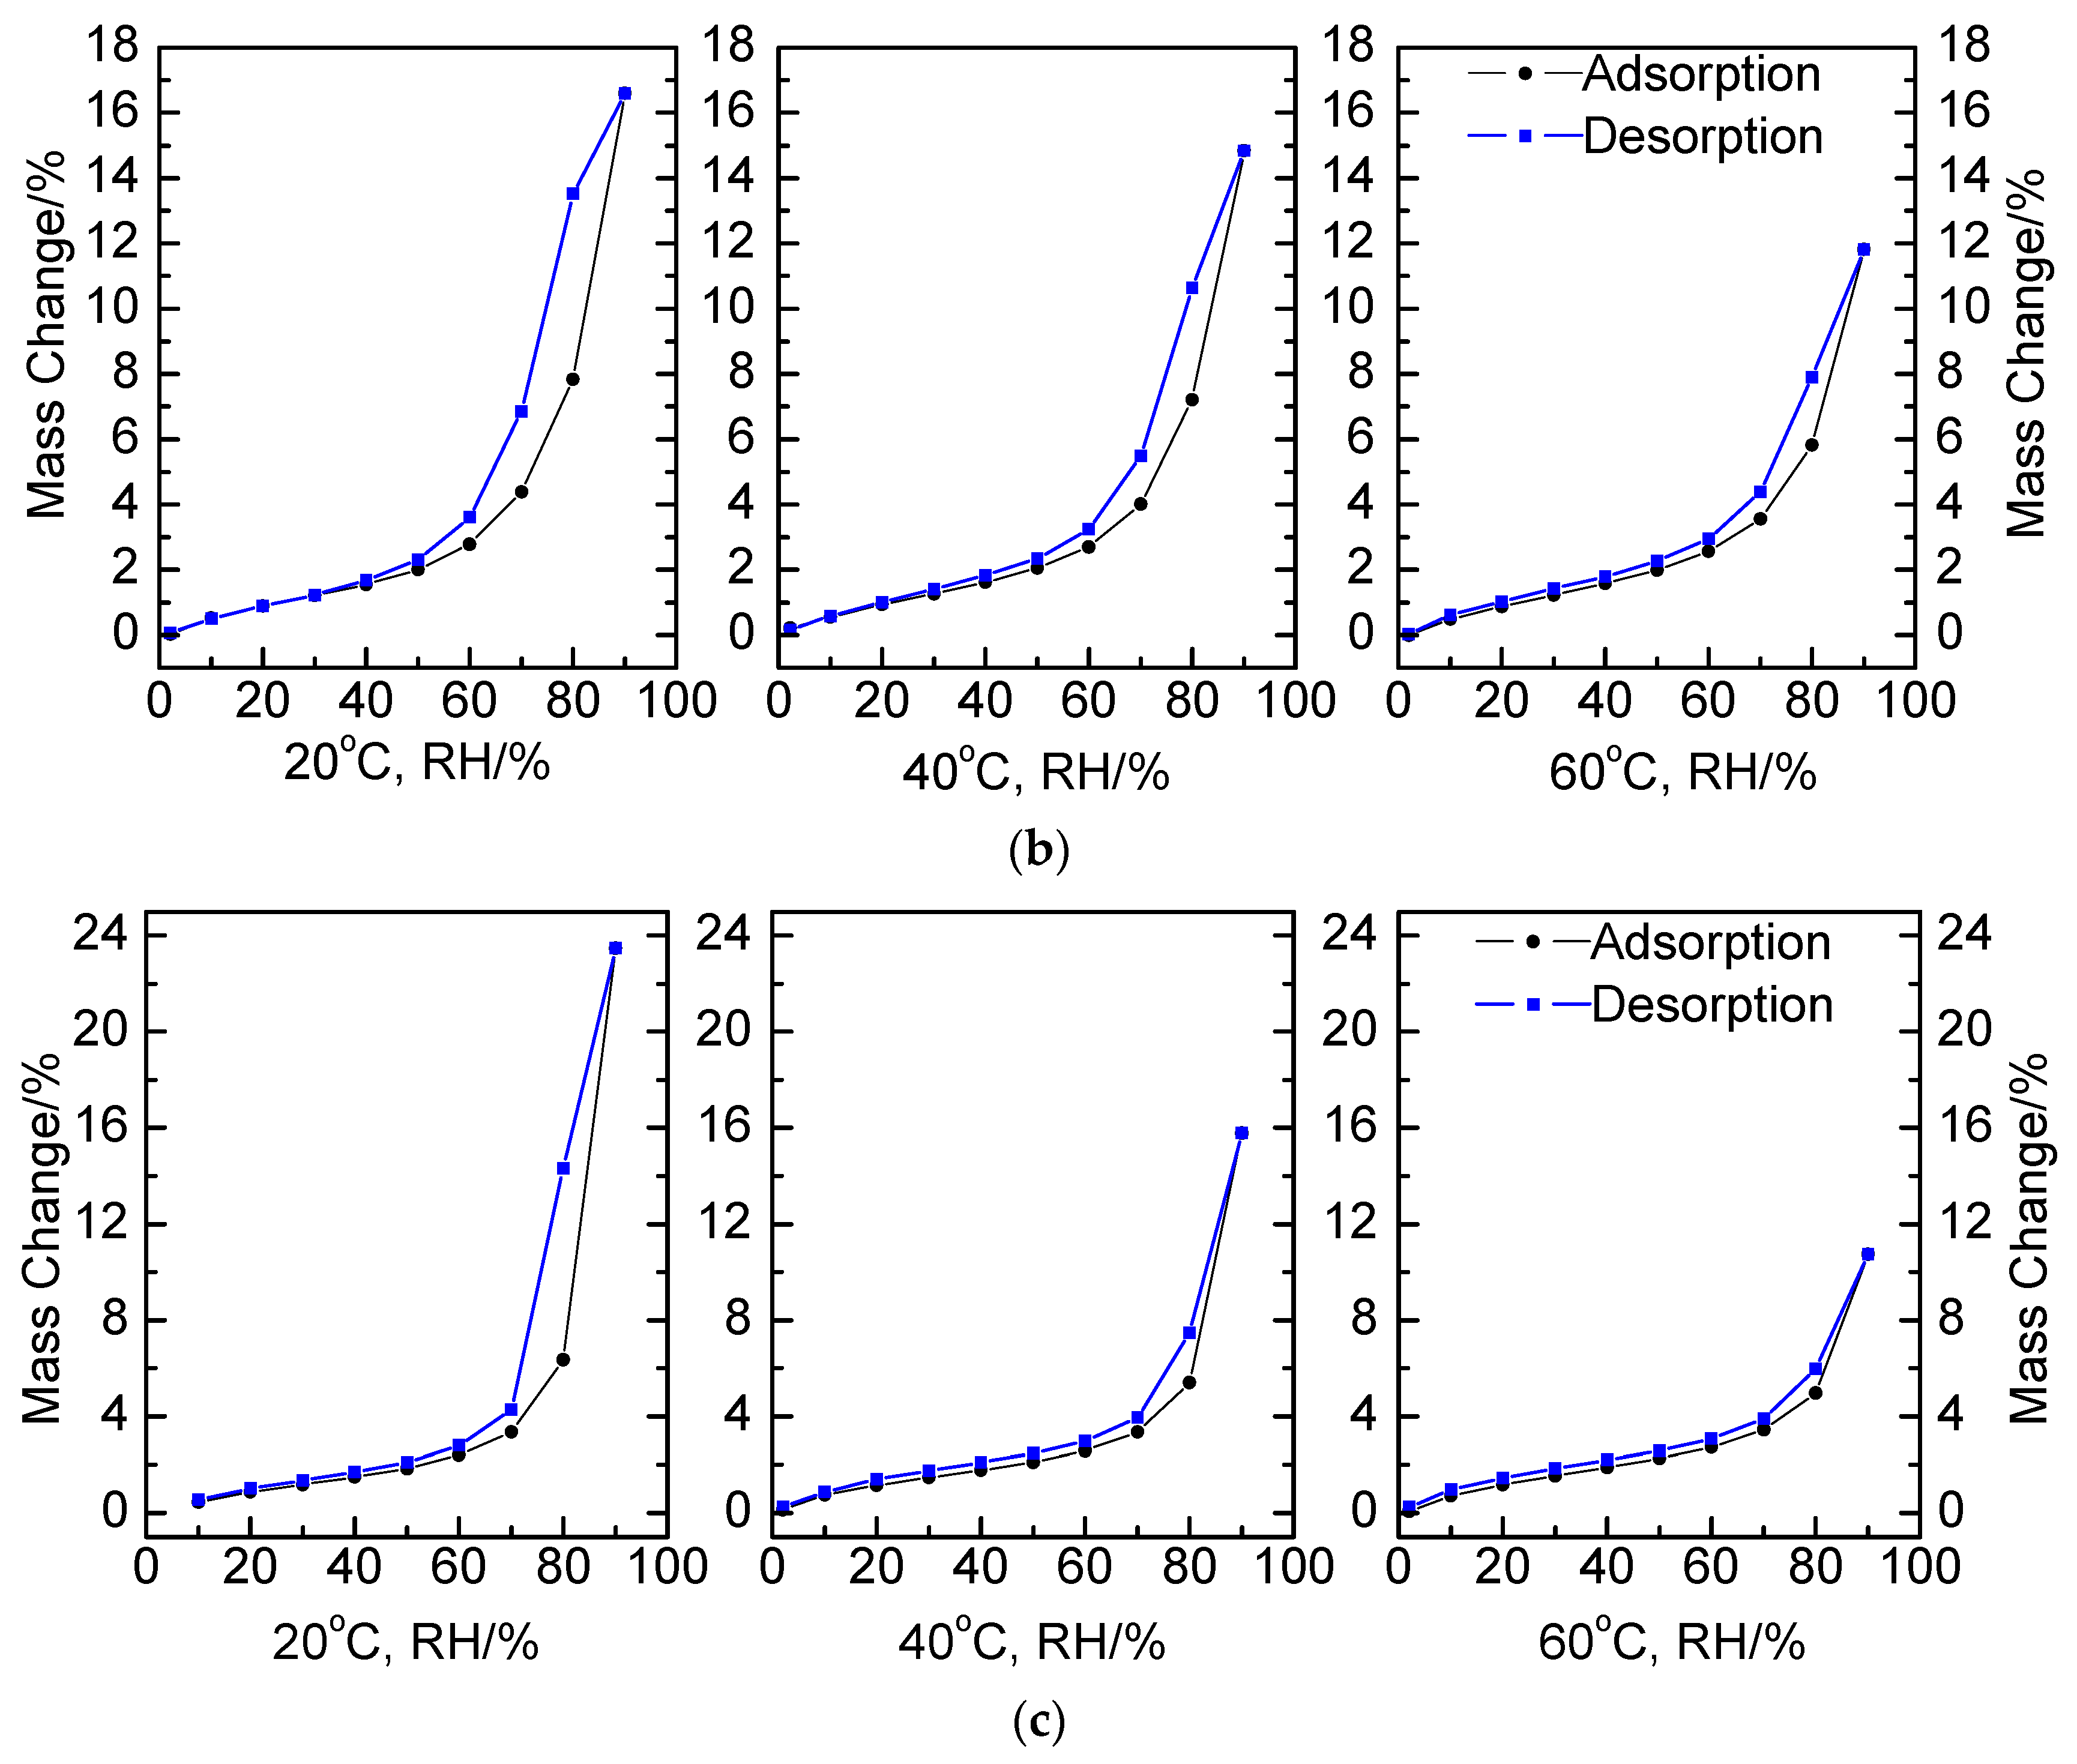
3.2. Water Vapor Adsorption on Fresh SGA
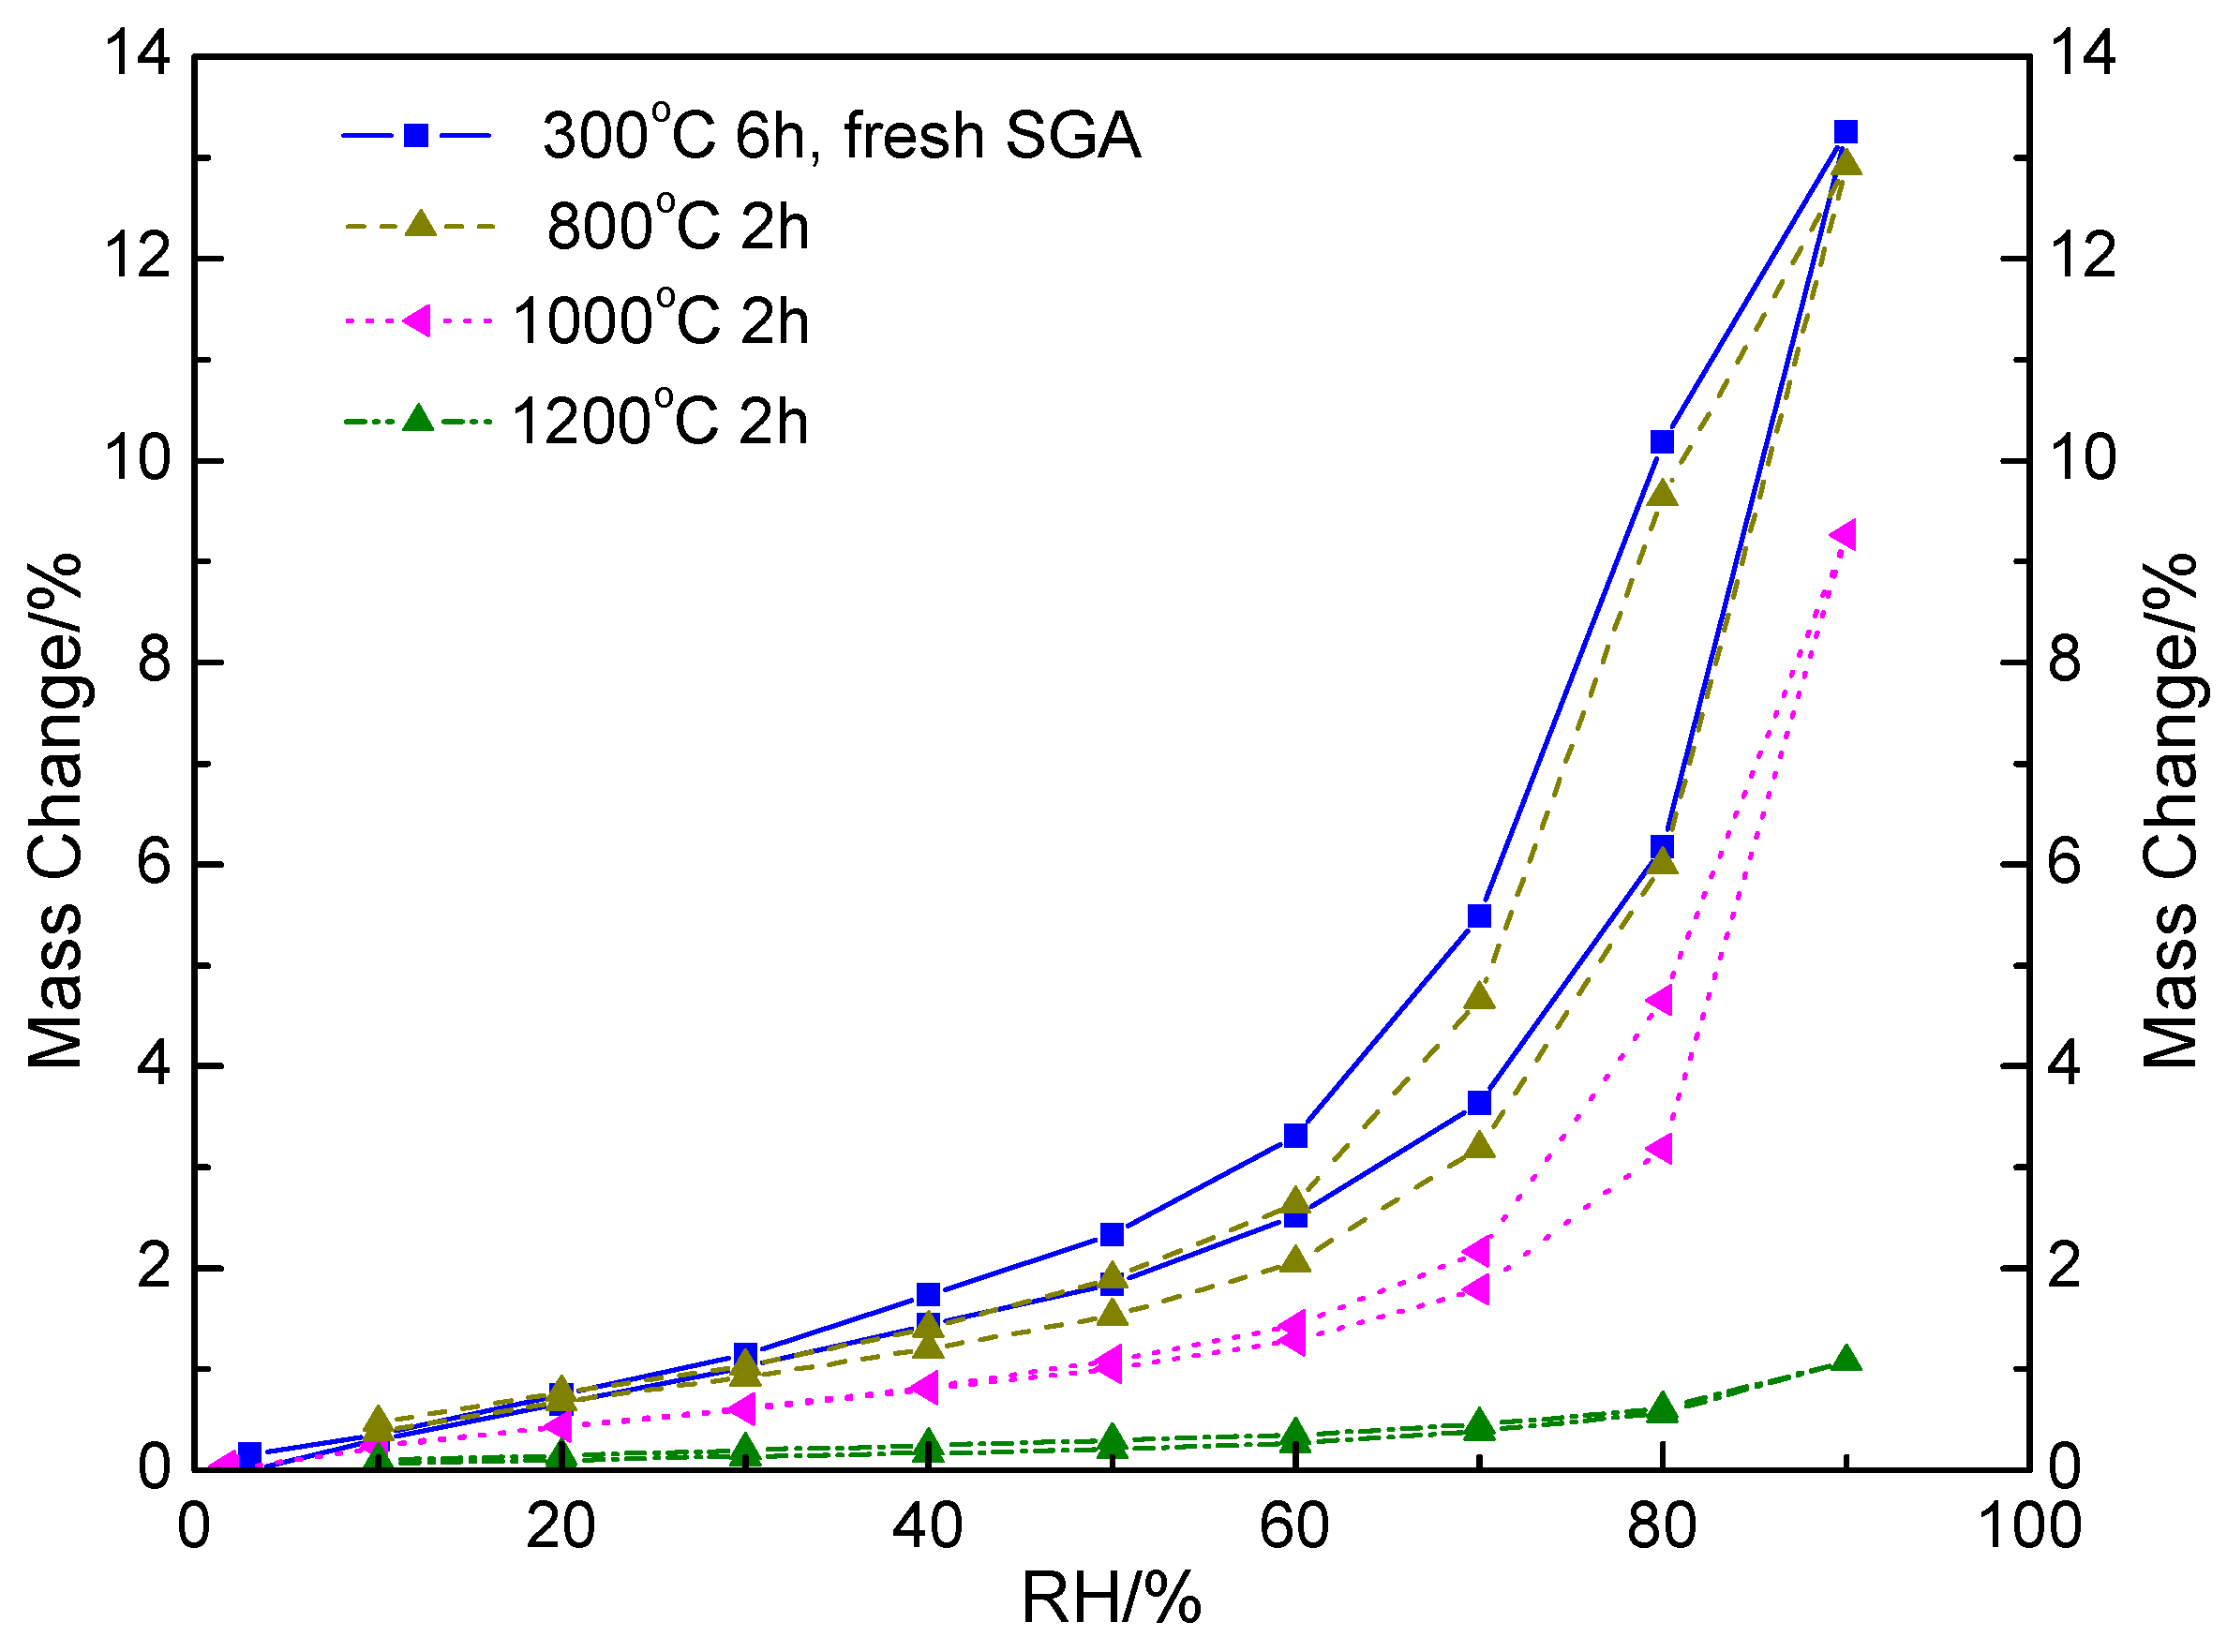
3.3. Water Vapor Adsorption on Calcined SGA
3.4. Calculation of the Adsorption Enthalpy
3.5. Modeling the Adsorption Kinetics of Water Vapor on SGA
4. Conclusions
Author Contributions
Funding
Conflicts of Interest
References
- Perander, L.M. Evolution of Nano-And Microstructure during the calcination of Bayer Gibbsite to Produce Alumina. Ph.D. Thesis, University of Auckland, Auckland, New Zealand, 2010. [Google Scholar]
- Yang, Y.; Hyland, M.M.; Wang, Z.; Seal, C. Modelling HF generation in aluminium reduction cell. Can. Metall. Quart. 2015, 54, 149–160. [Google Scholar] [CrossRef]
- Haupin, W.; Kvande, H. Mathematical model of fluoride evolution from Hall-Héroult cells. Essent. Read. Light Metals: Alum. Reduct. Technol. 1993, 2, 903–909. [Google Scholar]
- Patterson, E.C. Hydrogen Fluoride Emissions from Aluminium Electrolysis Cells. Ph.D. Thesis, University of Auckland, Auckland, New Zealand, 2002. [Google Scholar]
- Gillespie, R.A.; Hyland, M.M.; Metson, J.B. The surface chemistry of secondary alumina from the dry scrubbing process. Essent. Read. Light Metals 2016, 956–961. [Google Scholar]
- Hyland, M.M.; Gillespie, A.R.; Metson, J.B. Predicting moisture content on smelter grade alumina from measurement of the water isotherm. TMS-Light Metals 1997, 113–117. [Google Scholar]
- Yang, Y.; Gao, B.; Wang, Z.; Shi, Z.; Hu, X. Mechanism of dissolution behavior of the secondary Alumina. Metall. Mater. Trans. B 2013, 44, 1296–1303. [Google Scholar]
- Cochran, C.N. Recovery of hydrogen fluoride fumes on alumina in aluminum smelting. Environ. Sci. Technol. 1974, 8, 63–66. [Google Scholar] [CrossRef]
- Hyland, M.M.; Patterson, E.; Welch, B. Alumina structural hydroxyl as a continuous source of HF. Essent. Read. Light Metals 2016, 936–941. [Google Scholar]
- Sing, K. Reporting physisorption data for gas/solid systems with special reference to the determination of surface area and porosity. Pure Appl. Chem. 1985, 57, 603–619. [Google Scholar] [CrossRef]
- Osen, K.S.; Aarhaug, T.A.; Solheim, A.; Skybakmoen, E.; Sommerseth, C. HF measurements inside an aluminium electrolysis cell. TMS-Light Metals 2011, 259–268. [Google Scholar]
- Sommerseth, C. HF Formation upon Addition of Different Industrial Aluminas to Cryolitic Baths. Master’s Thesis, Norwegian University of Science and Technology, Trondheim, Norway, 2011. [Google Scholar]
- Haverkamp, R.G.; Metson, J.B.; Hyland, M.M.; Welch, B.J. Adsorption of hydrogen fluoride on alumina. Surf. Interface Anal. 1992, 19, 139–144. [Google Scholar] [CrossRef]
- McIntosh, G.J.; Agbenyegah, G.E.K.; Hyland, M.M.; Metson, J.B. The pivotal role of alumina pore structure in HF capture and fluoride return in aluminum reduction. JOM 2016, 68, 2463–2471. [Google Scholar] [CrossRef] [Green Version]


| Sample | Pre-Treatment | Tests Carried Out | Remarks |
|---|---|---|---|
| #1 | 300 °C, 6 h | Water vapor adsorption tests at 20 °C, 40 °C, and 60 °C, respectively; Brunauer, Emmett and Teller (B.E.T.) surface area, Pore size distribution, Particle size distribution, Loss on ignition (LOI 300–1000). | Sampled from a Chinese aluminum smelter |
| #2 | 300 °C, 6 h | Sampled from an Australian aluminum smelter | |
| #3 | 300 °C, 6 h | Manufactured from coal fly ash | |
| #1 | 800 °C, 2 h | Water vapor adsorption tests at 20 °C; B.E.T. surface area, Pore size distribution. | Pre-calcined Chinese alumina, Sample #1 |
| 1000 °C, 2 h | |||
| 1200 °C, 2 h |
| Testing Item | Parameters | Sample #1 | Sample #2 | Sample #3 |
|---|---|---|---|---|
| Specific surface area | B.E.T. surface area/m2 g−1 | 68.6 | 74.0 | 91.5 |
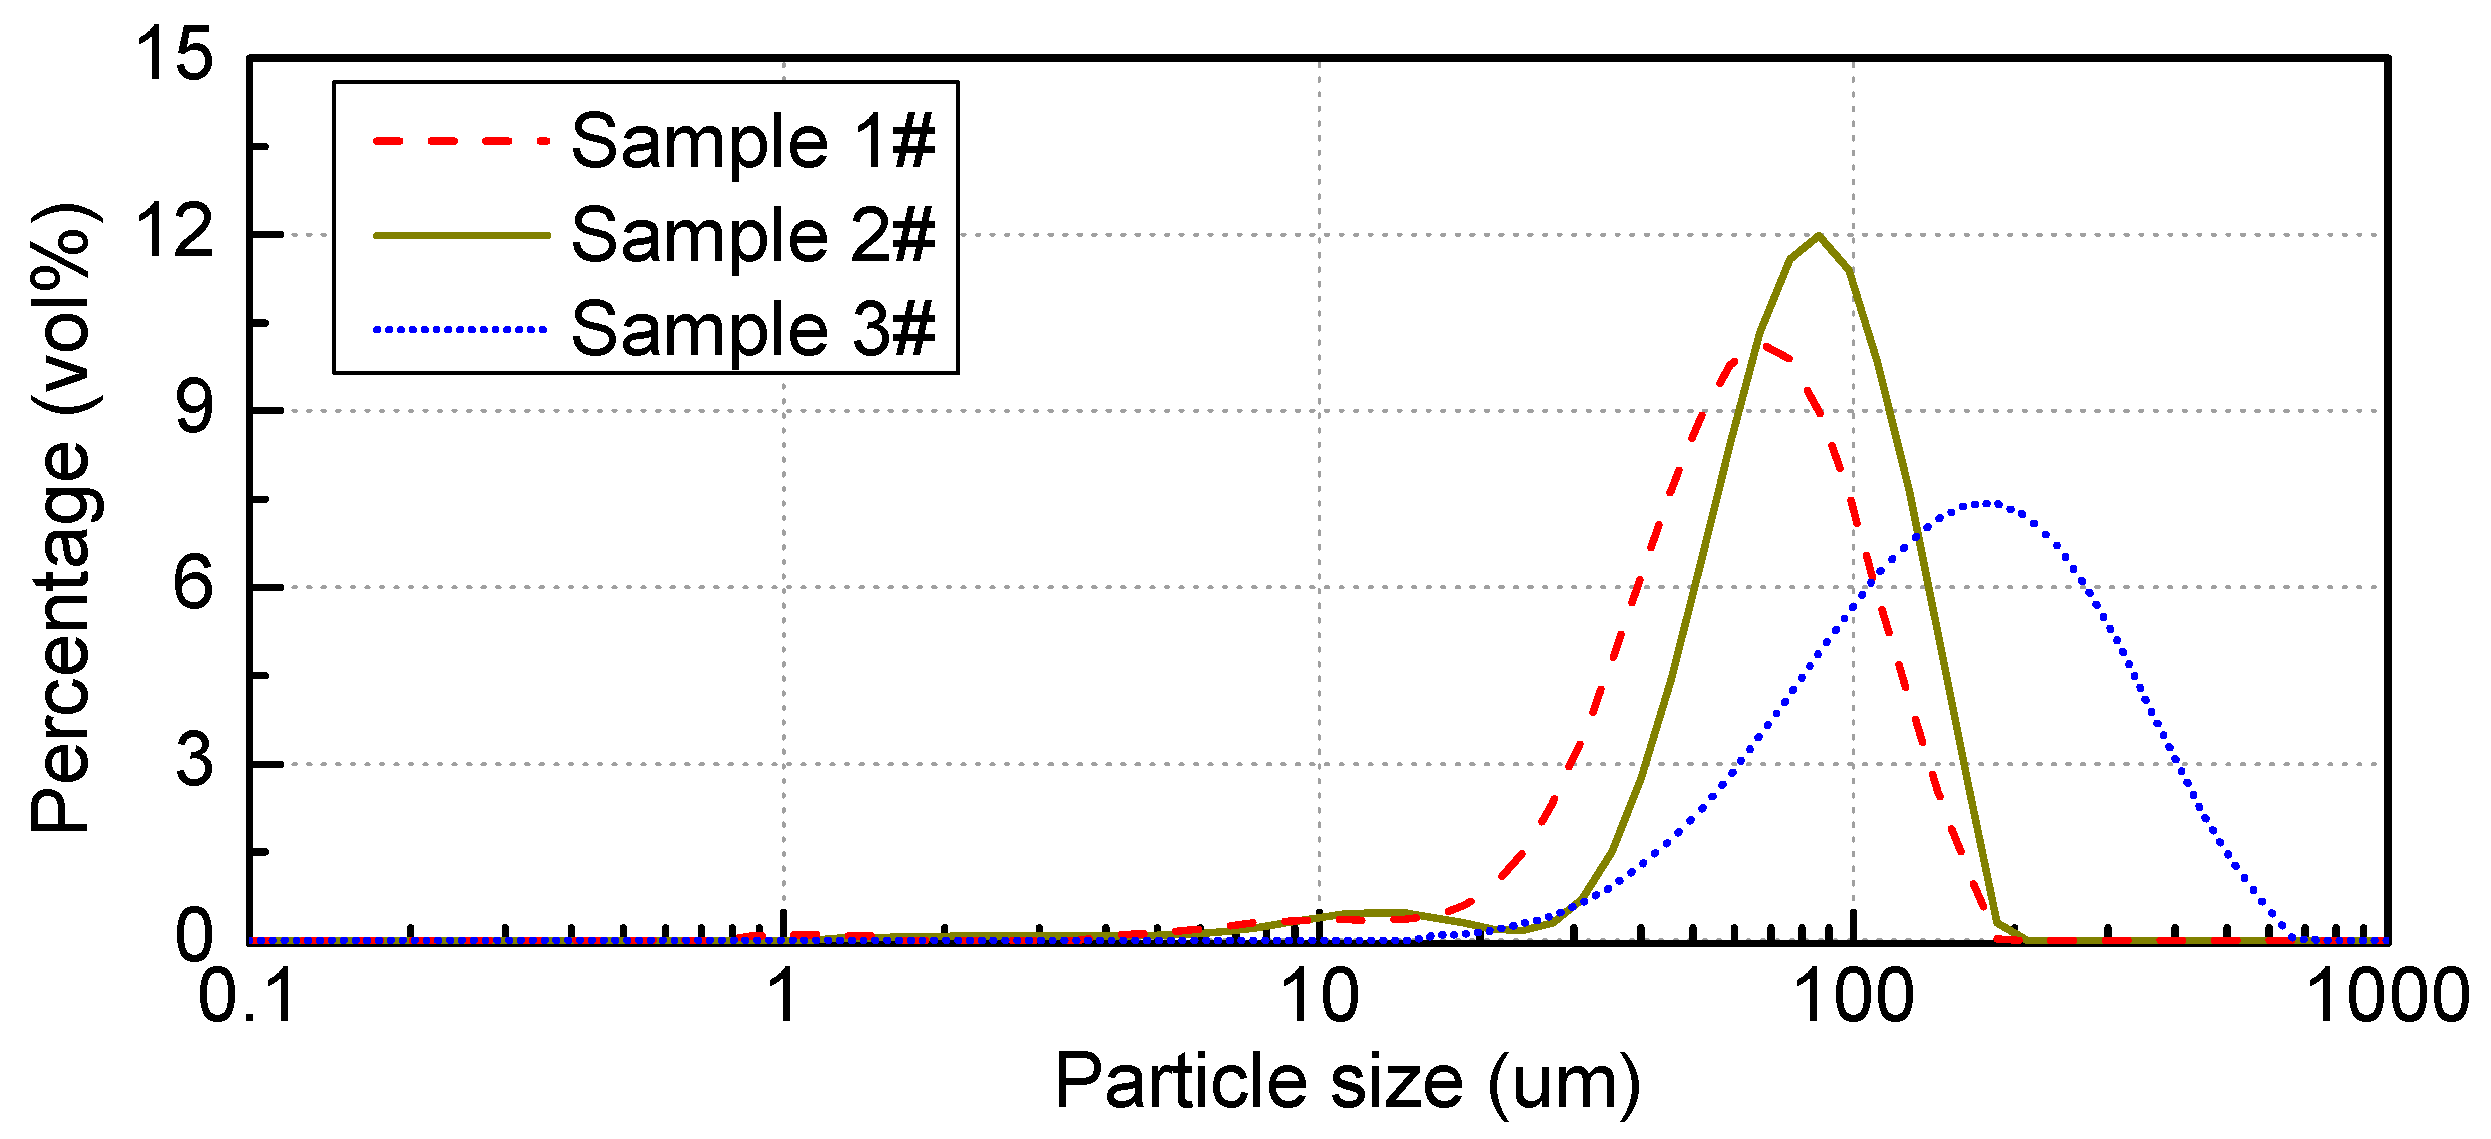
| Particle size distribution | D(10)/μm | 46.2 | 32.4 | 65.1 |
| D(50)/μm | 85.5 | 67.2 | 167 | |
| D(90)/μm | 140 | 121 | 365 | |
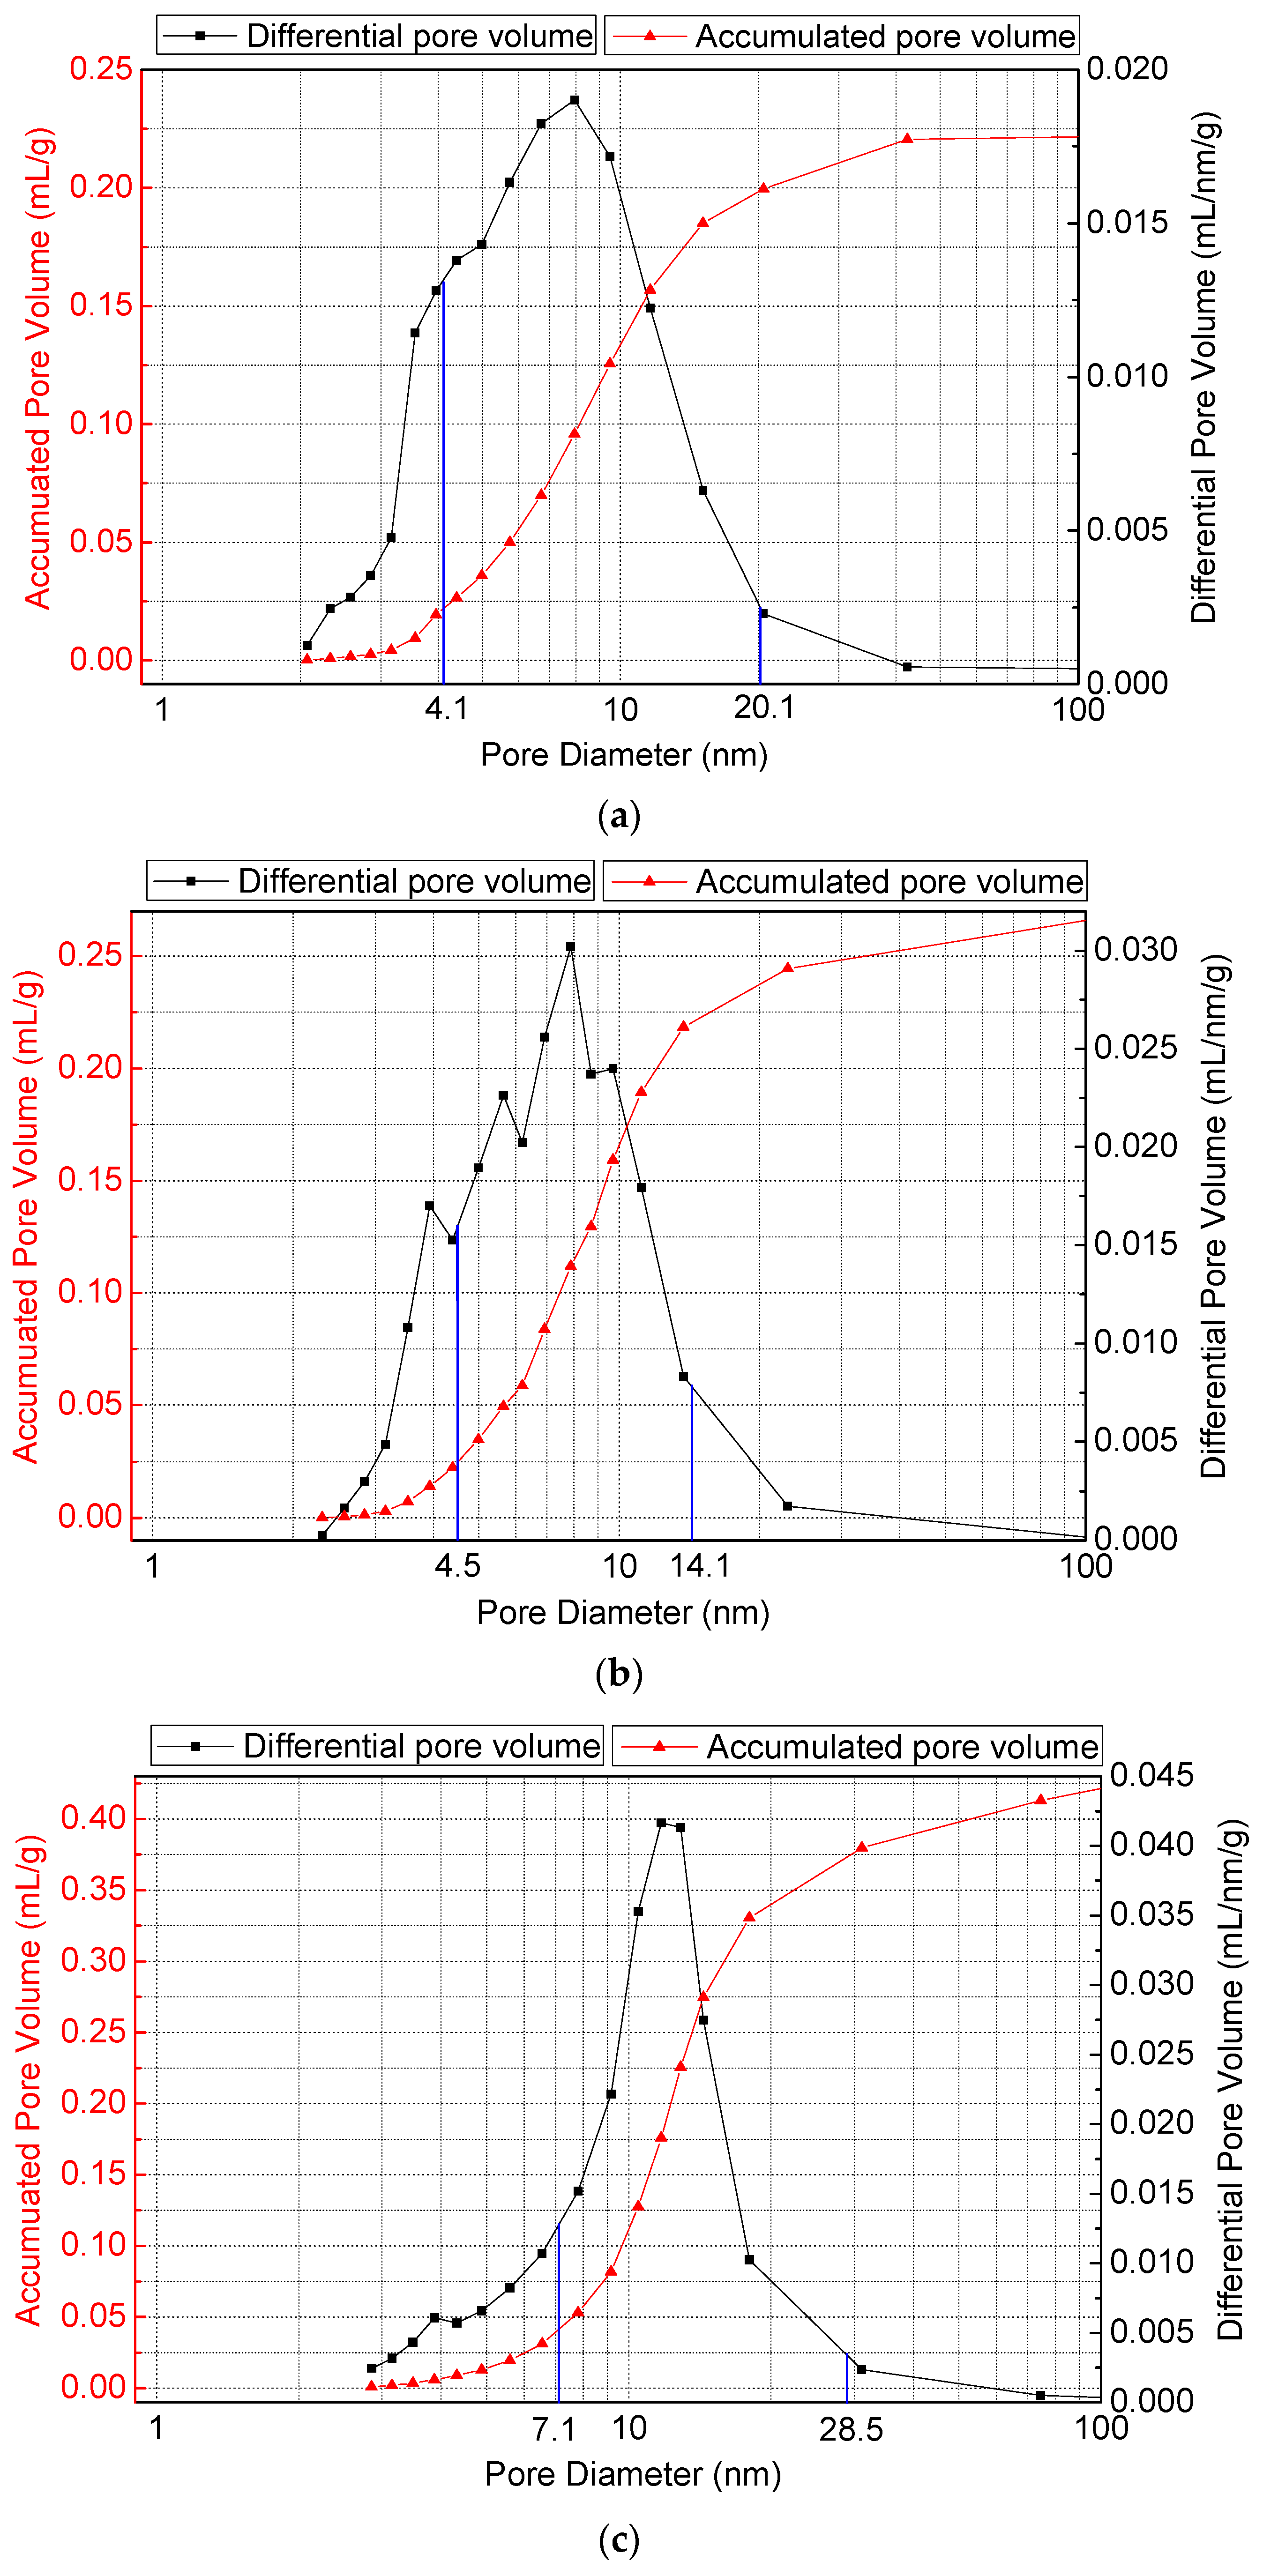
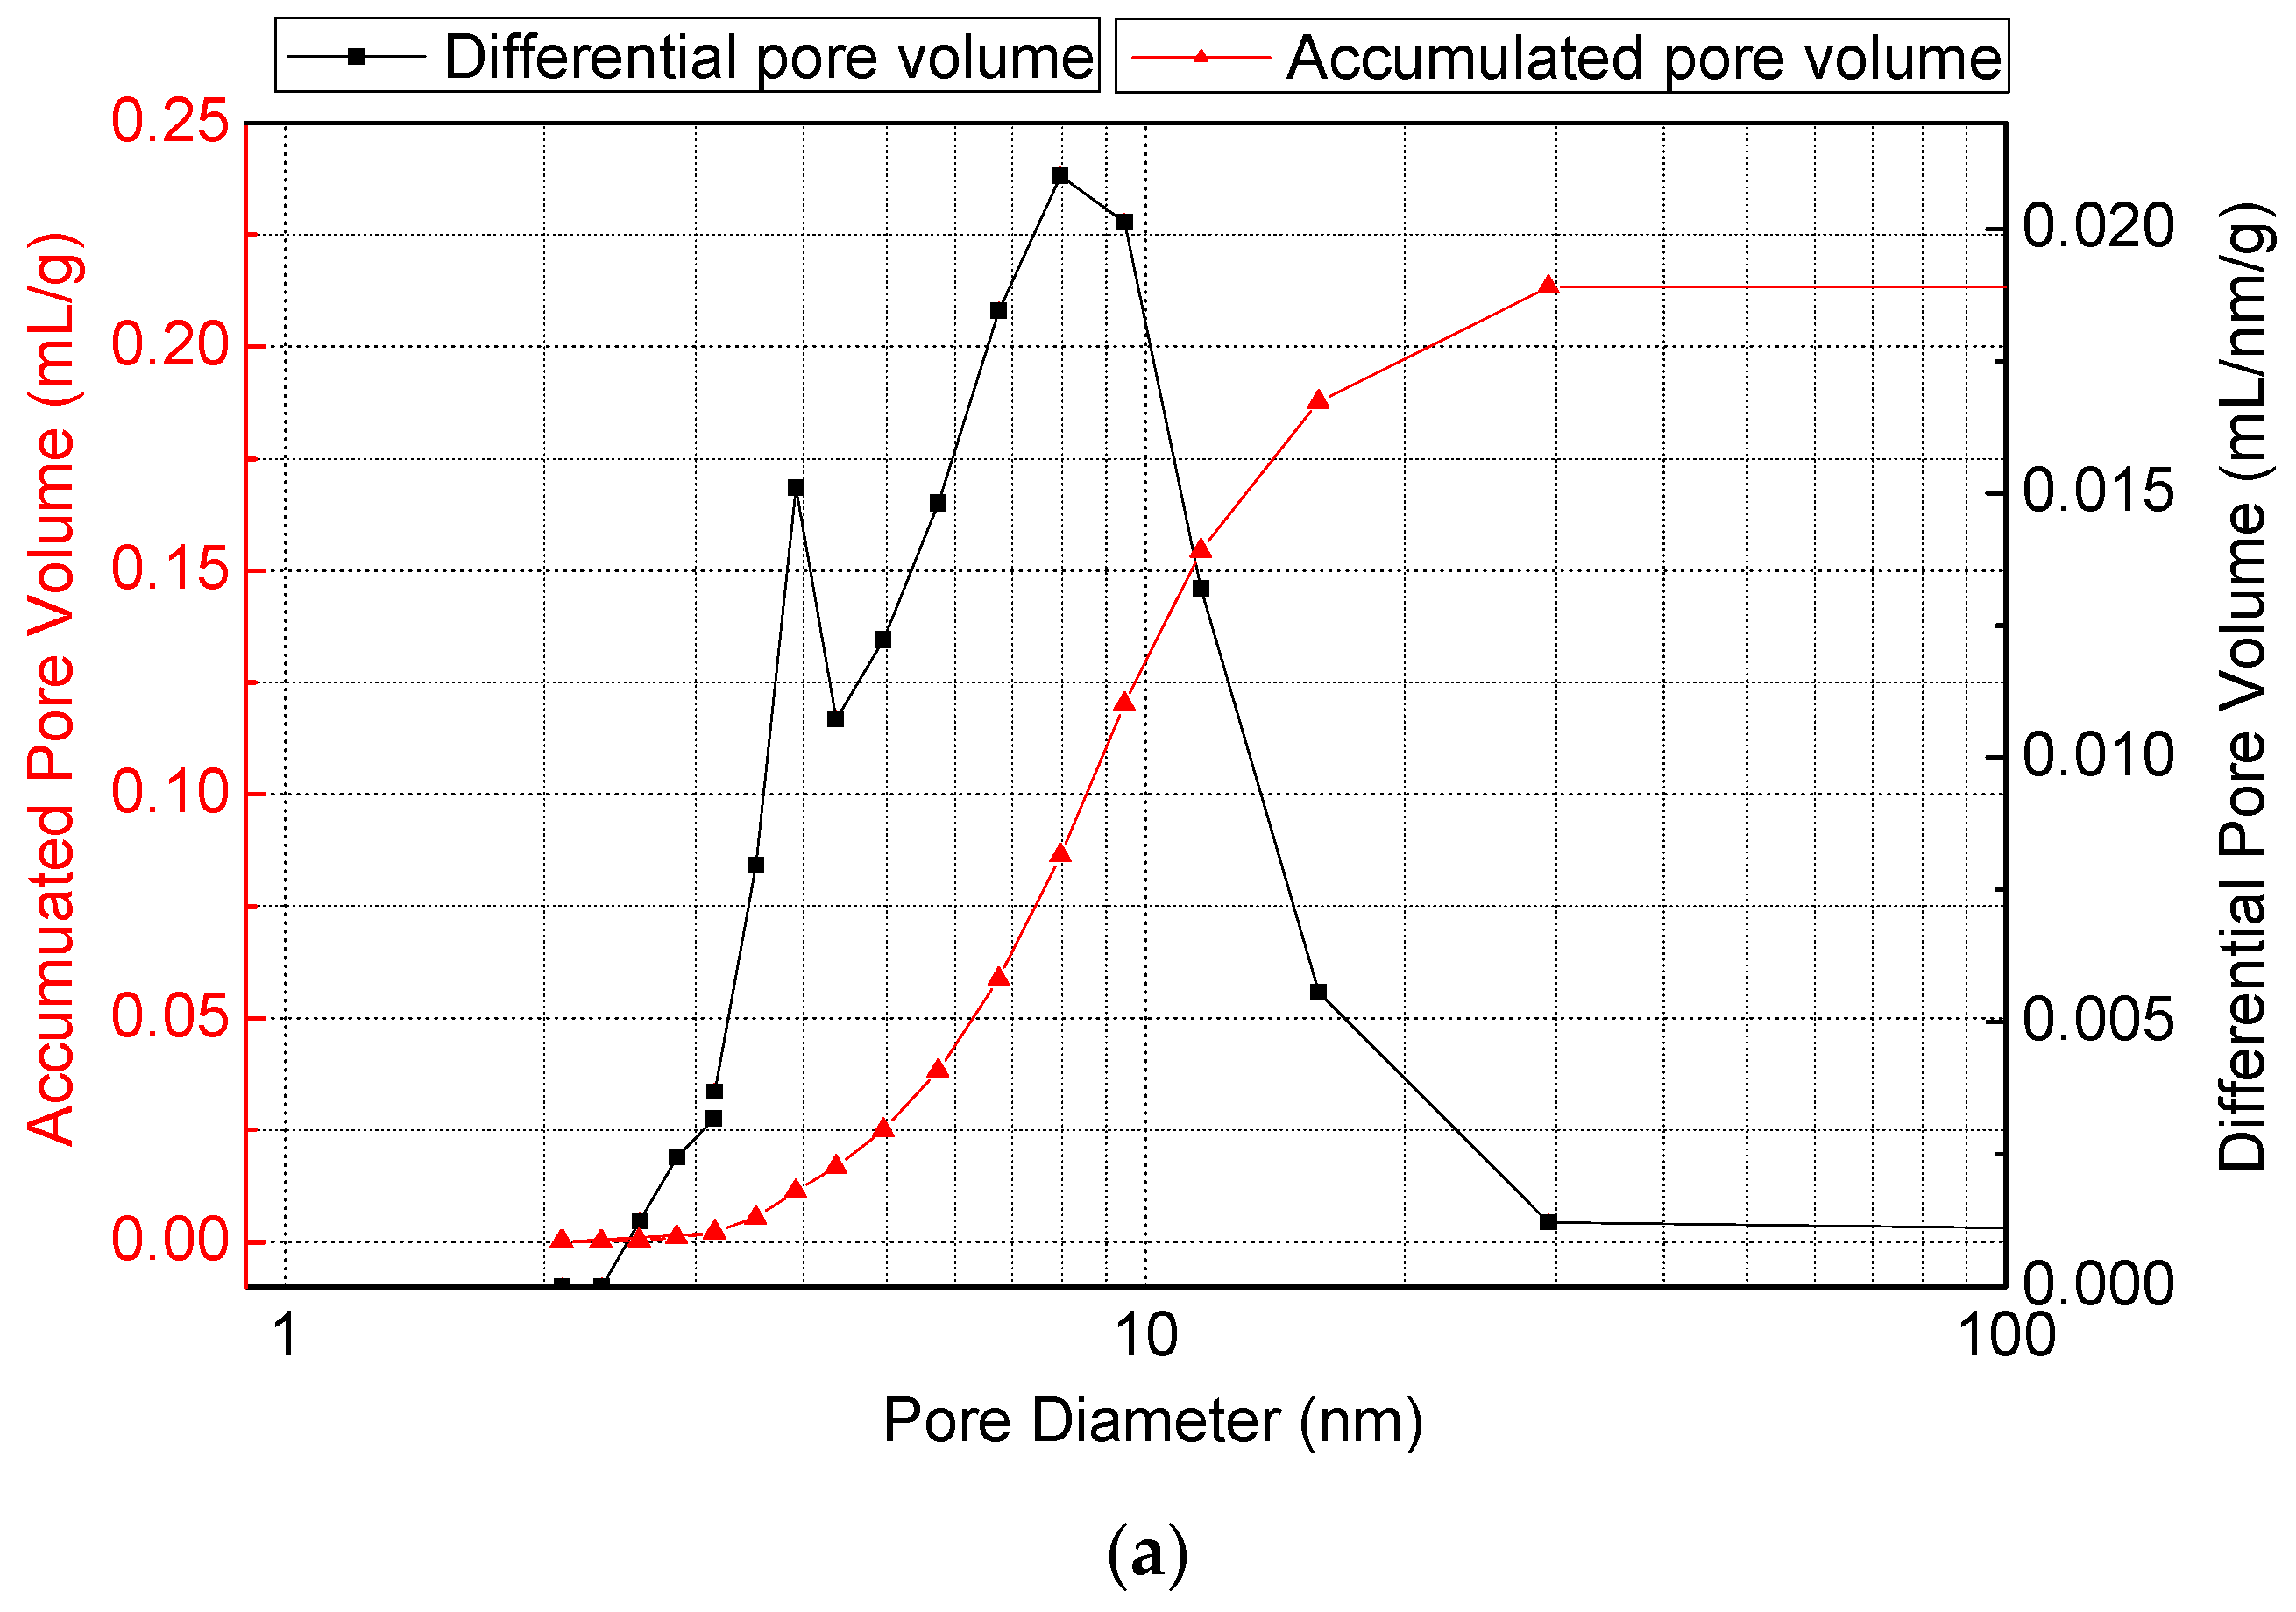
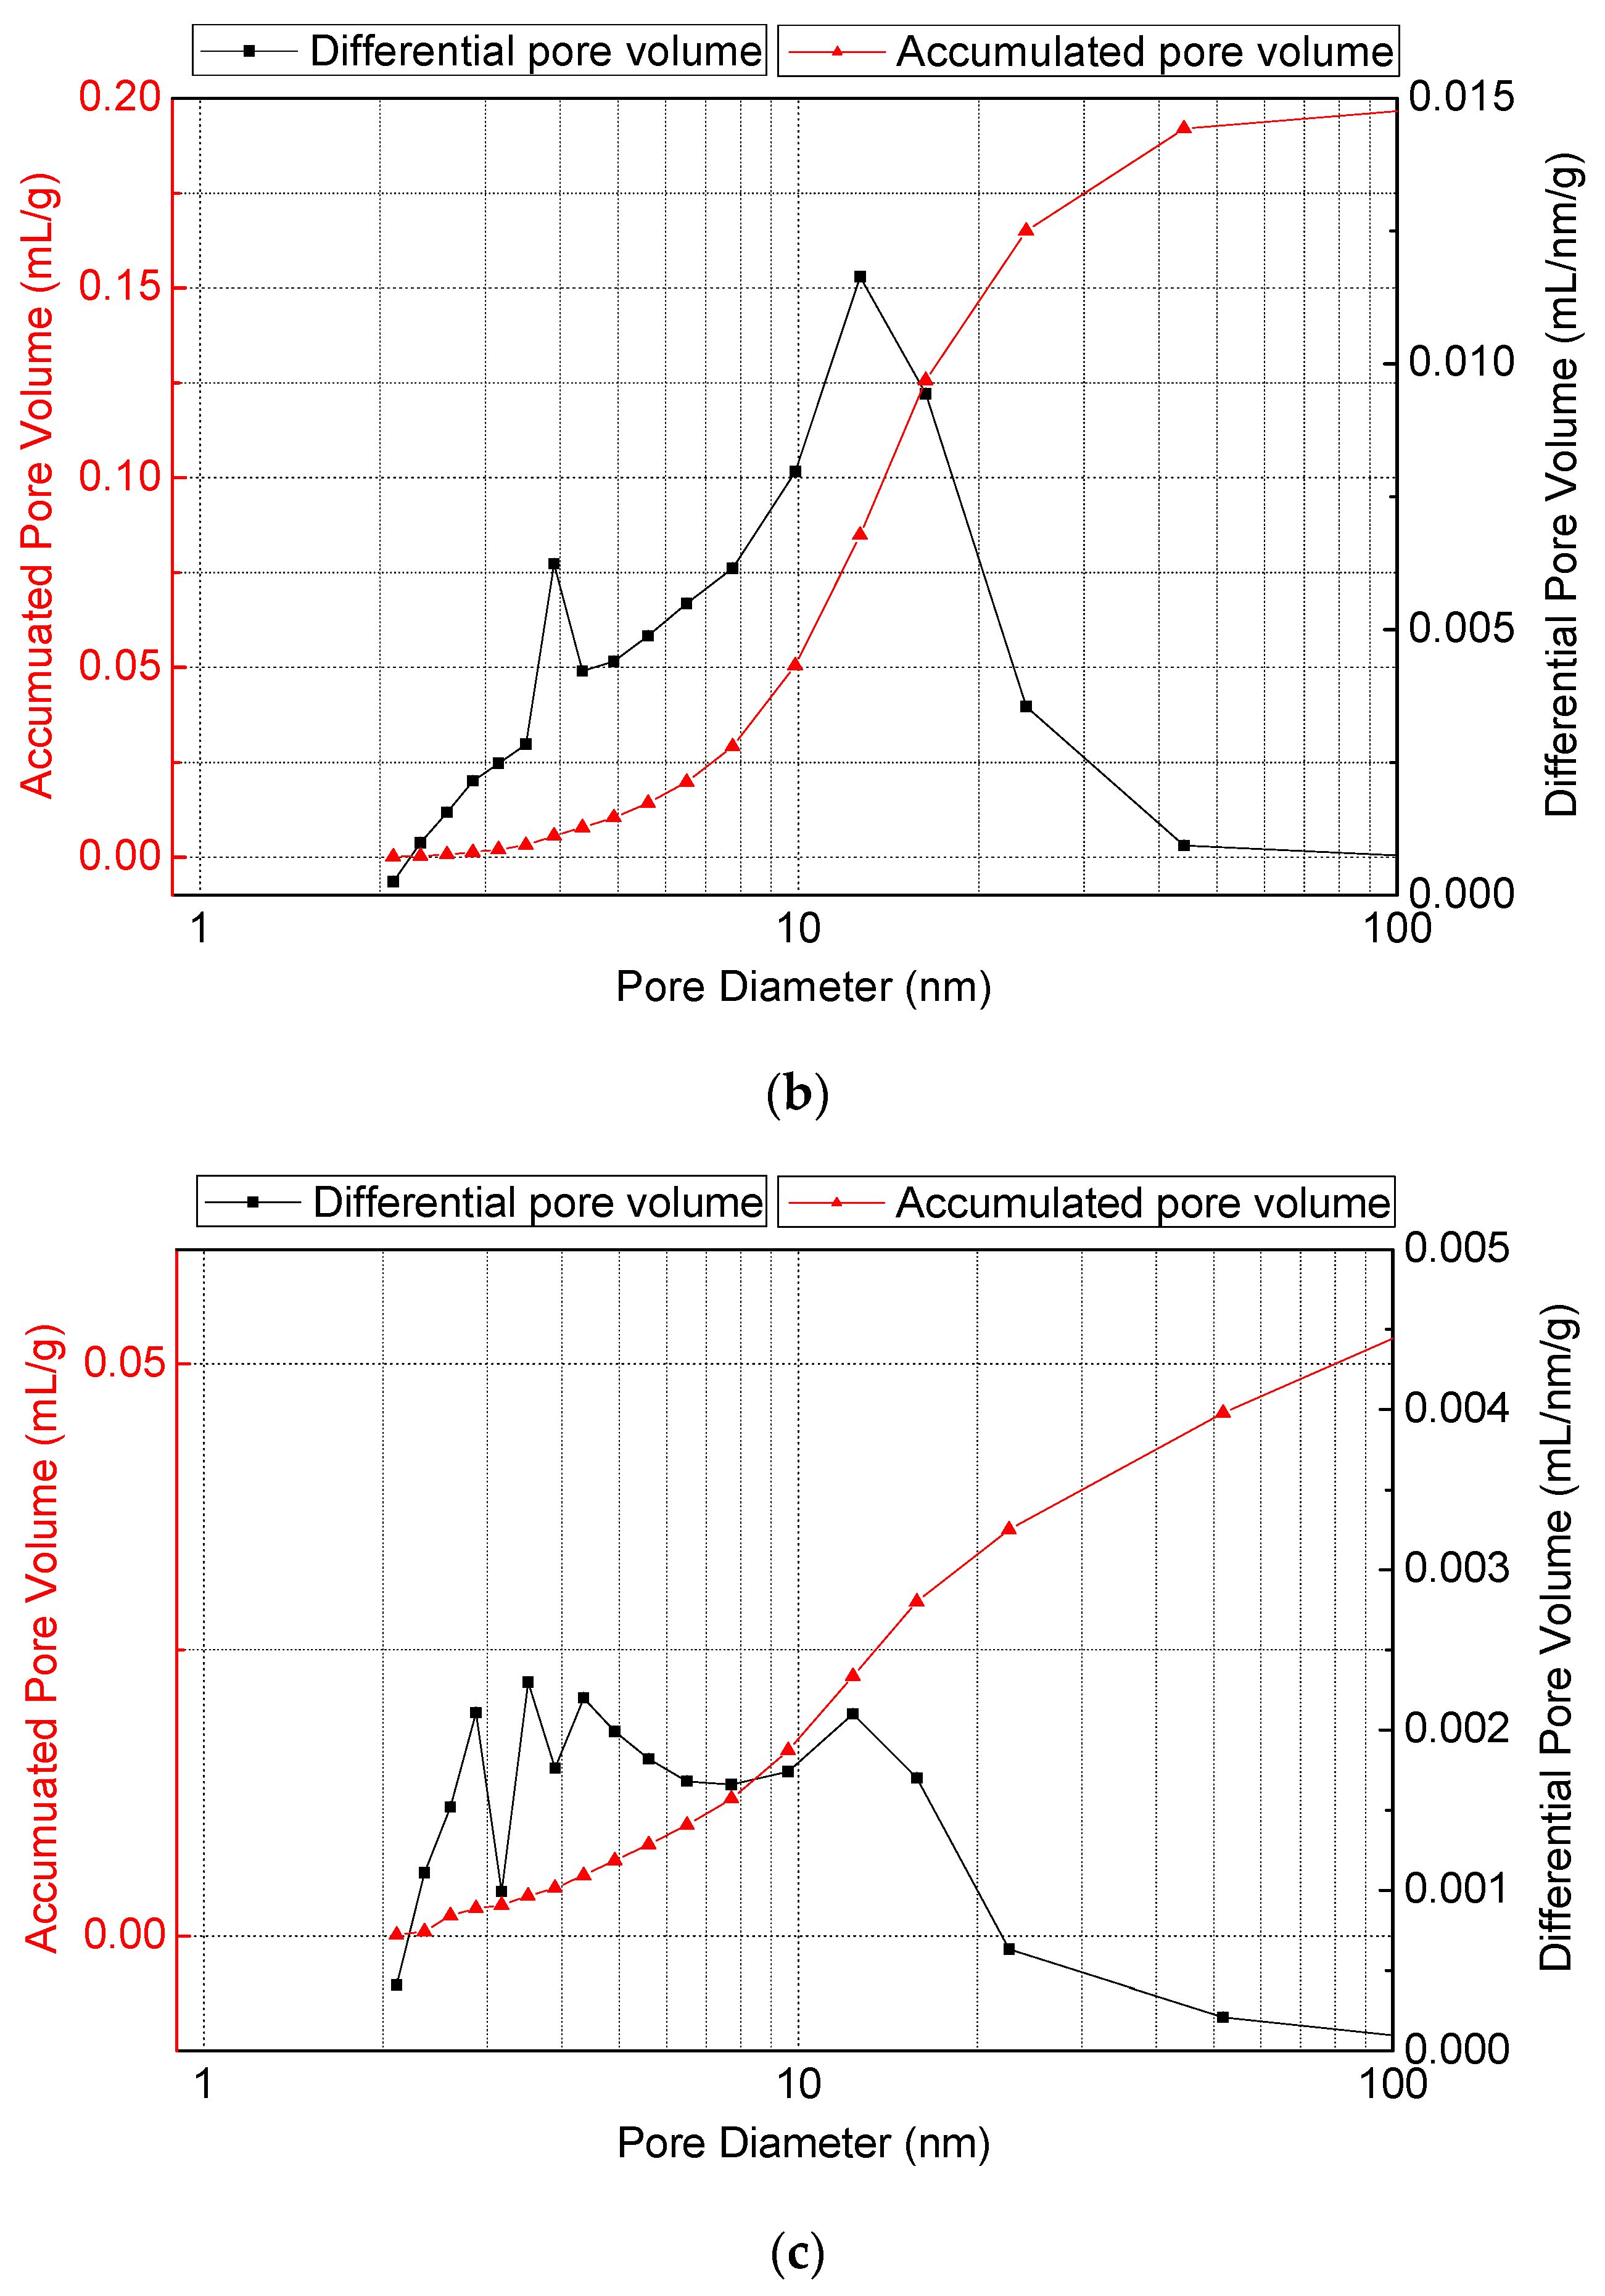
| Pore size distribution | Mean pore size/nm | 8.70 | 8.69 | 13.31 |
| Most probable pore size/nm | 7.68 | 7.41 | 11.12 | |
| Total pore volume/mL g−1 | 0.2426 | 0.2683 | 0.4107 | |
| Hydroxyl content | LOI (300–1000)/% | 0.56 | 0.66 | 2.35 |
| Sample | Total Pore Volume/mL g−1 | B.E.T. SA/m2 g−1 | P(10)/nm* | P(90)/nm* |
|---|---|---|---|---|
| #1-Bayer | 0.2206 | 68.6 | 4.1 | 20.1 |
| #2-Bayer | 0.2444 | 74.0 | 4.5 | 14.1 |
| #3 | 0.4131 | 91.5 | 7.1 | 28.5 |
| Temperature/°C | Max Equilibrium Adsorption Capacity | ||
|---|---|---|---|
| Sample #1 | Sample #2 | Sample #3 | |
| 20 | 7.3664 | 9.2188 | 13.0421 |
| 40 | 6.3536 | 8.2413 | 8.7694 |
| 60 | 5.1674 | 6.5675 | 5.9639 |
| Treatment Condition | B.E.T. SA /m2·g−1 | Total Pore Volume/mL g−1 | Mean Pore Size/nm | Most Probable Pore Size/nm |
|---|---|---|---|---|
| 300 °C, 6 h | 68.6 | 0.2426 | 8.70 | 7.68 |
| 800 °C, 2 h | 61.3 | 0.2184 | 8.75 | 7.30 |
| 1000 °C, 2 h | 40.9 | 0.2089 | 14.24 | 11.20 |
| 1200 °C, 2 h | 11.7 | 0.0533 | 12.41 | 2.47 |
| Testing Sample | Adsorption Temperature/°C | Adsorption Enthalpy/kJ mol−1 | Linear Fitting r2 |
|---|---|---|---|
| Sample #1 | 20 | 4.43 | 0.965 |
| 40 | 6.68 | 0.991 | |
| 60 | 9.49 | 0.980 | |
| Sample #1, 800 °C, 2 h | 20 | 5.96 | 0.970 |
| Sample #1, 1000 °C, 2 h | 6.64 | 0.996 | |
| Sample #1, 1200 °C, 2 h | 8.10 | 0.991 | |
| Sample #2 | 20 | 6.45 | 0.993 |
| 40 | 6.87 | 0.989 | |
| 60 | 6.96 | 0.994 | |
| Sample #3 | 20 | 7.34 | 0.999 |
| 40 | 10.59 | 0.991 | |
| 60 | 13.01 | 0.982 |
| Sample #1 | |||||
|---|---|---|---|---|---|
| Sample and Adsorption Temperature | RH /% | k2 | Calculated qe /mg‧g−1 | Tested qe /mg‧g−1 | Linear r2 |
| Sample #1, 20 °C | 70 | 0.0171 | 37.31 | 36.32 | 0.999 |
| 80 | 2.863 × 10⁻³ | 65.79 | 61.76 | 0.996 | |
| 90 | 5.777 × 10⁻⁴ | 138.89 | 132.53 | 0.998 | |
| Sample #1, 40 °C | 70 | 0.0683 | 34.45 | 34.36 | 0.999 |
| 80 | 0.0103 | 57.64 | 57.04 | 0.999 | |
| 90 | 1.583 × 10⁻³ | 117.37 | 114.36 | 0.999 | |
| Sample #1, 60 °C | 70 | 0.198 | 32.99 | 32.97 | 0.999 |
| 80 | 0.0873 | 49.36 | 49.29 | 0.999 | |
| 90 | 0.0175 | 93.28 | 93.01 | 0.999 | |
| 800 °C 2 h calcined sample #1, 20 °C | 70 | 0.0119 | 32.82 | 31.90 | 0.999 |
| 80 | 1.858 × 10⁻³ | 63.25 | 59.99 | 0.998 | |
| 90 | 3.384 × 10⁻⁴ | 138.89 | 128.85 | 0.998 | |
| 1000 °C 2 h calcined sample #1, 20 °C | 70 | 0.1317 | 18.02 | 17.94 | 0.999 |
| 80 | 7.994 × 10⁻³ | 32.82 | 31.84 | 0.999 | |
| 90 | 3.156 × 10⁻⁴ | 101.52 | 92.58 | 0.996 | |
| 1200 °C 2 h calcined sample #1, 20 °C | 70 | 0.5887 | 3.85 | 3.88 | 0.999 |
| 80 | 0.1751 | 5.78 | 5.71 | 0.999 | |
| 90 | 0.0419 | 10.74 | 10.78 | 0.999 | |
© 2020 by the authors. Licensee MDPI, Basel, Switzerland. This article is an open access article distributed under the terms and conditions of the Creative Commons Attribution (CC BY) license (http://creativecommons.org/licenses/by/4.0/).
Share and Cite
Yang, Y.; Tao, W.; Liu, W.; Hu, X.; Wang, Z.; Shi, Z.; Shu, X. The Adsorption Behavior of Moisture on Smelter Grade Alumina during Transportation and Storage—for Primary Aluminum Production. Metals 2020, 10, 325. https://doi.org/10.3390/met10030325
Yang Y, Tao W, Liu W, Hu X, Wang Z, Shi Z, Shu X. The Adsorption Behavior of Moisture on Smelter Grade Alumina during Transportation and Storage—for Primary Aluminum Production. Metals. 2020; 10(3):325. https://doi.org/10.3390/met10030325
Chicago/Turabian StyleYang, Youjian, Wenju Tao, Weicheng Liu, Xianwei Hu, Zhaowen Wang, Zhongning Shi, and Xin Shu. 2020. "The Adsorption Behavior of Moisture on Smelter Grade Alumina during Transportation and Storage—for Primary Aluminum Production" Metals 10, no. 3: 325. https://doi.org/10.3390/met10030325