Microstructures and Mechanical Properties of Precipitation-Hardenable Magnesium–Silver–Calcium Alloy Sheets

Abstract
:1. Introduction
2. Materials and Methods
3. Results
4. Discussion
5. Conclusions
Author Contributions
Funding
Conflicts of Interest
References
- Hirsch, J.; Al-Samman, T. Superior light metals by texture engineering: Optimized aluminum and magnesium alloys for automotive applications. Acta Mater. 2013, 61, 818–843. [Google Scholar] [CrossRef]
- Joost, W.J.; Krajewski, P.E. Towards magnesium alloys for high-volume automotive applications. Scr. Mater. 2017, 128, 107–112. [Google Scholar] [CrossRef]
- Letzig, D.; Bohlen, J.; Kurz, G.; Victoria-Hernandez, J.; Hoppe, R.; Yi, S. Development of magnesium sheets. In Magnesium Technology 2018; The Minerals, Metals and Materials Series; Springer International Publishing: Berlin/Heidelberg, Germany, 2018; Volume F7, pp. 355–360. [Google Scholar]
- Kim, N.J. Magnesium sheet alloys: Viable alternatives to steels? Mater. Sci. Technol. 2014, 30, 1925–1928. [Google Scholar] [CrossRef]
- Nie, J.-F. Precipitation and hardening in magnesium alloys. Metall. Mater. Trans. A 2012, 43, 3891–3939. [Google Scholar] [CrossRef] [Green Version]
- Hono, K.; Mendis, C.L.; Sasaki, T.T.; Oh-ishi, K. Towards the development of heat-treatable high-strength wrought Mg alloys. Scr. Mater. 2010, 63, 710–715. [Google Scholar] [CrossRef]
- Homma, T.; Kunito, N.; Kamado, S. Fabrication of extraordinary high-strength magnesium alloy by hot extrusion. Scr. Mater. 2009, 61, 644–647. [Google Scholar] [CrossRef]
- Mendis, C.L.; Bae, J.H.; Kim, N.J.; Hono, K. Microstructures and tensile properties of a twin roll cast and heat-treated Mg–2.4Zn–0.1Ag–0.1Ca–0.1Zr alloy. Scr. Mater. 2011, 64, 335–338. [Google Scholar] [CrossRef]
- Nakata, T.; Mezaki, T.; Ajima, R.; Xu, C.; Oh-Ishi, K.; Shimizu, K.; Hanaki, S.; Sasaki, T.T.; Hono, K.; Kamado, S. High-speed extrusion of heat-treatable Mg-Al-Ca-Mn dilute alloy. Scr. Mater. 2015, 101, 28–31. [Google Scholar] [CrossRef] [Green Version]
- Nakata, T.; Xu, C.; Ajima, R.; Shimizu, K.; Hanaki, S.; Sasaki, T.T.; Ma, L.; Hono, K.; Kamado, S. Strong and ductile age-hardening Mg-Al-Ca-Mn alloy that can be extruded as fast as aluminum alloys. Acta Mater. 2017, 130, 261–270. [Google Scholar] [CrossRef]
- Bian, M.Z.; Sasaki, T.T.; Suh, B.C.; Nakata, T.; Kamado, S.; Hono, K. A heat-treatable Mg–Al–Ca–Mn–Zn sheet alloy with good room temperature formability. Scr. Mater. 2017, 138, 151–155. [Google Scholar] [CrossRef]
- Li, Z.H.; Sasaki, T.T.; Bian, M.Z.; Nakata, T.; Yoshida, Y.; Kawabe, N.; Kamado, S.; Hono, K. Role of Zn on the room temperature formability and strength in Mg–Al–Ca–Mn sheet alloys. J. Alloys Compd. 2020, 847, 156347. [Google Scholar] [CrossRef]
- Bian, M.Z.; Sasaki, T.T.; Nakata, T.; Yoshida, Y.; Kawabe, N.; Kamado, S.; Hono, K. Bake-hardenable Mg–Al–Zn–Mn–Ca sheet alloy processed by twin-roll casting. Acta Mater. 2018, 158, 278–288. [Google Scholar] [CrossRef]
- Bian, M.; Huang, X.; Chino, Y. A room temperature formable magnesium–silver–calcium sheet alloy with high ductility. Mater. Sci. Eng. A 2020, 774, 138923. [Google Scholar] [CrossRef]
- Bian, M.; Huang, X.; Chino, Y. A combined experimental and numerical study on room temperature formable magnesium–silver–calcium alloys. J. Alloys Compd. 2020, 155017. [Google Scholar] [CrossRef]
- Bian, M.; Huang, X.; Chino, Y. Improving flame resistance and mechanical properties of magnesium–silver–calcium sheet alloys by optimization of calcium content. J. Alloys Compd. 2020, 837, 155551. [Google Scholar] [CrossRef]
- Nayeb-Hashemi, A.A.; Clark, J.B. Phase Diagrams of Binary Magnesium Alloys; ASM International: Metals Park, OH, USA, 1988; ISBN 9780871703286. [Google Scholar]
- Payne, R.J.M.; Bailey, N. Improvement of the age hardening properties of magnesium-rare-earth alloys by addition of silver. J. Inst. Met. 1960, 88, 417–427. [Google Scholar]
- Gao, X.; Nie, J.F. Enhanced precipitation-hardening in Mg–Gd alloys containing Ag and Zn. Scr. Mater. 2008, 58, 619–622. [Google Scholar] [CrossRef]
- Zhu, Y.M.; Morton, A.J.; Nie, J.F. Improvement in the age-hardening response of Mg-Y-Zn alloys by Ag additions. Scr. Mater. 2008, 58, 525–528. [Google Scholar] [CrossRef]
- Mendis, C.L.; Oh-ishi, K.; Hono, K. Enhanced age hardening in a Mg–2.4 at.% Zn alloy by trace additions of Ag and Ca. Scr. Mater. 2007, 57, 485–488. [Google Scholar] [CrossRef]
- Cao, W.; Chen, S.L.; Zhang, F.; Wu, K.; Yang, Y.; Chang, Y.A.; Schmid-Fetzer, R.; Oates, W.A. PANDAT software with PanEngine, PanOptimizer and PanPrecipitation for multi-component phase diagram calculation and materials property simulation. Calphad 2009, 33, 328–342. [Google Scholar] [CrossRef]
- Pennycook, S.J.; Jesson, D.E. High-resolution Z-contrast imaging of crystals. Ultramicroscopy 1991, 37, 14–38. [Google Scholar] [CrossRef] [Green Version]
- Pennycook, S.J.; Jesson, D.E. Atomic resolution Z-contrast imaging of interfaces. Acta Metall. Mater. 1992, 40, S149–S159. [Google Scholar] [CrossRef]
- Pei, R.; Korte-Kerzel, S.; Al-Samman, T. Normal and abnormal grain growth in magnesium: Experimental observations and simulations. J. Mater. Sci. Technol. 2020, 50, 257–270. [Google Scholar] [CrossRef]
- Bhattacharyya, J.J.; Agnew, S.R.; Muralidharan, G. Texture enhancement during grain growth of magnesium alloy AZ31B. Acta Mater. 2015, 86, 80–94. [Google Scholar] [CrossRef] [Green Version]
- Gottstein, G.; Alsamman, T. Texture development in pure Mg and Mg alloy AZ31. Mater. Sci. Forum 2005, 195–197, 623–632. [Google Scholar] [CrossRef]
- Steiner, M.A.; Bhattacharyya, J.J.; Agnew, S.R. The origin and enhancement of {0001}〈11-20〉 texture during heat treatment of rolled AZ31B magnesium alloys. Acta Mater. 2015, 95, 443–455. [Google Scholar] [CrossRef]
- Li, Z.H.; Sasaki, T.T.; Shiroyama, T.; Miura, A.; Uchida, K.; Hono, K. Simultaneous achievement of high thermal conductivity, high strength and formability in Mg-Zn-Ca-Zr sheet alloy. Mater. Res. Lett. 2020, 8, 335–340. [Google Scholar] [CrossRef]
- Trang, T.T.T.; Zhang, J.H.; Kim, J.H.; Zargaran, A.; Hwang, J.H.; Suh, B.-C.; Kim, N.J. Designing a magnesium alloy with high strength and high formability. Nat. Commun. 2018, 9, 2522. [Google Scholar] [CrossRef]
- Gao, X.; Muddle, B.C.; Nie, J.F. Transmission electron microscopy of Zr-Zn precipitate rods in magnesium alloys containing Zr and Zn. Philos. Mag. Lett. 2009, 89, 33–43. [Google Scholar] [CrossRef]
- Bohlen, J.; Cano, G.; Drozdenko, D.; Dobron, P.; Kainer, K.; Gall, S.; Müller, S.; Letzig, D. Processing Effects on the Formability of Magnesium Alloy Sheets. Metals 2018, 8, 147. [Google Scholar] [CrossRef] [Green Version]
- Yan, H.; Xu, S.W.; Chen, R.S.; Kamado, S.; Honma, T.; Han, E.H. Activation of {10-12} twinning and slip in high ductile Mg-2.0Zn-0.8Gd rolled sheet with non-basal texture during tensile deformation at room temperature. J. Alloys Compd. 2013, 566, 98–107. [Google Scholar] [CrossRef]
- Chino, Y.; Sassa, K.; Mabuchi, M. Texture and stretch formability of a rolled Mg–Zn alloy containing dilute content of Y. Mater. Sci. Eng. A 2009, 513–514, 394–400. [Google Scholar] [CrossRef]
- Chino, Y.; Huang, X.; Suzuki, K.; Sassa, K.; Mabuchi, M. Influence of Zn concentration on stretch formability at room temperature of Mg–Zn–Ce alloy. Mater. Sci. Eng. A 2010, 528, 566–572. [Google Scholar] [CrossRef]
- Bohlen, J.; Nürnberg, M.R.; Senn, J.W.; Letzig, D.; Agnew, S.R. The texture and anisotropy of magnesium–zinc–rare earth alloy sheets. Acta Mater. 2007, 55, 2101–2112. [Google Scholar] [CrossRef] [Green Version]
- He, S.M.; Zeng, X.Q.; Peng, L.M.; Gao, X.; Nie, J.F.; Ding, W.J. Microstructure and strengthening mechanism of high strength Mg–10Gd–2Y–0.5Zr alloy. J. Alloys Compd. 2007, 427, 316–323. [Google Scholar] [CrossRef]
- Mendis, C.L.; Oh-ishi, K.; Kawamura, Y.; Honma, T.; Kamado, S.; Hono, K. Precipitation-hardenable Mg-2.4Zn-0.1Ag-0.1Ca-0.16Zr (at.%) wrought magnesium alloy. Acta Mater. 2009, 57, 749–760. [Google Scholar] [CrossRef]
- Sasaki, T.T.; Elsayed, F.R.; Nakata, T.; Ohkubo, T.; Kamado, S.; Hono, K. Strong and ductile heat-treatable Mg–Sn–Zn–Al wrought alloys. Acta Mater. 2015, 99, 176–186. [Google Scholar] [CrossRef] [Green Version]
- The effect of cold work on precipitation in alloy WE54. In Proceedings of the Magnesium Alloys and Their Applications, Wolfsburg, Germany, 28–30 April 1998; pp. 329–334.
- Shi, G.L.; Zhang, D.F.; Zhang, H.J.; Zhao, X.B.; Qi, F.G.; Zhang, K. Influence of pre-deformation on age-hardening response and mechanical properties of extruded Mg-6%Zn-1%Mn alloy. Trans. Nonferrous Met. Soc. China 2013, 23, 586–592. [Google Scholar] [CrossRef]
- Oh-ishi, K.; Hono, K.; Shin, K.S. Effect of pre-aging and Al addition on age-hardening and microstructure in Mg-6 wt% Zn alloys. Mater. Sci. Eng. A 2008, 496, 425–433. [Google Scholar] [CrossRef]
- Sasaki, T.T.; Oh-ishi, K.; Ohkubo, T.; Hono, K. Effect of double aging and microalloying on the age hardening behavior of a Mg–Sn–Zn alloy. Mater. Sci. Eng. A 2011, 530, 1–8. [Google Scholar] [CrossRef]
- Mendis, C.L.; Oh-ishi, K.; Ohkubo, T.; Shin, K.S.; Hono, K. Microstructures and mechanical properties of extruded and heat treated Mg–6Zn–1Si–0.5Mn alloys. Mater. Sci. Eng. A 2012, 553, 1–9. [Google Scholar] [CrossRef]
- Mendis, C.L.; Bettles, C.J.; Gibson, M.A.; Hutchinson, C.R. An enhanced age hardening response in Mg–Sn based alloys containing Zn. Mater. Sci. Eng. A 2006, 435–436, 163–171. [Google Scholar] [CrossRef]
- Sasaki, T.T.; Oh-ishi, K.; Ohkubo, T.; Hono, K. Enhanced age hardening response by the addition of Zn in Mg–Sn alloys. Scr. Mater. 2006, 55, 251–254. [Google Scholar] [CrossRef]


| Alloy | Ag (wt.%) | Ca (wt.%) |
|---|---|---|
| Mg–1.5Ag–0.1Ca | 1.37 | 0.10 |
| Mg–6Ag–0.1Ca | 5.68 | 0.11 |
| Mg–12Ag–0.1Ca | 11.0 | 0.10 |
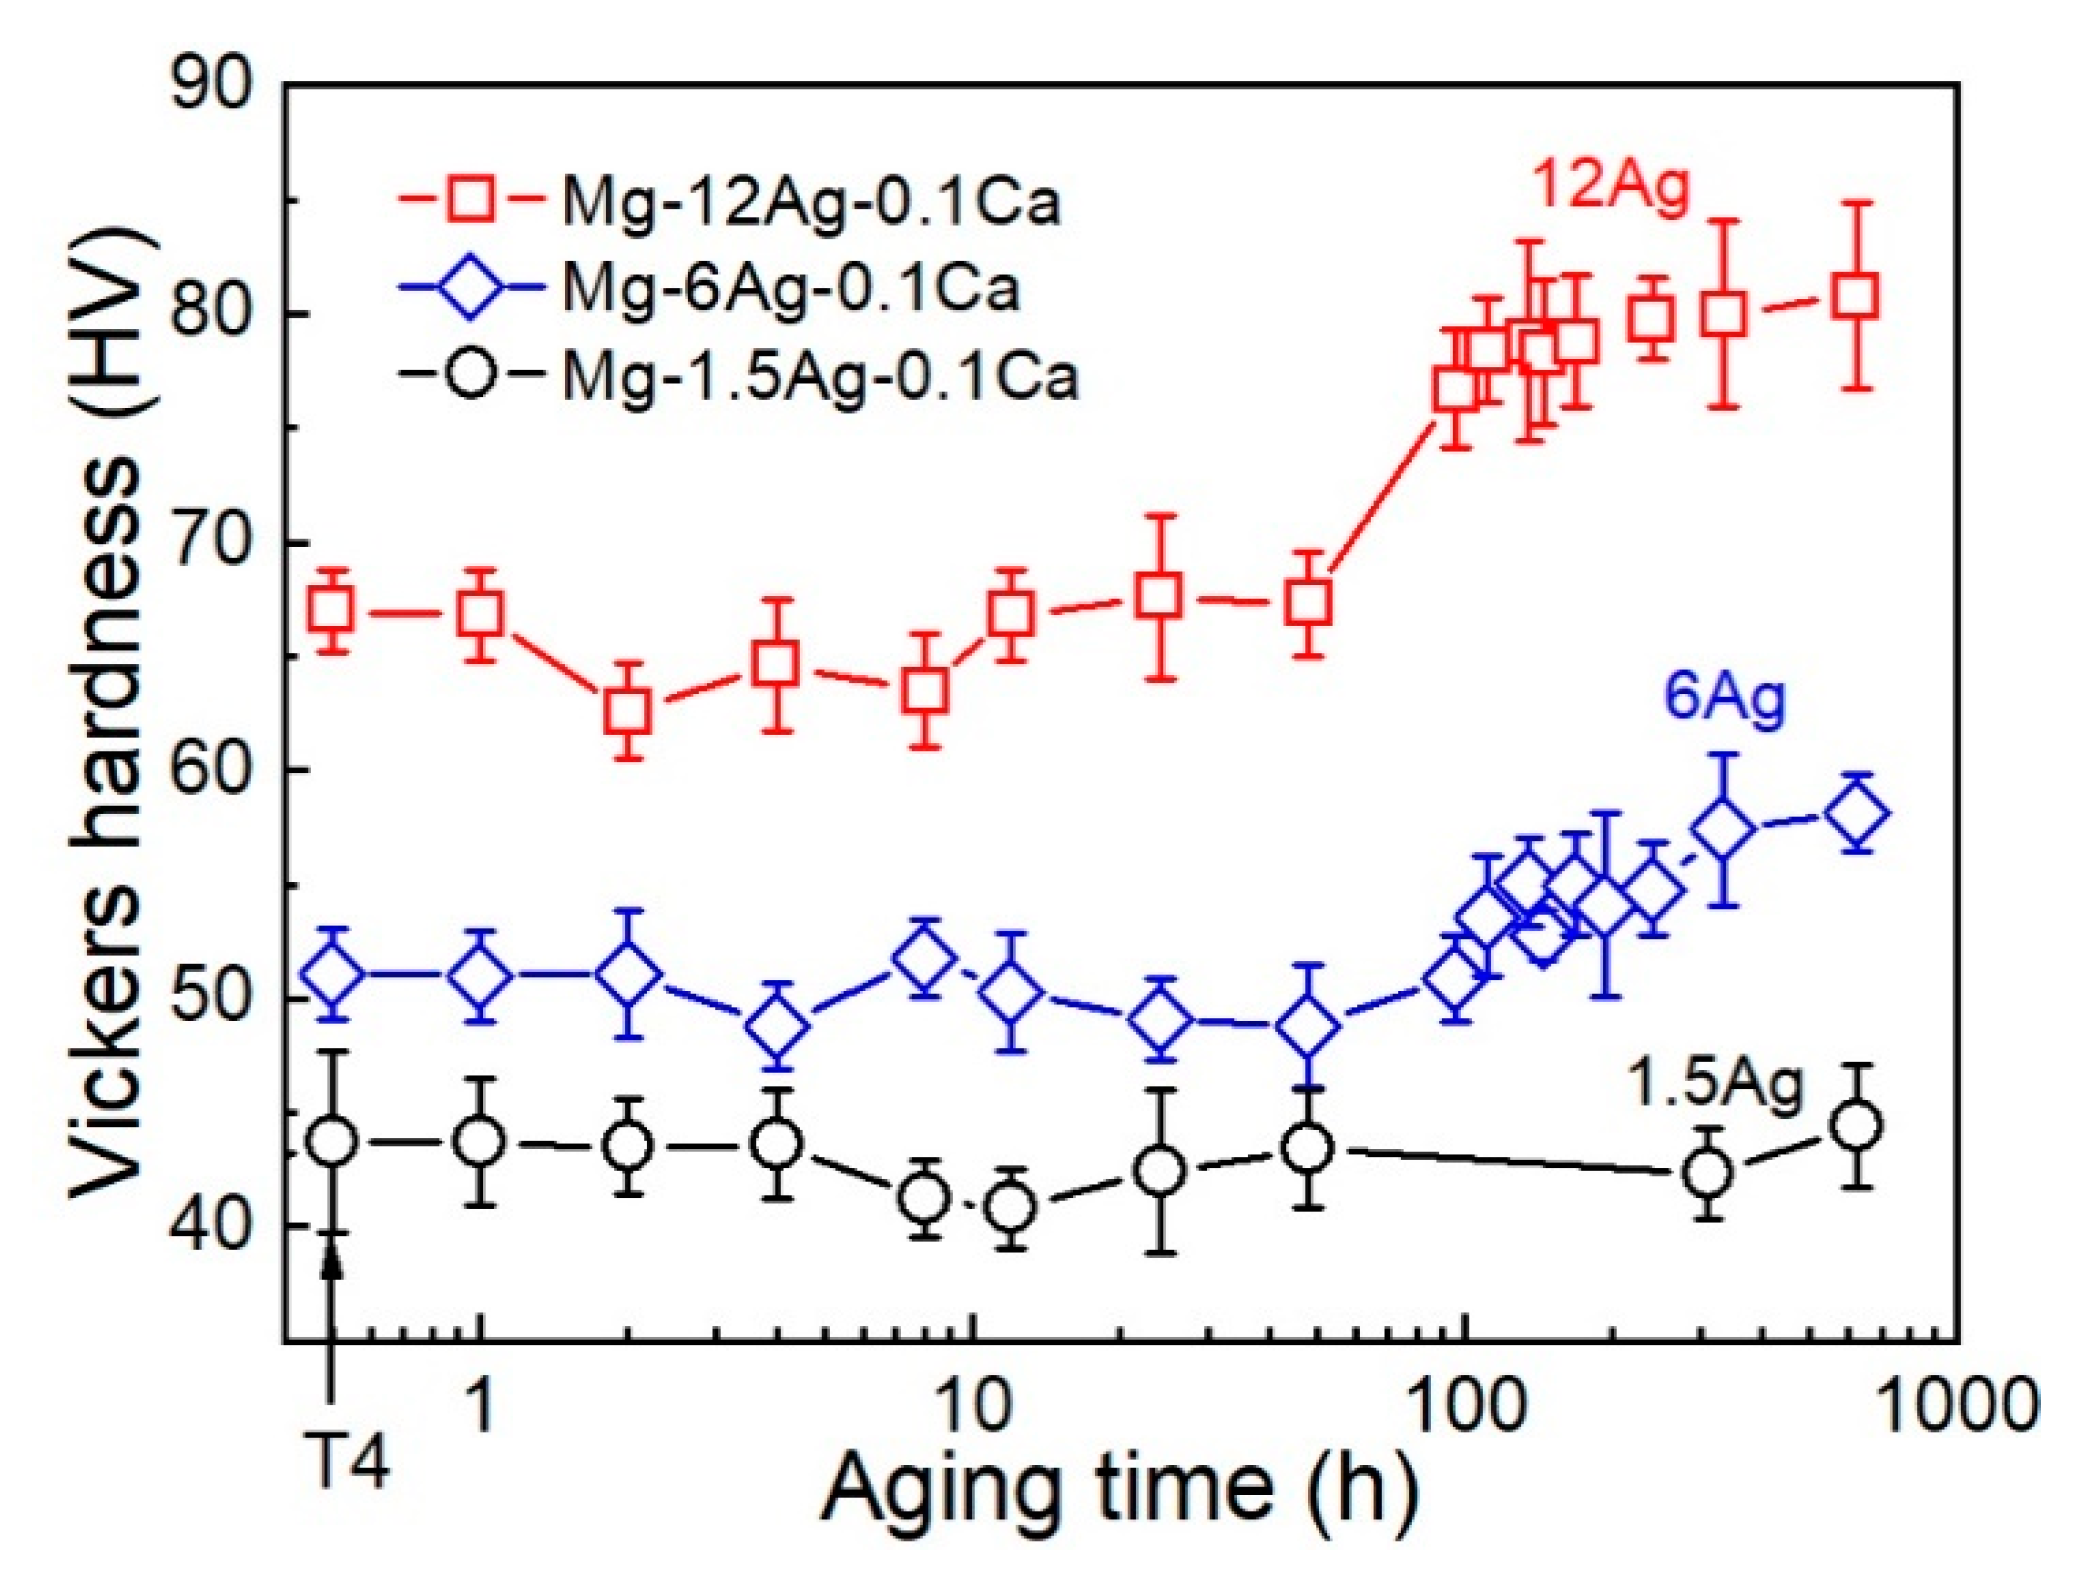
| Alloy | Initial Hardness (HV) | Peak Hardness (HV) | Time to Reach Peak Hardness (h) | Hardness Increment (HV) |
|---|---|---|---|---|
| Mg–1.5Ag–0.1Ca | 41.4 | 43.7 | 0.5 | 2.3 |
| Mg–6Ag–0.1Ca | 51.1 | 57.4 | 336 | 6.3 |
| Mg–12Ag–0.1Ca | 67.0 | 80.0 | 336 | 13.0 |
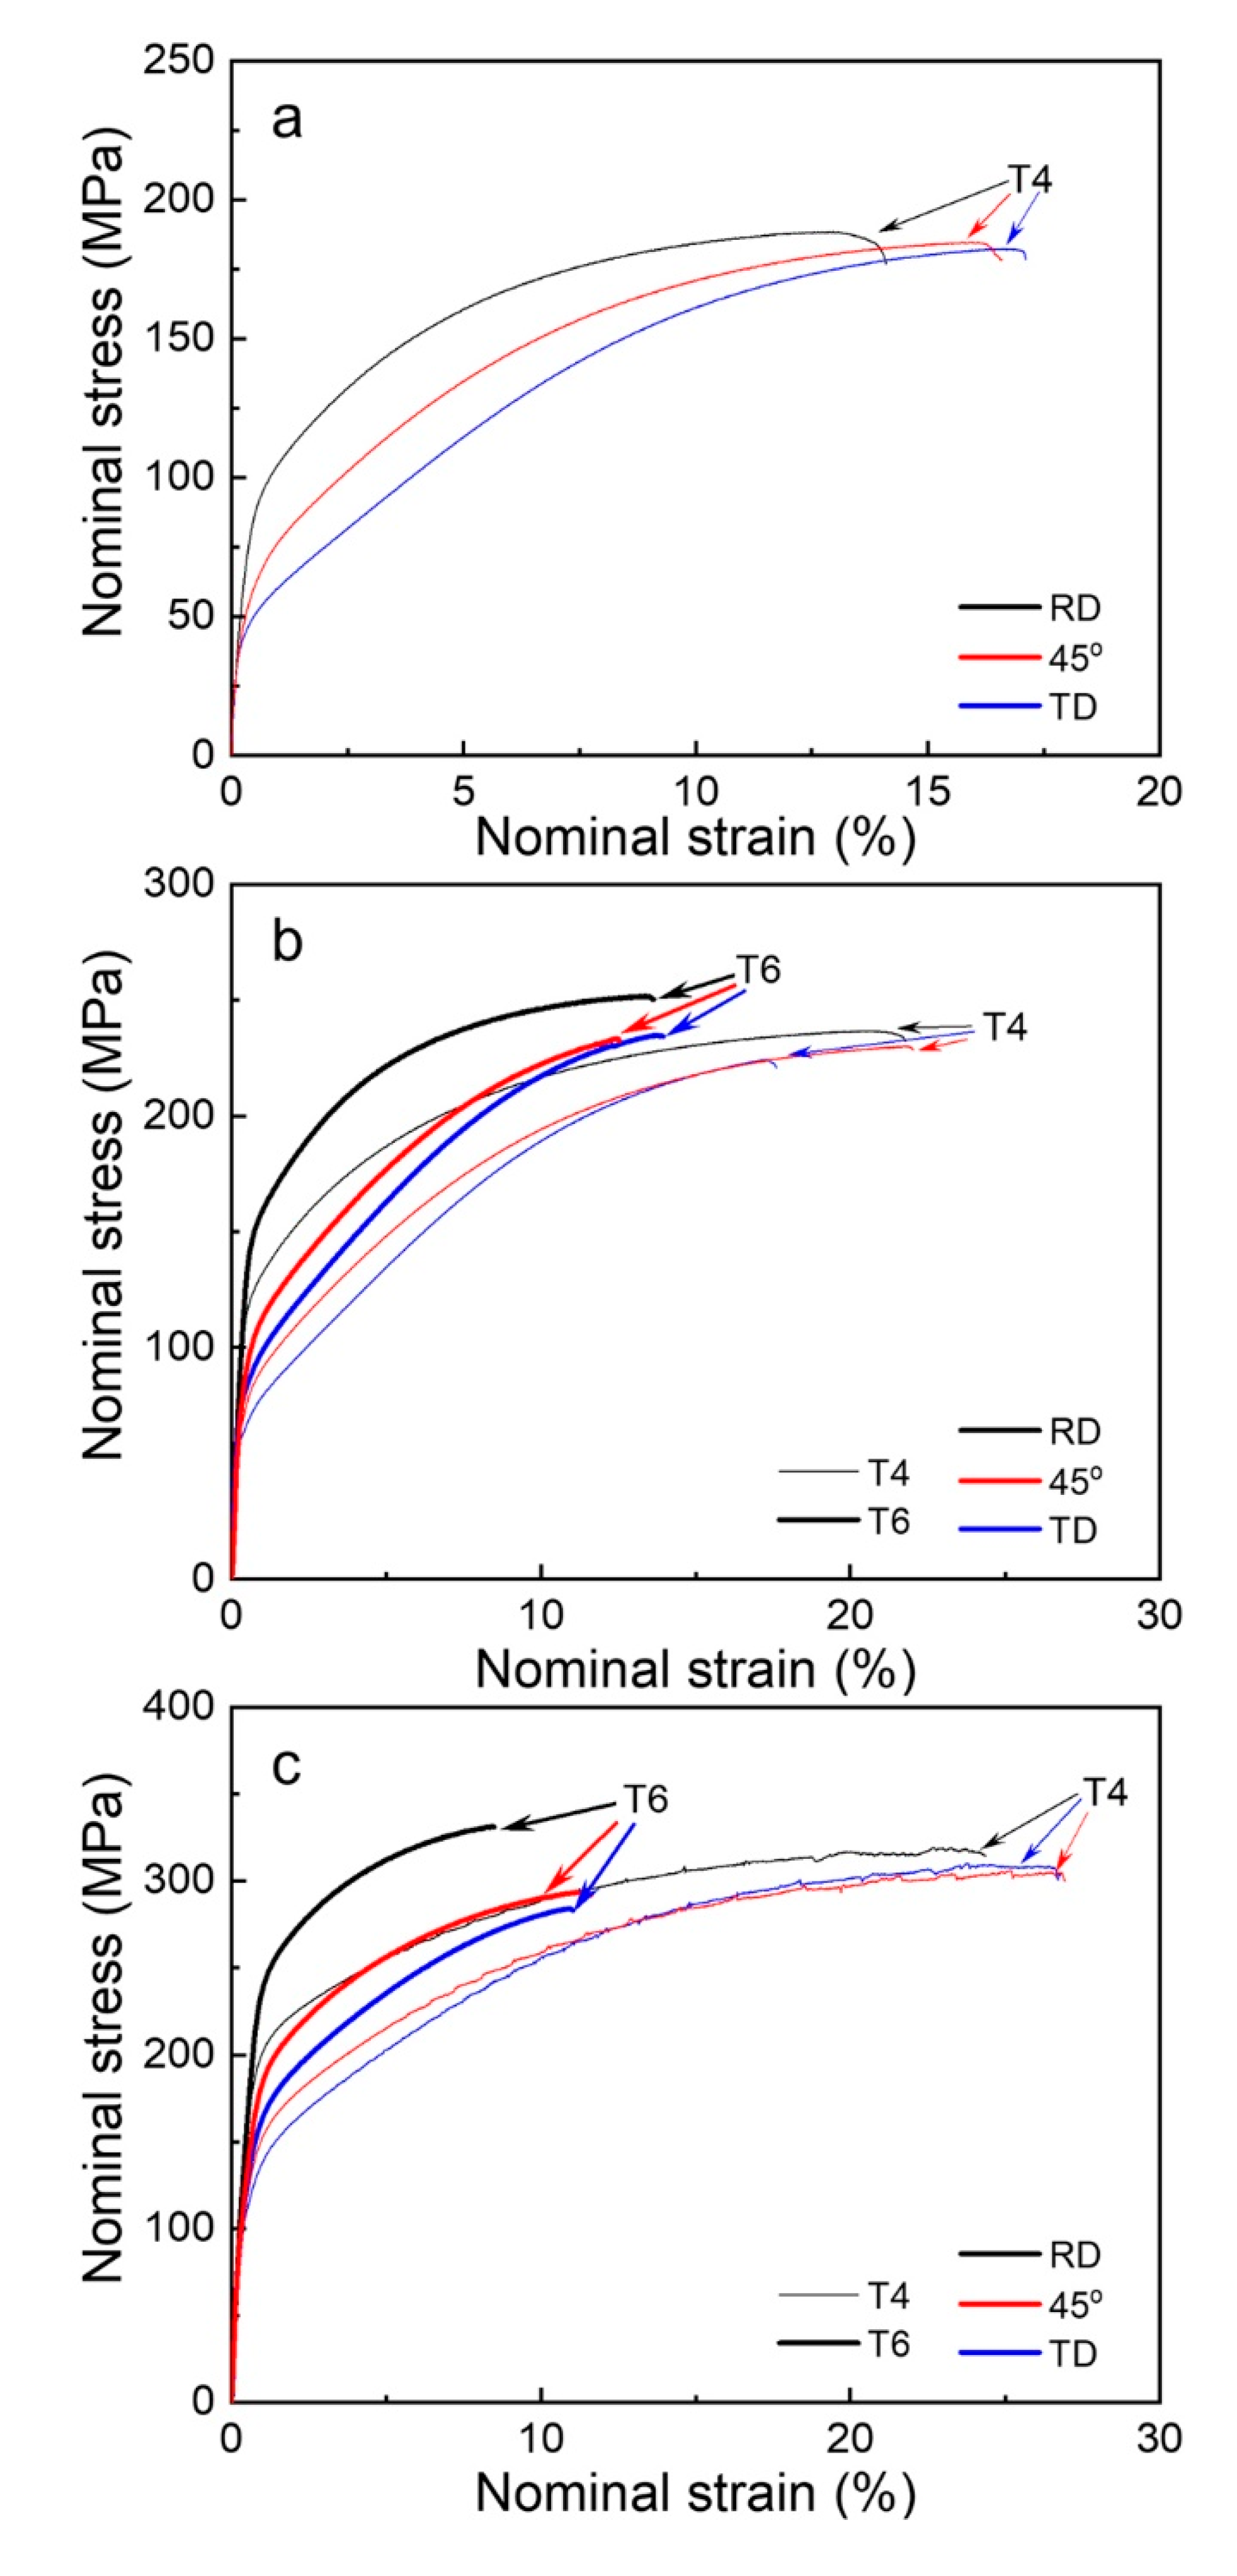
| Alloy | Condition | Direction | TYS (MPa) | UTS (MPa) | UE (%) | FE (%) |
|---|---|---|---|---|---|---|
| Mg–1.5Ag–0.1Ca | T4 | RD | 85 | 189 | 12 | 13 |
| 45° | 57 | 185 | 15 | 16 | ||
| TD | 47 | 182 | 16 | 16 | ||
| Mg–6Ag–0.1Ca | T4 | RD | 112 | 237 | 20 | 21 |
| 45° | 70 | 230 | 21 | 22 | ||
| TD | 61 | 224 | 17 | 17 | ||
| T6 | RD | 149 | 252 | 13 | 13 | |
| 45° | 89 | 233 | 12 | 12 | ||
| TD | 81 | 235 | 13 | 14 | ||
| Mg–12Ag–0.1Ca | T4 | RD | 193 | 319 | 22 | 24 |
| 45° | 130 | 306 | 24 | 26 | ||
| TD | 117 | 310 | 23 | 26 | ||
| T6 | RD | 236 | 331 | 8 | 8 | |
| 45° | 163 | 294 | 11 | 11 | ||
| TD | 143 | 284 | 10 | 10 |
Publisher’s Note: MDPI stays neutral with regard to jurisdictional claims in published maps and institutional affiliations. |
© 2020 by the authors. Licensee MDPI, Basel, Switzerland. This article is an open access article distributed under the terms and conditions of the Creative Commons Attribution (CC BY) license (http://creativecommons.org/licenses/by/4.0/).
Share and Cite
Bian, M.; Huang, X.; Chino, Y. Microstructures and Mechanical Properties of Precipitation-Hardenable Magnesium–Silver–Calcium Alloy Sheets. Metals 2020, 10, 1632. https://doi.org/10.3390/met10121632
Bian M, Huang X, Chino Y. Microstructures and Mechanical Properties of Precipitation-Hardenable Magnesium–Silver–Calcium Alloy Sheets. Metals. 2020; 10(12):1632. https://doi.org/10.3390/met10121632
Chicago/Turabian StyleBian, Mingzhe, Xinsheng Huang, and Yasumasa Chino. 2020. "Microstructures and Mechanical Properties of Precipitation-Hardenable Magnesium–Silver–Calcium Alloy Sheets" Metals 10, no. 12: 1632. https://doi.org/10.3390/met10121632